exploring the effects of tooth wear on functional morphology
TRANSCRIPT
Ungar, Peter and Williamson, Malcolm 2000. Exploring the Effects of Toothwear on Functional Morphology: A Preliminary Study Using Dental Topographic Analysis. Palaeontologia Electronica, vol. 3, issue 1, art. 1: 18pp., 752KB.http://palaeo-electronica.org/2000_1/ gorilla/issue1_00.htm
Copyright: Society of Vertebrate Paleontologists, 15 April 2000. Submission: 19 November 1999, Acceptance: 7 February 2000
EXPLORING THE EFFECTS OF TOOTH WEAR ON FUNCTIONAL MORPHOLOGY: A PRELIMINARY STUDY USING DENTAL
TOPOGRAPHIC ANALYSIS
Peter Ungar and Malcolm Williamson
ABSTRACT
Mammalian tooth form reflects the material proper-ties of foods. Much research has focused on relation-ships between aspects of dental morphology and diet.Understanding these relationships allows us to inferfeeding adaptations from the teeth of fossil forms. Mostsuch studies have focused on unworn (rather than worn)teeth because these are easier to characterize and com-pare among species. Nevertheless, tooth shape changeswith wear, and most fossil teeth are worn. How doeswear affect functional efficiency? Can dental morphol-ogy of worn teeth be used to infer diets of fossil species?The study described here presents a new way to exam-ine the shapes of worn teeth so that we may begin toanswer these important questions.
Geographic information systems (GIS) were used tomodel teeth as topographic landscapes. A laser scannergenerated a digital elevation model of the occlusal sur-face, and slope, angularity, surface area, relief, andmodal aspect of each cusp, and other variables werequantified. Data on worn gorilla molars are given as an
example. Although some aspects of morphology (e.g.,surface area, occlusal relief) change with wear, othersevidently do not. For example, cusp angularity showedno consistent change through the wear sequence, sug-gesting maintenance of some aspects of chewing effi-ciency. We conclude that this approach can be used tocharacterize and compare occlusal morphology in vari-ably worn teeth. This will allow us to evaluate changesin chewing efficiency as teeth wear, a prerequisite to theinclusion of worn teeth in studies of mammalian dentalfunctional anatomy.
Peter Ungar, Department of Anthropology, Old Main 330, University of Arkansas, Fayetteville, Arkansas 72701, USAMalcolm Williamson, Center for Advanced Spatial Technologies, Ozark Hall 12, University of Arkansas, Fayetteville, Arkansas 72701, USA
KEY WORDS: GIS, gorillas, morphometrics, teeth, functional anatomy
Palaeontologia Electronica�http://www-odp.tamu.edu/paleo 1

PLAIN LANGUAGE SUMMARY:
Tooth shape reflects diet in mammals because foodswith different material properties require differentlyshaped teeth to break them down. For example, sharpblade-like teeth would better slice raw meat than wouldblunt, hammer-like teeth suited to crushing hard, brittlefoods. Paleontologists have used relationships betweentooth shape and diet in living mammals to infer feedingadaptations from the shapes of fossil mammal teeth.Most such studies have relied on unworn (rather thanworn) teeth because it is easier measure functionalaspects of their shape and to compare measurementsamong species. Still, tooth shape changes with wear, andmost fossil teeth found are, in fact, worn. For an exam-ple of the investigation of tooth wear by more conven-tional means, and its use as a basis for inferring the dietof some Paleocene ungulates, see E.W. Dewar, 1997,Journal of Vertebrate Paleontology, vol.17A.
The study described here offers a new way to charac-terize and compare dental anatomy among variablyworn teeth. This approach uses geographic informationsystems (GIS) to examine teeth as topographic land-scapes, modeling their cusps and grooves as mountainsand valleys. Slope, aspect, surface area, volume, andother measures can be measured and compared amongspecimens. This is demonstrated with a series of vari-ably worn teeth from one species, the gorilla. Resultsshow that some attributes, such as surface area andslope, decrease with more and more wear. Otherattributes, such as angularity of the surface do not seem
to change with tooth wear, suggesting the maintenanceof some aspects of chewing efficiency. We conclude thatdental topographic analysis will allow us to measure theways that teeth change shape as they wear, permittingthe evaluation of changes in chewing efficiency, andperhaps even the reconstruction the diets of fossil mam-mals using worn teeth.
Glossary: Dental topographic analysis: a method for modeling
the shapes of the biting surfaces of teeth as topographicsurfaces for analysis using Geographic information sys-tems technology.
Digitial elevation model: a set x,y,z data where x andy values represent points on a two-dimensional surfaceand z values indicate elevation.
Functional morphology: the study or relationshipsbetween the shape of a biological structure and how itfunctions.
Geographic information system (GIS) - a system forassembling, storing, manipulating, analyzing, and dis-playing geographically referenced information
INTRODUCTION
The fundamental fact that teeth wear has been thebane of dental functional anatomists for decades.Researchers have known for a very long time that toothform reflects function in living mammals, and they haveconducted very elegant studies to demonstrate relation-ships between aspects of occlusal morphology and dietwithin various mammalian orders. Most such studieshave been limited to unworn and slightly worn teeth.The problem with this is that teeth change shape as theywear, and natural selection does not stop when this hap-pens. So how can we infer function from worn teeth?Geographic information systems (GIS) provide one toolto address this issue. In this study, we demonstrate howGIS can be used to assess functional changes in toothform among variably worn molars of one mammalianspecies, Gorilla gorilla (Savage and Wyman) 1847.
Tooth Shape and DietMost paleontologists who reconstruct fossil mammal
diets use the comparative method (Anthony and Kay1993). They look at relationships between diet and toothsize, shape, or wear in living species to infer diet fromthe dental remains of fossil forms. There has been agreat deal of effort spent on uncovering these relation-ships. For example, Kay and Hiiemae (1974) associatedspecific dental morphologies in primates with shearing,crushing, and grinding. Food is sheared between theleading edges of crown crests. Shearing blades generallyare reciprocally concave to minimize contact area. Incontrast, food is crushed between planar surfaces on theteeth. Grinding involves both shearing and crushingcomponents, where two smooth surfaces are occludedand moved across one another in the manner of a mortarand pestle. Different foods require different actions tobreak them down for further processing in the stomach.
Kay (1978, 1984) devised a method for measuringthe shear potential of a tooth and found that the resultant
Palaeontologia Electronica�http://www-odp.tamu.edu/paleo 2

value, the shearing quotient (SQ), accurately tracks dietin all extant higher-order primate taxa. First, the lengthsof mesiodistally running crests connecting the maincusps of lower second molars are summed and regressedover tooth length (in log10 space) for a group of closelyrelated frugivorous species. Frugivorous species aloneare used to control for allometric changes in animalsthat have similar adaptations. The SQs are computed asdeviations from the regression line. Thus, positive val-ues indicate longer shearing crests and more occlusalrelief than expected of a frugivore and negative valuesindicate shorter crests and less occlusal relief thanexpected. For all higher-order primate taxa, folivoresand insectivores have higher SQ values than frugivores.Further, among fruit-eaters, those that specialize on hardfoods have even lower SQs and blunter teeth than thosethat more often eat soft fruits (Anthony and Kay 1993;Kay and Covert 1984; Meldrum and Kay 1997). Suchstudies have served as baselines for paleobiologicalreconstruction and have provided important clues con-cerning the diets of fossil primates (e.g., Fleagle et al.1996; Kay and Simons 1980; Strait 1991; Ungar andKay 1996; Williams and Covert 1994).
GIS and Tooth Shape
SQ studies have not focused on worn teeth becauseof difficulties in comparing and measuring crestslengths for variably worn specimens. As a tooth wears,one would expect changing occlusal relief to affectshearing crest length. So how can we best characterizeocclusal morphology in worn specimens? This raisesone of the most important issues in dental functionalanatomy today - how does tooth wear affect function?Because dental morphology affects the magnitude,direction, and rate of change of stress on food particles,tooth shape should reflect the mechanical properties ofthose foods eaten (Spears and Crompton 1996). How dochanges in tooth shape that result from wear affectchewing efficiency? The first step in answering thisimportant question is to develop a technique that cancharacterize various aspects of occlusal morphology inworn specimens.
Dental topographic analysis is one such technique(Zuccotti et al. 1998). This approach models occlusalsurfaces as three-dimensional landscapes using GIS.GIS is an approach used to compare layers of differenttypes of data connected by locations in geographicspace. It is a system for assembling, storing, manipulat-ing, analyzing, and displaying geographically refer-enced information. Many GIS tools have been created toexamine and model the physical surface of the Earth. Ifteeth can be modeled as landscape surfaces, these toolscan be applied to provide data on cusp surface area, vol-ume, slope, aspect, and three-dimensional relief. Otherfunctionally relevant aspects of morphology, such as the
amount of fluid that could accumulate in a tooth's basinand the directions and intensity of drainage over theocclusal surface, can also be examined with GIS. Suchmeasures may provide insights into food moisture con-tent and other food properties. Walker (1968), for exam-ple, noted that pteropodid bats extract juice with low-cusped teeth surrounding a depressed central basin.Studies of occlusal topography are thus likely to be veryhelpful for reconstructing diets based on biomechanicalmodels of tooth function.
Few researchers have thus far used a GIS approach tothe study of tooth shape. Reed (1997) published anabstract describing one technique. He obtained three-dimensional coordinates of small primate teeth with areflex microscope and interpolated smooth surfacesusing Imagine (ERDAS, Inc.). Features were identifiedwith the help of contour lines in ArcInfo (ESRI, Inc.)and relative proportions of area dedicated to cusps,crests, and basins were calculated. Reed suggested thatdifferences in these proportions might reflect diet differ-ences among primates.
Zuccotti et al. (1998) applied GIS techniques to thestudy of occlusal morphology in great apes. Theseauthors used an electromagnetic digitizer to collectthree-dimensional data from each occlusal surface.Resulting data were imported into GRASS (U.S. ArmyConstruction Engineering Laboratory), and tooth sur-faces were interpolated using a thin-plate spliningmodel. Cusps were isolated using the lowest elevationcontour lines that fully surrounded those cusps, andslope and volume were calculated for each. Drainagepatterns and overflow area were also calculated for eachtooth (see Materials and Methods section).
Jernvall and Selänne (1999) suggested an alternativeapproach for smaller teeth (<10 mm in diameter) using alaser confocal microscope. These authors acquired aseries of cross-section pictures of the occlusal surfacesof teeth and stacked them together to provide a three-dimensional model of the tooth's surface. Digital eleva-tion models were constructed from the image stacksusing the 3D-view version of NIH-Image (U.S. NationalInstitutes of Health), and imported into GIS software(MapFactory, Thinkspace Inc.). Jernvall and Selänne(1999) then demonstrated that various new measure-ments can be taken. For example, they used the areas oflongitudinal and transverse slopes to determine cuspelongation to identify subtle differences in selenodontyin hedgehogs.
As with shearing quotient studies, GIS approacheshave thus far focused attention on unworn teeth. Thestudy described here evaluates the potential of dentaltopographic analysis to document and analyze function-ally relevant aspects of occlusal morphology in variablyworn teeth of G. gorilla. This study presents a first steptoward assessing the functional effects of tooth wear andperhaps even allowing the inclusion of worn teeth in
Palaeontologia Electronica�http://www-odp.tamu.edu/paleo 3
functional analyses that consider occlusal relief in threedimensions. We reconstructed a wear sequence forlower second molars of gorillas using variably wornteeth by scaling and aligning these teeth in an identicalmanner. We then quantified functionally relevant
aspects of morphology for comparison. Results demon-strate the potential of this approach for providing amodel of changes in tooth shape with wear. Wearsequence models may be compared among taxa andanalyzed for their relevance to tooth function.
MATERIALS AND METHODS
This study examined molar teeth of gorillas, G.gorilla, housed at the Field Museum of Natural Historyin Chicago, Illinois, USA. This taxon was chosenbecause of the large body of work focused on primatedental functional anatomy and because gorilla teethevince substantial visible morphological change withwear. Kay (1981) has speculated that high cusps andthin tooth enamel in primate folivores, such as thegorilla, would lead to sharp edges at the sites of dentineexposure, which would improve shredding and slicingabilities of the tooth with wear. Methods described herewere designed to examine such aspects of the morphol-ogy of worn teeth.
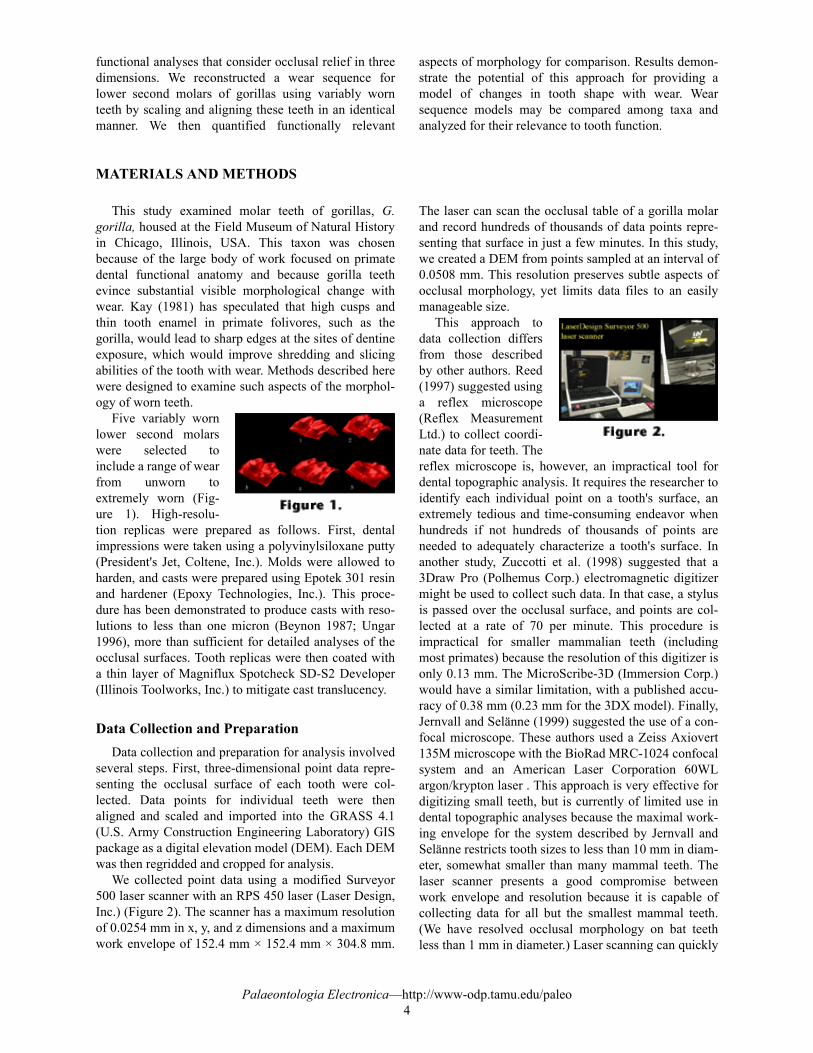
Five variably wornlower second molarswere selected toinclude a range of wearfrom unworn toextremely worn (Fig-ure 1). High-resolu-tion replicas were prepared as follows. First, dentalimpressions were taken using a polyvinylsiloxane putty(President's Jet, Coltene, Inc.). Molds were allowed toharden, and casts were prepared using Epotek 301 resinand hardener (Epoxy Technologies, Inc.). This proce-dure has been demonstrated to produce casts with reso-lutions to less than one micron (Beynon 1987; Ungar1996), more than sufficient for detailed analyses of theocclusal surfaces. Tooth replicas were then coated witha thin layer of Magniflux Spotcheck SD-S2 Developer(Illinois Toolworks, Inc.) to mitigate cast translucency.
Data Collection and PreparationData collection and preparation for analysis involved
several steps. First, three-dimensional point data repre-senting the occlusal surface of each tooth were col-lected. Data points for individual teeth were thenaligned and scaled and imported into the GRASS 4.1(U.S. Army Construction Engineering Laboratory) GISpackage as a digital elevation model (DEM). Each DEMwas then regridded and cropped for analysis.
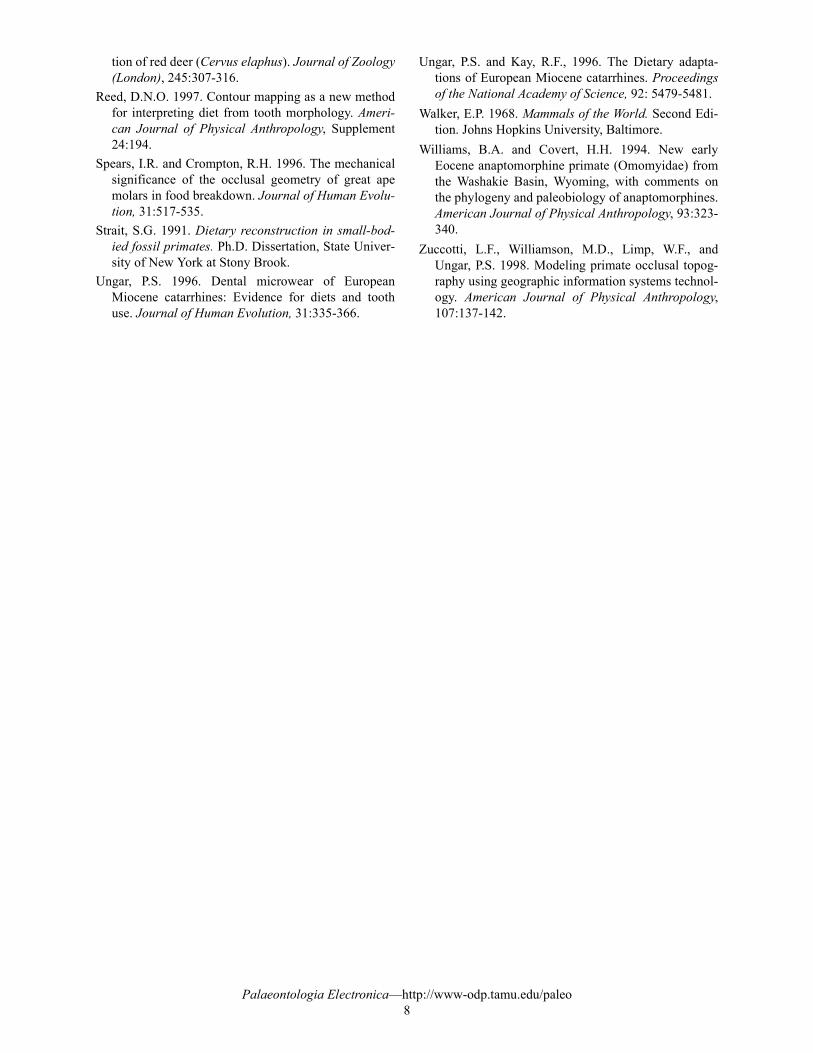
We collected point data using a modified Surveyor500 laser scanner with an RPS 450 laser (Laser Design,Inc.) (Figure 2). The scanner has a maximum resolutionof 0.0254 mm in x, y, and z dimensions and a maximumwork envelope of 152.4 mm × 152.4 mm × 304.8 mm.
The laser can scan the occlusal table of a gorilla molarand record hundreds of thousands of data points repre-senting that surface in just a few minutes. In this study,we created a DEM from points sampled at an interval of0.0508 mm. This resolution preserves subtle aspects ofocclusal morphology, yet limits data files to an easilymanageable size.
This approach todata collection differsfrom those describedby other authors. Reed(1997) suggested usinga reflex microscope(Reflex MeasurementLtd.) to collect coordi-nate data for teeth. Thereflex microscope is, however, an impractical tool fordental topographic analysis. It requires the researcher toidentify each individual point on a tooth's surface, anextremely tedious and time-consuming endeavor whenhundreds if not hundreds of thousands of points areneeded to adequately characterize a tooth's surface. Inanother study, Zuccotti et al. (1998) suggested that a3Draw Pro (Polhemus Corp.) electromagnetic digitizermight be used to collect such data. In that case, a stylusis passed over the occlusal surface, and points are col-lected at a rate of 70 per minute. This procedure isimpractical for smaller mammalian teeth (includingmost primates) because the resolution of this digitizer isonly 0.13 mm. The MicroScribe-3D (Immersion Corp.)would have a similar limitation, with a published accu-racy of 0.38 mm (0.23 mm for the 3DX model). Finally,Jernvall and Selänne (1999) suggested the use of a con-focal microscope. These authors used a Zeiss Axiovert135M microscope with the BioRad MRC-1024 confocalsystem and an American Laser Corporation 60WLargon/krypton laser . This approach is very effective fordigitizing small teeth, but is currently of limited use indental topographic analyses because the maximal work-ing envelope for the system described by Jernvall andSelänne restricts tooth sizes to less than 10 mm in diam-eter, somewhat smaller than many mammal teeth. Thelaser scanner presents a good compromise betweenwork envelope and resolution because it is capable ofcollecting data for all but the smallest mammal teeth.(We have resolved occlusal morphology on bat teethless than 1 mm in diameter.) Laser scanning can quickly
Palaeontologia Electronica�http://www-odp.tamu.edu/paleo 4

generate a large dataset of points representing theocclusal surfaces of most mammalian molar teeth.
Once data were col-lected, individualDEMs had to bealigned and scaled sothat measurementswould be consistentamong specimens.This was accomplishedusing three points: thelowest points on the anterior and posterior foveae andthe junction between crests connecting the metaconidand entoconid (Figure 3). These landmarks were chosenbecause they are the lowest points consistently identifi-able on the occlusal surface, thereby allowing inclusionof the most worn teeth in this study. Data Sculpt soft-ware (Laser Design, Inc.) was used to align these threepoints to the x-y plane, with the x-axis passing throughthe two foveae. Each tooth was then scaled to the meandistance separating pairs of landmarks on that tooth. Thealigned and scaled DEMs were exported in ASCII datafiles as x, y, z data points to the GRASS 4.1 (U.S. ArmyConstruction Engineering Laboratory) GIS softwarepackage.
Because rotational alignment of data results in anirregular matrix, inverse-distance weighting was used to
re-grid the coordinates to a regularly spaced surfacemodel. In order to further assure the comparability ofspecimens, each DEM was cropped to the horizontalplane intersecting the lowest point on the occlusal sur-face. This also eliminated the problem of surface over-hang (more than one z-value for an x-y pair), such asoften occurs down the buccal and lingual sides of thetooth as the enamel cap approaches the cervix. Individ-ual cusps were delineated on the basis of contour lines(isometric lines connecting points of identical eleva-tion). The areas defined by individual cusps were usedas masks to filter out data from other parts of the tooth.This allowed separate consideration of data for eachcusp.
Once the DEM was aligned, scaled, and cropped, weused standard GIS algorithms to compute descriptivestatistics for each cusp. These included average slope,average delta slope (the second derivative of elevation),topographic aspect or surface orientation (in thirty-degree increments), surface area, and a relief index. Therelief index is a ratio of three-dimensional surface areato two-dimensional (x, y) surface area. We also calcu-lated the volume of fluid required to �fill� the centralbasin of each tooth to the point that it would overflow.This is a useful and repeatable measure of basin volumethat reflects the morphology of the tooth.
RESULTS
Results of this study are presented in Figures 4, 5, 6,7, and 8 and Tables 1, 2, 3, 4, 5, and 6. These illustratechanges in some aspects of occlusal morphology withwear and identify other attributes that may not change ina consistent manner as a tooth wears. These results useteeth of different specimens to create a model of anocclusal wear sequence for the taxon. Although the scal-ing, alignment, and cropping procedures describedabove minimize differences between specimens, wemust remember that individual variation can still com-plicate wear sequence patterns (see Discussion). Eachattribute can be considered individually.
SlopeSlope is one mea-
sure of topographicrelief of the occlusalsurface. Although onemight expect toobserve a consistentdecrease in mean slopeas cusps become moreworn, this pattern is obscured by dentin exposure, andresulting steeply walled pits (Figure 4; Table 1). There isa general decrease in slopes for all cusps between the
first and the fifth wear stages. Further, four of five cuspsshow decreasing slope values between stages 1 and 2and between stages 4 and 5. On the other hand, onlythree cusps show decreasing values between stages 2and 3, and two show decreasing values between wearstages 3 and 4.
Delta SlopeThe rate of change
of slope is an indicatorof the angularity of asurface, with highnumbers representingsharper edges. There isno pattern of increas-ing or decreasingchange in slopebetween adjacent wear stages (Figure 5; Table 2). Thereis also no pattern evident between the least and the mostworn specimens. Therefore, there is no consistentchange in the angularity of the surface for each cusp.This may be related to enamel penetrance and steeplyangled dentin island walls for each of the cusps,although more work needs to be done to confirm thisrelationship.
Palaeontologia Electronica�http://www-odp.tamu.edu/paleo 5

Surface AreaSurface area of the cusps is calculated using the two-
dimensional x-y area and slope data. We would predict ageneral decrease in surface area as slope decreases andtooth surface is worn away. Results indicated that pat-terns for the buccal cusps (the protoconid, hypoconidand hypoconulid) and lingual cusps (the metaconid andentoconid) differ (Figure 6; Table 3). As expected, thesurface areas of the buccal cusps show a generaldecrease through the wear sequence, with the lowestvalues seen at wear stage 5. On the other hand, there isno such pattern for the lingual cusps. This may reflectthe fact that, in these primates, buccal cusps of lowermolars wear much more rapidly than do lingual cusps.In fact, lingual shearing crests on gorilla lower molarscan preserve much of their length well after the buccalcusp morphology has begun to wear away.
Relief IndexWe developed a
relief index to providea more direct measureof occlusal relief thancould be obtained byexamining surface areaalone. This is a ratio ofthe three-dimensionalsurface area to the two-dimensional x-y area. The greater the occlusal relief, thehigher the relief index. As expected, all five cusps showa trend toward decreasing relief from stage 1 throughstage 5 ( Figure 6; Table 4), although there is some vari-ability. Also as expected, the decrease in relief is great-est on the buccal side of the crown.
Topographic AspectThe measurement
of aspect offersintriguing possibilitiesfor observing func-tional changes of cuspsthough the wearsequence. It may bepossible to assesschanges in occlusalrelationships between upper and lower teeth by observ-ing variation in modal aspect (Table 5). The colors inFigure 7 relate to modal aspect increment for each cusp,not to particular aspect direction. Perhaps the most obvi-ous change in these data is on the buccal cusps betweenthe fourth and fifth stages, where the prevailing aspectswitches by 180 degrees! This may indicate a decreasedeffectiveness of the tooth as a guide for chewingmotions ( Kay and Hiiemae 1974). Still, a combinedstudy of maxillary and mandibular dentitions will benecessary to evaluate the potential of this approach.
Basin VolumeThe last variable to
consider is centralbasin volume. Weexpected that as a toothwears, the basin vol-ume would increasegradually because theworn cusps shouldallow more fluid toaccumulate beforeflowing off the molar.Instead, we saw anincrease in volumebetween stage 1 and stage 2, followed a sharp decreasethrough stages three and four (Figure 8; Table 6). Due tothe extreme wear seen in stage 5, the basin actuallyflowed right over the buccal cusps, preventing usefulmeasurement.
DISCUSSION
This study demonstrates that dental topographic anal-ysis can be used to document morphological differencesbetween variably worn teeth. We expect that naturalselection continues to act on individuals as their teethwear and therefore should select for a morphology thatwill maintain chewing efficiency throughout the life ofthe tooth. Characteristics such as cusp slope, aspect, sur-face area, relief, and basin volume can be quantifiedusing GIS algorithms. These may be of interest in
assessing functional changes in chewing efficiency asteeth wear. Still, this list is certainly not exhaustive, andtechniques described here may allow measurement ofmany other relevant attributes, such as the area of apolygon connecting the tips of the cusps, or the differ-ence between the actual volume of the tooth and the�cylindrical� volume (measured as the product of tootharea in the x-y plane and height of the tallest cusp).
Palaeontologia Electronica�http://www-odp.tamu.edu/paleo 6

The delta slope results, although preliminary, are par-ticularly intriguing. There is no apparent change inangularity of gorilla tooth surface from less to moreworn specimens. This evidently reflects the steep wallsof the occlusal pits that form as enamel gives way tosofter dentin as the tooth wears. Such a phenomenonmay be comparable to that seen in herbivorous ungu-lates that have complex infoldings and lophs designed toform sharp edges with dentin exposure for shearing andgrinding tough foods. If so, it might provide evidencethat thin tooth enamel in primate folivores, such as thegorilla, would lead to sharp edges at the sites of dentinexposure to improve shredding and slicing abilities ofthe tooth with wear (Kay 1981). Clearly, however, acomprehensive study of large numbers of individualsrepresenting various folivorous taxa is needed to ade-quately test this hypothesis. Studies of food particle size
in gut and fecal samples of younger and older individu-als will provide an independent test of changes in chew-ing efficiency (e.g., Perez-Barberia and Gordon 1998).
This paper set out to demonstrate the potential of GISto examine morphological changes in variably wornmammal teeth. The next phase of this research willinvolved a series of repeatability tests, followed by atemporal study of individual tooth wear. A temporalstudy will give us an idea of variation within species intooth wear sequences, a necessary step if we are to usevariably worn teeth of different individuals to constructa species-specific wear sequence. On the other hand, weare limited to variably worn teeth of different individu-als in the fossil record, so such studies of extant groupswill be needed to form an adequate baseline for compar-ison with extinct taxa.
ACKNOWLEDGMENTS
We thank Lucy Flynn Zuccotti for collecting moldsof the gorilla teeth and Dr. William Stanley for permis-sion to study collections at the Field Museum of NaturalHistory in Chicago. This paper was much improvedwith the help of comments by three anonymous review-ers. Computer systems were provided by Intergraph
Corporation and SUN Microsystems, and the Surveyor500 laser scanner was purchased with funds granted bythe University of Arkansas. This project was supportedin part by U.S. National Science Foundation grant SBR9804882.
REFERENCES
Anthony, M.R.L. and Kay, R.F. 1993. Tooth form anddiet in Ateline and Alouattine primates: Reflectionson the comparative method. American Journal ofScience, 293-A:356-382.
Beynon, A.D. 1987. Replication technique for studyingmicrostructure of fossil enamel. Scanning Micros-copy, 1:663-669.
Fleagle, J.G., R.F., Kay, and Anthony, M.R.L. 1996.Fossil New World monkeys. Kay, R.F., Madden,R.H., Cifelli, R.L., and Flynn, J.J. (ed.), VertebratePaleontology in the Neotropics. Smithsonian Institu-tion, Washington, D.C. p. 473-495.
Jernvall, J. and Selänne, L. 1999. Laser confocalmicroscopy and geographic information systems inthe study of dental morphology. Paleontologica Elec-tronica, 2 (1):18 p., 905 KB. http://www-odp.tamu.edu/paleo/1999_1/confocal/issue1_99.htm.
Kay, R.F. 1978. Molar structure and diet in extant Cer-copithecidae., p. 309-339. In Butler, P. M. and Joy-sey, K. A. (eds.), Development, Function, andEvolution of Teeth. Academic Press, New York.
Kay, R.F. 1981. The nut-crackers: A new theory of theadaptations of the Ramapithecinae. American Jour-nal of Physical Anthropology, 55:141-151.
Kay, R.F. 1984. On the use of anatomical features toinfer foraging behavior in extinct primates, p. 21-53.In Rodman, P. S. and Cant, J.G.H. (eds.), Adaptationsfor foraging in nonhuman primates: Contributions toan organismal biology of prosimians, monkeys andapes. Columbia University, New York.
Kay, R.F. and Covert, H.H. 1984. Anatomy and behav-ior of extinct primates, p. 467-508. In Chivers, D J.,Wood, B.A., and Bilsborough, A. (eds.), FoodAcquistion and Processing in Primates. Plenum,New York.
Kay, R.F. and Hiiemae, K.M. 1974. Jaw movement andtooth use in recent and fossil primates. AmericanJournal of Physical Anthropology, 40:227-256.
Kay, R.F. and Simons, E.L. 1980. The ecology of Oli-gocene African Anthropoidea. International Journalof Primatology, 1:21-37.
Meldrum, D.J. and Kay, R.F. 1997. Nucicruptor rubi-cae, a new pitheciin seed predator from the Mioceneof Colombia. American Journal of Physical Anthro-pology, 102:407-428.
Pérez-Barberia, F.J. and Gordon, I.J. 1998. The influ-ence of molar occlusal surface area on the voluntaryintake, digestion, chewing behaviour and diet selec-
Palaeontologia Electronica�http://www-odp.tamu.edu/paleo 7
tion of red deer (Cervus elaphus). Journal of Zoology(London), 245:307-316.
Reed, D.N.O. 1997. Contour mapping as a new methodfor interpreting diet from tooth morphology. Ameri-can Journal of Physical Anthropology, Supplement24:194.
Spears, I.R. and Crompton, R.H. 1996. The mechanicalsignificance of the occlusal geometry of great apemolars in food breakdown. Journal of Human Evolu-tion, 31:517-535.
Strait, S.G. 1991. Dietary reconstruction in small-bod-ied fossil primates. Ph.D. Dissertation, State Univer-sity of New York at Stony Brook.
Ungar, P.S. 1996. Dental microwear of EuropeanMiocene catarrhines: Evidence for diets and toothuse. Journal of Human Evolution, 31:335-366.
Ungar, P.S. and Kay, R.F., 1996. The Dietary adapta-tions of European Miocene catarrhines. Proceedingsof the National Academy of Science, 92: 5479-5481.
Walker, E.P. 1968. Mammals of the World. Second Edi-tion. Johns Hopkins University, Baltimore.
Williams, B.A. and Covert, H.H. 1994. New earlyEocene anaptomorphine primate (Omomyidae) fromthe Washakie Basin, Wyoming, with comments onthe phylogeny and paleobiology of anaptomorphines.American Journal of Physical Anthropology, 93:323-340.
Zuccotti, L.F., Williamson, M.D., Limp, W.F., andUngar, P.S. 1998. Modeling primate occlusal topog-raphy using geographic information systems technol-ogy. American Journal of Physical Anthropology,107:137-142.
Palaeontologia Electronica�http://www-odp.tamu.edu/paleo 8

Figure 1. Specimens used in this analysis. Digital elevation models as they appear in Datasculpt (LaserDesign Inc)before export to a GIS package. Specimens show increasing wear from stages 1 though 5.
Palaeontologia Electronica�http://www-odp.tamu.edu/paleo 9

Figure 2. Laser scanner used in this study.
Palaeontologia Electronica�http://www-odp.tamu.edu/paleo 10

Figure 3. Data points used to scale and orient specimens. A = anterior fovea; B = posterior fovea; C = intersection ofcrests adjacent to the metaconid and entoconid. Individual cusps are labeled.
Palaeontologia Electronica�http://www-odp.tamu.edu/paleo 11

Figure 4. Slope data for specimens representing each wear stage. Higher frequency colors represent steeper slopes.Higher frequency colors (i.e., violet, blue) represent higher values than do lower frequency colors (i.e., yellow,green).
Palaeontologia Electronica�http://www-odp.tamu.edu/paleo 12

Figure 5. Delta slope data for specimens representing each wear stage. Higher frequency colors represent steeperslopes. The lack of great contrast reflects minimal differences in values. Higher frequency colors (i.e., violet, blue)represent higher values than do lower frequency colors (i.e., yellow, green).
Palaeontologia Electronica�http://www-odp.tamu.edu/paleo 13
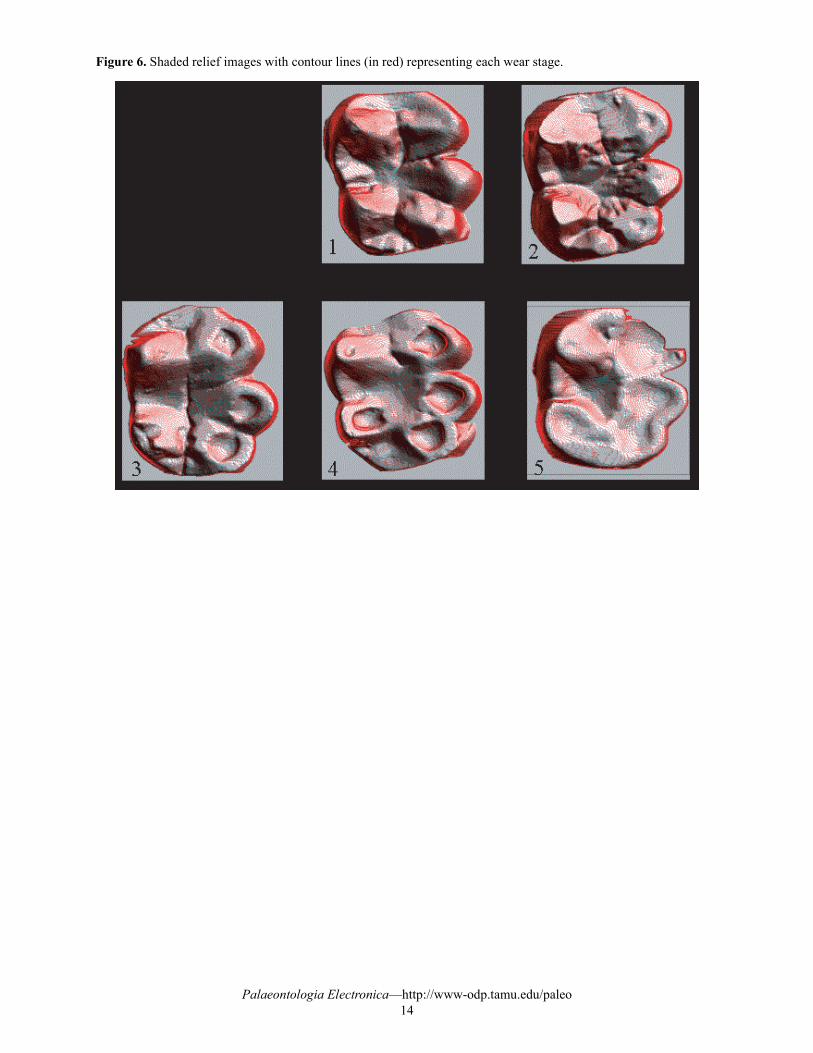
Figure 6. Shaded relief images with contour lines (in red) representing each wear stage.
Palaeontologia Electronica�http://www-odp.tamu.edu/paleo 14

Figure 7. Aspect data for specimens representing each wear stage. The various colors show locations of modal aspectfor each cusp. Note that different colors are used to represent modal aspect values for different cusps.
Palaeontologia Electronica�http://www-odp.tamu.edu/paleo 15

Figure 8. Central basin volume. The areas denoted in red represents the maximum volume of fluid that would beretained in each basin.
Palaeontologia Electronica�http://www-odp.tamu.edu/paleo 16

Table 1. Average slope of each cusp.
Table 2. Delta slope for each cusp.
Table 3. Surface area (scaled units) for each cusp.
Table 4. Relief index for each cusp.
Wear Protoconid Hypoconid Hypoconulid Entoconid Metaconid
1 36.06 40.86 44.36 48.84 45.86
2 27.04 32.82 33.41 51.01 43.99
3 32.88 30.86 29.82 39.35 44.61
4 33.71 33.30 33.15 36.85 38.59
5 28.41 22.72 24.31 32.76 43.13
Wear Protoconid Hypoconid Hypoconulid Entoconid Metaconid
1 1.85 1.69 1.79 1.80 1.80
2 1.95 1.95 2.02 1.75 1.79
3 1.76 1.92 2.02 2.00 1.76
4 1.78 1.85 1.83 2.02 1.64
5 1.71 1.70 1.69 1.86 1.72
Wear Protoconid Hypoconid Hypoconulid Entoconid Metaconid
1 23.86 23.33 21.86 22.60 39.89
2 24.71 21.00 18.54 29.64 47.25
3 28.03 21.97 16.55 18.65 35.43
4 29.32 26.95 23.84 23.34 30.28
5 18.70 16.69 14.34 22.68 39.90
Wear Protoconid Hypoconid Hypoconulid Entoconid Metaconid
1 1.53 1.66 1.61 1.81 1.73
2 1.33 1.45 1.48 1.81 1.64
3 1.40 1.48 1.34 1.57 1.92
4 1.40 1.47 1.33 1.57 1.47
5 1.21 1.11 1.17 1.55 1.58
Palaeontologia Electronica�http://www-odp.tamu.edu/paleo 17

Table 5. Modal aspect (30 degree cells) for each cusp.
Table 6. Basin volume.
Wear Protoconid Hypoconulid Hypoconid Entoconid Metaconid
1 181-210 271-300 301-330 151-180 1-30
2 151-180 271-300 181-210 121-150 121-150
3 331-360 271-300 181-210 121-150 1-30
4 211-240 241-270 271-300 181-210 1-30
5 61-90 61-90 91-120 121-150 91-120
Wear Rawvolume
Scaledvolume
1 573.81 166.76
2 836.71 206.55
3 306.66 90.72
4 287.52 71.48
5 (basin undefined)
Palaeontologia Electronica�http://www-odp.tamu.edu/paleo 18