the fukushima accident - lse home · rare events and risk perception: evidence from the fukushima...
TRANSCRIPT

Rare events and risk perception: evidence from
the Fukushima accident
Renaud Coulomb and Yanos Zylberberg
March 2016
Grantham Research Institute on Climate Change and
the Environment
Working Paper No. 229

The Grantham Research Institute on Climate Change and the Environment was established by the London School of Economics and Political Science in 2008 to bring together international expertise on economics, finance, geography, the environment, international development and political economy to create a world-leading centre for policy-relevant research and training. The Institute is funded by the Grantham Foundation for the Protection of the Environment and the Global Green Growth Institute. It has nine research programmes:
1. Adaptation and development2. Carbon trading and finance3. Ecosystems, resources and the natural environment4. Energy, technology and trade5. Future generations and social justice6. Growth and the economy7. International environmental negotiations8. Modelling and decision making9. Private sector adaptation, risk and insurance
More information about the Grantham Research Institute on Climate Change and the Environment can be found at: http://www.lse.ac.uk/grantham.
This working paper is intended to stimulate discussion within the research community and among users of research, and its content may have been submitted for publication in academic journals. It has been reviewed by at least one internal referee before publication. The views expressed in this paper represent those of the author(s) and do not necessarily represent those of the host institutions or funders.

Rare Events and Risk Perception: Evidence fromthe Fukushima Accident∗
Renaud Coulomb Yanos Zylberberg
March 9, 2016
Abstract
We study changes in nuclear-risk perception following the Fukushima nu-clear accident of March 2011. Using an exhaustive registry of individual hous-ing transactions in England and Wales between 2007 and 2014, we implementa difference-in-difference strategy and compare housing prices in at-risk areasto areas further away from nuclear sites before and after Fukushima incident.We find a persistent price malus of about 3.5% in response to the Fukushimaaccident for properties close to nuclear plants. We show evidence that thisprice malus can be interpreted as a change in nuclear-risk perception. Inaddition, the price decrease is much larger for high-value properties withinneighborhoods, and deprived zones in at-risk areas are more responsive to theaccident. We discuss various theoretical channels that could explain theseresults.
JEL codes: D80, Q51, Q53, R21, R23, R31.
Keywords: Hedonic prices, housing markets, risk perception, nuclear power.
∗Coulomb: corresponding author; The University of Melbourne, Department of Economics,Level 4, Faculty of Business and Economics Building 105, 111 Barry Street Carlton VIC3053; [email protected]; Zylberberg: Bristol University, Department of Economics;[email protected]. We thank Steve Gibbons for access to Nationwide datasets andTatiana Paredes-Torres for excellent research assistance. We are grateful to participants at the2016 Environmental Economics Workshop at Monash University. R. Coulomb acknowledges sup-port from the Faculty of Business and Economics at Melbourne University (FBE research grant)and early support from the Grantham Research Institute at the London School of Economics.
1

1 Introduction
There is a large uncertainty in the valuation of extreme events and we should observelarge fluctuations in the perception of such risk after the realization of one (very)rare event like an industrial accident or a natural catastrophe. There also existstrong variations in risk perception amongst individuals, see e.g., Slovic (1987),and such heterogeneity in knowledge about these risks, risk preferences, cultural orcognitive biases should be observed in individual reactions following the realizationof an extreme event.
In this paper, we analyze the changes in nuclear-risk perception due to Fukushimanuclear accident (FNA). This major industrial accident –the largest nuclear accidentafter Chernobyl– was triggered by the Great East Japan earthquake on March, 112011 and had a worldwide media coverage. A rare catastrophe of this amplitudeis a salient signal on a risk whose perception is arguably blurry for a majority ofindividuals, even in countries already relying on nuclear power, e.g., Japan, theUnited States, France or the United Kingdom.
We identify the changes in nuclear-risk beliefs using an hedonic approach: wedraw upon an exhaustive registry of individual housing transactions between 2007and 2014 in England and Wales. In order to capture the extent to which agentsrespond to this signal on nuclear risk, we compare treated neighborhoods to controlneighborhoods. We rely on the Fukushima Daiichi evacuation process (JapaneseGovernment, 2011) in which an evacuation zone of 20 km around teh plant has beenset, and define treated neighborhoods in England and Wales as being within a 20 kmradius around a nuclear site. In a first step, we use a difference-in-difference strategyand compare housing prices and transaction volumes in areas within a radius of 20kilometers around an active nuclear plant to areas between 20 and 100 kilometersbefore and after the Fukushima incident. In a second step, we analyze beliefs’ updateas captured by the price decrease across different environments both in terms of pre-and post-catastrophe access to information.
First, we document that housing prices strongly decrease in the wake of theFukushima catastrophe around active nuclear power plants (NPP) in England andWales. The price malus of about 3.5% is observed across a variety of specifications,e.g., controlling for differential trends across observable characteristics of postcodesor different definitions for treated and control groups. This price effect is persistentthroughout the post-Fukushima period (March 2011-September 2014).1
1We document a very limited liquidity effect: the number of transactions only drops by 1.0%close to NPPs due to Fukushima. We provide evidence of a similar qualitative shift in the housingdemand around nuclear waste sites even though smaller in magnitude.
2

Second, there exists a large disparity in the price revision across the different pricequantiles. There is a contraction of the price distribution in treated zones, with amuch larger price decrease for the top quantiles than for the bottom quantiles. Wealso find that deprived areas close to NPPs are more responsive to FNA.
The impact of Fukushima accident on UK housing market could go through twochannels: a risk-perception channel and a local-economy channel. Individuals canupdate their beliefs about nuclear risks in the wake of Fukushima which, coupledwith an aversion to nuclear risk, would shift housing demand downward. Agents mayalso expect future massive layoffs and a substantial reduction of the nuclear programthat may lead to further deterioration in the local economic prospects, e.g., throughlosses in local tax revenues and degradation of public goods and services. We performthree robustness checks to test for the presence of a local-economy channel. First,in the United Kingdom, Fukushima has not threatened the continuation of nuclearprograms: the life extension of almost all nuclear reactors was announced at theend of 2012 and we do not find any price rebound around this period. Second, wedo not find any differential effects across areas with different shares of employmentdevoted to the nuclear site. Third, we do find a non-negligible price decrease aroundnuclear waste sites. These waste sites are not susceptible to close down, and havelittle economic externality on the neighborhoods. We conclude from these tests thatour findings are only explained by a strong revision of beliefs in nuclear risk.
Our paper indirectly contributes to the vast literature on the valuation of local(dis)amenities.2 There is no consensus on the overall effect of the presence of anuclear plant on local housing and land markets. In cross-sectional analyses, Follandand Hough (1991) find a negative impact while Gamble and Downing (1982) andClark et al. (1997) have concluded that the proximity to nuclear plants does not affectproperties prices. More recent papers adopt a panel approach – tracking throughtime changes before and after the opening or the closure of a facility (Muehlenbachset al., 2014) or a regression-discontinuity design (Greenstone and Gallagher, 2008).Muehlenbachs et al. (2014) study the impact of shale gas development on housingprices in Pennsylvania. They find a negative impact of the proximity to a gaswell only for ground-water dependent homes. Greenstone and Gallagher (2008)find no specific effect of the Superfund cleanups on the housing market, suggestingthat the negative externalities that represent hazardous waste sites are not priced in
2Different types of disamenities have been studied such as hazardous waste sites (Gayer et al.,2000; Greenstone and Gallagher, 2008; Kiel and Williams, 2007), waste incinerators (Kiel andMcClain, 1995), wind farms (Gibbons, 2014), coal-fired power plants (Blomquist, 1974; Davis,2011), major infrastructure such as airports or highways, railways stations (Anselin and Lozano-Gracia, 2008; Carruthers and Clark, 2010; Cohen and Coughlin, 2008; Debrezion et al., 2007;Hughes and Sirmans, 1992).
3
housing markets. Our findings may complement these results by showing that agentsrevise their risk perceptions following a salient catastrophe, and that such revisionis reflected in market prices. The mitigated results on the relationship betweenpresence of a nuclear plant and local housing market may illustrate an heterogeneityin risk perception in addition to potential risk aversion. One shortcoming of mosthedonic studies focusing on plant opening-closing down is that risk perception cannotbe untangled from local-economic impacts. The installation of a NPP has positiveeconomic impacts driven by an inflow of skilled workers working for the NPP andthat are not reluctant to live in the NPP vicinity (Kivimaki and Kalimo, 1993), localtax revenues can be significantly increased by the contributions of a NPP tendingto reduce the tax burden for other citizen or upgrade valuable amenities such asschools in the surroundings of the NPP (Bezdek and Wendling, 2006).
In stark contrast with these papers, we rely on an environment in which themarket valuation of being in the proximity to existing nuclear plants only changesthrough a shift in risk perception. Our quasi-experiment did not threaten the exis-tence of UK nuclear plants and did not change the actual risk through new safetyregulations for instance. In contrast with the Japanese market, the United Kingdommarket was not directly affected by the catastrophe.3 The United Kingdom did notreevaluate its nuclear program following Fukushima, contrary to most nuclear-powercountries. For instance, Fukushima triggered changes in the German or Chinese nu-clear programmes, such as modifications of safety regulations, shutdowns of plants orcompensations for people living in at-risk areas. Bauer et al. (2013) give evidence ofa negative economic impact of Fukushima accident on local German housing marketdue to the shutdown of eight NPPs and the phasing-down of the remaining NPPs.Zhu et al. (2015) find a very short-term negative effect of land prices on Chineseland primary market, potentially explained by the announcement of safety reviewsof all NPPs in the country, and interference from local politicians.4
Our paper closely relates to Fink and Stratmann (2013) and Blehaut (2014).Using a dataset on housing prices in the US,5 Fink and Stratmann (2013) find no
3Nelson (1981) and Managi and Tanaka (2014) study the impact of a nuclear accident or ra-dioactivity exposure on housing prices nearby an accident location. Using panel survey data,Hanaoka et al. (2014) study how risk preference of individuals that have directly experienced theGreat Eastern Earthquake has been modified by the disaster.
4Land supply is provided by local governments and not by households, and local politicians mayalso be involved in the safety procedures around nuclear plants. See Viscusi and Hamilton (1999)who study how political demands shape cleaning decisions of hazardous waste sites made for theUS Superfund Program.
5The authors use data on median value for all-single-family houses within a postcode estimatedmonthly by a private company Zillow and according to a method proprietary to this company.Zillow Price Index is available for 10,419 US postcodes in the US, and the very short period ofanalysis goes from February 2011 to September 2011.
4

particular effect of Fukushima accident on properties prices. Blehaut (2014) studiesthe impact of the AZF industrial accident in France in 2001 on local housing marketsand finds no price effect in at-risk areas.
The remainder of this paper is structured as follows. In Section 2, we describe ourdata and our main empirical strategy. Sections 3 and 4 present our main findings,exploring first the average effect of Fukushima on the functioning of housing marketsand second the distributional effects. Section 5 briefly concludes.
2 Data and empirical strategy
This section briefly presents the context, describes our data construction and ourmain empirical strategy, and finally discusses some descriptive statistics.
2.1 Fukushima nuclear accident and nuclear risk in England
The Fukushima nuclear accident had a marked impact on the perception of nuclearrisk, generating unprecedented reactions in Japan but also other countries with asimilar nuclear fleet. In this paper, we study one potential impact through thefunctioning of housing markets in a country that resembles Japan in its nuclearstrategy, i.e., the United Kingdom.
In the following lines, we briefly describe the Fukushima nuclear accident and itsimpact in England and Wales.
Fukushima nuclear accident A major tsunami triggered by the Great EastJapan earthquake hit the Fukushima Daiichi nuclear plant (FNP) on March 11,2011 leading to a failure of coolant systems and large radioactive leakages due tothis equipment damage. This accident was given the highest level (Level 7) in theclassification of the International Nuclear Event Scale, a level shared only with theChernobyl accident of 1986.6
In the weeks following the tsunami, information was given about the nuclear coresmeltdown of three reactor units in the plant. The Japanese government responseconsisted in setting a prohibited access area out to 3 km from the plant, an on-alertarea 3-20 km and an evacuation prepared area 20-30 km. On 21 April 2011, a 20-kmzone around the plant was defined as a “no-go” zone by the Japanese government.Some areas outside this zone were later evacuated based on radiation measures.
Information releases about the accident were not circumscribed to the immediateaftermath. In July 2012, the Fukushima Nuclear Accident Independent Investigation
6However, the Fukushima disaster remained of smaller magnitude than the Chernobyl disasterin terms of radiation releases.
5

Commission revealed that the regulatory institutions had overestimated the capacityof power stations to resist such earthquake and tsunami. The Tokyo Electric PowerCompany (TEPCO) recognized later having failed in taking the adequate preventivemeasures.
The failure of safety measures monitored by supposedly-independent regulatoryagencies questioned the whole system of nuclear supervision in Japan, but alsoin other countries. Following Fukushima, a large number of TEPCO executiveswere identified as former independent supervisors and the same conflicts of interestwere detected in European countries. Overall, Fukushima raised a vast numberof questions regarding the actual safety around nuclear power stations across theWorld, particularly so because the Japanese system was considered as one of thesafest with conservative technologies.7
Nuclear context and response to Fukushima accident in England In orderto properly identify changes in nuclear risk perception from changes in housing pricesnearby Nuclear Power Plants (NPPs), it is important to understand how the nuclearcontext in England and Wales compares to Japan, and how the general recourse tonuclear technology was discussed in the aftermath of the catastrophe.
Nuclear fleet in England and Wales includes 12 operational nuclear reactors.Adding the two operational plants located in Scotland, nuclear account for about20% of domestic electricity generation in the United Kingdom in 2010 (IEA, 2014).To contrast, in Japan, almost 50 reactors generate 30% of the country’s electricity.The size of the nuclear sector in England is markedly lower than in Japan but thetwo countries shared similar objectives before the catastrophe, i.e., a reinforcementof the nuclear fleet and a slow transition to the next-generation power plants.
This line of conduct has not been modified by the Fukushima disaster in theUnited Kingdom: there was no premature shutdown of power plants. Conversely,the United Kingdom kept a pro-nuclear position after the accident and Secretaryof State (SoS) for Energy and Climate Change Chris Huhne criticized Europeanleaders for their haste in stopping their nuclear development projects. In the im-mediate aftermath of Fukushima, Chris Huhne asked Dr Mike W. Weightman HMChief Inspector of Nuclear Installations to write a report (Weightman, 2011) onthe implications of Fukushima for UK nuclear industry. In a letter to Dr Mike W.Weightman, dated June 2011, Chris Huhne responded to the Interim report andwrote “Having considered your findings, I see no reason why the UK should not
7The Boiling Water Reactors (BWR) are supposed to be safer than the Pressurized WaterReactors (PWR) which are used in the United States, France, or recently the United Kingdom.
6

proceed with our current policy: that nuclear should be part of the future energymix [...].” In December 2012, this position was made official with the renewal ofall nuclear power stations with expected closure between 2019 and 2035. This po-sition clearly contrasted with the German one: Chancellor Angela Merkel decidedto shutdown eight of the seventeen German NPPs directly after Fukushima and tophase-down by 2022 all the remaining ones.
Overall, in the United Kingdom, the expectations concerning possible phase outof operational plants in the wake of Fukushima were nil or very short-lived. Noeconomic effect that could be triggered by NPPs phase out – like a labor workforceoutflow or a loss of local tax base – were expected to occur in areas nearby NPPs.This feature makes the UK context very suitable for isolating changes in nuclear-riskperception only.
Poortinga et al. (2013) have showed that British opinion on nuclear risk wasrelatively stable despite Fukushima accident. As indicated by opinion polls aroundthe accident, the British support for replacing aging nuclear plants first decreasedright after Fukushima as in most countries in the world. Support felt by 11 points at36% in June 2011 compared to November 2010. However, this drop was short-lived,and nuclear support reached 50% in December 2011.
2.2 Treatment
The sources of exposure to nuclear residuals in England and Wales are multiple andmay differ both in magnitude and in nature. In our main specification, we will notdistinguish between Nuclear Power Plants in spite of some technological disparities,and we will treat similarly all neighborhoods at a given distance of any active nuclearplant. However, we will distinguish nuclear waste sites from Nuclear Power Plantsand estimate their effect separately.
In the following lines, we describe the catalogue of nuclear plants/waste sites inEngland and Wales, and we define our treatment measures.
Nuclear plants In March 2011, there were 10 active nuclear plants in the UnitedKingdom that could threaten some English neighborhoods (see Table 1 and Figure1). Data on nuclear plants are from the Department of Energy & Climate Change(DECC).8
These nuclear plants present some differences in their technologies. A dozen ofnuclear power reactors were constructed during the 1960s and early 1970s with the
8“Table of past and present UK nuclear reactors” available athttps://www.gov.uk/government/publications.
7

UK-specific Magnox technology. These reactors were designed such as to operateeither as a power plant or as a producer of plutonium for weapons. While beingquite safe, this Magnox technology has been unsuccessful.9 In 2011, only Oldburyand Wylfa were still active and these two power stations had a low radiation dosedespite their obsolete technology.
A second generation of seven reactors (Advanced Gas-cooled Reactors, AGR)were constructed between 1975 and 1988 to replace the Magnox power plants. Asfor the Magnox technology, this technology could not be competitive enough to beexported outside the United Kingdom. Being considered safe, these power plantswere given life extensions even after the Fukushima incident. For instance, EDFannounced the expected life extension of all AGR reactors in February 2012 (withexpected closure ranging between 2019 and 2028).
Finally, Sizewell B, connected to the grid in 1995 and expected to close down in2035, operates under the PWR technology (Pressurized Water Reactor).
It may be useful to compare these power plants to the Fukushima Daiichi NuclearPower Plant. All active power plants in the United Kingdom are almost threetimes smaller than the Fukushima Daiichi Nuclear Power Plant (with 6 BoilingWater Reactors – BWR) but their technologies and regulatory systems may be lessdeveloped than in Japan.
It is difficult to determine if UK nuclear power plants are more dangerous thantheir Japanese counterparts. Let us remark that Dr Mike W. Weightman HM ChiefInspector of Nuclear Installations declared that after a failure of the cooling system– the industrial cause of FNA – in Magnox reactors and AGRs, “the temperatureincreases would be slow allowing ample time for operator intervention” because ofthe “low power density and high thermal inertia” of these reactors (Weightman,2011).
For simplicity, we will assume that the level of risk implied by each NPP inEngland or Wales is comparable in nature to Fukushima, and that economic agentscould learn about the risk from the radiation zones provoked by the Fukushimaaccident and the evacuation process.
In practice, for the 20 active and inactive nuclear plants in the United Kingdom,we collect some information on their capacity, the number of operating reactors, theirconnection to the grid and expected closure, their technology, their exact location,the number of workers employed in the NPP and a list of accidents (e.g., cracks).Interestingly, accidents do not only concern active plants but also the closed ones
9The Magnesium non-oxidizing technology is associated with low thermal efficiency, and thushigh producing costs.
8
that act (and are registered) as nuclear waste sites.
Nuclear waste sites Before 1975 and the second generation of nuclear reactors,the nuclear waste produced by military and nuclear electricity programs was stockedon the same site as nuclear power plants. Data are from the Department of Energy& Climate Change (DECC) and the Nuclear Decommissioning Authority (NDA).
In the late 1970s, three granite sites close to the Scottish borders were examinedfor High Level Wastes (HLW) but they all encountered a large public opposition andwere abandoned.10 Only the Sellafield site, in the North-West of England, is usedto store High Level Wastes.11
Despite similar public opposition, the storage of Intermediate Level Wastes (ILW)outside of nuclear power stations became more frequent.12 Nowadays, a dozen ofthose sites store more than 1,000 m3 of wastes produced from uranium enrichment,nuclear fuel manufacture, nuclear power production, spent fuel reprocessing, researchand development, medical and industrial sources and defence activities.
In Table 9, we report the volume stored in each nuclear waste site for each wastecategory, its location and the site owners. In addition, we collected all radioactivewastes with its classification, volume, radioactivity concentration, material compo-sition, treatment and packaging.
Treatment Note that our baseline analysis collapses transactions at the LowerSuper Output Area (LSOA) level which comprise between 400 and 1,200 households.We choose this unit such as (i) to match Census data, and (ii) to restrict the numberof observations while keeping disaggregated geographical units. Between 2007 andSeptember 2014, we construct the number of transactions, their average price andthe total volume for each LSOA for each month, which leaves us with about 1,500,000observations.
In order to capture the extent to which a neighborhood may be affected by anuclear incident, we rely on the Fukushima Daiichi evacuation process and definea 20 km evacuation zone around each nuclear site. This piece of information wasdisseminated worldwide by media. We define Tnp = 1 for all LSOAs whose centroid
10High Level Wastes are mostly spent nuclear fuel and highly radioactive reprocessing liquors.One challenge to store them is that their temperature could rise significantly because of theirradioactivity. They are currently stored in steel containers to cool down for 50 years.
11The packaged volume of nuclear waste of any type in Sellafield is higher than the combinedvolume for all the other sites in the United Kingdom.
12Intermediate Level Wastes are used fuel rod casings, used ion exchange resins and parts ofdecommissioned reactors that are very radioactive but do not require any cooling process. LowLevel Wastes (LLW) are low in radioactivity, and their storage does not require very advancedfacilities.
9

is within the potential evacuation zone of any active nuclear power plant. In ourpreferred specification, we define Tnp = 0 for all LSOAs whose centroid is in arange of 20-100 km around any active nuclear power plant but not in any potentialevacuation zones. Figure 2 illustrates our treatment construction, in particular whentwo nuclear plants are sufficiently close for the evacuation zone of one nuclear plantto overlap with the safe neighborhood of another plant.
We apply the same methodology for nuclear waste sites (that are not nuclearpower stations), and define Tws = 1 for all LSOAs whose centroid is within thepotential evacuation zone of a nuclear waste site with intermediate- or high-levelwaste, and Tws = 0 for LSOAs in a band of 20-100 km.
In some robustness checks, we will consider different definitions for our treatmentand the control group. In particular, we will modify the distance interval definingtreated and control areas, then allow for a continuous treatment.
2.3 Housing data
We use two sources of data on the housing market, an exhaustive register with limitedcontrols, and a subsample of transactions with a very wide range of characteristics.
Our main empirical analysis draws on the Land Registry transaction data be-tween January 2007 and September 2014. Under the Land Registration Act 2002 andthe Land Registration Rules 2003, Land Registry registers all transactions (sales)and changes in ownership rights (mortgage, lease or right of way) in England andWales. The transaction data is exhaustive but few characteristics are available, i.e.,price, postcode, the type of property (e.g., flat, terrace house, separate house) andwhether the property was built during the past 10 years.
We also rely on another data source which is based on new mortgages issued byNationwide –the second largest company providing mortgages in the UK– betweenJanuary 2007 and December 2013. We provide a description of this dataset in theappendix.
2.4 Empirical strategy
To estimate the impact of Fukushima on the English housing market, we collapsethe data at the LSOA/month level and we use a difference-in-difference approach.We identify the market response in treated output areas versus controls betweenthe pre-treatment period (2008-March 2011) and the post-treatment one (March2011-September 2014).
In the benchmark specification, we control for monthly fixed effects and allowoutput areas in a range of 100 kilometers around each nuclear plant to have differ-
10
ential trends. In a robustness check, we also allow output areas with (i) differentex-ante ecological concerns (green votes), (ii) different deprivation indices, and (iii)different workforce composition to have different trends. Finally, we also includeoutput area fixed effects in our preferred specification to clean for time-invariant un-observed heterogeneity, and captures potential selection effects: some LSOAs mayappear more often than others because transactions are more frequent and such se-lection could be correlated with our treatment. In the end, we identify a Fukushimaeffect on variations over time for output areas inside a 20 km circle around a plantcompared to postcodes located between 20 and 100 km of the same plant but atleast 20 km away from other plants.
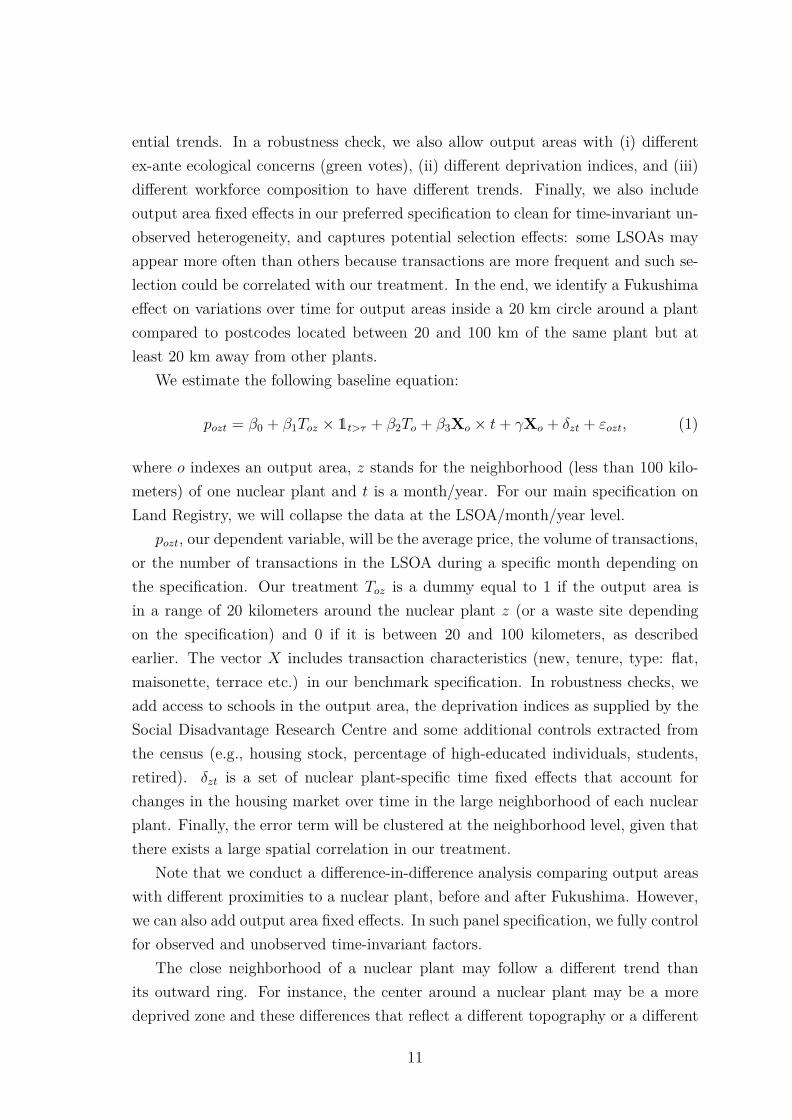
We estimate the following baseline equation:
pozt = β0 + β1Toz × 1t>τ + β2To + β3Xo × t+ γXo + δzt + εozt, (1)
where o indexes an output area, z stands for the neighborhood (less than 100 kilo-meters) of one nuclear plant and t is a month/year. For our main specification onLand Registry, we will collapse the data at the LSOA/month/year level.
pozt, our dependent variable, will be the average price, the volume of transactions,or the number of transactions in the LSOA during a specific month depending onthe specification. Our treatment Toz is a dummy equal to 1 if the output area isin a range of 20 kilometers around the nuclear plant z (or a waste site dependingon the specification) and 0 if it is between 20 and 100 kilometers, as describedearlier. The vector X includes transaction characteristics (new, tenure, type: flat,maisonette, terrace etc.) in our benchmark specification. In robustness checks, weadd access to schools in the output area, the deprivation indices as supplied by theSocial Disadvantage Research Centre and some additional controls extracted fromthe census (e.g., housing stock, percentage of high-educated individuals, students,retired). δzt is a set of nuclear plant-specific time fixed effects that account forchanges in the housing market over time in the large neighborhood of each nuclearplant. Finally, the error term will be clustered at the neighborhood level, given thatthere exists a large spatial correlation in our treatment.
Note that we conduct a difference-in-difference analysis comparing output areaswith different proximities to a nuclear plant, before and after Fukushima. However,we can also add output area fixed effects. In such panel specification, we fully controlfor observed and unobserved time-invariant factors.
The close neighborhood of a nuclear plant may follow a different trend thanits outward ring. For instance, the center around a nuclear plant may be a moredeprived zone and these differences that reflect a different topography or a different
11

history are imperfectly captured by our controls Xo. In order to test for these pre-existing differential trends between treated and control areas, we run our baselinespecification over the pre-accident period (between 2008 and March 2011), and wemodify our treatment as if Fukushima accident had occurred in March 2010.
2.5 Descriptive statistics
Table 2 provides summary statistics for the average LSOA, the average LSOAs forwhich Tnp = 1, Tws = 1, Tws = 0 and Tnp = 0. On average, in 2010, there were 2.3transactions per LSOA in a month with an average price around 230,000 pounds.There are few important differences that are worth mentioning between LSOAs in arange of 20 kilometers around a nuclear plant or a nuclear waste site and the otherLSOAs. While the number of transactions per month is constant across the differentsubsamples, the average price is markedly lower in the close neighborhood of nuclearpower stations and this malus does not seem to be related with either income oremployment deprivation measures.
The nuclear-plant malus can also be seen in Figure 5. As apparent, there is aprice gradient as one gets closer to a nuclear plant, especially between 0 and 20kilometers.13 The next section will analyze the evolution of this gradient followingthe Fukushima catastrophe.
3 Results
This section is organized as follows. First, we analyze how proximity to nuclearplants or waste sites coupled with the Fukushima incident affects prices and thenumber of transactions in our benchmark specification, and we explore some dif-ferences across nuclear plants. Second, we provide a series of robustness checks tosupport our benchmark estimates. In particular, we discard the existence of pre-treatment differential trends between treated and controls zones, and we show therobustness of our estimates to other definitions of treatment or to the addition of awide range of controls.
3.1 Housing market indicators in the wake of Fukushima
For all specifications but the placebo checks, we restrict our sample to the periodJanuary 2007 - September 2014. We estimate three variations of specification (2).In a first step (column 1), we estimate our difference-in-difference without LSOAfixed effects, and without controls for the type of transactions. In a second step, we
13In contrast, the price gradient is less pronounced around nuclear waste sites.
12

consider the panel specification with LSOA fixed effects (column 2), and we finallyadd transaction controls in column 3.
In Panel A of Table 3, we estimate the effect of being close to an active nuclearplant on housing market indicators in the aftermath of Fukushima. We estimateequation (2) with our treatment Tnp for different measures of housing transactionsstarting with the average price (in logarithm, see line 1). We then look at the numberof transactions (in logarithm, see line 2), and we derive the total effect, i.e., the sumof the price and quantity effects, in line 3 with the total volume of transactions (inlogarithm). We find a price decrease of about 3.5% for transactions occurring in theneighborhood of active nuclear plants after Fukushima, and this coefficient is robustto the addition of transaction controls or LSOA fixed effects. We also find thatthe number of transactions decreases by about 1%, and this quantity drop coupledwith the price decrease implies a drop in the volume of transactions of about 4.5%.Remark that the coefficients are robust across specifications: controlling for constantunobserved heterogeneity or transaction controls does not modify our conclusions.
In Panel B of Table 3, we repeat the same exercise for the effect of being close toa nuclear waste site with high-level waste or intermediary-level waste. While statis-tically significant, the shift in housing demand is markedly lower. The price decreaseof about 2% for transactions, combined with a quantity drop of 1%, generates anoverall 3% drop in transaction volumes.
We have provided evidence of a shift in the housing demand around nuclearplants, and we have found a similar qualitative shift for nuclear waste sites eventhough smaller in magnitude. We now examine whether:
1. this shift is short-lived or persistent,
2. this shift can be related to some features of these nuclear sites.
In order to study the persistence of the effect, we separate the treated periodbetween March 2011 and September 2014 into 2 periods, March 2011-November2012, December 2012-December 2013, and we run specification (2) with the twodifferent treated periods. We report the results in Table 7. There is no sign thatthe effect was short-lived, and the price malus is even a bit larger after December2012, reflecting potentially an announcement effect: the contract renewals of nuclearplants were announced in 2012. In parallel, there is no clear indication of liquidityshortages just after the catastrophe: the decrease in the number of transactions issmall and not very statistically significant (see Panel B of Table 7).
In order to study how the effect differs across nuclear sites, we estimate the
13
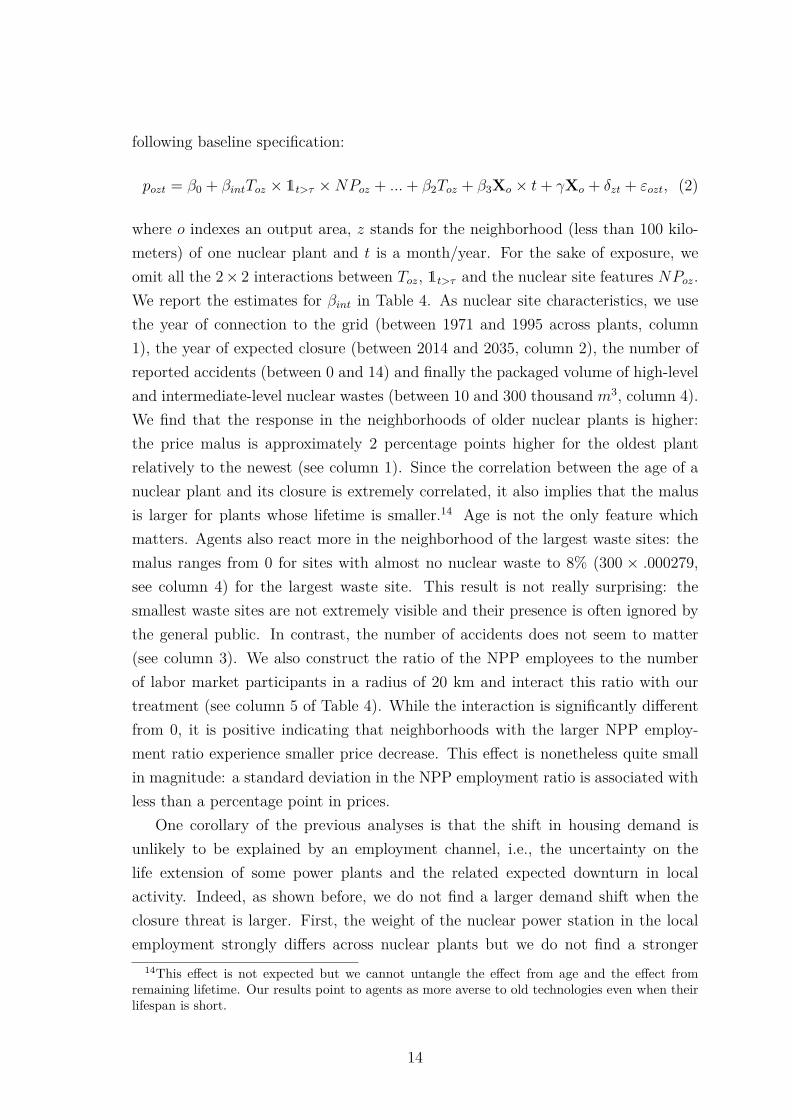
following baseline specification:
pozt = β0 + βintToz × 1t>τ ×NPoz + ...+ β2Toz + β3Xo × t+ γXo + δzt + εozt, (2)
where o indexes an output area, z stands for the neighborhood (less than 100 kilo-meters) of one nuclear plant and t is a month/year. For the sake of exposure, weomit all the 2× 2 interactions between Toz, 1t>τ and the nuclear site features NPoz.We report the estimates for βint in Table 4. As nuclear site characteristics, we usethe year of connection to the grid (between 1971 and 1995 across plants, column1), the year of expected closure (between 2014 and 2035, column 2), the number ofreported accidents (between 0 and 14) and finally the packaged volume of high-leveland intermediate-level nuclear wastes (between 10 and 300 thousand m3, column 4).We find that the response in the neighborhoods of older nuclear plants is higher:the price malus is approximately 2 percentage points higher for the oldest plantrelatively to the newest (see column 1). Since the correlation between the age of anuclear plant and its closure is extremely correlated, it also implies that the malusis larger for plants whose lifetime is smaller.14 Age is not the only feature whichmatters. Agents also react more in the neighborhood of the largest waste sites: themalus ranges from 0 for sites with almost no nuclear waste to 8% (300 × .000279,see column 4) for the largest waste site. This result is not really surprising: thesmallest waste sites are not extremely visible and their presence is often ignored bythe general public. In contrast, the number of accidents does not seem to matter(see column 3). We also construct the ratio of the NPP employees to the numberof labor market participants in a radius of 20 km and interact this ratio with ourtreatment (see column 5 of Table 4). While the interaction is significantly differentfrom 0, it is positive indicating that neighborhoods with the larger NPP employ-ment ratio experience smaller price decrease. This effect is nonetheless quite smallin magnitude: a standard deviation in the NPP employment ratio is associated withless than a percentage point in prices.
One corollary of the previous analyses is that the shift in housing demand isunlikely to be explained by an employment channel, i.e., the uncertainty on thelife extension of some power plants and the related expected downturn in localactivity. Indeed, as shown before, we do not find a larger demand shift when theclosure threat is larger. First, the weight of the nuclear power station in the localemployment strongly differs across nuclear plants but we do not find a stronger
14This effect is not expected but we cannot untangle the effect from age and the effect fromremaining lifetime. Our results point to agents as more averse to old technologies even when theirlifespan is short.
14

response in places in which this weight is larger (see column 5 of Table 4).15 Wefind the opposite: the price malus is small in these places with the largest NPPemployment ratio. Second, we can use our analysis on persistence to discard theemployment channel. Indeed, the news releases about the continuation of nuclearprogrammes occurred during the year 2012, and we show that such release is notfollowed by a rebound in housing markets (see Table 7):16 there is no significantdifference in the demand shift even after the news release. Finally, we have foundan effect around nuclear waste sites that are not susceptible to close down, and havea very low direct effect on local employment. Thus, we are confident that we candiscard economic effects to explain changes in housing market prices.
We can compare our main estimate to the average decrease in residential pricesaround Fukushima nuclear plant. As a 20km exclusion zone was set around the plant,housing markets were frozen in the close vicinity of the plant. Managi and Tanaka(2014) show that an increase in radiation dose of 1µSv/h decreases residential landvalue by 3.1%. Only 8 out of 38 municipals in Fukushima prefecture have recordeda radiation level above 1µSv/h after the accident (June and July 2011). For mostareas located between 20 and 60 km away from Fukushima nuclear plant, the effect ofradiation on residential land prices is lower that our estimate on prices of propertiesin the close vicinity of a nuclear plant in England or Wales.
To give an idea of the economic importance of the impact of Fukushima accidenton English housing markets, we perform two back-of-the-envelope calculations. Us-ing the volume of transactions in treated zones in 2010 as a starting point, and ourdifference-in-difference estimate of the Fukushima accident effect on the volume oftransactions with LSOA fixed effects (column 2 of Table 3), we get that the annualloss in transactions’ volume amounts to 164 million of Sterling pounds,17 i.e about0.4% of the increase in nominal terms of the UK GDP in 2012. A rough calcula-tion gives that Fukushima accident has reduced the value of the stock of propertiesnearby NPPs by 7.6 billion of Sterling pounds, this is equivalent to a 0.2% decreaseof the value of the entire English housing stock.18 Obviously, these back-of-the-
15The closure of a nuclear power station may affect employment beyond its direct effect. However,as long as these spillovers are linear in the direct effect, our constructed ratio will be proportionalto the expected aggregate effect. It could be, however, that spillovers are much larger when a NPPemploys a large fraction of the individuals in a neighborhood.
16We can also construct for each nuclear power station the official date for its contract renewalwith the State, and divide the treated period between pre- and post-announcement periods. Giventhat announcements were made around the same period, it would give the same results.
17Using the average volume of transactions per LSOA/month and the number of month/L-SOA observations for 2010 from Table 2, the calculation writes: 0.0340 ∗ £400105.8 ∗ 12064 =£164113796.6
18Transactions in treated zones represent in average 5.8% of transactions in England and Walesrecorded in Land Registry. According to the 2011 Census, 23.4 million of households live in England
15

envelope calculations are measures of the hedge between the value of properties inat-risk zones after Fukushima and their counterfactual value under the assumptionthat these at-risk areas would have followed the same trend than control areas. Thisignores the fact that housing markets’ dynamics in control areas may also have beenaffected by Fukushima accident since housing markets in at-risk and safer areas arerelated together via households’ location decisions.
3.2 Interpretation
The effect of the Fukushima incident on the English housing market results froma combination of (i) a shift in risk perception, (ii) the disamenity associated withadditional nuclear risk and (iii) the housing market response to the shift in housingdemand. While we cannot identify separately the contribution of these fundamen-tals, e.g., the elasticity of housing demand to risk perception, we describe theseelements in the following lines.
We consider the following housing demand schedule D(p) = D(p)− v(r), where:
• D captures the observed housing characteristics and the local amenities. Theseelements are captured in the empirical specification by LSOA-fixed effects,transaction characteristics, access to schools in the output area, deprivationindices, housing stock, percentage of high-educated individuals, students, re-tired and region-specific trends.
• r = E[C = 1|I] is the expected probability of a nuclear catastrophe, and v isthe valuation associated with such catastrophic risk.
This example is illustrative and we model the demand shift as a parallel shift, i.e., vdoes not depend on prices. With heterogeneous agents and some correlation betweenaccess to information and housing demand, this hypothesis would be violated.
In parallel, we assume that there is a housing supply schedule S(p, r). We keep itsformulation general but we will impose some restrictive assumptions in the followinglines.
Permanent shift in expectations With imperfect information on nuclear risk,the occurrence of a catastrophe should modify the information set that Bayesianagents use to establish their housing demand. Let us assume that the occurrence
and Wales. Assuming that the number of properties in England and Wales equals the number ofhouseholds, and that the percentage of properties sold in treated zones in 2010 is as in the rest ofthe country, we consider that about 1.3 million of residential properties are located in treated zones.Using the average price of the transacted properties in treated zones in 2010 as the average priceof properties in these zones, we do the following calculation 0.0325 ∗£179361.5 ∗ 1.3m ≈ £7.6b.
16

of a catastrophe is a permanent shock on agents’ expectations: they are perfectlyBayesian and never forget about past realizations. Letting I
′ denote the new in-formation set and assuming that all other amenities remain the same, the demandcurve shifts downward by
v (E[C = 1|I ])− v(E[C = 1|I ′ ]
)≈ −v′(r)︸ ︷︷ ︸
valuation
·[r′ − r
]︸ ︷︷ ︸perception
.
In contrast, housing supply should be independent of revisions in r: there is no gainfor agents willing to sell their house to wait and the supply stock remains constant.
In this case, we represent the new equilibrium in figure 3. The price drop entirelyreflects the change in risk perception weighted by the household’s risk aversion. Ifwe interpret transactions in the housing market as small frictional adjustments toreach the new equilibrium, then the market liquidity and the number of transactionsper month should not vary after the catastrophe.
Transitory shift in expectations If instead, the occurrence of a catastrophe is atransitory shock at least according to some agents’ expectations, the housing supplyschedule will be increasing, reflecting that some agents may refuse to sell their housebelow a certain price, accounting for the expected future price. We represent thisequilibrium in Figure 4.
In contrast with the previous case, the drop in prices reflects the change inrisk perception weighted by the household’s risk aversion but also the elasticitiesof housing demand and supply (partly driven by the expectations in a future pricerecovery). In such scenario, if we interpret transactions in the housing market assmall frictional adjustments to reach the new equilibrium, there will be fewer trans-actions after the catastrophe. Some households will refuse to sell their house giventhe current demand schedule, will wait for better opportunities thereby lowering thenumber of transactions.
Interpretation Our results indicate that the shift in expectations was permanent.Indeed, the relatively modest decrease in the number of transactions (1%) comparedto the price drop (3.5%) points to a very low price elasticity of housing supply. Thisresult stands in stark contrast with studies having documented a rest vacancy effect,i.e., households refusing to lower their prices waiting for future better opportunities(e.g., Blehaut 2014).
The modest decrease in the number of transactions also implies that the pricedecrease essentially reflects the demand shift (and not elasticities of housing demand
17

or supply coming from market imperfections or heterogeneities in risk valuations) asshown in Figure 4. One issue that we will not be able to tackle is that the demandshift is driven by (i) a shift in risk perception, (ii) the disamenity associated withadditional nuclear risk. The large price decrease of about 3.5% may indicate thathouseholds have a very high disamenity from being exposed to nuclear risk, or thatthey have sharply modified their risk perception. We come back to this question inthe next section. In the next lines, we rather investigate the robustness of our mainestimates.
3.3 Robustness checks
In this section, we provide a series of robustness checks to show that our results arenot driven by pre-treatment differential trends, the limited set of housing transac-tions’ controls present in Land Registry or our treatment definition.
In a first robustness check, we test the parallel trends assumption of our difference-in-difference approach. In order to do this, we restrict our analysis to the pre-Fukushima period and we define a placebo experiment in which Fukushima wouldhave occurred in March 2010. We then estimate specification (2), and replicate themain specification in Table 3, i.e., we look at prices around nuclear plants.19 Asevident in Table 6, we do not find any relevant differential trends in the neighbor-hood of nuclear plants: when we add LSOA fixed effects, the difference-in-differenceestimate between January 2007-February 2009, and March 2009-February 2011 isabout -0.004 and non-significantly different from 0.
In the second robustness check (see Table 10), we re-estimate specification (2)using Nationwide data instead of Land Registry data. We take advantage of thelarger set of transaction controls and add the number of bedrooms, square meters,the construction date and the type of good (e.g., flat, Victorian house) to our originalcontrols. Note, however, that due to the selection induced by the use of Nationwidedata, we only run the specifications with LSOA fixed effects. The results are similarto the benchmark specification. There is a 3% price malus in neighborhoods closeto active nuclear plants. The estimates remain quite precise in spite of the lowernumber of recorded transactions.
In a third robustness check (see Table 11), we test the sensitivity of our resultsto the addition of differential trends along some LSOA characteristics. Our resultscould be driven by a higher concern in zones that have more ecological concerns
19We do not report the results of this placebo test for the number of transactions, the volumeof transactions, and the estimates around nuclear waste sites, but the estimates are always non-economically significant (results available on request).
18

in general, and the neighborhoods of nuclear plants are potentially such zones. Incolumn 1 of Table 11, we add the share of green votes during the 2010 election inter-acted with time dummies. We then add the income, employment, health, educationand crime deprivation ranks interacted with time dummies (column 2). Finally, weadd census controls (type of accommodation, high/medium/low education levels,occupational structure) interacted with time dummies in column 3. None of thosecontrols modify our conclusions.20
In a fourth robustness check (see Table 12), we test the sensitivity of our resultsto other treatment definitions. We first redefine our treated zone (resp. controlzones) as being between 0-15 km (resp. 15-100 km), 0-25 km (resp. 25-100 km)and 0-50 km (resp. 50-100 km) from a nuclear plant and we report the results incolumns 1, 2 and 3. Second, we consider a continuous treatment, i.e., the distanceto the closest nuclear plant (see column 4). None of these specifications discard ourconclusions drawn from the benchmark estimates.
4 The demand shift and the distributional effects
This section presents an analysis of the demand shift across different price quantiles,and an interpretation of these results.
4.1 The demand shift across price quantiles and neighborhoods
So far, we have analyzed the demand shift in the housing markets, but we havefocused on the average effect.
We now run two separate analyses. In the first specification, we focus on thewithin-neighborhood distribution of prices and its evolution after Fukushima. Inthe second specification, we analyze the differences in price response across neigh-borhoods and we use three observable characteristics to define neighborhoods, theirdeprivation score, whether they are urban or rural and the existence of a greensupport.
In Table 5, we report the result of quantile regressions based on specification (2)with the LSOA fixed effects and the transaction controls. As in Table 3, we restrictour sample to the period January 2009 - September 2014.
The results are striking. There is a wide heterogeneity in the price responseacross quantiles. The 10%-quantile effect is close to 0 while the 25% and medianeffects are around -3.5-4%, the 75% around -5.5% and the 90% above -7%. There
20Controlling for i. the council taxes, ii. the number of open vacancies, or iii. the schoolperformance does not alter our results (results available on request).
19

is a strong compression in the distribution of prices in response to Fukushima: theshift in demand seems to be particularly pronounced for high-value goods.21
In Table 8, we report specification (2) with interaction terms between the effectand four neighborhood characteristics. In the first specification (column 1), weinteract our treatment with a dummy for neighborhoods with a deprivation scoreabove the median. In the second specification (column 2), we add an interactionwith a dummy for being in a rural area. In the third specification (column 3), we addthe support (in percentage points) for a local green candidate in the 2010 legislativeelections. In the last specification (column 4), we replace the support for a localgreen candidate in the 2010 legislative elections by the turnout levels during thiselection. While there are large additional maluses for deprived (-3%) and rural areas(-2%) as well as areas with low turnout (+3% for 10 additional points in turnout –2 standard deviations), we see no heterogeneity across neighborhoods with differentgreen support.
These results are surprising in two dimensions. First, the price distributionwithin neighborhoods tilts towards the lower tail, but this shift is essentially seen indeprived areas, whether the indicator for being a deprived area is a rural dummy, adeprivation score or turnout during a legislative election.22
One way to see this phenomenon is to plot the pre- versus post-Fukushima dis-tribution of transaction prices in treated versus control places, and to differentiatebetween deprived neighborhoods (see Figure 6) and non-deprived neighborhoods (seeFigure 7). Transaction prices strongly respond in deprived areas, and this responseis mostly explained by a shortage of high-price transactions. In both deprived andnon-deprived areas, the malus due to the proximity of a power plant is essentially inthe 0-20km ring around NPPs before and after the accident, as shown in Figure 8.
Second, green vote does not seem to have any influence, while it could be cor-related with two elements that intervene in the theoretical demand shift, i.e., thedisamenity related to nuclear risk and the information set of voters.23 The generallow level of green votes in England and Wales may explain this result.
21We do not report the results with the Nationwide data, but the conclusions are the same.22We observe similar heterogeneous effects in the neighborhoods of waste sites (results available
upon request).23In its platform, the Green Party specifies that “[the Green Party] will cancel construction of
new nuclear stations and nuclear power will not be eligible for government subsidy; the GreenParty opposes nuclear power generation and is particularly opposed to the construction of newnuclear power stations”.
20

4.2 Interpretation
There are three potential dimensions of heterogeneity across agents that may explainthe observed differences in the demand shift across the different price quantiles,and across the different neighborhoods. First, agents may differ in their access toinformation both in the precision of their pre-disaster information on nuclear risk,and in their capacity to process the Fukushima signal. For instance, richer agentsmight lend special attention to the news release on Fukushima and better updatetheir beliefs. Second, in spite of similar beliefs before and after the disaster, agentsmay differ in their valuation of the underlying nuclear risk and richer agents mayattribute a higher value to a safe environment (low radiation doses). Third, agentsmay differ in their ability to influence political decisions and obtain compensationsfor living close to a nuclear plant.
We describe below how these dimensions of heterogeneity may fit with our results.
Valuation Let us assume that agents can be characterized by (i) a disamenityfor nuclear risk – “nuclear fear”, and (ii) a certain demand for high-price houses –“wealth”, but their access to information is similar (they estimate nuclear risk withsome precision).
Before Fukushima, a simple selection process should have led the agents withlow nuclear fear to live in the neighborhoods of nuclear plants, and agents with highnuclear fear to live outside of the danger zone. The distribution of housing priceswould then reflect the distribution of wealth across these types.
After Fukushima, all agents similarly revise their priors on nuclear risks, andadjust their housing demand to this new valuation. If wealthy agents are the oneswho are most adverse to nuclear risk, the few of them having accepted to live inthe neighborhood of a nuclear plant should all strongly shift their housing demanddownward, and the housing prices both within and across postcodes should stronglycompress.
Our results are not consistent with this sole mechanism. While we do find somecompression within postcodes, we find that non-deprived areas with high housingprices are less responsive.
Information In contrast with the previous mechanism, we assume now that agentscan be characterized by (i) access to prior information – “nuclear awareness”, and (ii)a certain demand for high-price houses – “wealth”, but their nuclear fear is similar– all agents attribute a same malus to the neighborhoods of nuclear plants.
Before Fukushima, the same selection process would have driven agents with high
21

nuclear awareness outside of the danger zone, and mostly agents with low awarenesswould remain in the close neighborhood of nuclear plants.
After Fukushima, agents with the lowest nuclear awareness would respond themost. This could explain why deprived areas are most responsive, but cannot reallyexplain why the effect is mostly driven by the right tail of the price distribution.
Information externalities Let us assume, as in the first story, that agents arecharacterized by “nuclear fear” and “wealth”, and that these two dimensions arepositively correlated, i.e. rich agents usually care more about nuclear risk. Supposethat information is imperfect: it requires effort to be informed, e.g., invest in inves-tigation for the local newspaper, and there exists strong externalities (the efforts ofone agent have positive spillovers).
In such a world, some neighborhoods of nuclear plants that are essentially com-posed of poor agents would have a low nuclear fear in average, nobody would investin information and the few rich agents would be imperfectly informed about nuclearrisk. Rich neighborhoods instead would have high nuclear fear and would invest alot in information.
After Fukushima, these rich neighborhoods do not respond because nuclear riskwas already perfectly identified. In contrast, individuals in poor neighborhoodswould respond because of their very imprecise priors, and individuals with the high-est nuclear fear would react the most.
Political power Let us assume, as in the first stories, that agents are character-ized by “nuclear fear” and “wealth”, and that these two dimensions are positivelycorrelated, i.e. rich agents usually care more about nuclear risk. Assume that richneighborhoods have political power such as they can influence political decisions andget specific compensations to live in at-risk areas, for instance in the form of newschools, local tax rebates and infrastructure improvements.
After FNA, rich areas do not respond much since they get extra compensationfor the increased risk they are exposed to. Agents in deprived areas would respondmore as they do not get compensations, and within this group, rich agents wouldrespond the most as they have higher nuclear fear.
We do not have any tests for the exact mechanism at play. However, thereexist different theoretical channels which would generate predictions in line with ourempirical observations.
22

5 Conclusion
Fukushima accident was a salient industrial accident that has generated importantreactions from policy makers and public opinions worldwide about industrial risk.Understanding how people react to such a rare event and how they update theirbeliefs about nuclear risk is of prime importance.
In this paper, we study how nuclear-risk perception in England and Wales haschanged due to the Fukushima nuclear accident. To track changes in risk perception,we use a difference-in-difference strategy, and we compare housing prices and trans-action volumes in at-risk areas to those in safe areas before and after Fukushimaincident. In order to define at-risk areas in the UK, we relied on the Fukushima Dai-ichi evacuation process (Japanese Government, 2011) and defined a 20 km evacuationzone around each nuclear site. This piece of information was discussed worldwide inmedia, thus was available to individuals in England and Wales.
Results are striking: due to Fukushima accident a price malus of about 3.5% forproperties close to nuclear plants is observed across a variety of specifications. Thisprice effect is persistent throughout the post-Fukushima period. Our results are atodds with British stable support in favor of nuclear power as expressed by opinionpolls before and after Fukushima, and may reflect the fact that only a minority ofthe overall population remains at risk (2% of the England and Wales territory).
In the UK context, we show evidence that this price malus can be interpreted asa change in nuclear-risk perception. Indeed, no policy has been triggered that couldhave had an asymmetric impact on local housing markets nearby nuclear sites. In theUnited Kingdom, changes in housing prices are not due to economic impacts such asexpected losses in local employment, expected reductions in local-tax revenues etc.The continuation of the nuclear programme in the United Kingdom contrasts withthose of most other countries which were either canceled, suspended or reappraised.The case of Germany, whose Chancellor Angela Merkel decided to exit nuclear powerby 2022, is the strongest example.
In addition, we find a much larger price decrease for high-value properties withinneighborhoods, and we show that deprived zones in at-risk areas are more responsiveto the accident. We offer two main explanations of these results. They all sharethe assumption that richer agents put a higher value on a safe environment. Thisassumption allows to explain the compression of the transaction prices distributionthat we observe within neighborhoods. First, if rich areas have more informationabout nuclear power, priors in these areas will be more accurate, thus people willreact less to the accident compared to deprived areas, and rich persons in deprived
23

areas would react the most if they value more a safe environment. Second, if richareas have some political power that allow them to obtain compensations for theincreased (perceived) nuclear risk, housing prices in these areas would not react bymuch.
24

References
Anselin, Luc and Nancy Lozano-Gracia, “Errors in variables and spatial effectsin hedonic house price models of ambient air quality,” Empirical Economics, 2008,34 (1), 5–34.
Bauer, Thomas K., Sebastian Braun, and Michael Kvasnicka, “DistantEvent, Local Effects? Fukushima and the German Housing Market,” Ruhr Eco-nomic Papers August 2013.
Bezdek, Roger H. and Robert M. Wendling, “The impacts of nuclear fa-cilities on property values and other factors in the surrounding communities,”International Journal of Nuclear Governance, Economy and Ecology, 2006, 1 (1),122–144.
Blehaut, Marianne, “How does a change in risk perception affect the housingmarket? Evidence from an industrial accident in France,” Technical Report 2014.
Blomquist, Glenn, “The Effect of Electric Utility Power Plant Location on AreaProperty Value,” Land Economics, 1974, 50 (1), pp. 97–100.
Carruthers, John I. and David Clark, “Valuing environmental quality: a space-based strategy,” Journal of Regional Science, 2010, 50 (4), 801–832.
Clark, David E., Lisa Michelbrink, Tim Allison, and William C. Metz,“Nuclear Power Plants and Residential Housing Prices,” Growth and Change,1997, 28 (4), 496–519.
Cohen, Jeffrey P. and Cletus C. Coughlin, “Spatial Hedonic Models Of AirportNoise, Proximity, And Housing Prices,” Journal of Regional Science, 2008, 48 (5),859–878.
Davis, Lucas W., “The Effect of Power Plants on Local Housing Values and Rents,”The Review of Economics and Statistics, November 2011, 93 (4), 1391–1402.
Debrezion, Ghebreegziabiher, Eric Pels, and Piet Rietveld, “The Impactof Railway Stations on Residential and Commercial Property Value: A Meta-analysis,” The Journal of Real Estate Finance and Economics, August 2007, 35(2), 161–180.
Fink, Alexander and Thomas Stratmann, “U.S. housing prices and theFukushima nuclear accident: To update, or not to update, that is the question,”
25

ICER Working Papers, ICER - International Centre for Economic Research June2013.
Folland, Sherman T. and Robbin R. Hough, “Nuclear Power Plants and theValue of Agricultural Land,” Land Economics, 1991, 67 (1), 30–36.
Gamble, Hays B. and Roger H. Downing, “Effects of nuclear power plants onresidential property values,” Journal of Regional Science, 1982, 22 (4), 457–478.
Gayer, Ted, James T. Hamilton, and W Viscusi, “Private Values Of RiskTradeoffs At Superfund Sites: Housing Market Evidence On Learning AboutRisk,” The Review of Economics and Statistics, 2000, 82 (3), 439–451.
Gibbons, Stephen, “Gone with the Wind: Valuing the Visual Impacts of WindTurbines through House Prices,” SERC Discussion Papers 0159, Spatial Eco-nomics Research Centre, LSE April 2014.
Greenstone, Michael and Justin Gallagher, “Does Hazardous Waste Matter?Evidence from the Housing Market and the Superfund Program,” The QuarterlyJournal of Economics, 2008, 123 (3), 951–1003.
Hanaoka, Chie, Hitoshi Shigeoka, and Yasutora Watanabe, “Do risk pref-erences change? Evidence from panel data before and after the great east Japanearthquake,” Technical Report 2014.
Hughes, William T. and C. F. Sirmans, “Traffic externalities and single-familyhouse prices,” Journal of Regional Science, 1992, 32 (4), 487–500.
IEA, “Key World Energy Statistics,” 2014.
Japanese Government, “Report of Japanese Government to the IAEA MinisterialConference on Nuclear Safety: The Accident at TEPCO’s Fukushima NuclearPower Stations.,” Technical Report 2011.
Kiel, Katherine A. and Katherine T. McClain, “House Prices during SitingDecision Stages: The Case of an Incinerator from Rumor through Operation,”Journal of Environmental Economics and Management, March 1995, 28 (2), 241–255.
and Michael Williams, “The impact of Superfund sites on local propertyvalues: Are all sites the same?,” Journal of Urban Economics, January 2007, 61(1), 170–192.
26

Kivimaki, Mika and Raija Kalimo, “Risk perception among nuclear power plantpersonnel: a survey,” Risk Analysis, 1993, 13 (4), 421–424.
Managi, Shunsuke and Kenta Tanaka, “Impact of a Disaster on Land Price:Evidence from Fukushima Nuclear Power Plant Accident,” MPRA Paper 59358,University Library of Munich, Germany October 2014.
Muehlenbachs, Lucija, Elisheba Spiller, and Christopher Timmins, “TheHousing Market Impacts of Shale Gas Development,” Working Paper 19796, Na-tional Bureau of Economic Research January 2014.
Nelson, Jon P., “Three Mile Island and Residential Property Values: EmpiricalAnalysis and Policy Implications,” Land Economics, 1981, 57 (3), 363–372.
Poortinga, Wouter, Midori Aoyagi, and Nick F. Pidgeon, “Public percep-tions of climate change and energy futures before and after the Fukushima acci-dent: A comparison between Britain and Japan,” Energy Policy, 2013, 62, 1204– 1211.
Slovic, Paul, “Perception of risk,” Science, 1987, 236 (4799), 280–285.
Viscusi, W. Kip and James T. Hamilton, “Are Risk Regulators Rational?Evidence from Hazardous Waste Cleanup Decisions,” American Economic Review,1999, 89 (4), 1010–1027.
Weightman, Mike, “Japanese earthquake and tsunami: Implications for the UKnuclear industry. Final Report,” Technical Report, Office for Nuclear Regulation2011.
Zhu, Hongjia, Yongheng Deng, Rong Zhu, and Xiaobo He, “Fear of NuclearPower? Evidence from Fukushima Nuclear Accident and Land Markets in China,”2015.
27

Figures and tables
Figure 1. Map of nuclear power plants and nuclear waste sites.
Nuclear plants (large red dots) and nuclear waste sites (small blue dots) in the United Kingdom (2012).
28

Figure 2. Treated and control groups around nuclear plants P1, P2 and P3.
Treated(less than 20 kmaway from a NPP)
Control(less than 100 km from a NPP, andmore than 20 km away from all NPPs)
P2
P3
P1
Figure 3. Housing market equilibrium (permanent belief revision).
S(p)
D(p)
D′(p)
p
p′
h
p
29

Figure 4. Housing market equilibrium (transitory belief revision).
S(p)
D(p)
D′(p)
p
p′
hh′h
p
Figure 5. Average transaction prices as a function of distance to nuclear plants and waste sites.
(a) Nuclear Plant. (b) Waste site.
Note: these figures display the average prices as a function of distance to nuclear plants (left panel) and waste sites(right panel) over the period January 2007-September 2014.
30

Figure 6. Distributions of prices for deprived neighborhoods before and after Fukushima in treated(teal) and control zones (black).
(a) Before. (b) After.
Note: these figures display the distribution of prices before (left panel) and after (right panel) the Fukushimaaccident for areas with a deprivation score above the median. Prices are in logarithms and cleaned for housingcharacteristics and area fixed effects.
Figure 7. Distributions of prices for non-deprived neighborhoods before and after Fukushima intreated (teal) and control zones (black).
(a) Before. (b) After.
Note: these figures display the distribution of prices before (left panel) and after (right panel) the Fukushimaaccident for areas with a deprivation score below the median. Prices are in logarithms and cleaned for housingcharacteristics and area fixed effects.
31
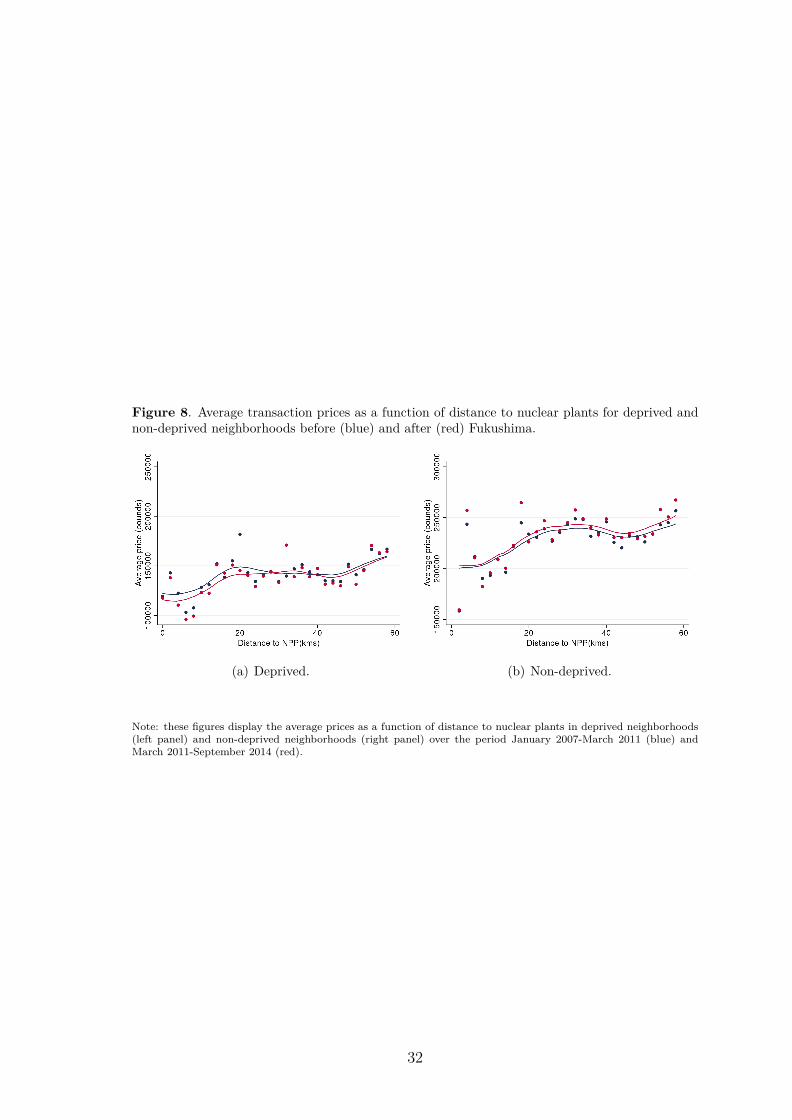
Figure 8. Average transaction prices as a function of distance to nuclear plants for deprived andnon-deprived neighborhoods before (blue) and after (red) Fukushima.
(a) Deprived. (b) Non-deprived.
Note: these figures display the average prices as a function of distance to nuclear plants in deprived neighborhoods(left panel) and non-deprived neighborhoods (right panel) over the period January 2007-March 2011 (blue) andMarch 2011-September 2014 (red).
32

Tab
le1.
Nuc
lear
plan
tsin
Engl
and
and
Wal
es.
Nam
eC
apac
ity(M
W)
Rea
ctor
sC
onne
ctio
nEx
pect
edC
losu
reT
ype
Latit
ude
Long
itude
Act
ive
plan
tsW
ylfa
490
119
7120
14M
agno
x53
.417
-4.4
83H
eysh
am1
1160
219
8920
19A
GR
54.0
28-2
.916
Hin
kley
Poin
tB
1220
219
7620
23A
GR
51.2
09-3
.127
Hun
ters
ton
B11
902
1976
2023
AG
R55
.722
-4.8
9D
unge
ness
B11
102
1985
2018
AG
R50
.914
0.96
4H
artle
pool
1190
219
8920
19A
GR
54.6
35-1
.181
Hey
sham
212
502
1989
2023
AG
R54
.028
-2.9
16To
rnes
s12
502
1988
2023
AG
R55
.968
-2.4
09Si
zew
ellB
1188
119
9520
35PW
R52
.215
1.62
Old
bury
434
219
6720
12M
agno
x51
.649
-2.5
71C
lose
dpl
ants
Ber
kele
y27
62
1962
1989
Mag
nox
51.6
92-2
.494
Hun
ters
ton
A30
02
1964
1989
Mag
nox
55.7
22-4
.89
Traw
sfyn
ydd
390
219
6519
91M
agno
x52
.925
-3.9
48D
ounr
eay
Fast
reac
tor
234
519
7619
94M
agno
x58
.578
-3.7
52H
inkl
eyPo
int
A47
02
1965
2000
Mag
nox
51.2
09-3
.134
Bra
dwel
l24
62
1962
2002
Mag
nox
51.7
410.
897
Cal
der
Hal
l20
04
1956
2003
Mag
nox
54.4
21-3
.497
5C
hape
lcro
ss20
04
1959
2004
Mag
nox
55.0
16-3
.226
Size
wel
lA42
02
1966
2006
Mag
nox
52.2
151.
62D
unge
ness
A45
02
1965
2006
Mag
nox
50.9
140.
964
Sour
ce:
Dep
artm
ent
ofE
nerg
y&
Clim
ate
Cha
nge
(DE
CC
).
33

Table 2. Descriptive statistics in 2010.
Sample All Tnp = 1 Tnp = 0 Tws = 1 Tws = 0Observations 308,326 12,064 207,493 32,440 133,247
Housing marketVolume of transactions† 514542.0 400105.8 541658.6 390673.9 533633.8Average price† 226297.8 179361.5 238280.8 177173.9 233955.0Number of transactions 2.169 2.157 2.167 2.146 2.173fraction of new buildings 0.040 0.045 0.038 0.039 0.040fraction of flats 0.158 0.089 0.187 0.096 0.167
Deprivation scoresIncome rank .533 .525 .520 .535 .534Employment rank .533 .470 .530 .492 .540Barriers to housing rank .503 .609 .472 .595 .493
Distance to nuclear facilitiesDistance to plants 80.59 13.71 65.56 59.28 82.18Distance to waste sites 52.82 13.62 53.70 12.30 56.35A unit of observation is a month/LSOA. The deprivation scores are the percentile in the distribution over all the
LSOAs in England. A rank of 1 means that the LSOA has the lowest score in England. †: All monetary variables
are expressed in Sterling pounds. Tnp (resp. Tws) is equal to 1 for all LSOAs whose centroid is within the potential
evacuation zone of a nuclear power plant (resp. nuclear waste site), and to 0 for LSOAs in a band of 20-100 km.
34

Table 3. Effect of Fukushima on the housing market.
PANEL A: Nuclear plants(1) (2) (3)
Price -.0379∗∗∗ -.0241∗∗∗ -.0325∗∗∗(.0033) (.0021) (.0018)
Number of transactions .00162 -.0098∗∗∗ -.0136∗∗∗(.0040) (.0037) (.0039)
Volume of transactions -.0363∗∗∗ -.0340∗∗∗ -.0462∗∗∗(.0054) (.0044) (.0044)
Observations 1,754,282 1,754,282 1,577,723Controls (housing characteristics) YesLSOA fixed effects Yes Yes
PANEL B: Nuclear waste sites(1) (2) (3)
Price -.0180∗∗∗ -.0146∗∗∗ -.0193∗∗∗(.0027) (.0017) (.0016)
Number of transactions -.00122 -.0106∗∗∗ -.0137∗∗∗(.0033) (.0030) (.0034)
Volume of transactions -.0.0192∗∗∗ .0252∗∗∗ .0331∗∗∗(.0044) (.0036) (.0039)
Observations 1,600,981 1,600,981 1,429,256Controls (housing characteristics) YesLSOA fixed effects Yes Yes
Each cell displays the result of a separate regression (specification (2)). We only report the Difference-in-Differencecoefficient, i.e. the coefficient before the treatment (LSOA centroid less than 20km from a nuclear plant) interactedwith a dummy for post-Fukushima. Robust standard errors in parentheses are clustered at the plant level. ∗∗∗:p < 0.01, ∗∗: p < 0.05, ∗: p < 0.1. The unit of observation is a LSOA/month. All specifications include month/zonedummies which clean for all time variations in the 100 km-neighborhood of any nuclear plant.
35

Tab
le4.
The
role
ofN
PP’s
char
acte
ristic
s.
(1)
(2)
(3)
(4)
Trea
tmen
t×
Con
nect
ion
.001
03∗∗∗
(.000
14)
Trea
tmen
t×
Expe
cted
clos
ure
.001
87∗∗∗
(.000
17)
Trea
tmen
t×
Num
ber
acci
dent
s.0
0031
(.001
43)
Trea
tmen
t×
Pack
age
(100
0m
3 )-.0
0027
9∗∗∗
(.000
062)
Trea
tmen
t×
Shar
eem
ploy
men
t(%
).0
0380∗∗∗
(.000
59)
Obs
erva
tions
1,57
7,72
31,
577,
723
1,57
7,72
31,
577,
723
1,57
7,72
3C
ontr
ols
(hou
sing)
Yes
Yes
Yes
Yes
Yes
LSO
Afix
edeff
ects
Yes
Yes
Yes
Yes
Yes
Eac
hco
lum
ndi
spla
ysth
ere
sult
ofa
sepa
rate
regr
essi
on(s
peci
ficat
ion
(2))
.W
eon
lyre
port
the
Diff
eren
ce-in
-Diff
eren
ceco
effici
ent,
i.e.
the
coeffi
cien
tbe
fore
the
trea
tmen
t(L
SOA
cent
roid
less
than
20km
from
anu
clea
rpl
ant)
inte
ract
edw
ith
adu
mm
yfo
rpo
st-F
ukus
him
a.R
obus
tst
anda
rder
rors
inpa
rent
hese
sar
ecl
uste
red
atth
epl
ant
leve
l.∗∗∗:p<
0.01
,∗∗
:p<
0.05
,∗:p<
0.1.
All
spec
ifica
tion
sin
clud
em
onth
/zon
edu
mm
ies
whi
chcl
ean
for
allt
ime
vari
atio
nsin
the
100
km-n
eigh
borh
ood
ofan
ynu
clea
rpl
ant.
36

Table 5. Effect of Fukushima on the housing market – Quantile regressions.
Quantiles .10 .25 .50 .75 .90Price -.00925 -.0405∗∗∗ -.0332∗∗∗ -.0565∗∗∗ -.0710∗∗∗
(.0120) (.0093) (.0087) (.0110) (.0175)
Observations 158,319 158,319 158,319 158,319 158,319Controls (housing) Yes Yes Yes Yes YesEach cell displays the result of a separate quantile regression (specification (2)). We only report the Difference-in-Difference coefficient, i.e. the coefficient before the treatment (LSOA centroid less than 20km from a nuclear plant)interacted with a dummy for post-Fukushima. Robust standard errors in parentheses are clustered at the plantlevel. ∗∗∗: p < 0.01, ∗∗: p < 0.05, ∗: p < 0.1. The unit of observation is a transaction. All specifications includemonth/zone dummies which clean for all time variations in the 100 km-neighborhood of any nuclear plant. Forcomputational purposes, we only keep a random subsample of the whole sample (10%).
Table 6. Pre-treatment differential trends.
Nuclear plants(1) (2)
Price -.0036 .0010(.0053) (.0034)
Observations 740,020 740,020Controls (housing characteristics) YesLSOA fixed effects Yes
Each cell displays the result of a separate regression (specification (2)). We only report the Difference-in-Differencecoefficient, i.e. the coefficient before the treatment (LSOA centroid less than 20km from a nuclear plant) interactedwith a dummy equal to 0 between January 2007 and February 2009, and 1 between March 2009 and February 2011.Robust standard errors in parentheses are clustered at the plant level. ∗∗∗: p < 0.01, ∗∗: p < 0.05, ∗: p < 0.1.The unit of observation is a LSOA/month. All specifications include month/zone dummies which clean for all timevariations in the 100 km-neighborhood of any nuclear plant.
37

Table 7. Persistence of the Fukushima effect.
PANEL A:Price (1) (2)Treatment (03/11-11/12) -.0318∗∗∗ -.0218∗∗∗
(.0041) (.0022)Treatment (12/12-12/13) -.0345∗∗∗ -.0349∗∗∗
(.0053) (.0027)
Observations 1,556,208 1,399,234Controls (housing characteristics) YesLSOA fixed effects Yes
PANEL B:Number of transactions (1) (2)Treatment (03/11-11/12) -.0116∗∗ -.0080∗
(.0048) (.0046)Treatment (12/12-12/13) -.0058 -.0161∗∗∗
(.0058) (.0057)
Observations 1,551,687 1,395,612Controls (housing characteristics) YesLSOA fixed effects YesEach cell displays the result of a separate regression (specification (2)). We only report the Difference-in-Differencecoefficient, i.e. the coefficient before the treatment (LSOA centroid less than 20km from a nuclear plant) interactedwith a dummy for post-Fukushima. Robust standard errors in parentheses are clustered at the plant level. ∗∗∗:p < 0.01, ∗∗: p < 0.05, ∗: p < 0.1. All specifications include month/zone dummies which clean for all time variationsin the 100 km-neighborhood of any nuclear plant.
38

Table 8. The role of neighborhood characteristics.
(1) (2) (3) (4)Treatment × Deprivation -.0314∗∗∗ -.0341∗∗∗ -.0326∗∗∗ -.0280∗∗∗
(.0046) (.0047) (.0047) (.0047)Treatment × Rural -.0162∗∗∗ -.0233∗∗∗ -.0256∗∗∗
(.0046) (.0045) (.0065)Treatment × Green support -.2230
(.1882)Treatment × Turnout .2951∗∗∗
(.0651)
Observations 729,689 729,689 729,689 729,689Controls (housing) Yes Yes Yes YesLSOA fixed effects Yes Yes Yes Yes
Each column displays the result of a separate regression (specification (2)). We only report the Difference-in-Difference coefficient, i.e. the coefficient before the treatment (LSOA centroid less than 20km from a nuclear plant)interacted with a dummy for post-Fukushima. Robust standard errors in parentheses are clustered at the plantlevel. ∗∗∗: p < 0.01, ∗∗: p < 0.05, ∗: p < 0.1. All specifications include month/zone dummies which clean for alltime variations in the 100 km-neighborhood of any nuclear plant. Deprivation is a dummy for neighborhoods witha deprivation score above the median. Rural is a dummy for rural output areas. Green support is the support (inpercentage points) for a local green candidate in the 2010 legislative elections.
39

A Additional tables and figures
40

Tab
le9.
Nuc
lear
was
tesit
esin
Engl
and
and
Wal
es.
Loca
tion
Site
owne
rH
LW(m
3)
ILW
(m3)
LLW
(m3)
Lati
tude
Long
itud
eT
ype
Am
ersh
amG
E0
341
4090
50.2
24-7
.658
Rad
ioch
emic
alpr
oduc
tion
AWE
Ald
erm
asto
nM
oD0
4730
4190
051
.362
-1.1
39D
efen
cees
tabl
ishm
ents
BA
ESM
Bar
row
-in-F
urne
ssM
oD0
037
.554
.110
8-3
.226
1D
efen
cees
tabl
ishm
ents
Ber
kele
yN
DA
069
1030
300
51.6
92-2
.494
Nuc
lear
pow
erst
atio
nB
radw
ell
ND
A0
5770
5140
051
.741
0.89
7N
ucle
arpo
wer
stat
ion
Cal
der
Hal
lN
DA
094
1051
000
54.4
21-3
.497
Nuc
lear
pow
erst
atio
nC
apen
hurs
t(1
&2)
ND
A0
055
8054
.522
-8.1
45N
ucle
arfu
elpr
oduc
tion
and
repr
oces
sing
Cap
enhu
rst
(1&
2)U
renc
o0
328
1054
.522
-8.1
45N
ucle
arfu
elpr
oduc
tion
and
repr
oces
sing
Car
diff
GE
046
611
400
51.5
23-3
.250
Rad
ioch
emic
alpr
oduc
tion
Cha
pelc
ross
ND
A0
6230
1670
0055
.016
-3.2
26N
ucle
arpo
wer
stat
ion
HM
NB
Cly
deM
oD0
077
050
.299
-6.9
88D
efen
cees
tabl
ishm
ents
Cul
ham
UK
AE
A0
817
8100
51.6
58-1
.228
Res
earc
hes
tabl
ishm
ents
RR
MP
OL
Der
byM
oD0
019
6052
.910
-1.4
349
Def
ence
esta
blis
hmen
tsH
MN
BD
evon
port
MoD
032
817
600
50.3
83-4
.183
Def
ence
esta
blis
hmen
tsD
SDC
Nor
thD
onni
ngto
nM
oD0
012
549
.767
-7.5
57D
efen
cees
tabl
ishm
ents
Dou
nrea
yN
DA
011
300
1130
0058
.578
-3.7
52R
esea
rch
esta
blis
hmen
tsD
unge
ness
(A&
B)
ND
A(A
)0
6940
3490
050
.914
0.96
4N
ucle
arpo
wer
stat
ion
Dun
gene
ss(A
&B
)E
DF
(B)
070
8019
600
50.9
140.
964
Nuc
lear
pow
erst
atio
nE
skm
eals
MoD
00
101
54.3
16-3
.400
Res
earc
hes
tabl
ishm
ents
Har
tlep
ool
ED
F0
7680
1470
054
.635
-1.1
81N
ucle
arpo
wer
stat
ion
Har
wel
l(1
&2)
ND
A0
6870
9960
051
.6-1
.283
Res
earc
hes
tabl
ishm
ents
Har
wel
l(1
&2)
GE
00.
140
.451
.6-1
.283
Res
earc
hes
tabl
ishm
ents
Hey
sham
(1&
2)E
DF
(1)
076
2015
200
54.0
28-2
.916
Nuc
lear
pow
erst
atio
nH
eysh
am(1
&2)
ED
F(2
)0
7670
1910
054
.028
-2.9
16N
ucle
arpo
wer
stat
ion
Hin
kley
Poi
nt(A
&B
)N
DA
(A)
072
7057
400
51.2
09-3
.134
Nuc
lear
pow
erst
atio
nH
inkl
eyP
oint
(A&
B)
ED
F(B
)0
7340
1550
051
.209
-3.1
34N
ucle
arpo
wer
stat
ion
Hun
ters
ton
(A&
B)
ND
A(A
)0
8350
5760
055
.722
-4.8
9N
ucle
arpo
wer
stat
ion
Hun
ters
ton
(A&
B)
ED
F(B
)0
8030
1530
055
.722
-4.8
9N
ucle
arpo
wer
stat
ion
LLW
Rne
arD
rigg
ND
A0
250
2210
054
.379
-3.4
56In
dust
rial
and
land
fills
ites
NR
TE
Vul
can
MoD
015
635
.758
.578
-3.7
52D
efen
cees
tabl
ishm
ents
Old
bury
ND
A0
6120
3290
051
.649
-2.5
71N
ucle
arpo
wer
stat
ion
HM
NB
Por
tsm
outh
MoD
00.
217
.950
.804
-1.1
02D
efen
cees
tabl
ishm
ents
Ros
yth
&D
evon
port
MoD
036
7028
4056
.020
-3.4
53D
efen
cees
tabl
ishm
ents
Ros
yth
Roy
alD
ocky
ard
MoD
011
618
356
.020
-3.4
53D
efen
cees
tabl
ishm
ents
Sella
field
(Sel
lafie
ldLt
d)N
DA
1330
3020
0031
6000
054
.420
-3.4
97N
ucle
arfu
elpr
oduc
tion
and
repr
oces
sing
Sella
field
(NN
L)N
DA
00
856
54.4
205
-3.4
975
Nuc
lear
fuel
prod
ucti
onan
dre
proc
essi
ngSi
zew
ell(
A&
B)
ND
A(A
)0
6140
3870
052
.215
1.62
Nuc
lear
pow
erst
atio
nSi
zew
ell(
A&
B)
ED
F(B
)0
3260
1340
052
.215
1.62
Nuc
lear
pow
erst
atio
nSp
ring
field
sN
DA
00
2400
0053
.775
-2.8
08N
ucle
arfu
elpr
oduc
tion
and
repr
oces
sing
Torn
ess
ED
F0
7260
2030
055
.968
-2.4
09N
ucle
arpo
wer
stat
ion
Traw
sfyn
ydd
ND
A0
1340
060
700
52.9
25-3
.948
Nuc
lear
pow
erst
atio
nW
inds
cale
ND
A0
1380
012
100
54.4
20-3
.497
Nuc
lear
fuel
prod
ucti
onan
dre
proc
essi
ngW
infr
ith
ND
A0
1590
9560
50.6
82-2
.261
Res
earc
hes
tabl
ishm
ents
Wyl
faN
DA
084
3059
500
53.4
17-4
.483
Nuc
lear
pow
erst
atio
nSo
urce
:T
he20
10U
KR
adio
acti
veW
aste
Inve
ntor
y,D
epar
tmen
tof
Ene
rgy
&C
limat
eC
hang
e(D
EC
C).
41

Table 10. Effect of Fukushima on the housing market – Nationwide data.
PANEL A: Nuclear plants(1) (2)
Price -.0319∗∗∗ -.0250∗∗∗(.0055) (.0033)
Observations 402,113 402,113Controls (housing characteristics) YesLSOA fixed effects Yes Yes
PANEL B: Nuclear waste sites(1) (2)
Price -.0157∗∗∗ -.0134∗∗∗(.0043) (.0026)
Observations 380,886 380,886Controls (housing characteristics) YesLSOA fixed effects Yes Yes
Each cell displays the result of a separate regression (specification (2)). We only report the Difference-in-Differencecoefficient, i.e. the coefficient before the treatment (LSOA centroid less than 20km from a nuclear plant) interactedwith a dummy for post-Fukushima. Robust standard errors in parentheses are clustered at the plant level. ∗∗∗:p < 0.01, ∗∗: p < 0.05, ∗: p < 0.1. The unit of observation is a transaction. All specifications include month/zonedummies which clean for all time variations in the 100 km-neighborhood of any nuclear plant.
42
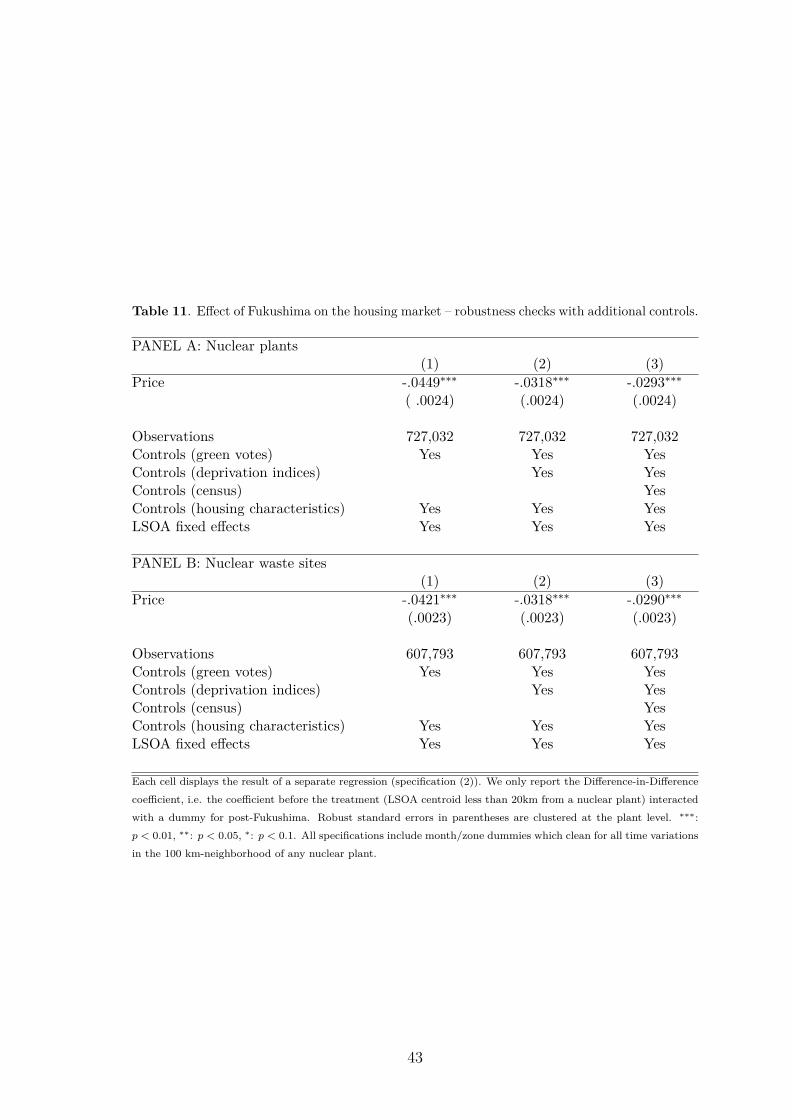
Table 11. Effect of Fukushima on the housing market – robustness checks with additional controls.
PANEL A: Nuclear plants(1) (2) (3)
Price -.0449∗∗∗ -.0318∗∗∗ -.0293∗∗∗( .0024) (.0024) (.0024)
Observations 727,032 727,032 727,032Controls (green votes) Yes Yes YesControls (deprivation indices) Yes YesControls (census) YesControls (housing characteristics) Yes Yes YesLSOA fixed effects Yes Yes Yes
PANEL B: Nuclear waste sites(1) (2) (3)
Price -.0421∗∗∗ -.0318∗∗∗ -.0290∗∗∗(.0023) (.0023) (.0023)
Observations 607,793 607,793 607,793Controls (green votes) Yes Yes YesControls (deprivation indices) Yes YesControls (census) YesControls (housing characteristics) Yes Yes YesLSOA fixed effects Yes Yes Yes
Each cell displays the result of a separate regression (specification (2)). We only report the Difference-in-Differencecoefficient, i.e. the coefficient before the treatment (LSOA centroid less than 20km from a nuclear plant) interactedwith a dummy for post-Fukushima. Robust standard errors in parentheses are clustered at the plant level. ∗∗∗:p < 0.01, ∗∗: p < 0.05, ∗: p < 0.1. All specifications include month/zone dummies which clean for all time variationsin the 100 km-neighborhood of any nuclear plant.
43

Table 12. Effect of Fukushima on the housing market – robustness checks with other treatmentdefinitions.
PANEL A: Nuclear plantsPrice (1) (2) (3) (4)Treatment (0-15 km) -.0248∗∗∗
(.0024)Treatment (0-25 km) -.0338∗∗∗
(.0015)Treatment (0-40 km) -.0362∗∗∗
(.0011)Distance (km) .00015∗∗∗
(.00001)
Observations 1,577,723 1,577,723 1,577,723 2,253,942Controls (housing characteristics) Yes Yes Yes YesLSOA fixed effects Yes Yes Yes Yes
PANEL B: Nuclear waste sitesPrice (1) (2) (3)Treatment (0-15 km) -.0220∗∗∗
(.0020)Treatment (0-25 km) -.0275∗∗∗
(.0014)Treatment (0-40 km) -.0333∗∗∗
(.0010)Distance (km) .00057∗∗∗
(.00001)
Observations 1,429,256 1,429,256 1,429,256 2,253,942Controls (housing characteristics) Yes Yes Yes YesLSOA fixed effects Yes Yes Yes Yes
Each column displays the result of a separate regression (specification (2)). We only report the Difference-in-Difference coefficient, i.e. the coefficient before the treatments interacted with a dummy for post-Fukushima. Robuststandard errors in parentheses are clustered at the plant level. ∗∗∗: p < 0.01, ∗∗: p < 0.05, ∗: p < 0.1. Allspecifications include month/zone dummies which clean for all time variations in the 100 km-neighborhood of anynuclear plant.
44

B Data sources
Nationwide Nationwide is the second largest mortgage provider in the UnitedKingdom, covering about 13-15% of the market (in volumes).
As a consequence, the sample of transactions is substantially smaller than LandRegistry. The percentage of Land Registry transactions in Nationwide is 10.19,10.46, 10.62, 9.63, 10.42, 16.19 and 16.55 between 2007 and 2013. The huge increasein 2012 relates to Nationwide strategy to cut fees. While the share of transactionsvaries with time, it is important to verify that such changes are not correlated withthe treatment: the ratio of transactions included in Nationwide increases between2007-2011 and 2012-2013 in similar proportions in treated (less than 20 kilometersfrom a nuclear plant) and non-treated zones.
Nationwide mostly covers small transactions, and these lower price quantiles areslightly over-represented. As before, however, the bias is very similar in treated andnon-treated zones.
The Nationwide dataset includes a wide range of controls for the property charac-teristics (e.g., the construction date, the number of bedrooms, bathrooms, garages,the square meters or heating facilities), and these controls alleviate the main issuewith Land Registry, i.e., the lack of individual-transaction controls. Accordingly, wemostly use Nationwide data such as to clean for within-LSOA compositional effects.
Local taxes We collect the Average Council Tax per Dwelling that is available atthe Billing authority (BA) on the Department for Communities and Local Govern-ment website. We then link each to a LSOA. In parallel, we construct the number ofproperties assigned to each council tax band for each domestic property type in eachgeographic area (LSOA). Council tax bands define eight valuation bands (nine bandsin Wales), i.e., A: Up to 40,000, B: 40,001 up to 52,000, C: 52,001 up to 68,000, D:68,001 up to 88,000, E: 88,001 up to 120,000, F: 120,001 up to 160,000, G: 160,001up to 320,000, H: 320,001 and above, on the basis of the domestic property value on1st April 1991 (1st April 2003 in Wales).
School performance We collect information about the performance of schoolsprovided by the Department of Education for the period 2009-2013 and we construct:
• a proxy for each school size (number of pupils per school),
• and proxies for students’ quality, i.e., the Average Point Score for each one ofthe stages (KS2, KS4, KS5).
45
Job Vacancies The information about the number of job vacancies by LSOA isavailable since 2004 up to November 2012 at the LSOA level. It is created on thebasis of reports from Job Centres.24 We thus generate the number of total vacanciesin each LSOA that we normalize by the number of prime-age working adults.
Census From the census 2011, we reconstruct in each LSOA the average qualityof accommodation, the average age of inhabitants, the number of schooling years,and the LSOA composition in terms of ethnicity and religion.
Green Votes The information on the vote share obtained by the Green Party onthe UK Parliament general election of 6 May 2010 was downloaded from:
http://www.electoralcommission.org.uk/our-work/our-research/electoral-data.
Deprivation The English Indices of Deprivation (2010) were constructed by theSocial Disadvantage Research Centre at the Department of Social Policy and SocialWork at the University of Oxford. The index is a weighted average of several sub-indices for each output area (Income Deprivation, 22.5%, Employment Deprivation,22.5%, Health Deprivation and Disability, 13.5%, Education, Skills and TrainingDeprivation, 13.5%, Barriers to Housing and Services, 9.3%, Crime, 9.3%, LivingEnvironment Deprivation, 9.3%).
The Income Deprivation measure sums the number of adults and children infamilies with Income Support, income-based Jobseeker’s Allowance, Pension Credit(Guarantee) or Child Tax Credit. Asylum seekers in England in receipt of subsis-tence support, accommodation support, or both are also included.
The Employment Deprivation measure sums the number of claimants of a. Job-seeker’s Allowance, b. Incapacity Benefit or Severe Disablement Allowance, c. Em-ployment and Support Allowance, and d. participants in New Deal.
The Health Deprivation and Disability measure combines a measure of prematuredeath with a morbidity/ disability ratio, the emergency admission to hospital andthe proportion of adults suffering from mood and anxiety disorders.
The Education measure combines the average points score of pupils taking En-glish, maths and science Key Stage 2/3 and 4 exams (this measure is already part ofour controls), the proportion of absences from secondary school, and the proportionof young people aged under 21 not entering higher education.
The Barriers to Housing and Services measure rates the housing conditions forhouseholds, i.e., the proportion of all households in an LSOA with insufficient space
24https://www.nomisweb.co.uk/query/construct/summary.asp?mode=construct&version=0&dataset=89
46

to meet the household’s needs, the number of households requiring housing assis-tance, the proportion of households under 35 whose income is not sufficient to affordits occupation.
The Crime Deprivation measure combines the rates of violence/burglary/theftand criminal damage.
Finally, the Living Environment Deprivation index captures the quality of hous-ing, and two measures relating to air quality and road traffic accidents.
47