the fourteenth young economists’ seminar - hnb.hr · 1 1. introduction during the last almost...
TRANSCRIPT

Matej Bule and Andrijana Ćudina
Foreign Direct Equity Investments and Foreign Ownership Premium: The Case of Croatia
Hotel "Grand Villa Argentina"
Dubrovnik
June 17, 2019
Draft version
Please do not quote
THE FOURTEENTH YOUNG ECONOMISTS’ SEMINAR TO THE TWENTY-FIFTH DUBROVNIK ECONOMIC CONFERENCE
Organized by the Croatian National Bank

FOREIGN DIRECT EQUITY INVESTMENTS
AND FOREIGN OWNERSHIP PREMIUM:
THE CASE OF CROATIA
Matej Bule*, Andrijana Ćudina**
Summary
This paper analyzes the structure of foreign direct equity investments in Croatia and econometrically
tests the existence of foreign ownership premium among Croatian non-financial companies. Using
a novel dataset generated by the merger of two firm-level databases, it is found that in the 2002-
2017 period foreign equity investments in non-financial companies were relatively modest and that
the bulk of investments was motivated by the expansion on the local market (market seeking FDI),
and only partly by increasing the efficiency of the investor's business group. As for the mode of entry,
most investments were greenfield projects, although brownfield investments were also significant,
reflecting the large scale privatization of state-owned companies. However, it is found that the
industry structure of investments was unfavorable as only a smaller part went into tradeable sectors
and high-tech industries. Compared to domestically owned companies, regression analysis has
firmly established the existence of organizational, technological and financial premium of foreign
ownership among Croatian non-financial companies, which differs depending on the size of the
company, industrial and regional affiliations, business orientation on local or foreign markets, type
of foreign ownership, mode of entry, as well as the origin of the foreign investor. Actually, the foreign
ownership premium is higher in small and medium companies and those that are oriented towards
the local market, and when the concentration of foreign ownership is higher. Also, the premium is
higher when the foreign investor originates from a more developed country.
Key words: foreign direct investment, foreign ownership premium
JEL classification: F21, F23, L20, C21
* Croatian National Bank, [email protected]
** Croatian National Bank, [email protected]
The views expressed in this paper are authors` own, and do not necessarily represent the views of the
Croatian National Bank.

1
1. Introduction
During the last almost three decades, many of the less developed European countries have been
trying to attract foreign investment recognizing its potential in accelerating economic growth and
smoothing the transition from planned to market economy. Indeed, foreign investment brings
numerous benefits to the host economy, both at a macroeconomic and microeconomic level. Apart
from being a relatively stable form of capital inflow, which is particularly important for countries
with inadequate domestic savings and accumulated macroeconomic imbalances, foreign direct
investment brings abundant macroeconomic benefits, most important being the job creation,
increasing tax revenues, widening export base and increasing the competitiveness of the economy.
At the microeconomic level, foreign ownership surges the transfer of superior knowledge and
technology, creates opportunities for faster involvement in global value chains, and often provides
access to more stable and affordable sources of funding.
Although the policy makers often take the benefits of foreign direct investments for granted, the
empirical findings on their true impact are not that streightforward. Specifically, empirical studies
are often based on aggregate macroeconomic data on inflows or stocks of foreign investments,
almost completely neglecting the fact that behind the aggregate variables there are numerous
investment projects, heterogeneous in nature, that can ultimately affect the recipient country in
different ways, depending on the motives behind each investment as well as the mode of entry of
foreign investors on the local market. In that context, with the increased availability of micro data,
the newer literature increasingly places companies at the very center of their research of the effects
of foreign investment. The basic assumption of this type of research is that foreign investors invest
in other countries in order to materialize the advantages of having the resources that are not
necessarily available to local entrepreneurs (Dunning, 1993).
Following the same assumption, this research seeks to examine the benefits of foreign ownership
on the example of Croatian companies over the 2002-2017 period through the estimation of
foreign ownership premium reflected in different organizational, technological or financial aspects
of non-financial companies. Premiums are estimated for different types of foreign investments,
depending on the motivation of investors (expansion on the local market or increasing efficiency
of the investors' business group), mode of entry (independent venture, joint venture, privatization
or takeover), size of the company, industry field, country of foreign investor, etc.
The paper is structured as follows. After the introduction, the second chapter provides a brief
overview of empirical literature, with an emphasis on the contribution from this particular
research. Then, in the third chapter, the data sources used in the descriptive and empirical part of
the research are described. The fourth chapter presents a detailed descriptive analysis of foreign
direct investment in Croatia based on data collected by the Croatian National Bank and the
Financial Agency directly from companies, which, according to the authors' best knowledge, have
not been used so far in such structural analysis of the foreign investment. Based on the same data,
the fifth chapter econometrically evaluates foreign ownership premium with regard to different
criteria (industry and region in which the company operates, its business orientation, relation with
the foreign investors, as well as the mode in which the investment was carried out).

2
2. Literature overview and research contribution
Empirical literature dealing with the effects of foreign direct equity investments on the recipient
country is quite rich. However, most of the literature are multi-country macroeconomic studies
that only partly take into account the specifics of each national economy, and thus cannot be
widely applied. By contrast, microeconomic studies that rely on firm-level data and thus take into
account the heterogeneity of individual investment projects (Wang et al., 2012), allow for a more
precise measurement of the effects of foreign investment on the business performance of
individual companies, as well as the measurement of spillover effects on other companies and
consequently on the overall macroeconomic activity. Thanks to the increasing availability and
quality of the data, the number of micro-based studies is on the rise at the global level.
Methodologically speaking, in microeconomic studies, the effects of foreign investment are most
often measured by the direct comparison of foreign and domestically owned companies through
the calculation of the so-called foreign ownership premium using various firm characteristics and
performance indicators. Expectedly, most such studies confirm the generally accepted assumption
that foreign-owned companies have better characteristics and performance than domestically
owned companies (this was confirmed by Doms and Jensen in 1995 on the example of US
companies; Goethals and Ooghe in 1997 for Belgian companies; Conyon et al. in 2002 for British
companies; Aydin et al. in 2007 for Turkish companies; and Gelübcke in 2012 for German
companies). Most mentioned authors point to higher productivity and wages in foreign-owned
companies, their greater capital and technological intensity as well as their better financial
performance, primarily the higher profitability and lower financing costs. They attribute these
findings to the fact that foreign-owned companies possess specific advantages that enable them
to use scarce resources more efficiently than the domestically owned companies, primarily in
terms of more advanced technology, better financial conditions and higher-quality human capital
(Caves, 2007; Shiu, 2009). The explanation may also be in the positive selection by foreign
investors when choosing domestic companies in which to invest, i.e. in their tendency to invest in
companies with above-average performance (Bentivogli and Mirenda, 2016).
However, there are exceptions. For example, Konings (2001) did not find any positive effects of
foreign ownership in the sample of Bulgarian and Romanian companies, as did not Khawar (2003)
on the example of Mexican companies. Likewise, Barbosa and Louri (2005) found almost no
difference between foreign and domestically owned companies in Portugal and Greece. According
to these studies, better knowledge of local markets and established distribution channels are some
of the advantages that can be better capitalized by domestic owners rather than foreigners.
Whereas most of the mentioned studies did not distinguish between different levels of foreign
ownership, Azzam et al. (2013) have shown that foreign ownership may have non-linear effects,
i.e. that its positive effects decrease after a certain level of foreign ownership. Similarly, Hintošova
and Kubikova (2016), on the example of Slovak companies, confirmed that the company's
performance improves with higher level of foreign ownership, but only up to the level of about
60%, after which it deteriorates compared to peer companies.
In most studies examining the case of Croatia, the effects of foreign direct equity investments are
analyzed from a macroeconomic perspective (Vukšić, 2005; Derado et al., 2011; Derado, 2013;
Kersan-Škrabić, 2014). Only a few studies have been carried out at the microeconomic level, and

3
these are relatively outdated studies focusing on the manufacturing sector. Škudar (2004)
confirmed positive effects of direct equity investments, both greenfield and brownfield, on the
example of Croatian manufacturing companies in the period from 1998 to 2002. These positive
effects are reflected in faster income and capital as well as productivity growth of foreign-owned
companies. The same author emphasized that positive effects of direct investment on the firm-
level did not translate into macroeconomic benefits, at least not as much as in other transition
European countries, due to the relatively small volume of foreign investments in the Croatian case.
Another significant research, Marić (2008), on the sample of about 2,400 companies in the period
from 1999 to 2005 also confirmed positive effects of foreign ownership on the productivity of
companies that are subject of foreign investment as well as spillover effects on the productivity of
other companies in the manufacturing industry.
Research questions raised by these authors are still very important for Croatia, especially in the
context of low potential growth of the domestic economy and the possible positive impact of equity
investments in that regard. This research complements the existing empirical knowledge on the
link between foreign ownership and business performance at the micro level, which is the basis
for understanding the impact of FDI at the macroeconomic level. Actually, the contribution of this
research is significant in many ways. Foremost, using a newly created data set, the paper
disaggregates the foreign direct equity investments in Croatia by new criteria, with perhaps the
most interesting being the motives of foreign investors and the mode of their entry on the local
market, thus sheding a new light on agregate FDI developments in Croatia. At the microeconomic
level, the main contribution of this research is in the estimation of foreign ownership premium
using a considerably broader set of structural and performance indicators that have not been used
previously, while using a larger sample of companies over a longer period of time (2002 - 2017).
Namely, for the first time, according to the authors' best knowledge, the regression model is used
to estimate the foreign ownership premium in various organizational, technological and financial
aspects of business performance of Croatian non-financial companies. The model takes into
account the heterogeneity among companies in terms of their size, industry field and regional
affiliation, business orientation, modality of foreign ownership, etc. The differentiation of the
foreign ownership premium with respect to all of these aspects significantly contributes to better
understanding of the behavior of foreign investors and can be used by policy makers in creating
measures to stimulate foreign investment with a view of improving the country's macroeconomic
outlook.
3. Data sources
For the purposes of this study, data from two firm-level databases was used. The first one is the
Croatian National Bank's (CNB) database containing detailed information on foreign direct equity
investments1
from 1990 to 2018. Namely, legal entities in Croatia are obliged to report to the
CNB the prescribed data on foreign direct investments for the purpose of monitoring external
sector developments, i.e. the compilation of the balance of payments. The advantage of the CNB
database is that it is the only source that includes specific information related to each investment,
1 In this paper the definition of foreign direct equity investments refers to those investments where a foreign owner
acquires at least 10% of the share in the company's share capital.

4
like the type of investment, method of payment, country of investor, acquired share in the
company, etc. This database is than merged with the annual financial statements of non-financial
companies reported to the Financial Agency (FINA) during 2002-2017 period. Companies
operating in Croatia are obliged to submit their financial statements to FINA for statistical and
other purposes, which are than aggregated and made available to other institutions and users. The
FINA database contains several hundred information from companies' balance sheets and the
profit and loss accounts. By merging these two databases, a unique data set is created, enabling a
much more detailed desegregation of total foreign direct investment as well as a deeper insight
into the microeconomic aspects of foreign investment.
Based on this newly created data set, in Chapter 4 total foreign direct investment in non-financial
companies during 2002-2017 period is desegregated. The desegregation analysis encompasses
9,717 non-financial companies subject to foreign investment at different years during the observed
period. These are companies for which complete data are available, i.e. those that have properly
reported the data on foreign investments to the CNB and have also submitted annual financial
statements to FINA. The analysis does not include 456 companies that did not submit annual
financial statements to FINA, but their importance in the total value of foreign direct investment
is not significant, as those are mostly inactive companies2
.
The calculation of the foreign ownership premium in Chapter 5 is based on a sample of 35,324
companies, out of which 2,185 are foreign-owned and 33,139 are domestically owned. The
sample was created by "cleaning" the total population of non-financial companies that properly
report to FINA, using several criteria. Namely, in the period from 2002 to 2017, more than 100
thousand companies operated in Croatia, in which the previously mentioned 9,717 were foreign-
owned. Out of the total population, first were excluded the companies operating in those activities
where no foreign investments were recorded in the observed period (at the fifth level of the NACE
Classification). Then, companies having less than 10 employees on average during the observed
period were excluded. The detailed overview of the sample structure according to different criteria
is given in Table 1 in the Appendix of the Paper.
4. The structure of foreign direct equity investments
Looking at aggregate indicators of foreign direct investments, like the stock of FDI in percent of
GDP, Croatia stands out as one of the best performers among new EU member states, which is
somewhat surprising given that Croatia lags behind peer countries when it comes to the overall
macroeconomic performance. Firm-level data used in the analysis below, shows somewhat
different picture of the seemingly favorable performance of the Croatian economy when it comes
to attracting FDI, as it allows for detailed insight into the composition of realized inflows of foreign
investments.
First of all, total inflow of foreign direct investment in Croatia is to a large extent related to equity
investments in the financial sector, which is expected in view of the bank-centric financial system
2 Because of the adjustments made by authors for analytical purposes and other methodological differences, aggregate
data on foreign direct equity investments may differ from official CNB data.

5
and the high share of foreign ownership in the domestic banking sector3
. As indicated in Figure 1
(left), during the period of excessive credit activity before the global financial crisis, there was a
noticeable inflow of direct equity investments associated with banks and insurance companies,
while after the crisis and the collapse of credit activity these inflows almost completely dried up.
Secondly, there are also significant foreign investments that have been realized by converting the
debt to affiliated companies into equity (debt-to-equity swaps). Such transactions intensified with
the outbreak of the crisis, creating an appearance of higher level of foreign equity investments,
while in fact, these foreign-owned companies came into difficulties and their debt to their parents
was converted into equity as part of their restructuring program. Furthermore, in Croatia there
are so-called round-tripping transactions that increase the level of direct equity investments on
both assets and liabilities side of the FDI account (such investments have been realized in larger
amount by several companies in 2008, 2009, 2010 and 2014).
When these three categories mentioned above are excluded, the remaining foreign direct equity
investments in non-financial companies (excluding debt-to-equity swaps) in Croatia are
significantly smaller than the aggregate numbers. The average value of foreign equity investment
over the 2002-2017 period halves from 3.1% of GDP to 1.5% of GDP. Nevertheless, although
relatively modest, the inflow of investments into non-financial companies was stable throughout
the observed period (ranging from 1 to 2% of GDP), which supports the theoretical assumptions
that foreign direct investments are relatively stable form of capital flows (Loungani and Razin,
2001; Lipsey, 2001; Sula and Willet, 2006). The only exceptions were in 2006 and 2008, when
somewhat larger investments were recorded, almost exclusively reflecting one-off effects
associated with large scale privatizations of two state-owned enterprises in the manufacture of
chemicals and oil industry.
Figure 1. Foreign direct equity investment in Croatia (left) and the structure of foreign direct
equity investments in non-financial companies by activities (right)
Note: The left panel excludes round-tripping transactions, the right panel excludes also debt-to-equity swaps and equity
investments associated with banks and insurance companies.
Sources: Authors' calculation based on FINA and CNB data
3 According to CNB data, the share of foreign-owned banks' assets in total banks assets at end 2018 stood at 90.1%,
similarly as during the whole period observed in this paper (available at https://www.hnb.hr/-/pokazatelji-poslovanja-
kreditnih-institucija).

6
Not only that foreign direct equity investments in non-financial companies are relatively modest,
their structure is also quite unfavorable, as can be seen in the Figure 1 (right). Namely,
investments in non-tradable sectors such as trade, telecommunications and real estate are most
represented. At the same time, the tradable industries are underrepresented, with most foreign
investments realized in the oil industry and the manufacture of chemicals and tobacco, whereas
the total value of foreign equity investments is again dominated by several companies that were
privatized or taken over from the private owner. Apart from these industries, the other
manufacturing industries and accommodation stand out as activities with somewhat greater
export potential. In addition to the prevalence the non-tradable sector, the structure of investments
in terms of technological intensity is also unfavorable. Namely, nearly four-fifths of foreign
investments made in the manufacturing industry (excluding oil, tobacco and chemical industry)
refer to low-tech or medium-low-tech activities4
.
Figure 2 (left) shows foreign direct equity investments into non-financial companies by the mode
of entry of foreign investors into the local market. Any foreign investment is preceded by a decision
on the mode of entry, i.e. whether the investor will start the business from the very beginning by
establishing a new company or by taking over an existing company. In this context, one can
distinguish between5
greenfield investments, which imply the establishment of a new company,
and brownfield investments involving the take-over of an existing company from a private resident
or the privatization of a state-owned company. If the investor decides to establish a new company,
the next decision is whether to do it independently or in the form of a joint venture where the key
difference is that joint venture, along with potential advantages, also carries along certain risks for
the foreign investor due to a lower degree of control. In this connection, it should be noted that
in the context of a positive contribution of foreign investments to the host country, literature
generally gives preference to greenfield investments (for example, Bayar, 2017; Neto et al., 2010;
Luu, 2016). On the other hand, significant brownfield investments are not uncommon in
transition and post-transition countries which went through the process of privatization and
external liberalization of the economy, often pressed by insufficient domestic savings and
macroeconomic imbalances.
4Sectoral division of manufacturing industry according to the degree of technological intensity is made according to
Eurostat classification (investing in research and development / added value);
http://ec.europa.eu/eurostat/statisticsexplained/index.php/Glossary:Hightech_classification_of_manufacturing_indus
tries
5 The division by type of investment shown in Figure 2 (left) is based on the initial status of the company / project and
any later recapitalization of the same company is attributed to the same investment type. In this way, the time dimension
of the investment project is taken into account, which is especially relevant for the newly established companies, as the
realization of greenfield projects can last for several years, whereas foreign investors often pay the minimum founding
capital at the very beginning and later recapitalize the company.

7
Figure 2. Greenfield and brownfield investments into non-financial companies by mode of entry
of foreign investor (left) and structure of investment values by activity (right)
Note: Data excludes round-tripping transactions, debt-to-equity swaps and equity investments associated with banks
and insurance companies. Brownfield project data refers to the number of new acquisitions and privatizations per year,
while data on the number of greenfield projects refer to the number of new companies being established by foreign
investors (whether individually or jointly with other investors) in the observed year. Greenfield projects do not include
real estate projects.
Sources: Authors' calculation based on FINA and CNB data
This is also the case in Croatia, where brownfield investments were significant in years before the
crisis (amounted to around 53% of total foreign equity investments in 2002-2008 period), when
large privatization projects took place. However, after the crisis, the importance of brownfield
investment declined (accounting for around 35% of total foreign equity investments in 2009-2017
period), as there were no significant privatizations. However, the amount of transactions related
to companies that were acquired from domestic private owners increased notably, primarily due
to the later recapitalization of earlier takeovers, while the value of new takeovers started recovering
only in 2012 (Figure 2 left). However, this structure is partly expected, given that acquisitions are
often larger in value than greenfield projects. Looking at the number of new projects6
, greenfield
investments are much more frequent than brownfield projects, although the number of new
projects, both greenfield and brownfield, has been severely reduced since the outbreak of the crisis.
Only after Croatia's accession to the European Union the number of new projects increased
shortly, but soon returned to the level recorded immediately after the EU entry.
Looking at greenfield investments in more detail, in Figure 2 (left) it can be noticed that a joint
venture as a modality of direct investment is highly represented, most of which are actually joint
ventures with local entrepreneurs. There are numerous motives why a foreign investor engages in
a joint business venture with a local entrepreneur, but it is usually for two opposing reasons. First
and foremost, a foreign investor associates with a domestic entrepreneur to share technology,
know-how and resources, and to use local knowledge of business practices and established
distribution channels, which significantly increases the likelihood of positive spillovers from
foreign investments. On the other hand, there are also cases when the reason for the joint venture
is in the high level of administrative and other barriers to doing business (for example, a high level
6 The number of new greenfield projects refers to the number of new companies established in the observed year, with
the real estate business being excluded. Prior to Croatia's joining the European Union, it was difficult for non-residents
to purchase real estate in Croatia, so it was often a practice to set up companies which served only for the acquisition
of the real-estate and kept out of business thereafter.
8
of corruption), whereby joint ventures with local companies reduce the investment risks. The
reasons why in fact foreign investors in Croatia associate with local entrepreneurs are difficult to
establish and are not best explored, with the existing literature mainly dealing with the motives of
local entrepreneurs, not foreign investors (for example, Matić and Ćenan, 2007; Bilas et al. 2012).
However, the biggest differences between greenfield and brownfiled investments in non-financial
companies in Croatia are visible from the structure by activities (Figure 2 right). Most greenfield
investments relate to trade and, to a lesser extent, other business services, real estate and other
manufacturing industries (excluding oil industry and the manufacture of chemicals). By contrast,
the majority of brownfiled investments were realized in the manufacturing industry, which was
greatly affected by the privatizations of oil and pharmaceutical industry, as well as significant
takeovers in other manufacturing industries, while only a small part of the investment relates to
trade. Nevertheless, it is not surprising that takeovers are more frequent in sectors with somewhat
greater entry barriers and greater technological and capital intensity, such as the manufacturing
industry, while the establishment of a new business is certainly more suitable in sectors such as
trade.
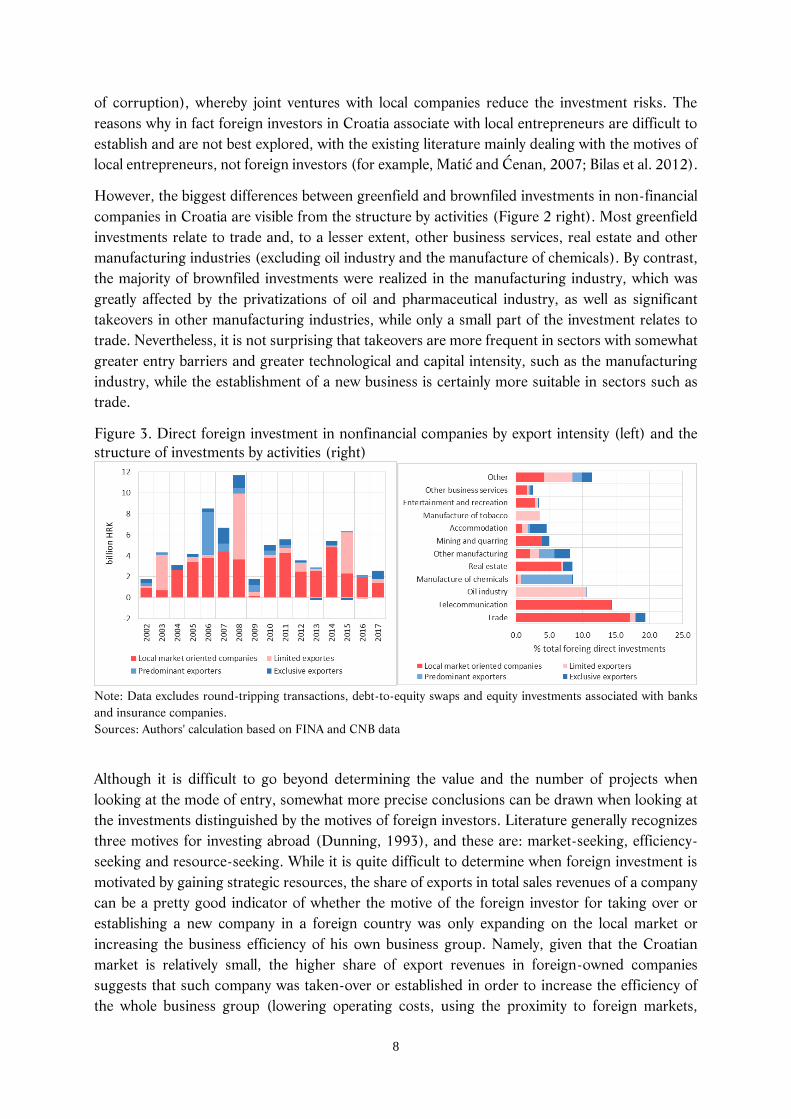
Figure 3. Direct foreign investment in nonfinancial companies by export intensity (left) and the
structure of investments by activities (right)
Note: Data excludes round-tripping transactions, debt-to-equity swaps and equity investments associated with banks
and insurance companies.
Sources: Authors' calculation based on FINA and CNB data
Although it is difficult to go beyond determining the value and the number of projects when
looking at the mode of entry, somewhat more precise conclusions can be drawn when looking at
the investments distinguished by the motives of foreign investors. Literature generally recognizes
three motives for investing abroad (Dunning, 1993), and these are: market-seeking, efficiency-
seeking and resource-seeking. While it is quite difficult to determine when foreign investment is
motivated by gaining strategic resources, the share of exports in total sales revenues of a company
can be a pretty good indicator of whether the motive of the foreign investor for taking over or
establishing a new company in a foreign country was only expanding on the local market or
increasing the business efficiency of his own business group. Namely, given that the Croatian
market is relatively small, the higher share of export revenues in foreign-owned companies
suggests that such company was taken-over or established in order to increase the efficiency of
the whole business group (lowering operating costs, using the proximity to foreign markets,

9
exploiting strategic resources, etc.) while producing goods and services that are mainly not
intended for the local market but to be exported. Thus, according to the share of exports in total
revenues, one can distinguish between: local-market-oriented companies that are mostly not
exporting or are occasional exporters, with the share of sales on foreign markets in total sales
revenues under 20%; limited exporters with this share between 20% and 50%; predominant
exporters with export revenues accounting for between 50% and 75% of total revenues, and
exclusive exporters whose export revenues make up more than 75% of total revenues.
In Figure 3 (left) direct foreign equity investments are divided according to the export intensity
of the company that is the subject of foreign investment. In this context, the export intensity is
used as an indicator of the company's predominant business orientation (local vs. foreign market)
and thus points to the motivation behind each foreign investment project. Throughout the
observed period, foreign direct investments in companies that were oriented towards the local
market are dominant compared to those oriented towards the foreign market. The only exceptions
are the years 2003, 2006, 2008 and 2015 when transactions related to the previously mentioned
privatizations of two major exporting companies (in oil industry and the manufacture of
chemicals) as well as one large takeover of exporting company (in tobacco industry) took place.
Therefore, it can be concluded that extremely low inflow of direct equity investments during the
observed period was related to export-oriented companies, i.e. was motivated by increasing the
efficiency of the investor's group. This points to the lack of competitiveness of the domestic
economy in attracting export-oriented investments. More investments of this type would certainly
contribute to stronger trade integration and greater involvement in global value chains, as well as
strengthening of the overall Croatia's export sector.
Croatia took little advantage of the surge of direct foreign equity investments into Central and
Eastern Europe at the very beginning of the transition process in the 1990s, due to specific
economic and political circumstances as well the legal and economic uncertainty. The analysis
shows that this remained the case also during the later period, especially when it comes to export-
oriented investments. Actually, the lack of export-oriented foreign investments in 2002-2017
period can be explained by a number of reasons, with a few worth mentioning. Compared to other
new EU member states, Croatia was accepted into full EU membership almost a decade later.
During this time other countries used their access to the common market as a comparative
advantage in attracting export-oriented investments. In addition, it is well known that one of the
key motives behind export-oriented investments is to increase the cost efficiency of the group by
reducing the cost of labor, whereby Croatia is not among the countries that based their policy of
attracting foreign investment on cheap labor. Also, other structural obstacles that make doing
business difficult, such as unpredictable tax policy and legal uncertainty, could be at play, as
indicated by Croatia's low ranking in the World Bank's Doing Business and World Economic
Forum's World Competitiveness Report. The low inflow of export-oriented investments could not
be compensated by local-market-oriented investments because of relatively small size and low
purchasing power of the Croatian market, which ultimately explains why the total inflow of foreign
direct equity investments in the observed period was so modest.

10
5. Foreign ownership premium in Croatian non-financial companies
In the text bellow, using a sample of Croatian non-financial companies, the hypothesis of the
foreign ownership premium, i.e. the difference in features and performance between foreign-
owned and domestically owned companies, is econometrically tested. As already described in
Chapter 3, a sample of 35,324 non-financial companies is used, out of which 2,185 are foreign-
owned enterprises. Despite "cleaning" of the data, the sample remained representative and
appropriate for econometric estimation.
The features and performance indicators on which the existence of a foreign ownership premium
is tested are defined in the Appendix (Table 2). They can be grouped into several categories. The
organizational and technological premiums (representing the advantages arising from more
developed management practices and the use of sophisticated knowledge and advanced
technology) are tested using the following indicators: labor productivity, unit labor cost, added
value, capital intensity and R&D intensity. The financial premium, i.e. the superiority in financial
operations is tested using the indicators of indebtedness, the cost of financing of the long-term
debt and financial stability indicator. In addition, the possibility that these advantages resulted in
a premium for the interested parties in the company, primarily owners and employees, is examined
using indicators of profitability and level of wages. Finally, the existence of a country of origin
effect, i.e. the difference in the premium of foreign ownership depending on the country of the
investor, is examined.
Similarly as the empirical literature often estimates the export premium (comparing exporters with
non-exporters), such as in Valdec and Zrnc (2017), here the foreign ownership premium
(comparing foreign-owned and domestically owned companies) is estimated by simple regression
OLS model, such that selected features and performance indicators are regressed on multiple
dummy variables. In the focus of this research is the dummy variable of the company's ownership
status, while other dummy variables are included in the regression model only to control for
differences in other features between companies. Specifically, the foreign ownership premium is
estimated by the following regression model:
(ln)Xi = α + β ∙ ownershipi + γ ∙controli + εi (1)
where i is the index of the company; Xi represents the vector of various features and performance
indicators on which the premium is calculated (see Table 2 in the Appendix); ownership is a
dummy variable of the company's ownership status (1 if the company is foreign-owned, otherwise
0); control is a vector of control dummy variables that relate to other characteristics of the
company (activity at 2 digit-level of the NACE classification, size, region and business
orientation); and ε is the error term. From the estimated β coefficients, the foreign ownership
premium is calculated as 100*(exp(β)-1), showing the average percentage difference between
foreign-owned and domestically owned companies after controlling for other company
characteristics included in the vector of control variables. The model was estimated on the full
sample and sub-samples broken down by size, region, business orientation, mode of entry and the
country of origin of foreign investor. The econometric estimation does not take into account the

11
time dimension of the data, but the indicators and features of each company are expressed as the
average values over the whole observed period (cross-section data)7
.
The results of the econometric analysis presented in Tables 1 to 4 show that foreign-owned non-
financial companies in Croatia undoubtedly have superior features and performance compared to
domestically owned companies, i.e. that there is an obvious foreign ownership premium among
Croatian non-financial companies, which is expected and consistent with most empirical
literature. What is less expected is that this premium varies strongly when looking at different
features and performance indicators (organizational, technological and financial), and depends
on the size of the company, industry field, region, business orientation and the mode of foreign
ownership.
Table 1 clearly shows a strong and significant foreign ownership premium in all features and
performance indicators used in the analysis, but also reveals differences depending on the size and
region of the company. Specifically, the organizational and technological premium of foreign
ownership is higher in small and medium enterprises, according to all indicators except unit labor
costs. Actually, while foreign–owned companies, regardless of their size, are more productive than
their domestically owned peers, there is nevertheless much smaller difference in wages among
large companies, which ensures them more competitive position in terms of unit labour costs. It
is difficult to establish the reasons why the technological and organizational premium is more
significant and stronger for small and medium companies. It is possible that large companies,
regardless of the ownership, have sufficient financial resources and higher quality human capital,
which enables them to improve their business organization and acquire and implement advanced
technology, and by doing so make foreign ownership less important. This is also supported by the
financial premium which is significant only for small and medium companies, suggesting that in
this group of companies, foreign ownership allows for better access to direct foreign financing,
under more favorable conditions. This is evident from the fact that, although they are obviously
more indebted8
, small and medium foreign-owned companies have a significantly lower cost of
financing of long-term debt than peer domestic-owned companies. Although small and medium
foreign-owned companies rely more on debt financing, they are more financially stable9
as they
have more working capital10
than peer companies. This stems from a more favorable maturity
structure of the debt of foreign-owned small and medium companies, as a result of the larger
share of long-term debt to affiliated foreign companies or banks due to likely higher credibility of
foreign owners among banking groups operating in countries of foreign investors, as well as in
Croatia. Namely, most foreign investments in Croatia come from Italy and Austria, and it is likely
that Austrian and Italian banks finance the parent companies, while their subsidiary banks in
Croatia are financing the operations of Croatian branches.
7 All econometric calculations were made in the Stata 15 program and are available upon request.
8 Based on the share of debt and equity in total sources of funding.
9 Looking at the financial stability indicator that relates long-term assets and long-term sources of financing (equity and
long-term liabilities).
10 Working capital refers to the difference between short-term assets and short-term liabilities of a company.

12
Table 1. Foreign ownership premiums, by size and regional affiliation of the company
Note: *, ** and *** refer to significance levels of 10%, 5% and 1%. Below the estimated regression coefficient, foreign
ownership premiums are presented as the percentage difference between foreign and domestic companies, calculated
as 100 (exp (ß) -1).
Source: Authors' calculations based on FINA and CNB data
Such a significant foreign ownership premium in the financing of small and medium companies
and the absence of the same premium in large companies is not surprising. Namely, the financial
market in Croatia is still quite underdeveloped and there is almost no significant alternative to
bank financing. This particularly affects small and medium companies that have limited access to
bank financing as they usually lack sufficient collateral to meet banks' credit requirements (Ljubaj
and Martinis, 2017). In the segment of small and medium companies, foreign-owned ones are
often in a position to ensure significant financial resources from parent companies, enabling them
to alleviate financial limitations. In addition to the financial premium, for small and medium
foreign-owned companies a substantial premium for employees in the form of higher wages is
confirmed, but not for owners in the form of higher profitability. Namely, foreign-owned
companies have higher wages than comparable domestic-owned companies, and the reasons are
multiple. As Gelübcke (2012) suggests, it is possible that foreign-owned companies are seeking
to retain their employees with higher wages, thereby preserving their competitive advantage, but
there is also a possibility that foreign companies are less familiar with domestic labor market
conditions which weakens their position in the wage negotiation process. It is also not excluded
that there is a positive selection by the investors, whereby only the best companies with a better
and more expensive workforce are the subject of foreign investment. However, the Croatian case
may be more related to the fact that foreign-owned companies are more capital and technology
intensive than their peer companies, as confirmed by the estimated premiums in Table 1, and this
requires more trained, educated and thus more expensive workforce.
Looking at the econometric results for individual regions11
, Table 1 shows that the foreign
ownership premium is widespread but largest in Zagreb where the business environment is most
11 The regions are used solely for statistical and analytical purposes and in no way represent a proposal for territorial
setup of the country.
Sample
Productivity
Unit la
bor
cost
Added valu
e
Capital
intensity
R&
D intensity
Indebtedness
Cost of lo
ng-
term
debt
Financial
stability
Wages
Profitability
All non-financial companies 0.63*** -0.14*** 0.60*** 0.58*** 0.42*** 0.30*** -0.19*** -0.14*** 0.49*** 0.12**
87.8 -9.5 82.2 78.6 52.2 35.0 -9.5 -9.5 63.2 12.7
Size:
Small and medium-sized companies 0.65*** -0.11*** 0.61*** 0.70*** 0.41*** 0.33*** -0.17*** -0.10*** 0.53*** 0.06
91.6 -9.5 84.0 101.4 50.7 39.1 -9.5 -9.5 69.9 6.2
Large companies 0.51*** -0.28*** 0.51*** 0.46** 0.35 -0.05 0.1 0.02 0.23*** 0.25
66.5 -18.1 66.5 58.4 41.9 0.0 10.5 2.0 25.9 28.4
Region:
Zagreb region 0.79*** -0.13*** 0.73*** 0.35*** 0.47*** 0.17*** -0.01 -0.27*** 0.60*** 0.09
120.3 -9.5 107.5 41.9 60.0 18.5 0.0 -18.1 82.2 9.4
Northern Croatia region 0.62*** -0.22*** 0.60*** 0.75*** 0.34 0.23** -0.17 -0.03 0.35*** -0.01
85.9 -18.1 82.2 111.7 40.5 25.9 -9.5 0.0 41.9 0.0
Coastal region 0.37*** -0.14*** 0.38*** 0.98*** 0.38*** 0.58*** -0.56*** 0.04 0.33*** 0.18*
44.8 -9.5 46.2 166.4 46.2 78.6 -39.3 4.1 39.1 19.7
Continental region 0.47*** -0.05 0.36*** 0.44** 0.19 0.13 0.1 -0.06 0.33*** -0.02
60.0 0.0 43.3 55.3 20.9 13.9 10.5 0.0 39.1 0.0

13
competitive. Organizational and technological premiums of foreign ownership are present in all
parts of the country, especially in terms of higher labor productivity, value added per employee
and capital intensity, while noticeable differences between regions exist only when looking at R&D
intensity. The latter is present only among companies operating in Zagreb and in the coastal
region, which is expected as companies with significant research and development activities are
concentrated in large cities.
Table 2 presents the foreign ownership premiums in different economic activities, with five of the
most important activities being singled out: manufacturing, trade, tourism (mainly hotels and
other accommodation), information technology and various professional services. Furthermore,
in order to take into account its heterogeneity, the manufacturing industry is divided by
technological intensity into low-tech and high-tech industries12
.
Table 2. Foreign ownership premiums, by business activity
Note: *, ** and *** refer to significance levels of 10%, 5% and 1%. Below the estimated regression coefficient, foreign
ownership premiums are presented as the percentage difference between foreign and domestic companies, calculated
as 100 (exp (ß) -1).
Source: Authors' calculations based on FINA and CNB data
12 According to the above-mentioned Eurostat methodology. See footnote 3.
Sample
Productivity
Unit la
bor
cost
Added valu
e
Capital
intensity
R&
D intensity
Indebtedness
Cost of lo
ng-
term
debt
Financial
stability
Wages
Profitability
All non-financial companies 0.63*** -0.14*** 0.60*** 0.58*** 0.42*** 0.30*** -0.19*** -0.14*** 0.49*** 0.12**
87.8 -9.5 82.2 78.6 52.2 35.0 -9.5 -9.5 63.2 12.7
NACE activity:
Manufacturing industry 0.51*** -0.10*** 0.40*** 0.61*** 0.54*** 0.09 -0.33*** -0.05 0.31*** 0.07
66.5 -9.5 49.2 84.0 71.6 9.4 -25.9 0.0 36.3 7.3
High-tech manufacturing 0.58*** -0.08 0.43*** 0.39* 0.62** -0.06 -0.38* -0.12 0.35*** -0.21
78.6 0.0 53.7 47.7 85.9 0.0 -25.9 -9.5 41.9 -18.1
Manufacture of machinery and equipment 0.59*** 0.05 0.36** 0.2 -0.13 -0.13 -0.14 -0.27 0.41*** -0.07
80.4 5.1 43.3 22.1 -9.5 -9.5 -9.5 -18.1 50.7 0.0
Manufacture of electrical equipment 0.61*** -0.15 0.48*** 0.19 0.87* -0.09 -0.41 -0.26 0.33*** -0.15
84.0 -9.5 61.6 20.9 138.7 0.0 -33.0 -18.1 39.1 -9.5
Manufacture of chemicals 0.52* -0.1 0.42* 0.27 0.69 0.17 -0.1 0.0 0.27** -0.3
68.2 -9.5 52.2 31.0 99.4 18.5 -9.5 0.0 31.0 -25.9
Low-tech manufacturing 0.47*** -0.11** 0.39*** 0.70*** 0.47** 0.16* -0.30** -0.02 0.29*** 0.25*
60.0 -9.5 47.7 101.4 60.0 17.4 -25.9 0.0 33.6 28.4
Manufacture of textiles 0.73*** -0.35*** 0.50*** 0.91*** 0.4 -0.25 -0.48* 0.04 0.21*** 0.76**
107.5 -25.9 64.9 148.4 49.2 -18.1 -33.0 4.1 23.4 113.8
Manufacture of wood and wood products 0.25 -0.1 0.29 0.56* 0.16 0.2 -0.89* -0.1 0.21* 0.03
28.4 -9.5 33.6 75.1 17.4 22.1 -55.1 -9.5 23.4 3.0
Manfacture of non-metallic products 0.99*** -0.41*** 0.97*** 1.03*** 1.47** -0.13 0.22 -0.36* 0.58*** 0.59*
169.1 -33.0 163.8 180.1 334.9 -9.5 24.6 -25.9 78.6 80.4
Manufacture of basic metals 0.34*** 0.13* 0.16 0.76** 0.62* 0.37** -0.50* 0.1 0.31*** 0.09
40.5 13.9 17.4 113.8 85.9 44.8 -39.3 10.5 36.3 9.4
Trade 0.69*** -0.14*** 0.72*** 0.27*** 0.48*** 0.11** 0.02 -0.26*** 0.60*** 0.17*
99.4 -9.5 105.4 31.0 61.6 11.6 2.0 -18.1 82.2 18.5
Accommodation 0.03 0.21 -0.43 0.79 0.24 0.62 0.14 0.06 0.36*** -0.34
3.0 23.4 -33.0 120.3 27.1 85.9 15.0 6.2 43.3 -25.9
Information technology 0.35*** -0.03 0.44*** 0.17 0.75** 0.38*** -0.18 0.06 0.37*** -0.25
41.9 0.0 55.3 18.5 111.7 46.2 -9.5 6.2 44.8 -18.1
Professional services 0.62*** -0.16*** 0.62*** 0.29* 0.50** 0.40*** -0.1 -0.24** 0.47*** 0.01
85.9 -9.5 85.9 33.6 64.9 49.2 -9.5 -18.1 60.0 1.0

14
The results shown in Table 2 show that there are organizational and technological premiums of
foreign ownership in all economic fields except tourism. The absence of foreign ownership
premium in tourism can be explained by the fact that the Croatian hotel industry is dominated by
domestic hotel chains, which are highly competitive and capitalized, and are considered as market
leaders in the sector. Since domestic tourism companies have a long tradition dating back to the
times before the economic transition and have no problems with access to quality financing, it is
not surprising that foreign ownership makes little significance in tourism. When it comes to other
activities, there is a significant foreign ownership premium in terms of higher productivity, value
added, and R&D intensity. The results are somewhat different in terms of unit labor costs, which
is only significant in trade, services and low-tech manufacturing industries. The absence of this
premium in the high-tech manufacturing industry and information technology, as well as in
tourism, can be attributed to the fact that these are mostly export-oriented industries in which
domestic companies are also exposed to international competition, pushing them to be more
efficient. As far as the financial premium is concerned, the lower cost of long-term debt is most
pronounced in the manufacturing industry, while the financial stability premium is most evident
in trade and professional services. It is again shown that the premiums in the form of higher wages
are widespread across industries, while the premium of profitability is present only in the low-tech
manufacturing industry and trade.
Looking at the manufacturing industry in more detail, Table 2 reveals significant differences in
the foreign ownership premium in specific industries. In general, the benefits of foreign ownership
are more widespread in low-tech industries than in the high-tech sector, confirming that the
positive effects of foreign ownership are not only transmitted through the transfer of advanced
technology that plays a key role in technologically highly intensive industries but also through
other channels (management skills and better financing). In the high-tech sector, the biggest
premium is in the manufacture of machinery and equipment and the manufacture of electrical
equipment, notably looking at the indicators of labor productivity, value added value, R&D
intensity and the level of wages. At the same time, in the pharmaceutical industry, the premium of
foreign ownership is less pronounced. On the other hand, in the low-tech sector, the premium is
visible on a much larger number of indicators, especially in the manufacture of textiles, non-
metallic products and basic metals, while the differences between foreign and domestic-owned
companies are not visible only in the manufacture of wood and wood products. Among different
indicators, it can be pointed out that, unlike in the high technology sector, in low-tech industries,
especially in manufacture of textiles and non-metallic products, foreign ownership brings
premium in the form of lower unit labor costs, greater productivity, higher value added and higher
profitability. Such strong and large differences can be partly explained by the greater capital
intensity of foreign-owned companies, which may lead to the conclusion that their business is
significantly more automated, even in traditionally labor-intensive industries.
Below are described the foreign ownership premiums according to the mode of entry of foreign
investors. The results in Table 3 show that organizational and technological premium of foreign
ownership is present in both greenfield and brownfield projects, with the difference being that the
R&D intensity premium has proved to be positively significant only in greenfield projects. This is

15
not surprising as it is hard to expect that Croatian companies are subject to takeovers with the
intent of gaining technological know-how (technology-seeking FDI). Furthermore, there are
significant differences when it comes to financial premium and the premium of profitability. It has
been shown that a strong and significant premium of lower cost of long-term debt and higher
working capital is only present in greenfield projects, and only those that are wholly foreign-
owned, while these effects do not exist in joint venture companies. These findings can be explained
by the different structure of liabilities of wholly foreign-owned companies, as they have a
significantly lower share of long-term debt to banks and a significantly higher share of debt to
foreign-affiliated creditors. The foreign-affiliated debt is cheaper than regular bank financing as
indicated by a strong and significant premium in terms of lower cost of financing of long-term
debt. This represents a significant competitive advantage for foreign-owned companies, especially
in the Croatian case, where direct access to external financing is limited, particularly for small and
medium companies.
Table 3. Foreign ownership premiums, by the mode of entry and business orientation
Note: *, ** and *** refer to significance levels of 10%, 5% and 1%. Below the estimated regression coefficient, foreign
ownership premiums are presented as the percentage difference between foreign and domestic companies, calculated
as 100 (exp (ß) -1).
Source: Authors' calculations based on FINA and CNB data
On the other hand, the profitability premium is only present in brownfield investments and, to a
lesser extent, in joint venture investments, which is rather unexpected given that the
organizational, technological and financial premium of foreign ownership is largest in the case of
independently-established companies. So the absence of profitability premium is surprising. The
explanation may be that a high degree of control of foreign owners in independently-established
companies allows and facilitates the transfer of profits to a more favorable tax jurisdiction through
transfer prices, as indicated by some other similar research (Gelübcke, 2012). This is also
supported by the fact that around one hundred investors in the sample of foreign-owned
companies (out of more than two thousand) are registered in countries that are considered as tax
Sample
Productivity
Unit la
bor cost
Added valu
e
Capital intensity
R&
D intensity
Indebtedness
Cost of lo
ng-
term
debt
Financial stability
Wages
Profitability
All non-financial companies 0.63*** -0.14*** 0.60*** 0.58*** 0.42*** 0.30*** -0.19*** -0.14*** 0.49*** 0.12**
87.8 -9.5 82.2 78.6 52.2 35.0 -9.5 -9.5 63.2 12.7
Mode of entry:
Greenfield investments 0.61*** -0.15*** 0.59*** 0.39*** 0.49*** 0.23*** -0.25*** -0.18*** 0.49*** 0.08
84.0 -9.5 80.4 47.7 63.2 25.9 -18.1 -9.5 63.2 8.3
Wholly owned companies 0.61*** -0.14*** 0.60*** 0.23*** 0.46*** 0.20*** -0.33*** -0.24*** 0.51*** 0.03
84.0 -9.5 82.2 25.9 58.4 22.1 -25.9 -18.1 66.5 3.0
Joint venture companies 0.54*** -0.15*** 0.50*** 0.71*** 0.47*** 0.26*** -0.06 -0.02 0.37*** 0.18*
71.6 -9.5 64.9 103.4 60.0 29.7 0.0 0.0 44.8 19.7
Brownfield investments 0.54*** -0.08** 0.48*** 0.98*** 0.13 0.43*** 0.01 -0.01 0.41*** 0.21**
71.6 0.0 61.6 166.4 13.9 53.7 1.0 0.0 50.7 23.4
Business orientation:
Domestic market oriented companies 0.69*** -0.20*** 0.66*** 0.67*** 0.39*** 0.43*** -0.13* -0.14*** 0.51*** 0.19***
99.4 -18.1 93.5 95.4 47.7 53.7 -9.5 -9.5 66.5 20.9
Partly foreign market oriented companies 0.69*** -0.11* 0.63*** 0.33** 0.40* 0.11 0.13 -0.29*** 0.52*** -0.14
99.4 -9.5 87.8 39.1 49.2 11.6 13.9 -18.1 68.2 -9.5
0.46*** -0.01 0.41*** 0.54*** 0.39** 0.08 -0.46*** -0.05 0.42*** 0.0
58.4 0.0 50.7 71.6 47.7 8.3 -33.0 0.0 52.2 0.0
Predominantly and exclusively foreign market
oriented companies

16
havens. In addition, the lack of profitability premium in greenfield companies can partly be
explained by the very nature of the project. Namely, as is apparent from the analysis in Chapter 4,
the majority of foreign investment in Croatia is oriented towards the local market, so it is expected
that such greenfield investments take longer period of market positioning before they become
profitable. On the other hand, the rationale behind brownfield investment is acquiring a company
that is already profitable or needs shorter restructuring to achieve a satisfactory level of
profitability.
An additional, very important aspect of foreign ownership that can make different premiums is
the motive of entering the local market, i.e. the degree of orientation towards local vs. foreign
market. Expectedly, the size of the foreign ownership premium decreases with higher export
orientation, i.e. the internationalization of business, primarily in unit labor costs, given that with
increased export intensity the exposure to international competition also grows, which compels
both foreign and domestic-owned exporters to increase business efficiency. However, the results
show that the foreign ownership premium does not entirely fade in the export sector, which is
understandable since foreign owners have better knowledge and access to foreign market.
Table 4 shows the foreign ownership premium depending on the country of origin of foreign
investor13
, indicating large differences in the significance and size of the premiums in different
groups of countries. However, these finding should be taken with caution, as it is possible that the
country from which the investment originates is only the administrative headquarters of the
company for tax and other purposes, while the place of actual business is somewhere else. The
premiums are the highest in companies whose owners come from old EU member states (and
Switzerland and Norway), while the premiums slightly drop in companies owned by investors
from new EU member states. What is particularly worth mentioning is that the financial premium
fades in companies whose investors originate from the new member states, which is not surprising
given that these countries do not have a significantly more developed financial market and thus
better financing opportunities for parent companies that could translate to their related companies
in Croatia. Also, the profitability premium is only present in companies owned by investors from
old EU member states (and Norway and Switzerland). Furthermore, the technological and
organizational premium is smaller and in certain cases completely non-existant for companies
whose owners originate from non-EU European countries, which are on average less developed
than Croatia. Also, in their case the R&D premium is non-existant, since it is difficult to expect
that foreign investors from these countries would build their competitive advantage in this way.
Among other countries, the United States stand out by the volume of investments and also by
positive organizational and technological premiums in terms of higher capital intensity,
productivity and value added.
13 In nearly 61.0% cases of all foreign investment projects, the foreign investor came from the old EU Member States,
Norway and Switzerland. Investors from the new member states account for around 20.0% of all projects, and the
investors from non-EU European countries account for around 9.0%. Investors from the United States account for less
than 4.0% of the total number of foreign investment projects observed.

17
Table 4. Foreign ownership premium by investor country
Note: *, ** and *** refer to significance levels of 10%, 5% and 1%. Below the estimated regression coefficient, foreign
ownership premiums are presented as the percentage difference between foreign and domestic companies, calculated
as 100 (exp (ß) -1).
Source: Authors' calculations based on FINA and CNB data
6. Conclusion
The conducted research has resulted in some new and very important findings that enable a better
understanding of the factors driving foreign investment in Croatia as well as the microeconomic
aspect of foreign ownership in Croatian non-financial companies. Namely, the analysis based on
the new set of data compiled for the purpose of this research has shown that most of the equity
investments in Croatia between 2002 and 2017 were motivated by the expansion on the local
market (market-seeking FDI), while investments aimed at increasing efficiency of the investors'
business group (efficiency-seeking FDI) were far less significant. This points to the lack of
competitiveness of the domestic economy in attracting export-oriented investments, which
combined with the limited potential of a relatively small local market to attract significant local-
market-oriented investments, largely explains the modest inflow of total foreign direct equity
investments into non-financial companies in Croatia. Furthermore, the analysis has shown that
greenfield investments prevailed compared to brownfield, which is positive, but their structure is
unfavorable, as they have mainly been realized in non-tradable sectors and low-tech industries.
Speaking about the microeconomic aspects of this research, the results of econometric analysis
have confirmed that foreign-owned non-financial companies undoubtedly have superior
characteristics and performance vis-à-vis domestically-owned companies, meaning that there is
an apparent foreign ownership premium at the level of total population. However, the premium is
not equally distributed in all aspects of business operations (organizational, technological and
financial operations), whereby its magnitude depends on the size of the company, its activity and
regional affiliation, its predominant business orientation, the mode of entry of foreign owner, as
well as the origin of the foreign investor.
The organizational and technological premium of foreign ownership is the largest in case of small
and medium companies, while it is noticeably smaller in large companies. In addition, the financial
Sample
Productivity
Unit la
bor cost
Added valu
e
Capital intensity
R&
D intensity
Indebtedness
Cost of lo
ng-
term
debt
Financial
stability
Wages
Profitability
All non-financial companies 0,63*** -0,14*** 0,60*** 0,58*** 0,42*** 0,30*** -0,19*** -0,14*** 0,49*** 0,12**
87.8 -9.5 82.2 78.6 52.2 35.0 -9.5 -9.5 63.2 12.7
Country of foreign investor:
0,68*** -0,12*** 0,65*** 0,74*** 0,41*** 0,24*** -0,16** -0,14*** 0,58*** 0,13**
97.4 -9.5 91.6 109.6 50.7 27.1 -9.5 -9.5 78.6 13.9
New EU member states 0,63*** -0,15*** 0,55*** 0,48*** 0,43*** 0,23*** 0.08 -0.05 0,40*** -0.11
87.8 -9.5 73.3 61.6 53.7 25.9 8.3 0.0 49.2 -9.5
Rest of Europe 0,41*** -0,15** 0,34*** 0,57*** 0.16 0,31*** -0.09 0.09 0,24*** 0.02
50.7 -9.5 40.5 76.8 17.4 36.3 0.0 9.4 27.1 2.0
United States of America 0,46*** 0.0 0,50*** 0,92*** 0,55* 0,52*** -0.3 0.1 0,49*** -0.3
58.4 0.0 64.9 150.9 73.3 68.2 -18.1 15.0 63.2 -18.1
Old EU member states, Norway and
Switzarland

18
premium of foreign ownership is non-existent in large companies. This is understandable since
large companies have greater market power, longer traditions, easier access to finance, and
accumulated knowledge and technology, so foreign ownership does not necessarily make a
significant difference in their business performance. Furthermore, apparent differences in the
foreign ownership premium were found depending on the business orientation of the company
(local market vs. export-orientation). As expected, the difference between foreign-owned and
domestically owned companies decreases with export orientation, i.e. internationalization of
business operations, because the exposure to international competition compels both foreign and
domestic-owned companies to increase their business efficiency. Nevertheless, the foreign
ownership premium still does exist in the export sector, which is understandable since foreign
ownership ensures better access to foreign markets and greater participation in global value
chains.
Also, the foreign ownership premium is confirmed in most NACE activities, except in tourism,
which can be explained by the fact that domestic tourism companies have a long tradition of
business dating back to the times before economic transition and that they do not have problems
accessing quality financing, so the foreign ownership should not bring significant benefits. As far
as other activities are concerned, it is particularly worth mentioning the manufacturing industry,
where the foreign ownership premium is widespread among high and low-tech industries,
suggesting that benefits of foreign ownership are transmitted not only through the transfer of high
technology but also through positive management practices and access to finance.
Looking from the mode-of-entry perspective, foreign ownership premiums are present in both
greenfield and brownfield projects, whereas the premium of profitability exists only in brownfield
investments. This can be attributed to the fact that greenfield investments usually imply a longer
period of market positioning before they become profitable. In addition, the foreign ownership
premium differs depending on the country of origin of the foreign investor. It is the biggest when
investors come from more developed countries (old EU members). Only in that case, the
profitability premium of foreign ownership is present along with higher technological and
organizational premiums. In addition, it can be pointed out that the financial premium completely
vanishes in companies whose investors originate from the new EU member states, which is not
surprising given that these countries do not have more developed financial market and thus better
financing opportunities for the parent companies.

19
Literature
Aydin, N., Sayim. M. and Yalama, A. (2007): "Foreign Ownership and Firm Performance:
Evidence from Turkey," International Research Journal of Finance and Economics, No 11, 103-
110.
Azzam, I., Fouad, J. and Ghosh, D.K. (2013): "Foreign Ownership and Financial Performance:
Evidence from Egypt", International Journal of Business, 18(3), 2013.
Barbosa, N. and Louri, H. (2005): "Corporate Performance: Does Ownership Matter?
Comparison of Foreign and Domestic owned Firms in Greece and Portugal," Review of Industrial
Organization, 27, 73-102.
Bayar, Y. (2017): "Greenfield and Brownfield Investments and Economic Growth: Evidence from
Central and Eastern European Union Countries", Naše Gospodarstvo/Our Economy, Vol. 63,
No.3
Bentivogli, C. and Mirenda, L. (2016): "Foreign ownership and performance: evidence from a
panel of Italian firms," Temi di discussione (Economic working papers) 1085, Bank of Italy,
Economic Research and International Relations Area.
Bilas, V., Ćenan, D., and Kedačić, A. (2012): "Međunarodna zajednička ulaganja u Republici
Hrvatskoj", Ekonomski Vjesnik, Vol. 25, No. 1.
Bobenic Hintošova, A. and Kubikova, Z. (2016): "The effect of the degree of foreign ownership
on firms' performance", Review of Economic Perspectives, v. 16, iss. 1, pp. 29-43.
Caves, R. E. (2007): "Multinational enterprise and economic analysis", 3rd edition, Cambridge
University Press.
Conyon, M.J., Girma, S., Thompson, S. and Wright, P.W. (2002): "The productivity and wage
effects of foreign acquisition in the United Kingdom," Journal of Industrial Economics, 50(1),
85-102.
Derado, D. (2013): "Determinants of FDI in transition countries and estimation of the potential
level of Croatian FDI", Financial theory and practice, 37 (3), 227-258.
Derado, D., Škudar, A. and Rakušić, S. (2011): "Regional aspects of FDI in Croatia", Ninth
International Conference on Challenges of Europe: Growth and Competitiveness – Reversing the
Trends, University of Split, Faculty of Economics, Split – Bol, 26-28 May 2011.
Doms, M. and Jensen, J.B. (1995): "Comparing Wages, Skills, and Productivity between
Domestically and Foreign-Owned Manufacturing Establishments in the United States," in Robert
E. Baldwin, Robert E. Lipsey, and J. David Richardson (eds.). Geography and Ownership as Bases
for Economic Accounting, Chicago, IL: University of Chicago Press.
Dunning, J. (1993): Multinational Enterprises and the Global Economy, Addison-Wesfey,
Harlow.

20
Gelübcke, J. P. W. (2013): "The performance of foreign affiliates in German manufacturing:
Evidence from a new database". Review of World Economics. 149 (1), pp. 151- 182.
Goethals, J. and Ooghe, H. (1997): "The Performance of Foreign and National Take- Overs in
Belgium," European Business Review, 97(1), 24-37.
Huang, R. D. and Shiu, C. Y. (2009): "Local effects of foreign ownership in an emerging financial
market: Evidence from qualified foreign institutional investors in Taiwan, Financial Management.
38 (3.), pp. 567-602.
Kersan-Škabic, I. and Tijanić, L. (2014): "The Influence of Foreign Direct Investments on
Regional Development in Croatia", Croatian Economic Survey, December 2014, v. 16, iss. 2, pp.
59-90.
Khawar, M. (2003): "Productivity and Foreign Direct Investment: Evidence from Mexico,"
Journal of Economic Studies, 30(1), 66-76.
Konings, J. (2001): "The Effects of Foreign Direct Investment on Domestic Firm," Economics of
Transition, 9(3), 619-633.
Lipsey, R., E. (2001): "Foreign Direct Investors in Three Financial Crises", NBER Working Paper
8084.
Loungani, P. and Razin, A. (2001): "How Beneficial Is Foreign Direct Investment for Developing
Countries?", Finance and Development, IMF. 38.
Luu, H., N. (2016): "Greenfield investments, cross-border M&As, and economic growth in
emerging countries", Economics & Business Letters, Vol. 5, No. 3
Ljubaj, I. and Martinis, A. (2017): "Prekomjerni dug poduzeća u Hrvatskoj: mikroprocjena i
makroimplikacije"; Istraživanja, Hrvatska narodna banka, I-52 (2017.).
Marić, Z. (2008): "Foreign Direct Investment and the Productivity of Croatian Companies in the
Industrial Sector", Privredna Kretanja i Ekonomska Politika, v. 18, iss. 116, pp. 28-51.
Matić, B., and Ćenan, D. (2007): "Analiza motiva za međunarodna zajednička ulaganja u
Republici Hrvatskoj", Zbornik Ekonomskog Fakulteta u Zagrebu 5.
Neto, P., Brandão, A., and Cerqueira, A. (2010): "The Impact of FDI, Cross Border Mergers and
Acquisitions and Greenfield Investments on Economic Growth", IUP Journal of Business
Strategy. Vol. 7, Issue 4.
Sula, O. and Willett, T., D. (2006): "Reversibility of Different Types of Capital Flows to Emerging
Markets", MPRA Paper No. 384.
Škudar, A. (2004): "Pregled i analiza izravnih ulaganja u Republiku Hrvatsku", Pregledi -
Hrvatska narodna banka, P-16 (2004).
Vukšić, G. (2005): "Impact of foreign direct investment on Croatian manufacturing exports",
Financial Theory and Practice, 29(2), pp. 147-175.

21
Appendix
Table 1. Structure of the sample of non-financial companies
All non-financial companies 1,628 4.6% 557 1.6% 2,185 6.2% 33,139 93.8% 35,324
Small and medium-sized companies 1,518 4.4% 430 1.2% 1,948 5.6% 32,624 94.4% 34,572
Large companies 110 14.6% 127 16.9% 237 31.5% 515 68.5% 752
Zagreb Region 948 7.3% 241 1.9% 1,189 9.2% 11,709 90.8% 12,898
Northern Croatia Region 128 2.7% 54 1.2% 182 3.9% 4,473 96.1% 4,655
Coastal Region 420 3.7% 180 1.6% 600 5.2% 10,866 94.8% 11,466
Continental Region 97 2.1% 50 1.1% 147 3.2% 4,396 96.8% 4,543
Domestic market oriented companies 981 3.2% 316 1.0% 1,297 4.3% 28,909 95.7% 30,206
Partly foreign market oriented companies 203 9.5% 91 4.2% 294 13.7% 1,853 86.3% 2,147
Predominantly and exclusively foreign
market oriented companies444 14.9% 150 5.0% 594 20.0% 2,377 80.0% 2,971
Manufacturing industry 334 5.8% 175 3.0% 509 8.8% 5,290 91.2% 5,799
Trade 513 5.8% 97 1.1% 610 6.9% 8,238 93.1% 8,848
Accomodation 9 5.2% 12 6.9% 21 12.1% 152 87.9% 173
Information technology 94 10.5% 55 6.2% 149 16.7% 742 83.3% 891
Professional services 231 5.4% 29 0.7% 260 6.1% 4,013 93.9% 4,273
Other 403 3.1% 132 1.0% 535 4.1% 12,506 95.9% 13,041
Sample
Foreign-owned companiesDomestically owned
companies
Total
Greenfield Brownfield Total

22
Table 2. Definition of the variables used in the model
* (+) is evaluated positive; (-) is estimated negative
Indicator Calculation
Criteria and interpretation of results
(+/-)*
Productivity
revenue from sale of goods and services / number of
employees
increase in value (+) & decrease in
value (-)
ULC wages and other costs of employees / added value
increase in value (-) & decrease in
value (+)
Added value
revenue from sale of goods and services - cost of raw
material - selling costs
increase in value (+) & decrease in
value (-)
Capital intensity non-current assets / number of employees
increase in value (+) & decrease in
value (-)
R&D intensity intangible assets/ total assets
increase in value (+) & decrease in
value (-)
Indebtedness
non-current liabilities / (total liabilities + long term
provisions and other equity)
increase in value (-) & decrease in
value (+)
Cost of long-term debt accrued interest / non-current liabilities
increase in value (-) & decrease in
value (+)
Financial stability non-current assets / (equity + non-current liabilities)
increase in value (-) & decrease in
value (+)
Wages
wages and other costs of employees/ number of
employees
increase in value (+) & decrease in
value (-)
Profitability profit or loss before tax / total revenue
increase in value (+) & decrease in
value (-)

23
Table 3. Sample division criteria
Dummy SampleA
ctiv
ity Manufacturing industry, trade,
accomodation, information
technology and professional services
according to the first and second level of NACE classification
Busin
ess orie
ntatio
n
Local market oriented companies
the share of sales revenue from foreign markets in total sales revenues in the
observed period does not exceed 20%
Limited exporters
the share of sales revenue from foreign markets in total sales revenues in the
observed period ranges from 20% to 50%
Predominant exporters
the share of sales revenue from foreign markets in total sales revenues in the
observed period ranges from 50% to 75%
Exclusive exporters
the share of sales revenue from foreign markets in total sales revenues in the
observed period exceeds 75%
Regio
nal affilia
tio
n
Zagreb Region City of Zagreb and Zagreb County
Northern Croatia Region
Međimurje County, Varaždin County, Krapina-Zagorje County, Bjelovar-
Bilogora County and Koprivnica-Križevci County
Jadran Region
Istra County, Primorje-Gorski Kotar County, Zadar County, Šibenik-Knin
County, Split-Dalmacija County, Dubrovnik-Neretva County
Slavonija Region
Virovitica-Podravina County, Požega-Slavonija County, Brod-Posavina County,
Osijek-Baranja County i Vukovar-Srijem County
DescriptionS
ize
Small and medium-sized companies
average number of employees in the observed period from 10 to 250
Large companies
average number of employees in the observed period larger than 250