the food vs. fuel controversy - home | aede
TRANSCRIPT

The Food vs. Fuel
Controversy
The Food vs. Fuel
Controversy
Ian SheldonIan SheldonAndersons Professor of International Trade
Ohio State University
ITESM, Guadalajara, August 27, 2008
UASLP, San Luis Potosí, September 1, 2008
http://aede.osu.edu/programs/Anderson/trade/
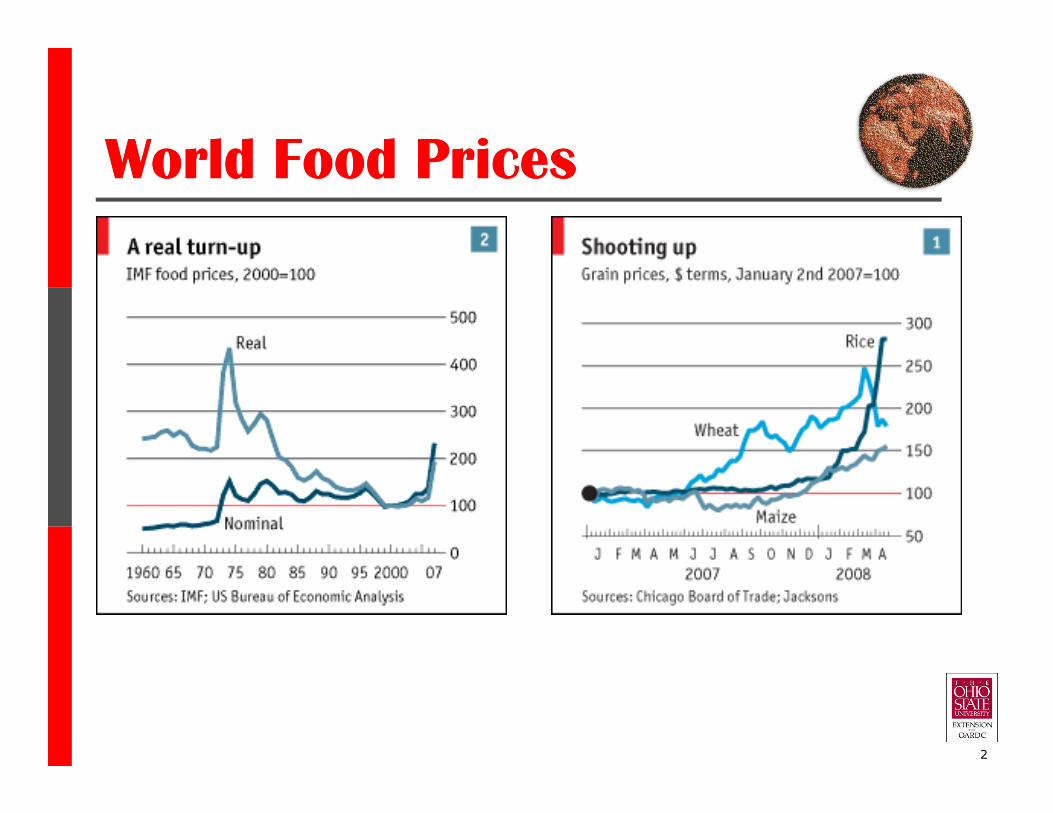
World Food PricesWorld Food Prices
2

World Food PricesWorld Food Prices
3

World Food PricesWorld Food Prices
2002200220022002 to to to to
March 2008March 2008March 2008March 2008 CornCornCornCorn WheatWheatWheatWheat RiceRiceRiceRice SoybeansSoybeansSoybeansSoybeans OilOilOilOil
Nominal $ 143 217 199 171 308
Increases in Food and Oil Prices (%)
4
Nominal $ 143 217 199 171 308
Real $ 46 91 80 63 145
Real Euros 37 79 69 53 130
Source: Farm Foundation, 2008

World Food PricesWorld Food Prices
Food Price Inflation 2007-08
CountryCountryCountryCountry Food Price Food Price Food Price Food Price
InflationInflationInflationInflation
Expenditure Share on Food Expenditure Share on Food Expenditure Share on Food Expenditure Share on Food
US 5.1 10
China 23.3 28
5
Source: OECD and FAO, 2008
India 5.8 33
Egypt 13.5 42
Haiti 11.8 50
Sri Lanka 25.6 62
Bangladesh 14.2 65

World Food Prices World Food Prices
� Food crisis occurring in many countries
simultaneously – political protests in 30
� May reduce purchasing power of urban
6
� May reduce purchasing power of urban
and rural poor by 20%
� 1.5 billion on 1-2$/day – World Bank
estimates food price increases will push
at least another 100 million in poverty

World Food PricesWorld Food Prices
7

Key Drivers of Food Prices Key Drivers of Food Prices
� Complex set of forces combined to push
up prices:
■ Global changes in demand and supply
8
■ Global changes in demand and supply
■ Depreciation of US $
■ Growth in production of biofuels

Demand and Supply Demand and Supply
� Rapid growth in developing countries – shift
from cereals to animal protein
� Slowdown in agricultural productivity growth –
9
� Slowdown in agricultural productivity growth –
change from surplus to shortage, stocks tight
� Weather shocks (Australia) in 2006/07
exacerbated price impact of low stocks
� Export policies have also made situation worse
(Argentina, China, India, Ukraine, Vietnam)
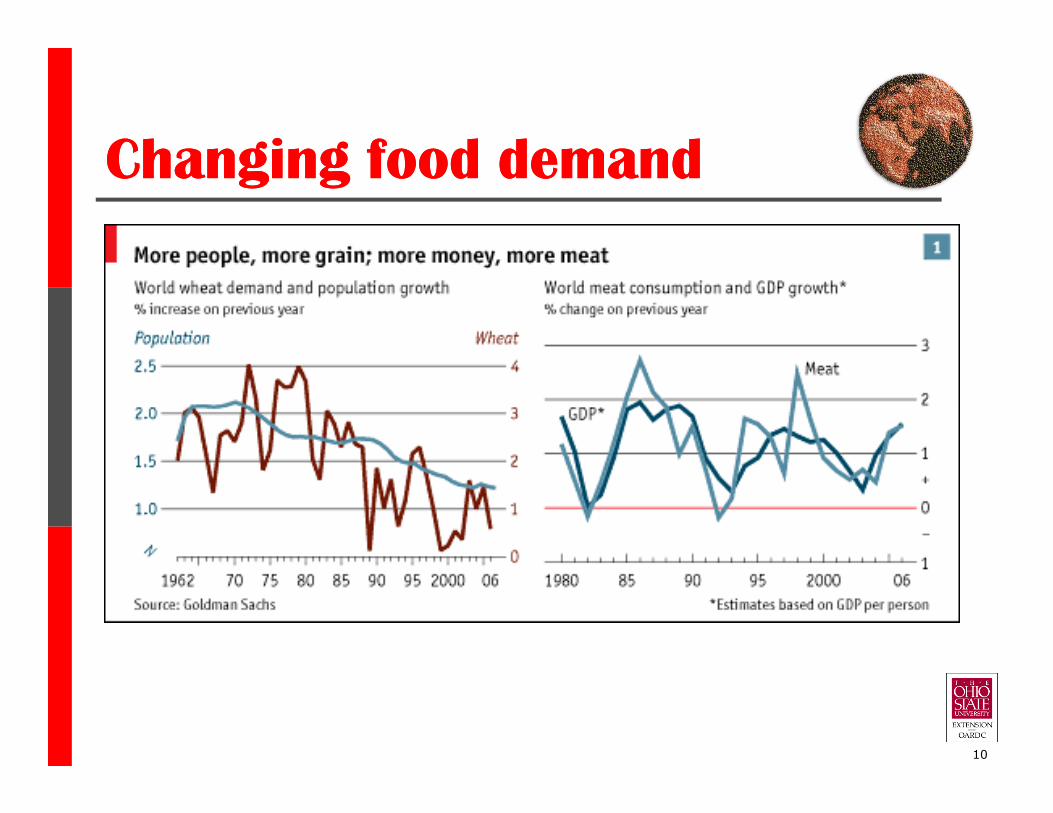
Changing food demandChanging food demand
10

Demand Demand
� In developing countries, real GDP grew on
average by 7.3% over period 2003-07
� High income elasticities for food contributed to
strong demand for meats and grains
11
strong demand for meats and grains
� China and India not impacting world food
prices as much as might be expected:
-both following policies to be self-sufficient
-neither are major traders of most commodities

China: Corn Market China: Corn Market
100,000
120,000
140,000
160,000
(1,000 mt)
12
0
20,000
40,000
60,000
80,000
100,000
19
80
/19
81
19
81
/19
82
19
82
/19
83
19
83
/19
84
19
84
/19
85
19
85
/19
86
19
86
/19
87
19
87
/19
88
19
88
/19
89
19
89
/19
90
19
90
/19
91
19
91
/19
92
19
92
/19
93
19
93
/19
94
19
94
/19
95
19
95
/19
96
19
96
/19
97
19
97
/19
98
19
98
/19
99
19
99
/20
00
20
00
/20
01
20
01
/20
02
20
02
/20
03
20
03
/20
04
20
04
/20
05
20
05
/20
06
20
06
/20
07
20
07
/20
08
Production
Consumption
Imports
Exports
Source: Farm Foundation, 2008

China: Wheat Market China: Wheat Market
(1,000 mt)
80,000
100,000
120,000
140,000
13
0
20,000
40,000
60,000
80,000
19
80
/19
81
19
81
/19
82
19
82
/19
83
19
83
/19
84
19
84
/19
85
19
85
/19
86
19
86
/19
87
19
87
/19
88
19
88
/19
89
19
89
/19
90
19
90
/19
91
19
91
/19
92
19
92
/19
93
19
93
/19
94
19
94
/19
95
19
95
/19
96
19
96
/19
97
19
97
/19
98
19
98
/19
99
19
99
/20
00
20
00
/20
01
20
01
/20
02
20
02
/20
03
20
03
/20
04
20
04
/20
05
20
05
/20
06
20
06
/20
07
20
07
/20
08
20
08
/20
09
Production
Consumption
Imports
Exports
Source: Farm Foundation, 2008

China: All Oils China: All Oils
(1,000 mt)
20,000
25,000
Consuption
Production
Imports
14
0
5,000
10,000
15,000
19
80
/19
81
19
81
/19
82
19
82
/19
83
19
83
/19
84
19
84
/19
85
19
85
/19
86
19
86
/19
87
19
87
/19
88
19
88
/19
89
19
89
/19
90
19
90
/19
91
19
91
/19
92
19
92
/19
93
19
93
/19
94
19
94
/19
95
19
95
/19
96
19
96
/19
97
19
97
/19
98
19
98
/19
99
19
99
/20
00
20
00
/20
01
20
01
/20
02
20
02
/20
03
20
03
/20
04
20
04
/20
05
20
05
/20
06
20
06
/20
07
20
07
/20
08
Imports
Exports
Source: Farm Foundation, 2008

China: Rice China: Rice
(1,000 mt)
100,000
120,000
140,000
160,000
15
0
20,000
40,000
60,000
80,000
100,000
1980/1
981
1981/1
982
1982/1
983
1983/1
984
1984/1
985
1985/1
986
1986/1
987
1987/1
988
1988/1
989
1989/1
990
1990/1
991
1991/1
992
1992/1
993
1993/1
994
1994/1
995
1995/1
996
1996/1
997
1997/1
998
1998/1
999
1999/2
000
2000/2
001
2001/2
002
2002/2
003
2003/2
004
2004/2
005
2005/2
006
2006/2
007
2007/2
008
2008/2
009
Production
Consumption
Imports
Exports
Source: Farm Foundation, 2008

China: Food vs. Non-Food China: Food vs. Non-Food
16

� Investment in agriculturalresearch in developingcountries has fallen since
1980s
� New investment will only
Agricultural productivityAgricultural productivity
� New investment will onlygenerate payoffs throughhigher yields after 5-10
years
� Policies to allow adoptionof existing technologiesmay have a more rapidpayoff
17

Declining StocksDeclining Stocks
30%
35%
Stocks-to-Use Ratio for Total Grains* in World (1960-2009)
*Feed grains + wheat + rice
18
15%
20%
25%
30%
YearSource: Farm Foundation, 2008

Declining StocksDeclining Stocks
19
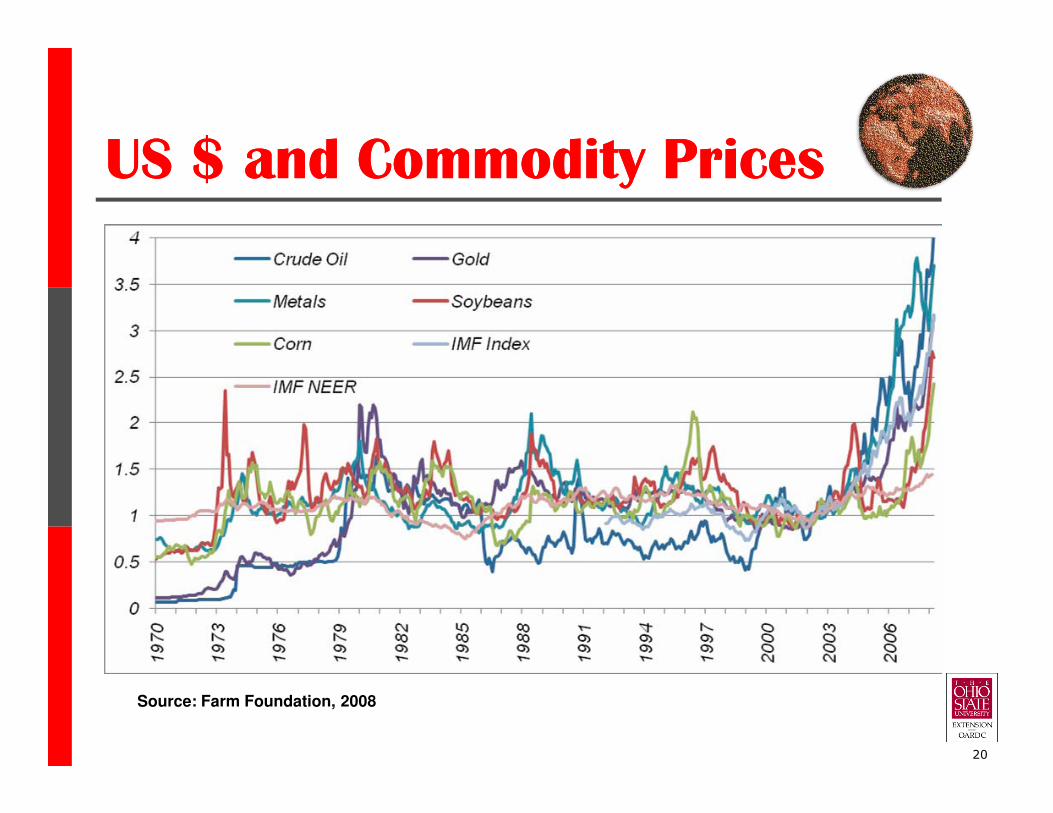
US $ and Commodity PricesUS $ and Commodity Prices
20
Source: Farm Foundation, 2008

� Movements in commodityprices and US $ exchangerate negatively correlated
� Partly accounting – if US $falls, US$ price must rise
US $ and Commodity PricesUS $ and Commodity Prices
falls, US$ price must rise
for overall price to remain
stable in terms of currencybasket
� However, commodity priceshave risen even when
priced in non-US $currencies
21

US $ and Commodity PricesUS $ and Commodity Prices
0
0.5
1
1.5
2
2.5
3
Corn Prices
Nominal $
Real Euros
USDA Ag Index
0
0.5
1
1.5
2
2.5
3
Soybean Prices
Nominal $
Real Euros
USDA Ag Index
22
00
0
0.5
1
1.5
2
2.5
3
3.5
Wheat Prices
Nominal $
Real Euros
USDA Ag Index
0
0.5
1
1.5
2
2.5
3
3.5
Rice Prices
Nominal $
Real Euros
USDA Ag Index

� What is causation – does low US $ drive up commodityprices, or do high commodity prices drive US $ down?
� Some analysts argue high oil prices drive US $ down:
- oil exporters import more from Europe than US,
US $ and Commodity PricesUS $ and Commodity Prices
- oil exporters import more from Europe than US,
and hold less oil revenues in US $
- US Federal Reserve targets core (excludes oil and
food prices) not overall inflation, pushing down US $due to “looser” monetary policy
� However, there are channels through which a fall in
nominal US $ can raise commodity prices in US $
23
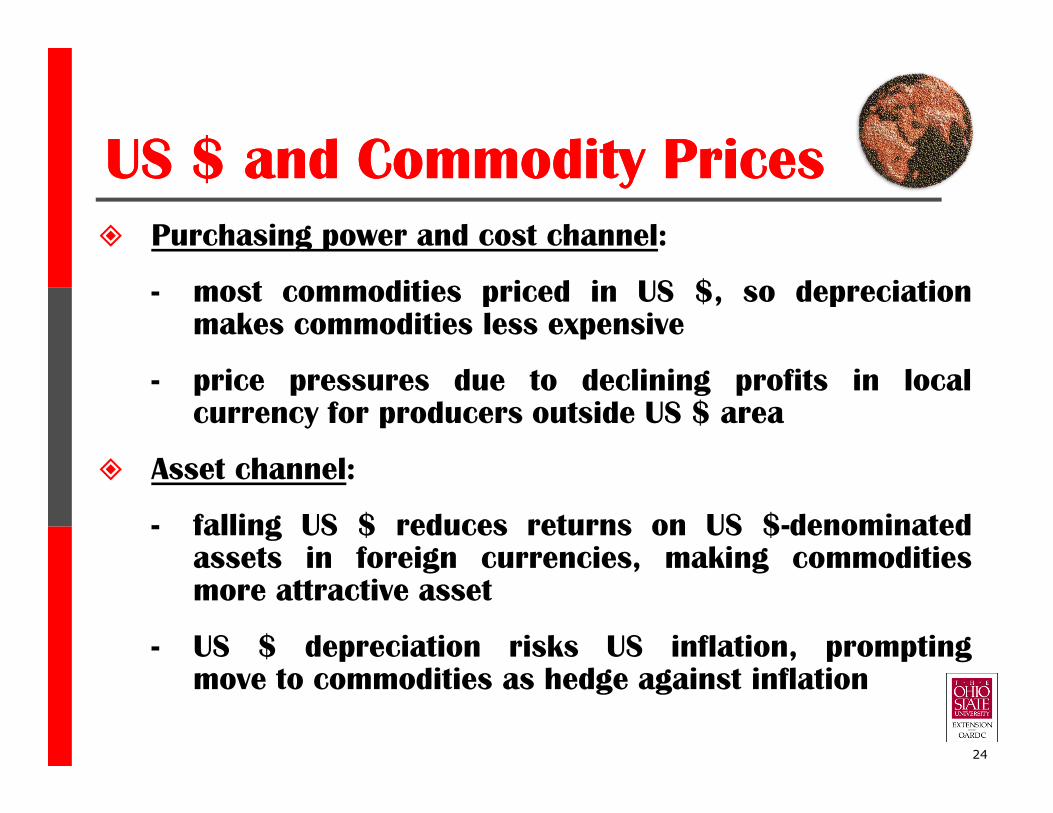
� Purchasing power and cost channel:
- most commodities priced in US $, so depreciationmakes commodities less expensive
- price pressures due to declining profits in local
currency for producers outside US $ area
US $ and Commodity PricesUS $ and Commodity Prices
currency for producers outside US $ area
� Asset channel:
- falling US $ reduces returns on US $-denominated
assets in foreign currencies, making commodities
more attractive asset
- US $ depreciation risks US inflation, promptingmove to commodities as hedge against inflation
24
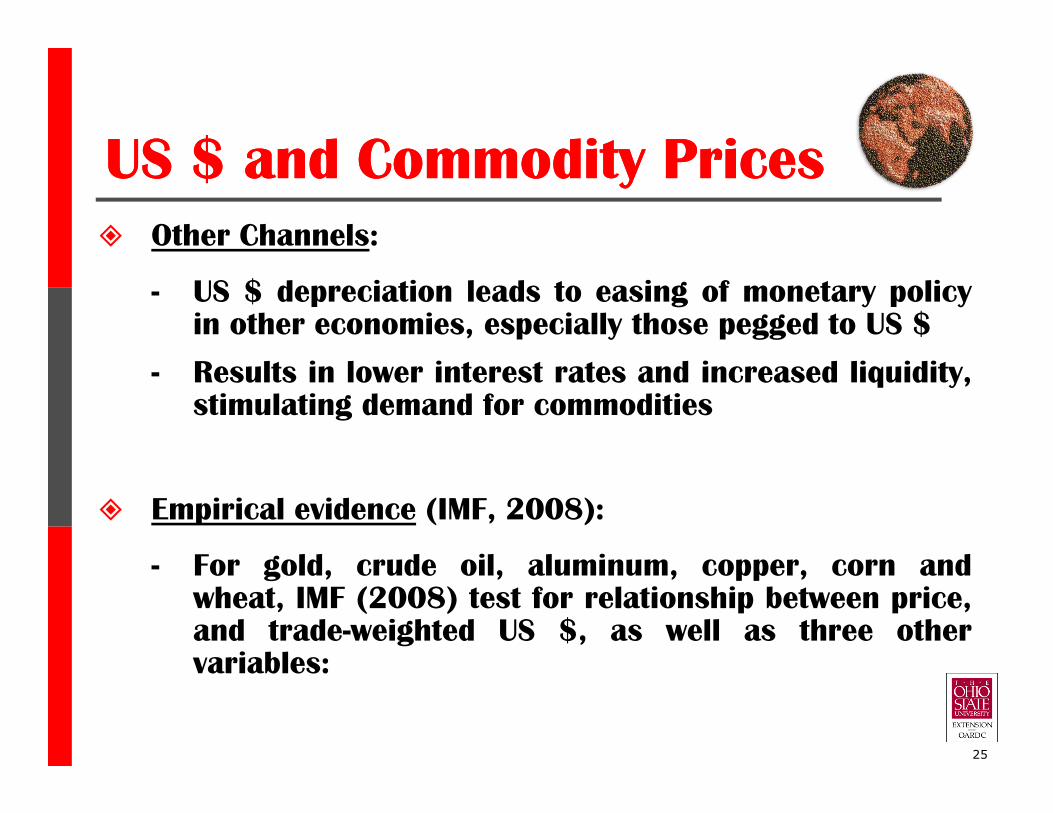
� Other Channels:
- US $ depreciation leads to easing of monetary policyin other economies, especially those pegged to US $
- Results in lower interest rates and increased liquidity,stimulating demand for commodities
US $ and Commodity PricesUS $ and Commodity Prices
stimulating demand for commodities
� Empirical evidence (IMF, 2008):
- For gold, crude oil, aluminum, copper, corn and
wheat, IMF (2008) test for relationship between price,and trade-weighted US $, as well as three other
variables:
25

� (i) World output: increases in output requires commodity
inputs, i.e., should be positively correlated with prices
� (ii) Federal funds rate: lower interest rates may raise
commodity prices through three channels (Frankel,
US $ and Commodity PricesUS $ and Commodity Prices
2006) – (a) lowers incentive for extraction today; (b)
lowers cost of holding inventories; (c) induces shift from
bonds to commodities
� (iii) Market balance: level of stocks can affect commodityprices; i.e., high (low) stocks lower (raise) prices
� Impact of exchange rate varies over commodities –
strongest for gold and oil, weaker for grains
26
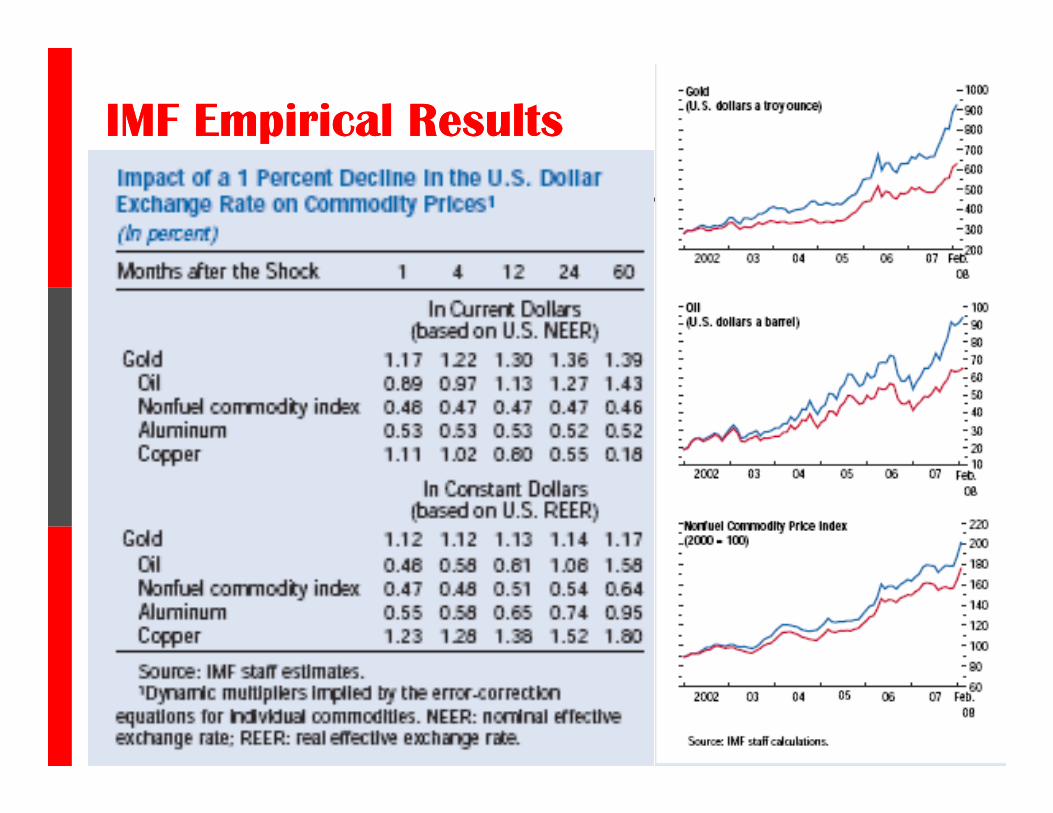
IMF Empirical ResultsIMF Empirical Results
27

Biofuels and Food Prices Biofuels and Food Prices
� Brazil and US leading producers of ethanol
� Recent surge in US ethanol production set in context of
Federal biofuels mandate, ethanol blending subsidy and
import tariff
28
� 2004-07, most of increase in global corn production
(55 million tons) went into US ethanol production (50
million tons)
� Growing demand for ethanol driven by high oil prices,
which then affects corn prices: $2.26/ bushel at
$40/barrel → $6.33/bushel at $120/barrel (Farm
Foundation, 2008)

Biofuels and Food Prices Biofuels and Food Prices
Leading ethanol producing countries, 2004-2005
(mil. gal.
per year)(percent) Country
(mil. gal.
per year)(percent)
Brazil 3,989 37 Brazil 4,227 35.8
United States 3,400 32.8 United States 3,904 33.1
2004 2005Country
29
United States 3,400 32.8 United States 3,904 33.1
China 964 9 China 1,004 8.5
India 462 4.3 India 449 3.8
France 219 2 France 240 2
Russia 198 1.8 Russia 198 1.7
South Africa 110 1 Germany 114 1
United Kingdom 106 1 South Africa 103 0.9
Saudi Arabia 79 0.7 Spain 93 0.8
Spain 79 0.7 United Kingdom 92 0.8
Others 1,029 9.6 Others 1,366 11.6
Total 10,770 100 Total 11,790 100
Source: von Lampe (2006)

Biofuels and Food Prices Biofuels and Food Prices
� Various estimates of impact of biofuels on food prices:
(i) USDA, 2-3%, (ii) IMF, 20-30%, (iii) World Bank, 65%
� Wide range of conclusions reflects different prices
being measured (farm, wholesale, retail) and different
time periods for data analyzed
30
time periods for data analyzed
� World Bank (2008) estimate: 140% increase in food
price index (2002-08): 15% (energy/fertilizer prices),
20% (US$), 105% (biofuels and related effects of
stocks, land-use, speculation, and export controls )
� While cause(s) of increase in food prices is complex,
appears to be a connection between food and fuel

Useful References:Useful References:
� The Economist (2008), “The New Face of Hunger” -
http://www.economist.com/world/international/displaystory.cfm?s
tory_id=11049284
� Farm Foundation (2008), “What’s Driving Food Prices?” -
http://www.farmfoundation.org/news/templates/template.aspx?art
icleid=404&zoneid=26icleid=404&zoneid=26
� International Food Policy Research Institute (2008), “High Food
Prices: The What, Who, and How of Proposed Policy Actions” –
http://www.ifpri.org/pubs/ib/FoodPricesPolicyAction.pdf
� World Bank (2008), “A Note on Rising Food Prices” -
http://image.guardian.co.uk/sys-
files/Environment/documents/2008/07/10/Biofuels.PDF
9/1/2008 OSU Agricultural, Environmental & Development Economics31