the federal democratic republic of ethiopia...
TRANSCRIPT

THE FEDERAL DEMOCRATIC REPUBLIC OFETHIOPIA
CENTRAL STATISTICAL AGENCY
STATISTICAL REPORT ONTHE 2012 URBAN EMPLOYMENT UNEMPLOYMENT
SURVEY
Addis AbabaSeptember 2012
___________________________________________________________
STATISTICAL BULLETIN_________________________________________
Created by PDF Generator (http://www.alientools.com/), to remove this mark, please buy the software.

TABLE OF CONTENTTable of Contents ------------------------------------------------------------------------------------- iList of Statistical Tables ----------------------------------------------------------------------------- iii
Chapter I Background of the Survey------------------------------------------------------- 11.1 Introduction-------------------------------------------------------------------------- 11.2 Objectives of the Survey--------------------------------------------------------- 31.3 Content and Organization of the Survey Questionnaire ---------------- 41.4 Training of Field Staff ------------------------------------------------------------- 51.5 Organization of the Field Work ------------------------------------------------ 61.6 Data Processing ------------------------------------------------------------------- 71.7 Definitions of Terms and Concepts ----------------------------------------- 71.8 Organization of the Report ------------------------------------------------------ 91.9 Abbreviations ---------------------------------------------------------------------- 10
Chapter II Survey Methodology --------------------------------------------------------------- 112.1 Coverage---------------------------------------------------------------------------- 112.2 Sampling Frame ----------------------------------------------------------------- 112.3 Sample Design ------------------------------------------------------------------- 112.4 Sample Size and Selection Scheme --------------------------------------- 12
Chapter III Socio - Demographic Characteristics ofUrban Population ----------------------------------------------------------------- 15
3.1 Introduction ------------------------------------------------------------------------- 153.2 Age- Sex Structure of Urban Population and
Other Socio - Demographic Data-- ------------------------------------------- 15
Chapter IV Economic Activity Status ------------------------------------------------------- 39
4.1 Introduction-------------------------------------------------------------------------- 394.2 Data Collection Approaches of the Economic Activity Status of
Urban Population ------------------------------------------------------------------ 414.2.1 Current Activity Status Approach ------------------------------- 41
4.2.2 Usual Activity Status Approach----------------------------------- 414.3 Current Activity Status ---------------------------------------------------------- 424.4 Economically Active and Non-Active Population and Activity Rate… 43
Chapter V Characteristics of the Currently urban Employed Population---- - 635.1 Introduction.................................................................................... 635.2 Employment to Population Ratio .................................................... 635.3 Occupation and Industry ................................................................ 645.4 Employment Status ...................................................................... 655.5 Number of Hours Worked .............................................................. 655.6 Earning from Paid Employment ..................................................... 675.7 Absence from Work ....................................................................... 685.8 Availability to Work Additional Hours............................................... 685.9 Formal and Informal Employment Sector ........................................ 69
Created by PDF Generator (http://www.alientools.com/), to remove this mark, please buy the software.

ii
Chapter V I Unemployment in Urban Areas............................................ ........ 187
6.1 Introduction ................................................................................... 1876.2 Measurement of Unemployment .................................................... 1886.3 Size and Rate of Urban Unemployment ........................................ 190
Annex I Survey Questionnaire ..................................................................... 229Annex II Estimation Procedures of Total, Ratio and Sampling Errors ........... 235Annex III Estimates and CV's for Selected Tables......................................... 239
References............................................................................................................ 243
Created by PDF Generator (http://www.alientools.com/), to remove this mark, please buy the software.

iii
LIST OF STATISTICAL TABLESPage
Table 3.1 Estimated Total Population of Urban Areas by Age Group, Sex andRegion: 2012 .........................................................................................................................17
Table 3.2 Distribution of Urban Population, Households and Average Household SizeBy Region: 2012 ....................................................................................................................19
Table 3.3 Distribution of Urban Population by Region, Sex and Relationship to theHead of Household: 2012 ....................................................................................................20
Table 3.4 Distribution of Urban Population Aged Ten Years and Above byAge Group, Sex, Literacy Status and EducationalAttainment - COUNTRY TOTAL: 2012 ..............................................................................22
Table 3.5 Distribution of Urban Population Aged Ten Years andAbove by Region, Sex, Training Status and Types of
Training - COUNTRY TOTAL: 2012 .......................................................................................24Table 3.6 Distribution of Urban Population by Five Years Age Group,
Sex and Sex Ratio - COUNTRY TOTAL: 2012 .................................................................33
Table 4.1. Urban population Aged Ten Years and Above by Age Group,Sex, Activity Status and Rate during the Last Seven Days(Current Status Approach) - COUNTRY TOTAL: 2012 .................................................41
Table 4.1.1 Urban population Aged Ten Years and Above by Age Group,Sex, Activity Status and Rate during the Last Seven Days(Current Status Approach) -TIGRAY REGION: 2012 ................................................... 42
Table 4.1.2 Urban population Aged Ten Years and Above by Age Group,Sex, Activity Status and Rate during the Last Seven Days(Current Status Approach) - AFFAR REGION: 2012 .....................................................43
Table 4.1.3 Urban population Aged Ten Years and Above by Age Group,Sex, Activity Status and Rate during the Last Seven Days(Current Status Approach) - AMHARA REGION: 2012 .................................................44
Table 4.1.4 Urban population Aged Ten Years and Above by Age Group,Sex, Activity Status and Rate during the Last Seven Days(Current Status Approach) – OROMIA REGION: 2012 ..................................................45
Table 4.1.5 Urban population Aged Ten Years and Above by Age Group,Sex, Activity Status and Rate during the Last Seven Days(Current Status Approach) - SOMALI REGION: 2012....................................................46
Table 4.1.6 Urban population Aged Ten Years and Above by Age Group,Sex, Activity Status and Rate during the Last Seven Days(Current Status Approach) - BENISHANGUL GUMUZ REGION: 2012 .......................47
Table 4.1.7 Urban population Aged Ten Years and Above by Age Group,Sex, Activity Status and Rate during the Last Seven Days(Current Status Approach) - SNNP REGION: 2012 ...................................................... 48
Table 4.1.8 Urban population Aged Ten Years and Above r by Age Group,Sex, Activity Status and Rate during the Last Seven Days(Current Status Approach) - GAMBELLA REGION: 2012 .............................................49
Table 4.1.9 Urban population Aged Ten Years and Above by Age Group,Sex, Activity Status and Rate during the Last Seven Days(Current Status Approach) - HARARI REGION: 2012 ...................................................50
Table 4.1.10 Urban population Aged Ten Years and O Above by Age Group, Sex,Activity Status and Rate during the Last Seven Days(Current Status Approach)-ADDIS ABABA CITY ADMINISTRATION: 2012 ............................................................. 51
Table 4.1.11 Urban population Aged Ten Years and Above by Age Group,Sex, Activity Status and Rate during the Last Seven Days(Current Status Approach) – DIRE DAWA ADMINISTRATION: 2012 52
Created by PDF Generator (http://www.alientools.com/), to remove this mark, please buy the software.

iv
Table 4.2 Population of Major Towns Aged Ten Years and Above by Sex,Activity Status and Rate during the Last Seven Days(Current Status Approach): 2012.................................................................................... 53
Table 4.3 Economically Non - Active Population of Urban AreasAged Ten Years and Above by Age Group, Sex and ReasonsFor Not Being Active During the Last Seven Days(Current Status Approach) - COUNTRY TOTAL: 2012 ...................................................55
Table 4.4 Economically Non-active Population of Urban AreasAged Ten Years and Above by Region, Sex and ReasonsFor Not Being Active During the Last Seven days(Current Status Approach):2012 .......................................................................................57
Table 5.1 Urban Population Aged Ten Years and Above by Region, Age Group,Sex and Employment to Population Ratio- COUNTRY TOTAL: 2012....................................................................................................67
Table 5.2 Urban Population of Major Towns Aged Ten Years andAbove by Age Group, Sex and Employment toPopulation Ratio: 2012 .......................................................................................................71
Table 5.3 Currently Employed Population of Urban Areas Aged Ten Yearsand Above by Age Group, Sex andMajor Occupational Groups – COUNTRY TOTAL: 2012 ..................................................77
Table 5.4 Currently Employed Population of Urban Areas Aged Ten Yearsand Above by Region, Sex andMajor Occupational Groups: 2012 ....................................................................................79
Table 5.5 Currently Employed Population of Major Towns Aged Ten Yearsand Above by Sex andMajor Occupational Groups: 2012 ....................................................................................81
Table 5.6 Currently Employed Population of Urban Areas Aged Ten Yearsand Above by Region, Sex andMinor Occupational Groups: 2012......................................................................................83
Table 5.7 Currently Employed Population of Urban Areas Aged Ten Yearsand Above by Age Group, Sex and Major Industrial Divisions -COUNTRY TOTAL: 2012 .................................................................................................. 102
Table 5.8 Currently Employed Population of Urban Areas Aged Ten Yearsand Above by Region, Sex and Major Industrial Divisions –COUNTRY TOTAL: 2012 ..................................................................................................... 104
Table 5.9 Currently Employed Population of Major Towns Aged Ten Yearsand Above by Sex and Major Industrial Divisions: 2012 ........................................... 107
Table 5.10 Currently Employed Population of Urban Areas Aged Ten Yearsand Above by Region, Sex and Minor Industrial Divisions-COUNTRY TOTAL: 2012 .................................................................................................. 109
Table 5.11 Currently Employed Population of Urban Areas Aged Ten Yearsand Above by Age Group, Sex and Status in Employment -COUNTRY TOTAL: 2012 .................................................................................................. 136
Table 5.12 Currently Employed Population of Urban Areas Aged Ten Yearsand Above by Region, Sex and Status in Employment: 2012 ................................... 138
Table 5.13 Currently Employed Population of Major Towns Aged Ten Yearsand Above by Sex and Status in Employment: 2012 ................................................. 140
Table 5.14 Currently Employed Population of Urban Areas Aged Ten Yearsand Above by Sex, Major Occupation Groups andMajor Industrial Divisions - COUNTRY TOTAL: 2012.................................................... 142
Table 5.15 Currently Employed Population of Urban Areas Aged Ten Yearsand Above by Sex, Major Industrial Divisions andEmployment Status – COUNTRY TOTAL: 2012 .......................................................... 145
Table 5.16 Currently Employed Population of Urban Areas Aged Ten Yearsand Above by Major Occupational Groups, Sex andStatus in Employment - COUNTRY TOTAL: 2012 ........................................................ 147
Created by PDF Generator (http://www.alientools.com/), to remove this mark, please buy the software.

v
Table 5.17 Currently Employed Population of Urban Areas Aged Ten Yearsand Above by Sex, Age Group and Number of HoursWorked Per Week- COUNTRY TOTAL: 2012................................................................ 149
Table 5.18 Currently Employed Population of Urban Areas Aged Ten Yearsand Above by Region, Sex and Number of HoursWorked Per Week: 2012................................................................................................... 151
Table 5.19 Currently Employed Population of Urban Areas Aged Ten Yearsand Above by Major Industrial Divisions, Sex and Numberof Hours Worked Per Week - COUNTRY TOTAL: 2012 .............................................. 153
Table 5.20 Currently Employed Population of Urban Areas Aged Ten Yearsand Above by Sex, Major Occupational Groups and Numberof Hours Worked Per Week - COUNTRY TOTAL: 2012 .............................................. 155
Table 5.21 Currently Employed Population Urban Areas Aged Ten Yearsand Above by Sex, Status in Employment and Numberof Hours Worked Per Week - COUNTRY TOTAL: 2012 .............................................. 157
Table 5.22 Paid Employees of Urban Population Aged Ten Years andAbove by Region, Sex and Type of Payment: 2012 .................................................... 159
Table 5.23 Paid Employees of Urban Population Aged Ten Years andAbove by Sex and Period of Payment –COUNTRY TOTAL: 2012 ................................................................................................... 161
Table 5.24 Paid Employees of Urban Population Aged Ten Years andAbove by Sex, Period of Payment and Amount of Total Payment –COUNTRY TOTAL: 2012 .................................................................................................. 162
Table 5. 25 Paid Employees of Urban Population Aged Ten Years andAbove by Major Industrial Divisions, Sex and Amount ofPayment per month - COUNTRY TOTAL: 2012 ............................................................... 163
Table 5.26 Total Employed Population Not at Work by Region, Sex, andReason for Not Working: 2012 ........................................................................................ 165
Table 5.27 Currently Employed Population of Urban Areas Aged Ten Yearsand Above by Age Group, Sex, Whether Available and Ready toWork Additional Hours and Percent Available and Ready to WorkAdditional Hours – COUNTRY TOTAL: 2012 ............................................................... 166
Table 5.28 Currently Employed Population of Urban Areas Aged Ten Yearsand Above Who Sought or Available to Work Additional Hours andNumber of Hours Worked Per Week by Age Group and Sex –COUNTRY TOTAL: 2012 .................................................................................................. 167
Table 5.29 Currently Employed Population of Urban Areas Aged Ten Yearsand Above Who Sought or Available to Work Additional Hours andType of Work Sought for by Region and Sex: 2012 ................................................... 169
Table 5.30 Currently Employed Population of Urban Areas Aged Ten Years andAbove by Age Group, Sex, Employment Sector and Percentage Share of Informal-COUNTRY TOTAL l: 2012 ................................................................................................... 170
Table 5.31 Currently Employed Population of Urban Areas Aged Ten Years and Aboveby Region, Sex, Employment Sector and Percentage Share of Informal: 2012 .... 171
Table 5.32 Currently Employed Populations of Major Towns Aged Ten Years andAbove by Sex, Employment Sector and Percentage Share of Informal: 2012 ....... 172
Table 5.33 Distribution of Urban Population aged ten years and Above Workingin the Informal Sector by Major Occupational Groupand Region : 2012 ............................................................................................................. 174
Table 5.34 Distribution of Urban Population aged ten years and Above Workingin the Informal Sector by Region, Sex andMajor Branches of Industry: 2012.................................................................................. 176
Table 5.35 Distribution of Urban Population aged ten years and Above Workingin the Informal Sector by Region, Sex, Major Branches of Industry andMean Number of Hours Worked Per Week: 2012 ........................................................ 177
Table 5.36 Distribution of Urban Population aged ten years and Above Workingin the Informal Sector by Region, Sex Literacy Status and Educational Level
Created by PDF Generator (http://www.alientools.com/), to remove this mark, please buy the software.

vi
and: 2012 ............................................................................................................................ 178Table 5.37 Distribution of Urban Population Aged ten years and Above Working
in the Informal Sector by Region and Sex,Size of Workers: 2012 ...................................................................................................... 180
Table 5.38 Distribution of Urban Population Aged ten years and Above Workingin the Informal Sector by Region, Sex, Type ofWorking Place: 2012 ........................................................................................................ 181
Table 5.39 Distribution of Urban Population aged ten years and Above Workingin the Informal Sector by Regions, Order andType of Difficulties Faced: 2012..................................................................................... 183
Table 6.1 Currently Unemployed Populations of Urban AreasAged Ten Years and Above by Region, Age Group, Sex andUnemployment Rate: 2012 ............................................................................................... 190
Table 6.2 Currently Unemployed Populations of Major TownsAged Ten Years and Above by Sex, Age Group andUnemployment Rate: 2012 .............................................................................................. 194
Table 6.3 Currently Unemployed Population of Urban Areas Aged Ten Yearsand Above by Age group, Sex, Literacy Status andEducational Attainment, COUNTRY TOTAL: 2012 ...................................................... 200
Table 6.4 Currently Unemployed Populations of Urban Areas Aged Ten Yearsand Above by Region, Sex, Literacy Status andEducational Attainment: 2012 .......................................................................................... 202
Table 6.5 Currently Unemployed Population of Urban Areas Aged Ten Yearsand Above by Region, Sex, Training Status andTypes of Training: 2012................................................................................................... 204
Table 6.6 Currently Unemployed Population of Urban Areas Aged Ten Yearsand Above by Age Group, Sex and Marital Status,COUNTRY TOTAL: 2012 .................................................................................................. 213
Table 6.7 Currently Unemployed Population of Urban Areas Aged Ten Yearsand Above by Region, Sex and Marital Status: 2012 .................................................. 214
Table 6.8 Currently Unemployed Population of Urban Areas Aged Ten Yearsand Above Who Were Seeking for Work by Region, Sex and StepsTaken to Seek Work: 2012 .............................................................................................. 215
Table 6.9 Currently Unemployed Population of Urban Areas Aged ten Yearsand Above by Region, Sex and Type of job looking for: 2012 ................................. 217
Table 6.10 Currently Unemployed Population of Urban Areas Aged Ten Yearsand Above by Age Group, Sex, Previous Work Experienceand Duration of Unemployment, COUNTRY TOTAL: 2012........................................ 218
Table 6.11 Currently Unemployed Population of Urban Areas Aged Ten Yearsand Above by Region, Sex, Previous Work Experience andDuration of Unemployment: 2012 .................................................................................. 220
Table 6.12 Currently Unemployed Population of Urban Areas Aged Ten Yearsand Above by Region, Sex, Types of Problem Faced toEstablish Own Business: 2012 ...................................................................................... 222
Created by PDF Generator (http://www.alientools.com/), to remove this mark, please buy the software.

CAHAPTER I
BACKGROUND OF THE SURVEY
1.1 Introduction
Statistical information on all aspects of the population is vital for the design,implementation, monitoring and evaluation of economic and social development planand policy issues. Labour force survey is one of the most important sources of datafor assessing the role of the population of the country in the economic and socialdevelopment process. It is useful to indicate the extent of available and unutilizedhuman resources that must be absorbed by the national economy to ensure fullemployment and economic well being of the population. Statistics on the labour forcefurther present the economic activity status and its relationship to other social andeconomic characteristics of the population. Seasonal and other variations as well aschanges over time in the size, distribution and characteristics of employed andunemployed population can be monitored using up-to-date information from labourforce surveys. It serves as an input for assessing the achevements of the MillenniumDevelopment Goals (MDGs). Furthermore, labour force data is also useful as aspringboard for monitoring and evaluation of the five years growth and transformationplan of the country.
Despite the significance of the labour force data, the availability of reliable and timelylabour force data were inadequate. The lack of reliable and timely data on differentaspects of the population hinders the monitoring and evaluation of changes ofdevelopmental activities.
The Central Statistical Agency (CSA) has been providing labour force and relateddata at different levels with various contents and details in order to fill the gap in datarequirement for the purpose of planning, monitoring and evaluation. These includethe 1976 Addis Ababa Manpower and Housing Sample Survey, the 1978 Survey onPopulation and Housing Characteristics of Seventeen Major Towns, the 1980/81 and1987/88 Rural Labour Force Surveys (RLFS). The 1984, 1994 and 2007 Population
Created by PDF Generator (http://www.alientools.com/), to remove this mark, please buy the software.

and Housing Censuses and the 1999 and 2005 National Labour Force Surveysprovided a comprehensive national labour force data representing both urban andrural areas.
Considering the development process of the country and dynamic nature of thesectors and fulfilling the demands of different data users, the CSA has beenlaunched Urban Employment Unemployment Survey program (UEUS) since 2003.The Agency conducted UEUS in seven rounds. The statistical and analytical report ofthe October 2003, April 2004, and April 2006 surveys were published together inbulletin number 301, 319, 373, respectively. Whereas the May 2009, May 2010 andMarch 2011 surveys, the statistical and analytical results were published separately.The statistical report found in bulletin number 469, 499 and 521, while the analyticalreport in bulletin number 477, 504 and 530, respectively.
The 2012 Urban Employment and Unemployment Survey conducted from March 12 -March 27, 2012 is the seven series. Unlike the previous surveys the May 2009, May2010, March 2011, and the recent survey of March 2012 survey have collectedinformation from selected major towns with population size 100,000 and above andincluding region capital cities.
In addition, data on economic activities of children were also collected to measure
child labour in urban areas. For this purpose, the former minimum age limit 10 years
was lower down to 5 years since May 2009 and the data in each subsequent survey
was also collected from those persons aged five years and above. This is because
children in rural and urban areas used to work at their early age such as collection of
fire wood, looking after cattle, shoeshine, street vendor, petty trading…etc.
The survey primarily provides data on the size, distribution and other socio-
demographic characteristics of employed and unemployed population. It also provide
data on active population and activity status and employment in the informal sector,
and its distribution in the various sectors of the economy during the survey reference
period. For the purpose of measuring the economic activity status based on Ethiopian
situation, the lower age limit was fixed in to ten years. This statistical report is
therefore mainly aimed at provide information on the economic characteristics of the
Created by PDF Generator (http://www.alientools.com/), to remove this mark, please buy the software.

population aged ten years and above. Furthermore, the 2012 UEUS provide data on
employment in the informal sector, their spatial distribution and at various sectors.
This statistical report presents a brief introduction of each chapter including basic
concepts based on ILO standard definitions together with statistical tables.
1.2. Objectives of the Survey
The general objective of the 2012 Urban Employment and Unemployment Survey is
to provide statistical data on the characteristics and size of the economic activity
status i.e. employed, unemployed population of the country at urban levels on annual
basis.
The specific objectives of the survey are to:
Ø collect statistical data on the potential manpower and those who areavailable to take part in various socio-economic activities;
Ø update the data and determine the size and distribution of the labour force
participation and the status of economic activity for different sub-groups of
the population at different levels of the country; and also to study the socio-
economic and demographic characteristics of these groups;
Ø identify the size, distribution and characteristics of employed population
i.e. working in the formal or informal employment sector of the economy
and earnings from paid employees and its distribution by occupation and
Industry...etc;
Ø provide data on the size, characteristics and distribution of unemployed
population and rate of unemployment;
Ø provide data that can be used to assess the situation of women’s
employment or the participation of women in the labour force;
Ø generated time series data to trace changes over time;
Created by PDF Generator (http://www.alientools.com/), to remove this mark, please buy the software.
1.3. Content and Organization of Survey Questionnaire
The survey questionnaire is organized into seven sections;
Section - 1 Area identification of the selected household: consists of
area identification of respondents such as region, zone,
wereda, kebele, EAs… etc.
Section - 2 Particulars of household members: consists of questions on the
general socio-demographic characteristics of the household
members such as age, sex, relationship to the head of
household, literacy status, educational levels, status and types
of training and marital status.
Section - 3 Economic activity status during the last seven days: this section
contains questions to identify whether persons were engaged in
productive activities during the last seven days prior to date of
interview. It comprises question on the status and characteristics
of employed persons such as occupation, industry, status in
employment, hours of work, formal and informal sector and
earnings from paid employment... etc.
Section - 4 Unemployment rate and characteristics of unemployed persons:
comprises questions on seeking and availability for work,
reasons for not being activity and type of work looking for and
problems encountered to establish own business and duration of
unemployment.
Section - 5 Economic activity status the population during the last six
months: this section contains questions to gather Information
about the economic activity status of the population during the
last six months such as number of weeks on employment,
unemployment and not being active and reasons for not being
active.
Section - 6 Employment in the informal sector of Employment. It includes
question whether the enterprise that a person engaged has book
account and license, number of workers and whether the product
Created by PDF Generator (http://www.alientools.com/), to remove this mark, please buy the software.

is mainly produced for sale.
Section - 7 Economic activity of children aged 5-17 years: this section
consists of information on the participation of children aged 5-17
years in the economic activities, whether attending education,
reason for not attending education, types of injuries whether
using protective wear while working and frequency of working
periods and for whom they are working.
A structured questionnaire was used to solicit the required data in the survey. The
draft questionnaire was tested by undertaking a pretest in selected kebeles (lower
administrative unit) in Addis Ababa. Based on the pretest, the content, logical flow,
layout and presentation of the questionnaire was amended. The questionnaire used
in the field for data collection was prepared in Amharic language. Most questions
have pre coded answers and column numbers were assigned for each question. A
copy of the questionnaire translated in English language is attached as Annex I of
this report for reference.
1.4. Training of Field Staff
The training program of enumerators, supervisors and other field office staff was
conducted in two stages. The first stage training of trainers was conducted at the
head quarters of the Central Statistical Agency (CSA), in Addis Ababa for five days
including half day field practice. The participants were selected from professionals
and associate professionals with long time experiences, branch office statisticians
and coordinators who were supposed to train enumerators and supervisors during
the second stage of training conducted at the branch statistical offices of CSA. The
training was guided by an enumerator and supervisor manuals, which consists of
detailed explanation of concepts, ideas and instructions on how to fill each entry in
the questionnaire.
The second stage training was undertaken at the CSA branch offices. The trainers
conducted similar training for enumerators and field supervisors for ten days. The
Created by PDF Generator (http://www.alientools.com/), to remove this mark, please buy the software.

training consisted of theoretical classroom discussions on concepts, definitions and
techniques of completing the questionnaire as well as mock interview. The class
room presentation and discussions were intended to exchange experiences among
participants and pinpoint the areas of the survey questions that need more care and
attention. At the end of the training, one day field practice was carried out to
familiarize on the contents and structure of the questionnaire through interviewing of
household members. The objectives of mock and practical interviewing of
households were twofold. First, it enabled to assess how well the classroom
theoretical discussions were understood by all participants to convey the same
message at all levels. The second objective was to examine the difficulty, which
would likely be encountered during actual field work.
1.5. Organization of the Fieldwork
In order to carry out this survey with the desired level of quality, there was a need to
organize a large staff that performs the various survey activities. The 25 Branch
Statistical Offices of the Agency were responsible to carry out the data collection
operation. These offices have permanent and contract enumerators stationed in the
selected enumeration areas. The data collection operation of the survey involved a
total of about 696 enumerators and 168 field supervisors with an average supervisor
to enumerator ratio of 1: 4.
The interviews have been done by canvassing from house-to-house. Information was
collected directly from the head of the household or from other responsible
household member. The enumerators were assigned to one sampled enumeration
area, where he/she could easily converse with the respondent’s dialect. However, in
some cases whenever enumerator faces difficulty to converse with the respondent’s
dialect interpreters were used to facilitate the data collection. Data collection from
the field took place from 12 March – 27 March 2012.
During the survey data collection operation, close and regular supervision was
undertaken at various levels. Immediately after the commencement of the data
Created by PDF Generator (http://www.alientools.com/), to remove this mark, please buy the software.

collection exercise the supervisors had made spot checking, re-interviewing and a
thorough scrutiny of filled-in questionnaires to ensure that the data collection
activities are taking place according to the given instruction. The branch statistical
office heads, coordinators and statisticians were also made supervision of the data
collection operation. Moreover, senior staff members from the CSA head office made
field supervision activities in seven branches for a week at different towns.
1.6. Data Processing
The filled-in questionnaires that were retrieved from the field were first subjected to
manual editing and coding. During the fieldwork, field supervisors and statisticians of
the head and branch statistical offices have checked the filled-in questionnaires and
carried out some editing. However, the major editing and coding operation was
carried out at the head office. All the edited questionnaires were again fully verified
and checked for consistency before they were submitted to the data entry by the
subject matter experts.
Using the computer edit specifications prepared earlier for this purpose, the entered
data were checked for consistencies and then computer editing or data cleaning was
made by referring back to the filled-in questionnaire. This is an important part of data
processing operation to maintain the quality of the data. Consistency checks and re-
checks were also made based on frequency and tabulation results. This was done by
senior programmers using CSPro software in collaboration with the senior subject
matter experts from Manpower Statistics Team of the CSA.
1.7. Definitions of Concepts and Terms
Some of the major operational definitions of basic concepts are given below.
Moreover, other concepts and definitions related to the economic activity status are
provided under respective chapters.
Created by PDF Generator (http://www.alientools.com/), to remove this mark, please buy the software.

Urban Center: is defined as a locality with 2000 or more inhabitants. In this survey,however, for practical purposes an urban center includes the following regardless ofthe number of inhabitants.a) All administrative capitals
i) Regional capitalsii) Zonal capitals not included in (i)iii) Wereda capitals not included in (i) and (ii)iv) Localities with Urban Dweller's Association (UDAs) not included in (I-iii).
b) Municipal town not included in item (a) above.c) All localities which are not included either in item (a) or (b) above, having a
population of 1000 or more persons, and whose inhabitants are primarilyengaged in non-agricultural activities. Note that localities with population lessthan 1000 persons should be considered as rural.
Major Urban Centers: For the purpose of this study, major urban center includethose selected urban centers with population 100,000 and above. It also includesregion capitals irrespective of their population size.Urban Kebele: is the lowest administrative unit in an urban center with its ownjurisdiction. It is an association of urban dwellers (commonly known as kebele)formed by the inhabitants.Enumeration Area (EA): is a unit of land delineated for the purpose of enumeratingpopulation and housing units without omission and duplication. An EA in rural areasusually consists of 150-200 households. On the other hand, an EA in urban areasconstitutes 150-200 housing units.Household: Consists of a person or group of persons, irrespective of whetherrelated or not, who normally live together in the same household and housing unitsand have common cooking and eating arrangements.Housing Unit : is defined as a separate and independent place of abode eitherintended for habitation or not intended for habitation but was occupied as a livingquarter by a household during the survey period. Although intended for habitation byone household, a housing unit may, at the survey be occupied by one or morehouseholds or may be used partly for living and partly for establishment.Head of Household: is a person who provides economic supports or manages thehouseholds. The head of the household is selected by household members for somereasons of his age or respect regardless of their sex.Usual Member of a Household: a person is considered as usual members of ahousehold if he or she is:-
Created by PDF Generator (http://www.alientools.com/), to remove this mark, please buy the software.

a) a person who continuously live/reside at least for six months and have acommon cooking and eating arrangements with the household; or
b) a person who is temporarily absent from the household at the time of thesurvey but his absence has not violated the six months criterion.
c) House maids, guards, baby sitters, etc…with no other dwelling and who werestaying with the household at the time of the survey.
d) Persons who plan to live more than six months due to searching for job andtransfer from job …etc.
1.8. Organization of the Report
This statistical report contains seven chapters. The first chapter covers background
and objectives of the survey, where the objectives and the contents of the survey
questionnaire, training of field staff, organization of field work, concepts and
definitions of terms and concepts. Chapter II presents methodology of the survey
including scope, coverage, sample size, covered households and response rate.
Chapter III describes briefly the socio-demographic characteristics of the urban
population such as the size and distribution of urban population by age group and
sex. Chapter IV presents data on the economic activity status of the population aged
ten years and above using the current status approach. Chapter V explores the size,
characteristics and distribution of the employed population aged ten years and
above. Chapter VI presents the size, characteristics and distribution of the
unemployed population and unemployment rate aged ten years and above.
Annex I provides survey questionnaire English version, while estimation procedures
of total, ratio and sampling errors; and estimates and CV's are also presented in
Annex II and Annex III, respectively.
Created by PDF Generator (http://www.alientools.com/), to remove this mark, please buy the software.

1.9 ABBEREVATIONS
CSA Central Statistical Agency
EA Enumeration Area
HH Households
ICSE International classification of Status in Employment
ILO International Labour Organization
CSPro Census and Survey Processing System
ISCO International Standard Classification of Occupation
ISIC International Standard Industrial Classification of All Economic Activities
ICLS International Conference on Labour Statistics
KILM Key Indicators of Labour Market
MDGs Millennium Development Goals
NIHSP National Integrated Household Survey Program
NLFS National Labour Force Survey
NS Not Stated
NOIC National Occupation and Industrial Classification
PASDEP Plan for Accelerated and Sustained Development to End Poverty
PSU Primary Sampling Unit
RLFS Rural Labour Force Survey
SNA System of National Account
SNNPR Southern Nations, Nationalities and Peoples Region
TVET Technical Vocational and Educational Training
UEUS Urban Employment and Unemployment Survey
UBEUS Urban Bi-annual Employment and Unemployment Survey
Created by PDF Generator (http://www.alientools.com/), to remove this mark, please buy the software.

CHAPTER II
SURVEY METHODOLOGY
2.1 COVERAGE
The 2012 Urban Employment and Unemployment Survey (UEUS) covered all urban
parts of the country except three zones of Afar, Six zones of Somali, where the
residents are pastoralists. This survey follows household approach and covers
households residing in conventional households, thus population residing in the
collective quarters such as universities/colleges, hotel/hostel, monasteries and
homeless population …. etc are not covered by this survey.
It was initially planned to cover 660 EAs and 19,800 households in the survey, but
ultimately 100% of EAs and 99.86% of households were successfully covered.
2.2 SAMPLING FRAME
The list of households obtained from the 2007 population and housing census is
used to select EAs. A fresh list of households from each EA was prepared at the
beginning of the survey period. The list was then used as a frame in order to select
30 households from sample EAs.
2.3 SAMPLE DESIGN
For the purpose of this survey, the country was divided into two broad categories.
That is major urban center and other urban center categories.
Category I:- Major urban centers:- In this category all regional capitals and five
other major urban centers that have had a high population size as compared to
others were included. Each urban center in this category was considered as a
reporting level. The category has a total of 16 reporting levels. In this category, in
order to select the sample, a stratified two-stage cluster sample design was
implemented. The primary sampling units were EAs of each reporting level. From
each sample EA 30 households were then selected as a Second Stage Unit (SSU).
Created by PDF Generator (http://www.alientools.com/), to remove this mark, please buy the software.

Category II: - Other urban centers: Urban centers in the country other than those
under category I were grouped into this category. A domain of other urban centers is
formed for each region. Consequently 8 reporting levels were formed in this
category. Harari, Addis Ababa and Dire Dawa do not have urban centers other than
that grouped in category I. Hence, no domain was formed for these regions under
this category.
A stratified three stage cluster sample design was also adopted to select samples
from this category. The primary sampling units were urban centers and the second
stage sampling units were EAs. From each EA 30 households were selected at the
third stage and the survey questionnaires administered for all of them.
2.4 SAMPLE SIZE AND SELECTION SCHEME
Category I: - In this category 393 EAs and 11,790 households were selected from
16 major urban centers. Sample EAs from each reporting level in this category were
selected using probability proportional to size /PPS/ with systematic sampling
method; size being number of households obtained from the 2007 population and
housing census. From the fresh list of households prepared at the beginning of the
survey, 30 households per EA were selected using systematic random sampling
techniques /SRS/.
Category II:- consists of 86 urban centers, 267 EAs and 8,010 households were
selected in this category. Urban centers from each domain and EAs from each
urban center were selected using probability proportional to size /PPS/ with
systematic sampling method; size being number of households obtained from the
2007 Population and housing census. From the listing of households in each EA
then 30 households were selected using systematic random sampling techniques
/SRS/ and the survey questionnaire was administered for the 30 sample households.
The distribution of planned and covered EAs and households and the Estimation
procedures are given in the appendix.
Created by PDF Generator (http://www.alientools.com/), to remove this mark, please buy the software.

Appendix I: Number of planned and actually covered sampling units
(EAs and households) of the 2012 (2004 E.C) Urban Employment
and Unemployment Survey (UEUS).
Stratum Enumeration Areas HouseholdsRegion
Major Urban/
Other Urban
Planned Covered Planned Covered
Mekele 23 23 690 690Tigray
Tigray other urban 28 28 840 840
Asayita 15 15 450 450Affar
Affar other urban 14 14 420 420
Bahir dar 23 23 690 690
Gonder 23 23 690 689
Dessie 23 23 690 685
Amhara
Amhara other urban 54 54 1620 1619
Debrezeit/Bishoftu/ 22 22 660 660
Nazreth/Adama/ 23 23 690 690
Jimma 23 23 690 690
Shashmene 23 23 690 688
Oromiya
Oromiya other urban 83 83 2490 2486
Jijiga 20 20 600 599Somalie
Somalie other urban 15 15 450 450
Asosa 15 15 450 450Benishangul -
Gumuz Benishangul -Gumuz
other urban
13 13 390 390
Awassa 23 23 690 690S.N.N.P.
S.N.N.P other urban 51 51 1530 1530
Gambella 14 14 420 447Gambela
Gambella other urban 9 9 270 239
Harari Hareri 23 23 690 688
Addis Ababa Addis ababa 75 75 2250 2247
Dire Dawa Diredawa 25 25 750 745
Total 660 660 19,800 19,772
Created by PDF Generator (http://www.alientools.com/), to remove this mark, please buy the software.

Created by PDF Generator (http://www.alientools.com/), to remove this mark, please buy the software.

CHAPTER III
SOCIO-DEMOGRAPHIC CHARACTERISTICS OF URBAN POPULATION
3.1 Introduction
The figure in this chapter refers to the dejure population residing in conventional
households. The dejure population comprises all persons who belong to a given area
at a given time by virtue of usual residence. Thus, visitors, persons residing in
collective quarters (hotel/hostel, boarding schools, prisons...etc.) as well as homeless
persons are excluded.
This chapter presents the basic socio-demographic characteristics of urban population
of the country which includes population size; distribution of the population by age and
sex, sex ratio, literacy status, , attending formal or informal education, educational
attainment, training status and type of training.
3.2. Age-Sex Structure of Urban Population and Other Socio-
Demographic Data
This section portrays a set of tables that depict the main socio-demographic
characteristics of the urban population as of 2012. The size and distribution of
estimated total population of urban areas by age group, sex and region is shown in
Table 3.1. The total urban population of the country estimated to be 14,011,269 in
March 2012. Table 3.2 presents the distribution of urban population, number of
households and average household size by region. The average household size is
computed from the total population to that of the total households. Data on household
size and distribution of persons per household can sometimes be used as a proxy
measure of crowdedness of population and has a great implication to health and
housing problem. The distribution of urban population by region, sex and the
relationship of the respondents to the head of household is presented in Table 3.3.
Created by PDF Generator (http://www.alientools.com/), to remove this mark, please buy the software.

Table 3.4 and Table 3.5 show the status of school attendance for those aged five
years and above by age group and sex at national and regional levels. The literacy
status and educational attainment of urban population aged ten years and above has
shown in Table 3.6 and Table 3.7, respectively. As indicated in these tables secondary
education refers to those persons who did not complete high school education, that is,
grades 9 - 11 in old curriculum and grade 9 in new curriculum, while secondary
education completed covers those persons who completed high school education
which includes grade 12 in old curriculum and grade 10 in new curriculum.
The 2012 Urban Employment and Unemployment Survey also collected data on status
and types of training of urban population aged ten years and above. Tables 3.8
demonstrate the status and type of training received by region and sex.
Besides, the distribution of urban population by five-year age group, sex and sex ratio
is presented in Table 3.9. Sex ratio is defined as the number of males per 100 females
in a given population. The sex composition has an effect on economic activities
through changing the relative size of the working population.
Created by PDF Generator (http://www.alientools.com/), to remove this mark, please buy the software.

Table 3.2 Distribution of Urban Population, Number of Households and Average Household Size by Region: 2012Household Size
Region, Population andHouseholds
Total 1 2 3 4 5 6 7COUNTRY TOTAL
Households 3,840,602 661,419 676,954 694,021 620,803 473,059 324,501 183,719Population 14,011,269 661,419 1,353,907 2,082,063 2,483,212 2,365,295 1,947,009 1,286,031
TIGRAY REGIONHouseholds 301,059 52,748 54,011 60,526 49,515 39,927 24,481 9,235Population 1,043,639 52,748 108,022 181,577 198,062 199,636 146,886 64,642
AFFAR REGIONHouseholds 51,583 9,684 9,688 11,103 7,963 5,710 4,398 1,966Population 172,140 9,684 19,375 33,308 31,854 28,550 26,391 13,761
AMHARA REGIONHouseholds 748,408 138,524 164,075 149,208 110,275 81,573 55,161 27,196Population 2,474,466 138,524 328,149 447,625 441,099 407,865 330,968 190,369
OROMIA REGIONHouseholds 1,116,894 196,700 197,544 192,023 195,212 135,643 93,354 53,207Population 4,031,092 196,700 395,088 576,070 780,848 678,217 560,124 372,452
SOMALI REGIONHouseholds 146,377 20,346 14,807 20,327 16,842 20,733 18,237 13,798Population 682,683 20,346 29,613 60,981 67,366 103,667 109,423 96,586
BENISHANGUL GUMUZREGION
Households 41,986 8,532 9,079 7,103 6,593 4,001 2,859 1,753Population 141,476 8,532 18,157 21,310 26,373 20,005 17,154 12,268
SNNP REGIONHouseholds 520,587 103,520 84,800 80,016 77,232 61,848 49,315 30,156Population 1,936,997 103,520 169,600 240,049 308,930 309,242 295,891 211,094
GAMBELLA REGIONHouseholds 27,915 4,534 4,769 5,070 5,082 3,253 2,035 1,296Population 104,449 4,534 9,538 15,211 20,327 16,265 12,208 9,074
HARARI REGIONHouseholds 33,646 7,444 6,226 6,334 5,819 4,190 2,033 877Population 107,802 7,444 12,452 19,003 23,277 20,952 12,199 6,138
ADDIS ABABA CITYADMINISTRATION
Households 783,439 106,566 120,554 149,072 136,491 108,313 67,098 41,341Population 3,061,404 106,566 241,107 447,215 545,964 541,565 402,585 289,384
DIRE DAWAADMINISTRATION
Households 68,708 12,820 11,402 13,238 9,778 7,866 5,530 2,895Population 255,121 12,820 22,804 39,713 39,112 39,332 33,180 20,264
Created by PDF Generator (http://www.alientools.com/), to remove this mark, please buy the software.

Created by PDF Generator (http://www.alientools.com/), to remove this mark, please buy the software.

Table 3.3 Distribution of Urban Population by Region, Sex and Relationship to the Head of Household: 2012Relationship to the Head of Household
Region and Sex
TotalHead of
Household Spouse
Son /Daughter ofhead andSpouse
Son /Daughter of
Head
Son /Daughter of
Spouse
Mother /Father ofhead orSpouse
Brother /Sister ofHead /Spouse
COUNTRY TOTALTotal 14,011,269 3,875,123 1,893,142 3,988,775 1,986,143 86,770 111,630 515,742Male 6,689,363 2,476,596 151,684 2,103,310 1,040,647 43,173 18,996 240,319Female 7,321,906 1,398,527 1,741,458 1,885,464 945,496 43,597 92,634 275,422
TIGRAY REGIONTotal 1,043,639 314,451 127,715 269,841 188,618 7,732 9,469 30,521Male 470,348 178,361 6,639 129,654 94,381 3,143 1,642 13,530Female 573,291 136,091 121,075 140,187 94,237 4,590 7,827 16,991
AFFAR REGIONTotal 172,140 52,318 29,125 57,373 15,904 967 1,331 3,132Male 84,334 36,885 1,458 28,961 9,311 560 180 1,288Female 87,805 15,433 27,667 28,413 6,594 407 1,152 1,844
AMHARA REGIONTotal 2,474,466 751,588 341,751 648,526 364,247 22,532 23,631 78,454Male 1,151,457 443,437 21,747 345,291 190,270 12,678 3,436 36,369Female 1,323,009 308,151 320,004 303,234 173,976 9,854 20,196 42,085
OROMIA REGIONTotal 4,031,092 1,129,529 577,998 1,198,776 527,728 18,028 28,620 121,683Male 1,994,569 785,222 28,092 649,853 277,228 9,706 4,353 57,227Female 2,036,523 344,307 549,906 548,923 250,500 8,322 24,267 64,456
SOMALI REGIONTotal 682,683 147,059 83,769 279,448 113,679 1,317 5,433 14,040Male 344,567 94,459 10,463 151,218 59,024 403 375 7,027Female 338,115 52,599 73,305 128,229 54,655 913 5,058 7,013
Created by PDF Generator (http://www.alientools.com/), to remove this mark, please buy the software.

Table 3.3 Cont’dRelationship to the Head of Household
Region and Sex
TotalHead of
Household Spouse
Son /Daughterof Head
andSpouse
Son /Daughter of
Head
Son /Daughter of
Spouse
Mother /Father ofHead orSpouse
Brother /Sister ofHead /Spouse
Domestic
.BENISHANGUL GUMUZ REGIONTotal 141,476 42,070 22,467 41,021 16,153 1,451 1,028 4,730Male 70,461 30,189 841 21,233 8,064 1,011 175 2,560Female 71,015 11,882 21,627 19,788 8,089 439 852 2,170
SNNP REGIONTotal 1,936,997 521,307 269,619 595,942 233,894 8,478 7,955 83,483Male 955,050 371,936 11,162 309,224 129,408 3,776 1,206 37,043Female 981,947 149,371 258,457 286,718 104,485 4,703 6,749 46,440
GAMBELLA REGIONTotal 104,449 27,999 12,559 26,497 23,020 458 1,102 3,775
Male 48,403 16,496 948 12,571 11,997 209 200 1,591Female 56,046 11,503 11,611 13,926 11,023 249 901 2,184
HARARI REGIONTotal 107,802 33,748 15,828 24,861 16,587 593 1,054 3,186Male 52,142 20,787 1,912 13,474 9,519 252 - 1,427Female 55,660 12,961 13,916 11,387 7,068 342 1,054 1,760
ADDIS ABABA CITY ADMINISTRATIONTotal 3,061,404 786,259 379,316 783,073 445,779 23,841 28,931 160,800Male 1,395,378 457,381 64,680 407,970 230,002 10,911 6,715 76,197Female 1,666,026 328,878 314,637 375,102 215,777 12,930 22,217 84,602
DIRE DAWA ADMINISTRATIONTotal 255,121 68,794 32,995 63,418 40,533 1,372 3,076 11,939Male 122,652 41,443 3,741 33,862 21,441 523 714 6,061Female 132,468 27,351 29,254 29,556 19,092 849 2,362 5,878
Created by PDF Generator (http://www.alientools.com/), to remove this mark, please buy the software.

Table 3.4 Distribution of Urban Population Aged Five Years and Above by Age Group,Sex and School Attendance - COUNTRY TOTAL: 2012
Attended Formal / Informal EducationAge group
TotalCurrentlyAttending
Attended inthe Past
NeverAttended Not Stated
All AgesTotal 12,553,784 5,002,762 5,288,023 2,262,490 509Male 5,906,542 2,428,935 2,842,619 634,479 509Female 6,647,242 2,573,827 2,445,404 1,628,011 -
5-9Total 1,443,131 1,142,657 35,412 264,587 475Male 720,528 574,538 14,954 130,561 475Female 722,603 568,119 20,458 134,026 -
10-14Total 1,592,162 1,460,316 72,720 59,126 -Male 754,662 703,130 29,636 21,895 -Female 837,500 757,185 43,084 37,231 -
15-19Total 1,752,372 1,266,725 394,452 91,195 -Male 754,648 571,764 161,784 21,099 -Female 997,725 694,960 232,669 70,096 -
20-24Total 1,707,114 573,548 962,469 171,064 34Male 743,495 267,748 438,266 37,447 34Female 963,619 305,800 524,203 133,617 -
25-29Total 1,615,015 302,780 1,092,322 219,912 -Male 776,270 157,604 571,144 47,522 -Female 838,745 145,176 521,178 172,391 -
30-34Total 1,006,702 109,148 713,654 183,900 -Male 507,720 59,288 401,965 46,467 -Female 498,982 49,860 311,688 137,433 -
35-39Total 945,870 65,982 678,036 201,852 -Male 465,729 38,924 372,367 54,439 -Female 480,140 27,059 305,669 147,413 -
40-44Total 568,878 35,702 397,666 135,510 -Male 299,009 24,450 240,005 34,554 -Female 269,869 11,252 157,661 100,956 -
45-49Total 477,925 17,750 321,543 138,632 -Male 233,108 11,850 195,338 25,920 -Female 244,817 5,900 126,205 112,712 -
50-54Total 381,120 9,698 221,847 149,575 -Male 176,523 6,702 135,472 34,349 -Female 204,597 2,997 86,375 115,226 -
55-59Total 269,995 5,324 136,038 128,633 -Male 118,356 3,133 90,049 25,174 -Female 151,640 2,191 45,990 103,459 -
60-64Total 239,219 5,986 98,793 134,440 -Male 103,804 4,071 65,201 34,532 -Female 135,416 1,915 33,593 99,909 -
65+Total 554,280 7,146 163,070 384,063 -Male 252,690 5,732 126,439 120,519 -Female 301,589 1,414 36,631 263,544 -
Created by PDF Generator (http://www.alientools.com/), to remove this mark, please buy the software.

Created by PDF Generator (http://www.alientools.com/), to remove this mark, please buy the software.

Table 3.5 Distribution of Urban Population Aged Five Years and above byRegion, Sex, School Attendance: 2012
Attended Formal / Informal EducationRegion and Sex
TotalCurrentlyAttending
Attended inthe Past
NeverAttended Not Stated
COUNTRY TOTALTotal 12,553,784 5,002,762 5,288,023 2,262,490 509Male 5,906,542 2,428,935 2,842,619 634,479 509Female 6,647,242 2,573,827 2,445,404 1,628,011 -
TIGRAY REGIONTotal 917,333 364,092 388,110 165,130 -Male 401,155 171,543 190,040 39,571 -Female 516,178 192,549 198,069 125,559 -
AFFAR REGIONTotal 147,773 48,308 54,830 44,634 -Male 70,472 23,246 32,364 14,862 -Female 77,301 25,063 22,467 29,772 -
AMHARA REGIONTotal 2,236,891 801,351 898,504 537,036 -Male 1,019,052 387,845 469,630 161,577 -Female 1,217,839 413,506 428,874 375,459 -
OROMIA REGIONTotal 3,569,666 1,385,959 1,601,471 581,728 509Male 1,737,368 693,654 881,074 162,131 509Female 1,832,298 692,305 720,397 419,596 -
SOMALI REGIONTotal 558,971 241,078 109,240 208,653 -Male 278,201 134,813 68,155 75,233 -Female 280,770 106,266 41,085 133,419 -
BENISHANGULGUMUZ REGION
Total 127,521 49,491 48,619 29,412 -Male 63,355 24,051 28,540 10,764 -Female 64,166 25,439 20,079 18,648 -
SNNP REGIONTotal 1,739,338 742,017 734,239 263,081 -Male 855,181 363,435 412,131 79,616 -Female 884,156 378,582 322,109 183,465 -
GAMBELLA REGIONTotal 89,710 46,276 23,722 19,712 -Male 41,753 22,298 13,620 5,835 -Female 47,958 23,978 10,103 13,878 -
HARARI REGIONTotal 97,553 33,956 49,639 13,958 -Male 46,386 17,345 26,110 2,931 -Female 51,167 16,611 23,529 11,027 -
ADDIS ABABA CITYADMINISTRATION
Total 2,837,461 1,202,356 1,280,316 354,789 -Male 1,283,318 542,590 668,975 71,753 -Female 1,554,143 659,766 611,341 283,036 -
DIRE DAWAADMINISTRATION
Total 231,567 87,877 99,334 44,356 -Male 110,302 48,115 51,982 10,205 -Female 121,266 39,762 47,352 34,151 -
Created by PDF Generator (http://www.alientools.com/), to remove this mark, please buy the software.

Table 3.6 Distribution of Urban Population Aged Ten Years and Above by Region, Sex and Literacy Status: 2012
Literacy Status
Total Literate IlliterateRegion
Total Male Female Total Male Female Total Male
COUNTRY TOTAL 11,110,653 5,186,014 5,924,639 8,912,226 4,636,559 4,275,667 2,197,510 549,421
TIGRAY REGION 794,578 344,053 450,525 632,643 312,560 320,084 161,934 31,493
AFFAR REGION 127,674 61,116 66,558 80,560 45,152 35,408 47,114 15,964
AMHARA REGION 1,976,070 890,049 1,086,021 1,471,421 759,642 711,779 504,649 130,407
OROMIA REGION 3,131,966 1,522,509 1,609,457 2,536,043 1,367,468 1,168,575 595,889 155,007
SOMALI REGION 433,866 214,968 218,898 264,971 162,047 102,924 168,895 52,921BENISHANGUL- GUMUZREGION 111,784 55,116 56,668 83,276 45,733 37,543 28,508 9,383
SNNP REGION 1,531,368 743,394 787,974 1,277,087 674,361 602,726 254,281 69,033
GAMBELLA REGION 75,144 34,340 40,804 59,447 30,477 28,969 15,697 3,863
HARARI REGION 87,661 41,096 46,566 72,979 38,309 34,670 14,682 2,787ADDIS ABABA CITYADMINISTRATION 2,636,013 1,183,148 1,452,865 2,278,116 1,115,141 1,162,975 357,014 68,007DIRE DAWAADMINISTRATION 204,530 96,225 108,305 155,683 85,669 70,014 48,847 10,556
Created by PDF Generator (http://www.alientools.com/), to remove this mark, please buy the software.

Table 3.7 Distribution of Urban Population Aged 10 Years and above by Age group, Sex and EducationalCOUNTRY TOTAL: 2012
Highest Grade CompletedRegion and Sex
TotalNon-
FormalPre-
schoolGrades
1-8
Secondarynot
completedSecondaryCompleted Preparatory
CertificateCompleted
All AgesTotal 9,113,039 138,194 71,163 4,756,708 891,056 1,444,551 426,730 213,366Male 4,682,386 75,011 26,076 2,291,250 478,942 780,760 216,212 88,472Female 4,430,653 63,184 45,088 2,465,458 412,115 663,791 210,517 124,894
10-14Total 1,533,359 4,024 32,844 1,470,602 21,334 2,240 291 -Male 733,090 3,502 13,919 703,766 9,698 99 168 -Female 800,269 522 18,925 766,835 11,636 2,141 122 -
15-19Total 1,661,177 2,518 6,136 965,566 293,184 231,801 117,121 26,053Male 733,548 1,548 1,157 412,404 140,146 108,742 53,105 8,916Female 927,629 970 4,979 553,161 153,038 123,059 64,016 17,137
20-24Total 1,536,016 1,932 4,034 523,993 143,462 375,684 163,704 60,010Male 706,014 1,247 1,015 216,568 76,637 181,269 82,891 20,201Female 830,002 685 3,019 307,425 66,825 194,415 80,813 39,809
25-29Total 1,395,103 5,779 6,177 525,834 129,704 275,026 81,916 56,495Male 728,748 3,708 893 259,090 67,415 144,810 41,367 20,368Female 666,354 2,071 5,283 266,744 62,289 130,216 40,549 36,127
30-34Total 822,802 5,359 1,347 335,425 95,098 174,503 25,746 23,107Male 461,253 3,449 579 174,418 51,958 102,772 15,053 10,369Female 361,549 1,910 768 161,007 43,140 71,731 10,694 12,738
35-39Total 744,018 16,822 5,133 309,290 82,381 149,565 14,431 16,847Male 411,291 8,853 2,387 159,577 48,334 81,041 7,969 7,125Female 332,728 7,969 2,745 149,713 34,046 68,524 6,462 9,721
40-44Total 433,368 12,929 1,747 166,788 44,904 92,520 8,542 9,733Male 264,455 6,420 37 90,397 27,247 58,390 6,028 5,759Female 168,913 6,509 1,710 76,391 17,657 34,130 2,515 3,974
Created by PDF Generator (http://www.alientools.com/), to remove this mark, please buy the software.

Table 3.7 Cont’dHighest Grade Completed
Region and Sex
TotalNon-
FormalPre-
schoolGrades
1-8
Secondarynot
completedSecondaryCompleted Preparatory
CertificateCompleted
DiplomaCompleted
45-49Total 339,293 15,056 2,928 141,251 35,272 61,475 6,573 6,818 43,022Male 207,188 6,742 1,113 74,755 22,588 41,478 3,335 4,168 29,569Female 132,105 8,314 1,815 66,495 12,684 19,997 3,238 2,650 13,453
50-54Total 231,546 17,239 3,133 102,680 22,491 31,349 2,801 5,514 24,834Male 142,174 6,279 1,134 54,612 16,171 22,395 1,314 4,202 17,069Female 89,371 10,960 1,999 48,069 6,320 8,954 1,487 1,312 7,765
55-59Total 141,362 12,472 1,302 71,430 7,757 22,641 3,101 4,322 10,820Male 93,181 5,322 525 41,540 7,115 18,000 2,755 2,944 8,658Female 48,181 7,150 777 29,891 643 4,641 346 1,378 2,162
60-64Total 104,779 13,881 1,173 55,404 6,330 11,674 751 1,817 9,032Male 69,272 7,253 893 34,228 4,161 8,708 751 1,770 7,535Female 35,507 6,628 280 21,176 2,169 2,966 - 46 1,497
65+Total 170,217 30,183 5,212 88,446 9,140 16,073 1,753 2,651 9,881Male 132,171 20,688 2,424 69,894 7,473 13,055 1,477 2,651 9,313Female 38,045 9,495 2,787 18,552 1,668 3,017 277 -
Created by PDF Generator (http://www.alientools.com/), to remove this mark, please buy the software.

Table 3.8 Distribution of Urban Population Aged Ten Years and Above by Region, Sex, Training Status and Types of Training
RegionTraining status andTypes of Training
Total Tigray Afar Amhara Oromia SomalieBenishangul -
Gumuz SNNP Gambela
All PersonsTotal 11,110,653 794,578 127,674 1,976,070 3,131,966 433,866 111,784 1,531,368 75,144Male 5,186,014 344,053 61,116 890,049 1,522,509 214,968 55,116 743,394 34,340Female 5,924,639 450,525 66,558 1,086,021 1,609,457 218,898 56,668 787,974 40,804
Not TrainedTotal 8,840,548 623,416 116,663 1,619,508 2,553,481 392,923 92,616 1,239,127 64,278Male 3,770,739 244,285 52,919 669,140 1,153,402 184,252 41,733 553,122 26,804Female 5,069,809 379,131 63,744 950,368 1,400,079 208,672 50,884 686,005 37,475
TrainedTotal 2,269,772 171,162 10,867 356,407 578,450 40,943 19,167 292,241 10,866Male 1,415,131 99,768 8,054 220,909 369,107 30,716 13,384 190,272 7,537Female 854,641 71,394 2,813 135,499 209,343 10,226 5,784 101,969 3,329
Not StatedTotal 333 - 144 154 35 - - - -Male 144 - 144 - - - - - -Female 189 - - 154 35 - - - -
Types of TrainingAgriculture
Total 25,873 1,391 615 4,214 6,697 240 520 6,051 191Male 22,181 1,068 415 3,371 6,509 240 520 5,108 147Female 3,692 323 200 842 189 - - 943 44
Water and Soil ConservationTotal 3,752 251 - 780 1,123 50 105 847 249Male 3,093 251 - 511 1,047 - 86 604 249Female 659 - - 269 76 50 20 244 -
Forestry ScienceTotal 1,807 - - 450 437 - - 871 -Male 1,357 - - 450 437 - - 421 -Female 450 - - - - - - 450 -
General medicine, Ophthalmology Pathology, Internal medicine, Gynecology, Surgery, AnesthesiologyTotal 6,697 327 176 1,118 443 365 55 1,186 31Male 5,463 218 176 965 384 314 55 670 31Female 1,234 109 - 154 59 51 - 516 -
Created by PDF Generator (http://www.alientools.com/), to remove this mark, please buy the software.
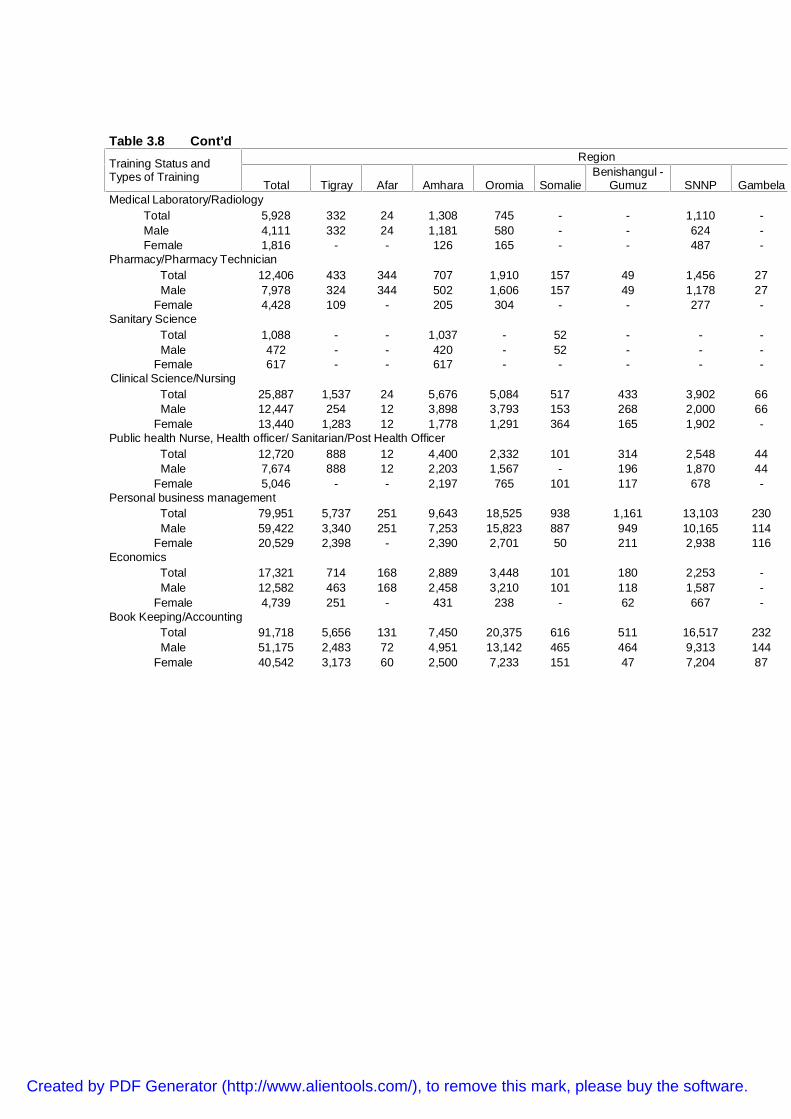
Table 3.8 Cont’dRegionTraining Status and
Types of TrainingTotal Tigray Afar Amhara Oromia Somalie
Benishangul -Gumuz SNNP Gambela
Medical Laboratory/RadiologyTotal 5,928 332 24 1,308 745 - - 1,110 -Male 4,111 332 24 1,181 580 - - 624 -Female 1,816 - - 126 165 - - 487 -
Pharmacy/Pharmacy TechnicianTotal 12,406 433 344 707 1,910 157 49 1,456 27Male 7,978 324 344 502 1,606 157 49 1,178 27
Female 4,428 109 - 205 304 - - 277 -Sanitary Science
Total 1,088 - - 1,037 - 52 - - -Male 472 - - 420 - 52 - - -
Female 617 - - 617 - - - - -Clinical Science/Nursing
Total 25,887 1,537 24 5,676 5,084 517 433 3,902 66Male 12,447 254 12 3,898 3,793 153 268 2,000 66
Female 13,440 1,283 12 1,778 1,291 364 165 1,902 -Public health Nurse, Health officer/ Sanitarian/Post Health Officer
Total 12,720 888 12 4,400 2,332 101 314 2,548 44Male 7,674 888 12 2,203 1,567 - 196 1,870 44
Female 5,046 - - 2,197 765 101 117 678 -Personal business management
Total 79,951 5,737 251 9,643 18,525 938 1,161 13,103 230Male 59,422 3,340 251 7,253 15,823 887 949 10,165 114
Female 20,529 2,398 - 2,390 2,701 50 211 2,938 116Economics
Total 17,321 714 168 2,889 3,448 101 180 2,253 -Male 12,582 463 168 2,458 3,210 101 118 1,587 -
Female 4,739 251 - 431 238 - 62 667 -Book Keeping/Accounting
Total 91,718 5,656 131 7,450 20,375 616 511 16,517 232Male 51,175 2,483 72 4,951 13,142 465 464 9,313 144
Female 40,542 3,173 60 2,500 7,233 151 47 7,204 87
Created by PDF Generator (http://www.alientools.com/), to remove this mark, please buy the software.

Table 3.8 Cont’dRegionTraining Status and
Types of TrainingTotal Tigray Afar Amhara Oromia Somalie
Benishangul -Gumuz SNNP Gambela
Secretarial ScienceTotal 18,510 900 - 2,123 2,798 50 23 1,690 -Male 2,512 341 - 75 481 - - 289 -
Female 15,998 559 - 2,048 2,318 50 23 1,400 -Banking and Finance
Total 9,257 - - 2,354 1,175 - 89 1,305 -Male 6,195 - - 1,859 1,085 - 89 1,305 -
Female 3,062 - - 495 90 - - - -Law
Total 28,922 2,518 36 4,162 7,641 159 66 4,857 245Male 23,943 1,992 36 3,849 7,210 159 66 4,021 217
Female 4,979 526 - 314 430 - - 836 28Language and Literature (Ethiopian and Foreign)
Total 26,559 333 179 7,558 8,856 1,145 239 1,861 80Male 16,570 224 168 5,588 6,276 416 216 1,043 80
Female 9,989 109 12 1,970 2,579 730 24 817 -Theatrical Art
Total 5,997 1,619 - 799 739 161 24 153 29Male 3,980 1,079 - 162 739 161 24 - 29
Female 2,018 540 - 637 - - - 153 -Educational Pedagogy, Teaching curriculum instruction Educational administration, Adults education
Total 91,325 5,884 535 21,886 18,677 2,120 414 18,001 504Male 58,137 2,961 392 14,975 11,444 1,340 289 12,353 446
Female 33,188 2,922 144 6,910 7,233 780 124 5,648 58Geography
Total 27,255 1,693 87 6,378 7,762 1,099 114 5,861 248Male 21,980 1,462 87 5,175 5,285 784 114 5,239 214
Female 5,275 231 - 1,203 2,477 314 - 622 33History
Total 11,791 384 176 2,235 4,832 51 83 1,305 225Male 10,024 153 176 2,160 3,942 51 83 1,095 225
Female 1,767 231 - 75 891 - - 210 -
Created by PDF Generator (http://www.alientools.com/), to remove this mark, please buy the software.

Table 3.8 Cont’dRegionTraining Status and
Types of TrainingTotal Tigray Afar Amhara Oromia Somalie
Benishangul -Gumuz SNNP Gambela
Political scienceTotal 2,497 - - 640 369 - - 599 148Male 1,888 - - 640 316 - - 389 148
Female 609 - - - 53 - - 210 -Sociology and Anthropology
Total 9,508 251 - 634 2,762 50 24 1,554 -Male 4,976 251 - 189 1,287 50 24 1,062 -
Female 4,532 - - 445 1,475 - - 492 -Psychology
Total 3,956 504 - 363 515 51 - 1,225 66Male 3,140 504 - 181 476 51 - 631 66
Female 816 - - 182 39 - - 595 -Civil
Engineering/BuildingTotal 14,882 946 214 375 823 101 59 3,329 66Male 10,437 946 214 375 663 101 26 2,838 66
Female 4,445 - - - 160 - 33 491 -Mechanical Engineering
Total 6,073 1,516 - 232 389 210 - 437 -Male 5,630 1,407 - 232 144 210 - 437 -
Female 443 109 - - 245 - - - -Electrical Engineering
Total 8,933 1,295 - 269 1,636 50 - 1,107 83Male 7,635 872 - 269 1,241 - - 1,107 -
Female 1,298 424 - - 395 50 - - 83Industrial Engineering
Total 988 - - 80 177 - - 385 -Male 866 - - 80 55 - - 385 -
Female 122 - - - 122 - - - -Municipality Engineering/Architecture
Total 4,242 - - 588 1,005 - - 854 -Male 2,612 - - 491 128 - - 554 -
Female 1,630 - - 97 877 - - 299 -
Created by PDF Generator (http://www.alientools.com/), to remove this mark, please buy the software.

Table 3.8 Cont’dRegionTraining Status and
Types of TrainingTotal Tigray Afar Amhara Oromia Somalie
Benishangul -Gumuz SNNP Gambela
Other types of Engineering, Dry Land,, Bio-diversity, Hydraulic Engineering Irrigation EngineeringTotal 4,478 682 - 284 470 314 24 330 -Male 3,557 682 - 284 470 314 24 101 -
Female 921 - - - - - - 229 -Automotive technology
Total 6,879 1,376 - 2,105 1,138 - - 693 28Male 4,781 1,106 - 1,214 411 - - 483 28
Female 2,098 270 - 892 726 - - 210 -Construction technology
Total 9,805 941 - 682 2,160 102 - 972 -Male 7,989 832 - 579 2,051 102 - 670 -
Female 1,816 109 - 103 109 - - 302 -Drafting technology
Total 2,461 176 - 663 143 - - - -Male 1,829 176 - 462 - - - - -
Female 632 - - 201 143 - - - -Manufacturing technology
Total 2,063 341 - - 46 218 - 420 -Male 1,722 - - - 46 218 - 420 -
Female 341 341 - - - - - - -Metal technology
Total 3,165 646 - 99 818 121 - 490 -Male 2,009 323 - 99 401 50 - 490 -
Female 1,155 323 - - 416 70 - - -Veterinary Science, Animal husbandry
Total 5,327 109 - 1,035 1,703 50 159 841 -Male 4,062 109 - 293 1,180 50 159 841 -
Female 1,265 - - 742 522 - - - -Communication
Total 1,764 203 - 630 247 50 - - -Male 1,318 203 - 581 247 - - - -
Female 446 - - 50 - 50 - - -
Created by PDF Generator (http://www.alientools.com/), to remove this mark, please buy the software.
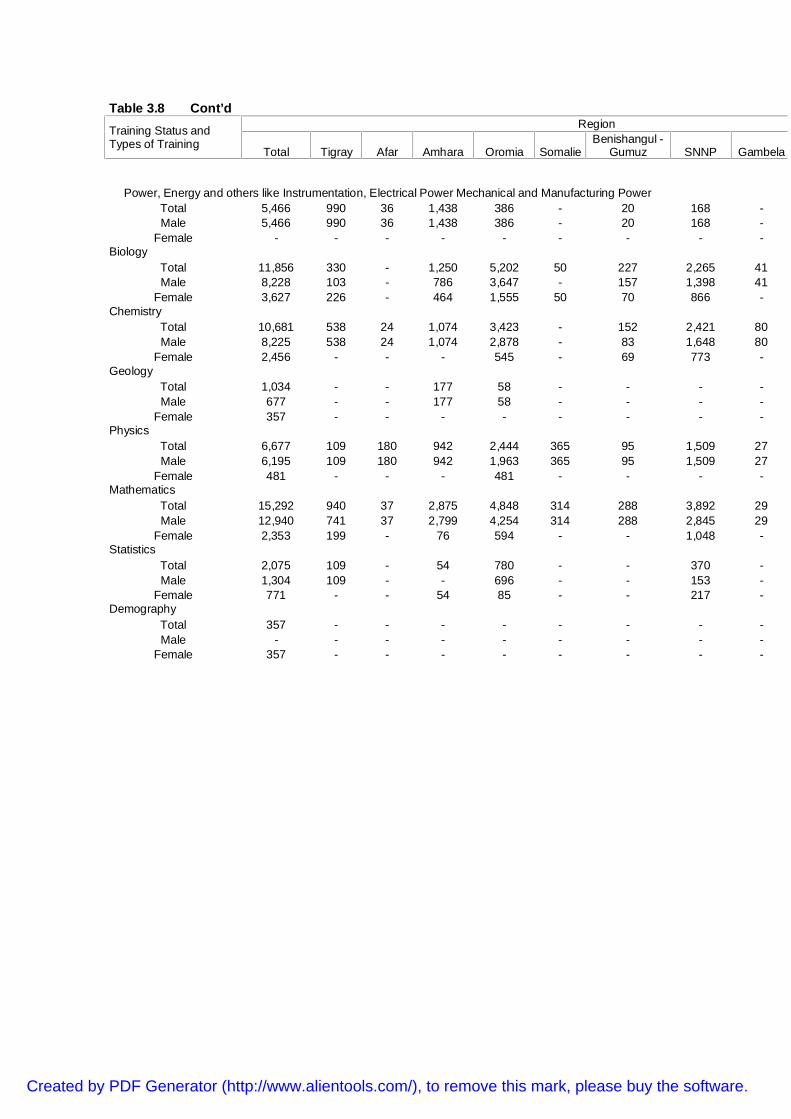
Table 3.8 Cont’dRegionTraining Status and
Types of TrainingTotal Tigray Afar Amhara Oromia Somalie
Benishangul -Gumuz SNNP Gambela
Power, Energy and others like Instrumentation, Electrical Power Mechanical and Manufacturing PowerTotal 5,466 990 36 1,438 386 - 20 168 -Male 5,466 990 36 1,438 386 - 20 168 -
Female - - - - - - - - -Biology
Total 11,856 330 - 1,250 5,202 50 227 2,265 41Male 8,228 103 - 786 3,647 - 157 1,398 41
Female 3,627 226 - 464 1,555 50 70 866 -Chemistry
Total 10,681 538 24 1,074 3,423 - 152 2,421 80Male 8,225 538 24 1,074 2,878 - 83 1,648 80
Female 2,456 - - - 545 - 69 773 -Geology
Total 1,034 - - 177 58 - - - -Male 677 - - 177 58 - - - -
Female 357 - - - - - - - -Physics
Total 6,677 109 180 942 2,444 365 95 1,509 27Male 6,195 109 180 942 1,963 365 95 1,509 27
Female 481 - - - 481 - - - -Mathematics
Total 15,292 940 37 2,875 4,848 314 288 3,892 29Male 12,940 741 37 2,799 4,254 314 288 2,845 29
Female 2,353 199 - 76 594 - - 1,048 -Statistics
Total 2,075 109 - 54 780 - - 370 -Male 1,304 109 - - 696 - - 153 -
Female 771 - - 54 85 - - 217 -Demography
Total 357 - - - - - - - -Male - - - - - - - - -
Female 357 - - - - - - - -
Created by PDF Generator (http://www.alientools.com/), to remove this mark, please buy the software.

Table 3.8 Cont’dRegionTraining Status and
Types of TrainingTotal Tigray Afar Amhara Oromia Somalie
Benishangul -Gumuz SNNP Gambela
Computer Science/Information ScienceTotal 27,732 436 188 4,381 5,184 101 59 3,028 -Male 16,106 218 - 2,058 2,957 101 26 2,149 -
Female 11,626 218 188 2,323 2,227 - 33 880 -Health and Physical education
Total 6,245 323 - 572 3,124 - 124 210 -Male 4,919 - - 357 2,682 - 124 210 -
Female 1,326 323 - 215 442 - - - -Meteorological Science
Total 769 - - - 470 - - - -Male 769 - - - 470 - - - -
Female - - - - - - - - -Chemical Engineering
Total 1,469 109 - - 209 - - 85 27Male 1,469 109 - - 209 - - 85 27
Female - - - - - - - - -Textile Engineering
Total 1,057 226 - - 139 - - - -Male 485 - - - 139 - - - -
Female 572 226 - - - - - - -Purchasing supply
Total 6,247 226 - 983 754 - 76 - 86Male 2,782 - - 403 574 - 76 - 58
Female 3,466 226 - 580 180 - - - 28Software Engineering
Total 1,612 - - 477 97 - - - -Male 1,266 - - 477 97 - - - -
Female 346 - - - - - - - -Home economics
Total 18,969 1,982 - 6,585 2,501 - 103 273 -Male 3,983 425 - 1,795 971 - 76 - -
Female 14,987 1,557 - 4,790 1,530 - 27 273 -Leather handicraft technology
Total 3,950 1,233 - 103 193 - 28 - -
Created by PDF Generator (http://www.alientools.com/), to remove this mark, please buy the software.
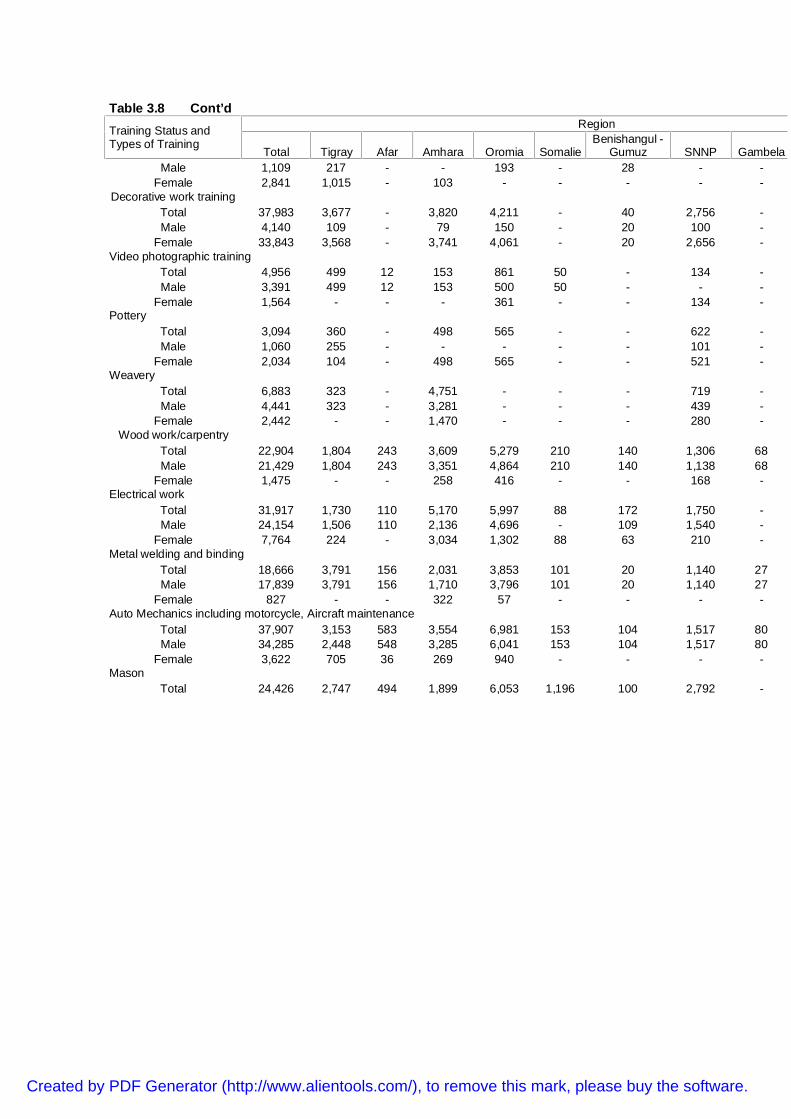
Table 3.8 Cont’dRegionTraining Status and
Types of TrainingTotal Tigray Afar Amhara Oromia Somalie
Benishangul -Gumuz SNNP Gambela
Male 1,109 217 - - 193 - 28 - -Female 2,841 1,015 - 103 - - - - -
Decorative work trainingTotal 37,983 3,677 - 3,820 4,211 - 40 2,756 -Male 4,140 109 - 79 150 - 20 100 -
Female 33,843 3,568 - 3,741 4,061 - 20 2,656 -Video photographic training
Total 4,956 499 12 153 861 50 - 134 -Male 3,391 499 12 153 500 50 - - -
Female 1,564 - - - 361 - - 134 -Pottery
Total 3,094 360 - 498 565 - - 622 -Male 1,060 255 - - - - - 101 -
Female 2,034 104 - 498 565 - - 521 -Weavery
Total 6,883 323 - 4,751 - - - 719 -Male 4,441 323 - 3,281 - - - 439 -
Female 2,442 - - 1,470 - - - 280 -Wood work/carpentry
Total 22,904 1,804 243 3,609 5,279 210 140 1,306 68Male 21,429 1,804 243 3,351 4,864 210 140 1,138 68
Female 1,475 - - 258 416 - - 168 -Electrical work
Total 31,917 1,730 110 5,170 5,997 88 172 1,750 -Male 24,154 1,506 110 2,136 4,696 - 109 1,540 -
Female 7,764 224 - 3,034 1,302 88 63 210 -Metal welding and binding
Total 18,666 3,791 156 2,031 3,853 101 20 1,140 27Male 17,839 3,791 156 1,710 3,796 101 20 1,140 27
Female 827 - - 322 57 - - - -Auto Mechanics including motorcycle, Aircraft maintenance
Total 37,907 3,153 583 3,554 6,981 153 104 1,517 80Male 34,285 2,448 548 3,285 6,041 153 104 1,517 80
Female 3,622 705 36 269 940 - - - -Mason
Total 24,426 2,747 494 1,899 6,053 1,196 100 2,792 -
Created by PDF Generator (http://www.alientools.com/), to remove this mark, please buy the software.

Table 3.8 Cont’dRegionTraining Status and
Types of TrainingTotal Tigray Afar Amhara Oromia Somalie
Benishangul -Gumuz SNNP Gambela
Male 21,677 2,180 494 1,759 5,539 1,196 100 2,302 -Female 2,750 567 - 141 514 - - 491 -
TypingTotal 20,087 1,337 96 1,971 5,072 50 53 978 27Male 358 - - - - - - - -
Female 19,729 1,337 96 1,971 5,072 50 53 978 27Tailoring
Total 36,837 6,818 24 5,682 8,508 576 - 3,519 27Male 11,792 1,724 - 2,497 2,439 210 - 2,266 27
Female 25,045 5,093 24 3,186 6,069 367 - 1,253 -Driver
Total 254,103 15,104 1,362 26,870 66,910 5,453 1,552 23,720 939Male 245,489 14,567 1,362 26,415 66,666 5,383 1,552 23,534 537
Female 8,614 537 - 455 243 70 - 187 403Development Agent
Total 4,160 109 37 638 1,917 51 112 257 -Male 2,719 109 37 638 1,238 51 43 257 -
Female 1,440 - - - 679 - 69 - -Traditional Birth Attendant
Total 1,634 109 - 744 226 210 - - -Male 816 - - 744 72 - - - -
Female 818 109 - - 154 210 - - -Computer Applications and Usage
Total 45,599 3,388 273 6,805 8,304 1,955 181 4,014 218Male 9,423 191 188 1,609 2,514 618 - 414 56
Female 36,176 3,197 85 5,196 5,790 1,337 181 3,600 162Lower Scale training of Agriculture (from Agarfa, Ardaeta and Baco)
Total 4,083 223 - 2,795 787 - 54 - -Male 2,997 223 - 1,888 608 - 54 - -
Female 1,086 - - 907 179 - - - -Hotels and Tourism
Total 120,619 8,782 290 19,088 36,980 730 1,271 15,910 611Male 42,779 2,857 155 4,011 13,342 314 282 7,162 282
Female 77,840 5,925 134 15,077 23,638 415 988 8,748 329Police
Total 46,793 3,798 263 7,892 10,839 2,579 552 8,581 591
Created by PDF Generator (http://www.alientools.com/), to remove this mark, please buy the software.

Table 3.8 Cont’dRegionTraining Status and
Types of TrainingTotal Tigray Afar Amhara Oromia Somalie
Benishangul -Gumuz SNNP Gambela
Male 41,921 3,332 263 7,257 10,519 2,143 431 7,269 451Female 4,872 466 - 635 319 436 121 1,312 140
Military scienceTotal 33,004 2,872 36 8,165 6,124 373 304 4,889 108Male 30,154 2,549 - 8,118 6,081 373 304 4,398 81
Female 2,850 323 36 47 42 - - 491 27Cobblestone
Total 21,251 3,806 - 8,073 4,311 101 27 1,325 -Male 13,495 2,497 - 5,299 2,070 50 27 1,197 -
Female 7,757 1,310 - 2,774 2,241 50 - 128 -Embroidery
Total 12,286 1,325 - 1,512 4,448 210 167 309 -Male 1,192 - - - - - - 101 -
Female 11,094 1,325 - 1,512 4,448 210 167 207 -Plumber
Total 5,249 109 62 800 1,348 - - 771 -Male 4,522 109 62 420 1,280 - - 490 -
Female 727 - - 380 67 - - 280 -Other Senior and Junior Professions/Specified
Total 592,343 37,880 2,920 93,448 196,261 13,222 7,788 87,181 4,943Male 313,101 19,865 1,159 50,557 102,706 10,027 4,947 46,902 3,295
Female 279,242 18,015 1,761 42,891 93,555 3,195 2,841 40,279 1,648Other Skilled and Technical Professions/Specified
Total 164,895 19,746 326 29,061 32,788 3,565 713 14,980 144Male 88,271 9,704 300 15,291 17,139 2,630 459 8,129 28
Female 76,624 10,042 26 13,771 15,649 934 254 6,851 116
Not Stated for type of trainingTotal 5,153 540 287 778 2,051 - - 739 -Male 2,165 323 287 137 998 - - 420 -
Female 2,988 218 - 641 1,052 - - 319 -
Created by PDF Generator (http://www.alientools.com/), to remove this mark, please buy the software.

Table 3.9 Distribution of Urban Population by Five Years Age Group,Sex and Sex Ratio - COUNTRY TOTAL: 2012
SexAge Group
Total Male Female
Sex Ratio
All Ages 14,011,269 6,689,363 7,321,906 91.4
0-4 1,457,485 782,821 674,664 116.0
5-9 1,443,131 720,528 722,603 99.7
10-14 1,592,162 754,662 837,500 90.1
15-19 1,752,372 754,648 997,725 75.6
20-24 1,707,114 743,495 963,619 77.2
25-29 1,615,015 776,270 838,745 92.6
30-34 1,006,702 507,720 498,982 101.8
35-39 945,870 465,729 480,140 97.0
40-44 568,878 299,009 269,869 110.8
45-49 477,925 233,108 244,817 95.2
50-54 381,120 176,523 204,597 86.3
55-59 269,995 118,356 151,640 78.1
60-64 239,219 103,804 135,416 76.7
65+ 554,280 252,690 301,589 83.8
Created by PDF Generator (http://www.alientools.com/), to remove this mark, please buy the software.

Created by PDF Generator (http://www.alientools.com/), to remove this mark, please buy the software.

CHAPTER IV
ECONOMIC ACTIVITY STATUS
4.1 Introduction
Statistical data on the economic activity status of a population is essential for planning
and formulating policies for better utilization of human resources of a country. The
economic activity status indicates the size and distribution of the work force of
economically active and not active population during a given reference period at a
specified area.
A wide range of information was collected on economic activity status of all persons aged
five years and above in the 2012 UEUS. For the purpose of gathering information about
the economic activities of children, the lower age limit was fixed at five years and hence
data were collected from persons aged five years and above. However, for measuring the
economic activity status of the population those persons aged ten years and above were
included in the analysis.
The 2012 Urban Employment and Unemployment Survey administered detailed labour
force questions to measure the economic activity status of persons in urban areas of the
country. These includes:-
a) whether persons were engaged in economic / productive activities in the last
seven days prior to the survey date or reasons for not being engaged;
b) whether persons were looking for work or will be available for work in the
coming one month or reason for not being available during the reference
period;
c) whether persons were engaged in economic / productive activities during
most of the last six months or reasons for not being engaged.
Created by PDF Generator (http://www.alientools.com/), to remove this mark, please buy the software.
Every person aged ten years and above in the sampled household was asked if he/she
was engaged in any productive activities during the last seven days, and in the last six
months prior to the survey date. Based on the response obtained from respondents, the
economic activity status of the population was determined by using the standard
definitions of economic and non economic activities.
The 2012 Urban Employment and Unemployment Survey followed the ILO international
standard definitions of economic and non-economic activities. The concept of economic
activity as adopted by the 13th International Conference on Labour Statistics (ICLS,1982)
is defined as the production of goods and/or services that falls within the United Nations
System of National Accounts (SNA) production boundary (ILO, 1990). In this survey,
economic/ productive activity is defined as work, which involves the production of goods
and /or services for sale or exchange. In addition, production of goods and services for
own consumption or own uses are also considered as economic activities. These include
production of primary products (agriculture, hunting, fishing, forestry and logging, mining
and quarrying), for own consumption; processing of primary products by the producers
themselves; production of other commodities where part of it is sold on the market; and
own account construction and fixed asset formation (expected life use of one year or
more). Such economic activities could be performed for an individual, family or private
enterprise, government establishment or social organization. The remuneration may be
on daily, weekly, monthly, yearly or contract basis. The practical activities of apprentices
are also considered as economic activities. On the other hand, unpaid household chores
such as preparing food, cleaning the house, taking care of children are not considered as
economic activities. Similarly, unpaid community and volunteer services are classified as
non-economic activities.
Based on the ILO definitions of economic and non economic activities, data on economic
activity status of persons aged ten years and above was collected in the survey. Persons
who were engaged in productive work /employed/ or available to be engaged
/unemployed/ during the reference period are considered as economically active
persons. While those persons who were neither engaged nor available to be engaged in
Created by PDF Generator (http://www.alientools.com/), to remove this mark, please buy the software.
the production of economic goods and services during the reference period are
considered as economically not active or inactive population.
4.2 Data Collection Approaches of the Economic Activity Status of Urban
Population
the 2012 Urban Employment and Unemployment Survey, two approaches were used in
the collection of data about the economic activity status of urban population. These are
current and usual activity status approaches. The main difference between these two
approaches is the length of the reference period.
4.2.1 Current Activity Status Approach
The current activity status approach measures the economic activity status of a person
based on a short reference period of seven days before the date of interview. In this
approach, all persons aged ten years and above who were engaged in productive work
or available to be engaged during the reference week were considered as currently
economically active while those who were neither engaged nor available to be engaged
in productive work were taken as currently economically not active.
4.2.2 Usual Activity Status Approach
The usual activity status approach measures the economic activity status of a person
based on a long reference period of the six months prior to the date of interview. In the
usual activity status approach, all persons aged ten years and above who were
engaged in productive works or available to be engaged in the production of economic
goods and/or services during most of the six months were classified as usually
economically active. Those who were neither employed nor unemployed in most of the
six months categorized as economically not active.
Created by PDF Generator (http://www.alientools.com/), to remove this mark, please buy the software.

The choice of appropriate economic activity status measurement approach depends on
the extent of variability of economic activities of the population during a specified period
of time in the study area. In the rural areas seasonal variation of activities is common. In
order to collect economic activity status of the rural population including the slack and
peak periods of agricultural activities, a longer reference period (usual activity status
approach) is found to be more appropriate. On the other hand, in urban areas, activities
are relatively less affected by seasonal variations and hence shorter reference period or
current activity status approach is found to be more convenient. But in this survey, both
approaches were used to collect data on economic activity status of urban population.
This chapter presents the economic activity status, size and distribution of economically
active and not active population, activity rate, and reasons for being inactive of urban
population aged ten years and above using only the current status approach at national,
regional and major town level.
4.3 Current Activity Status
As mentioned above, current activity status approach measures the economic activity
status of a person in a short reference period, that is, the seven days prior to the date of
the interview. In this approach a series of inquiries were administered to determine the
economic activity status of the population during the reference week such as
engagement in economic activity, attachment to jobs, seeking and availability to work,
reason for not seeking or available to work, etc., These questions were presented to
those persons aged five years and above. But the responses of persons aged ten years
and above were used to classify the population into three mutually exclusive categories:
employed, unemployed, and not in the labour force (non-active). The employed and the
unemployed population together constitute the labour force or the currently
economically active population. The third category, those who were not in the labour
force are called currently not active population.
Created by PDF Generator (http://www.alientools.com/), to remove this mark, please buy the software.

As part of the economically active population, employed population consists of persons
aged ten years and above who engaged in a productive activity or work at least for four
hours during the seven days prior to the date of the interview. In addition, persons who
had regular jobs, or business, or holdings to return to but who were temporarily absent
from work (not at work or worked less than four hours) for various reasons such as
illness or injury, holiday or vacation, strike or lockout, and seasonality of work, annual
leave, temporary closure of establishment were also considered as employed. For a
person to be considered as absent from work, he/she must have formal attachment to
the job.
The currently unemployed population also comprises those persons without work but
looking for work or available and ready to work if any job is found during the reference
period of the coming one month. The reference period of the coming one month refers
to the survey week plus the next three weeks. If a person who is looking for work but
engaged in productive activity during the reference week is recorded as employed but
not as unemployed.
4.4 Economically Active and Not active Population and Activity Rate
Based on the above definition of economic activity status, the number of economically
active population including employed and unemployed persons, population not active
and activity rates of urban population aged ten years and above at national and regional
level is presented by sex and age group in Table 4.1 and Table 4.1.1- 4.1.11 using the
current status approach, respectively. Besides, the economic activity status and activity
rate of selected major towns’ population aged ten years and above is also presented in
Table 4.2.
The extent of the economic participation of the population is measured using economic
activity rates. Economic activity rate or economic participation rate is computed as the
percentage of the economically active population over the total of active plus not active
Created by PDF Generator (http://www.alientools.com/), to remove this mark, please buy the software.

population aged ten years and above. The national estimate shows that 62.5 percent of
the population aged ten years and above were economically active (Table 4.1). With
respect to sex, the activity rate of male is 69.7 percent and the corresponding female
activity rate is 56.2 percent. The age distributions of activity rate illustrates that it is low
up to age 20, but steadily rise and reaches its peak in age 34, and then after declines
(Table 4.1).
As far as the economic activity status of major towns’ population is concerned, 62.4
percent of the populations were economically active while the remaining 37.6 percent
were found economically not active. In terms of sex, the activity rate of male was higher
by 14.3 percent than female. Among the major towns, the highest activity rate was
recorded in Bahir Dar town (70.4 percent) while the lowest was in Gambella town (50.0
percent) (Table 4.2).
The size of economically active and not active population has its own implication on the
development of the local as well as the national economy of a region. The high activity
rate of a population implies the prevalence of huge potential of the human resource or
human labour that foster sustainable economic development. On the other hand, the
low economic activity rate also implies the lack of adequate and trained human labour
or the existence of large number of economically non-productive population which has
no contribution for development at the time. Hence, the economic activity rate of urban
population of the Ethiopia can be viewed from these perspectives.
The distribution of economically not active population of urban areas at national and
regional level by age group, sex and reason for not being economically active (for those
who were neither engaged nor available and/ or seeking work) during the last seven
days are presented in Table 4.3 and Table 4.4, respectively. The reasons for not looking
for or available to work include; student/training, home making / domestic work,
pregnancy, injury / disability, illness, too young, old age /pensioned… etc. The result in
Table 4.3 shows that the lion share of the population not active were students (66.4
percent). The remaining not active population (33.6 percent) comprises home makers,
old aged, youngsters, and injured / disabled, remitted, and other persons.
Created by PDF Generator (http://www.alientools.com/), to remove this mark, please buy the software.

Table 4.1 Urban population Aged Ten Years and above by Age Group, Sex,Activity Status and Rate during the Last Seven Days (Current StatusApproach)- COUNTRY TOTAL: 2012
Activity StatusEconomically ActiveAge Group
and SexAll
PersonsEmployed Unemployed Total Active
EconomicallyNot Active
ActivityRate
All AgesTotal 11,110,653 5,726,116 1,218,574 6,944,691 4,165,962 62.5Male 5,186,014 3,202,042 410,381 3,612,423 1,573,590 69.7Female 5,924,639 2,524,074 808,193 3,332,267 2,592,372 56.2
10-14Total 1,592,162 195,567 24,618 220,185 1,371,977 13.8Male 754,662 94,187 11,787 105,974 648,689 14.0Female 837,500 101,380 12,831 114,211 723,289 13.6
15-19Total 1,752,372 492,071 136,069 628,140 1,124,233 35.8Male 754,648 205,515 51,396 256,911 497,736 34.0Female 997,725 286,556 84,673 371,228 626,496 37.2
20-24Total 1,707,114 902,304 361,492 1,263,796 443,318 74.0Male 743,495 457,454 127,407 584,861 158,634 78.7Female 963,619 444,850 234,085 678,935 284,684 70.5
25-29Total 1,615,015 1,128,487 268,787 1,397,273 217,742 86.5Male 776,270 653,525 79,619 733,144 43,126 94.4Female 838,745 474,962 189,168 664,129 174,616 79.2
30-34Total 1,006,702 767,262 128,378 895,639 111,063 89.0Male 507,720 448,530 39,484 488,015 19,705 96.1Female 498,982 318,731 88,893 407,624 91,357 81.7
35-39Total 945,870 742,001 98,500 840,501 105,369 88.9Male 465,729 423,955 26,203 450,158 15,571 96.7Female 480,140 318,046 72,297 390,343 89,797 81.3
40-44Total 568,878 445,655 58,078 503,733 65,145 88.5Male 299,009 273,476 16,589 290,065 8,944 97.0Female 269,869 172,179 41,489 213,668 56,201 79.2
45-49Total 477,925 361,687 43,186 404,873 73,052 84.7Male 233,108 211,592 12,716 224,308 8,799 96.2Female 244,817 150,094 30,470 180,565 64,252 73.8
50-54Total 381,120 266,025 36,225 302,251 78,870 79.3Male 176,523 153,598 12,971 166,568 9,955 94.4Female 204,597 112,428 23,254 135,682 68,915 66.3
55-59Total 269,995 152,584 24,471 177,055 92,940 65.6Male 118,356 96,469 9,677 106,145 12,210 89.7Female 151,640 56,115 14,794 70,910 80,730 46.8
60-64Total 239,219 113,615 18,566 132,181 107,038 55.3Male 103,804 75,221 8,023 83,244 20,560 80.2Female 135,416 38,393 10,544 48,937 86,479 36.1
65+Total 554,280 158,859 20,205 179,064 375,215 32.3Male 252,690 108,519 14,510 123,030 129,661 48.7Female 301,589 50,340 5,694 56,035 245,555 18.6
Created by PDF Generator (http://www.alientools.com/), to remove this mark, please buy the software.

Table 4.1.1 Urban population Aged Ten Years and above by Age Group, Sex,Activity Status and Rate during the Last Seven Days (Current StatusApproach)- TIGRAY REGION: 2012
Activity StatusEconomically ActiveAge Group
and SexAll
PersonsEmployed Unemployed Total Active
EconomicallyNot Active
ActivityRate
All AgesTotal 794,578 391,891 94,756 486,647 307,931 61.2Male 344,053 204,483 25,996 230,478 113,574 67.0Female 450,525 187,408 68,761 256,169 194,356 56.9
10-14Total 107,902 7,272 603 7,875 100,027 7.3Male 52,790 3,165 281 3,445 49,345 6.5Female 55,112 4,107 323 4,430 50,682 8.0
15-19Total 139,083 36,408 12,014 48,422 90,662 34.8Male 56,861 13,795 4,398 18,193 38,667 32.0Female 82,223 22,613 7,615 30,229 51,994 36.8
20-24Total 125,551 65,371 30,545 95,916 29,635 76.4Male 46,449 28,440 9,254 37,694 8,756 81.2Female 79,102 36,931 21,291 58,222 20,880 73.6
25-29Total 114,701 79,187 23,393 102,580 12,121 89.4Male 48,065 41,064 5,335 46,399 1,666 96.5Female 66,636 38,123 18,059 56,181 10,455 84.3
30-34Total 67,877 53,581 8,462 62,043 5,834 91.4Male 34,111 31,791 1,365 33,157 955 97.2Female 33,766 21,790 7,097 28,887 4,879 85.5
35-39Total 60,067 47,215 6,513 53,728 6,339 89.4Male 28,032 26,320 1,480 27,800 232 99.2Female 32,036 20,895 5,033 25,928 6,107 80.9
40-44Total 34,911 27,380 4,051 31,431 3,481 90.0Male 18,240 16,618 1,298 17,916 324 98.2Female 16,672 10,762 2,753 13,515 3,157 81.1
45-49Total 30,600 21,678 3,210 24,888 5,712 81.3Male 12,166 10,994 630 11,624 542 95.5Female 18,434 10,684 2,580 13,264 5,170 72.0
50-54Total 25,692 18,603 1,941 20,545 5,147 80.0Male 11,299 10,153 536 10,689 610 94.6Female 14,393 8,450 1,406 9,856 4,537 68.5
55-59Total 19,663 11,114 1,290 12,404 7,258 63.1Male 6,742 6,098 254 6,352 389 94.2Female 12,921 5,016 1,036 6,052 6,869 46.8
60-64Total 21,192 11,191 1,506 12,696 8,496 59.9Male 8,015 7,009 434 7,443 573 92.9Female 13,177 4,182 1,072 5,254 7,923 39.9
65+Total 47,337 12,892 1,227 14,119 33,218 29.8Male 21,284 9,035 732 9,768 11,516 45.9Female 26,053 3,856 495 4,351 21,702 16.7
Created by PDF Generator (http://www.alientools.com/), to remove this mark, please buy the software.

Table 4.1.2 Urban population Aged Ten Years and above by Age Group, Sex,Activity Status and Rate during the Last Seven Days (Current StatusApproach)- AFFAR REGION: 2012
Activity StatusEconomically ActiveAge Group
and SexAll
PersonsEmployed Unemployed Total Active
EconomicallyNot Active
ActivityRate
All AgesTotal 127,674 77,068 9,846 86,914 40,759 68.1Male 61,116 43,657 2,425 46,082 15,034 75.4Female 66,557 33,411 7,421 40,832 25,726 61.3
10-14Total 19,920 4,132 227 4,358 15,561 21.9Male 9,600 1,607 - 1,607 7,993 16.7Female 10,319 2,524 227 2,751 7,568 26.7
15-19Total 15,019 5,365 684 6,049 8,971 40.3Male 6,525 2,749 311 3,060 3,466 46.9Female 8,494 2,616 372 2,989 5,505 35.2
20-24Total 15,774 8,848 2,455 11,302 4,471 71.7Male 6,978 5,305 506 5,811 1,167 83.3Female 8,796 3,542 1,949 5,491 3,305 62.4
25-29Total 19,941 14,868 2,266 17,134 2,806 85.9Male 8,868 8,055 559 8,613 254 97.1Female 11,073 6,814 1,707 8,521 2,552 77.0
30-34Total 13,870 10,723 1,173 11,896 1,974 85.8Male 6,672 5,868 409 6,277 395 94.1Female 7,197 4,856 763 5,619 1,578 78.1
35-39Total 12,365 10,217 1,203 11,420 944 92.4Male 6,305 6,090 48 6,138 168 97.3Female 6,059 4,127 1,156 5,282 777 87.2
40-44Total 10,893 8,664 856 9,520 1,373 87.4Male 5,096 4,753 343 5,096 - 100.0Female 5,797 3,911 513 4,424 1,373 76.3
45-49Total 6,757 5,664 541 6,205 552 91.8Male 3,608 3,549 12 3,561 48 98.7Female 3,149 2,115 529 2,645 504 84.0
50-54Total 4,766 3,636 406 4,042 724 84.8Male 2,711 2,376 201 2,578 133 95.1Female 2,055 1,259 204 1,464 591 71.2
55-59Total 2,813 1,838 12 1,850 962 65.8Male 1,163 984 12 996 168 85.6Female 1,649 855 - 855 795 51.8
60-64Total 2,373 1,976 12 1,988 385 83.8Male 1,378 1,256 12 1,268 110 92.0Female 995 720 - 720 275 72.3
65+Total 3,185 1,137 12 1,149 2,036 36.1Male 2,210 1,066 12 1,077 1,133 48.8Female 975 72 - 72 903 7.4
Created by PDF Generator (http://www.alientools.com/), to remove this mark, please buy the software.

Table 4.1.3 Urban population Aged Ten Years and above by Age Group, Sex,Activity Status and Rate during the Last Seven Days (Current StatusApproach)- AMHARA REGION: 2012
Activity StatusEconomically ActiveAge Group
and SexAll
PersonsEmployed Unemployed Total Active
EconomicallyNot Active
ActivityRate
All AgesTotal 1,976,070 1,063,958 209,533 1,273,491 702,578 64.4Male 890,049 562,815 68,229 631,044 259,005 70.9Female 1,086,021 501,144 141,304 642,448 443,573 59.2
10-14Total 282,456 46,894 4,505 51,398 231,057 18.2Male 127,488 20,712 3,900 24,611 102,877 19.3Female 154,967 26,182 605 26,787 128,180 17.3
15-19Total 318,539 106,615 27,257 133,872 184,667 42.0Male 145,969 50,539 9,267 59,806 86,164 41.0Female 172,570 56,076 17,990 74,067 98,503 42.9
20-24Total 318,284 171,226 75,607 246,832 71,452 77.6Male 128,423 80,185 25,276 105,461 22,962 82.1Female 189,861 91,040 50,331 141,371 48,490 74.5
25-29Total 277,108 201,112 42,132 243,244 33,865 87.8Male 128,579 111,705 12,342 124,047 4,532 96.5Female 148,529 89,407 29,790 119,197 29,333 80.3
30-34Total 151,672 124,150 14,303 138,453 13,220 91.3Male 75,368 68,031 4,394 72,425 2,944 96.1Female 76,304 56,119 9,909 66,028 10,276 86.5
35-39Total 158,480 122,684 15,404 138,088 20,392 87.1Male 73,725 65,070 3,790 68,859 4,865 93.4Female 84,756 57,615 11,614 69,229 15,527 81.7
40-44Total 87,769 67,780 8,239 76,018 11,751 86.6Male 44,189 40,336 2,165 42,501 1,688 96.2Female 43,580 27,444 6,074 33,517 10,063 76.9
45-49Total 92,767 72,389 8,004 80,393 12,373 86.7Male 42,951 39,013 2,388 41,401 1,550 96.4Female 49,815 33,376 5,617 38,992 10,823 78.3
50-54Total 74,978 53,685 4,470 58,155 16,823 77.6Male 29,271 26,813 849 27,663 1,608 94.5Female 45,707 26,871 3,621 30,492 15,215 66.7
55-59Total 53,720 32,020 4,782 36,802 16,918 68.5Male 20,891 17,775 1,438 19,213 1,679 92.0Female 32,828 14,245 3,344 17,589 15,239 53.6
60-64Total 43,478 24,872 1,192 26,064 17,414 59.9Male 21,274 16,883 520 17,403 3,870 81.8Female 22,204 7,989 672 8,661 13,543 39.0
65+Total 116,818 40,532 3,639 44,171 72,647 37.8Male 51,920 25,753 1,901 27,654 24,266 53.3Female 64,897 14,779 1,738 16,516 48,381 25.4
Created by PDF Generator (http://www.alientools.com/), to remove this mark, please buy the software.

Table 4.1.4 Urban population Aged Ten Years and above by Age Group, Sex,Activity Status and Rate during the Last Seven Days (Current StatusApproach)- OROMIA REGION: 2012
Activity StatusEconomically ActiveAge Group
and SexAll
PersonsEmployed Unemployed Total Active
EconomicallyNot Active
ActivityRate
All AgesTotal 3,131,966 1,643,077 330,723 1,973,800 1,158,165 63.0Male 1,522,509 963,543 115,759 1,079,302 443,207 70.9Female 1,609,457 679,534 214,964 894,498 714,959 55.6
10-14Total 499,611 62,670 11,148 73,818 425,793 14.8Male 244,631 35,683 4,801 40,484 204,146 16.5Female 254,981 26,987 6,347 33,334 221,647 13.1
15-19Total 497,405 133,755 48,172 181,928 315,477 36.6Male 226,258 68,607 18,526 87,134 139,124 38.5Female 271,147 65,148 29,646 94,794 176,353 35.0
20-24Total 502,385 283,346 104,073 387,419 114,966 77.1Male 234,894 159,428 37,409 196,837 38,057 83.8Female 267,491 123,918 66,664 190,582 76,909 71.2
25-29Total 444,847 316,724 71,304 388,028 56,819 87.2Male 228,652 197,210 20,499 217,709 10,942 95.2Female 216,196 119,514 50,804 170,318 45,877 78.8
30-34Total 273,528 217,268 27,749 245,017 28,511 89.6Male 134,872 122,380 7,981 130,361 4,511 96.7Female 138,656 94,888 19,768 114,656 24,001 82.7
35-39Total 275,890 226,653 25,353 252,006 23,883 91.3Male 142,624 131,824 7,634 139,458 3,166 97.8Female 133,266 94,829 17,720 112,549 20,717 84.5
40-44Total 150,776 123,199 12,715 135,914 14,862 90.1Male 79,002 72,172 4,353 76,525 2,477 96.9Female 71,774 51,027 8,362 59,389 12,385 82.7
45-49Total 127,777 103,373 6,515 109,887 17,889 86.0Male 69,919 65,656 2,268 67,925 1,995 97.1Female 57,857 37,716 4,246 41,963 15,894 72.5
50-54Total 92,024 64,589 8,771 73,360 18,664 79.7Male 41,791 36,871 3,292 40,164 1,628 96.1Female 50,232 27,718 5,479 33,196 17,036 66.1
55-59Total 70,754 43,710 5,573 49,283 21,470 69.7Male 32,993 28,330 1,953 30,283 2,710 91.8Female 37,761 15,380 3,620 19,000 18,761 50.3
60-64Total 61,110 27,111 4,515 31,626 29,485 51.8Male 28,702 19,414 3,166 22,581 6,121 78.7Female 32,409 7,697 1,348 9,045 23,364 27.9
65+Total 135,860 40,679 4,835 45,514 90,346 33.5Male 58,172 25,966 3,876 29,842 28,330 51.3Female 77,688 14,713 960 15,672 62,016 20.2
Created by PDF Generator (http://www.alientools.com/), to remove this mark, please buy the software.

Table 4.1.5 Urban population Aged Ten Years and above by Age Group, Sex,Activity Status and Rate during the Last Seven Days (Current StatusApproach)- SOMALI REGION: 2012
Activity StatusEconomically ActiveAge Group
and SexAll
PersonsEmployed Unemployed Total Active
EconomicallyNot Active
ActivityRate
All AgesTotal 433,866 202,547 34,427 236,974 196,892 54.6Male 214,968 111,869 12,124 123,994 90,974 57.7Female 218,898 90,677 22,302 112,980 105,918 51.6
10-14Total 92,168 12,450 1,683 14,132 78,036 15.3Male 52,286 6,972 680 7,652 44,634 14.6Female 39,882 5,478 1,003 6,481 33,402 16.2
15-19Total 72,665 17,659 4,557 22,217 50,448 30.6Male 37,256 7,161 2,056 9,216 28,040 24.7Female 35,409 10,499 2,502 13,000 22,408 36.7
20-24Total 50,357 23,737 7,604 31,341 19,016 62.2Male 22,021 12,792 1,741 14,533 7,487 66.0Female 28,337 10,945 5,863 16,808 11,529 59.3
25-29Total 47,996 28,029 6,470 34,499 13,496 71.9Male 20,569 15,908 1,775 17,684 2,885 86.0Female 27,427 12,121 4,695 16,816 10,611 61.3
30-34Total 39,534 28,916 3,417 32,334 7,200 81.8Male 16,223 14,810 875 15,686 537 96.7Female 23,311 14,106 2,542 16,648 6,663 71.4
35-39Total 33,748 25,187 3,641 28,827 4,921 85.4Male 16,019 14,303 1,369 15,672 346 97.8Female 17,730 10,883 2,272 13,155 4,575 74.2
40-44Total 31,822 24,280 2,510 26,791 5,032 84.2Male 15,441 13,340 1,153 14,493 948 93.9Female 16,381 10,940 1,357 12,298 4,083 75.1
45-49Total 15,432 12,559 1,075 13,634 1,798 88.3Male 8,720 8,141 372 8,512 208 97.6Female 6,712 4,418 704 5,122 1,590 76.3
50-54Total 16,384 10,959 2,008 12,967 3,417 79.1Male 8,324 6,255 1,203 7,457 867 89.6Female 8,060 4,704 805 5,509 2,551 68.4
55-59Total 6,637 4,475 543 5,019 1,618 75.6Male 3,802 3,049 229 3,278 523 86.2Female 2,835 1,426 314 1,740 1,095 61.4
60-64Total 9,736 6,570 830 7,400 2,336 76.0Male 5,343 4,128 584 4,712 631 88.2Female 4,393 2,442 246 2,688 1,705 61.2
65+Total 17,386 7,724 88 7,812 9,574 44.9Male 8,964 5,009 88 5,097 3,867 56.9Female 8,422 2,715 - 2,715 5,707 32.2
Created by PDF Generator (http://www.alientools.com/), to remove this mark, please buy the software.

Table 4.1.6 Urban population Aged Ten Years and above by Age Group, Sex,Activity Status and Rate during the Last Seven Days (Current StatusApproach)- BENISHANGUL- GUMUZ REGION: 2012
Activity StatusEconomically ActiveAge Group
and SexAll
PersonsEmployed Unemployed Total Active
EconomicallyNot Active
ActivityRate
All AgesTotal 111,784 72,518 5,505 78,024 33,760 69.8Male 55,116 39,854 1,897 41,751 13,365 75.8Female 56,668 32,664 3,609 36,273 20,395 64.0
10-14Total 16,948 4,905 - 4,905 12,043 28.9Male 8,487 2,252 - 2,252 6,235 26.5Female 8,461 2,653 - 2,653 5,808 31.4
15-19Total 21,192 9,040 901 9,941 11,251 46.9Male 9,435 3,944 562 4,507 4,928 47.8Female 11,758 5,096 339 5,435 6,323 46.2
20-24Total 16,117 10,926 1,846 12,772 3,345 79.2Male 6,818 5,274 568 5,842 976 85.7Female 9,299 5,652 1,278 6,930 2,369 74.5
25-29Total 15,425 13,202 891 14,093 1,332 91.4Male 8,363 7,909 340 8,249 114 98.6Female 7,062 5,293 551 5,843 1,219 82.7
30-34Total 9,605 8,311 442 8,753 852 91.1Male 4,251 4,051 147 4,197 54 98.7Female 5,354 4,260 295 4,555 798 85.1
35-39Total 9,626 8,322 614 8,937 689 92.8Male 4,686 4,620 66 4,686 - 100.0Female 4,940 3,702 548 4,250 689 86.1
40-44Total 6,375 5,608 459 6,067 307 95.2Male 4,231 4,050 103 4,153 77 98.2Female 2,144 1,558 356 1,914 230 89.3
45-49Total 4,542 4,220 63 4,283 258 94.3Male 2,754 2,730 24 2,754 - 100.0Female 1,788 1,490 40 1,530 258 85.6
50-54Total 2,868 2,542 107 2,649 219 92.4Male 1,269 1,269 - 1,269 - 100.0Female 1,599 1,273 107 1,380 219 86.3
55-59Total 2,041 1,789 33 1,822 219 89.3Male 1,230 1,197 33 1,230 - 100.0Female 810 592 - 592 219 73.0
60-64Total 2,214 1,306 95 1,401 813 63.3Male 840 811 - 811 28 96.6Female 1,375 495 95 590 784 42.9
65+Total 4,831 2,346 53 2,400 2,432 49.7Male 2,753 1,746 53 1,799 954 65.4Female 2,078 600 - 600 1,478 28.9
Created by PDF Generator (http://www.alientools.com/), to remove this mark, please buy the software.

Table 4.1.7 Urban population Aged Ten Years and above by Age Group, Sex,Activity Status and Rate during the Last Seven Days (Current StatusApproach)- SNNP REGION: 2012
Activity StatusEconomically ActiveAge Group
and SexAll
PersonsEmployed Unemployed Total Active
EconomicallyNot Active
ActivityRate
All AgesTotal 1,531,368 837,386 119,176 956,562 574,806 62.5Male 743,394 466,330 40,404 506,734 236,660 68.2Female 787,974 371,057 78,771 449,828 338,146 57.1
10-14Total 263,019 42,829 3,566 46,395 216,624 17.6Male 120,319 19,185 628 19,812 100,506 16.5Female 142,701 23,644 2,938 26,582 116,118 18.6
15-19Total 272,312 80,799 12,899 93,698 178,615 34.4Male 115,837 33,118 5,855 38,973 76,864 33.6Female 156,475 47,681 7,044 54,724 101,751 35.0
20-24Total 226,337 131,432 36,312 167,744 58,592 74.1Male 112,224 70,414 13,773 84,187 28,037 75.0Female 114,113 61,018 22,540 83,558 30,555 73.2
25-29Total 209,680 160,140 27,120 187,260 22,419 89.3Male 110,082 96,043 7,899 103,942 6,141 94.4Female 99,597 64,097 19,221 83,319 16,279 83.7
30-34Total 136,023 108,830 13,033 121,863 14,160 89.6Male 72,101 65,815 4,344 70,160 1,942 97.3Female 63,922 43,015 8,688 51,703 12,218 80.9
35-39Total 125,953 104,541 8,881 113,422 12,531 90.1Male 56,987 54,629 1,698 56,327 660 98.8Female 68,966 49,912 7,182 57,095 11,871 82.8
40-44Total 82,153 70,376 4,519 74,895 7,258 91.2Male 45,930 44,177 1,232 45,409 521 98.9Female 36,223 26,199 3,287 29,486 6,737 81.4
45-49Total 59,963 49,333 3,177 52,509 7,453 87.6Male 29,788 27,665 1,007 28,672 1,117 96.3Female 30,174 21,667 2,170 23,838 6,337 79.0
50-54Total 43,200 36,324 3,479 39,803 3,397 92.1Male 25,912 23,720 1,491 25,212 700 97.3Female 17,288 12,604 1,988 14,591 2,697 84.4
55-59Total 26,231 17,952 1,916 19,868 6,364 75.7Male 12,426 10,996 616 11,612 814 93.5Female 13,806 6,956 1,300 8,256 5,550 59.8
60-64Total 25,259 13,973 1,815 15,789 9,470 62.5Male 8,696 6,628 601 7,229 1,467 83.1Female 16,563 7,345 1,215 8,560 8,003 51.7
65+Total 61,238 20,857 2,460 23,317 37,921 38.1Male 33,091 13,939 1,262 15,200 17,891 45.9Female 28,147 6,919 1,198 8,117 20,030 28.8
Created by PDF Generator (http://www.alientools.com/), to remove this mark, please buy the software.
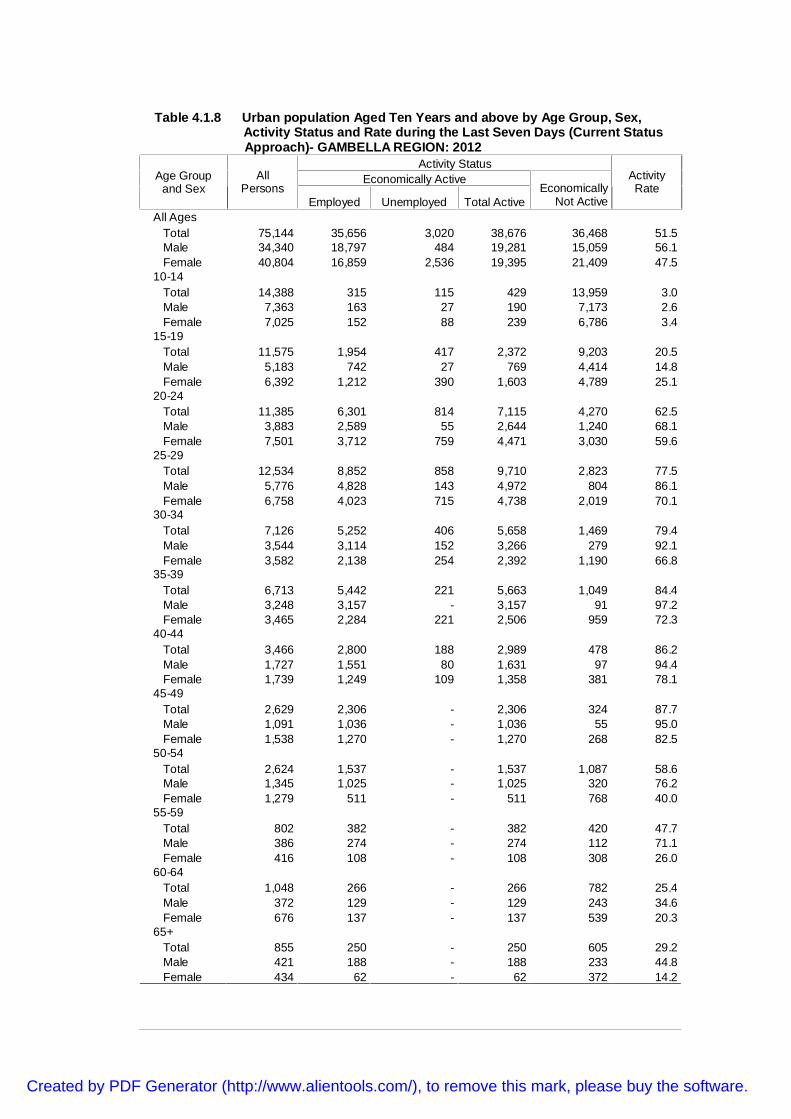
Table 4.1.8 Urban population Aged Ten Years and above by Age Group, Sex,Activity Status and Rate during the Last Seven Days (Current StatusApproach)- GAMBELLA REGION: 2012
Activity StatusEconomically ActiveAge Group
and SexAll
PersonsEmployed Unemployed Total Active
EconomicallyNot Active
ActivityRate
All AgesTotal 75,144 35,656 3,020 38,676 36,468 51.5Male 34,340 18,797 484 19,281 15,059 56.1Female 40,804 16,859 2,536 19,395 21,409 47.5
10-14Total 14,388 315 115 429 13,959 3.0Male 7,363 163 27 190 7,173 2.6Female 7,025 152 88 239 6,786 3.4
15-19Total 11,575 1,954 417 2,372 9,203 20.5Male 5,183 742 27 769 4,414 14.8Female 6,392 1,212 390 1,603 4,789 25.1
20-24Total 11,385 6,301 814 7,115 4,270 62.5Male 3,883 2,589 55 2,644 1,240 68.1Female 7,501 3,712 759 4,471 3,030 59.6
25-29Total 12,534 8,852 858 9,710 2,823 77.5Male 5,776 4,828 143 4,972 804 86.1Female 6,758 4,023 715 4,738 2,019 70.1
30-34Total 7,126 5,252 406 5,658 1,469 79.4Male 3,544 3,114 152 3,266 279 92.1Female 3,582 2,138 254 2,392 1,190 66.8
35-39Total 6,713 5,442 221 5,663 1,049 84.4Male 3,248 3,157 - 3,157 91 97.2Female 3,465 2,284 221 2,506 959 72.3
40-44Total 3,466 2,800 188 2,989 478 86.2Male 1,727 1,551 80 1,631 97 94.4Female 1,739 1,249 109 1,358 381 78.1
45-49Total 2,629 2,306 - 2,306 324 87.7Male 1,091 1,036 - 1,036 55 95.0Female 1,538 1,270 - 1,270 268 82.5
50-54Total 2,624 1,537 - 1,537 1,087 58.6Male 1,345 1,025 - 1,025 320 76.2Female 1,279 511 - 511 768 40.0
55-59Total 802 382 - 382 420 47.7Male 386 274 - 274 112 71.1Female 416 108 - 108 308 26.0
60-64Total 1,048 266 - 266 782 25.4Male 372 129 - 129 243 34.6Female 676 137 - 137 539 20.3
65+Total 855 250 - 250 605 29.2Male 421 188 - 188 233 44.8Female 434 62 - 62 372 14.2
Created by PDF Generator (http://www.alientools.com/), to remove this mark, please buy the software.

Table 4.1.9 Urban population Aged Ten Years and above by Age Group, Sex,Activity Status and Rate during the Last Seven Days (Current StatusApproach)- HARARI REGION: 2012
Activity StatusEconomically ActiveAge Group
and SexAll
PersonsEmployed Unemployed Total Active
EconomicallyNot Active
ActivityRate
All AgesTotal 87,661 49,969 6,973 56,942 30,719 65.0Male 41,096 26,901 2,086 28,987 12,109 70.5Female 46,566 23,068 4,887 27,955 18,610 60.0
10-14Total 11,438 557 - 557 10,881 4.9Male 5,782 325 - 325 5,457 5.6Female 5,656 231 - 231 5,425 4.1
15-19Total 11,174 2,870 548 3,418 7,756 30.6Male 4,885 1,058 151 1,209 3,676 24.7Female 6,290 1,812 398 2,210 4,080 35.1
20-24Total 10,243 6,489 1,591 8,080 2,163 78.9Male 4,385 3,054 692 3,746 640 85.4Female 5,858 3,435 899 4,334 1,524 74.0
25-29Total 11,207 8,966 1,218 10,184 1,023 90.9Male 5,722 5,127 248 5,375 348 93.9Female 5,485 3,839 970 4,809 676 87.7
30-34Total 9,509 7,415 1,152 8,567 942 90.1Male 4,300 3,905 245 4,151 150 96.5Female 5,209 3,510 907 4,417 792 84.8
35-39Total 8,241 6,850 948 7,798 443 94.6Male 4,545 4,093 205 4,298 247 94.6Female 3,696 2,757 743 3,500 196 94.7
40-44Total 5,006 4,377 240 4,617 389 92.2Male 2,519 2,322 44 2,367 152 94.0Female 2,487 2,055 196 2,250 237 90.5
45-49Total 5,047 3,823 392 4,216 831 83.5Male 2,403 2,216 49 2,265 138 94.2Female 2,644 1,607 343 1,951 693 73.8
50-54Total 4,171 3,129 196 3,325 846 79.7Male 1,865 1,661 49 1,709 156 91.6Female 2,306 1,469 147 1,616 690 70.1
55-59Total 3,943 2,672 369 3,040 903 77.1Male 1,604 1,382 222 1,604 - 100.0Female 2,339 1,290 147 1,436 903 61.4
60-64Total 1,872 1,104 49 1,153 719 61.6Male 862 723 - 723 138 83.9Female 1,010 381 49 430 581 42.5
65+Total 5,809 1,716 271 1,987 3,822 34.2Male 2,222 1,033 182 1,215 1,008 54.7Female 3,587 683 89 772 2,815 21.5
Created by PDF Generator (http://www.alientools.com/), to remove this mark, please buy the software.
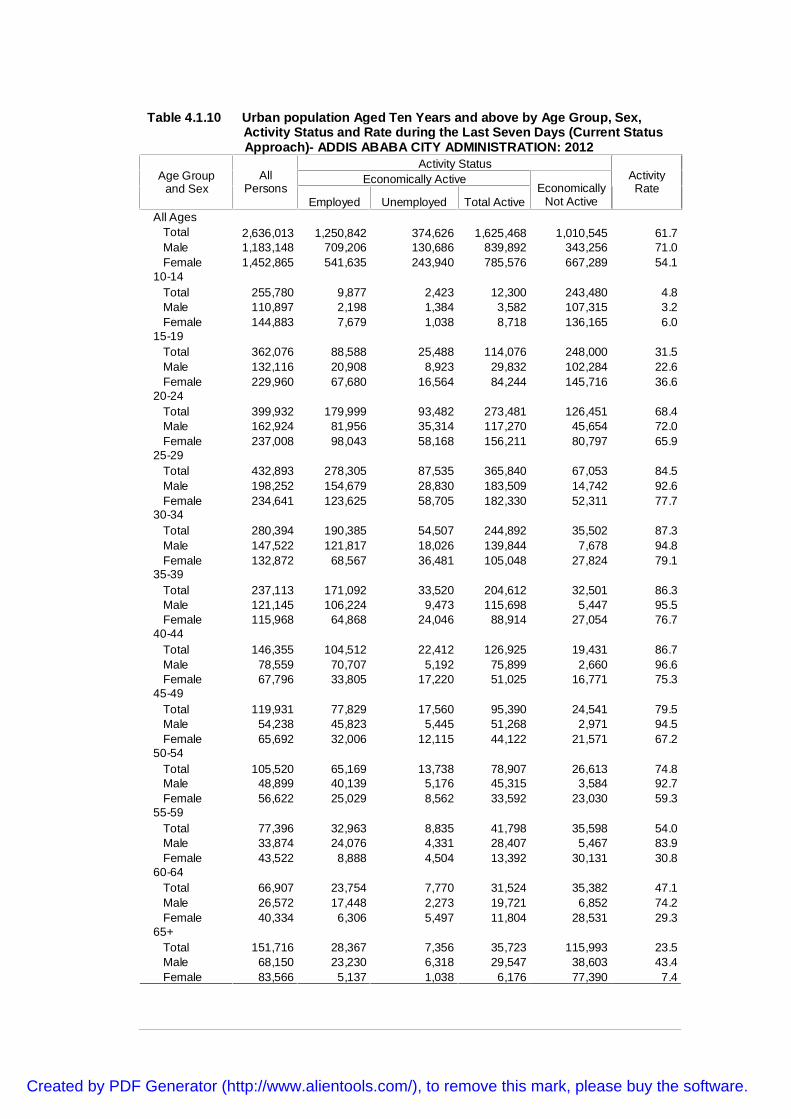
Table 4.1.10 Urban population Aged Ten Years and above by Age Group, Sex,Activity Status and Rate during the Last Seven Days (Current StatusApproach)- ADDIS ABABA CITY ADMINISTRATION: 2012
Activity StatusEconomically ActiveAge Group
and SexAll
PersonsEmployed Unemployed Total Active
EconomicallyNot Active
ActivityRate
All AgesTotal 2,636,013 1,250,842 374,626 1,625,468 1,010,545 61.7Male 1,183,148 709,206 130,686 839,892 343,256 71.0Female 1,452,865 541,635 243,940 785,576 667,289 54.1
10-14Total 255,780 9,877 2,423 12,300 243,480 4.8Male 110,897 2,198 1,384 3,582 107,315 3.2Female 144,883 7,679 1,038 8,718 136,165 6.0
15-19Total 362,076 88,588 25,488 114,076 248,000 31.5Male 132,116 20,908 8,923 29,832 102,284 22.6Female 229,960 67,680 16,564 84,244 145,716 36.6
20-24Total 399,932 179,999 93,482 273,481 126,451 68.4Male 162,924 81,956 35,314 117,270 45,654 72.0Female 237,008 98,043 58,168 156,211 80,797 65.9
25-29Total 432,893 278,305 87,535 365,840 67,053 84.5Male 198,252 154,679 28,830 183,509 14,742 92.6Female 234,641 123,625 58,705 182,330 52,311 77.7
30-34Total 280,394 190,385 54,507 244,892 35,502 87.3Male 147,522 121,817 18,026 139,844 7,678 94.8Female 132,872 68,567 36,481 105,048 27,824 79.1
35-39Total 237,113 171,092 33,520 204,612 32,501 86.3Male 121,145 106,224 9,473 115,698 5,447 95.5Female 115,968 64,868 24,046 88,914 27,054 76.7
40-44Total 146,355 104,512 22,412 126,925 19,431 86.7Male 78,559 70,707 5,192 75,899 2,660 96.6Female 67,796 33,805 17,220 51,025 16,771 75.3
45-49Total 119,931 77,829 17,560 95,390 24,541 79.5Male 54,238 45,823 5,445 51,268 2,971 94.5Female 65,692 32,006 12,115 44,122 21,571 67.2
50-54Total 105,520 65,169 13,738 78,907 26,613 74.8Male 48,899 40,139 5,176 45,315 3,584 92.7Female 56,622 25,029 8,562 33,592 23,030 59.3
55-59Total 77,396 32,963 8,835 41,798 35,598 54.0Male 33,874 24,076 4,331 28,407 5,467 83.9Female 43,522 8,888 4,504 13,392 30,131 30.8
60-64Total 66,907 23,754 7,770 31,524 35,382 47.1Male 26,572 17,448 2,273 19,721 6,852 74.2Female 40,334 6,306 5,497 11,804 28,531 29.3
65+Total 151,716 28,367 7,356 35,723 115,993 23.5Male 68,150 23,230 6,318 29,547 38,603 43.4Female 83,566 5,137 1,038 6,176 77,390 7.4
Created by PDF Generator (http://www.alientools.com/), to remove this mark, please buy the software.

Table 4.1.11 Urban population Aged Ten Years and above by Age Group, Sex,Activity Status and Rate during the Last Seven Days (Current StatusApproach)- DIRE DAWA ADMINISTRATION: 2012
Activity StatusEconomically ActiveAge Group
and SexAll
PersonsEmployed Unemployed Total Active
EconomicallyNot Active
ActivityRate
All AgesTotal 204,530 101,204 29,988 131,192 73,338 64.1Male 96,225 54,588 10,291 64,878 31,347 67.4Female 108,305 46,617 19,697 66,314 41,990 61.2
10-14Total 28,533 3,668 348 4,016 24,517 14.1Male 15,019 1,925 87 2,012 13,007 13.4Female 13,514 1,743 262 2,005 11,509 14.8
15-19Total 31,331 9,016 3,132 12,148 19,183 38.8Male 14,323 2,894 1,320 4,213 10,109 29.4Female 17,008 6,122 1,812 7,934 9,074 46.7
20-24Total 30,749 14,629 7,164 21,793 8,956 70.9Male 14,495 8,016 2,820 10,836 3,659 74.8Female 16,254 6,613 4,345 10,957 5,297 67.4
25-29Total 28,683 19,103 5,599 24,701 3,982 86.1Male 13,343 10,996 1,649 12,645 698 94.8Female 15,341 8,106 3,950 12,056 3,284 78.6
30-34Total 17,563 12,430 3,735 16,164 1,399 92.0Male 8,754 6,947 1,545 8,493 262 97.0Female 8,809 5,482 2,189 7,671 1,137 87.1
35-39Total 17,675 13,798 2,201 15,999 1,675 90.5Male 8,414 7,625 440 8,065 350 95.8Female 9,260 6,173 1,762 7,935 1,325 85.7
40-44Total 9,350 6,678 1,888 8,566 784 91.6Male 4,075 3,449 626 4,075 - 100.0Female 5,275 3,229 1,262 4,491 784 85.1
45-49Total 12,481 8,513 2,648 11,161 1,320 89.4Male 5,468 4,769 523 5,292 176 96.8Female 7,013 3,744 2,125 5,869 1,144 83.7
50-54Total 8,894 5,853 1,109 6,962 1,932 78.3Male 3,837 3,314 173 3,487 350 90.9Female 5,057 2,539 935 3,475 1,582 68.7
55-59Total 5,996 3,668 1,118 4,785 1,211 79.8Male 3,245 2,307 588 2,895 350 89.2Female 2,751 1,361 529 1,890 861 68.7
60-64Total 4,030 1,491 783 2,274 1,756 56.4Male 1,750 791 434 1,224 525 70.0Female 2,280 700 350 1,049 1,231 46.0
65+Total 9,244 2,359 263 2,622 6,622 28.4Male 3,502 1,554 87 1,641 1,861 46.9Female 5,742 805 176 981 4,761 17.1
Created by PDF Generator (http://www.alientools.com/), to remove this mark, please buy the software.

Table 4.2 Populations of Major Towns Aged Ten Years and Above by Sex, Activity Statusand Rate during the Last Seven Days (Current Status Approach): 2012
Activity Status
Economically ActiveActivityRateMajor Towns and Sex All
PersonsEmployed Unemployed Total Active
EconomicallyNot Active
MAJOR TOWNS TOTALTotal 4,509,970 2,212,903 602,000 2,814,902 1,695,068 62.4Male 2,049,041 1,240,813 197,663 1,438,476 610,565 70.2Female 2,460,930 972,089 404,337 1,376,426 1,084,503 55.9
MEKELE TOWNTotal 241,332 121,116 29,944 151,060 90,272 62.6Male 105,549 65,727 7,951 73,678 31,872 69.8Female 135,783 55,389 21,993 77,382 58,401 57.0
ASAYITA TOWNTotal 13,612 8,369 849 9,218 4,394 67.7Male 6,540 4,624 286 4,910 1,630 75.1Female 7,072 3,745 564 4,309 2,764 60.9
GONDER TOWNTotal 181,710 97,868 18,392 116,260 65,450 64.0Male 81,795 51,748 5,780 57,528 24,268 70.3Female 99,915 46,121 12,612 58,732 41,182 58.8
DESSIE TOWNTotal 102,107 47,543 13,755 61,298 40,809 60.0Male 45,608 26,410 4,136 30,546 15,062 67.0Female 56,499 21,133 9,618 30,752 25,747 54.4
BAHIR DAR TOWNTotal 163,850 93,781 21,606 115,388 48,462 70.4Male 71,488 46,806 5,672 52,479 19,009 73.4Female 92,362 46,975 15,934 62,909 29,453 68.1
BISHOFTU TOWNTotal 84,864 41,284 15,052 56,336 28,528 66.4Male 39,579 23,681 4,901 28,582 10,997 72.2Female 45,285 17,602 10,151 27,753 17,531 61.3
ADAMA TOWNTotal 191,245 92,946 29,899 122,846 68,399 64.2Male 90,429 55,237 8,097 63,334 27,095 70.0Female 100,816 37,709 21,802 59,511 41,304 59.0
JIMMA TOWNTotal 106,414 59,065 11,711 70,776 35,638 66.5Male 50,853 33,607 3,449 37,056 13,797 72.9Female 55,561 25,458 8,263 33,720 21,841 60.7
SHASHEMENE TOWNTotal 99,036 45,485 14,606 60,090 38,945 60.7Male 47,497 28,269 4,098 32,367 15,130 68.1Female 51,539 17,216 10,508 27,723 23,816 53.8
JIJIGA TOWNTotal 97,536 40,942 9,476 50,418 47,118 51.7Male 45,624 23,990 2,558 26,548 19,075 58.2Female 51,912 16,952 6,918 23,870 28,042 46.0
ASOSA TOWNTotal 30,002 17,931 2,189 20,119 9,883 67.1Male 14,734 10,159 803 10,962 3,772 74.4Female 15,268 7,772 1,385 9,157 6,111 60.0
Created by PDF Generator (http://www.alientools.com/), to remove this mark, please buy the software.

Table 4.2 Cont’d
Activity StatusEconomically ActiveMajor Towns and Sex All
PersonsEmployed Unemployed Total Active
EconomicallyNot Active
ActivityRate
HAWASSA TOWNTotal 232,077 127,071 21,428 148,499 83,578 64.0Male 110,817 70,534 6,539 77,073 33,744 69.5Female 121,260 56,537 14,889 71,426 49,835 58.9
GAMBELLA TOWNTotal 37,981 17,486 1,506 18,992 18,989 50.0Male 18,059 9,326 330 9,656 8,402 53.5Female 19,923 8,160 1,176 9,336 10,587 46.9
HARAR TOWNTotal 87,661 49,969 6,973 56,942 30,719 65.0Male 41,096 26,901 2,086 28,987 12,109 70.5Female 46,566 23,068 4,887 27,955 18,610 60.0
ADDIS ABABA CITYADMINISTRATION
Total 2,636,013 1,250,842 374,626 1,625,468 1,010,545 61.7Male 1,183,148 709,206 130,686 839,892 343,256 71.0Female 1,452,865 541,635 243,940 785,576 667,289 54.1
DIRE DAWA TOWNTotal 204,530 101,204 29,988 131,192 73,338 64.1Male 96,225 54,588 10,291 64,878 31,347 67.4Female 108,305 46,617 19,697 66,314 41,990 61.2
Created by PDF Generator (http://www.alientools.com/), to remove this mark, please buy the software.

Table 4.3 Economically Not Active Population of Urban Areas Aged Ten Years and Above by Age Group, Sex and ReasonBeing Active During the Last Seven Days (Current Status Approach) - COUNTRY TOTAL: 2012
Reasons for Not Being ActiveAge Group andsex Economically
Not ActiveHomeMaker Pregnancy Student
Injury/Disabled Illness
TooYoung Remittance
All AgesTotal 4,165,962 421,945 135,069 2,768,241 29,723 236,712 43,283 58,921Male 1,573,590 11,959 - 1,296,597 16,573 77,009 20,484 14,008Female 2,592,372 409,986 135,069 1,471,644 13,149 159,703 22,799 44,913
10-14Total 1,371,977 16,140 - 1,299,633 3,027 5,650 43,283 1,457Male 648,689 1,223 - 619,005 2,468 3,247 20,484 1,100Female 723,289 14,917 - 680,628 559 2,403 22,799 357
15-19Total 1,124,233 32,873 18,191 1,042,688 2,736 13,951 - 3,204Male 497,736 2,827 - 483,478 1,267 4,956 - 1,089Female 626,496 30,046 18,191 559,211 1,469 8,995 - 2,115
20-24Total 443,318 66,164 42,890 302,637 2,441 15,859 - 3,902Male 158,634 1,859 - 145,463 965 6,347 - 635Female 284,684 64,305 42,890 157,175 1,476 9,513 - 3,266
25-29Total 217,742 68,234 43,493 66,450 3,294 17,250 - 7,739Male 43,126 1,115 - 30,801 2,004 5,408 - 1,454Female 174,616 67,119 43,493 35,649 1,290 11,843 - 6,285
30-34Total 111,063 49,188 16,553 14,374 1,189 17,751 - 4,021Male 19,705 1,153 - 5,411 458 8,802 - 1,219Female 91,357 48,035 16,553 8,963 731 8,949 - 2,801
35-39Total 105,369 51,575 9,931 7,795 2,783 19,697 - 7,759Male 15,571 1,458 - 2,149 2,272 6,078 - 1,062Female 89,797 50,117 9,931 5,647 511 13,619 - 6,697
40-44Total 65,145 29,638 3,690 4,802 1,782 15,884 - 4,176Male 8,944 346 - 1,375 979 4,263 - 688Female 56,201 29,292 3,690 3,427 803 11,620 - 3,488
Created by PDF Generator (http://www.alientools.com/), to remove this mark, please buy the software.

Table 4.3 Cont’dReasons for Not Being ActiveAge Group and
sex EconomicallyNot Active
HomeMaker Pregnancy Student
Injury/Disabled Illness
TooYoung Remittance
45-49Total 73,052 32,392 322 6,681 1,936 22,227 - 4,902Male 8,799 906 - 1,088 550 5,435 - 517Female 64,252 31,486 322 5,593 1,386 16,792 - 4,385
50-54Total 78,870 28,923 - 3,022 1,776 18,813 - 3,102Male 9,955 962 - 523 1,609 3,137 - 275Female 68,915 27,961 - 2,499 167 15,677 - 2,828
55-59Total 92,940 20,371 - 4,437 2,377 23,237 - 2,088Male 12,210 - - - 272 4,946 - 725Female 80,730 20,371 - 4,437 2,105 18,291 - 1,363
60-64Total 107,038 12,341 - 2,596 1,988 26,616 - 5,830Male 20,560 - - 613 716 6,741 - 1,039Female 86,479 12,341 - 1,983 1,272 19,875 - 4,791
65+Total 375,215 14,106 - 13,124 4,391 39,776 - 10,742Male 129,661 109 - 6,691 3,013 17,649 - 4,204Female 245,555 13,997 - 6,433 1,378 22,127 - 6,537
Created by PDF Generator (http://www.alientools.com/), to remove this mark, please buy the software.

Table 4.4 Economically Not Active population of Urban Areas Aged Ten Years and Above by Region, Sex and Reasonsfor Not Being Active during the Last Seven Days (Current Status Approach): 2012
Reason for Not Being ActiveRegion and Sex
TotalHomeMaker Pregnancy Student
Injury/Disabled Illness
TooYoung Remittance
Old age/Pensioned
COUNTRY TOTALTotal 4,165,962 421,945 135,069 2,767,894 29,723 236,712 45,216 58,921 401,648Male 1,573,590 11,959 - 1,296,251 16,573 77,009 21,908 14,008 116,613Female 2,592,372 409,986 135,069 1,471,644 13,149 159,703 23,307 44,913 285,036
TIGRAY REGIONTotal 307,931 31,382 9,387 201,239 1,136 24,290 1,899 3,319 32,035Male 113,574 389 - 94,522 606 6,008 1,091 743 9,875Female 194,356 30,993 9,387 106,717 530 18,282 808 2,577 22,161
AFFAR REGIONTotal 40,759 6,200 2,921 25,418 371 2,618 50 985 1,826Male 15,034 37 - 12,254 59 1,556 38 144 790Female 25,726 6,162 2,921 13,164 311 1,062 12 841 1,036
AMHARA REGIONTotal 702,578 78,293 21,309 451,137 8,997 51,677 3,535 9,482 68,642Male 259,005 684 - 209,443 4,176 17,085 1,102 1,530 19,989Female 443,573 77,609 21,309 241,694 4,820 34,592 2,432 7,952 48,653
OROMIA REGIONTotal 1,158,165 114,973 40,751 793,554 8,411 62,747 16,589 13,127 94,646Male 443,207 3,604 - 373,065 4,794 23,078 8,713 2,693 23,855Female 714,959 111,368 40,751 420,489 3,616 39,669 7,875 10,434 70,791
SOMALI REGIONTotal 196,892 30,156 6,246 132,034 1,227 7,657 3,591 3,488 10,229Male 90,974 749 - 78,064 916 3,246 2,594 1,515 2,419Female 105,918 29,406 6,246 53,970 310 4,411 997 1,973 7,810
BENISHANGULGUMUZ REGION
Total 33,760 2,237 1,426 25,694 53 1,296 169 407 2,294Male 13,365 - - 11,964 - 447 169 31 68Female 20,395 2,237 1,426 13,730 53 850 - 375 1,611
SNNP REGIONTotal 574,806 46,771 14,632 429,687 4,223 20,859 10,196 7,410 35,855Male 236,660 1,241 - 203,539 3,081 7,704 4,329 1,643 14,080Female 338,146 45,531 14,632 226,148 1,142 13,155 5,868 5,767 21,775
Created by PDF Generator (http://www.alientools.com/), to remove this mark, please buy the software.

Table 4.4 Cont’dReason for Not Being Active
Region and SexTotal
HomeMaker Pregnancy Student
Injury/Disabled Illness
TooYoung Remittance
Old age/Pensioned
GAMBELLA REGIONTotal 36,468 3,495 1,264 26,941 208 957 130 1,833 1,446Male 15,059 127 - 13,343 27 451 35 589 459Female 21,409 3,367 1,264 13,598 181 505 96 1,244 987
HARARI REGIONTotal 30,719 3,122 528 19,804 299 2,910 98 503 3,192Male 12,109 89 - 9,874 54 1,145 - 49 732Female 18,610 3,033 528 9,930 244 1,765 98 454 2,461
ADDIS ABABA CITYADMINISTRATION
Total 1,010,545 99,377 32,973 614,920 4,357 57,040 7,475 16,286 145,260Male 343,256 4,950 - 264,370 2,685 14,437 3,229 4,725 41,963Female 667,289 94,427 32,973 350,550 1,672 42,603 4,246 11,562 103,296
DIRE DAWAADMINISTRATION
Total 73,338 5,939 3,632 47,466 444 4,660 1,483 2,081 6,223Male 31,347 87 - 25,813 173 1,851 608 347 1,769Female 41,990 5,853 3,632 21,654 270 2,809 875 1,734 4,454
Created by PDF Generator (http://www.alientools.com/), to remove this mark, please buy the software.
CHAPTER V
CHARACTERISTICS OF THE CURRENTLY URBAN EMPLOYED POPULATION
5. 1. Introduction
The previous chapter has defined the economically active population to be the sum of
the employed and the unemployed population. This chapter presents statistical data
on the size, distribution and characteristics of the currently employed population based
on the definition given in chapter IV. The survey has collected the following information
regarding the characteristics of the currently employed population:
a) Main type of occupation;
b) Main product or service of the establishment or industry;
c) Employment status of the main activity and terms of employment;
d) Reasons for absence from work for those employed persons who worked less
than four hours or does not work at all but have formal job attachment during the
reference period;
e) Amount of earnings from paid employees;
f) Hours worked per week and
g) Whether employed persons were available or seeking to work additional hours.
h) Sector of the economy (Formal or informal employment sector);
5.2. Employment to Population Ratio
According to the 18 Key Indicators of Labour Market (KILM) used by the ILO,
employment to population ratio is calculated as a percentage of total employed
persons to that of the working age population (ILO, 1999). The distribution of
employment to population ratio of urban areas of each region by age group and sex is
shown in Table 5.1. The data for employment to population ratio each selected major
towns by age group and sex is presented in Table 5.2.
Created by PDF Generator (http://www.alientools.com/), to remove this mark, please buy the software.

5.3. Occupation and Industry
In this survey, the currently employed persons were asked about the type of main
activity or occupation and major product or service of the establishment or industry in
which they were engaged during the survey reference period. The questions used to
identify the type of occupation and industry, were left open ended so that they will be
filled in with the fullest description and its code in the field. For those employed
persons engaged in multiple activities, the activity that took the largest share of the
respondents’ time was taken as the main type of activity.
The responses of the descriptions and codes for the type of occupation and industry
filled in by enumerators were further checked and edited at the head quarters using
the National Occupational and Industrial Classifications (NOIC) code-book. The NOIC
codes were adopted from the International Standard Classification of Occupation
(ISCO-88) and International Standard Industrial Classification (ISIC, 1993) by taking
into account the prevailing national socio-economic conditions.
The NOIC uses a 3-digit coding systems corresponding to 3 level classifications in
successively finer detail. In the cases of occupation and industry, the levels are
ordered as major divisions, sub major divisions, and minor divisions. The occupational
classification was categorized into 9 major groups, 28 sub major groups and 113 minor
groups. The industrial classification contains, 13, 60 and 159 major, sub major and
minor divisions, respectively.
The distribution of employed population of urban areas by major occupational groups,
age group and sex for the country total and each region is presented in Table 5.3 and
5.4, respectively. Table 5.5 presents the distribution of employed population by major
occupation, sex for each selected major towns. The distribution of employed
population by minor occupational groups for each region classified by sex appears in
Table 5.6. One should note that in Table 5.6 and 5.10 major and sub major occupation
and industrial classification are written in capital letter, while minor occupation and
Created by PDF Generator (http://www.alientools.com/), to remove this mark, please buy the software.

industrial classification are written in small letter, respectively. Analogous information,
which deals with the industrial divisions are also shown in Table 5.7 to 5.10.
5.4. Employment Status
Employment status of a person indicates the level of involvement and degree of
decision-making in his main activity. In this survey employed persons were asked
about the employment status of their main activity which was classified into: employer,
paid employees, self-employed, unpaid family worker, apprentice, and member’s of
producers, cooperative and others categories. Paid employees were further
disaggregated into employees-government, employees government parastatal,
employees NGO's, employees private organization, employees domestic and other
paid employees.
Table 5.11 and Table 5.12 present the distribution of status in employment by age
group and sex for urban areas of country and each region. The distribution of status in
employment for major towns classified by sex is presented in Tables 5.13. Table 5.14
contains data on major occupational groups cross classified by major industrial
divisions and sex for urban areas of the country total. The status in employment by
major industrial divisions and sex for a country total is shown in Table 5.15. Also, the
figures for status in employment classified by major occupation and sex for country
total are presented in Table 5.16.
5.5. Number of Hours worked
The absence of standard working hours and irregular nature of working days in the
informal sectors or in the self employment, data collection as well as getting accurate
data on hours of work were found to be difficult. In addition, the reliability of the data
collection is likely to be affected due to memory lapse and lack of knowledge or
information about the concepts of time on the part of the respondent. Thus,
considering the inherent data collection problem on hours of work in developing
Created by PDF Generator (http://www.alientools.com/), to remove this mark, please buy the software.

countries, the figures presented in these tables should be regarded as indicative and
not the true levels of intensity of work.
The 2012 Urban Employment and Unemployment Survey included questions on the
number of hours worked for two purposes. First, the response on the number of hours
worked during the seven days prior to the date of the interview is used to classify the
respondents as employed or not on the basis of the given criteria of the minimum
required hours of work. As described in Chapter IV, persons who worked at least four
hours or more, and those who were not worked or worked less than 4 hours but had a
job to return to were considered as employed. The rest of persons were then
subjected to other filtering questions for unemployment and inactivity. The second
objective of including questions on number of hours worked was to gather data on
intensity of work among the employed population.
In this survey, all persons who were engaged in productive activities during the seven
days prior to the date of interview were asked to provide the number of hours they
worked in all of their productive activities. The response was recorded for each of the
days in a separate notebook so as to get the total actual hours of work during the
reference week. Then the hours so obtained were added together for the week and
finally filled in the main questionnaire.
According to the resolution concerning statistics on hours actually worked that adopted
by the tenth ICLS in 1962 (ILO, 1976), in this survey, the hours actually worked
included:
a) Hours actually worked during normal periods of work and time spent for waiting
for the market;
b) Time worked in addition to hours worked during normal periods of work, and
generally paid at higher rates than normal rates (overtime);
c) Time spent at place of work on activities such as the preparation of the work
place; repairing maintenance, preparing and cleaning of tools and others;
d) Time spent at the place of work waiting or standing by for such reasons as lack
of supply of work, break down of machinery, or accidents, or time spent at the
Created by PDF Generator (http://www.alientools.com/), to remove this mark, please buy the software.

place of wok during which no work is done but for which payment is made
under a guaranteed employment contract and
e) Time corresponding to short rest periods at the work place including tea and
coffee breaks;
According to the resolution in recording the number of hours worked, care was taken
to exclude hours paid for but not worked, such as paid annual leave, paid public
holidays or paid sick leave. Also excluded are meal breaks, time spent on travel from
home to work and vice versa /for those who have specified place of work/, and hours
spent on household activities that were not considered as productive. For employed
persons who were not at work during the seven days prior to the date of interview, the
number of hours of work is recorded as zero. On the other hand, any time that
employed persons have spent in productive activity in places other than work site is
considered as working hour.
Table 5.17 presents the distribution of the number of hours worked during the last
seven days by age group and sex at country urban level. Similarly, the distribution for
each region classified by sex appears in Table 5.18. The distribution of number of
hours worked by major industrial divisions, major occupation, and status in
employment for country total disaggregated by sex are shown in Table 5.19, 5.20 and
5.21, in that order.
5.6. Earning from Paid Employment
Paid employment jobs are those jobs where the employees hold explicit (written or
oral) or implicit employment contracts, which give them a basic remuneration. Some or
all of the tools, capitals equipment, information systems and/or premises used by the
employees may be owned by others, and the employees may work under direct
supervision or according to the strict guidelines set by the owner(s) or persons in the
owners’ employment. Persons in “paid employment” jobs are typically remunerated by
wages and salaries, but may be paid by commission from sales, by piece rates,
bonuses or in kind payments such as food, housing or clothing. In this survey,
Created by PDF Generator (http://www.alientools.com/), to remove this mark, please buy the software.

earnings for paid employees refer to gross remuneration and include bonus, overtime,
allowances and other benefits that are obtained only from the main job.
Table 5.22 shows the distribution of paid employees disaggregated by types of
payment and sex for urban areas of each region. The distribution of paid employees in
urban areas by sex and period of payment and sex at country level is presented in
Table 5.23. The distribution of paid employees in urban areas of the country classified
by amount and period of payment and sex is presented in table 5.24. Paid employees
of urban areas of the country by major industrial divisions, sex and amount of payment
per month has also shown in Table 5.25.
5.7. Absence from Work
Employed persons that were considered to be absent from work were those who were
not engaged in any productive activity or who work less than four hours during the
seven days prior to the date of the interview but have formal job attachment. These
persons were asked their main reason for being absent from work. Reasons for
absence from work was classified as illness, holiday /vacation, Training/education, off-
season, reduction in economic activity and “others” categories. The data presented in
Table 5.26 indicates the distribution of employed population for their reasons for being
absent from work by region and sex.
5.8. Availability to Work Additional Hours
This survey collected data on time related under employment in an attempt to capture
the insufficiency of the hours of work of employed persons in relation to an alternative
employment situation in which persons are willing and available to be engaged in. The
response of employed persons depending on their availability and readiness or not to
work for additional hours was coded as “yes” or “no”. The response for additional
hours available could be for another job (jobs) in addition to the current job; replacing
Created by PDF Generator (http://www.alientools.com/), to remove this mark, please buy the software.

any of current jobs by another job with increased hours of work or longer time on the
current job.
The distribution of employed population whether they were available or ready to work
additional hours for urban areas of the country by age group and sex is shown in Table
5.27. Table 5.28 shows distribution of employed persons who sought or available to
work additional hours together with the actual number of hours worked by age group
and sex for the total urban areas of the country. Table 5.29 present the distribution of
urban employed population of each region who were sought or available to work
additional hours classified by type of work sought or available for and sex.
5.9. Formal and Informal Employment Sectors of the Economic Activity
For statistical purposes, the informal sector is regarded as a group of production units,
which according to the definitions and classification provided in the United Nation
System of National Accounts (SNA Rev.4), form part of the household sector as
household enterprises or, equivalently, unincorporated enterprises owned by
households. The informal sector is defined irrespective of the kind of work place where
the productive activities are carried out, the extent of fixed capital used, the duration of
the enterprise and its operation as main or secondary activity of the owner.
The figures here were not referring to the whole employed population. In this survey,
according to the 15th ICLS recommendations, those employed persons who were
engaged in subsistence farming and work in private households were exempted from
the analysis of the formal and informal sectors of the economic activity.
This survey includes questions to identify the employment sector of the economy and
some of the characteristics in which the employed persons are engaged in their main
activity. However, employed persons whose employment status were classified as
employee-government, employee-government parasitatal, employee-non-
governmental organization, or members of producers’ cooperative were not
Created by PDF Generator (http://www.alientools.com/), to remove this mark, please buy the software.

necessary to ask such questions related to the activities of their sectors because they
were considered as formal and later classified as being working in the formal sector.
On the other hand, other employed persons whose employment status were employer,
employee of private organization, self employed, and apprentice were asked the
following questions whether the business /enterprise they were engaged in,
a) has a book of account that shows the monthly income statement
and balance sheet; or
b) has business/enterprise license.
Based on the response to these three questions classification on sector of economy
was made as: formal, informal or “not – identified”. Employed persons who satisfy at
least one of the above conditions were considered as working in the formal sector. For
those who respond “no” for all of the three questions, the activity was taken as
informal. For those who don't know the situation about their main
activity/business/enterprise with respect to the above questions was labeled as “not –
identified”.
Table 5.30 presents the distribution of employed population of urban areas of the
country in relation to the sector of the economy classified by age group and sex. The
distribution of employed population by sector of economy, region and sex is presented
in 5.31. Similar information for selected major town is shown in Table 5.32. Table
5.33-5.37 presents the cross classification of the informal sector by sex and region by
some of the selected variables, such as major occupation and branches of economic
sector, educational attainment, size of workers and type of working place. The
distribution of informal sector by type of difficulties they faced during their work at
national level is also given in Table 5.38. The last Table 5.39 has shown the
distribution of total employed population by Mean number of hours worked with major
branches of economic sector in each region and sex.
Created by PDF Generator (http://www.alientools.com/), to remove this mark, please buy the software.

Table 5.1 Urban Population Aged Ten Years and Above by Region, Age Group, Sex andEmployment to Population Ratio - 2012
Total Population Total Employed population Employment to PopulationRatioRegion and
Age GroupTotal Male Female Total Male Female Total Male Female
COUNTRY TOTALAll Ages 11,110,653 5,186,014 5,924,639 5,726,116 3,202,042 2,524,074 51.5 61.7 42.610-14 1,592,162 754,662 837,500 195,567 94,187 101,380 12.3 12.5 12.115-19 1,752,372 754,648 997,725 492,071 205,515 286,556 28.1 27.2 28.720-24 1,707,114 743,495 963,619 902,304 457,454 444,850 52.9 61.5 46.225-29 1,615,015 776,270 838,745 1,128,487 653,525 474,962 69.9 84.2 56.630-34 1,006,702 507,720 498,982 767,262 448,530 318,731 76.2 88.3 63.935-39 945,870 465,729 480,140 742,001 423,955 318,046 78.4 91.0 66.240-44 568,878 299,009 269,869 445,655 273,476 172,179 78.3 91.5 63.845-49 477,925 233,108 244,817 361,687 211,592 150,094 75.7 90.8 61.350-54 381,120 176,523 204,597 266,025 153,598 112,428 69.8 87.0 55.055-59 269,995 118,356 151,640 152,584 96,469 56,115 56.5 81.5 37.060-64 239,219 103,804 135,416 113,615 75,221 38,393 47.5 72.5 28.465+ 554,280 252,690 301,589 158,859 108,519 50,340 28.7 42.9 16.7
TIGRAY REGIONAll Ages 794,578 344,053 450,525 391,891 204,483 187,408 49.3 59.4 41.610-14 107,902 52,790 55,112 7,272 3,165 4,107 6.7 6.0 7.515-19 139,083 56,861 82,223 36,408 13,795 22,613 26.2 24.3 27.520-24 125,551 46,449 79,102 65,371 28,440 36,931 52.1 61.2 46.725-29 114,701 48,065 66,636 79,187 41,064 38,123 69.0 85.4 57.230-34 67,877 34,111 33,766 53,581 31,791 21,790 78.9 93.2 64.535-39 60,067 28,032 32,036 47,215 26,320 20,895 78.6 93.9 65.240-44 34,911 18,240 16,672 27,380 16,618 10,762 78.4 91.1 64.545-49 30,600 12,166 18,434 21,678 10,994 10,684 70.8 90.4 58.050-54 25,692 11,299 14,393 18,603 10,153 8,450 72.4 89.9 58.755-59 19,663 6,742 12,921 11,114 6,098 5,016 56.5 90.5 38.860-64 21,192 8,015 13,177 11,191 7,009 4,182 52.8 87.4 31.765+ 47,337 21,284 26,053 12,892 9,035 3,856 27.2 42.5 14.8
AFFAR REGIONAll Ages 127,674 61,116 66,558 77,068 43,657 33,411 60.4 71.4 50.210-14 19,920 9,600 10,319 4,132 1,607 2,524 20.7 16.7 24.515-19 15,019 6,525 8,494 5,365 2,749 2,616 35.7 42.1 30.820-24 15,774 6,978 8,796 8,848 5,305 3,542 56.1 76.0 40.325-29 19,941 8,868 11,073 14,868 8,055 6,814 74.6 90.8 61.530-34 13,870 6,672 7,197 10,723 5,868 4,856 77.3 87.9 67.535-39 12,365 6,305 6,059 10,217 6,090 4,127 82.6 96.6 68.140-44 10,893 5,096 5,797 8,664 4,753 3,911 79.5 93.3 67.545-49 6,757 3,608 3,149 5,664 3,549 2,115 83.8 98.3 67.250-54 4,766 2,711 2,055 3,636 2,376 1,259 76.3 87.7 61.355-59 2,813 1,163 1,649 1,838 984 855 65.4 84.6 51.860-64 2,373 1,378 995 1,976 1,256 720 83.3 91.2 72.365+ 3,185 2,210 975 1,137 1,066 72 35.7 48.2 7.4
Created by PDF Generator (http://www.alientools.com/), to remove this mark, please buy the software.
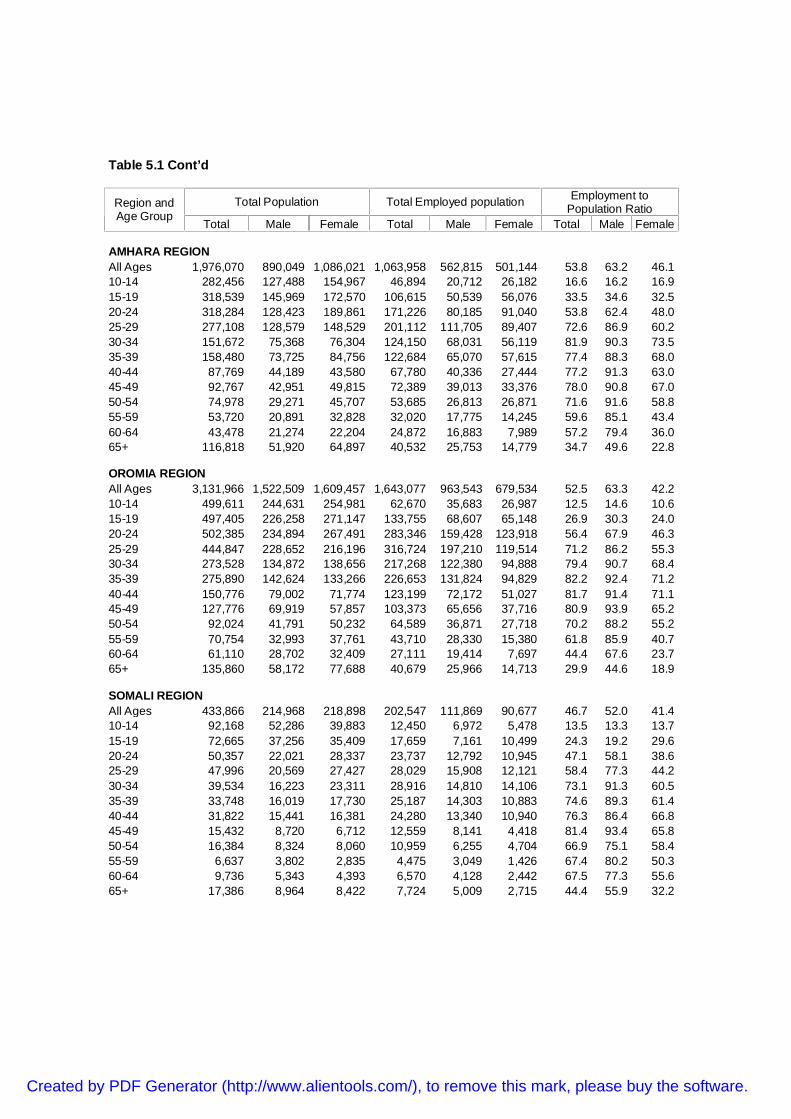
Table 5.1 Cont’d
Total Population Total Employed population Employment toPopulation RatioRegion and
Age GroupTotal Male Female Total Male Female Total Male Female
AMHARA REGIONAll Ages 1,976,070 890,049 1,086,021 1,063,958 562,815 501,144 53.8 63.2 46.110-14 282,456 127,488 154,967 46,894 20,712 26,182 16.6 16.2 16.915-19 318,539 145,969 172,570 106,615 50,539 56,076 33.5 34.6 32.520-24 318,284 128,423 189,861 171,226 80,185 91,040 53.8 62.4 48.025-29 277,108 128,579 148,529 201,112 111,705 89,407 72.6 86.9 60.230-34 151,672 75,368 76,304 124,150 68,031 56,119 81.9 90.3 73.535-39 158,480 73,725 84,756 122,684 65,070 57,615 77.4 88.3 68.040-44 87,769 44,189 43,580 67,780 40,336 27,444 77.2 91.3 63.045-49 92,767 42,951 49,815 72,389 39,013 33,376 78.0 90.8 67.050-54 74,978 29,271 45,707 53,685 26,813 26,871 71.6 91.6 58.855-59 53,720 20,891 32,828 32,020 17,775 14,245 59.6 85.1 43.460-64 43,478 21,274 22,204 24,872 16,883 7,989 57.2 79.4 36.065+ 116,818 51,920 64,897 40,532 25,753 14,779 34.7 49.6 22.8
OROMIA REGIONAll Ages 3,131,966 1,522,509 1,609,457 1,643,077 963,543 679,534 52.5 63.3 42.210-14 499,611 244,631 254,981 62,670 35,683 26,987 12.5 14.6 10.615-19 497,405 226,258 271,147 133,755 68,607 65,148 26.9 30.3 24.020-24 502,385 234,894 267,491 283,346 159,428 123,918 56.4 67.9 46.325-29 444,847 228,652 216,196 316,724 197,210 119,514 71.2 86.2 55.330-34 273,528 134,872 138,656 217,268 122,380 94,888 79.4 90.7 68.435-39 275,890 142,624 133,266 226,653 131,824 94,829 82.2 92.4 71.240-44 150,776 79,002 71,774 123,199 72,172 51,027 81.7 91.4 71.145-49 127,776 69,919 57,857 103,373 65,656 37,716 80.9 93.9 65.250-54 92,024 41,791 50,232 64,589 36,871 27,718 70.2 88.2 55.255-59 70,754 32,993 37,761 43,710 28,330 15,380 61.8 85.9 40.760-64 61,110 28,702 32,409 27,111 19,414 7,697 44.4 67.6 23.765+ 135,860 58,172 77,688 40,679 25,966 14,713 29.9 44.6 18.9
SOMALI REGIONAll Ages 433,866 214,968 218,898 202,547 111,869 90,677 46.7 52.0 41.410-14 92,168 52,286 39,883 12,450 6,972 5,478 13.5 13.3 13.715-19 72,665 37,256 35,409 17,659 7,161 10,499 24.3 19.2 29.620-24 50,357 22,021 28,337 23,737 12,792 10,945 47.1 58.1 38.625-29 47,996 20,569 27,427 28,029 15,908 12,121 58.4 77.3 44.230-34 39,534 16,223 23,311 28,916 14,810 14,106 73.1 91.3 60.535-39 33,748 16,019 17,730 25,187 14,303 10,883 74.6 89.3 61.440-44 31,822 15,441 16,381 24,280 13,340 10,940 76.3 86.4 66.845-49 15,432 8,720 6,712 12,559 8,141 4,418 81.4 93.4 65.850-54 16,384 8,324 8,060 10,959 6,255 4,704 66.9 75.1 58.455-59 6,637 3,802 2,835 4,475 3,049 1,426 67.4 80.2 50.360-64 9,736 5,343 4,393 6,570 4,128 2,442 67.5 77.3 55.665+ 17,386 8,964 8,422 7,724 5,009 2,715 44.4 55.9 32.2
Created by PDF Generator (http://www.alientools.com/), to remove this mark, please buy the software.
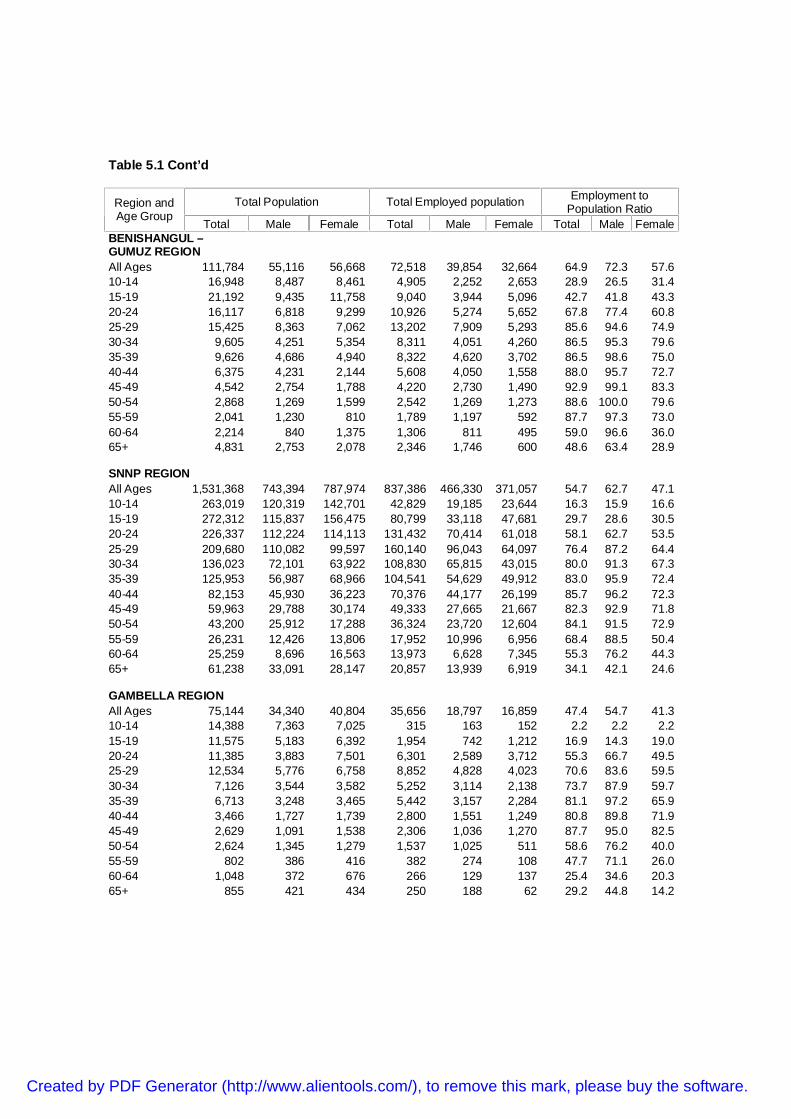
Table 5.1 Cont’d
Total Population Total Employed population Employment toPopulation RatioRegion and
Age GroupTotal Male Female Total Male Female Total Male Female
BENISHANGUL –GUMUZ REGIONAll Ages 111,784 55,116 56,668 72,518 39,854 32,664 64.9 72.3 57.610-14 16,948 8,487 8,461 4,905 2,252 2,653 28.9 26.5 31.415-19 21,192 9,435 11,758 9,040 3,944 5,096 42.7 41.8 43.320-24 16,117 6,818 9,299 10,926 5,274 5,652 67.8 77.4 60.825-29 15,425 8,363 7,062 13,202 7,909 5,293 85.6 94.6 74.930-34 9,605 4,251 5,354 8,311 4,051 4,260 86.5 95.3 79.635-39 9,626 4,686 4,940 8,322 4,620 3,702 86.5 98.6 75.040-44 6,375 4,231 2,144 5,608 4,050 1,558 88.0 95.7 72.745-49 4,542 2,754 1,788 4,220 2,730 1,490 92.9 99.1 83.350-54 2,868 1,269 1,599 2,542 1,269 1,273 88.6 100.0 79.655-59 2,041 1,230 810 1,789 1,197 592 87.7 97.3 73.060-64 2,214 840 1,375 1,306 811 495 59.0 96.6 36.065+ 4,831 2,753 2,078 2,346 1,746 600 48.6 63.4 28.9
SNNP REGIONAll Ages 1,531,368 743,394 787,974 837,386 466,330 371,057 54.7 62.7 47.110-14 263,019 120,319 142,701 42,829 19,185 23,644 16.3 15.9 16.615-19 272,312 115,837 156,475 80,799 33,118 47,681 29.7 28.6 30.520-24 226,337 112,224 114,113 131,432 70,414 61,018 58.1 62.7 53.525-29 209,680 110,082 99,597 160,140 96,043 64,097 76.4 87.2 64.430-34 136,023 72,101 63,922 108,830 65,815 43,015 80.0 91.3 67.335-39 125,953 56,987 68,966 104,541 54,629 49,912 83.0 95.9 72.440-44 82,153 45,930 36,223 70,376 44,177 26,199 85.7 96.2 72.345-49 59,963 29,788 30,174 49,333 27,665 21,667 82.3 92.9 71.850-54 43,200 25,912 17,288 36,324 23,720 12,604 84.1 91.5 72.955-59 26,231 12,426 13,806 17,952 10,996 6,956 68.4 88.5 50.460-64 25,259 8,696 16,563 13,973 6,628 7,345 55.3 76.2 44.365+ 61,238 33,091 28,147 20,857 13,939 6,919 34.1 42.1 24.6
GAMBELLA REGIONAll Ages 75,144 34,340 40,804 35,656 18,797 16,859 47.4 54.7 41.310-14 14,388 7,363 7,025 315 163 152 2.2 2.2 2.215-19 11,575 5,183 6,392 1,954 742 1,212 16.9 14.3 19.020-24 11,385 3,883 7,501 6,301 2,589 3,712 55.3 66.7 49.525-29 12,534 5,776 6,758 8,852 4,828 4,023 70.6 83.6 59.530-34 7,126 3,544 3,582 5,252 3,114 2,138 73.7 87.9 59.735-39 6,713 3,248 3,465 5,442 3,157 2,284 81.1 97.2 65.940-44 3,466 1,727 1,739 2,800 1,551 1,249 80.8 89.8 71.945-49 2,629 1,091 1,538 2,306 1,036 1,270 87.7 95.0 82.550-54 2,624 1,345 1,279 1,537 1,025 511 58.6 76.2 40.055-59 802 386 416 382 274 108 47.7 71.1 26.060-64 1,048 372 676 266 129 137 25.4 34.6 20.365+ 855 421 434 250 188 62 29.2 44.8 14.2
Created by PDF Generator (http://www.alientools.com/), to remove this mark, please buy the software.

Table 5.1 Cont’d
Total Population Total Employed population Employment toPopulation RatioRegion and
Age GroupTotal Male Female Total Male Female Total Male Female
HARARI REGIONAll Ages 87,661 41,096 46,566 49,969 26,901 23,068 57.0 65.5 49.510-14 11,438 5,782 5,656 557 325 231 4.9 5.6 4.115-19 11,174 4,885 6,290 2,870 1,058 1,812 25.7 21.7 28.820-24 10,243 4,385 5,858 6,489 3,054 3,435 63.4 69.6 58.625-29 11,207 5,722 5,485 8,966 5,127 3,839 80.0 89.6 70.030-34 9,509 4,300 5,209 7,415 3,905 3,510 78.0 90.8 67.435-39 8,241 4,545 3,696 6,850 4,093 2,757 83.1 90.1 74.640-44 5,006 2,519 2,487 4,377 2,322 2,055 87.4 92.2 82.645-49 5,047 2,403 2,644 3,823 2,216 1,607 75.8 92.2 60.850-54 4,171 1,865 2,306 3,129 1,661 1,469 75.0 89.0 63.755-59 3,943 1,604 2,339 2,672 1,382 1,290 67.8 86.2 55.160-64 1,872 862 1,010 1,104 723 381 59.0 83.9 37.765+ 5,809 2,222 3,587 1,716 1,033 683 29.5 46.5 19.0
ADDIS ABAB CITYADMINISTRATIONAll Ages 2,636,013 1,183,148 1,452,865 1,250,842 709,206 541,635 47.5 59.9 37.310-14 255,780 110,897 144,883 9,877 2,198 7,679 3.9 2.0 5.315-19 362,076 132,116 229,960 88,588 20,908 67,680 24.5 15.8 29.420-24 399,932 162,924 237,008 179,999 81,956 98,043 45.0 50.3 41.425-29 432,893 198,252 234,641 278,305 154,679 123,625 64.3 78.0 52.730-34 280,394 147,522 132,872 190,385 121,817 68,567 67.9 82.6 51.635-39 237,113 121,145 115,968 171,092 106,224 64,868 72.2 87.7 55.940-44 146,355 78,559 67,796 104,512 70,707 33,805 71.4 90.0 49.945-49 119,931 54,238 65,692 77,829 45,823 32,006 64.9 84.5 48.750-54 105,520 48,899 56,622 65,169 40,139 25,029 61.8 82.1 44.255-59 77,396 33,874 43,522 32,963 24,076 8,888 42.6 71.1 20.460-64 66,907 26,572 40,334 23,754 17,448 6,306 35.5 65.7 15.665+ 151,716 68,150 83,566 28,367 23,230 5,137 18.7 34.1 6.1
DIRE DAWA ADMINISTRATIONAll Ages 204,530 96,225 108,305 101,204 54,588 46,617 49.5 56.7 43.010-14 28,533 15,019 13,514 3,668 1,925 1,743 12.9 12.8 12.915-19 31,331 14,323 17,008 9,016 2,894 6,122 28.8 20.2 36.020-24 30,749 14,495 16,254 14,629 8,016 6,613 47.6 55.3 40.725-29 28,683 13,343 15,341 19,103 10,996 8,106 66.6 82.4 52.830-34 17,563 8,754 8,809 12,430 6,947 5,482 70.8 79.4 62.235-39 17,675 8,414 9,260 13,798 7,625 6,173 78.1 90.6 66.740-44 9,350 4,075 5,275 6,678 3,449 3,229 71.4 84.6 61.245-49 12,481 5,468 7,013 8,513 4,769 3,744 68.2 87.2 53.450-54 8,894 3,837 5,057 5,853 3,314 2,539 65.8 86.4 50.255-59 5,996 3,245 2,751 3,668 2,307 1,361 61.2 71.1 49.560-64 4,030 1,750 2,280 1,491 791 700 37.0 45.2 30.765+ 9,244 3,502 5,742 2,359 1,554 805 25.5 44.4 14.0
Created by PDF Generator (http://www.alientools.com/), to remove this mark, please buy the software.
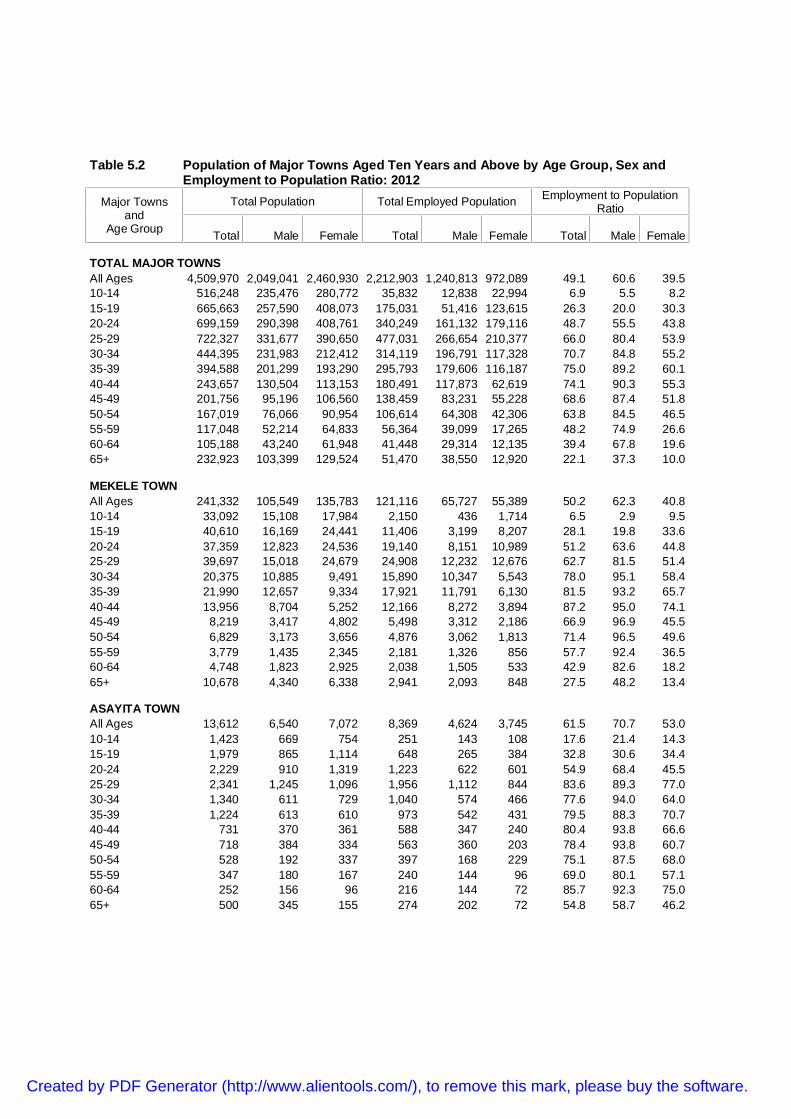
Table 5.2 Population of Major Towns Aged Ten Years and Above by Age Group, Sex andEmployment to Population Ratio: 2012
Total Population Total Employed Population Employment to PopulationRatioMajor Towns
andAge Group Total Male Female Total Male Female Total Male Female
TOTAL MAJOR TOWNSAll Ages 4,509,970 2,049,041 2,460,930 2,212,903 1,240,813 972,089 49.1 60.6 39.510-14 516,248 235,476 280,772 35,832 12,838 22,994 6.9 5.5 8.215-19 665,663 257,590 408,073 175,031 51,416 123,615 26.3 20.0 30.320-24 699,159 290,398 408,761 340,249 161,132 179,116 48.7 55.5 43.825-29 722,327 331,677 390,650 477,031 266,654 210,377 66.0 80.4 53.930-34 444,395 231,983 212,412 314,119 196,791 117,328 70.7 84.8 55.235-39 394,588 201,299 193,290 295,793 179,606 116,187 75.0 89.2 60.140-44 243,657 130,504 113,153 180,491 117,873 62,619 74.1 90.3 55.345-49 201,756 95,196 106,560 138,459 83,231 55,228 68.6 87.4 51.850-54 167,019 76,066 90,954 106,614 64,308 42,306 63.8 84.5 46.555-59 117,048 52,214 64,833 56,364 39,099 17,265 48.2 74.9 26.660-64 105,188 43,240 61,948 41,448 29,314 12,135 39.4 67.8 19.665+ 232,923 103,399 129,524 51,470 38,550 12,920 22.1 37.3 10.0
MEKELE TOWNAll Ages 241,332 105,549 135,783 121,116 65,727 55,389 50.2 62.3 40.810-14 33,092 15,108 17,984 2,150 436 1,714 6.5 2.9 9.515-19 40,610 16,169 24,441 11,406 3,199 8,207 28.1 19.8 33.620-24 37,359 12,823 24,536 19,140 8,151 10,989 51.2 63.6 44.825-29 39,697 15,018 24,679 24,908 12,232 12,676 62.7 81.5 51.430-34 20,375 10,885 9,491 15,890 10,347 5,543 78.0 95.1 58.435-39 21,990 12,657 9,334 17,921 11,791 6,130 81.5 93.2 65.740-44 13,956 8,704 5,252 12,166 8,272 3,894 87.2 95.0 74.145-49 8,219 3,417 4,802 5,498 3,312 2,186 66.9 96.9 45.550-54 6,829 3,173 3,656 4,876 3,062 1,813 71.4 96.5 49.655-59 3,779 1,435 2,345 2,181 1,326 856 57.7 92.4 36.560-64 4,748 1,823 2,925 2,038 1,505 533 42.9 82.6 18.265+ 10,678 4,340 6,338 2,941 2,093 848 27.5 48.2 13.4
ASAYITA TOWNAll Ages 13,612 6,540 7,072 8,369 4,624 3,745 61.5 70.7 53.010-14 1,423 669 754 251 143 108 17.6 21.4 14.315-19 1,979 865 1,114 648 265 384 32.8 30.6 34.420-24 2,229 910 1,319 1,223 622 601 54.9 68.4 45.525-29 2,341 1,245 1,096 1,956 1,112 844 83.6 89.3 77.030-34 1,340 611 729 1,040 574 466 77.6 94.0 64.035-39 1,224 613 610 973 542 431 79.5 88.3 70.740-44 731 370 361 588 347 240 80.4 93.8 66.645-49 718 384 334 563 360 203 78.4 93.8 60.750-54 528 192 337 397 168 229 75.1 87.5 68.055-59 347 180 167 240 144 96 69.0 80.1 57.160-64 252 156 96 216 144 72 85.7 92.3 75.065+ 500 345 155 274 202 72 54.8 58.7 46.2
Created by PDF Generator (http://www.alientools.com/), to remove this mark, please buy the software.

Table 5.2 Cont’dTotal Population Total Employed Population Employment to Population
RatioMajor Townsand
Age Group Total Male Female Total Male Female Total Male Female
GONDER TOWNAll Ages 181,710 81,795 99,915 97,868 51,748 46,121 53.9 63.3 46.210-14 29,886 14,056 15,830 7,924 3,908 4,015 26.5 27.8 25.415-19 29,160 12,023 17,137 9,838 4,075 5,763 33.7 33.9 33.620-24 27,936 10,476 17,460 15,476 6,702 8,775 55.4 64.0 50.325-29 25,247 13,445 11,803 17,499 10,272 7,228 69.3 76.4 61.230-34 13,321 6,672 6,649 10,259 5,356 4,903 77.0 80.3 73.735-39 12,815 5,911 6,904 10,310 5,635 4,675 80.5 95.3 67.740-44 9,737 4,442 5,295 6,729 4,149 2,580 69.1 93.4 48.745-49 8,225 3,927 4,298 6,367 3,357 3,010 77.4 85.5 70.050-54 5,556 2,276 3,280 3,739 2,153 1,586 67.3 94.6 48.455-59 4,870 1,728 3,142 2,747 1,553 1,193 56.4 89.9 38.060-64 4,839 2,065 2,775 3,094 1,838 1,257 63.9 89.0 45.365+ 10,116 4,774 5,342 3,885 2,750 1,135 38.4 57.6 21.2
DESSIE TOWNAll Ages 102,107 45,608 56,499 47,543 26,410 21,133 46.6 57.9 37.410-14 12,131 5,709 6,422 704 54 650 5.8 0.9 10.115-19 18,638 7,850 10,788 4,235 1,889 2,345 22.7 24.1 21.720-24 16,161 7,588 8,573 8,198 4,659 3,539 50.7 61.4 41.325-29 12,735 5,907 6,828 8,749 5,041 3,709 68.7 85.3 54.330-34 7,238 3,928 3,310 5,638 3,400 2,238 77.9 86.5 67.635-39 8,958 3,985 4,973 6,493 3,458 3,035 72.5 86.8 61.040-44 4,915 2,419 2,495 3,370 2,166 1,205 68.6 89.5 48.345-49 4,026 1,839 2,186 2,727 1,626 1,102 67.7 88.4 50.450-54 4,372 1,124 3,248 2,619 1,070 1,550 59.9 95.2 47.755-59 2,488 1,008 1,479 1,309 810 499 52.6 80.3 33.860-64 3,158 1,471 1,687 1,613 1,209 404 51.1 82.2 24.065+ 7,288 2,778 4,510 1,888 1,030 858 25.9 37.1 19.0
BAHIR DAR TOWNAll Ages 163,850 71,488 92,362 93,781 46,806 46,975 57.2 65.5 50.910-14 16,691 7,989 8,703 1,612 755 858 9.7 9.4 9.915-19 27,214 9,586 17,628 10,189 2,309 7,880 37.4 24.1 44.720-24 34,767 11,556 23,211 19,809 6,841 12,968 57.0 59.2 55.925-29 28,491 14,395 14,096 21,225 13,012 8,213 74.5 90.4 58.330-34 13,613 6,251 7,363 10,818 5,965 4,853 79.5 95.4 65.935-39 12,530 6,321 6,209 11,050 5,812 5,238 88.2 91.9 84.440-44 7,093 4,313 2,780 6,066 3,909 2,157 85.5 90.6 77.645-49 6,157 3,050 3,107 4,861 2,899 1,962 79.0 95.1 63.150-54 4,917 2,470 2,447 3,505 2,090 1,415 71.3 84.6 57.855-59 3,723 1,538 2,185 2,057 1,362 695 55.2 88.5 31.860-64 2,936 1,318 1,618 1,271 902 369 43.3 68.4 22.865+ 5,716 2,701 3,015 1,318 951 367 23.1 35.2 12.2
Created by PDF Generator (http://www.alientools.com/), to remove this mark, please buy the software.

Table 5.2 Cont’dTotal Population Total Employed Population Employment to Population
RatioMajor Townsand
Age Group Total Male Female Total Male Female Total Male Female
BISHOFTU TOWNAll Ages 84,864 39,579 45,285 41,284 23,681 17,602 48.6 59.8 38.910-14 10,014 4,805 5,209 413 240 173 4.1 5.0 3.315-19 12,106 4,541 7,565 2,454 940 1,514 20.3 20.7 20.020-24 13,334 6,614 6,720 7,162 4,056 3,107 53.7 61.3 46.225-29 14,165 6,769 7,397 8,941 5,298 3,643 63.1 78.3 49.330-34 7,780 4,745 3,035 6,197 4,241 1,956 79.7 89.4 64.435-39 7,702 3,640 4,062 5,855 3,165 2,691 76.0 87.0 66.240-44 3,729 1,705 2,024 2,891 1,513 1,378 77.5 88.8 68.145-49 3,318 1,441 1,876 2,429 1,328 1,101 73.2 92.1 58.750-54 3,226 1,071 2,155 1,801 829 972 55.8 77.3 45.155-59 1,835 884 951 929 665 264 50.7 75.3 27.860-64 2,369 900 1,469 860 498 361 36.3 55.4 24.665+ 5,285 2,465 2,821 1,351 908 443 25.6 36.8 15.7
ADAMA TOWNAll Ages 191,245 90,429 100,816 92,946 55,237 37,709 48.6 61.1 37.410-14 24,629 12,107 12,522 725 177 548 2.9 1.5 4.415-19 31,831 15,172 16,658 8,782 3,959 4,823 27.6 26.1 29.020-24 28,180 12,215 15,964 15,660 8,808 6,852 55.6 72.1 42.925-29 33,229 13,747 19,483 21,071 11,606 9,465 63.4 84.4 48.630-34 18,155 9,337 8,819 13,135 8,319 4,816 72.3 89.1 54.635-39 16,370 9,236 7,134 12,520 8,298 4,222 76.5 89.8 59.240-44 9,766 5,168 4,598 6,850 4,360 2,490 70.1 84.4 54.145-49 8,394 4,955 3,439 6,212 4,558 1,654 74.0 92.0 48.150-54 5,139 2,181 2,958 3,181 1,889 1,291 61.9 86.6 43.655-59 3,322 1,267 2,055 1,528 1,000 528 46.0 79.0 25.760-64 4,048 1,318 2,730 1,388 842 547 34.3 63.9 20.065+ 8,181 3,726 4,456 1,894 1,420 474 23.2 38.1 10.6
JIMMA TOWNAll Ages 106,414 50,853 55,561 59,065 33,607 25,458 55.5 66.1 45.810-14 14,612 6,477 8,135 2,228 764 1,464 15.2 11.8 18.015-19 15,866 6,250 9,616 5,245 2,016 3,228 33.1 32.3 33.620-24 18,152 8,544 9,608 10,760 5,747 5,013 59.3 67.3 52.225-29 15,919 8,164 7,756 11,860 7,093 4,767 74.5 86.9 61.530-34 10,015 4,925 5,090 7,246 4,517 2,729 72.4 91.7 53.635-39 9,458 4,998 4,460 7,825 4,662 3,163 82.7 93.3 70.940-44 5,128 2,784 2,344 4,139 2,486 1,654 80.7 89.3 70.645-49 4,292 2,463 1,829 3,541 2,363 1,179 82.5 95.9 64.450-54 3,887 1,883 2,005 2,489 1,632 857 64.0 86.7 42.855-59 2,743 1,415 1,329 1,564 1,105 458 57.0 78.2 34.560-64 2,016 870 1,146 935 640 295 46.4 73.5 25.865+ 4,325 2,081 2,244 1,232 581 651 28.5 27.9 29.0
Created by PDF Generator (http://www.alientools.com/), to remove this mark, please buy the software.

Table 5.2 Cont’dTotal Population Total Employed Population Employment to Population
RatioMajor Townsand
Age Group Total Male Female Total Male Female Total Male Female
SHASHEMENE TOWNAll Ages 99,036 47,497 51,539 45,485 28,269 17,216 45.9 59.5 33.410-14 16,042 7,205 8,836 739 352 387 4.6 4.9 4.415-19 15,852 7,126 8,726 3,553 1,875 1,678 22.4 26.3 19.220-24 14,601 7,099 7,502 7,381 4,541 2,840 50.6 64.0 37.925-29 16,549 7,446 9,103 10,326 6,113 4,213 62.4 82.1 46.330-34 10,212 5,103 5,109 7,307 4,640 2,668 71.6 90.9 52.235-39 7,969 4,415 3,554 5,790 3,708 2,082 72.7 84.0 58.640-44 5,606 2,985 2,621 4,167 2,805 1,362 74.3 94.0 52.045-49 3,385 1,787 1,598 2,487 1,622 865 73.5 90.8 54.150-54 2,714 1,221 1,493 1,495 954 541 55.1 78.1 36.255-59 1,284 726 558 729 590 139 56.8 81.3 24.960-64 1,817 1,059 758 777 547 230 42.8 51.7 30.365+ 3,004 1,324 1,680 734 522 212 24.4 39.4 12.6
JIJIGA TOWNAll Ages 97,536 45,624 51,912 40,942 23,990 16,952 42.0 52.6 32.710-14 18,192 9,713 8,479 1,130 369 761 6.2 3.8 9.015-19 13,559 6,247 7,311 2,918 1,113 1,805 21.5 17.8 24.720-24 13,107 5,445 7,662 4,788 2,397 2,391 36.5 44.0 31.225-29 13,446 5,259 8,187 7,819 4,356 3,464 58.2 82.8 42.330-34 9,503 4,358 5,145 5,908 3,577 2,331 62.2 82.1 45.335-39 8,902 4,263 4,639 5,703 3,679 2,023 64.1 86.3 43.640-44 6,272 3,465 2,808 4,387 3,093 1,294 69.9 89.3 46.145-49 4,736 2,826 1,910 3,512 2,564 948 74.2 90.7 49.650-54 3,107 1,357 1,749 1,948 1,042 906 62.7 76.8 51.855-59 1,683 1,101 581 1,275 845 430 75.8 76.7 74.060-64 2,084 700 1,384 694 453 241 33.3 64.7 17.465+ 2,946 889 2,057 859 502 357 29.2 56.4 17.4
ASOSSA TOWNAll Ages 30,002 14,734 15,268 17,931 10,159 7,772 59.8 68.9 50.910-14 4,382 2,252 2,131 744 345 398 17.0 15.3 18.715-19 5,345 1,824 3,520 1,845 500 1,346 34.5 27.4 38.220-24 5,344 2,204 3,140 3,089 1,597 1,491 57.8 72.5 47.525-29 4,715 2,453 2,262 3,840 2,175 1,665 81.4 88.7 73.630-34 2,978 1,597 1,381 2,608 1,575 1,034 87.6 98.6 74.935-39 2,768 1,767 1,001 2,533 1,701 832 91.5 96.3 83.140-44 1,563 1,107 457 1,346 1,006 340 86.1 90.9 74.545-49 921 640 281 716 617 99 77.7 96.3 35.350-54 586 274 311 475 274 201 81.1 100.0 64.455-59 476 199 277 366 166 200 76.8 83.2 72.260-64 298 144 155 195 115 80 65.3 80.2 51.465+ 626 273 354 175 88 87 28.0 32.4 24.5
Created by PDF Generator (http://www.alientools.com/), to remove this mark, please buy the software.

Table 5.2 Cont’dTotal Population Total Employed Population Employment to Population
RatioMajor Townsand
Age Group Total Male Female Total Male Female Total Male Female
HAWASSA TOWNAll Ages 232,077 110,817 121,260 127,071 70,534 56,537 54.8 63.6 46.610-14 33,063 14,194 18,870 2,915 762 2,153 8.8 5.4 11.415-19 42,321 15,535 26,786 12,591 4,193 8,398 29.8 27.0 31.420-24 41,354 21,109 20,246 23,475 12,974 10,501 56.8 61.5 51.925-29 36,677 17,431 19,246 27,900 14,979 12,921 76.1 85.9 67.130-34 19,046 11,200 7,847 15,419 10,135 5,284 81.0 90.5 67.335-39 17,323 7,645 9,678 14,396 7,559 6,836 83.1 98.9 70.640-44 12,676 7,107 5,568 10,815 6,535 4,280 85.3 92.0 76.945-49 10,436 5,635 4,801 8,234 5,151 3,083 78.9 91.4 64.250-54 6,553 3,695 2,858 5,376 3,618 1,758 82.0 97.9 61.555-59 2,628 1,772 856 1,823 1,562 261 69.4 88.1 30.560-64 3,325 2,087 1,238 1,900 1,566 333 57.1 75.1 26.965+ 6,674 3,407 3,266 2,227 1,497 730 33.4 43.9 22.3
GAMBELLA TOWNAll Ages 37,981 18,059 19,923 17,486 9,326 8,160 46.0 51.6 41.010-14 6,340 3,495 2,845 194 83 111 3.1 2.4 3.915-19 6,602 3,079 3,523 853 223 630 12.9 7.2 17.920-24 5,709 2,010 3,699 2,969 1,010 1,958 52.0 50.3 52.925-29 6,332 3,083 3,249 4,563 2,565 1,999 72.1 83.2 61.530-34 3,352 1,795 1,557 2,425 1,475 950 72.3 82.1 61.035-39 3,550 1,743 1,807 2,683 1,653 1,030 75.6 94.8 57.040-44 1,773 781 992 1,409 753 656 79.5 96.4 66.145-49 1,469 720 748 1,145 665 480 78.0 92.4 64.150-54 1,018 548 470 563 414 149 55.2 75.5 31.755-59 533 237 296 314 206 108 58.8 86.6 36.560-64 489 146 343 119 92 27 24.3 63.0 7.965+ 814 421 393 250 188 62 30.7 44.8 15.7
HARAR TOWNAll Ages 87,661 41,096 46,566 49,969 26,901 23,068 57.0 65.5 49.510-14 11,438 5,782 5,656 557 325 231 4.9 5.6 4.115-19 11,174 4,885 6,290 2,870 1,058 1,812 25.7 21.7 28.820-24 10,243 4,385 5,858 6,489 3,054 3,435 63.4 69.6 58.625-29 11,207 5,722 5,485 8,966 5,127 3,839 80.0 89.6 70.030-34 9,509 4,300 5,209 7,415 3,905 3,510 78.0 90.8 67.435-39 8,241 4,545 3,696 6,850 4,093 2,757 83.1 90.1 74.640-44 5,006 2,519 2,487 4,377 2,322 2,055 87.4 92.2 82.645-49 5,047 2,403 2,644 3,823 2,216 1,607 75.8 92.2 60.850-54 4,171 1,865 2,306 3,129 1,661 1,469 75.0 89.0 63.755-59 3,943 1,604 2,339 2,672 1,382 1,290 67.8 86.2 55.160-64 1,872 862 1,010 1,104 723 381 59.0 83.9 37.765+ 5,809 2,222 3,587 1,716 1,033 683 29.5 46.5 19.0
Created by PDF Generator (http://www.alientools.com/), to remove this mark, please buy the software.

Table 5.2 Cont’dTotal Population Total Employed Population Employment to Population
RatioMajor Townsand
Age Group Total Male Female Total Male Female Total Male Female
ADDIS ABABA CITYAll Ages 2,636,013 1,183,148 1,452,865 1,250,842 709,206 541,635 47.5 59.9 37.310-14 255,780 110,897 144,883 9,877 2,198 7,679 3.9 2.0 5.315-19 362,076 132,116 229,960 88,588 20,908 67,680 24.5 15.8 29.420-24 399,932 162,924 237,008 179,999 81,956 98,043 45.0 50.3 41.425-29 432,893 198,252 234,641 278,305 154,679 123,625 64.3 78.0 52.730-34 280,394 147,522 132,872 190,385 121,817 68,567 67.9 82.6 51.635-39 237,113 121,145 115,968 171,092 106,224 64,868 72.2 87.7 55.940-44 146,355 78,559 67,796 104,512 70,707 33,805 71.4 90.0 49.945-49 119,931 54,238 65,692 77,829 45,823 32,006 64.9 84.5 48.750-54 105,520 48,899 56,622 65,169 40,139 25,029 61.8 82.1 44.255-59 77,396 33,874 43,522 32,963 24,076 8,888 42.6 71.1 20.460-64 66,907 26,572 40,334 23,754 17,448 6,306 35.5 65.7 15.665+ 151,716 68,150 83,566 28,367 23,230 5,137 18.7 34.1 6.1
DIRE DAWA TOWNAll Ages 204,530 96,225 108,305 101,204 54,588 46,617 49.5 56.7 43.010-14 28,533 15,019 13,514 3,668 1,925 1,743 12.9 12.8 12.915-19 31,331 14,323 17,008 9,016 2,894 6,122 28.8 20.2 36.020-24 30,749 14,495 16,254 14,629 8,016 6,613 47.6 55.3 40.725-29 28,683 13,343 15,341 19,103 10,996 8,106 66.6 82.4 52.830-34 17,563 8,754 8,809 12,430 6,947 5,482 70.8 79.4 62.235-39 17,675 8,414 9,260 13,798 7,625 6,173 78.1 90.6 66.740-44 9,350 4,075 5,275 6,678 3,449 3,229 71.4 84.6 61.245-49 12,481 5,468 7,013 8,513 4,769 3,744 68.2 87.2 53.450-54 8,894 3,837 5,057 5,853 3,314 2,539 65.8 86.4 50.255-59 5,996 3,245 2,751 3,668 2,307 1,361 61.2 71.1 49.560-64 4,030 1,750 2,280 1,491 791 700 37.0 45.2 30.765+ 9,244 3,502 5,742 2,359 1,554 805 25.5 44.4 14.0
Created by PDF Generator (http://www.alientools.com/), to remove this mark, please buy the software.

Table 5.3 Currently Employed Population of Urban Areas Aged Ten Years and Above by Age Group, Sex and Major OccupationalGroups – COUNTRY TOTAL: 2012
Major Occupational Groups
Age Groupand Sex Total
EmployedPerson
LegislatorSenior
Officials &Managers Professional
Technical andAssociate
Professionals Clerks
Service,Shop &Marketsales
Workers
Skilledagriculturaland Fishery
Crafts andrelatedtrades
All AgesTotal 5,726,116 165,216 376,286 359,728 316,379 1,516,219 343,555 1,048,027Male 3,202,042 128,932 259,132 225,287 123,190 646,234 246,151 616,303Female 2,524,074 36,284 117,154 134,441 193,190 869,985 97,404 431,723
10-14Total 195,567 - - - 2,984 61,572 25,335 16,215Male 94,187 - - - 516 24,360 20,776 6,574Female 101,380 - - - 2,468 37,212 4,559 9,641
15-19Total 492,071 1,394 1,496 8,458 9,652 154,084 28,524 71,097Male 205,515 524 604 3,159 4,006 53,670 17,811 42,652Female 286,556 870 892 5,298 5,646 100,414 10,713 28,445
20-24Total 902,304 11,482 56,515 56,572 62,038 239,947 29,753 161,094Male 457,454 7,062 30,894 25,655 21,751 99,283 23,620 103,670Female 444,850 4,421 25,621 30,917 40,287 140,664 6,133 57,424
25-29Total 1,128,487 31,673 112,177 93,521 79,136 293,850 38,190 199,081Male 653,525 22,592 80,185 51,721 29,647 129,882 27,281 130,621Female 474,962 9,081 31,992 41,800 49,489 163,969 10,909 68,460
30-34Total 767,262 24,462 59,577 55,757 42,598 210,723 37,570 145,359Male 448,530 18,907 39,033 37,062 15,563 91,846 24,156 90,844Female 318,731 5,555 20,544 18,694 27,035 118,878 13,414 54,515
35-39Total 742,001 27,668 48,654 54,174 44,874 198,415 40,496 149,026Male 423,955 21,683 33,807 37,074 14,837 87,592 26,425 85,156Female 318,046 5,986 14,847 17,101 30,038 110,823 14,070 63,870
40-44Total 445,655 25,862 34,186 33,786 26,574 113,204 33,084 78,953Male 273,476 22,269 25,002 24,562 9,822 52,514 25,011 46,779Female 172,179 3,593 9,184 9,224 16,753 60,691 8,073 32,174
Created by PDF Generator (http://www.alientools.com/), to remove this mark, please buy the software.

Table 5.3 Cont’d
Major Occupational Groups
Age Groupand Sex Total
EmployedPerson
LegislatorSenior
Officials &Managers Professional
Technical andAssociate
Professionals Clerks
Service,Shop &Marketsales
Workers
Skilledagriculturaland Fishery
Crafts andrelatedtrades
45-49Total 361,687 20,751 27,609 23,111 21,221 89,940 24,911 68,446Male 211,592 15,822 18,943 17,676 10,072 42,905 16,069 32,862Female 150,094 4,928 8,665 5,435 11,149 47,035 8,841 35,584
50-54Total 266,025 11,834 21,838 17,504 11,934 60,074 19,765 55,401Male 153,598 10,450 17,387 12,984 6,422 22,417 13,846 22,814Female 112,428 1,384 4,452 4,520 5,512 37,657 5,920 32,587
55-59Total 152,584 4,426 7,885 9,228 7,810 34,583 16,043 35,166Male 96,469 4,390 7,620 8,179 5,423 11,879 10,174 20,239Female 56,115 36 264 1,049 2,387 22,704 5,868 14,927
60-64Total 113,615 3,178 2,536 3,805 4,056 22,440 18,783 28,748Male 75,221 2,987 2,536 3,805 2,744 10,512 15,205 13,553Female 38,393 191 - - 1,313 11,928 3,578 15,195
65+Total 158,859 2,485 3,814 3,813 3,502 37,388 31,102 39,440Male 108,519 2,246 3,122 3,411 2,387 19,375 25,776 20,541Female 50,340 239 692 403 1,115 18,013 5,326 18,900
Created by PDF Generator (http://www.alientools.com/), to remove this mark, please buy the software.

Table 5.4 Currently Employed Population of Urban Areas Aged Ten Years and Above by Region, Sex and Major Occupational Groups: 2012Major Occupational Groups
Region andSex Total
EmployedPersons
LegislatorSenior
Officials &Managers Professional
Technical andAssociate
Professionals Clerks
Service,Shop &Marketsales
Workers
Skilledagriculturaland Fishery
Crafts andrelatedtrades
COUNTRY TOTALTotal 5,726,116 165,216 376,286 359,728 316,379 1,516,219 343,555 1,048,027Male 3,202,042 128,932 259,132 225,287 123,190 646,234 246,151 616,303Female 2,524,074 36,284 117,154 134,441 193,190 869,985 97,404 431,723
TIGRAY REGIONTotal 391,891 13,563 24,773 20,141 24,632 101,721 17,642 90,632Male 204,483 10,562 17,213 13,607 8,362 33,751 12,166 47,142Female 187,408 3,000 7,560 6,534 16,270 67,970 5,476 43,490
AFFAR REGIONTotal 77,068 1,992 1,942 3,259 3,404 22,155 8,142 9,556Male 43,657 1,732 1,441 2,383 2,300 5,750 7,343 6,076Female 33,411 260 500 875 1,104 16,405 800 3,480
AMHARA REGIONTotal 1,063,958 27,602 57,403 72,654 45,543 260,922 88,420 218,176Male 562,815 21,608 42,381 45,109 17,789 90,272 70,611 113,948Female 501,144 5,994 15,022 27,545 27,755 170,650 17,809 104,227
OROMIA REGIONTotal 1,643,077 42,584 87,713 97,248 72,830 443,850 115,490 313,892Male 963,543 34,523 60,011 61,054 35,708 202,112 78,227 184,268Female 679,534 8,061 27,702 36,194 37,122 241,738 37,263 129,625
SOMALI REGIONTotal 202,547 4,824 9,096 12,972 5,039 87,662 30,538 12,245Male 111,869 4,773 5,916 9,887 2,933 32,657 21,514 8,551Female 90,677 51 3,180 3,085 2,106 55,006 9,024 3,694
BENISHANGUL GUMUZREGION
Total 72,518 2,735 3,949 5,070 3,415 14,967 6,773 16,949Male 39,854 2,400 3,066 3,536 1,049 6,738 5,071 8,077Female 32,664 335 883 1,534 2,366 8,229 1,702 8,872
SNNP REGIONTotal 837,386 25,460 65,657 62,410 43,238 233,481 63,304 146,655Male 466,330 20,859 45,587 39,820 19,288 105,781 41,173 77,920Female 371,057 4,601 20,071 22,590 23,950 127,700 22,131 68,735
Created by PDF Generator (http://www.alientools.com/), to remove this mark, please buy the software.

Table 5.4 Cont’d
Major Occupational Groups
Region andSex Total
EmployedPersons
LegislatorSenior
Officials &Managers Professional
Technical andAssociate
Professionals Clerks
Service,Shop &Marketsales
Workers
Skilledagriculturaland Fishery
Crafts andrelatedtrades
GAMBELLA REGIONTotal 35,656 855 2,882 4,058 1,593 8,729 3,840 8,048Male 18,797 640 2,407 2,863 787 4,084 3,179 2,057Female 16,859 215 475 1,196 807 4,645 661 5,991
HARARI REGIONTotal 49,969 1,499 2,628 2,952 3,225 16,703 440 8,703Male 26,901 1,267 1,885 1,357 873 5,485 440 6,841Female 23,068 231 742 1,595 2,352 11,219 - 1,861
ADDIS ABABA CITYADMINISTRATION
Total 1,250,842 41,197 115,979 73,917 108,202 295,161 6,863 208,306Male 709,206 28,011 76,413 41,949 31,770 146,825 5,552 153,026Female 541,635 13,186 39,566 31,967 76,432 148,336 1,311 55,280
DIRE DAWAADMINISTRATION
Total 101,204 2,906 4,264 5,047 5,257 30,867 2,102 14,864Male 54,588 2,556 2,811 3,723 2,331 12,779 874 8,396Female 46,617 350 1,454 1,325 2,925 18,088 1,228 6,469
Created by PDF Generator (http://www.alientools.com/), to remove this mark, please buy the software.

Table 5.5 Currently Employed Population of Major Towns Aged Ten Years and above by Sex and Major Occupational Groups: 2012Major Occupational Groups
Major Towns andSex Total
EmployedPersons
LegislatorSenior
Officials &Managers Professional
Technical andAssociate
Professionals Clerks
Service,Shop &
Market salesWorkers
Skilledagriculturaland Fishery
Craftsand
relatedtrades
TOTAL MAJOR TOWNSTotal 2,212,903 73,677 179,079 127,231 162,443 531,720 43,968 388,021Male 1,240,813 55,824 118,967 74,900 49,476 239,555 30,066 273,107Female 972,089 17,853 60,113 52,331 112,967 292,164 13,902 114,914
MEKELE TOWNTotal 121,116 7,189 7,451 4,359 6,307 29,819 1,183 25,191Male 65,727 6,015 4,551 2,687 1,473 9,645 970 17,667Female 55,389 1,174 2,900 1,672 4,834 20,174 213 7,524
ASAYITA TOWNTotal 8,369 215 348 598 485 2,744 1,086 1,147Male 4,624 167 275 372 216 1,041 775 839Female 3,745 48 73 227 269 1,703 311 308
GONDER TOWNTotal 97,868 2,268 3,646 5,012 4,136 18,463 15,874 14,895Male 51,748 2,026 2,415 3,089 1,346 7,436 12,151 8,167Female 46,121 242 1,230 1,923 2,790 11,027 3,723 6,729
DESSIE TOWNTotal 47,543 1,068 3,266 2,832 2,858 12,429 654 9,143Male 26,410 1,019 2,286 1,653 1,066 5,381 366 6,263Female 21,133 50 980 1,179 1,792 7,048 288 2,880
BAHIR DARTOWN
Total 93,781 1,774 8,329 4,837 6,420 19,941 887 21,036Male 46,806 1,697 5,755 2,347 1,824 5,378 384 12,283Female 46,975 77 2,574 2,490 4,596 14,562 503 8,753
BISHOFTUTOWN
Total 41,284 1,474 2,097 2,669 1,875 7,963 2,283 11,052Male 23,681 1,085 1,273 1,510 738 3,220 1,200 7,556Female 17,602 389 824 1,159 1,137 4,743 1,083 3,496
ADAMA TOWNTotal 92,946 2,347 5,494 3,619 4,558 21,865 2,507 19,761Male 55,237 1,913 3,727 2,582 984 10,050 1,887 14,291Female 37,709 435 1,767 1,037 3,575 11,815 620 5,470
JIMMA TOWNTotal 59,065 2,323 5,873 3,432 3,638 12,642 761 11,434Male 33,607 1,950 4,299 1,973 1,481 5,766 528 7,393Female 25,458 373 1,574 1,458 2,156 6,876 233 4,041
Created by PDF Generator (http://www.alientools.com/), to remove this mark, please buy the software.

Table 5.5 Cont’d
Major Occupational GroupsMajor Towns and
Sex TotalEmployedPersons
LegislatorSenior
Officials &Managers Professional
Technical andAssociate
Professionals Clerks
Service,Shop &
Market salesWorkers
Skilledagriculturaland Fishery
Craftsand
relatedtrades
SHASHEMENETOWN
Total 45,485 1,723 2,013 2,668 1,892 14,573 2,425 8,424Male 28,269 1,550 1,552 1,740 874 6,949 1,861 5,955Female 17,216 173 461 929 1,018 7,624 564 2,468
JIJIGA TOWNTotal 40,942 998 2,839 2,245 2,209 13,616 1,086 5,411Male 23,990 948 1,807 1,801 1,046 5,303 447 4,389Female 16,952 51 1,031 443 1,163 8,312 639 1,022
ASOSA TOWNTotal 17,931 727 1,524 1,690 1,783 4,332 911 2,926Male 10,159 626 1,105 1,027 554 1,953 634 1,705Female 7,772 102 419 663 1,229 2,379 277 1,221
HAWASSA TOWNTotal 127,071 5,457 11,955 9,057 8,304 25,677 4,427 22,281Male 70,534 4,625 7,717 5,513 2,346 10,222 1,644 16,794Female 56,537 832 4,238 3,544 5,958 15,456 2,782 5,488
GAMBELLA TOWNTotal 17,486 511 1,375 2,296 1,293 4,924 479 3,446Male 9,326 370 1,096 1,577 553 2,122 353 1,541Female 8,160 141 279 719 740 2,802 126 1,905
HARAR TOWNTotal 49,969 1,499 2,628 2,952 3,225 16,703 440 8,703Male 26,901 1,267 1,885 1,357 873 5,485 440 6,841Female 23,068 231 742 1,595 2,352 11,219 - 1,861
ADDIS ABABA CITYTotal 1,250,842 41,197 115,979 73,917 108,202 295,161 6,863 208,306Male 709,206 28,011 76,413 41,949 31,770 146,825 5,552 153,026Female 541,635 13,186 39,566 31,967 76,432 148,336 1,311 55,280
DIRE DAWA TOWNTotal 101,204 2,906 4,264 5,047 5,257 30,867 2,102 14,864Male 54,588 2,556 2,811 3,723 2,331 12,779 874 8,396Female 46,617 350 1,454 1,325 2,925 18,088 1,228 6,469
Created by PDF Generator (http://www.alientools.com/), to remove this mark, please buy the software.

Table 5.6 Currently Employed Population of Urban Areas Aged Ten Years and Above by Region, Sex and MinorOccupational Groups: 2012
RegionMinor OccupationalGroup and Sex Total Tigray Afar Amhara Oromia Somalie
Benishangul-Gumuz SNNPR Gambela
Total Employed PersonsTotal 5,726,116 391,891 77,068 1,063,958 1,643,077 202,547 72,518 837,386 35,656Male 3,202,042 204,483 43,657 562,815 963,543 111,869 39,854 466,330 18,797Female 2,524,074 187,408 33,411 501,144 679,534 90,677 32,664 371,057 16,859
MAJOR GROUP 1: LEGISLATORS, SENIOR OFFICIALS AND MANAGERSTotal 165,216 13,563 1,992 27,602 42,584 4,824 2,735 25,460 855Male 128,932 10,562 1,732 21,608 34,523 4,773 2,400 20,859 640Female 36,284 3,000 260 5,994 8,061 51 335 4,601 215
LEGISLATORS AND SENIOR OFFICIALSTotal 37,658 2,876 795 6,725 9,862 1,900 488 5,092 191Male 29,560 2,129 795 6,077 8,435 1,900 456 3,724 154Female 8,098 747 - 648 1,427 - 31 1,367
LegislatorsTotal 2,024 - - 323 - 171 - 107Male 1,604 - - 323 - 171 - 107Female 420 - - - - - - -
Senior government officialsTotal 16,173 2,016 - 4,794 2,801 889 311 2,310 135Male 13,688 1,693 - 4,145 2,656 889 311 2,029Female 2,485 323 - 648 145 - - 280
Traditional chiefs and heads of villagesTotal 8,029 111 475 213 2,244 770 151 389Male 6,057 111 475 213 2,200 770 119 179Female 1,972 - - - 44 - 31 210
Senior officials of special-interest organizationsTotal 11,433 749 320 1,396 4,817 70 26 2,285Male 8,212 325 320 1,396 3,579 70 26 1,409Female 3,221 424 - - 1,238 - - 877
CORPORATE MANAGERSTotal 55,229 5,740 768 8,462 13,055 623 334 8,788 244Male 44,123 4,369 756 6,910 11,042 573 314 7,362 179Female 11,106 1,372 12 1,551 2,013 51 20 1,426
Directors and chief executivesTotal 11,638 856 553 478 2,770 51 - 2,732Male 10,406 856 553 478 2,728 - - 2,732Female 1,232 - - - 42 51 - -
Created by PDF Generator (http://www.alientools.com/), to remove this mark, please buy the software.
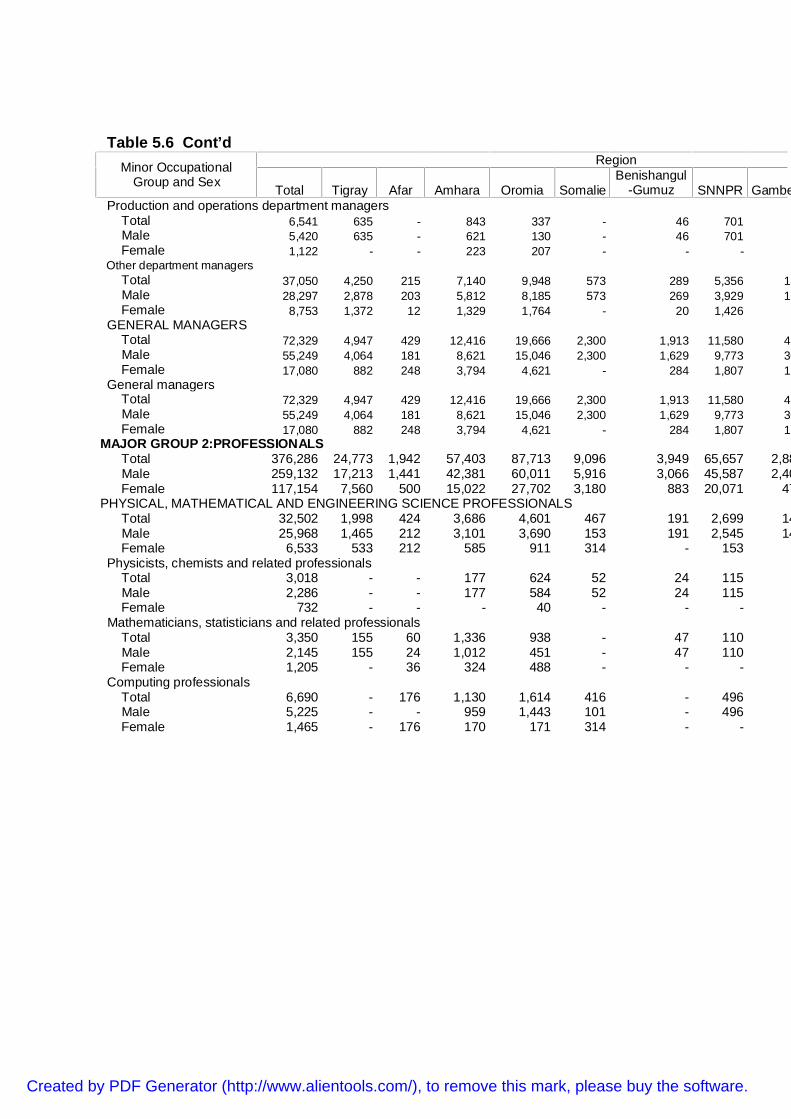
Table 5.6 Cont’dRegionMinor Occupational
Group and Sex Total Tigray Afar Amhara Oromia SomalieBenishangul
-Gumuz SNNPR GambelaProduction and operations department managers
Total 6,541 635 - 843 337 - 46 701Male 5,420 635 - 621 130 - 46 701Female 1,122 - - 223 207 - - -
Other department managersTotal 37,050 4,250 215 7,140 9,948 573 289 5,356 182Male 28,297 2,878 203 5,812 8,185 573 269 3,929 117Female 8,753 1,372 12 1,329 1,764 - 20 1,426
GENERAL MANAGERSTotal 72,329 4,947 429 12,416 19,666 2,300 1,913 11,580 420Male 55,249 4,064 181 8,621 15,046 2,300 1,629 9,773 307Female 17,080 882 248 3,794 4,621 - 284 1,807 113
General managersTotal 72,329 4,947 429 12,416 19,666 2,300 1,913 11,580 420Male 55,249 4,064 181 8,621 15,046 2,300 1,629 9,773 307Female 17,080 882 248 3,794 4,621 - 284 1,807 113
MAJOR GROUP 2:PROFESSIONALSTotal 376,286 24,773 1,942 57,403 87,713 9,096 3,949 65,657 2,882Male 259,132 17,213 1,441 42,381 60,011 5,916 3,066 45,587 2,407Female 117,154 7,560 500 15,022 27,702 3,180 883 20,071 475
PHYSICAL, MATHEMATICAL AND ENGINEERING SCIENCE PROFESSIONALSTotal 32,502 1,998 424 3,686 4,601 467 191 2,699 147Male 25,968 1,465 212 3,101 3,690 153 191 2,545 147Female 6,533 533 212 585 911 314 - 153
Physicists, chemists and related professionalsTotal 3,018 - - 177 624 52 24 115Male 2,286 - - 177 584 52 24 115Female 732 - - - 40 - - -
Mathematicians, statisticians and related professionalsTotal 3,350 155 60 1,336 938 - 47 110Male 2,145 155 24 1,012 451 - 47 110Female 1,205 - 36 324 488 - - -
Computing professionalsTotal 6,690 - 176 1,130 1,614 416 - 496Male 5,225 - - 959 1,443 101 - 496Female 1,465 - 176 170 171 314 - -
Created by PDF Generator (http://www.alientools.com/), to remove this mark, please buy the software.

Table 5.6 Cont’dRegionMinor Occupational
Group and Sex Total Tigray Afar Amhara Oromia SomalieBenishangul
-Gumuz SNNPR GambelaArchitects, engineers and related professionals
Total 19,443 1,843 188 1,042 1,424 - 120 1,977Male 16,313 1,310 188 952 1,212 - 120 1,824Female 3,130 533 - 91 212 - - 153
LIFE SCIENCE AND HEALTH PROFESSIONALSTotal 56,409 3,029 475 8,915 14,654 1,998 997 9,633 396Male 31,378 1,769 416 5,525 8,609 904 805 5,284 341Female 25,031 1,261 60 3,389 6,045 1,093 192 4,350
Life science professionalsTotal 7,759 109 12 1,921 2,073 52 329 1,297 108Male 5,891 109 - 1,698 1,432 - 329 1,087 108Female 1,867 - 12 223 641 52 - 210
Health professionals/except nursing/Total 26,287 1,194 380 5,155 4,780 522 209 4,454 136Male 17,345 1,194 380 2,415 3,538 472 209 3,027 136Female 8,942 - - 2,739 1,243 51 - 1,427
Nursing and midwifery professionalsTotal 22,364 1,726 84 1,839 7,800 1,424 459 3,882 152Male 8,142 465 36 1,412 3,639 433 268 1,170Female 14,222 1,261 48 427 4,161 991 192 2,712
TEACHING PROFESSIONALSTotal 180,256 12,576 635 33,446 44,024 4,955 1,664 36,866 1,894Male 128,511 9,464 598 25,858 30,459 3,505 1,363 26,585 1,584Female 51,746 3,112 37 7,588 13,565 1,450 301 10,281 310
College, university and higher education teachingprofessionals
Total 31,590 4,514 36 5,408 6,814 252 205 6,842Male 26,953 3,911 36 5,128 6,123 151 205 5,736Female 4,636 603 - 280 691 101 - 1,107
Secondary education teaching professionalsTotal 83,241 3,380 301 15,192 20,561 2,607 898 15,930 1,400Male 68,318 2,951 289 13,499 15,956 2,139 762 12,345 1,291Female 14,923 429 12 1,693 4,604 468 136 3,585 109
Primary and pre-primary education teaching professionalsTotal 56,987 4,023 285 11,292 13,129 1,729 464 13,393 373Male 25,572 2,266 273 5,676 4,895 848 353 7,804 172Female 31,415 1,757 12 5,615 8,234 881 111 5,589 201
Created by PDF Generator (http://www.alientools.com/), to remove this mark, please buy the software.

Table 5.6 Cont’dRegionMinor Occupational
Group and Sex Total Tigray Afar Amhara Oromia SomalieBenishangul
-Gumuz SNNPR GambelaSpecial education teaching professionals
Total 721 - - - 375 - - -Male 375 - - - 375 - - -Female 346 - - - - - - -
Other teaching professionalsTotal 7,718 658 13 1,555 3,145 367 97 701Male 7,292 335 - 1,555 3,110 367 43 701Female 425 323 13 - 36 - 54 -
OTHER PROFESSIONALSTotal 107,119 7,170 407 11,356 24,434 1,676 1,098 16,459 446Male 73,275 4,516 215 7,897 17,253 1,354 707 11,173 336Female 33,844 2,654 191 3,459 7,181 322 391 5,286 110
Business professionalsTotal 53,568 3,895 60 5,384 13,001 748 459 9,169 134Male 31,339 2,091 12 3,224 7,579 577 306 5,364Female 22,228 1,804 48 2,160 5,422 171 154 3,805
Legal professionalsTotal 21,407 1,259 60 1,895 5,989 524 282 2,332 147Male 15,616 726 60 1,683 5,173 473 166 1,504 147Female 5,791 534 - 211 815 50 115 828
Archivists, librarians and related information professionalsTotal 5,248 410 144 1,039 1,770 151 43 648Male 3,370 202 - 944 1,123 51 24 418Female 1,878 208 144 95 646 101 20 231
Social science and related professionalsTotal 10,400 613 - 517 1,636 50 270 2,976Male 9,208 613 - 294 1,386 50 188 2,653Female 1,193 - - 223 250 - 82 323
Writers and creative or performing artistsTotal 9,617 208 - 1,790 782 101 43 521Male 6,862 99 - 1,020 736 101 24 421Female 2,754 109 - 770 47 - 20 100
Religious professionalsTotal 6,879 785 144 731 1,256 101 - 812Male 6,879 785 144 731 1,256 101 - 812Female - - - - - - - -
Created by PDF Generator (http://www.alientools.com/), to remove this mark, please buy the software.

Table 5.6 Cont’dRegionMinor Occupational
Group and Sex Total Tigray Afar Amhara Oromia SomalieBenishangul
-Gumuz SNNPR GambelaMAJOR GROUP 3:TECHNICIANS AND ASSOCIATE PROFESSIONALS
Total 359,728 20,141 3,259 72,654 97,248 12,972 5,070 62,410 4,058Male 225,287 13,607 2,383 45,109 61,054 9,887 3,536 39,820 2,863Female 134,441 6,534 875 27,545 36,194 3,085 1,534 22,590 1,196
PHYSICAL AND ENGINEERING SCIENCE ASSOCIATE PROFESSIONALSTotal 44,362 3,250 346 5,255 10,092 935 452 6,657Male 34,388 2,604 334 4,021 7,814 935 379 4,279Female 9,974 645 12 1,234 2,278 - 73 2,377
Physical and engineering science techniciansTotal 26,850 2,582 250 2,906 6,249 260 279 3,460Male 22,770 2,147 250 2,522 5,457 260 226 3,072Female 4,080 434 - 384 792 - 53 387
Computer associate professionalsTotal 5,368 - - 587 551 310 46 1,169Male 3,336 - - 72 551 310 26 305Female 2,032 - - 515 - - 20 864
Optical and electronic equipment operatorsTotal 4,762 - 60 1,006 540 50 73 1,239Male 3,203 - 48 1,006 391 50 73 533Female 1,560 - 12 - 150 - - 706
Ship and aircraft controllers and techniciansTotal 2,121 - - - 215 - - 420Male 1,577 - - - 91 - - -Female 545 - - - 125 - - 420
Safety and quality inspectorsTotal 5,260 668 36 756 2,537 314 54 369Male 3,503 457 36 421 1,326 314 54 369Female 1,758 211 - 335 1,211 - - -
LIFE SCIENCE AND HEALTH ASSOCIATE PROFESSIONALSTotal 80,038 2,829 916 16,928 20,546 3,306 1,795 19,169 1,505Male 42,815 910 651 10,234 10,999 1,913 815 12,590 1,172Female 37,223 1,919 265 6,694 9,546 1,393 980 6,578 333
Life science technicians and related associate professionalsTotal 17,909 307 529 3,305 4,966 819 412 6,353 871Male 16,225 307 467 3,305 4,863 768 318 5,387 809Female 1,683 - 62 - 103 51 94 966
Created by PDF Generator (http://www.alientools.com/), to remove this mark, please buy the software.

Table 5.6 Cont’dRegionMinor Occupational
Group and Sex Total Tigray Afar Amhara Oromia SomalieBenishangul
-Gumuz SNNPR GambelaModern health associate professionals (except nursing)
Total 37,120 1,275 363 6,752 11,014 1,132 679 8,082 376Male 15,557 322 172 2,535 3,968 994 212 4,945 233Female 21,563 953 191 4,217 7,047 139 467 3,137 144
Nursing and midwifery associate professionalsTotal 21,893 1,247 24 5,927 3,297 1,145 609 4,134 258Male 8,495 281 12 3,451 988 151 189 1,940 130Female 13,398 966 12 2,477 2,308 994 420 2,194 127
Traditional medicine practitioners and faith healersTotal 3,116 - - 944 1,269 210 95 599Male 2,538 - - 944 1,180 - 95 319Female 578 - - - 88 210 - 280
TEACHING ASSOCIATE PROFESSIONALSTotal 111,168 7,845 1,266 25,620 35,690 5,082 551 19,134 1,018Male 57,616 4,587 740 12,731 18,504 3,881 250 11,069 667Female 53,552 3,258 526 12,889 17,186 1,202 301 8,065 351
Primary education teaching associate professionalsTotal 80,574 5,455 1,230 19,454 24,486 2,482 551 17,029 799Male 45,742 3,295 704 10,279 14,201 2,168 250 10,501 448Female 34,833 2,159 526 9,176 10,285 314 301 6,528 351
Pre-primary education teaching associate professionalsTotal 19,806 670 24 3,312 8,115 1,690 - 1,327 140Male 5,258 111 24 614 2,930 960 - - 140Female 14,547 559 - 2,698 5,186 730 - 1,327
Special education teaching associate professionalsTotal 3,910 1,349 - 483 1,768 229 - -Male 2,489 810 - 483 888 229 - -Female 1,421 540 - - 881 - - -
Other teaching Associate ProfessionalsTotal 6,878 371 12 2,371 1,321 681 - 779Male 4,126 371 12 1,355 485 524 - 568Female 2,752 - - 1,016 835 157 - 210
OTHER ASSOCIATE PROFESSIONALSTotal 124,160 6,217 731 24,852 30,920 3,648 2,272 17,450 1,448Male 90,468 5,505 659 18,123 23,736 3,157 2,092 11,881 935Female 33,692 712 72 6,729 7,184 491 180 5,569 512
Created by PDF Generator (http://www.alientools.com/), to remove this mark, please buy the software.

Table 5.6 Cont’dRegionMinor Occupational
Group and Sex Total Tigray Afar Amhara Oromia SomalieBenishangul
-Gumuz SNNPR GambelaFinance and sales associate professionals
Total 22,120 660 192 3,600 4,514 - 308 1,610 246Male 13,322 210 192 3,081 3,990 - 246 311 112Female 8,798 450 - 519 524 - 62 1,298 134
Business services agents and trade brokersTotal 10,108 749 144 183 3,086 445 92 1,559Male 8,606 749 144 183 2,242 266 92 1,426Female 1,502 - - - 844 179 - 134
Administrative associate professionalsTotal 40,751 1,860 276 10,946 13,859 292 1,046 6,579 806Male 26,324 1,752 240 6,842 9,721 292 975 3,491 507Female 14,427 109 36 4,104 4,139 - 71 3,087 299
Customs, tax and related governmentassociate professionals
Total 5,874 542 12 1,935 1,012 730 297 995Male 3,580 389 12 843 393 679 278 895Female 2,295 153 - 1,092 619 50 20 100
Police inspectors and detectivesTotal 10,097 770 72 2,693 1,683 1,279 145 1,256Male 7,887 770 36 1,781 1,683 1,069 145 1,256Female 2,210 - 36 912 - 210 - -
Social work associate professionalsTotal 1,933 - 12 103 - - 26 340Male 594 - 12 - - - 26 153Female 1,339 - - 103 - - - 187
Artistic, entertainment and sports associate professionalsTotal 9,532 744 - 684 1,318 123 140 1,746Male 7,525 744 - 684 900 70 140 1,257Female 2,007 - - - 417 52 - 488
Religious associate professionalsTotal 23,340 892 24 4,708 5,448 466 219 3,366 246Male 22,316 892 24 4,708 4,806 466 192 3,091 166Female 1,023 - - - 642 - 27 275
Associat professionals not elsewhere classified.Total 404 - - - - 314 - -Male 314 - - - - 314 - -Female 90 - - - - - - -
Created by PDF Generator (http://www.alientools.com/), to remove this mark, please buy the software.

Table 5.6 Cont’dRegionMinor Occupational
Group and Sex Total Tigray Afar Amhara Oromia SomalieBenishangul
-Gumuz SNNPR GambelaMAJOR GROUP 4: CLERKS
Total 316,379 24,632 3,404 45,543 72,830 5,039 3,415 43,238 1,593Male 123,190 8,362 2,300 17,789 35,708 2,933 1,049 19,288 787Female 193,190 16,270 1,104 27,755 37,122 2,106 2,366 23,950 807
OFFICE CLERKSTotal 229,927 17,556 2,798 30,541 52,939 3,481 1,849 33,451 1,357Male 78,955 6,154 2,097 9,836 21,716 1,841 547 13,463 609Female 150,972 11,402 701 20,705 31,223 1,640 1,302 19,988 747
Secretaries and keyboard-operating clerksTotal 100,075 7,160 675 12,906 24,851 973 1,129 11,922 518Male 15,824 884 144 1,097 5,876 365 76 3,027Female 84,251 6,276 531 11,810 18,975 608 1,053 8,895 433
Numerical clerksTotal 63,554 3,352 634 7,093 11,728 1,070 459 11,907 332Male 30,080 1,897 610 3,434 6,282 604 284 6,442 216Female 33,475 1,454 24 3,659 5,446 466 175 5,465 116
Material-recording and transport clerksTotal 29,503 3,656 168 4,707 6,826 101 67 2,237Male 14,866 1,700 133 2,243 4,087 - 47 1,449Female 14,637 1,956 36 2,464 2,739 101 20 787
Library, maill and related clerksTotal 25,129 2,361 169 3,725 6,290 884 175 5,798 363Male 9,288 1,007 169 1,502 3,080 469 121 1,744 221Female 15,841 1,353 - 2,223 3,209 415 54 4,054 142
Other office clerksTotal 11,666 1,028 1,152 2,110 3,244 453 20 1,587Male 8,898 666 1,042 1,561 2,390 402 20 801Female 2,768 362 110 549 854 50 - 786
CUSTOMER SERVICES CLERKSTotal 86,453 7,076 607 15,002 19,892 1,558 1,566 9,787 237Male 44,235 2,208 203 7,953 13,992 1,092 502 5,825 177Female 42,218 4,868 403 7,050 5,899 466 1,064 3,962
Cashiers, tellers and related clerksTotal 75,817 5,761 607 14,212 18,352 1,507 1,439 8,944 178Male 38,648 2,005 203 7,700 12,744 1,041 375 5,067 150Female 37,169 3,756 403 6,512 5,609 466 1,064 3,877
Created by PDF Generator (http://www.alientools.com/), to remove this mark, please buy the software.

Table 5.6 Cont’dRegionMinor Occupational
Group and Sex Total Tigray Afar Amhara Oromia SomalieBenishangul
-Gumuz SNNPR GambelaClient information clerks
Total 1,516,219 101,721 22,155 260,922 443,850 87,662 14,967 233,481 8,729Male 646,234 33,751 5,750 90,272 202,112 32,657 6,738 105,781 4,084Female 869,985 67,970 16,405 170,650 241,738 55,006 8,229 127,700 4,645
MAJOR GROUP 5: SERVICE WORKERS AND SHOP AND MARKET SALES WORKESTotal 549,602 44,823 8,752 86,277 155,138 24,303 4,537 92,043 3,568Male 219,624 12,762 1,308 25,190 77,987 11,334 1,529 37,547 1,314Female 329,979 32,061 7,444 61,087 77,151 12,969 3,009 54,497 2,253
PERSONAL AND PROTECTIVE SERVICES WORKERSTotal 12,327 1,081 250 532 3,321 786 116 1,800Male 9,819 1,081 23 532 3,225 786 83 1,386Female 2,508 - 227 - 96 - 33 415
Travel attendants and related workersTotal 291,101 23,496 3,225 59,395 82,247 8,006 3,138 49,027 2,073Male 78,687 2,628 629 9,450 29,369 2,335 933 18,012 433Female 212,414 20,869 2,595 49,945 52,877 5,672 2,206 31,015 1,640
Housekeeping and restaurant services workersTotal 67,721 931 4,536 5,821 14,029 8,855 192 16,162Male 15,031 - 213 1,420 2,427 2,830 - 5,130Female 52,690 931 4,323 4,401 11,602 6,025 192 11,032
Personal care and related workersTotal 101,632 8,609 332 10,550 33,297 3,582 402 10,735 191Male 59,733 3,510 332 6,451 24,368 2,800 236 3,954Female 41,899 5,099 - 4,099 8,930 782 165 6,781 110
Other personal services workersTotal 1,405 254 - - 969 - - 133Male 1,356 254 - - 969 - - 133Female 49 - - - - - - -
Astrologers, fortune-Tellers and Related WorkersTotal 61,576 5,969 109 8,473 18,358 2,916 460 10,357 1,086Male 54,997 5,289 109 7,337 17,629 2,583 277 8,931 774Female 6,578 679 - 1,136 729 333 183 1,426 312
Protective services workers 1,516,219 101,721 22,155 260,922 443,850 87,662Total 646,234 33,751 5,750 90,272 202,112 32,657 6,738 105,781 4,084Male 869,985 67,970 16,405 170,650 241,738 55,006 8,229 127,700 4,645Female
Created by PDF Generator (http://www.alientools.com/), to remove this mark, please buy the software.

Table 5.6 Cont’dRegionMinor Occupational
Group and Sex Total Tigray Afar Amhara Oromia SomalieBenishangul
-Gumuz SNNPR GambelaProstitutes.
Total 13,841 4,483 299 1,506 2,917 157 229 3,828 135Male - - - - - - - -Female 13,841 4,483 299 1,506 2,917 157 229 3,828 135
Protactive services/bodygurd,patrol not else where classified.Total - - - - - - - -Male - - - - - - - -Female - - - - - - - -
PERSONAL AND PROTECTIVE SERVICES WORKERSTotal 966,617 56,898 13,403 174,646 288,712 63,359 10,430 141,438 5,161Male 426,611 20,988 4,442 65,082 124,125 21,323 5,209 68,235 2,770Female 540,006 35,909 8,961 109,564 164,587 42,037 5,221 73,203 2,391
Fashion and other modelsTotal 4,809 927 - 134 541 51 250 396Male 2,787 552 - 134 106 51 77 396Female 2,022 375 - - 436 - 173 -
Shop salespersons and demonstratorsTotal 451,062 30,035 4,267 75,933 125,098 23,469 5,207 54,946 1,846Male 260,863 14,585 2,165 35,119 75,666 11,234 3,130 37,206 1,370Female 190,200 15,450 2,102 40,815 49,433 12,235 2,077 17,741 476
Sellers in ?gulit? & open market any items including traders ofTotal 331,643 18,624 3,126 75,820 91,006 23,956 3,856 58,326 2,489Male 107,857 4,251 986 22,553 28,484 5,623 1,744 20,437 968Female 223,786 14,373 2,140 53,267 62,521 18,333 2,112 37,889 1,520
"Katikala" retailersTotal 29,131 1,697 443 8,255 11,292 365 54 5,272 199Male 1,887 - 12 401 282 - - 366 135Female 27,244 1,697 431 7,855 11,010 365 54 4,907
Related workers not stated elsewhereTotal 149,971 5,614 5,568 14,503 60,775 15,518 1,064 22,498 628Male 53,217 1,600 1,280 6,875 19,587 4,415 258 9,831 296Female 96,755 4,014 4,288 7,627 41,188 11,104 806 12,667 331
MAJOR GROUP 6:SKILLED AGRICULTURAL AND FISHERY WORKERSTotal 343,555 17,642 8,142 88,420 115,490 30,538 6,773 63,304 3,840Male 246,151 12,166 7,343 70,611 78,227 21,514 5,071 41,173 3,179Female 97,404 5,476 800 17,809 37,263 9,024 1,702 22,131 661
Created by PDF Generator (http://www.alientools.com/), to remove this mark, please buy the software.

Table 5.6 Cont’dRegionMinor Occupational
Group and Sex Total Tigray Afar Amhara Oromia SomalieBenishangul
-Gumuz SNNPR GambelaMARKET-ORIENTED SKILLED AGRICULTURAL AND FISHERY WORKERS
Total 219,956 16,395 7,475 52,663 63,502 26,136 4,010 40,648 3,027Male 160,869 11,122 6,855 42,208 44,153 17,322 3,196 29,044 2,541Female 59,088 5,274 620 10,455 19,348 8,815 813 11,604 486
Market gardeners and crop growersTotal 126,739 7,695 1,339 34,174 35,767 14,235 2,992 26,624 1,860Male 99,351 5,087 1,184 28,013 29,199 10,087 2,403 20,072 1,689Female 27,388 2,607 156 6,161 6,568 4,149 589 6,552 171
Market-oriented animal producers and related workersTotal 63,790 7,162 1,633 12,545 18,989 8,655 562 11,126 376Male 37,853 4,605 1,168 9,247 9,336 4,882 456 6,505 148Female 25,937 2,557 465 3,299 9,653 3,772 106 4,621 227
Market-oriented crop and animal producersTotal 16,820 1,319 12 3,519 7,227 1,674 210 1,727Male 12,349 1,319 12 3,190 4,237 781 210 1,469Female 4,471 - - 329 2,990 894 - 258
Forestry and related workersTotal 10,528 220 4,204 2,323 1,190 1,572 246 444 156Male 9,410 111 4,204 1,656 1,053 1,572 127 444Female 1,119 109 - 667 137 - 118 -
Fishery workers, hunters and trappersTotal 2,079 - 287 102 328 - - 727 636Male 1,906 - 287 102 328 - - 553 636Female 173 - - - - - - 173
SUBSISTENCE AGRICULTURAL AND FISHERY WORKERSTotal 123,599 1,247 667 35,757 51,988 4,402 2,763 22,655 813Male 85,282 1,044 488 28,403 34,074 4,192 1,875 12,129 638Female 38,316 203 180 7,354 17,914 210 888 10,526 175
Subsistence agricultural-crop & garden vegetables producersTotal 51,059 737 488 14,106 27,192 1,467 1,929 4,344 168Male 38,377 534 488 11,146 19,140 1,467 1,228 3,666Female 12,682 203 - 2,960 8,053 - 701 678
Subsistence livestock producersTotal 28,818 510 144 2,881 12,689 210 111 11,857 156Male 12,368 510 - 1,318 6,132 210 62 3,981Female 16,449 - 144 1,563 6,557 - 49 7,876
Knowledgeable subsistence crop & animal producers
Created by PDF Generator (http://www.alientools.com/), to remove this mark, please buy the software.

Table 5.6 Cont’dRegionMinor Occupational
Group and Sex Total Tigray Afar Amhara Oromia SomalieBenishangul
-Gumuz SNNPR GambelaTotal 41,064 - - 18,250 11,113 2,725 723 5,346 489Male 33,832 - - 15,679 8,356 2,515 585 4,482 489Female 7,232 - - 2,571 2,756 210 138 864
Subsistence forestry and related product workersTotal 2,138 - 36 - 994 - - 1,108Male 446 - - - 446 - - -Female 1,692 - 36 - 549 - - 1,108
Fishery workers and hunters for own consumptionTotal 520 - - 520 - - - -Male 260 - - 260 - - - -Female 260 - - 260 - - - -
MAJOR GROUP 7: CRAFT AND RELATED TRADES WORKERSTotal 1,048,027 90,632 9,556 218,176 313,892 12,245 16,949 146,655 8,048Male 616,303 47,142 6,076 113,948 184,268 8,551 8,077 77,920 2,057Female 431,723 43,490 3,480 104,227 129,625 3,694 8,872 68,735 5,991
EXTRACTION AND BUILDING TRADES WORKERSTotal 284,997 18,323 4,582 59,594 77,619 5,709 6,973 39,168 1,211Male 253,861 15,745 3,869 49,560 71,072 5,547 5,423 37,010 1,047Female 31,136 2,578 713 10,033 6,547 162 1,550 2,158 163
Miners, shotfirers, stone cutters and carversTotal 36,347 3,831 906 12,297 6,740 50 356 2,613Male 30,913 3,435 586 9,912 6,241 50 356 2,613Female 5,434 396 320 2,385 499 - - -
Building frame and related trades workersTotal 195,161 10,121 3,387 34,893 54,345 4,889 6,233 31,012 915Male 176,688 9,011 3,055 30,226 49,516 4,726 4,683 29,028 796Female 18,474 1,110 332 4,667 4,829 162 1,550 1,984 119
Building finiishers and related trades workersTotal 39,553 2,988 133 9,613 13,044 719 290 3,965 268Male 35,098 2,459 72 7,415 11,903 719 290 3,965 224Female 4,455 529 61 2,197 1,141 - - -
Painters, building structure cleaners and related trades workersTotal 13,936 1,384 156 2,791 3,490 52 94 1,578Male 11,162 840 156 2,007 3,412 52 94 1,404Female 2,774 544 - 784 78 - - 173
METAL, MACHINERY AND RELATED TRADES WORKERS
Created by PDF Generator (http://www.alientools.com/), to remove this mark, please buy the software.

Table 5.6 Cont’dRegionMinor Occupational
Group and Sex Total Tigray Afar Amhara Oromia SomalieBenishangul
-Gumuz SNNPR GambelaTotal 131,335 10,291 1,011 16,967 28,469 1,247 822 15,254 453Male 125,732 9,677 976 16,326 28,220 1,247 822 15,062 405Female 5,603 614 36 641 249 - - 192
Metal moulders, weldeers, sheetmetal workers, structural metalTotal 46,755 5,657 426 7,286 12,760 353 276 5,836 178Male 44,864 5,246 390 7,180 12,725 353 276 5,721 131Female 1,892 412 36 107 35 - - 115
Blacksmiths, tool-makers and related trades workersTotal 6,713 892 - 760 802 51 23 177Male 5,971 892 - 760 691 51 23 100Female 742 - - - 112 - - 77
Machinery mechanics and fittersTotal 43,725 1,927 440 5,076 6,706 614 294 4,890 214Male 42,193 1,927 440 4,634 6,655 614 294 4,890 214Female 1,531 - - 443 50 - - -
Electrical and electronic equipment mechanics and fittersTotal 34,143 1,815 146 3,844 8,201 229 230 4,351Male 32,704 1,612 146 3,752 8,148 229 230 4,351Female 1,439 203 - 92 53 - - -
PRECISION, HANDICRAFT, PRINTING AND RELATED TRADES WORKERSTotal 72,856 5,707 311 13,619 24,496 103 1,007 6,194 160Male 33,242 3,718 60 6,311 9,914 103 379 3,187Female 39,614 1,990 251 7,308 14,582 - 628 3,007 104
Precision workers in metal and related materialsTotal 8,802 1,378 - 987 3,264 52 46 973Male 8,385 1,378 - 987 3,225 52 46 973Female 417 - - - 39 - - -
Potters, glass-makers and related trades workersTotal 36,656 2,100 287 6,794 14,404 - 554 2,332Male 3,671 111 36 67 967 - - 100Female 32,985 1,990 251 6,726 13,437 - 554 2,232
Handicraft workers in wood, textile, leather and related materialsTotal 16,181 1,642 24 3,430 4,088 - 301 2,047Male 15,465 1,642 24 3,354 4,036 - 227 1,878Female 716 - - 75 52 - 74 168
Printing and related trades workers
Created by PDF Generator (http://www.alientools.com/), to remove this mark, please buy the software.

Table 5.6 Cont’dRegionMinor Occupational
Group and Sex Total Tigray Afar Amhara Oromia SomalieBenishangul
-Gumuz SNNPR GambelaTotal 11,216 587 - 2,409 2,740 51 106 842Male 5,721 587 - 1,902 1,686 51 106 236Female 5,495 - - 506 1,054 - - 606
OTHER CRAFT AND RELATED TRADES WORKERSTotal 558,838 56,311 3,652 127,996 183,308 5,186 8,148 86,039 6,224Male 203,468 18,003 1,172 41,751 75,062 1,654 1,453 22,660 549Female 355,370 38,308 2,480 86,245 108,246 3,532 6,694 63,378 5,675
Food processing and related trades workersTotal 291,338 19,953 2,985 51,021 111,053 2,792 6,459 61,586 5,755Male 47,423 2,349 837 4,302 25,806 472 411 5,990 198Female 243,916 17,605 2,148 46,719 85,247 2,320 6,048 55,595 5,557
Wood treaters, cabinet-makers and related trades workersTotal 23,678 1,034 - 6,356 7,939 298 397 2,739 110Male 20,279 712 - 5,484 7,089 298 397 2,335 110Female 3,399 323 - 872 850 - - 404
Textile, garment and related trades workersTotal 226,364 33,662 523 69,023 61,843 1,992 1,292 20,733 359Male 124,537 14,384 192 30,539 40,192 780 646 13,635 241Female 101,827 19,278 332 38,484 21,651 1,212 647 7,098 118
Pelt, leather and shoemaking trades workersTotal 17,458 1,661 144 1,596 2,472 105 - 980Male 11,230 559 144 1,426 1,974 105 - 700Female 6,228 1,102 - 171 498 - - 280
MAJOR GROUP 8:PLANT AND MACHINE OPERATORS AND ASSEMBLERSTotal 305,437 21,182 2,181 35,896 80,011 4,619 1,445 36,141 488Male 286,619 18,406 2,169 33,470 77,034 4,467 1,411 33,529 488Female 18,818 2,776 12 2,426 2,977 151 33 2,612
STATIONARY-PLANT AND RELATED OPERATORSTotal 15,092 1,100 12 1,693 4,844 155 60 1,239 124Male 11,843 533 12 1,693 4,154 105 60 881 124Female 3,249 567 - - 691 50 - 358
Mining- and mineral-processing-plant operatorsTotal 1,028 255 - 483 42 - 60 134Male 772 - - 483 42 - 60 134Female 255 255 - - - - - -
Metal-processing-plant operators
Created by PDF Generator (http://www.alientools.com/), to remove this mark, please buy the software.

Table 5.6 Cont’dRegionMinor Occupational
Group and Sex Total Tigray Afar Amhara Oromia SomalieBenishangul
-Gumuz SNNPR GambelaTotal 3,454 - - 100 1,620 - - 279Male 2,501 - - 100 1,620 - - 100Female 953 - - - - - - 179
Glass, ceramics and related plant operatorsTotal 910 218 - - - - - -Male 455 109 - - - - - -Female 455 109 - - - - - -
Wood-processing- and papermaking-plant operatorsTotal 1,480 - - - 96 - - -Male 1,480 - - - 96 - - -Female - - - - - - - -
Chemical-processing-plant operatorsTotal 2,585 203 - - 1,616 - - 420Male 1,345 - - - 925 - - 420Female 1,240 203 - - 691 - - -
Power-production and related plant operatorsTotal 4,847 - 12 1,034 1,470 155 - 407 124Male 4,502 - 12 1,034 1,470 105 - 228 124Female 346 - - - - 50 - 179
Automated-assembly-line and industrial-robot operatorsTotal 788 424 - 77 - - - -Male 788 424 - 77 - - - -Female - - - - - - - -
MACHINE OPERATORS AND ASSEMBLERSTotal 76,319 5,458 191 11,146 25,568 101 152 9,437Male 62,240 3,571 180 8,898 23,479 - 119 7,183Female 14,079 1,887 12 2,247 2,089 101 33 2,254
Metal- and mineral-products machine operatorsTotal 7,612 1,992 - 975 1,402 - 28 257Male 6,815 1,510 - 745 1,317 - 28 257Female 797 482 - 231 85 - - -
Chemical-prpdicts machine operatorsTotal 1,469 - 12 183 55 - - 527Male 814 - - 183 55 - - 230Female 655 - 12 - - - - 297
Rubber- and plastic-products machine operators
Created by PDF Generator (http://www.alientools.com/), to remove this mark, please buy the software.

Table 5.6 Cont’dRegionMinor Occupational
Group and Sex Total Tigray Afar Amhara Oromia SomalieBenishangul
-Gumuz SNNPR GambelaTotal 5,643 155 - 47 3,333 - - -Male 3,559 155 - - 2,607 - - -Female 2,084 - - 47 727 - - -
Wood-products machine operatorsTotal 3,205 - - 1,178 1,064 - 33 584Male 2,985 - - 1,178 1,064 - - 397Female 220 - - - - - 33 187
Printing- binding- and paper-products machine operatorsTotal 2,322 109 - 69 409 - - 268Male 2,105 109 - 69 409 - - 100Female 217 - - - - - - 168
Textile- fur- and leather-products machine operatorsTotal 7,206 546 - 1,486 728 - - 550Male 2,261 109 - 411 432 - - 153Female 4,945 437 - 1,075 296 - - 397
Food and related products machine operatorsTotal 26,222 1,663 36 4,081 12,061 101 37 4,952Male 21,604 695 36 3,283 11,154 - 37 3,832Female 4,618 968 - 799 907 101 - 1,120
AssemblersTotal 21,443 884 144 2,830 6,035 - 53 2,299Male 20,900 884 144 2,734 5,961 - 53 2,213Female 543 - - 96 74 - - 85
Machines products assemblers not else where classified.Total 1,198 109 - 298 482 - - -Male 1,198 109 - 298 482 - - -Female - - - - - - - -
DRIVERS AND MOBILE-PLANT OPERATORSTotal 214,026 14,625 1,978 23,057 49,598 4,362 1,232 25,464 337Male 212,537 14,302 1,978 22,878 49,401 4,362 1,232 25,464 337Female 1,490 323 - 179 197 - - -
Locomotive-engine drivers and related workersTotal 2,025 - - 58 901 - - 336Male 2,025 - - 58 901 - - 336Female - - - - - - - -
Motor-vehicle drivers
Created by PDF Generator (http://www.alientools.com/), to remove this mark, please buy the software.

Table 5.6 Cont’dRegionMinor Occupational
Group and Sex Total Tigray Afar Amhara Oromia SomalieBenishangul
-Gumuz SNNPR GambelaTotal 208,557 14,092 1,547 22,454 48,247 4,292 1,199 24,575 266Male 207,067 13,769 1,547 22,275 48,049 4,292 1,199 24,575 266Female 1,490 323 - 179 197 - - -
Agricultural and other mobile plant opertorsTotal 3,265 533 431 467 451 70 33 453Male 3,265 533 431 467 451 70 33 453Female - - - - - - - -
Ships deck crews and related workersTotal 180 - - 79 - - - 101Male 180 - - 79 - - - 101Female - - - - - - - -
MAJOR GROUP 9: ELEMENTARY OCCUPATIONSTotal 1,293,289 77,405 24,437 257,251 388,989 35,434 17,214 160,682 5,162Male 669,003 43,274 14,461 127,536 230,488 21,113 8,505 82,194 2,292Female 624,286 34,131 9,976 129,715 158,501 14,321 8,709 78,489 2,870
SALES AND SERVICES ELEMENTARY OCCUPATIONSTotal 940,563 55,546 12,000 153,985 272,912 24,507 10,481 125,265 3,804Male 443,770 26,202 6,751 68,168 159,133 12,594 4,565 59,270 1,832Female 496,793 29,344 5,249 85,817 113,779 11,913 5,917 65,995 1,972
Street vendors and related workersTotal 88,041 3,258 316 11,933 37,758 2,519 211 11,889 226Male 49,684 2,074 63 4,992 24,274 858 107 8,540 143Female 38,357 1,184 254 6,940 13,484 1,660 104 3,348
Shoe cleaning and other street services elementary occupationsTotal 25,893 1,153 596 3,228 12,339 155 166 5,118Male 24,896 1,041 596 3,052 12,339 155 166 4,408Female 997 111 - 176 - - - 709
Domestic and related helpers, cleaners and launderesTotal 336,520 22,201 3,562 51,669 64,216 6,191 2,682 45,252 1,105Male 19,344 1,217 417 4,855 4,057 312 166 3,240Female 317,176 20,985 3,144 46,813 60,158 5,879 2,516 42,012 1,105
Building caretakers, helpers, cleaners and launderersTotal 13,477 1,093 12 819 4,372 101 47 1,037Male 4,944 105 - 54 2,288 - 47 580Female 8,533 988 12 765 2,083 101 - 456
Messengers, porters, doorkeepers and related workers
Created by PDF Generator (http://www.alientools.com/), to remove this mark, please buy the software.

Table 5.6 Cont’dRegionMinor Occupational
Group and Sex Total Tigray Afar Amhara Oromia SomalieBenishangul
-Gumuz SNNPR GambelaTotal 460,882 27,151 7,514 81,110 151,592 15,016 7,376 59,486 2,365Male 338,092 21,656 5,675 52,463 114,776 10,794 4,079 41,277 1,689Female 122,789 5,495 1,840 28,646 36,817 4,222 3,297 18,208 676
Garbage collectors and related labourersTotal 15,750 690 - 5,227 2,635 526 - 2,485Male 6,810 109 - 2,751 1,398 475 - 1,224Female 8,939 581 - 2,476 1,237 51 - 1,261
AGRICULTURAL, FISHERY AND RELATED LABOURERSTotal 171,794 8,417 10,362 65,764 51,917 7,523 5,347 17,369 995Male 83,583 5,534 5,792 31,437 20,929 5,322 2,866 9,159 126Female 88,212 2,882 4,570 34,326 30,988 2,201 2,481 8,209 869
Agricultural, fishery anf related labourersTotal 171,794 8,417 10,362 65,764 51,917 7,523 5,347 17,369 995Male 83,583 5,534 5,792 31,437 20,929 5,322 2,866 9,159 126Female 88,212 2,882 4,570 34,326 30,988 2,201 2,481 8,209 869
LABOURERS IN MINING, MANUFACTURING AND TRANSPORTTotal 180,932 13,443 2,074 37,503 64,160 3,404 1,386 18,048 362Male 141,651 11,537 1,919 27,931 50,426 3,196 1,074 13,764 334Female 39,281 1,906 156 9,571 13,734 208 312 4,284
Mining and construction labourersTotal 80,147 7,056 274 20,640 21,017 1,785 461 8,796 137Male 53,604 5,580 262 12,520 15,214 1,578 177 5,003 109Female 26,543 1,476 12 8,120 5,802 208 285 3,793
Manufacturing labourersTotal 26,596 1,570 467 1,921 17,754 101 - 359Male 15,625 1,140 323 952 10,188 101 - 359Female 10,972 430 144 969 7,566 - - -
Transport labourers and frieght handlersTotal 74,189 4,816 1,334 14,942 25,389 1,518 925 8,893 225Male 72,422 4,816 1,334 14,459 25,024 1,518 898 8,403 225Female 1,767 - - 483 365 - 27 491
NOT STATEDTotal 1,979 199 - 91 470 116 - 358Male 1,190 - - 91 118 58 - 179Female 788 199 - - 352 58 - 179
Created by PDF Generator (http://www.alientools.com/), to remove this mark, please buy the software.

Table 5.7 Currently Employed Population of Urban Areas Aged Ten Years and Above by Sex, Age Group and MajorIndustrial Divisions - Country Total: 2012
Age Group 10Major IndustrialDivisionsand Sex All Ages 10-14 15-19 20-24 25-29 30-34 35-39 40-44 45-49 50-54
Total Employed PopulationTotal 5,726,116 195,567 492,071 902,304 1,128,487 767,262 742,001 445,655 361,687 266,025Male 3,202,042 94,187 205,515 457,454 653,525 448,530 423,955 273,476 211,592 153,598Female 2,524,074 101,380 286,556 444,850 474,962 318,731 318,046 172,179 150,094 112,428
Agriculture, Hunting, Forsetery & FishingTotal 469,377 58,078 47,410 44,845 49,953 47,639 48,323 39,842 30,703 24,484Male 315,988 45,379 33,366 30,192 30,177 29,151 28,612 27,546 16,800 16,320Female 153,389 12,699 14,044 14,653 19,777 18,488 19,711 12,296 13,902 8,164
Mining & QuarryingTotal 21,374 - 371 2,598 5,923 4,578 2,886 1,073 1,303 1,434Male 16,486 - 371 1,863 3,542 3,542 2,886 1,073 1,303 732Female 4,888 - - 735 2,380 1,036 - - - 702
ManufacturingTotal 757,055 14,039 57,471 127,307 149,375 83,841 96,982 54,345 54,688 41,777Male 419,831 8,163 35,242 78,429 89,882 44,020 46,322 27,687 26,262 17,592Female 337,224 5,876 22,229 48,878 59,493 39,820 50,660 26,658 28,426 24,185
Electricity, Gas and Water SupplyTotal 53,226 483 3,499 7,368 10,285 6,763 7,130 5,489 3,490 2,330Male 38,176 - 2,111 5,141 7,927 3,940 5,046 3,703 2,866 1,838Female 15,050 483 1,387 2,227 2,358 2,823 2,084 1,786 624 492
ConstructionTotal 395,129 1,508 22,046 71,740 84,673 64,525 62,878 29,305 22,830 14,591Male 324,893 657 14,576 50,076 71,952 56,557 53,755 25,745 18,838 12,639Female 70,235 851 7,470 21,664 12,721 7,968 9,123 3,560 3,992 1,952
Whole Sale and Retail TradeTotal 1,235,258 34,173 89,936 165,295 231,138 190,628 186,531 102,762 83,337 56,694Male 625,873 18,595 46,955 83,936 119,025 97,819 89,863 51,514 42,423 25,011Female 609,386 15,577 42,981 81,359 112,113 92,808 96,669 51,248 40,913 31,682
Hotels and RestaurantsTotal 457,810 15,263 63,681 83,181 87,151 50,949 51,049 28,740 24,244 19,917Male 112,237 2,234 15,822 22,984 23,276 10,492 13,072 8,111 5,029 3,678Female 345,572 13,029 47,859 60,197 63,874 40,457 37,977 20,629 19,215 16,239
Transport, Storage and CommunicationsTotal 260,370 732 9,964 39,278 62,376 48,830 35,272 24,011 16,656 11,517Male 246,962 732 9,310 36,763 57,671 46,375 34,050 23,072 15,945 11,467Female 13,407 - 653 2,515 4,705 2,455 1,222 940 712 50
Created by PDF Generator (http://www.alientools.com/), to remove this mark, please buy the software.

Table 5.7 Cont’dAge Group 10Major Industrial
Divisionsand Sex All Ages 10-14 15-19 20-24 25-29 30-34 35-39 40-44 45-49 50-54
Financial IntermediationTotal 115,655 - 345 16,710 29,800 21,644 18,882 9,681 8,735 5,142Male 69,717 - - 5,234 20,649 12,705 11,300 6,853 5,718 3,300Female 45,938 - 345 11,476 9,152 8,938 7,582 2,828 3,017 1,842
Real Estate, Renting and Business ActivitiesTotal 119,259 341 3,382 25,840 31,013 17,895 14,526 9,471 7,076 3,180Male 74,806 - 2,151 13,949 19,194 11,947 8,470 5,816 4,864 2,483Female 44,453 341 1,231 11,892 11,819 5,947 6,055 3,655 2,212 697
PUBLIC ADMINISTRATION AND DEFENCETotal 381,757 - 3,094 52,973 80,947 58,690 58,220 51,056 33,220 24,238Male 251,433 - 846 27,980 47,533 36,291 36,938 37,558 27,512 20,009Female 130,324 - 2,248 24,993 33,414 22,399 21,283 13,498 5,708 4,229
EducationTotal 404,111 - 5,561 66,815 108,808 64,128 52,172 33,752 30,304 25,191Male 239,864 - 1,582 31,358 66,447 38,772 31,446 18,850 18,016 18,840Female 164,247 - 3,978 35,457 42,361 25,356 20,726 14,902 12,288 6,350
Health and Social WorkTotal 182,330 - 4,106 31,094 50,898 23,929 27,491 18,547 9,594 7,171Male 91,421 - 1,090 9,498 22,350 12,474 14,378 12,322 6,154 4,735Female 90,909 - 3,016 21,595 28,547 11,455 13,113 6,226 3,441 2,436
Other Community, Social and Personal ServiceActivities
Total 566,625 45,030 74,806 98,083 106,691 68,003 59,429 27,382 28,012 24,477Male 330,050 16,404 37,948 55,340 66,447 39,097 40,456 18,603 17,843 13,692Female 236,574 28,626 36,858 42,743 40,244 28,905 18,973 8,779 10,169 10,785
Private Households with Employed PersonsTotal 269,616 25,920 105,606 66,098 31,096 10,824 11,037 4,379 5,678 2,639Male 20,520 2,023 4,143 3,039 2,591 2,629 1,171 750 897 389Female 249,095 23,898 101,463 63,059 28,505 8,195 9,865 3,629 4,781 2,251
Extra-Territorial Organizations and NGOsTotal 34,003 - 793 2,265 6,816 4,307 8,986 5,600 1,528 1,243Male 21,696 - - 1,095 3,619 2,629 6,191 4,097 1,121 873Female 12,307 - 793 1,170 3,197 1,678 2,795 1,503 408 370
Not StatedTotal 3,162 - - 815 1,544 91 207 218 287 -Male 2,087 - - 578 1,242 91 - 176 - -Female 1,076 - - 237 301 - 207 42 287 -
Created by PDF Generator (http://www.alientools.com/), to remove this mark, please buy the software.

Table 5.8 Currently Employed Population of Urban Areas Aged Ten Years and Above by Region, Sex and Major Industrial Divisions-COUNTRY TOTAL: 2012
RegionMajor IndustrialDivisions and Sex
Total Tigray Afar Amhara Oromia SomalieBenishangul-
Gumuz SNNP GambelaTotal Employed Population
Total 5,726,116 391,891 77,068 1,063,958 1,643,077 202,547 72,518 837,386 35,656Male 3,202,042 204,483 43,657 562,815 963,543 111,869 39,854 466,330 18,797Female 2,524,074 187,408 33,411 501,144 679,534 90,677 32,664 371,057 16,859
Agriculture, Hunting Forsetery & FishingTotal 469,377 22,364 21,391 138,534 147,139 39,539 11,248 74,269 5,602Male 315,988 15,316 15,592 93,209 99,548 28,027 7,121 47,356 3,352Female 153,389 7,048 5,799 45,325 47,590 11,511 4,128 26,913 2,250
Mining & QuarryingTotal 21,374 5,111 260 5,416 1,092 171 77 3,098 28Male 16,486 4,360 224 4,708 781 171 77 1,838 -Female 4,888 751 36 708 311 - - 1,260 28
ManufacturingTotal 757,055 70,706 7,464 151,510 247,198 5,029 7,561 87,083 1,687Male 419,831 36,355 4,302 76,413 146,747 2,361 2,984 39,035 706Female 337,224 34,351 3,162 75,098 100,451 2,668 4,577 48,048 981
Electricity, Gas and Water SupplyTotal 53,226 4,130 2,235 10,690 14,537 3,471 537 4,188 83Male 38,176 2,912 1,755 6,264 10,649 2,266 511 2,596 55Female 15,050 1,218 480 4,427 3,888 1,205 26 1,591 28
ConstructionTotal 395,129 27,780 5,037 77,790 95,075 7,511 9,318 51,559 1,728Male 324,893 23,472 3,854 58,622 82,534 7,127 6,501 44,066 1,377Female 70,235 4,309 1,183 19,168 12,541 384 2,817 7,493 351
Wholesale and Retail TradeTotal 1,235,258 70,372 12,953 201,437 385,964 68,517 11,281 168,955 5,440Male 625,873 31,862 5,116 87,026 193,652 25,144 6,250 94,180 3,052Female 609,386 38,510 7,837 114,410 192,312 43,373 5,031 74,776 2,388
Hotels and RestaurantsTotal 457,810 42,973 5,798 93,341 137,416 8,710 6,506 73,563 6,334Male 112,237 4,228 1,434 12,320 39,899 2,494 1,233 21,349 543Female 345,572 38,746 4,364 81,021 97,517 6,216 5,274 52,213 5,791
Transport, Storage and CommunicationsTotal 260,370 16,431 2,232 30,135 67,455 6,129 1,651 30,520 478Male 246,962 15,396 2,032 29,104 65,798 6,078 1,526 29,208 424Female 13,407 1,036 200 1,030 1,657 50 125 1,312 54
Created by PDF Generator (http://www.alientools.com/), to remove this mark, please buy the software.

Table 5.8 Cont’dRegionMajor Industrial
Divisions and SexTotal Tigray Afar Amhara Oromia Somalie
Benishangul-Gumuz SNNP Gambela
Financial IntermediationTotal 115,655 8,492 302 12,932 30,893 2,027 519 15,919 324Male 69,717 5,431 253 9,443 20,812 1,089 368 9,216 240Female 45,938 3,061 49 3,489 10,081 937 151 6,703 84
Real Estate, Renting and Business ActivitiesTotal 119,259 4,161 979 15,090 27,117 1,818 1,133 17,447 371Male 74,806 2,703 622 10,921 18,737 1,504 794 11,693 252Female 44,453 1,457 357 4,169 8,379 314 338 5,754 118
PUBLIC ADMINISTRATION AND DEFENCETotal 381,757 26,163 5,399 68,125 105,834 14,891 6,109 66,025 6,298Male 251,433 16,705 3,524 47,392 76,003 10,773 4,440 44,437 4,160Female 130,324 9,458 1,875 20,733 29,831 4,118 1,669 21,588 2,138
EducationTotal 404,111 28,992 1,438 76,701 108,393 12,064 3,544 80,524 3,190Male 239,864 18,384 959 46,109 63,939 9,077 2,593 49,807 2,381Female 164,247 10,608 479 30,592 44,455 2,987 951 30,717 809
Health and Social WorkTotal 182,330 11,355 1,287 28,520 47,973 6,128 3,144 33,325 1,057Male 91,421 5,214 750 15,196 23,355 3,123 1,680 18,376 476Female 90,909 6,141 538 13,324 24,619 3,005 1,465 14,950 581
Other Community, Social and Personal Service ActivitiesTotal 566,625 37,803 7,745 112,322 170,206 21,708 7,957 94,420 2,213Male 330,050 19,566 2,648 60,314 111,319 12,059 3,476 48,346 1,455Female 236,574 18,237 5,097 52,009 58,887 9,648 4,481 46,074 758
Private Households with Employed PersonsTotal 269,616 11,984 2,229 37,869 48,448 3,665 1,453 32,937 470Male 20,520 409 417 3,573 3,762 - 54 2,835 -Female 249,095 11,575 1,812 34,296 44,686 3,665 1,399 30,102 470
Extra-Territorial Organizations and NGOsTotal 34,003 2,874 320 3,455 6,972 1,054 480 3,195 354Male 21,696 2,171 176 2,110 4,993 516 247 1,812 325Female 12,307 703 144 1,345 1,978 538 233 1,383 29
Not StatedTotal 3,162 199 - 91 1,366 116 - 358 -Male 2,087 - - 91 1,014 58 - 179 -Female 1,076 199 - - 352 58 - 179 -
Created by PDF Generator (http://www.alientools.com/), to remove this mark, please buy the software.

Table 5.9 Currently Employed Population of Major Towns Aged Ten Years and Above by Sex and Major IndustrialDivisions: 2012
Major Industrial Divisions
Major Townsand Sex
TotalEmployedPopulation
Agriculture,Hunting,Forestry& Fishing
Mining &Quarrying
Manufacturing
Electricity,Gas and
WaterSupply Construction
WholeSaleand
RetailTrade
Hotelsand
Restaurants
Transport,Storage
andCommunica
tions
FinancialIntermedia
tion
RealEstate,Renting
andBusinessActivities
PublicAdministration
AndDefense Education
MAJOR TOWNS TOTALTotal 2,212,903 52,658 8,585 284,019 22,712 197,243 473,171 147,616 147,320 55,668 66,363 140,971 148,474Male 1,240,813 34,582 6,763 173,944 16,487 160,307 262,096 44,685 136,723 30,910 37,893 82,160Female 972,089 18,075 1,823 110,075 6,225 36,936 211,075 102,931 10,597 24,758 28,471 58,811
MEKELE TOWNTotal 121,116 1,805 1,286 21,846 1,328 12,516 22,179 9,381 6,854 1,723 1,769 7,530Male 65,727 1,591 1,286 13,489 1,108 10,479 10,109 1,198 6,636 1,404 1,248 4,858Female 55,389 213 - 8,356 220 2,037 12,070 8,183 218 319 522 2,673
ASAYITA TOWNTotal 8,369 1,254 12 393 108 950 1,995 800 370 13 48 1,009Male 4,624 931 12 73 60 804 896 182 346 - 12 623Female 3,745 323 - 320 49 146 1,099 618 24 13 37 386
GONDER TOWNTotal 97,868 22,288 163 10,483 2,400 7,166 14,204 7,288 2,326 758 1,239 4,966Male 51,748 15,495 163 5,407 280 5,598 8,027 822 2,096 510 659 4,056Female 46,121 6,794 - 5,076 2,120 1,568 6,177 6,466 230 249 580 910
DESSIE TOWNTotal 47,543 573 60 5,406 311 4,278 11,863 2,552 1,951 398 643 4,229Male 26,410 241 60 3,274 265 3,510 6,026 473 1,808 290 396 2,502Female 21,133 333 - 2,132 46 768 5,837 2,080 142 108 247 1,727
BAHIR DAR TOWNTotal 93,781 2,410 207 12,558 675 13,137 14,597 9,983 4,065 1,528 2,586 8,140Male 46,806 1,156 207 6,336 571 8,862 6,818 1,783 3,622 1,144 2,052 5,259Female 46,975 1,254 - 6,222 103 4,275 7,779 8,200 443 384 534 2,881
BISHOFTUTOWN
Total 41,284 2,946 197 10,382 245 5,013 6,226 2,810 2,537 672 696 2,413Male 23,681 1,400 197 6,626 245 4,282 2,925 602 2,288 326 453 1,612Female 17,602 1,546 - 3,755 - 732 3,300 2,209 249 346 243 801
ADAMA TOWNTotal 92,946 2,202 235 16,025 778 6,466 24,160 7,586 8,485 1,298 2,333 2,903Male 55,237 1,579 235 10,338 665 6,002 12,076 2,861 8,032 886 1,515 2,086Female 37,709 623 - 5,687 113 464 12,084 4,726 453 412 818 816
Created by PDF Generator (http://www.alientools.com/), to remove this mark, please buy the software.

Table 5.9 Cont’dMajor Industrial Divisions
Major Townsand Sex
TotalEmployedPopulation
Agriculture,Hunting,Forestry& Fishing
Mining &Quarrying
Manufacturing
Electricity,Gas and
WaterSupply
Construction
WholeSaleand
RetailTrade
Hotelsand
Restaurants
Transport,Storage
andCommunica
tions
FinancialIntermedia
tion
RealEstate,Renting
andBusinessActivities
PublicAdministration
andDefence Education
JIMMA TOWNTotal 59,065 602 81 4,749 380 7,364 11,769 3,744 2,731 669 1,194 3,463Male 33,607 439 81 2,649 245 5,549 6,120 1,526 2,597 437 763 2,451Female 25,458 163 - 2,100 135 1,815 5,650 2,218 134 232 431 1,012
SHASHEMENE TOWNTotal 45,485 2,817 - 5,104 193 2,797 14,405 4,094 3,439 676 793 1,491Male 28,269 2,072 - 3,772 193 2,458 7,928 1,407 3,091 521 459 1,196Female 17,216 745 - 1,332 - 338 6,477 2,686 347 155 333 295
JIJIGA TOWNTotal 40,942 968 171 2,335 531 3,584 12,408 1,478 2,251 455 665 3,713Male 23,990 671 171 1,261 380 3,200 4,927 607 2,200 303 665 2,687Female 16,952 296 - 1,074 152 384 7,481 871 50 151 - 1,026
ASOSA TOWNTotal 17,931 1,071 24 1,394 223 1,788 3,247 1,707 966 132 755 2,128Male 10,159 678 24 712 197 1,414 1,701 360 917 89 486 1,446Female 7,772 393 - 682 26 373 1,545 1,346 49 43 269 682
HAWASSATOWN
Total 127,071 3,762 - 13,425 2,102 11,380 23,740 10,060 5,646 2,775 2,266 11,926Male 70,534 1,446 - 8,573 1,057 9,597 13,821 3,698 5,386 1,895 1,460 6,885Female 56,537 2,316 - 4,852 1,045 1,783 9,920 6,362 261 880 806 5,041
GAMBELLA TOWNTotal 17,486 667 28 1,104 83 1,474 2,038 2,964 360 324 230 4,147Male 9,326 416 - 507 55 1,211 1,132 428 306 240 145 2,499Female 8,160 251 28 597 28 263 906 2,536 54 84 85 1,648
HARAR TOWNTotal 49,969 538 565 6,007 770 3,894 16,349 1,361 1,504 734 692 5,184Male 26,901 538 512 3,624 565 3,357 6,189 285 1,455 338 487 3,117Female 23,068 - 53 2,383 205 537 10,160 1,076 49 397 205 2,067
ADDIS ABABA CITY ADMINISTRATIONTotal 1,250,842 5,904 4,934 162,016 11,175 108,369 262,548 76,648 97,060 42,626 49,114 72,212Male 709,206 4,520 3,192 101,765 9,445 88,369 159,385 27,427 89,581 21,819 26,032 36,330Female 541,635 1,384 1,742 60,251 1,729 19,999 103,163 49,221 7,479 20,808 23,082 35,881
DIRE DAWA TOWNTotal 101,204 2,850 622 10,794 1,409 7,068 31,443 5,159 6,775 888 1,340 5,518Male 54,588 1,408 622 5,539 1,156 5,615 14,016 1,025 6,360 709 1,062 4,552Female 46,617 1,441 - 5,254 253 1,453 17,426 4,134 415 179 278 966
Created by PDF Generator (http://www.alientools.com/), to remove this mark, please buy the software.

Created by PDF Generator (http://www.alientools.com/), to remove this mark, please buy the software.

Table 5.10 Currently Employed Population of Urban Areas Aged Ten Years and Above by Region, Sex and MinorIndustrial Divisions -COUNTRY TOTAL: 2012
RegionMinor Industrial Divisionsand Sex Total Tigray Afar Amhara Oromia Somalie
Benishangul-Gumuz SNNPR Gambela
TOTAL EMPLOYED PERSONSTotal 5,726,116 391,891 77,068 1,063,958 1,643,077 202,547 72,518 837,386 35,656Male 3,202,042 204,483 43,657 562,815 963,543 111,869 39,854 466,330 18,797Female 2,524,074 187,408 33,411 501,144 679,534 90,677 32,664 371,057 16,859
MAJOR GROUP 1:AGRICULTURE: - HUNTING ,FORESTRY AND FISHINGTotal 469,377 22,364 21,391 138,534 147,139 39,539 11,248 74,269 5,602Male 315,988 15,316 15,592 93,209 99,548 28,027 7,121 47,356 3,352Female 153,389 7,048 5,799 45,325 47,590 11,511 4,128 26,913 2,250
AGRICULTURE, HUNTING AND RELATED SERVICE ACTIVITIESTotal 441,247 21,599 16,341 131,551 140,336 38,220 9,886 70,472 4,069Male 299,221 14,892 11,259 90,753 95,012 26,770 6,190 45,473 2,579Female 142,026 6,707 5,082 40,798 45,324 11,450 3,696 24,998 1,491
Growing of crops; market gardening; horticultureTotal 215,428 9,238 12,484 58,030 69,967 19,036 4,985 35,765 2,351Male 151,183 6,080 8,773 36,573 52,197 14,573 2,928 25,221 2,048Female 64,245 3,158 3,711 21,457 17,770 4,463 2,057 10,544 303
Farming of animalsTotal 112,952 11,140 3,201 25,200 33,825 13,912 1,987 19,789 1,404Male 61,734 7,817 2,150 16,096 16,560 7,134 1,212 8,905 286Female 51,217 3,323 1,051 9,105 17,265 6,778 776 10,884 1,119
Growing of crops combined with farming of animals (mixed farming)Total 76,267 253 467 41,519 15,135 4,573 2,876 9,222 217Male 60,789 253 323 33,055 12,009 4,364 2,013 7,331 217Female 15,478 - 144 8,464 3,126 210 863 1,891
Agricultural and animal husbandry service activities, except veterinary activitiesTotal 36,028 742 189 6,802 21,409 699 37 5,696Male 25,168 742 13 5,030 14,246 699 37 4,016Female 10,859 - 176 1,772 7,163 - - 1,680
Hunting, trapping and game propagation including related service activitiesTotal 572 226 - - - - - -Male 346 - - - - - - -Female 226 226 - - - - - -
FORESTRY, LOGGING AND RELATED SERVICE ACTIVITIESTotal 26,336 765 4,763 6,881 6,803 1,319 1,362 3,373 897Male 15,318 424 4,046 2,354 4,536 1,258 931 1,458 137Female 11,018 341 717 4,527 2,266 61 431 1,915 759
Created by PDF Generator (http://www.alientools.com/), to remove this mark, please buy the software.

Table 5.10 Cont’dRegionMinor Industrial Divisions
and Sex Total Tigray Afar Amhara Oromia SomalieBenishangul
-Gumuz SNNPR GambelaForestry, logging and related service activities
Total 26,336 765 4,763 6,881 6,803 1,319 1,362 3,373 897Male 15,318 424 4,046 2,354 4,536 1,258 931 1,458 137Female 11,018 341 717 4,527 2,266 61 431 1,915 759
FISHINGTotal 1,795 - 287 102 - - - 424 636Male 1,449 - 287 102 - - - 424 636Female 346 - - - - - - -
Fishing, operation of fish hatcheries and fish farms; service activities incidental toFishing
Total 1,795 - 287 102 - - - 424 636Male 1,449 - 287 102 - - - 424 636Female 346 - - - - - - -
MAJOR GROUP 2: MINING AND QUARRYINGTotal 21,374 5,111 260 5,416 1,092 171 77 3,098Male 16,486 4,360 224 4,708 781 171 77 1,838Female 4,888 751 36 708 311 - - 1,260
MINING OF COAL AND LIGNITE; EXTRACTION OF PEATTotal 142 - - 103 39 - - -Male 142 - - 103 39 - - -Female - - - - - - - -
Mining and agglomeration of hard coalTotal 142 - - 103 39 - - -Male 142 - - 103 39 - - -Female - - - - - - - -
Mining and agglomeration of ligniteTotal - - - - - - - -Male - - - - - - - -Female - - - - - - - -
Extraction and agglomeration of peatTotal - - - - - - - -Male - - - - - - - -Female - - - - - - - -
Created by PDF Generator (http://www.alientools.com/), to remove this mark, please buy the software.

Table 5.10 Cont’dRegionMinor Industrial Divisions
and Sex Total Tigray Afar Amhara Oromia SomalieBenishangul
-Gumuz SNNPR GambelaEXTRACTION OF CRUDE PETROLEUM AND NATURAL GAS; SERVICE ACTIVITIES
Total 1,284 277 - - - - - 210Male 938 277 - - - - - 210Female 346 - - - - - - -
Extraction of crude petroleum and natural gasTotal 346 - - - - - - -Male 346 - - - - - - -Female - - - - - - - -
Service activities incidental to oil and gas extraction excludingsurveying
Total 938 277 - - - - - 210Male 592 277 - - - - - 210Female 346 - - - - - - -
MINING OF GOLD, COPPER AND AS WELL AS URANIUM AND THORIUM ORESTotal 612 612 - - - - - -Male 612 612 - - - - - -Female - - - - - - - -
Mining of gold,copper and as well as uranium and thorium oresTotal 612 612 - - - - - -Male 612 612 - - - - - -Female - - - - - - - -
MINING OF METAL ORESTotal 4,896 2,532 - - 311 - 54 210Male 3,467 2,176 - - - - 54 210Female 1,429 356 - - 311 - - -
Mining of iron oresTotal 455 109 - - - - - -Male 455 109 - - - - - -Female - - - - - - - -
Mining of non-ferrous metal ores, except uranium and thorium oresTotal 4,441 2,423 - - 311 - 54 210Male 3,012 2,067 - - - - 54 210Female 1,429 356 - - 311 - - -
OTHER MINING AND QUARRYINGTotal 14,439 1,690 260 5,313 742 171 24 2,677Male 11,326 1,294 224 4,605 742 171 24 1,418Female 3,113 396 36 708 - - - 1,260
Created by PDF Generator (http://www.alientools.com/), to remove this mark, please buy the software.

Table 5.10 Cont’dRegionMinor Industrial Divisions
and Sex Total Tigray Afar Amhara Oromia SomalieBenishangul
-Gumuz SNNPR GambelaQuarrying of stone, sand and clay
Total 12,808 1,294 188 5,231 475 171 24 2,677Male 10,414 1,294 188 4,523 475 171 24 1,418Female 2,394 - - 708 - - - 1,260
Mining and quarrying n.e.c.Total 1,631 396 72 82 267 - - -Male 912 - 36 82 267 - - -Female 719 396 36 - - - - -
MAJOR GROUP 3: MANUFACTURINGTotal 757,055 70,706 7,464 151,510 247,198 5,029 7,561 87,083 1,687Male 419,831 36,355 4,302 76,413 146,747 2,361 2,984 39,035 706Female 337,224 34,351 3,162 75,098 100,451 2,668 4,577 48,048 981
MANUFACTURE OF FOOD PRODUCTS AND BEVERAGESTotal 215,162 10,695 5,337 29,931 95,052 2,276 785 30,932 711Male 101,232 4,466 2,913 13,017 51,882 838 106 9,049Female 113,930 6,229 2,424 16,915 43,169 1,438 680 21,884 657
Production, processing and preservation of meat, fish, fruit,vegetables,oils and fatsTotal 14,206 841 287 2,013 5,949 419 28 1,398Male 9,844 403 287 1,153 3,931 314 28 977Female 4,361 438 - 860 2,018 105 - 421
Manufacture of dairy productsTotal 2,467 - - 1,642 264 139 - 77Male 1,219 - - 703 170 - - -Female 1,248 - - 939 94 139 - 77
Manufacture of grain mill products, starches and starch products, and prepared animalfeeds
Total 72,441 5,375 466 8,429 44,295 271 131 5,663 232Male 50,995 2,112 454 6,028 34,308 210 23 3,344Female 21,446 3,263 12 2,401 9,987 61 108 2,320 205
Manufacture of other food productsTotal 95,666 3,927 4,584 11,387 31,811 1,398 626 20,338 392Male 23,981 1,614 2,172 2,281 6,849 314 54 4,021Female 71,684 2,313 2,412 9,107 24,962 1,083 572 16,317 392
Manufacture of beveragesTotal 30,382 552 - 6,460 12,732 51 - 3,457Male 15,192 337 - 2,852 6,623 - - 707Female 15,190 215 - 3,608 6,109 51 - 2,750
Created by PDF Generator (http://www.alientools.com/), to remove this mark, please buy the software.

Table 5.10 Cont’dRegionMinor Industrial Divisions
and Sex Total Tigray Afar Amhara Oromia SomalieBenishangul
-Gumuz SNNPR GambelaMANUFACTURE OF TOBACCO AND LOCAL BEVERAGEPRODUCTS
Total 31,299 323 - 4,482 8,546 - 2,967 14,216Male 1,365 - - 407 498 - 460 -Female 29,935 323 - 4,075 8,048 - 2,507 14,216
Manufacture of tobacco productsTotal 2,482 - - 1,221 915 - - -Male 407 - - 407 - - - -Female 2,075 - - 814 915 - - -
Manufacture and Wholesale of tela and bordeTotal 2,037 323 - - 1,434 - - 280Male - - - - - - - -Female 2,037 323 - - 1,434 - - 280
Manufacture and Wholesale of tejiTotal 447 - - - 166 - - 280Male 112 - - - 112 - - -Female 335 - - - 55 - - 280
Manufacture and Wholesale of Areke/katikela/Total 26,333 - - 3,261 6,031 - 2,967 13,655Male 846 - - - 386 - 460 -Female 25,487 - - 3,261 5,644 - 2,507 13,655
MANUFACTURE OF TEXTILESTotal 176,353 25,619 455 63,063 44,264 664 413 10,946 118Male 79,859 9,319 144 24,206 22,380 298 138 3,994Female 96,494 16,300 311 38,857 21,884 367 276 6,951 118
Spinning, weaving and finishing of textilesTotal 144,798 24,671 431 53,519 33,141 419 62 8,727Male 70,669 9,220 144 20,827 19,163 210 62 3,841Female 74,129 15,451 287 32,692 13,978 210 - 4,886
Manufacture of other textilesTotal 23,279 208 24 8,414 8,072 245 76 958Male 8,450 - - 3,379 2,921 88 76 153Female 14,829 208 24 5,035 5,151 157 - 804
Manufacture of knitted and crocheted fabrics and articlesTotal 8,276 740 - 1,129 3,051 - 276 1,261Male 741 99 - - 296 - - -Female 7,536 642 - 1,129 2,755 - 276 1,261
Created by PDF Generator (http://www.alientools.com/), to remove this mark, please buy the software.

Table 5.10 Cont’dRegionMinor Industrial Divisions
and Sex Total Tigray Afar Amhara Oromia SomalieBenishangul
-Gumuz SNNPR GambelaMANUFACTURE OF WEARING APPAREL; DRESSING AND DYEING OF FUR
Total 41,514 6,345 356 6,585 12,480 871 536 6,149 335Male 29,245 3,422 180 4,415 10,466 213 420 5,787 308Female 12,269 2,923 176 2,171 2,015 659 116 362
Manufacture of wearing apparel, except fur apparelTotal 41,305 6,345 356 6,585 12,271 871 536 6,149 335Male 29,245 3,422 180 4,415 10,466 213 420 5,787 308Female 12,060 2,923 176 2,171 1,806 659 116 362
Dressing and dyeing of fur; manufacture of articles of furTotal 209 - - - 209 - - -Male - - - - - - - -Female 209 - - - 209 - - -
TANNING AND DRESSING OF LEATHER; MANUFACTURE OF LUGGAGE,HANDBAGS, SADDLER, HARNESS AND FOOTWEAR
Total 18,059 1,260 - 900 5,234 105 107 795Male 9,546 481 - 237 4,495 105 107 515Female 8,513 779 - 663 739 - - 280
Tanning and dressing of leather; manufacture of luggage, handbags,saddler and HarnessTotal 4,832 583 - 853 689 - 107 680Male 2,384 217 - 237 635 - 107 399Female 2,449 366 - 616 55 - - 280
Manufacture of footwearTotal 13,226 677 - 47 4,544 105 - 115Male 7,162 264 - - 3,860 105 - 115Female 6,064 414 - 47 684 - - -
MANUFACTURE OF WOOD AND OF PRODUCTS OF WOOD AND CORK, EXCEPTFURNITURE; MANUFACTURE OF ARTICLES OF STRAW AND PLAITING MATERIALS
Total 40,449 4,418 - 8,855 13,298 - 455 7,193Male 34,898 3,800 - 6,593 12,153 - 422 6,738Female 5,551 618 - 2,262 1,144 - 33 455
Saw milling and planning of woodTotal 4,751 - - 1,849 1,044 - - 474Male 2,878 - - 525 941 - - 374Female 1,873 - - 1,325 102 - - 100
Manufacture of products of wood, cork, straw and plaiting materials in forestTotal 35,697 4,418 - 7,005 12,254 - 455 6,719Male 32,019 3,800 - 6,068 11,212 - 422 6,364
Created by PDF Generator (http://www.alientools.com/), to remove this mark, please buy the software.

Table 5.10 Cont’dRegionMinor Industrial Divisions
and Sex Total Tigray Afar Amhara Oromia SomalieBenishangul
-Gumuz SNNPR GambelaFemale 3,678 618 - 937 1,042 - 33 355
MANUFACTURE OF PAPER AND PAPER PRODUCTSTotal 2,384 - - - 296 - - -Male 1,939 - - - 209 - - -Female 445 - - - 87 - - -
Manufacture of paper and paper products Manufacture of other articles of paperand paperboard
Total 2,384 - - - 296 - - -Male 1,939 - - - 209 - - -Female 445 - - - 87 - - -
PUBLISHING, PRINTING AND REPRODUCTION OF RECORDED MEDIATotal 12,804 300 - 845 2,299 101 211 832Male 5,180 300 - 466 853 - 188 200Female 7,624 - - 379 1,446 101 23 631
PublishingTotal 8,350 300 - 560 1,649 101 92 463Male 3,185 300 - 237 397 - 69 100Female 5,165 - - 323 1,253 101 23 363
Printing and service activities related to printingTotal 4,233 - - 285 549 - - 368Male 1,775 - - 228 356 - - 100Female 2,458 - - 56 193 - - 268
Reproduction of recorded mediaTotal 220 - - - 101 - 119 -Male 220 - - - 101 - 119 -Female - - - - - - - -
MANUFACTURE OF COKE, REFINED PETROLEUM PRODUCTS ANDNUCLEAR FUEL
Total 2,555 - - - 465 - - 1,051Male 1,879 - - - - - - 841Female 676 - - - 465 - - 210
Manufacture of coke oven productsTotal - - - - - - - -Male - - - - - - - -Female - - - - - - - -
Created by PDF Generator (http://www.alientools.com/), to remove this mark, please buy the software.

Table 5.10 Cont’dRegionMinor Industrial Divisions
and Sex Total Tigray Afar Amhara Oromia SomalieBenishangul
-Gumuz SNNPR GambelaManufacture of refined petroleum products
Total 1,744 - - - - - - 1,051Male 1,533 - - - - - - 841Female 210 - - - - - - 210
Processing of nuclear fuelTotal 811 - - - 465 - - -Male 346 - - - - - - -Female 465 - - - 465 - - -
MANUFACTURE OF CHEMICALS AND CHEMICAL PRODUCTSTotal 11,084 406 - - 4,903 52 - 987Male 7,915 203 - - 4,569 - - 777Female 3,169 203 - - 334 52 - 210
Manufacture of basic chemicals Manufacture of basic chemicals, except fertilizersand nitrogen compounds
Total 1,670 - - - 768 - - 210Male 1,257 - - - 565 - - -Female 413 - - - 202 - - 210
Manufacture of other chemical products and of plastics in primery formsTotal 9,414 406 - - 4,135 52 - 777Male 6,658 203 - - 4,004 - - 777Female 2,756 203 - - 131 52 - -
Manufacture of man-made fibresTotal - - - - - - - -Male - - - - - - - -Female - - - - - - - -
MANUFACTURE OF RUBBER AND PLASTICS PRODUCTSTotal 16,136 541 - 55 6,172 - 62 134Male 9,297 155 - 55 2,540 - - 134Female 6,839 386 - - 3,632 - 62 -
Manufacture of rubber productsTotal 3,226 277 - 55 128 - 62 134Male 2,334 - - 55 128 - - 134Female 892 277 - - - - 62 -
Manufacture of plastic productsTotal 12,909 264 - - 6,045 - - -Male 6,963 155 - - 2,413 - - -Female 5,946 109 - - 3,632 - - -
Created by PDF Generator (http://www.alientools.com/), to remove this mark, please buy the software.
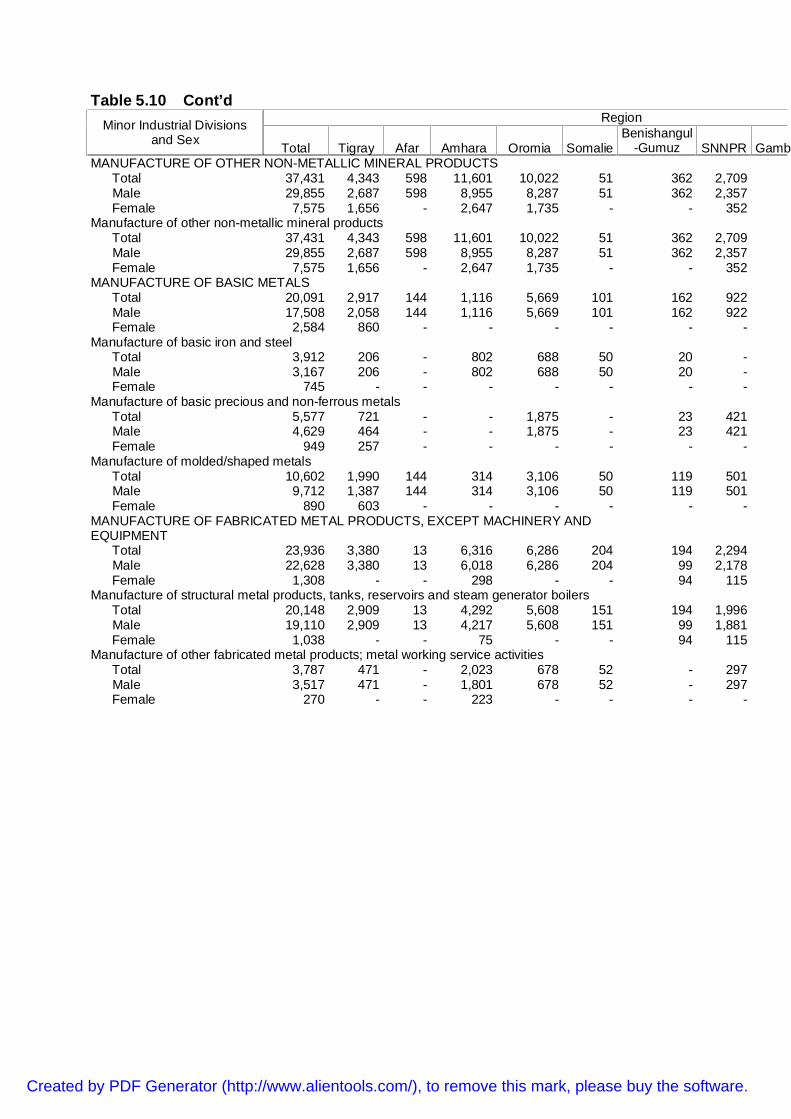
Table 5.10 Cont’dRegionMinor Industrial Divisions
and Sex Total Tigray Afar Amhara Oromia SomalieBenishangul
-Gumuz SNNPR GambelaMANUFACTURE OF OTHER NON-METALLIC MINERAL PRODUCTS
Total 37,431 4,343 598 11,601 10,022 51 362 2,709Male 29,855 2,687 598 8,955 8,287 51 362 2,357Female 7,575 1,656 - 2,647 1,735 - - 352
Manufacture of other non-metallic mineral productsTotal 37,431 4,343 598 11,601 10,022 51 362 2,709Male 29,855 2,687 598 8,955 8,287 51 362 2,357Female 7,575 1,656 - 2,647 1,735 - - 352
MANUFACTURE OF BASIC METALSTotal 20,091 2,917 144 1,116 5,669 101 162 922Male 17,508 2,058 144 1,116 5,669 101 162 922Female 2,584 860 - - - - - -
Manufacture of basic iron and steelTotal 3,912 206 - 802 688 50 20 -Male 3,167 206 - 802 688 50 20 -Female 745 - - - - - - -
Manufacture of basic precious and non-ferrous metalsTotal 5,577 721 - - 1,875 - 23 421Male 4,629 464 - - 1,875 - 23 421Female 949 257 - - - - - -
Manufacture of molded/shaped metalsTotal 10,602 1,990 144 314 3,106 50 119 501Male 9,712 1,387 144 314 3,106 50 119 501Female 890 603 - - - - - -
MANUFACTURE OF FABRICATED METAL PRODUCTS, EXCEPT MACHINERY ANDEQUIPMENT
Total 23,936 3,380 13 6,316 6,286 204 194 2,294Male 22,628 3,380 13 6,018 6,286 204 99 2,178Female 1,308 - - 298 - - 94 115
Manufacture of structural metal products, tanks, reservoirs and steam generator boilersTotal 20,148 2,909 13 4,292 5,608 151 194 1,996Male 19,110 2,909 13 4,217 5,608 151 99 1,881Female 1,038 - - 75 - - 94 115
Manufacture of other fabricated metal products; metal working service activitiesTotal 3,787 471 - 2,023 678 52 - 297Male 3,517 471 - 1,801 678 52 - 297Female 270 - - 223 - - - -
Created by PDF Generator (http://www.alientools.com/), to remove this mark, please buy the software.

Table 5.10 Cont’dRegionMinor Industrial Divisions
and Sex Total Tigray Afar Amhara Oromia SomalieBenishangul
-Gumuz SNNPR GambelaMANUFACTURE OF MACHINERY AND EQUIPMENT N.E.C.
Total 6,355 118 - 808 2,381 51 74 420Male 3,996 - - 808 943 51 37 -Female 2,359 118 - - 1,438 - 37 420
Manufacture of general purpose machineryTotal 2,138 118 - 413 791 51 - 420Male 946 - - 413 136 51 - -Female 1,192 118 - - 655 - - 420
Manufacture of special purpose machineryTotal 3,741 - - - 1,590 - 74 -Male 2,575 - - - 807 - 37 -Female 1,166 - - - 783 - 37 -
Manufacture of domestic appliances n.e.c.Total 476 - - 395 - - - -Male 476 - - 395 - - - -Female - - - - - - - -
MANUFACTURE OF OFFICE, ACCOUNTING AND COMPUTING MACHINERYTotal 1,854 - - - - 50 - 420Male 420 - - - - - - 420Female 1,435 - - - - 50 - -
Manufacture of office, accounting and computing machineryTotal 1,854 - - - - 50 - 420Male 420 - - - - - - 420Female 1,435 - - - - 50 - -
MANUFACTURE OF ELECTRICAL MACHINERY AND APPARATUS N.E.C.Total 3,660 607 - - 696 52 - -Male 3,449 396 - - 696 52 - -Female 211 211 - - - - - -
Manufacture of electric motors, generators and transformersTotal 1,032 - - - - 52 - -Male 1,032 - - - - 52 - -Female - - - - - - - -
Manufacture of electricity distribution and control apparatusTotal 2,063 607 - - 418 - - -Male 1,852 396 - - 418 - - -Female 211 211 - - - - - -
Created by PDF Generator (http://www.alientools.com/), to remove this mark, please buy the software.

Table 5.10 Cont’dRegionMinor Industrial Divisions
and Sex Total Tigray Afar Amhara Oromia SomalieBenishangul
-Gumuz SNNPR GambelaManufacture of insulted wire and cable
Total - - - - - - - -Male - - - - - - - -Female - - - - - - - -
Manufacture of accumulators, primary cells and primary batteriesTotal 287 - - - - - - -Male 287 - - - - - - -Female - - - - - - - -
Manufacture of electric lamps and lighting equipmentTotal - - - - - - - -Male - - - - - - - -Female - - - - - - - -
Manufacture of other electrical equipment n.e.c.Total 278 - - - 278 - - -Male 278 - - - 278 - - -Female - - - - - - - -
MANUFACTURE OF RADIO, TELEVISION AND COMMUNICATIONEQUIPMENT AND APPARATUS
Total 2,202 - - 100 768 - - 299Male 2,116 - - 100 682 - - 299Female 86 - - - 86 - - -
Manufacture of electronic valves and tubes and other electronic componentsTotal 817 - - - 470 - - -Male 817 - - - 470 - - -Female - - - - - - - -
Manufacture of television and radio transmitters and apparatus for line telephonyandlinetelegraphy
Total 134 - - - 101 - - -Male 91 - - - 58 - - -Female 42 - - - 42 - - -
Manufacture of television and radio receivers, sound or video recording or reproducing apparatus, andassociated goods
Total 1,252 - - 100 197 - - 299Male 1,208 - - 100 154 - - 299Female 44 - - - 44 - - -
Created by PDF Generator (http://www.alientools.com/), to remove this mark, please buy the software.

Table 5.10 Cont’dRegionMinor Industrial Divisions
and Sex Total Tigray Afar Amhara Oromia SomalieBenishangul
-Gumuz SNNPR GambelaMANUFACTURE OF MEDICAL, PRECISION AND OPTICALINSTRUMENTS,WATCHES AND CLOCKS
Total 1,751 203 - - 509 - - -Male 1,147 203 - - 252 - - -Female 604 - - - 258 - - -
Manufacture of medical appliances and instruments and appliances for measuring,checking, testing, navigating and other purposes, except optical Instrument
Total 1,059 203 - - 509 - - -Male 801 203 - - 252 - - -Female 258 - - - 258 - - -
Manufacture of optical instruments and photographic equipmentTotal 692 - - - - - - -Male 346 - - - - - - -Female 346 - - - - - - -
Manufacture of watches and clocksTotal - - - - - - - -Male - - - - - - - -Female - - - - - - - -
MANUFACTURE OF MOTOR VEHICLES, TRAILERS AND SEMI-TRAILERSTotal 10,301 2,234 - 1,060 2,054 50 - -Male 9,182 1,696 - 662 1,872 50 - -Female 1,119 538 - 398 183 - - -
Manufacture of motor vehiclesTotal 734 218 - - 170 - - -Male 625 109 - - 170 - - -Female 109 109 - - - - - -
Manufacture of bodies (coachwork) for motor vehicles; manufacture oftrailers and semi- trailers
Total 9,567 2,016 - 1,060 1,884 50 - -Male 8,557 1,587 - 662 1,701 50 - -Female 1,010 429 - 398 183 - - -
MANUFACTURE OF OTHER TRANSPORT EQUIPMENTTotal 3,152 104 - 795 1,215 50 - 332Male 2,808 104 - 795 1,034 50 - 168Female 344 - - - 181 - - 163
Created by PDF Generator (http://www.alientools.com/), to remove this mark, please buy the software.

Table 5.10 Cont’dRegionMinor Industrial Divisions
and Sex Total Tigray Afar Amhara Oromia SomalieBenishangul
-Gumuz SNNPR GambelaBuilding and repairing of ships and boats/repairing of railway, aircraft,manufacture of bicycle/
Total 882 - - 573 - - - -Male 882 - - 573 - - - -Female - - - - - - - -
Manufacture of railway and tramway locomotives and rolling stockTotal 152 - - - 152 - - -Male 54 - - - 54 - - -Female 98 - - - 98 - - -
Manufacture of aircraft and spacecraftTotal 170 - - - 170 - - -Male 88 - - - 88 - - -Female 82 - - - 82 - - -
Manufacture of transport equipment n.e.c.Total 1,948 104 - 223 892 50 - 332Male 1,784 104 - 223 892 50 - 168Female 163 - - - - - - 163
MANUFACTURE OF FURNITURE; MANUFACTURING N.E.C.Total 75,976 6,616 562 14,998 23,847 349 1,209 6,118 201Male 41,821 3,409 311 8,564 10,239 349 460 4,319Female 34,156 3,207 251 6,434 13,608 - 749 1,798 104
Manufacture of household and office furnitureTotal 75,976 6,616 562 14,998 23,847 349 1,209 6,118 201Male 41,821 3,409 311 8,564 10,239 349 460 4,319Female 34,156 3,207 251 6,434 13,608 - 749 1,798 104
RICYCLINGTotal 2,546 277 - - 742 - 24 336Male 2,546 277 - - 742 - 24 336Female - - - - - - - -
Recycling of metal waste and scrapTotal 1,456 - - - 742 - - 336Male 1,456 - - - 742 - - 336Female - - - - - - - -
Recycling of non-metal waste and scrapTotal 1,090 277 - - - - 24 -Male 1,090 277 - - - - 24 -Female - - - - - - - -
Created by PDF Generator (http://www.alientools.com/), to remove this mark, please buy the software.

Table 5.10 Cont’dRegionMinor Industrial Divisions
and Sex Total Tigray Afar Amhara Oromia SomalieBenishangul
-Gumuz SNNPR GambelaMAJOR GROUP 4: ELECTRICITY, GAS AND WATER SUPPLY
Total 53,226 4,130 2,235 10,690 14,537 3,471 537 4,188Male 38,176 2,912 1,755 6,264 10,649 2,266 511 2,596Female 15,050 1,218 480 4,427 3,888 1,205 26 1,591
ELECTRICITY, GAS, STEAM AND HOT WATER SUPPLYTotal 22,024 2,242 323 3,398 6,324 151 173 1,844Male 19,956 2,023 299 3,248 5,765 101 173 1,499Female 2,068 220 24 150 559 50 - 345
Production, collection and distribution of electricityTotal 19,555 2,119 323 3,248 5,973 151 153 1,844Male 17,686 1,900 299 3,248 5,413 101 153 1,499Female 1,869 220 24 - 559 50 - 345
Manufacture of gas; distribution of gaseous fuels through mainsTotal 2,019 123 - 46 351 - 20 -Male 1,924 123 - - 351 - 20 -Female 96 - - 46 - - - -
Steam and hot water supplyTotal 450 - - 103 - - - -Male 346 - - - - - - -Female 103 - - 103 - - - -
COLLECTION, PURIFICATION AND DISTRIBUTION OF WATERTotal 31,202 1,888 1,912 7,292 8,213 3,320 364 2,343Male 18,220 890 1,456 3,015 4,884 2,165 338 1,097Female 12,982 998 456 4,277 3,328 1,155 26 1,246
Collection, purification and distribution of waterTotal 31,202 1,888 1,912 7,292 8,213 3,320 364 2,343Male 18,220 890 1,456 3,015 4,884 2,165 338 1,097Female 12,982 998 456 4,277 3,328 1,155 26 1,246
MAJOR GROUP 5: CONSTRUCTIONTotal 395,129 27,780 5,037 77,790 95,075 7,511 9,318 51,559 1,728Male 324,893 23,472 3,854 58,622 82,534 7,127 6,501 44,066 1,377Female 70,235 4,309 1,183 19,168 12,541 384 2,817 7,493 351
CONSTRUCTIONTotal 395,129 27,780 5,037 77,790 95,075 7,511 9,318 51,559 1,728Male 324,893 23,472 3,854 58,622 82,534 7,127 6,501 44,066 1,377Female 70,235 4,309 1,183 19,168 12,541 384 2,817 7,493 351
Created by PDF Generator (http://www.alientools.com/), to remove this mark, please buy the software.

Table 5.10 Cont’dRegionMinor Industrial Divisions
and Sex Total Tigray Afar Amhara Oromia SomalieBenishangul
-Gumuz SNNPR GambelaSite preparation
Total 49,577 4,316 12 8,322 7,815 2,043 235 3,545Male 41,216 3,598 12 5,954 7,191 1,973 125 3,079Female 8,361 718 - 2,367 624 70 109 466
Building complete construction or parts thereof; civil engineeringTotal 283,251 18,740 4,833 60,178 71,046 4,085 8,780 40,108 1,359Male 229,639 16,146 3,650 45,066 61,404 3,923 6,072 33,693 1,124Female 53,612 2,594 1,183 15,112 9,642 162 2,708 6,415 235
Building installationTotal 15,339 612 48 2,953 3,448 101 246 1,548 152Male 13,952 612 48 2,881 2,530 51 246 1,548 152Female 1,387 - - 72 918 51 - -
Building completionTotal 43,995 4,113 144 6,338 12,058 1,281 57 6,358 188Male 37,812 3,116 144 4,721 10,701 1,180 57 5,746 100Female 6,183 997 - 1,616 1,357 101 - 612
Renting of construction or demolition equipment with operatorTotal 2,966 - - - 707 - - -Male 2,273 - - - 707 - - -Female 692 - - - - - - -
MAJOR GROUP 6 : WHOLESALE AND RETAIL TRADE; REPAIR OF MOTOR VEHICLES,MOTORCYCLESAND PERSONAL AND HOUSEHOLD GOODS
Total 1,235,258 70,372 12,953 201,437 385,964 68,517 11,281 168,955 5,440Male 625,873 31,862 5,116 87,026 193,652 25,144 6,250 94,180 3,052Female 609,386 38,510 7,837 114,410 192,312 43,373 5,031 74,776 2,388
WHOLESALE AND RETAIL TRADE; REPAIR OF MOTOR VEHICLES,MOTORCYCLES ANDPERSONAL AND HOUSEHOLD GOODS
Total 58,493 2,478 287 3,997 10,351 618 165 7,907 135Male 51,684 2,227 275 3,856 10,086 618 165 7,806 135Female 6,808 251 12 140 265 - - 101
Sale of motor vehiclesTotal 1,618 - - - - - - 133Male 569 - - - - - - 133Female 1,050 - - - - - - -
Created by PDF Generator (http://www.alientools.com/), to remove this mark, please buy the software.

Table 5.10 Cont’dRegionMinor Industrial Divisions
and Sex Total Tigray Afar Amhara Oromia SomalieBenishangul
-Gumuz SNNPR GambelaMaintenance and repair of motor vehicles,carwashing and greasing
Total 37,879 1,628 48 2,754 6,007 560 43 5,127 135Male 35,445 1,378 48 2,709 5,957 560 43 5,127 135Female 2,434 251 - 45 50 - - -
Sale of motor vehicle parts and accessoriesTotal 6,799 356 - 583 559 58 46 479Male 5,072 356 - 488 433 58 46 479Female 1,728 - - 95 127 - - -
Sale, maintenance and repair of motorcycles and related parts and accessoriesTotal 4,854 - 72 519 1,117 - 76 757Male 4,508 - 72 519 1,117 - 76 757Female 346 - - - - - - -
Retail sale of automotive fuelTotal 7,341 494 168 140 2,666 - - 1,410Male 6,090 494 156 140 2,579 - - 1,310Female 1,251 - 12 - 88 - - 101
WHOLESALE AGENCIES, IMPORTERS AND EXPORTERS, DISTRIBUTORS,BROKERS AND TENDER
Total 181,180 9,802 2,457 24,580 54,777 4,524 882 27,283 382Male 109,933 5,482 1,657 13,997 35,174 2,837 672 15,349 198Female 71,247 4,320 800 10,583 19,602 1,687 211 11,933 185
Wholesale agencies,importers and exporters,ditributers,brokers andtender
Total 44,456 844 391 700 14,283 917 114 9,676 262Male 30,300 746 331 643 11,505 657 114 4,913Female 14,156 99 60 56 2,778 260 - 4,763 185
Wholesale of agricultural raw materials, live animals, food, beverages and tobaccoTotal 77,137 3,998 2,018 16,526 26,649 2,600 768 10,561 120Male 38,986 1,588 1,290 9,239 12,294 1,648 557 4,942 120Female 38,151 2,410 728 7,287 14,355 951 211 5,619
Wholesale of household goodsTotal 46,852 4,072 12 7,066 9,684 1,007 - 6,613Male 30,952 2,416 - 4,009 7,250 532 - 5,061Female 15,900 1,657 12 3,057 2,434 475 - 1,551
Wholesale of non-agricultural intermediate products, waste and scrapTotal 7,231 255 36 289 1,769 - - 433Male 5,419 255 36 107 1,769 - - 433
Created by PDF Generator (http://www.alientools.com/), to remove this mark, please buy the software.

Table 5.10 Cont’dRegionMinor Industrial Divisions
and Sex Total Tigray Afar Amhara Oromia SomalieBenishangul
-Gumuz SNNPR GambelaFemale 1,812 - - 182 - - - -
Wholesale of machinery,equpment and suppliesTotal 5,503 633 - - 2,391 - - -Male 4,275 478 - - 2,356 - - -Female 1,228 155 - - 35 - - -
Other wholesaleTotal - - - - - - - -Male - - - - - - - -Female - - - - - - - -
RETAIL TRADE, OF MOTOR VEHICLES AND MOTORCYCLES; REPAIR OF PERSONAL AND HOUSEHOLD GOODSTotal 995,586 58,092 10,208 172,860 320,837 63,375 10,233 133,766 4,923Male 464,256 24,152 3,183 69,173 148,392 21,689 5,413 71,024 2,720Female 531,330 33,939 7,025 103,687 172,445 41,687 4,820 62,742 2,204
Non-specialized retail trade in storesTotal 182,268 17,165 1,955 25,094 57,952 14,570 1,976 17,752 865Male 95,129 6,583 1,013 7,810 33,103 7,193 1,268 11,682 668Female 87,139 10,583 943 17,284 24,850 7,376 708 6,070 197
Retail sale of food, beverages and tobacco in specialized storesTotal 217,740 7,704 1,840 40,883 87,037 10,409 2,678 39,551 916Male 85,584 3,268 48 17,863 31,562 3,056 1,577 16,447 466Female 132,156 4,436 1,792 23,020 55,475 7,353 1,101 23,104 450
Other retail trade of new goods in specialized storesTotal 148,450 10,176 142 21,128 42,664 4,582 1,483 13,814 198Male 96,778 7,329 107 12,762 29,646 3,398 880 8,594Female 51,671 2,847 35 8,366 13,018 1,184 603 5,220
Retail sale of second-hand goods in storesTotal 13,325 449 - 1,315 5,214 600 76 2,521Male 10,778 340 - 921 4,067 234 76 2,338Female 2,547 109 - 395 1,147 367 - 184
Retail trade not in storesTotal 387,120 21,844 4,990 78,996 115,593 31,676 3,780 48,475 2,492Male 146,867 6,306 1,636 26,019 43,527 6,738 1,535 24,753 1,033Female 240,253 15,538 3,354 52,977 72,065 24,937 2,245 23,722 1,458
Repair of personal and household goodsTotal 46,683 754 1,281 5,443 12,377 1,539 240 11,654 426Male 29,119 327 380 3,798 6,488 1,069 77 7,211 426Female 17,564 427 901 1,645 5,889 470 163 4,442
Created by PDF Generator (http://www.alientools.com/), to remove this mark, please buy the software.

Table 5.10 Cont’dRegionMinor Industrial Divisions
and Sex Total Tigray Afar Amhara Oromia SomalieBenishangul
-Gumuz SNNPR GambelaMAJOR GROUP 7: HOTELS AND RESTAURANTS
Total 457,810 42,973 5,798 93,341 137,416 8,710 6,506 73,563 6,334Male 112,237 4,228 1,434 12,320 39,899 2,494 1,233 21,349 543Female 345,572 38,746 4,364 81,021 97,517 6,216 5,274 52,213 5,791
HOTELS AND RESTAURANTSTotal 457,810 42,973 5,798 93,341 137,416 8,710 6,506 73,563 6,334Male 112,237 4,228 1,434 12,320 39,899 2,494 1,233 21,349 543Female 345,572 38,746 4,364 81,021 97,517 6,216 5,274 52,213 5,791
Hotels; camping sites and other provision of short-stayaccommodation
Total 98,950 10,016 1,093 12,243 21,522 469 591 11,491 180Male 38,876 2,351 705 3,748 10,952 418 199 3,876Female 60,074 7,665 388 8,495 10,570 51 392 7,615 180
Restaurants, bars and canteensTotal 358,859 32,957 4,705 81,098 115,894 8,241 5,916 62,071 6,154Male 73,361 1,877 729 8,573 28,947 2,075 1,034 17,473 543Female 285,498 31,080 3,976 72,526 86,947 6,166 4,882 44,598 5,611
MAJOR GROUP 8:TRANSPORT, STORAGE AND COMMUNICATIONSTotal 260,370 16,431 2,232 30,135 67,455 6,129 1,651 30,520 478Male 246,962 15,396 2,032 29,104 65,798 6,078 1,526 29,208 424Female 13,407 1,036 200 1,030 1,657 50 125 1,312
LAND TRANSPORT; TRANSPORT VIA PIPELINESTotal 215,229 14,017 2,074 25,773 58,929 5,226 1,164 25,784 309Male 210,730 13,740 1,886 25,594 57,754 5,226 1,114 25,293 309Female 4,499 277 188 179 1,175 - 49 491
Transport via railwaysTotal 448 - - - 102 - - -Male 448 - - - 102 - - -Female - - - - - - - -
Other land transportTotal 214,781 14,017 2,074 25,773 58,827 5,226 1,164 25,784 309Male 210,282 13,740 1,886 25,594 57,652 5,226 1,114 25,293 309Female 4,499 277 188 179 1,175 - 49 491
WATER TRANSPORTTotal 1,399 - 36 384 - - 53 926Male 1,050 - 36 315 - - 53 646Female 349 - - 69 - - - 280
Created by PDF Generator (http://www.alientools.com/), to remove this mark, please buy the software.

Table 5.10 Cont’dRegionMinor Industrial Divisions
and Sex Total Tigray Afar Amhara Oromia SomalieBenishangul
-Gumuz SNNPR GambelaSea and coastal water transport
Total 1,176 - 36 161 - - 53 926Male 827 - 36 92 - - 53 646Female 349 - - 69 - - - 280
Inland water transportTotal 223 - - 223 - - - -Male 223 - - 223 - - - -Female - - - - - - - -
AIR TRANSPORTTotal 7,573 838 - 217 658 51 24 257Male 5,114 475 - 117 614 51 24 257Female 2,460 363 - 100 44 - - -
Scheduled air transportTotal 6,589 838 - 72 658 - 24 257Male 4,230 475 - 72 614 - 24 257Female 2,359 363 - - 44 - - -
Non-scheduled air transportTotal 984 - - 145 - 51 - -Male 884 - - 45 - 51 - -Female 100 - - 100 - - - -
SUPPORTING AND AUXILIARY TRANSPORT ACTIVITIES; ACTIVITIES OFTRAVEL AGENCIES
Total 16,041 616 - 1,469 2,128 782 89 1,114Male 13,183 330 - 1,469 1,909 732 89 981Female 2,858 286 - - 219 50 - 133
Supporting and auxiliary transport activities; activities of travel agenciesTotal 16,041 616 - 1,469 2,128 782 89 1,114Male 13,183 330 - 1,469 1,909 732 89 981Female 2,858 286 - - 219 50 - 133
POST AND TELECOMMUNICATIONSTotal 19,840 961 122 2,292 5,740 70 321 2,438Male 16,598 851 110 1,609 5,521 70 246 2,030Female 3,242 109 12 683 220 - 76 408
Post and courier activitiesTotal 2,854 - - 339 1,855 - - -Male 2,376 - - 211 1,855 - - -Female 478 - - 127 - - - -
Created by PDF Generator (http://www.alientools.com/), to remove this mark, please buy the software.

Table 5.10 Cont’dRegionMinor Industrial Divisions
and Sex Total Tigray Afar Amhara Oromia SomalieBenishangul
-Gumuz SNNPR GambelaTelecommunications
Total 16,986 961 122 1,953 3,885 70 321 2,438Male 14,222 851 110 1,398 3,666 70 246 2,030Female 2,764 109 12 555 220 - 76 408
MAJOR GROUP 9: FINANCIAL INTERMIDIATIONTotal 115,655 8,492 302 12,932 30,893 2,027 519 15,919 324Male 69,717 5,431 253 9,443 20,812 1,089 368 9,216 240Female 45,938 3,061 49 3,489 10,081 937 151 6,703
FINANCIAL INTERMEDIATION, EXCEPT INSURANCE ANDPENSION FUNDING
Total 87,612 7,425 - 7,981 23,094 1,145 398 11,610 137Male 53,662 4,898 - 6,529 16,282 359 321 6,111 137Female 33,949 2,527 - 1,452 6,812 786 77 5,498
Monetary intermediationTotal 56,934 4,851 - 4,151 13,851 466 140 5,297Male 37,428 3,029 - 3,087 11,461 309 140 3,238Female 19,506 1,822 - 1,064 2,390 157 - 2,059
Other financial intermediationTotal 30,677 2,575 - 3,830 9,242 680 259 6,312Male 16,234 1,869 - 3,442 4,821 51 182 2,873Female 14,444 705 - 388 4,421 629 77 3,439
INSURANCE AND PENSION FUNDING, EXCEPT COMPULSORY SOCIAL SECURITYTotal 3,139 109 - - 1,547 - - 75Male 807 - - - 386 - - 75Female 2,332 109 - - 1,161 - - -
Insurance and pension funding, except compulsory social securityTotal 3,139 109 - - 1,547 - - 75Male 807 - - - 386 - - 75Female 2,332 109 - - 1,161 - - -
ACTIVITIES AUXILIARY TO FINANCIAL INTERMEDIATIONTotal 24,905 957 302 4,951 6,252 881 120 4,234 187Male 15,248 533 253 2,914 4,144 730 47 3,029 102Female 9,657 425 49 2,036 2,108 151 73 1,205
Activities auxiliary to financial intermediation, except insurance and pension fundingTotal 23,541 957 302 4,951 6,214 881 120 4,234 187Male 14,230 533 253 2,914 4,106 730 47 3,029 102Female 9,311 425 49 2,036 2,108 151 73 1,205
Created by PDF Generator (http://www.alientools.com/), to remove this mark, please buy the software.
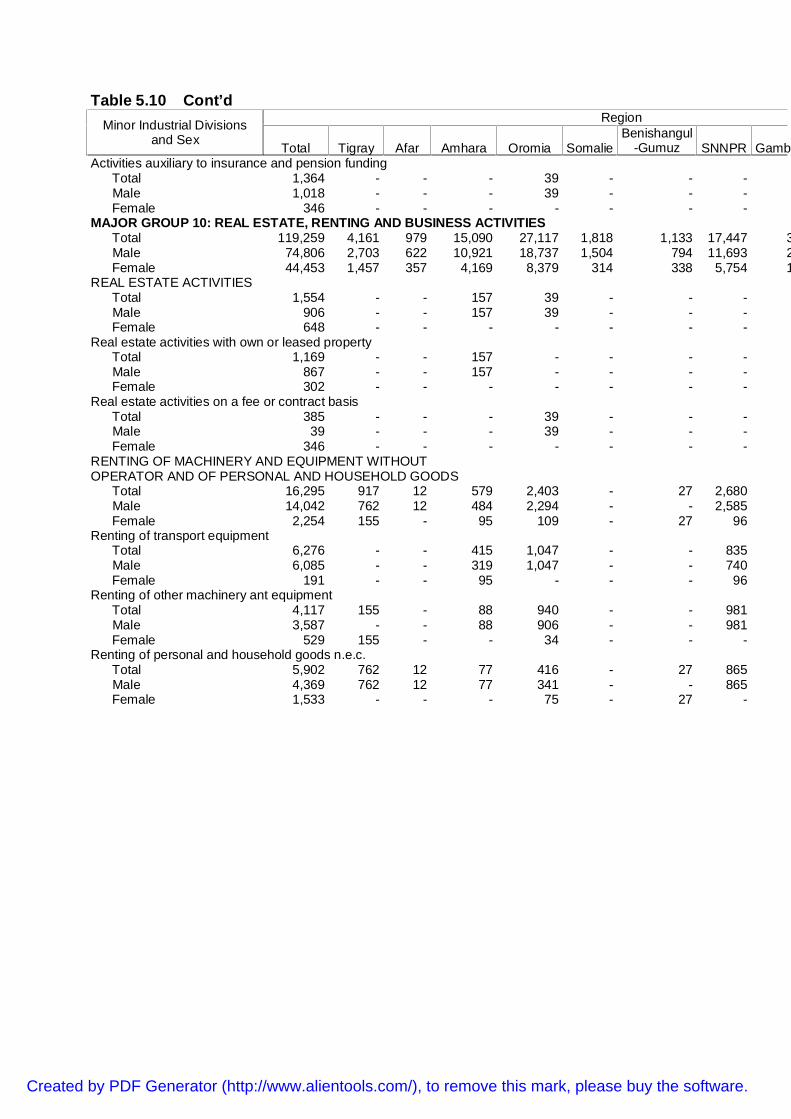
Table 5.10 Cont’dRegionMinor Industrial Divisions
and Sex Total Tigray Afar Amhara Oromia SomalieBenishangul
-Gumuz SNNPR GambelaActivities auxiliary to insurance and pension funding
Total 1,364 - - - 39 - - -Male 1,018 - - - 39 - - -Female 346 - - - - - - -
MAJOR GROUP 10: REAL ESTATE, RENTING AND BUSINESS ACTIVITIESTotal 119,259 4,161 979 15,090 27,117 1,818 1,133 17,447 371Male 74,806 2,703 622 10,921 18,737 1,504 794 11,693 252Female 44,453 1,457 357 4,169 8,379 314 338 5,754 118
REAL ESTATE ACTIVITIESTotal 1,554 - - 157 39 - - -Male 906 - - 157 39 - - -Female 648 - - - - - - -
Real estate activities with own or leased propertyTotal 1,169 - - 157 - - - -Male 867 - - 157 - - - -Female 302 - - - - - - -
Real estate activities on a fee or contract basisTotal 385 - - - 39 - - -Male 39 - - - 39 - - -Female 346 - - - - - - -
RENTING OF MACHINERY AND EQUIPMENT WITHOUTOPERATOR AND OF PERSONAL AND HOUSEHOLD GOODS
Total 16,295 917 12 579 2,403 - 27 2,680Male 14,042 762 12 484 2,294 - - 2,585Female 2,254 155 - 95 109 - 27 96
Renting of transport equipmentTotal 6,276 - - 415 1,047 - - 835Male 6,085 - - 319 1,047 - - 740Female 191 - - 95 - - - 96
Renting of other machinery ant equipmentTotal 4,117 155 - 88 940 - - 981Male 3,587 - - 88 906 - - 981Female 529 155 - - 34 - - -
Renting of personal and household goods n.e.c.Total 5,902 762 12 77 416 - 27 865Male 4,369 762 12 77 341 - - 865Female 1,533 - - - 75 - 27 -
Created by PDF Generator (http://www.alientools.com/), to remove this mark, please buy the software.

Table 5.10 Cont’dRegionMinor Industrial Divisions
and Sex Total Tigray Afar Amhara Oromia SomalieBenishangul
-Gumuz SNNPR GambelaCOMPUTER AND RELATED ACTIVITIES/SERVICE/
Total 24,480 109 189 3,331 6,677 310 160 2,861Male 11,788 109 - 877 3,125 310 80 1,700Female 12,692 - 189 2,453 3,553 - 81 1,161
Hardware consultancy serviceTotal 1,148 - - - 400 - - 287Male 1,148 - - - 400 - - 287Female - - - - - - - -
Software consultancy serviceTotal 6,394 - 13 617 2,416 - 57 928Male 1,773 - - 223 994 - - 210Female 4,621 - 13 394 1,422 - 57 717
Data processing/analysis/ serviceTotal 6,822 - 176 1,181 2,316 210 24 849Male 3,673 - - - 1,181 210 - 849Female 3,149 - 176 1,181 1,134 - 24 -
Data base activitiesTotal 4,231 - - 180 1,033 - 54 633Male 1,773 - - 180 193 - 54 353Female 2,459 - - - 840 - - 280
Manitenance and repair of office, accounting and computingmachinery
Total 2,808 109 - 351 315 - 26 -Male 2,808 109 - 351 315 - 26 -Female - - - - - - - -
Other computer related activitiesTotal 3,077 - - 1,002 198 101 - 163Male 613 - - 124 42 101 - -Female 2,463 - - 878 156 - - 163
RESEARCH AND DEVELOPMENTTotal 6,726 109 586 311 2,542 211 318 1,508Male 3,854 109 431 311 1,506 211 298 620Female 2,872 - 156 - 1,036 - 20 888
Research and experimental development on natural sciences and engineering(NSE)Total 5,652 109 431 45 2,472 211 221 1,432Male 3,169 109 287 45 1,436 211 201 544Female 2,483 - 144 - 1,036 - 20 888
Created by PDF Generator (http://www.alientools.com/), to remove this mark, please buy the software.
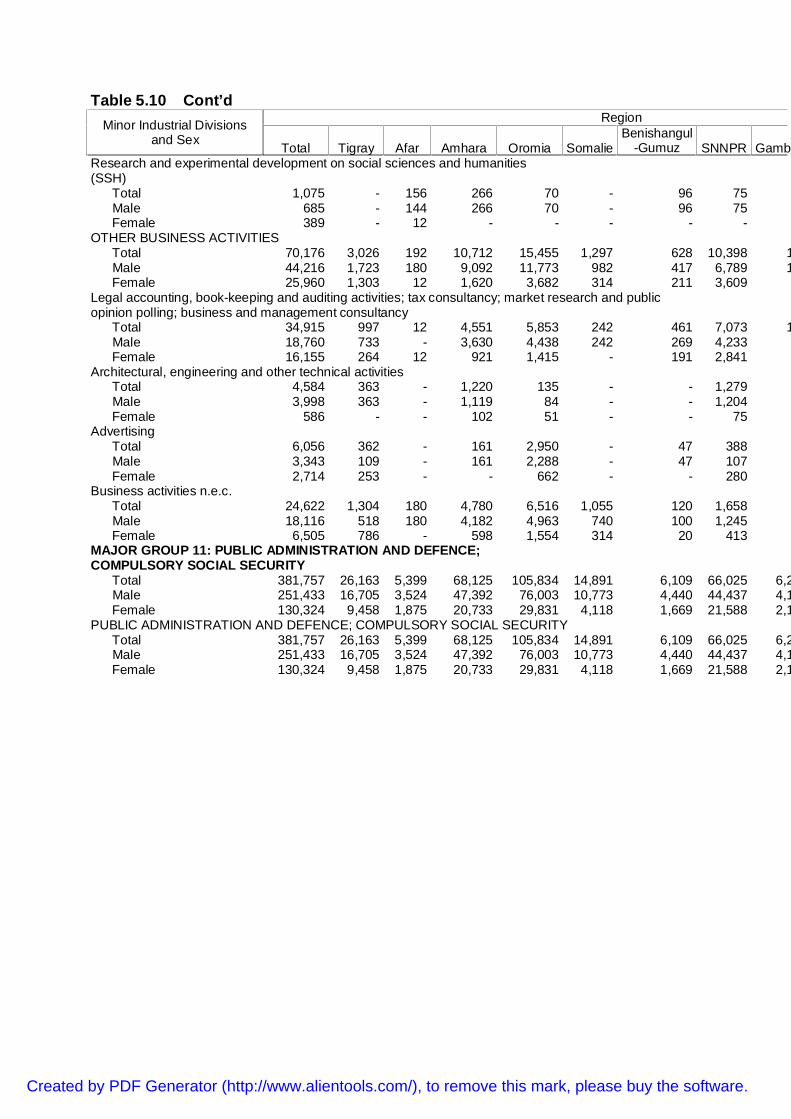
Table 5.10 Cont’dRegionMinor Industrial Divisions
and Sex Total Tigray Afar Amhara Oromia SomalieBenishangul
-Gumuz SNNPR GambelaResearch and experimental development on social sciences and humanities(SSH)
Total 1,075 - 156 266 70 - 96 75Male 685 - 144 266 70 - 96 75Female 389 - 12 - - - - -
OTHER BUSINESS ACTIVITIESTotal 70,176 3,026 192 10,712 15,455 1,297 628 10,398 192Male 44,216 1,723 180 9,092 11,773 982 417 6,789 101Female 25,960 1,303 12 1,620 3,682 314 211 3,609
Legal accounting, book-keeping and auditing activities; tax consultancy; market research and publicopinion polling; business and management consultancy
Total 34,915 997 12 4,551 5,853 242 461 7,073 165Male 18,760 733 - 3,630 4,438 242 269 4,233Female 16,155 264 12 921 1,415 - 191 2,841
Architectural, engineering and other technical activitiesTotal 4,584 363 - 1,220 135 - - 1,279Male 3,998 363 - 1,119 84 - - 1,204Female 586 - - 102 51 - - 75
AdvertisingTotal 6,056 362 - 161 2,950 - 47 388Male 3,343 109 - 161 2,288 - 47 107Female 2,714 253 - - 662 - - 280
Business activities n.e.c.Total 24,622 1,304 180 4,780 6,516 1,055 120 1,658Male 18,116 518 180 4,182 4,963 740 100 1,245Female 6,505 786 - 598 1,554 314 20 413
MAJOR GROUP 11: PUBLIC ADMINISTRATION AND DEFENCE;COMPULSORY SOCIAL SECURITY
Total 381,757 26,163 5,399 68,125 105,834 14,891 6,109 66,025 6,298Male 251,433 16,705 3,524 47,392 76,003 10,773 4,440 44,437 4,160Female 130,324 9,458 1,875 20,733 29,831 4,118 1,669 21,588 2,138
PUBLIC ADMINISTRATION AND DEFENCE; COMPULSORY SOCIAL SECURITYTotal 381,757 26,163 5,399 68,125 105,834 14,891 6,109 66,025 6,298Male 251,433 16,705 3,524 47,392 76,003 10,773 4,440 44,437 4,160Female 130,324 9,458 1,875 20,733 29,831 4,118 1,669 21,588 2,138
Created by PDF Generator (http://www.alientools.com/), to remove this mark, please buy the software.

Table 5.10 Cont’dRegionMinor Industrial Divisions
and Sex Total Tigray Afar Amhara Oromia SomalieBenishangul
-Gumuz SNNPR GambelaAdministration of the state and the economic and social policy of the community
Total 233,595 12,087 4,583 44,740 65,667 8,803 4,313 43,572 4,094Male 142,363 5,899 2,879 30,240 43,045 5,740 2,969 27,787 2,772Female 91,232 6,189 1,704 14,500 22,622 3,063 1,344 15,785 1,322
Provision of services to the community as a wholeTotal 142,086 13,408 816 23,024 37,839 5,949 1,773 21,778 2,176Male 106,074 10,806 645 16,940 31,433 4,945 1,448 16,077 1,360Female 36,012 2,602 171 6,084 6,406 1,004 325 5,701 816
Compulsory social security activities and pension securityTotal 6,076 667 - 361 2,329 138 23 675Male 2,996 - - 213 1,526 88 23 574Female 3,080 667 - 148 803 50 - 101
MAJOR GROUP 12: EDUCATIONTotal 404,111 28,992 1,438 76,701 108,393 12,064 3,544 80,524 3,190Male 239,864 18,384 959 46,109 63,939 9,077 2,593 49,807 2,381Female 164,247 10,608 479 30,592 44,455 2,987 951 30,717 809
EDUCATIONTotal 404,111 28,992 1,438 76,701 108,393 12,064 3,544 80,524 3,190Male 239,864 18,384 959 46,109 63,939 9,077 2,593 49,807 2,381Female 164,247 10,608 479 30,592 44,455 2,987 951 30,717 809
Primary educationTotal 188,576 12,809 992 36,837 54,035 6,034 1,617 35,950 1,290Male 89,144 6,840 561 16,203 26,653 4,335 1,104 20,106 821Female 99,432 5,969 431 20,634 27,382 1,699 513 15,844 469
Secondary educationTotal 105,660 5,178 313 21,103 23,855 5,012 943 17,374 1,575Male 82,154 4,342 301 17,508 17,262 4,280 831 13,694 1,467Female 23,506 835 12 3,595 6,593 732 112 3,680 109
Technical and vocational,driving and typingTotal 27,470 2,096 49 6,785 9,943 310 98 4,677Male 19,868 1,987 37 5,014 7,652 210 43 3,061Female 7,602 109 12 1,771 2,291 101 55 1,617
Higher education/college and university education/Total 82,405 8,909 85 11,976 20,561 708 886 22,523 291Male 48,698 5,215 60 7,384 12,372 252 615 12,946Female 33,707 3,694 25 4,592 8,189 455 271 9,577 197
Created by PDF Generator (http://www.alientools.com/), to remove this mark, please buy the software.

Table 5.10 Cont’dRegionMinor Industrial Divisions
and Sex Total Tigray Afar Amhara Oromia SomalieBenishangul
-Gumuz SNNPR GambelaMAJOR GROUP 13: HEALTH AND SOCIAL WORK
Total 182,330 11,355 1,287 28,520 47,973 6,128 3,144 33,325 1,057Male 91,421 5,214 750 15,196 23,355 3,123 1,680 18,376 476Female 90,909 6,141 538 13,324 24,619 3,005 1,465 14,950 581
HEALTH AND SOCIAL WORKTotal 182,330 11,355 1,287 28,520 47,973 6,128 3,144 33,325 1,057Male 91,421 5,214 750 15,196 23,355 3,123 1,680 18,376 476Female 90,909 6,141 538 13,324 24,619 3,005 1,465 14,950 581
Human health activitiesTotal 150,770 10,550 1,189 25,831 36,015 4,699 2,543 28,757 969Male 71,436 4,789 676 13,931 16,778 1,695 1,168 14,836 388Female 79,334 5,762 514 11,900 19,237 3,005 1,375 13,921 581
Veterinary activitiesTotal 11,500 307 62 206 6,081 629 523 2,379Male 9,234 307 50 206 4,216 629 434 2,210Female 2,266 - 12 - 1,865 - 89 168
Social work activitiesTotal 20,060 497 36 2,483 5,877 800 78 2,190Male 10,751 118 24 1,059 2,361 800 78 1,329Female 9,308 379 12 1,424 3,516 - - 861
MAJOR GROUP 14: OTHER COMMUNITY, SOCIAL AND PERSONALSERVICE ACTIVITIES
Total 566,625 37,803 7,745 112,322 170,206 21,708 7,957 94,420 2,213Male 330,050 19,566 2,648 60,314 111,319 12,059 3,476 48,346 1,455Female 236,574 18,237 5,097 52,009 58,887 9,648 4,481 46,074 758
SEWAGE AND REFUSE DISPOSAL, SANITATION AND SIMILAR ACTIVITIESTotal 15,954 903 168 6,260 2,369 421 - 2,461Male 7,529 217 144 3,108 1,232 161 - 1,527Female 8,425 686 24 3,152 1,137 260 - 934
Sewage and Refuse Disposal, Sanitation and Similar ActivitiesTotal 15,954 903 168 6,260 2,369 421 - 2,461Male 7,529 217 144 3,108 1,232 161 - 1,527Female 8,425 686 24 3,152 1,137 260 - 934
ACTIVITIES OF MEMBERSHIP ORGANIZATIONS N.E.C.Total 75,239 5,060 668 11,511 24,355 1,194 554 9,807 648Male 58,380 3,861 524 9,682 19,212 778 351 6,923 568Female 16,858 1,199 144 1,829 5,143 415 203 2,885
Created by PDF Generator (http://www.alientools.com/), to remove this mark, please buy the software.

Table 5.10 Cont’dRegionMinor Industrial Divisions
and Sex Total Tigray Afar Amhara Oromia SomalieBenishangul
-Gumuz SNNPR GambelaOther Activities of business and Employers professional organization
Total 12,873 1,545 13 2,367 4,701 681 - 300Male 9,621 1,276 13 1,335 4,620 316 - 210Female 3,252 270 - 1,032 81 365 - 90
Activities of trade unionsTotal 787 - - 359 428 - - -Male 787 - - 359 428 - - -Female - - - - - - - -
Activities of other membership organizationsTotal 53,771 3,514 655 8,298 16,984 513 411 7,709 539Male 47,328 2,585 511 7,766 14,108 462 351 6,712 460Female 6,443 929 144 532 2,876 50 60 996
RECREATIONAL, CULTURAL AND SPORTING ACTIVITIESTotal 40,094 2,578 368 8,317 6,504 689 472 6,386 187Male 28,351 1,830 368 5,790 4,948 374 249 4,655 154Female 11,743 748 - 2,527 1,557 314 223 1,731
Motion picture, radio, television and other entertainment activitiesTotal 14,768 1,262 188 1,755 1,862 202 221 3,275Male 11,815 1,044 188 1,273 1,399 202 72 2,416Female 2,952 218 - 482 462 - 149 858
News agency activitiesTotal 2,711 317 - 886 465 121 - 421Male 1,583 208 - 663 41 121 - 421Female 1,128 109 - 223 424 - - -
Library, archives, museums and other cultural activitiesTotal 4,240 - - 1,583 273 - 74 757Male 1,613 - - 718 109 - - 337Female 2,627 - - 865 164 - 74 421
Sporting and other recreational activitiesTotal 18,375 999 180 4,093 3,905 366 177 1,933Male 13,339 578 180 3,135 3,398 52 177 1,482Female 5,036 421 - 957 507 314 - 452
OTHER SERVICE ACTIVITIESTotal 435,338 29,262 6,542 86,235 136,978 19,404 6,931 75,767 1,350Male 235,791 13,658 1,613 41,734 85,928 10,746 2,877 35,242 704Female 199,547 15,604 4,929 44,501 51,050 8,658 4,055 40,525 645
Created by PDF Generator (http://www.alientools.com/), to remove this mark, please buy the software.

Table 5.10 Cont’dRegionMinor Industrial Divisions
and Sex Total Tigray Afar Amhara Oromia SomalieBenishangul
-Gumuz SNNPR GambelaRepairing of old cloths
Total 91,551 9,218 452 11,377 29,340 1,712 571 10,747 165Male 39,023 2,535 133 5,524 16,433 1,400 259 3,392Female 52,528 6,683 320 5,853 12,907 313 312 7,355 138
Other service activitiesTotal 343,787 20,043 6,090 74,857 107,638 17,692 6,360 65,019 1,184Male 196,768 11,122 1,480 36,210 69,495 9,346 2,618 31,850 677Female 147,020 8,921 4,609 38,647 38,142 8,346 3,743 33,169 507
MAJOR GROUP 15: PRIVATE HOUSEHOLDS WITH EMPLOYED PERSONSTotal 269,616 11,984 2,229 37,869 48,448 3,665 1,453 32,937 470Male 20,520 409 417 3,573 3,762 - 54 2,835Female 249,095 11,575 1,812 34,296 44,686 3,665 1,399 30,102 470
PRIVATE HOUSEHOLDS WITH EMPLOYED PERSONSTotal 269,616 11,984 2,229 37,869 48,448 3,665 1,453 32,937 470Male 20,520 409 417 3,573 3,762 - 54 2,835Female 249,095 11,575 1,812 34,296 44,686 3,665 1,399 30,102 470
Private households with employed personsTotal 269,616 11,984 2,229 37,869 48,448 3,665 1,453 32,937 470Male 20,520 409 417 3,573 3,762 - 54 2,835Female 249,095 11,575 1,812 34,296 44,686 3,665 1,399 30,102 470
MAJOR GROUP 16:EXTRA-TERRITORIAL ORGANIZATIONS AND NGOS?Total 34,003 2,874 320 3,455 6,972 1,054 480 3,195 354Male 21,696 2,171 176 2,110 4,993 516 247 1,812 325Female 12,307 703 144 1,345 1,978 538 233 1,383
EXTRA-TERRITORIAL ORGANIZATIONSTotal 34,003 2,874 320 3,455 6,972 1,054 480 3,195 354Male 21,696 2,171 176 2,110 4,993 516 247 1,812 325Female 12,307 703 144 1,345 1,978 538 233 1,383
Extra-territorial organizationsTotal 34,003 2,874 320 3,455 6,972 1,054 480 3,195 354Male 21,696 2,171 176 2,110 4,993 516 247 1,812 325Female 12,307 703 144 1,345 1,978 538 233 1,383
Not statedTotal 3,162 199 - 91 1,366 116 - 358Male 2,087 - - 91 1,014 58 - 179Female 1,076 199 - - 352 58 - 179
Created by PDF Generator (http://www.alientools.com/), to remove this mark, please buy the software.

Table 5.11 Currently Employed Population of Urban Areas Aged Ten Years and Above by Age Group, Sex and Status in EmploymentCountry-Total: 2012
Status in EmploymentPaid employees
Age Groupand Sex
TotalEmployed
PersonTotal paidEmployees
Employee-Government
Employee-GovernmentParasitatal
Employee-Private
organization
Employee-NGO
(includingInternationalorganization)
EmployeeDomestic
OtherEmployee
SelfEmployed
UnpaidFamilyWorker Employer Apprentice
All AgesTotal 5,726,116 2,867,785 876,306 297,994 1,297,136 64,029 267,461 64,860 2,215,946 493,930 39,445Male 3,202,042 1,682,365 541,563 206,729 822,436 38,077 19,940 53,620 1,218,230 206,822 29,577emale 2,524,074 1,185,420 334,742 91,265 474,700 25,952 247,520 11,240 997,715 287,108 9,869
10-14Total 195,567 38,620 - 1,308 11,396 - 25,500 415 20,693 132,539 -Male 94,187 8,907 - 679 5,789 - 2,023 415 13,118 70,534 -emale 101,380 29,713 - 629 5,607 - 23,477 - 7,575 62,006 -
15-19Total 492,071 235,653 7,428 5,695 111,089 826 105,356 5,258 112,936 135,484 492Male 205,515 67,300 2,402 3,641 53,082 - 4,143 4,032 67,597 66,213 39emale 286,556 168,352 5,025 2,054 58,008 826 101,212 1,227 45,339 69,271 453
20-24Total 902,304 542,346 127,352 42,164 295,822 6,037 65,518 5,454 254,904 75,209 3,533Male 457,454 259,685 61,335 23,485 165,504 2,339 3,039 3,983 144,480 36,178 2,501emale 444,850 282,661 66,017 18,678 130,318 3,698 62,479 1,471 110,424 39,031 1,033
25-29Total 1,128,487 657,158 216,957 62,465 325,380 12,475 30,192 9,689 393,264 47,288 8,150Male 653,525 395,376 127,403 43,340 207,590 6,690 2,011 8,341 221,229 15,302 5,629emale 474,962 261,782 89,553 19,125 117,790 5,785 28,181 1,348 172,035 31,986 2,521
30-34Total 767,262 380,487 133,388 45,043 174,303 7,927 10,824 9,002 340,164 31,105 5,612Male 448,530 243,162 81,506 28,524 117,976 4,884 2,629 7,645 189,409 6,389 4,300emale 318,731 137,325 51,882 16,520 56,328 3,043 8,195 1,357 150,755 24,717 1,312
35-39Total 742,001 356,911 124,583 41,847 152,635 16,990 11,037 9,820 335,037 28,976 7,703Male 423,955 225,291 75,602 28,625 101,313 10,516 1,171 8,064 177,060 4,580 6,807emale 318,046 131,620 48,981 13,222 51,322 6,473 9,865 1,757 157,976 24,396 896
40-44Total 445,655 218,490 99,953 26,805 73,949 7,860 4,379 5,543 201,351 13,798 4,109Male 273,476 152,396 66,019 19,881 55,171 5,652 750 4,923 112,000 1,972 3,338emale 172,179 66,094 33,934 6,925 18,778 2,208 3,629 620 89,351 11,826 770
Created by PDF Generator (http://www.alientools.com/), to remove this mark, please buy the software.

Table 5.11 Cont’dEmployment Status
Paid employeeAge Group
and SexTotal
EmployedPersons
Total paidEmployees
Employee-Government
Employee-GovernmentParasitatal
Employee-Private
organization
Employee-NGO
(includingInternationalorganization)
EmployeeDomestic
OtherEmployee
SelfEmployed
UnpaidFamilyWorker Employer Apprentice
45-49Total 361,687 172,087 71,162 26,422 58,178 3,878 5,678 6,769 168,222 11,824 3,570Male 211,592 120,120 51,334 19,609 40,814 1,904 897 5,561 84,784 965 2,701emale 150,094 51,967 19,828 6,813 17,364 1,973 4,781 1,209 83,438 10,859 869
50-54Total 266,025 122,180 55,961 19,552 37,107 4,222 2,639 2,700 131,790 5,754 1,761Male 153,598 88,584 42,815 13,964 27,374 2,711 389 1,331 59,808 1,835 994emale 112,428 33,596 13,146 5,589 9,733 1,510 2,251 1,368 71,982 3,919 767
55-59Total 152,584 66,658 24,896 13,048 22,858 1,221 1,143 3,493 79,384 3,142 1,293Male 96,469 56,172 20,472 12,725 18,033 829 664 3,449 38,555 542 649emale 56,115 10,486 4,424 323 4,825 392 479 44 40,829 2,600 644
60-64Total 113,615 38,565 8,659 8,006 12,999 2,594 2,854 3,453 69,329 3,459 854Male 75,221 32,876 7,550 7,235 11,203 2,551 1,696 2,641 40,421 747 577emale 38,393 5,689 1,108 771 1,796 43 1,158 812 28,908 2,711 277
65+Total 158,859 38,629 5,968 5,638 21,420 - 2,341 3,263 108,872 5,350 2,370Male 108,519 32,497 5,124 5,021 18,588 - 528 3,236 69,769 1,565 2,043emale 50,340 6,133 844 617 2,833 - 1,812 27 39,103 3,785 327
Created by PDF Generator (http://www.alientools.com/), to remove this mark, please buy the software.

Table 5.12 Currently Employed Population of Urban Areas Aged Ten Years and Above by Region, Sex andStatus in Employment: 2012
Status in EmploymentPaid employees
Region andSex
TotalEmployedpersons
TotalEmployed
Person Totalpaid
EmployeesEmployee
Government
Employee-Gov’t
Parasitatal
Employee-Private
organization
Employee-NGO
(includingInternationalorganization)
EmployeeDomestic
OtherEmployee
SelfEmployed
UnpaidFamilyWorker Employer
COUNTRY TOTALTotal 5,726,116 5,726,116 2,867,785 876,306 297,994 1,297,136 64,029 267,461 64,860 2,215,946 493,930 39,445Male 3,202,042 3,202,042 1,682,365 541,563 206,729 822,436 38,077 19,940 53,620 1,218,230 206,822 29,577Female 2,524,074 2,524,074 1,185,420 334,742 91,265 474,700 25,952 247,520 11,240 997,715 287,108 9,869
TIGRAY REGIONTotal 391,891 391,891 189,677 64,502 17,399 86,620 5,385 11,984 3,788 148,442 34,603 8,969Male 204,483 204,483 107,939 39,498 10,737 50,457 3,407 409 3,431 71,719 12,706 7,111Female 187,408 187,408 81,738 25,003 6,661 36,163 1,978 11,575 357 76,722 21,897 1,858
AFFAR REGIONTotal 77,068 77,068 38,124 8,725 7,851 17,641 428 2,229 1,250 28,680 9,266 876Male 43,657 43,657 25,538 5,868 5,847 12,679 260 417 467 14,317 3,009 721Female 33,411 33,411 12,586 2,857 2,004 4,961 168 1,812 783 14,363 6,257 155
AMHARA REGIONTotal 1,063,958 1,063,958 435,245 167,769 39,303 172,824 6,331 36,709 12,308 433,165 152,045 8,231Male 562,815 562,815 257,734 105,571 28,759 105,986 4,018 2,993 10,407 222,046 58,040 6,152Female 501,144 501,144 177,511 62,198 10,544 66,838 2,314 33,716 1,901 211,119 94,005 2,079
OROMIA REGIONTotal 1,643,077 1,643,077 762,056 233,690 70,467 371,357 17,443 48,197 20,902 725,044 129,088 5,930Male 963,543 963,543 480,200 151,891 52,229 245,409 9,534 3,762 17,376 399,515 66,955 3,769Female 679,534 679,534 281,856 81,799 18,238 125,948 7,909 44,435 3,526 325,529 62,132 2,161
SOMALI REGIONTotal 202,547 202,547 64,880 30,133 12,296 15,507 1,904 3,665 1,375 104,920 29,684 952Male 111,869 111,869 44,711 20,625 8,145 13,615 1,316 - 1,010 53,925 10,719 830Female 90,677 90,677 20,169 9,509 4,151 1,892 588 3,665 365 50,995 18,965 122
BENISHANGUL GUMUZ REGIONTotal 72,518 72,518 24,970 12,448 3,420 6,547 688 1,453 413 27,306 17,677 974Male 39,854 39,854 16,498 8,584 2,729 4,342 422 54 366 15,499 6,315 584Female 32,664 32,664 8,473 3,864 691 2,205 266 1,399 47 11,807 11,363 391
Created by PDF Generator (http://www.alientools.com/), to remove this mark, please buy the software.

Table 5.12 Cont’dStatus in Employment
Paid employeesRegion and
SexTotal
Employedpersons
TotalEmployed Person Total
paidEmployees
EmployeeGovernment
Employee-Gov’t
Parasitatal
Employee-Private
organization
Employee-NGO
(includingInternationalorganization)
EmployeeDomestic
OtherEmployee
SelfEmployed
UnpaidFamilyWorker
SNNP REGIONTotal 837,386 837,386 381,966 169,204 34,090 133,061 7,919 32,517 5,175 358,694 83,625Male 466,330 466,330 230,899 107,633 23,474 87,666 4,817 2,835 4,473 194,697 32,233Female 371,057 371,057 151,067 61,571 10,615 45,395 3,102 29,682 702 163,997 51,392
GAMBELLA REGIONTotal 35,656 35,656 16,728 10,631 828 3,862 498 470 440 16,872 2,056Male 18,797 18,797 10,877 7,100 550 2,454 440 - 333 7,059Female 16,859 16,859 5,851 3,531 277 1,407 58 470 108 9,813 1,195
HARARI REGIONTotal 49,969 49,969 26,144 10,828 1,805 11,060 634 1,670 147 20,061 1,929Male 26,901 26,901 15,197 5,950 1,406 7,188 449 107 98 9,812Female 23,068 23,068 10,947 4,878 399 3,873 186 1,563 49 10,249 1,172
ADDISABAB CITYADMINISTRATION
Total 1,250,842 1,250,842 878,145 156,428 107,681 451,525 21,298 123,036 18,177 316,991 23,216Male 709,206 709,206 463,149 80,817 70,542 275,556 12,361 9,098 14,775 213,139 10,611Female 541,635 541,635 414,996 75,611 37,139 175,969 8,937 113,938 3,402 103,851 12,605
DIRE DAWA ADMINISTRATIONTotal 101,204 101,204 49,847 11,946 2,855 27,132 1,501 5,529 884 35,773 10,741Male 54,588 54,588 29,622 8,026 2,310 17,084 1,054 265 884 16,503 4,616Female 46,617 46,617 20,225 3,920 545 10,048 447 5,265 - 19,270 6,125
Created by PDF Generator (http://www.alientools.com/), to remove this mark, please buy the software.

Table 5.13 Currently Employed Population of Major Towns Aged Ten Years and Above by Sex andStatus in Employment: 2012
Status in EmploymentPaid Employees
Major Townsand Sex
TotalEmployed
PersonTotal PaidEmplyees
Employee-Government
Employee-GovernmentParasitatal
Employee-Private
organization
Employee- NGO
(includingInternationalorganization)
EmployeeDomestic
OtherEmployee
SelfEmployed
UnpaidFamilyWorker Employer
MAJOR TOWNS TOTALTotal 2,212,903 1,410,578 307,281 151,342 710,526 33,386 179,207 28,837 642,031 92,307 20,456Male 1,240,813 768,740 169,289 100,927 441,332 20,559 12,577 24,056 387,932 36,928 15,853Female 972,089 641,837 137,991 50,414 269,194 12,827 166,630 4,782 254,099 55,380 4,603
MEKELE TOWNTotal 121,116 65,647 15,766 4,870 34,494 1,243 8,106 1,168 39,040 7,567 5,382Male 65,727 36,135 8,494 2,981 22,339 1,037 218 1,067 20,199 2,372 4,461Female 55,389 29,512 7,272 1,889 12,155 206 7,888 102 18,841 5,195
ASAYITA TOWNTotal 8,369 3,825 1,790 195 1,333 36 434 36 3,411 824Male 4,624 2,390 1,116 108 1,093 12 26 36 1,697 323Female 3,745 1,434 674 87 241 24 408 - 1,714 501
GONDER TOWNTotal 97,868 41,659 11,231 3,734 20,469 156 4,648 1,421 29,223 22,242Male 51,748 24,006 6,964 2,542 12,664 75 340 1,421 16,892 8,222Female 46,121 17,653 4,268 1,192 7,805 80 4,308 - 12,331 14,020
DESSIE TOWNTotal 47,543 27,168 8,762 2,137 12,179 761 2,849 480 16,881 1,975Male 26,410 14,960 5,019 1,496 7,515 396 99 436 9,672 935Female 21,133 12,208 3,743 641 4,664 364 2,750 45 7,209 1,040
BAHIR DAR TOWNTotal 93,781 58,017 16,260 5,774 28,805 683 6,065 430 29,128 3,604 1,350Male 46,806 30,124 9,105 3,705 16,007 683 341 282 13,404 1,337Female 46,975 27,894 7,155 2,069 12,798 - 5,724 147 15,724 2,267
BISHOFTU TOWNTotal 41,284 26,422 4,353 3,729 16,282 372 1,350 337 13,276 1,000Male 23,681 15,573 2,462 2,432 10,094 227 176 182 7,369 319Female 17,602 10,849 1,890 1,297 6,189 145 1,174 155 5,907 681
ADAMA TOWNTotal 92,946 58,610 8,236 5,375 36,255 1,297 4,498 2,949 30,152 2,019Male 55,237 34,232 4,949 4,036 21,423 642 419 2,764 18,200 977Female 37,709 24,378 3,287 1,339 14,832 655 4,079 186 11,951 1,041
Created by PDF Generator (http://www.alientools.com/), to remove this mark, please buy the software.

Table 5.13 Cont’dStatus in Employment
Paid EmployeesMajor Towns
and Sex TotalEmployed
PersonTotal PaidEmplyees
Employee-Government
Employee-GovernmentParasitatal
Employee-Private
organization
Employee- Ngo(including
Internationalorganization)
EmployeeDomestic
OtherEmployee
SelfEmployed
UnpaidFamilyWorker Employer
JIMMA TOWNTotal 59,065 38,531 13,867 2,861 15,322 1,156 4,647 678 16,499 2,775Male 33,607 22,178 7,815 2,328 10,033 876 765 361 9,672 879Female 25,458 16,353 6,051 533 5,289 281 3,882 318 6,828 1,896
SHASHEMENE TOWNTotal 45,485 19,735 3,531 1,845 10,773 726 2,559 301 22,536 2,174Male 28,269 12,903 2,492 1,365 8,232 542 70 201 13,208 1,416Female 17,216 6,832 1,039 480 2,541 184 2,489 100 9,328 757
JIJIGA TOWNTotal 40,942 18,903 7,146 1,396 7,735 625 1,778 222 17,684 2,865Male 23,990 13,009 4,765 861 6,839 373 - 171 9,067 657Female 16,952 5,893 2,381 535 896 252 1,778 51 8,617 2,208
ASOSA TOWNTotal 17,931 8,965 4,188 1,148 2,951 139 412 127 6,284 2,437Male 10,159 5,783 2,600 907 2,090 106 - 80 3,333 855Female 7,772 3,182 1,588 241 861 33 412 47 2,952 1,582
HAWASSA TOWNTotal 127,071 78,142 26,552 5,317 31,585 2,260 11,266 1,162 39,296 6,068Male 70,534 42,729 14,900 3,481 21,400 1,285 654 1,009 23,555 2,286Female 56,537 35,413 11,652 1,836 10,185 975 10,611 153 15,741 3,782
GAMBELLA TOWNTotal 17,486 10,817 6,396 620 2,625 498 358 319 5,796 873Male 9,326 6,749 3,815 426 1,777 440 - 291 2,211 366Female 8,160 4,067 2,581 194 848 58 358 28 3,585 507
HARAR TOWNTotal 49,969 26,144 10,828 1,805 11,060 634 1,670 147 20,061 1,929Male 26,901 15,197 5,950 1,406 7,188 449 107 98 9,812 757Female 23,068 10,947 4,878 399 3,873 186 1,563 49 10,249 1,172
ADDIS ABABA CITY ADMINISTRATIONTotal 1,250,842 878,145 156,428 107,681 451,525 21,298 123,036 18,177 316,991 23,216 7,130Male 709,206 463,149 80,817 70,542 275,556 12,361 9,098 14,775 213,139 10,611 5,228Female 541,635 414,996 75,611 37,139 175,969 8,937 113,938 3,402 103,851 12,605 1,902
DIRE DAWA TOWNTotal 101,204 49,847 11,946 2,855 27,132 1,501 5,529 884 35,773 10,741 2,139Male 54,588 29,622 8,026 2,310 17,084 1,054 265 884 16,503 4,616 1,682Female 46,617 20,225 3,920 545 10,048 447 5,265 - 19,270 6,125
Created by PDF Generator (http://www.alientools.com/), to remove this mark, please buy the software.

Created by PDF Generator (http://www.alientools.com/), to remove this mark, please buy the software.

Table 5.14 Currently Employed Population of Urban Areas Aged Ten Years and Above by Sex, Major Occupation Groups andMajor Industrial Divisions - COUNTRY TOTAL: 2012
Major Occupational GroupsMajor IndustrialDivisions and Sex
TotalEmployedPersons
LegislatorSenior
Officials &Managers Professional
Technical andAssociate
Professionals Clerks
Service, Shop& Market
salesWorkers
Skilledagriculturaland Fishery
Crafts andrelatedtrades
Total Employed PopulationTotal 5,726,116 165,216 376,286 359,728 316,379 1,516,219 343,555 1,048,027Male 3,202,042 128,932 259,132 225,287 123,190 646,234 246,151 616,303Female 2,524,074 36,284 117,154 134,441 193,190 869,985 97,404 431,723
Agriculture, Hunting, Forestry & FishingTotal 469,377 4,025 1,017 2,669 2,594 10,494 313,108 4,969Male 315,988 3,517 963 1,864 2,185 3,544 225,555 2,897Female 153,389 509 55 805 409 6,950 87,553 2,072
Mining & QuarryingTotal 21,374 685 - 770 1,375 1,134 - 9,904Male 16,486 649 - 770 - 467 - 7,813Female 4,888 36 - - 1,375 666 - 2,091
ManufacturingTotal 757,055 12,715 6,374 11,159 29,916 40,415 2,441 497,035Male 419,831 7,496 3,763 6,871 11,799 17,395 1,535 257,769Female 337,224 5,218 2,611 4,288 18,117 23,020 906 239,266
Electricity, Gas and Water SupplyTotal 53,226 2,368 3,382 3,490 7,464 4,035 - 9,842Male 38,176 2,368 2,099 2,606 2,410 1,439 - 9,842Female 15,050 - 1,283 885 5,055 2,596 -
ConstructionTotal 395,129 8,082 13,117 11,040 11,222 1,708 - 231,105Male 324,893 6,908 11,432 9,226 5,173 1,584 - 207,188Female 70,235 1,174 1,685 1,813 6,049 124 - 23,916
Whole Sale and Retail TradeTotal 1,235,258 4,984 4,778 12,567 13,367 890,574 22,269 119,011Male 625,873 3,498 2,005 7,840 5,455 415,612 15,359 77,313Female 609,386 1,486 2,773 4,727 7,912 474,961 6,910 41,698
Hotels and RestaurantsTotal 457,810 10,941 3,289 2,483 18,748 280,458 - 105,964Male 112,237 6,877 1,715 1,473 7,810 70,230 - 6,484Female 345,572 4,064 1,575 1,010 10,938 210,228 - 99,480
Transport, Storage and CommunicationsTotal 260,370 2,190 5,341 5,498 12,543 10,664 682 5,027Male 246,962 2,008 4,112 4,034 9,260 9,266 682 4,974Female 13,407 182 1,229 1,464 3,282 1,398 - 53
Created by PDF Generator (http://www.alientools.com/), to remove this mark, please buy the software.

Table 5.14 Cont’d
Major Occupational GroupsMajor IndustrialDivisions and Sex
TotalEmployedPersons
LegislatorSenior
Officials &Managers Professional
Technical andAssociate
Professionals Clerks
Service, Shop& Market
salesWorkers
Skilledagriculturaland Fishery
Crafts andrelatedtrades
Financial IntermediationTotal 115,655 7,677 24,314 14,146 44,162 1,220 - 89Male 69,717 6,371 17,063 10,288 19,760 - - 89Female 45,938 1,306 7,250 3,859 24,402 1,220 -
Real Estate, Renting and Business ActivitiesTotal 119,259 4,859 18,817 15,523 34,732 14,269 62 11,912Male 74,806 3,795 13,114 11,789 11,065 12,482 42 8,280Female 44,453 1,064 5,703 3,734 23,666 1,787 20 3,633
Public Administration and defenseTotal 381,757 71,351 43,361 64,181 65,786 66,346 1,491 4,366Male 251,433 57,751 28,521 45,031 22,664 56,054 1,121 2,666Female 130,324 13,600 14,840 19,150 43,122 10,292 370 1,699
EducationTotal 404,111 13,318 184,678 112,538 26,870 14,942 912 4,532Male 239,864 10,733 130,852 58,926 6,376 2,421 375 2,357Female 164,247 2,585 53,826 53,612 20,495 12,521 537 2,175
Health and Social WorkTotal 182,330 6,384 49,270 64,132 16,314 11,213 343 2,345Male 91,421 4,772 27,765 30,063 4,940 3,884 343 1,632Female 90,909 1,612 21,505 34,069 11,374 7,329 - 713
Other Community, Social and Personal Service ActivitiesTotal 566,625 9,799 14,292 35,887 24,600 141,063 1,924 34,062Male 330,050 8,153 12,414 32,110 11,162 48,610 816 26,166Female 236,574 1,646 1,878 3,777 13,439 92,453 1,108 7,896
Private Households with Employed PersonsTotal 269,616 - - - 89 24,053 - 7,065Male 20,520 - - - - 1,505 - 457Female 249,095 - - - 89 22,547 - 6,607
Extra-Territorial Organizations and NGOsTotal 34,003 5,838 4,256 3,647 6,597 2,737 323 799Male 21,696 4,036 3,315 2,397 3,131 844 323 374Female 12,307 1,802 942 1,250 3,465 1,892 - 425
Not StatedTotal 3,162 - - - - 896 -Male 2,087 - - - - 896 -Female 1,076 - - - - - -
Created by PDF Generator (http://www.alientools.com/), to remove this mark, please buy the software.

Table 5.15 Currently Employed Population of Urban Areas Aged Ten Years and Above by Sex, Major Industrial Divisions andStatus in Employment - COUNTRY TOTAL: 2012
Status in Employment
Major IndustrialDivisions and Sex Total
EmployedPopulation
Employee-Government
Employee-Gov’t
Parasitatal
Employee-Private
organization
Employee-NGO(including
Internationalorganization)
EmployeeDomestic
Other PaidEmployee
SelfEmployed
UnpaidFamilyWorker Employer Apprentice
Total Employed PopulationTotal 5,726,116 876,306 297,994 1,297,136 64,029 267,461 64,860 2,215,946 493,930 39,445Male 3,202,042 541,563 206,729 822,436 38,077 19,940 53,620 1,218,230 206,822 29,577Female 2,524,074 334,742 91,265 474,700 25,952 247,520 11,240 997,715 287,108 9,869
Agriculture, Hunting, Forestry & FishingTotal 469,377 1,081 15,114 41,323 - - 10,877 246,716 144,277 3,298Male 315,988 704 10,586 27,690 - - 7,832 176,987 86,885 2,347Female 153,389 377 4,528 13,632 - - 3,046 69,730 57,392 950
Mining &Quarrying
Total 21,374 39 2,977 5,326 - - 883 9,877 215 36Male 16,486 39 1,579 3,531 - - 883 8,581 215 36Female 4,888 - 1,399 1,795 - - - 1,295 - -
ManufacturingTotal 757,055 - 43,894 278,009 - - 1,236 346,123 58,987 9,073Male 419,831 - 27,139 184,207 - - 466 159,689 27,866 8,331Female 337,224 - 16,755 93,802 - - 771 186,434 31,121 742
Electricity, Gas and Water SupplyTotal 53,226 16,134 19,950 5,286 - - 1,875 4,622 5,250 109Male 38,176 10,647 17,430 4,380 - - 1,530 3,584 497 109Female 15,050 5,487 2,520 906 - - 345 1,038 4,753 -
ConstructionTotal 395,129 - 48,805 196,787 - - 11,356 112,080 5,528 3,071Male 324,893 - 39,856 152,837 - - 10,301 103,103 3,853 3,071Female 70,235 - 8,949 43,950 - - 1,055 8,977 1,675 -
Whole Sale and Retail TradeTotal 1,235,258 - 12,069 177,065 - - 1,079 909,526 113,935 9,135Male 625,873 - 7,250 107,481 - - 602 448,428 48,236 7,023Female 609,386 - 4,819 69,584 - - 477 461,098 65,699 2,112
Hotels and RestaurantsTotal 457,810 - 6,993 159,371 - - 982 213,196 64,850 9,337Male 112,237 - 3,189 61,296 - - - 31,351 12,113 4,081Female 345,572 - 3,804 98,075 - - 982 181,845 52,737 5,257
Transport, Storage and CommunicationsTotal 260,370 - 47,036 129,045 - - 3,501 69,635 3,740 1,351Male 246,962 - 41,029 123,497 - - 3,076 68,308 3,740 1,299Female 13,407 - 6,008 5,548 - - 425 1,327 - 51
Created by PDF Generator (http://www.alientools.com/), to remove this mark, please buy the software.

Table 5.15 Cont’dStatus in Employment
Major IndustrialDivisions and Sex Total
EmployedPopulation
Employee-Government
Employee-Gov’t
Parasitatal
Employee-Private
organization
Employee-NGO(including
Internationalorganization)
EmployeeDomestic
Other PaidEmployee
SelfEmployed
UnpaidFamilyWorker Employer Apprentice
Financial IntermediationTotal 115,655 - 87,364 27,137 - - 153 635 - -Male 69,717 - 51,413 18,039 - - - 264 - -Female 45,938 - 35,950 9,097 - - 153 370 - -
Real Estate, Renting and Business ActivitiesTotal 119,259 - 4,695 70,792 - - 890 38,462 1,891 1,344Male 74,806 - 2,662 37,102 - - 287 31,935 1,018 1,035Female 44,453 - 2,033 33,690 - - 603 6,527 873 310
Public and Administration and DefenseTotal 381,757 381,697 - - - - - - - -Male 251,433 251,433 - - - - - - - -Female 130,324 130,263 - - - - - - - -
EducationTotal 404,111 327,369 3,956 62,820 6,100 - 360 - - -Male 239,864 204,557 1,591 28,490 2,469 - 300 - - -Female 164,247 122,812 2,365 34,330 3,631 - 61 - - -
Health and Social WorkTotal 182,330 115,634 2,081 32,963 14,134 - 102 10,747 3,959 1,170Male 91,421 54,772 1,057 16,703 6,976 - - 8,009 2,365 1,170Female 90,909 60,862 1,025 16,260 7,158 - 102 2,739 1,594 -
Other Community, Social and Personal ServiceActivities
Total 566,625 34,353 3,060 109,851 9,881 - 31,566 252,968 91,297 1,522Male 330,050 19,411 1,950 56,285 6,935 - 28,345 177,200 20,033 1,075Female 236,574 14,941 1,110 53,565 2,946 - 3,221 75,768 71,264 447
Private Households with Employed PersonsTotal 269,616 - - - - 267,461 - - - -Male 20,520 - - - - 19,940 - - - -Female 249,095 - - - - 247,520 - - - -
Extra-Territorial Organizations and NGOsTotal 34,003 - - - 33,913 - - - - -Male 21,696 - - - 21,696 - - - - -Female 12,307 - - - 12,217 - - - - -
Not StatedTotal 3,162 - - 1,363 - - - 1,359 - -Male 2,087 - - 896 - - - 792 - -Female 1,076 - - 466 - - - 567 - -
Created by PDF Generator (http://www.alientools.com/), to remove this mark, please buy the software.

Created by PDF Generator (http://www.alientools.com/), to remove this mark, please buy the software.

Table 5.16 Currently Employed Population of Urban Areas Aged Ten Years and Above by Major Occupational Groups, Sex andStatus in Employment - COUNTRY TOTAL: 2012
Status in EmploymentMajorOccupationalGroups and
SexTotal
EmployedPopulation
Employee-Government
Employee-GovernmentParasitatal
Employee-Private
organization
Employee-NGO(including
Internationalorganization)
EmployeeDomestic
OtherEmployee
SelfEmployed
UnpaidFamilyWorker Employer
Total Employed PersonTotal 5,726,116 876,306 296,685 1,297,136 64,029 267,461 66,168 2,215,946 493,930 39,445Male 3,202,042 541,563 206,049 822,436 38,077 19,940 54,299 1,218,230 206,822 29,577
Female 2,524,074 334,742 90,636 474,700 25,952 247,520 11,869 997,715 287,108 9,869Legislator Senior Officials & Managers
Total 165,216 92,593 14,663 28,668 8,570 - 1,376 13,023 1,085 4,077Male 128,932 75,189 10,152 21,501 6,352 - 1,332 9,883 223 3,189
Female 36,284 17,403 4,511 7,168 2,218 - 44 3,140 863 888Professional
Total 376,286 237,666 37,861 69,696 9,518 - 4,501 13,494 684 1,195Male 259,132 164,562 27,266 43,151 5,915 - 4,347 11,054 441 885
Female 117,154 73,104 10,595 26,544 3,603 - 153 2,440 242 310Technical and Associate Professionals
Total 359,728 204,820 33,037 63,958 11,742 - 14,321 21,829 1,478 1,267Male 225,287 118,709 22,258 35,312 7,941 - 14,008 18,585 849 1,267
Female 134,441 86,111 10,780 28,646 3,801 - 312 3,244 629 -Clerks
Total 316,379 110,104 59,526 101,820 8,515 89 2,314 19,686 7,550 983Male 123,190 34,644 26,957 36,449 4,033 - 1,275 14,459 2,623 983
Female 193,190 75,459 32,569 65,371 4,482 89 1,039 5,228 4,927 -Service, Shop & Market sales Workers
Total 1,516,219 84,331 9,226 198,686 7,166 22,222 3,349 963,419 194,352 14,921Male 646,234 62,187 4,373 82,850 1,492 925 1,498 414,880 62,583 8,583
Female 869,985 22,144 4,853 115,836 5,674 21,297 1,852 548,539 131,768 6,338Skilled agricultural and Fishery
Total 343,555 2,746 8,776 12,454 323 - 4,561 225,914 79,705 3,310Male 246,151 1,839 5,969 7,405 323 - 3,695 174,784 46,943 2,453
Female 97,404 907 2,807 5,049 - - 866 51,130 32,762 857Crafts and related trades
Total 1,048,027 13,206 39,012 295,192 1,089 7,065 11,597 569,852 66,159 10,885Male 616,303 9,213 32,612 225,263 454 457 10,287 281,414 25,948 9,663
Female 431,723 3,993 6,399 69,930 635 6,607 1,310 288,438 40,211 1,222
Created by PDF Generator (http://www.alientools.com/), to remove this mark, please buy the software.

Table 5.16 Cont’dStatus in EmploymentMajor
OccupationalGroups and
SexTotal
EmployedPopulation
Employee-Government
Employee-GovernmentParasitatal
Employee-Private
organization
Employee-NGO(including
Internationalorganization)
EmployeeDomestic
OtherEmployee
SelfEmployed
UnpaidFamilyWorker Employer
Plant ,Machine Operators & AssemblersTotal 305,437 17,419 32,743 174,277 3,616 479 2,854 62,452 6,951 2,232Male 286,619 16,917 30,910 161,244 3,616 479 2,775 60,328 6,363 2,193
Female 18,818 502 1,833 13,033 - - 79 2,124 588Elementary Occupation
Total 1,293,289 113,420 61,841 352,206 13,490 237,606 21,296 324,918 135,965 575Male 669,003 58,303 45,553 209,260 7,950 18,079 15,083 232,053 60,848 360
Female 624,286 55,117 16,287 142,947 5,539 219,527 6,213 92,865 75,117 214N.S
Total 1,979 - - 179 - - - 1,359 -Male 1,190 - - - - - - 792 -
Female 788 - - 179 - - - 567 -
Created by PDF Generator (http://www.alientools.com/), to remove this mark, please buy the software.

Table 5.17 Currently Employed Population of Urban Areas Aged Ten Years and Above by Sex, Age Group andHours Worked Per Week - COUNTRY TOTAL: 2012
Number of Hours Worked Per WeekAge Group
and SexTotal 0 1-3 4-12 13-21 22-30 31-39 40-48 49-57
All AgesTotal 5,726,116 275,568 9,353 322,625 429,717 503,568 697,095 1,266,142 825,717Male 3,202,042 145,905 2,594 117,929 188,151 252,231 363,160 753,429 503,771Female 2,524,074 129,663 6,759 204,697 241,566 251,337 333,936 512,712 321,946
10-14Total 195,567 3,412 402 54,354 35,343 28,263 21,170 12,829 14,676Male 94,187 1,450 - 24,750 17,864 15,745 12,577 7,763 4,108Female 101,380 1,962 402 29,604 17,480 12,518 8,593 5,065 10,568
15-19Total 492,071 15,840 507 50,811 57,135 47,343 40,842 67,738 66,785Male 205,515 6,003 43 20,890 27,359 24,301 20,094 32,313 24,809Female 286,556 9,838 464 29,921 29,776 23,042 20,748 35,425 41,975
20-24Total 902,304 35,140 1,388 39,164 57,790 76,475 107,980 209,778 135,143Male 457,454 17,277 577 13,204 26,624 37,658 50,181 106,287 69,328Female 444,850 17,864 811 25,959 31,167 38,818 57,799 103,490 65,815
25-29Total 1,128,487 52,946 2,276 43,442 63,690 90,655 134,939 287,926 177,616Male 653,525 25,161 1,044 14,660 30,958 49,749 73,079 171,415 113,615Female 474,962 27,785 1,232 28,781 32,732 40,907 61,859 116,510 64,001
30-34Total 767,262 40,498 961 30,004 46,653 61,204 99,071 182,308 119,551Male 448,530 23,357 - 9,134 16,971 27,742 47,247 110,464 81,687Female 318,731 17,140 961 20,870 29,682 33,463 51,824 71,845 37,864
35-39Total 742,001 34,269 517 30,065 46,960 56,665 98,862 181,246 107,131Male 423,955 15,956 - 11,886 16,685 27,504 52,824 104,704 68,742Female 318,046 18,313 517 18,178 30,276 29,161 46,038 76,542 38,389
40-44Total 445,655 22,892 223 17,442 28,697 38,516 63,822 107,626 65,857Male 273,476 12,819 - 7,395 13,267 17,649 33,290 71,593 45,080Female 172,179 10,073 223 10,048 15,430 20,867 30,532 36,033 20,778
Created by PDF Generator (http://www.alientools.com/), to remove this mark, please buy the software.

Table 5.17 Cont’dNumber of Hours Worked Per Week
Age Groupand Sex
Total 0 1-3 4-12 13-21 22-30 31-39 40-48 49-5745-49
Total 361,687 18,311 346 16,289 27,127 30,632 50,304 79,274 50,915Male 211,592 11,008 - 4,654 10,728 14,167 26,082 49,963 34,704Female 150,094 7,303 346 11,635 16,399 16,465 24,222 29,310 16,211
50-54Total 266,025 19,576 1,185 11,476 27,483 26,439 32,395 57,784 30,191Male 153,598 10,403 367 590 10,924 11,167 19,508 35,751 20,316Female 112,428 9,173 818 10,887 16,559 15,271 12,887 22,033 9,875
55-59Total 152,584 10,989 422 7,192 10,894 15,865 18,009 33,695 21,910Male 96,469 5,799 75 2,834 3,316 9,214 10,823 26,113 14,838Female 56,115 5,190 346 4,359 7,578 6,651 7,186 7,582 7,072
60-64Total 113,615 8,783 1,067 7,963 10,161 9,230 14,360 21,212 16,506Male 75,221 7,215 428 1,956 4,693 4,732 7,659 17,221 11,452Female 38,393 1,568 640 6,007 5,468 4,498 6,701 3,991 5,055
65+Total 158,859 12,913 60 14,423 17,782 22,280 15,342 24,726 19,435Male 108,519 9,457 60 5,975 8,763 12,604 9,795 19,842 15,092Female 50,340 3,455 - 8,448 9,019 9,676 5,547 4,884 4,342
Created by PDF Generator (http://www.alientools.com/), to remove this mark, please buy the software.

Table 5.18 Currently Employed Population of Urban Areas Aged Ten Years and Above by Region, Sex, MeanNumber of Hours Worked Per Week: 2012
Number of Hours Worked Per WeekRegion and Sex
Total 0 1-3 4-12 13-21 22-30 31-39 40-48 49-57COUNTRY TOTAL
Total 5,726,116 275,568 9,353 322,625 429,717 503,568 697,095 1,266,142 825,717 851,143Male 3,202,042 145,905 2,594 117,929 188,151 252,231 363,160 753,429 503,771 545,707Female 2,524,074 129,663 6,759 204,697 241,566 251,337 333,936 512,712 321,946 305,436
TIGRAY REGIONTotal 391,891 23,377 626 18,384 20,566 29,016 35,570 78,802 71,589Male 204,483 13,895 - 4,963 5,945 15,646 16,279 41,009 41,061Female 187,408 9,482 626 13,421 14,621 13,369 19,290 37,793 30,528
AFFAR REGIONTotal 77,068 5,497 144 2,773 7,365 6,041 8,621 13,538 15,048Male 43,657 3,975 - 643 2,678 3,056 3,866 9,213 10,289Female 33,411 1,522 144 2,130 4,687 2,984 4,755 4,325 4,759
AMHARA REGIONTotal 1,063,958 68,967 2,565 92,287 117,980 100,399 112,604 225,776 133,245 128,131Male 562,815 27,645 156 31,682 54,677 50,466 61,722 138,668 80,960Female 501,144 41,322 2,409 60,605 63,304 49,933 50,882 87,108 52,285
OROMIA REGIONTotal 1,643,077 76,603 2,338 98,980 135,010 187,665 194,305 352,830 232,140 231,782Male 963,543 44,989 1,871 46,108 60,265 95,172 103,400 216,760 147,837 156,044Female 679,534 31,614 467 52,872 74,746 92,493 90,905 136,070 84,303
SOMALI REGIONTotal 202,547 7,112 50 15,597 20,432 19,685 35,529 35,664 29,001Male 111,869 5,117 - 4,200 8,025 12,372 20,348 19,975 16,871Female 90,677 1,995 50 11,397 12,407 7,313 15,181 15,689 12,130
BENISHANGUL-GUMUZ REGION
Total 72,518 3,753 293 7,612 8,206 9,590 15,260 9,504 7,129Male 39,854 1,974 28 2,561 3,659 4,898 9,234 5,935 4,771Female 32,664 1,779 264 5,052 4,547 4,692 6,027 3,569 2,358
SNNP REGIONTotal 837,386 38,456 2,079 57,436 76,197 78,977 83,827 208,112 102,217 111,885Male 466,330 19,337 495 14,680 31,408 35,866 43,686 130,930 64,858Female 371,057 19,119 1,584 42,756 44,789 43,111 40,141 77,183 37,359
Created by PDF Generator (http://www.alientools.com/), to remove this mark, please buy the software.
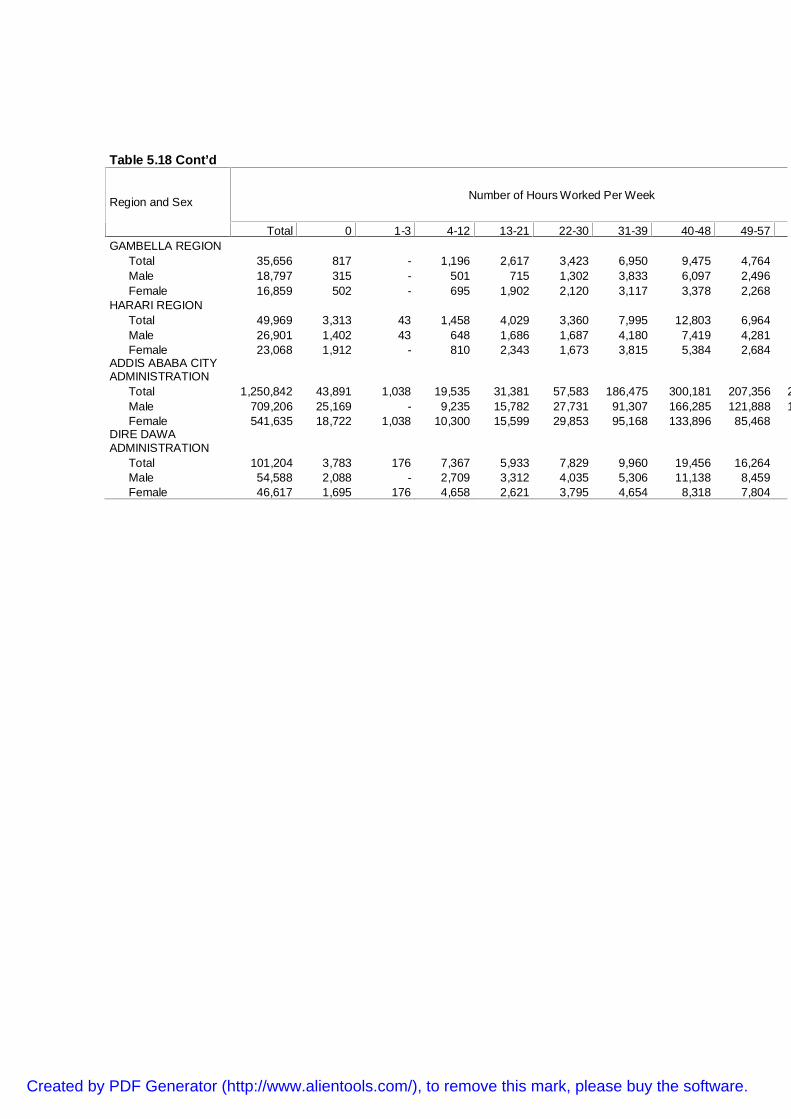
Table 5.18 Cont’d
Number of Hours Worked Per WeekRegion and Sex
Total 0 1-3 4-12 13-21 22-30 31-39 40-48 49-57GAMBELLA REGION
Total 35,656 817 - 1,196 2,617 3,423 6,950 9,475 4,764Male 18,797 315 - 501 715 1,302 3,833 6,097 2,496Female 16,859 502 - 695 1,902 2,120 3,117 3,378 2,268
HARARI REGIONTotal 49,969 3,313 43 1,458 4,029 3,360 7,995 12,803 6,964Male 26,901 1,402 43 648 1,686 1,687 4,180 7,419 4,281Female 23,068 1,912 - 810 2,343 1,673 3,815 5,384 2,684
ADDIS ABABA CITYADMINISTRATION
Total 1,250,842 43,891 1,038 19,535 31,381 57,583 186,475 300,181 207,356 240,768Male 709,206 25,169 - 9,235 15,782 27,731 91,307 166,285 121,888 155,860Female 541,635 18,722 1,038 10,300 15,599 29,853 95,168 133,896 85,468
DIRE DAWAADMINISTRATION
Total 101,204 3,783 176 7,367 5,933 7,829 9,960 19,456 16,264Male 54,588 2,088 - 2,709 3,312 4,035 5,306 11,138 8,459Female 46,617 1,695 176 4,658 2,621 3,795 4,654 8,318 7,804
Created by PDF Generator (http://www.alientools.com/), to remove this mark, please buy the software.

Table 5.19 Currently Employed Population of Urban Areas Aged Ten Years and Above by Major Industrial Divisions, Sex andand Number of Hours Worked Per Week - COUNTRY TOTAL: 2012
Number of Hours Worked Per WeekMajor Industrial Divisionsand Sex
Total 0 1-3 4-12 13-21 22-30 31-39 40-48 49-57Total Employed Population
Total 5,726,116 275,568 9,353 322,625 429,717 503,568 697,095 1,266,142 825,717Male 3,202,042 145,905 2,594 117,929 188,151 252,231 363,160 753,429 503,771Female 2,524,074 129,663 6,759 204,697 241,566 251,337 333,936 512,712 321,946
Agriculture, Hunting Forestry & FishingTotal 469,377 47,893 839 50,435 79,524 73,915 54,931 69,867 43,207Male 315,988 25,715 395 28,733 48,090 50,540 40,520 52,721 33,505Female 153,389 22,178 444 21,702 31,435 23,375 14,411 17,147 9,703
Mining & QuarryingTotal 21,374 1,811 - 1,001 132 1,856 3,487 5,657 4,365Male 16,486 696 - 1,001 103 1,856 2,795 3,521 3,537Female 4,888 1,115 - - 28 - 692 2,136 828
ManufacturingTotal 757,055 40,502 2,682 46,617 59,084 67,308 79,312 161,165 127,157Male 419,831 17,536 549 15,468 16,188 27,858 33,848 100,037 85,203Female 337,224 22,966 2,133 31,149 42,896 39,450 45,465 61,127 41,954
Electricity, Gas and Water SupplyTotal 53,226 1,891 - 4,961 2,897 1,738 5,791 18,088 9,287Male 38,176 1,611 - 1,533 248 1,273 3,533 12,831 8,929Female 15,050 280 - 3,428 2,649 466 2,258 5,257 358
ConstructionTotal 395,129 23,345 1,023 10,664 19,472 36,483 43,943 113,207 68,470Male 324,893 21,114 1,023 8,182 16,667 29,272 35,017 90,598 54,873Female 70,235 2,231 - 2,482 2,804 7,211 8,926 22,609 13,597
Wholesale and Retail TradeTotal 1,235,258 59,521 2,091 67,671 106,813 135,357 108,946 203,986 183,398Male 625,873 30,739 60 22,656 40,467 50,989 44,683 101,712 105,955Female 609,386 28,782 2,031 45,016 66,346 84,368 64,263 102,275 77,443
Hotels and RestaurantsTotal 457,810 19,531 645 24,918 29,668 36,373 38,510 58,791 63,605Male 112,237 2,170 - 2,485 3,681 4,152 6,792 11,564 13,289Female 345,572 17,361 645 22,433 25,987 32,220 31,718 47,227 50,316
Transport, Storage and CommunicationsTotal 260,370 16,519 - 3,452 6,257 10,032 18,034 46,025 37,134Male 246,962 16,086 - 2,986 6,257 9,404 15,631 42,617 35,195Female 13,407 433 - 465 - 628 2,404 3,408 1,939
Created by PDF Generator (http://www.alientools.com/), to remove this mark, please buy the software.

Table 5.19 Cont’d
Number of Hours Worked Per WeekMajor Industrial Divisionsand Sex
Total 0 1-3 4-12 13-21 22-30 31-39 40-48 49-57Financial Intermediation
Total 115,655 4,259 - 1,055 1,592 3,192 28,578 54,813 11,827Male 69,717 1,955 - 446 713 1,785 12,390 34,377 8,791Female 45,938 2,304 - 610 879 1,407 16,188 20,436 3,035
Real Estate, Renting and Business ActivitiesTotal 119,259 5,049 - 3,568 3,271 5,422 23,094 43,428 15,203Male 74,806 3,357 - 2,777 1,710 3,475 12,103 26,295 10,735Female 44,453 1,692 - 790 1,561 1,947 10,991 17,133 4,467
Public administration and DefenseTotal 381,757 16,830 96 2,167 6,503 10,083 99,095 144,009 53,278Male 251,433 10,899 96 1,273 2,748 5,712 55,219 91,685 40,845Female 130,324 5,931 - 895 3,754 4,370 43,876 52,324 12,433
EducationTotal 404,111 8,564 - 2,101 35,473 51,686 87,128 139,451 50,383Male 239,864 3,384 - 1,429 20,553 28,303 49,506 83,387 31,144Female 164,247 5,180 - 673 14,920 23,384 37,622 56,064 19,239
Health and Social WorkTotal 182,330 8,914 - 2,670 3,537 5,156 26,203 72,727 36,810Male 91,421 3,748 - 1,498 1,462 1,484 12,019 35,973 17,070Female 90,909 5,166 - 1,172 2,075 3,672 14,184 36,754 19,740
Other Community, Social and PersonalService Activities
Total 566,625 16,527 1,639 94,309 61,231 52,424 51,044 85,876 69,134Male 330,050 4,948 471 26,904 26,532 35,160 32,301 57,969 49,021Female 236,574 11,579 1,168 67,404 34,699 17,265 18,743 27,906 20,113
Private Households with Employed PersonsTotal 269,616 1,024 338 5,617 13,145 12,212 20,120 38,218 47,455Male 20,520 98 - 112 1,613 767 2,041 1,616 1,994Female 249,095 925 338 5,505 11,532 11,445 18,079 36,602 45,461
Extra-Territorial Organizations and NGOsTotal 34,003 1,809 - 1,421 939 330 8,592 10,834 3,930Male 21,696 838 - 447 939 203 4,764 6,527 2,789Female 12,307 970 - 974 - 128 3,828 4,307 1,141
Not StatedTotal 3,162 1,578 - - 179 - 287 - 1,075Male 2,087 1,011 - - 179 - - - 896Female 1,076 567 - - - - 287 - 179
Created by PDF Generator (http://www.alientools.com/), to remove this mark, please buy the software.

Created by PDF Generator (http://www.alientools.com/), to remove this mark, please buy the software.

Table 5.20 Currently Employed Population of Urban Areas Aged Ten Years and Above by Sex, Major Occupational Groups andMean and Number of Hours Worked Per Week - COUNTRY TOTAL: 2012
Number of Hours Worked Per WeekMajor OccupationalGroups and Sex Total
EmployedPersons 0 1-3 4-12 13-21 22-30 31-39 40-48 49-57 58
Total Employed PersonsTotal 5,726,116 275,568 9,353 322,625 429,717 503,568 697,095 1,266,142 825,717 851,143Male 3,202,042 145,905 2,594 117,929 188,151 252,231 363,160 753,429 503,771 545,707Female 2,524,074 129,663 6,759 204,697 241,566 251,337 333,936 512,712 321,946 305,436
Legislator Senior Officials& Managers
Total 165,228 7,027 367 1,096 3,307 3,196 33,567 67,351 23,735 15,425Male 128,944 5,052 367 432 2,337 2,163 24,741 54,146 19,533 13,178Female 36,284 1,975 - 664 970 1,033 8,826 13,205 4,202 2,247
ProfessionalTotal 376,286 10,921 - 3,813 20,310 31,237 87,703 149,032 48,430 16,500Male 259,132 6,633 - 3,295 13,489 20,286 59,390 99,142 37,533 12,839Female 117,154 4,289 - 518 6,821 10,951 28,313 49,890 10,897 3,661
Technical and AssociateProfessionals
Total 359,728 12,943 261 5,805 21,632 33,801 69,572 136,617 48,048 18,931Male 225,287 6,978 171 3,708 13,972 17,584 42,223 84,951 29,898 15,911Female 134,441 5,965 90 2,098 7,660 16,217 27,349 51,666 18,150 3,020
ClerksTotal 316,379 10,731 356 6,034 5,464 6,175 80,245 127,818 38,451 23,925Male 123,190 3,491 - 1,914 1,229 2,645 22,958 49,899 17,503 13,211Female 193,190 7,241 356 4,120 4,235 3,530 57,286 77,918 20,948 10,714
Service, Shop & Marketsales Workers
Total 1,516,208 72,051 2,895 107,914 123,821 135,142 126,438 215,284 224,158 289,090Male 646,222 28,836 - 27,080 41,493 45,199 46,843 91,169 106,545 148,679Female 869,985 43,215 2,895 80,834 82,328 89,943 79,595 124,114 117,613 140,411
Skilled agricultural andFishery
Total 343,555 31,489 472 35,179 55,136 55,340 39,858 55,300 34,805 27,654Male 246,151 22,613 28 20,090 33,758 41,079 29,781 43,359 28,960 20,491Female 97,404 8,876 444 15,088 21,378 14,261 10,078 11,942 5,845 7,163
Created by PDF Generator (http://www.alientools.com/), to remove this mark, please buy the software.

Table 5.20 Cont’dNumber of Hours Worked Per WeekMajor Occupational
Groups and Sex TotalEmployedPersons 0 1-3 4-12 13-21 22-30 31-39 40-48 49-57 58
Crafts and related tradesTotal 1,048,027 61,628 3,787 63,439 90,225 108,655 117,235 229,496 162,017 158,066Male 616,303 34,926 1,376 21,950 29,084 47,020 58,300 161,074 112,296 114,962Female 431,723 26,702 2,411 41,489 61,141 61,635 58,935 68,422 49,721 43,105
Plant ,Machine Operators& Assemblers
Total 305,437 18,507 - 2,513 5,630 11,751 19,676 59,506 54,503 74,775Male 286,619 16,583 - 2,073 5,581 10,520 18,731 53,744 50,657 71,951Female 18,818 1,924 - 440 49 1,231 945 5,762 3,845 2,824
Elementary OccupationTotal 1,293,289 48,692 1,215 96,832 104,014 118,270 122,802 225,736 191,390 226,734Male 669,003 19,784 652 37,385 47,029 65,736 60,193 115,945 100,845 134,485Female 624,286 28,909 564 59,447 56,985 52,534 62,609 109,792 90,546 92,249
Not StatedTotal 1,979 1,578 - - 179 - - - 179Male 1,190 1,011 - - 179 - - - -Female 788 567 - - - - - - 179
Created by PDF Generator (http://www.alientools.com/), to remove this mark, please buy the software.
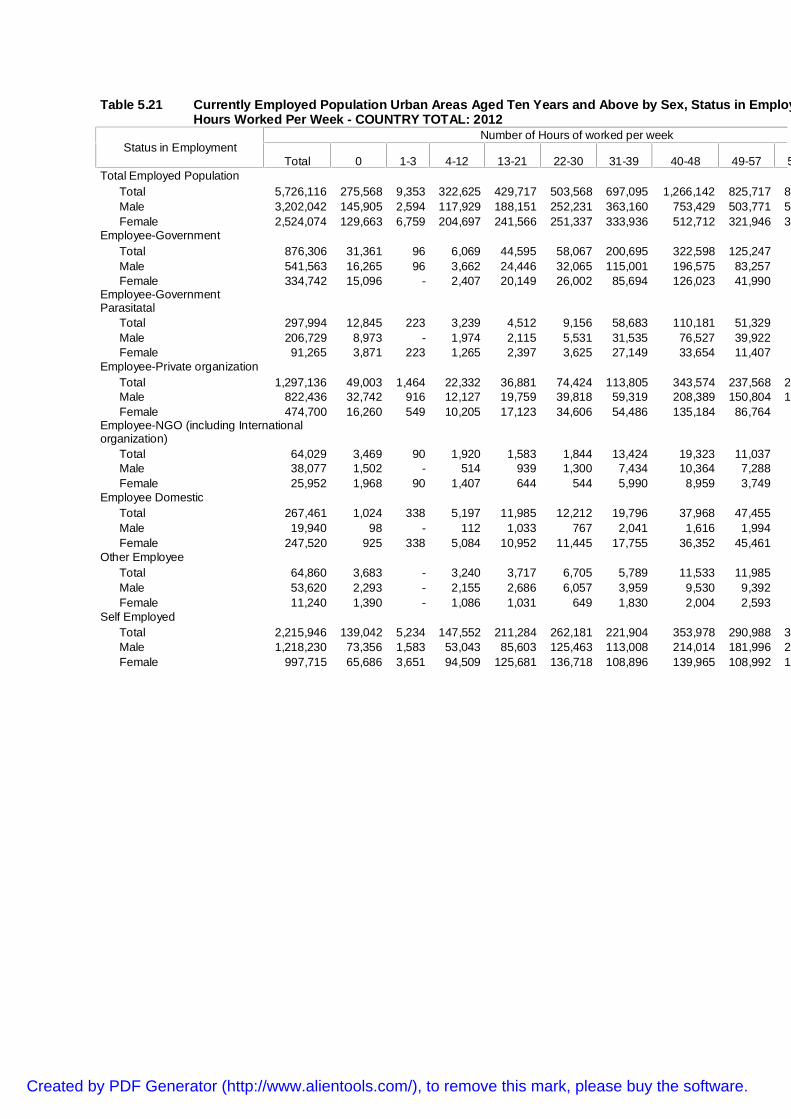
Table 5.21 Currently Employed Population Urban Areas Aged Ten Years and Above by Sex, Status in Employment and Number ofHours Worked Per Week - COUNTRY TOTAL: 2012
Number of Hours of worked per weekStatus in Employment
Total 0 1-3 4-12 13-21 22-30 31-39 40-48 49-57 58Total Employed Population
Total 5,726,116 275,568 9,353 322,625 429,717 503,568 697,095 1,266,142 825,717 851,143Male 3,202,042 145,905 2,594 117,929 188,151 252,231 363,160 753,429 503,771 545,707Female 2,524,074 129,663 6,759 204,697 241,566 251,337 333,936 512,712 321,946 305,436
Employee-GovernmentTotal 876,306 31,361 96 6,069 44,595 58,067 200,695 322,598 125,247Male 541,563 16,265 96 3,662 24,446 32,065 115,001 196,575 83,257Female 334,742 15,096 - 2,407 20,149 26,002 85,694 126,023 41,990
Employee-GovernmentParasitatal
Total 297,994 12,845 223 3,239 4,512 9,156 58,683 110,181 51,329Male 206,729 8,973 - 1,974 2,115 5,531 31,535 76,527 39,922Female 91,265 3,871 223 1,265 2,397 3,625 27,149 33,654 11,407
Employee-Private organizationTotal 1,297,136 49,003 1,464 22,332 36,881 74,424 113,805 343,574 237,568 246,373Male 822,436 32,742 916 12,127 19,759 39,818 59,319 208,389 150,804 174,021Female 474,700 16,260 549 10,205 17,123 34,606 54,486 135,184 86,764
Employee-NGO (including Internationalorganization)
Total 64,029 3,469 90 1,920 1,583 1,844 13,424 19,323 11,037Male 38,077 1,502 - 514 939 1,300 7,434 10,364 7,288Female 25,952 1,968 90 1,407 644 544 5,990 8,959 3,749
Employee DomesticTotal 267,461 1,024 338 5,197 11,985 12,212 19,796 37,968 47,455Male 19,940 98 - 112 1,033 767 2,041 1,616 1,994Female 247,520 925 338 5,084 10,952 11,445 17,755 36,352 45,461
Other EmployeeTotal 64,860 3,683 - 3,240 3,717 6,705 5,789 11,533 11,985Male 53,620 2,293 - 2,155 2,686 6,057 3,959 9,530 9,392Female 11,240 1,390 - 1,086 1,031 649 1,830 2,004 2,593
Self EmployedTotal 2,215,946 139,042 5,234 147,552 211,284 262,181 221,904 353,978 290,988 383,712Male 1,218,230 73,356 1,583 53,043 85,603 125,463 113,008 214,014 181,996 251,232Female 997,715 65,686 3,651 94,509 125,681 136,718 108,896 139,965 108,992 132,479
Created by PDF Generator (http://www.alientools.com/), to remove this mark, please buy the software.

Table 5.21 Cont’dNumber of Hours of worked per week
Status in EmploymentTotal 0 1-3 4-12 13-21 22-30 31-39 40-48 49-57 58-74
Unpaid Family WorkerTotal 493,930 25,456 1,101 121,674 103,991 65,817 48,339 39,797 28,904Male 206,822 4,825 - 41,359 45,396 33,102 22,868 16,694 12,162Female 287,108 20,631 1,101 80,316 58,595 32,715 25,472 23,103 16,742
EmployerTotal 39,445 2,142 - 156 752 2,035 2,392 7,924 6,444Male 29,577 1,588 - 103 691 815 1,853 5,849 5,713Female 9,869 554 - 54 61 1,220 540 2,074 730
ApprenticeTotal 10,872 230 - 904 860 844 1,039 3,840 2,156Male 7,327 230 - 115 346 498 769 3,160 1,557Female 3,544 - - 789 514 346 270 680 599
Member of Co-OperativesTotal 50,871 4,026 808 2,878 1,832 4,470 7,696 9,401 5,665Male 28,239 1,880 - 1,541 1,792 2,056 2,976 5,704 4,015Female 22,632 2,146 808 1,337 40 2,414 4,720 3,697 1,650
OthersTotal 47,268 3,288 - 7,463 7,725 5,812 3,531 6,025 6,940Male 29,482 2,153 - 1,223 3,345 4,759 2,397 5,008 5,670Female 17,786 1,135 - 6,240 4,380 1,053 1,134 1,017 1,269
Created by PDF Generator (http://www.alientools.com/), to remove this mark, please buy the software.

Table 5.22 Paid Employees of Urban Population Aged Ten Years and Above by Region, Sex and Type of Payment: 2012
Total Paid Employees Employee-Government Employee-GovernmentParasitatal
Employee-Privateorganization
Employee-NGO(including International
organization)Employee Domestic
Type of Payment
Total Male Female Total Male Female Total Male Female Total Male Female Total Male Female TotalCOUNTRY TOTAL
Total 2,867,785 1,682,365 1,185,420 876,306 541,563 334,742 297,994 206,729 91,265 1,297,136 822,436 474,700 64,029 38,077 25,952 267,461In cash 2,766,231 1,633,779 1,132,452 861,498 533,211 328,287 289,906 201,275 88,632 1,250,677 794,722 455,955 62,407 37,950 24,457 241,290In kind 21,647 8,571 13,076 3,210 1,010 2,199 918 824 94 8,159 3,202 4,956 91 51 39 6,545Both 75,979 37,185 38,794 11,543 7,310 4,233 6,670 4,131 2,539 36,307 22,558 13,750 1,115 75 1,040 18,660Not stated 3,928 2,830 1,098 54 31 23 499 499 - 1,993 1,953 40 416 - 416 965
TIGRAY REGIONTotal 189,677 107,939 81,738 64,502 39,498 25,003 17,399 10,737 6,661 86,620 50,457 36,163 5,385 3,407 1,978 11,984In cash 182,024 106,109 75,915 64,069 39,242 24,827 17,399 10,737 6,661 82,246 49,138 33,108 4,960 3,407 1,553 10,074In kind 2,686 662 2,024 - - - - - - 2,431 407 2,024 - - -Both 4,967 1,168 3,799 433 257 176 - - - 1,943 912 1,031 425 - 425 1,911Not stated - - - - - - - - - - - - - - -
AFFAR REGIONTotal 38,124 25,538 12,586 8,725 5,868 2,857 7,851 5,847 2,004 17,641 12,679 4,961 428 260 168 2,229In cash 37,871 25,285 12,586 8,582 5,724 2,857 7,778 5,774 2,004 17,616 12,655 4,961 416 248 168 2,229In kind 61 61 - - - - 36 36 - 13 13 - 12 12 -Both 181 181 - 144 144 - 37 37 - - - - - - -Not stated 12 12 - - - - - - - 12 12 - - - -
AMHARA REGIONTotal 435,245 257,734 177,511 167,769 105,571 62,198 39,303 28,759 10,544 172,824 105,986 66,838 6,331 4,018 2,314 36,709In cash 419,259 248,532 170,727 163,485 102,605 60,880 37,454 28,022 9,432 165,701 102,299 63,402 6,331 4,018 2,314 35,568In kind 2,700 1,741 959 89 - 89 89 89 - 1,296 703 594 - - - 277Both 13,286 7,461 5,825 4,195 2,966 1,229 1,760 648 1,112 5,826 2,984 2,842 - - - 865Not stated - - - - - - - - - - - - - - -
OROMIA REGIONTotal 762,056 480,200 281,856 233,690 151,891 81,799 70,467 52,229 18,238 371,357 245,409 125,948 17,443 9,534 7,909 48,197In cash 733,919 464,940 268,979 229,721 150,041 79,680 67,785 49,806 17,978 358,391 236,011 122,381 16,679 9,494 7,184 41,712In kind 6,018 2,492 3,526 59 - 59 373 279 94 2,885 954 1,932 79 39 39 1,478Both 19,895 10,960 8,935 3,909 1,849 2,060 1,810 1,644 166 8,771 7,136 1,636 269 - 269 5,007Not stated 2,224 1,808 416 - - - 499 499 - 1,309 1,309 - 416 - 416
SOMALI REGIONTotal 64,880 44,711 20,169 30,133 20,625 9,509 12,296 8,145 4,151 15,507 13,615 1,892 1,904 1,316 588 3,665In cash 61,841 43,558 18,283 28,058 20,436 7,622 12,246 8,095 4,151 14,907 13,015 1,892 1,904 1,316 588 3,665In kind 1,975 88 1,887 1,975 88 1,887 - - - - - - - - -Both 1,065 1,065 - 101 101 - 50 50 - 599 599 - - - -Not stated - - - - - - - - - - - - - - -
Created by PDF Generator (http://www.alientools.com/), to remove this mark, please buy the software.
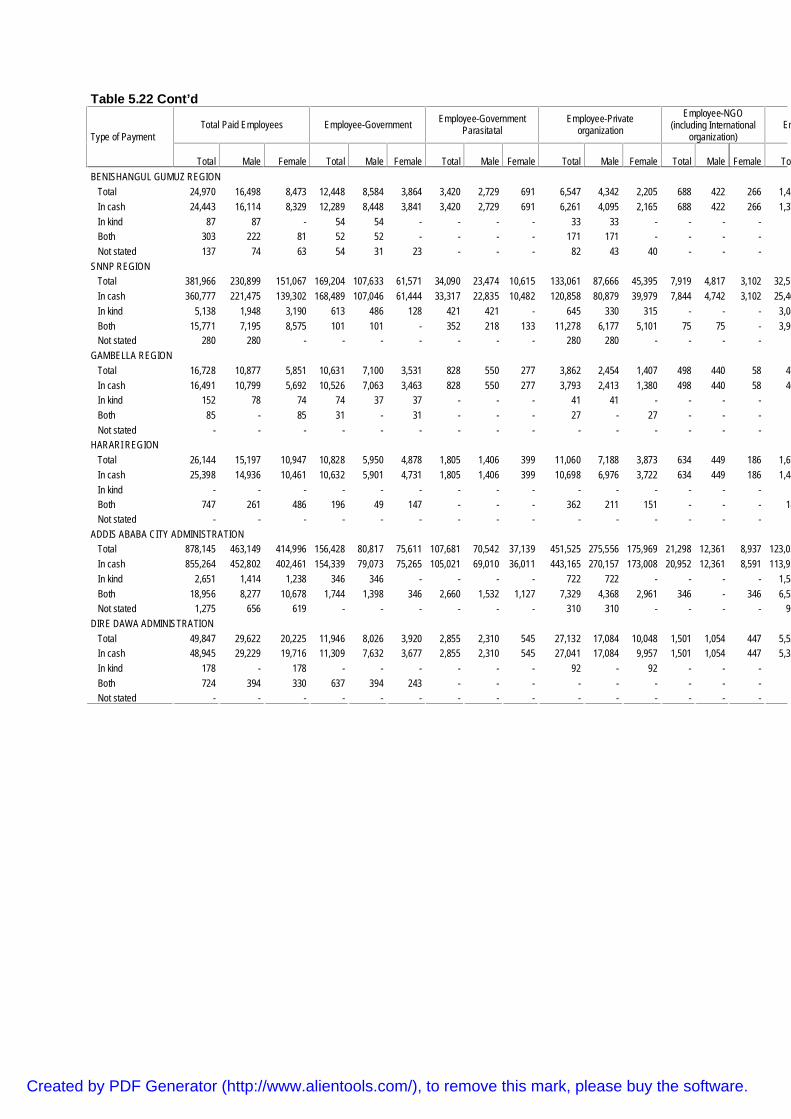
Table 5.22 Cont’d
Total Paid Employees Employee-Government Employee-GovernmentParasitatal
Employee-Privateorganization
Employee-NGO(including International
organization)Employee Domestic
Type of Payment
Total Male Female Total Male Female Total Male Female Total Male Female Total Male Female TotalBENISHANGUL GUMUZ REGION
Total 24,970 16,498 8,473 12,448 8,584 3,864 3,420 2,729 691 6,547 4,342 2,205 688 422 266 1,453In cash 24,443 16,114 8,329 12,289 8,448 3,841 3,420 2,729 691 6,261 4,095 2,165 688 422 266 1,372In kind 87 87 - 54 54 - - - - 33 33 - - - -Both 303 222 81 52 52 - - - - 171 171 - - - -Not stated 137 74 63 54 31 23 - - - 82 43 40 - - -
SNNP REGIONTotal 381,966 230,899 151,067 169,204 107,633 61,571 34,090 23,474 10,615 133,061 87,666 45,395 7,919 4,817 3,102 32,517In cash 360,777 221,475 139,302 168,489 107,046 61,444 33,317 22,835 10,482 120,858 80,879 39,979 7,844 4,742 3,102 25,469In kind 5,138 1,948 3,190 613 486 128 421 421 - 645 330 315 - - - 3,083Both 15,771 7,195 8,575 101 101 - 352 218 133 11,278 6,177 5,101 75 75 - 3,964Not stated 280 280 - - - - - - - 280 280 - - - -
GAMBELLA REGIONTotal 16,728 10,877 5,851 10,631 7,100 3,531 828 550 277 3,862 2,454 1,407 498 440 58 470In cash 16,491 10,799 5,692 10,526 7,063 3,463 828 550 277 3,793 2,413 1,380 498 440 58 406In kind 152 78 74 74 37 37 - - - 41 41 - - - -Both 85 - 85 31 - 31 - - - 27 - 27 - - -Not stated - - - - - - - - - - - - - - -
HARARI REGIONTotal 26,144 15,197 10,947 10,828 5,950 4,878 1,805 1,406 399 11,060 7,188 3,873 634 449 186 1,670In cash 25,398 14,936 10,461 10,632 5,901 4,731 1,805 1,406 399 10,698 6,976 3,722 634 449 186 1,482In kind - - - - - - - - - - - - - - -Both 747 261 486 196 49 147 - - - 362 211 151 - - - 188Not stated - - - - - - - - - - - - - - -
ADDIS ABABA CITY ADMINISTRATIONTotal 878,145 463,149 414,996 156,428 80,817 75,611 107,681 70,542 37,139 451,525 275,556 175,969 21,298 12,361 8,937 123,036In cash 855,264 452,802 402,461 154,339 79,073 75,265 105,021 69,010 36,011 443,165 270,157 173,008 20,952 12,361 8,591 113,957In kind 2,651 1,414 1,238 346 346 - - - - 722 722 - - - - 1,584Both 18,956 8,277 10,678 1,744 1,398 346 2,660 1,532 1,127 7,329 4,368 2,961 346 - 346 6,530Not stated 1,275 656 619 - - - - - - 310 310 - - - - 965
DIRE DAWA ADMINISTRATIONTotal 49,847 29,622 20,225 11,946 8,026 3,920 2,855 2,310 545 27,132 17,084 10,048 1,501 1,054 447 5,529In cash 48,945 29,229 19,716 11,309 7,632 3,677 2,855 2,310 545 27,041 17,084 9,957 1,501 1,054 447 5,356In kind 178 - 178 - - - - - - 92 - 92 - - -Both 724 394 330 637 394 243 - - - - - - - - -Not stated - - - - - - - - - - - - - - -
Created by PDF Generator (http://www.alientools.com/), to remove this mark, please buy the software.

Table 5.23 Paid Employees of Urban Population Aged Ten Years and Above by Sexand Period of Payment - COUNTRY TOTAL: 2012
Paid Employees
Period ofPaymentand Sex Total
PaidEmployees
Employee-Government
Employee-GovernmentParasitatal
Employee-Private
organization
Employee-NGO
(includingInternationalorganization)
EmployeeDomestic
OtherPaid
EmployeesTotal Paid Employees
Total 2,867,785 876,306 297,994 1,297,136 64,029 267,461 64,860Male 1,682,365 541,563 206,729 822,436 38,077 19,940 53,620Female 1,185,420 334,742 91,265 474,700 25,952 247,520 11,240
Hourly
Total 20,972 2,357 1,570 16,075 - 356 614Male 14,847 1,969 89 12,229 - 269 290Female 6,125 388 1,480 3,846 - 87 324
Daily
Total 124,396 1,946 2,015 108,770 317 2,270 9,077Male 95,866 1,581 1,458 84,465 227 48 8,087Female 28,530 365 558 24,305 90 2,222 990
Weekly
Total 119,978 709 2,132 110,928 88 1,539 4,582Male 91,241 415 2,015 84,200 88 346 4,176Female 28,737 294 117 26,728 - 1,193 406
Half Month
Total 89,676 3,081 6,536 75,256 1,073 885 2,844Male 55,420 1,919 4,073 46,932 451 210 1,835Female 34,255 1,161 2,463 28,323 623 675 1,009
Monthly
Total 2,459,248 866,113 283,243 952,899 61,508 252,993 42,493Male 1,395,219 534,886 196,901 573,800 36,907 18,009 34,716Female 1,064,029 331,226 86,342 379,099 24,601 234,984 7,777
Yearly
Total 12,056 1,254 - 1,901 403 5,475 3,022Male 5,656 643 - 1,219 403 605 2,785Female 6,400 611 - 682 - 4,870 237
Others
Total 37,495 791 1,998 29,314 223 3,287 1,882Male 20,940 118 1,694 17,636 - 107 1,385Female 16,555 673 305 11,678 223 3,179 497
Not Stated
Total 3,964 54 499 1,993 416 656 346Male 3,176 31 499 1,953 - 346 346Female 788 23 - 40 416 310 -
Created by PDF Generator (http://www.alientools.com/), to remove this mark, please buy the software.

Table 5.24 Paid Employees of Urban Population Aged Ten Years and Over by Sex, Periodof Payment and Amount of Total Payment - COUNTRY TOTAL: 2012
Amount of Total Payment Per Month (In Birr)Period ofPayment and
Sex Total <50 50-99 100-199 200-399 400-699 700-999 1000+Not
StatedTotal Paid Employees
Total 2,867,785 14,939 29,218 108,926 388,948 548,049 385,789 1,368,088 23,827Male 1,682,365 1,658 5,576 24,032 118,389 283,880 250,551 984,180 14,099Female 1,185,420 13,280 23,642 84,894 270,559 264,169 135,239 383,908 9,728
Hourly
Total 20,972 1,043 173 1,290 2,901 3,777 2,642 8,496 650Male 14,847 490 - 385 1,715 2,760 2,541 6,652 304Female 6,125 553 173 904 1,186 1,017 101 1,844 346
Daily
Total 124,396 2,000 3,322 7,271 15,658 27,827 18,203 48,694 1,419Male 95,866 59 1,159 3,639 8,907 20,838 16,400 43,890 973Female 28,530 1,941 2,163 3,632 6,752 6,988 1,803 4,804 447
Weekly
Total 119,978 1,125 1,217 6,682 14,542 32,214 25,680 38,237 281Male 91,241 209 642 3,887 7,491 20,783 21,180 36,769 281Female 28,737 916 575 2,795 7,051 11,431 4,500 1,468 -
Half Month
Total 89,676 552 1,187 1,043 11,084 33,463 16,824 25,319 204Male 55,420 346 - 316 3,131 13,650 14,082 23,815 80Female 34,255 206 1,187 727 7,953 19,813 2,742 1,504 124
Monthly
Total 2,459,248 9,379 22,089 88,594 335,315 436,670 316,180 1,234,931 16,090Male 1,395,219 554 3,439 14,804 92,971 220,076 191,074 863,133 9,167Female 1,064,029 8,825 18,651 73,790 242,344 216,594 125,106 371,798 6,923
Yearly
Total 12,056 633 802 1,403 2,062 2,283 654 4,219 -Male 5,656 - 336 813 1,058 403 654 2,392 -Female 6,400 633 465 590 1,004 1,880 - 1,827 -
Other
Total 37,495 206 427 2,643 7,386 11,784 5,606 7,866 1,577Male 20,940 - - 187 3,117 5,338 4,619 7,225 453Female 16,555 206 427 2,456 4,270 6,446 987 640 1,124
Not Stated
Total 3,964 - - - - 31 - 326 3,607Male 3,176 - - - - 31 - 303 2,841Female 788 - - - - - - 23 765
Created by PDF Generator (http://www.alientools.com/), to remove this mark, please buy the software.

Table 5.25 Paid Employees of Urban Population Aged Ten Years and Above by MajorIndustrial Divisions, Sex and Amount of Payment Per Month -COUNTRY TOTAL: 2012
Amount of Total Payment Per Month (In Birr)Major IndustrialDivisions and
Sex Total <50 50-99 100-199 200-399 400-699 700-999 1000+Not
stated
MeanAmountof Total
Payment
Total Employed PopulationTotal 2,867,785 14,939 29,218 108,926 388,948 548,049 385,789 1,368,088 23,827 1,255.9Male 1,682,365 1,658 5,576 24,032 118,389 283,880 250,551 984,180 14,099 1,519.3Female 1,185,420 13,280 23,642 84,894 270,559 264,169 135,239 383,908 9,728 882.1
Agriculture, Hunting Forestry & FishingTotal 68,394 731 1,241 4,290 14,366 22,127 8,502 15,914 1,224 821.3Male 46,812 - 368 2,849 8,100 14,516 5,919 13,836 1,224 962.5Female 21,583 731 873 1,440 6,267 7,611 2,583 2,078 - 522.9
Mining &Quarrying
Total 9,225 - - - 1,057 1,831 344 5,993 - 1,787.2Male 6,031 - - - 641 740 344 4,307 - 2,198.5Female 3,194 - - - 416 1,091 - 1,686 - 1,010.5
ManufacturingTotal 323,139 3,300 2,425 8,309 36,409 90,882 65,273 111,464 5,076 1,017.6Male 211,812 645 783 3,840 17,891 53,638 47,312 84,894 2,810 1,105.6Female 111,327 2,656 1,642 4,469 18,519 37,245 17,962 26,570 2,266 848.9
Electricity, Gas and Water SupplyTotal 43,245 127 - - 2,407 7,670 9,091 23,440 511 1,402.8Male 33,986 - - - 1,472 7,104 7,013 17,886 511 1,456.5Female 9,259 127 - - 935 566 2,077 5,554 - 1,208.5
ConstructionTotal 256,948 301 593 3,261 20,479 52,070 41,496 136,952 1,797 1,349.1Male 202,994 59 320 2,020 12,043 32,101 33,579 121,075 1,797 1,477.8Female 53,954 241 273 1,241 8,436 19,970 7,917 15,877 - 869.3
Whole Sale and Retail TradeTotal 190,212 2,185 2,917 9,743 30,771 56,446 34,822 51,499 1,831 874.1Male 115,333 - 479 5,367 12,962 28,881 24,666 41,915 1,064 1,032.2Female 74,879 2,185 2,438 4,376 17,809 27,565 10,156 9,584 767 630.2
Hotels andRestaurants
Total 167,346 565 1,103 9,588 61,176 50,132 20,150 23,188 1,444 741.8Male 64,485 - 432 2,101 17,566 20,815 8,604 14,226 740 1,122.5Female 102,861 565 671 7,487 43,610 29,317 11,546 8,962 703 504.2
Transport, Storage and CommunicationsTotal 179,582 376 100 839 8,902 28,189 30,213 109,788 1,176 1,513.9Male 167,601 376 100 839 8,327 25,135 28,695 102,954 1,176 1,486.2Female 11,981 - - - 575 3,053 1,519 6,834 - 1,898.0
FinancialIntermediation
Total 114,654 - - 825 1,653 9,458 11,410 90,804 503 2,030.3Male 69,453 - - 479 418 4,716 6,216 57,467 157 2,170.8Female 45,201 - - 346 1,235 4,743 5,194 33,337 346 1,813.1
Real Estate, Renting and Business ActivitiesTotal 76,377 - - - 5,788 8,112 9,979 52,097 400 1,802.0Male 40,051 - - - 1,276 3,931 4,613 30,177 54 2,149.9Female 36,326 - - - 4,513 4,182 5,366 21,920 346 1,415.4
Created by PDF Generator (http://www.alientools.com/), to remove this mark, please buy the software.

Table 5.25 Cont’dAmount of Total Payment Per Month (In Birr)Major
IndustrialDivisionsand Sex Total <50 50-99
100-199
200-399
400-699
700-999 1000+
Notstated
MeanAmountof Total
Payment
PUBLIC ADMINISTRATION AND DEFENCETotal 381,697 374 689 2,033 8,682 47,895 51,972 268,710 1,341 1,594.8Male 251,433 - 640 262 4,822 22,340 33,062 189,444 864 1,750.9Female 130,263 374 50 1,771 3,860 25,555 18,910 79,266 477 1,293.4
EducationTotal 400,605 - 380 636 14,196 51,033 42,294 290,193 1,872 1,655.1Male 237,406 - 380 354 4,817 19,200 18,835 192,724 1,097 1,932.1Female 163,199 - - 283 9,379 31,833 23,459 97,469 776 1,252.1
Health andSocial Work
Total 164,914 - - 1,034 4,883 26,945 24,028 106,697 1,327 1,584.4Male 79,508 - - 618 1,763 11,196 11,686 53,753 491 1,850.0Female 85,406 - - 415 3,120 15,748 12,342 52,944 836 1,336.3
Other Community, Social and Personal Service ActivitiesTotal 188,710 2,774 3,275 10,139 34,546 55,571 27,982 52,503 1,919 863.7Male 112,927 400 696 2,291 16,368 32,722 17,155 41,742 1,553 1,015.2Female 75,783 2,374 2,579 7,849 18,178 22,849 10,828 10,761 366 640.1
Private Households with Employed PersonsTotal 267,461 4,121 16,309 57,488 141,954 34,859 5,070 4,253 3,406 267.4Male 19,940 92 1,379 3,013 8,880 4,468 1,153 394 561 318.7Female 247,520 4,029 14,929 54,475 133,075 30,391 3,917 3,859 2,845 263.4
Extra-Territorial Organizations and NGOsTotal 33,913 87 187 743 1,389 3,932 2,982 24,594 - 2,574.0Male 21,696 87 - - 1,043 1,483 1,698 17,386 - 3,033.8Female 12,217 - 187 743 346 2,449 1,284 7,208 - 1,757.4
Not StatedTotal 1,363 - - - 287 896 179 - - 566.2Male 896 - - - - 896 - - - 600.0Female 466 - - - 287 - 179 - - 501.2
Created by PDF Generator (http://www.alientools.com/), to remove this mark, please buy the software.

Table 5.26 Total Employed Population Not at Work Aged Ten Years and Above byRegion, Sex, and Reason for Absence: 2012
Reason for AbsenceRegion and Sex
TotalSickInjury
Holiday/Vacation
Training/Education
OffSeason
No worktemporarily Others
NotStated
COUNTRY TOTALTotal 284,922 76,465 43,432 8,015 40,584 51,155 63,065 2,207Male 148,500 38,120 22,913 5,030 22,736 33,809 24,955 937Female 136,422 38,345 20,519 2,986 17,847 17,346 38,110 1,270
TIGRAY REGIONTotal 24,003 4,915 4,251 1,385 2,235 5,036 5,901 281Male 13,895 2,735 2,465 750 1,957 3,513 2,194 281Female 10,108 2,180 1,786 635 277 1,524 3,707 -
AFFAR REGIONTotal 5,641 1,731 1,838 168 323 1,410 170 -Male 3,975 1,111 1,541 156 323 747 97 -Female 1,666 620 297 12 - 664 73 -
AMHARA REGIONTotal 71,532 17,658 8,780 1,600 19,840 11,080 12,416 158Male 27,801 8,338 4,279 1,166 6,202 4,655 3,081 79Female 43,731 9,320 4,501 434 13,637 6,425 9,335 79
OROMIA REGIONTotal 78,941 23,624 10,450 1,319 10,233 10,685 22,383 247Male 46,861 11,656 5,858 1,201 7,392 9,017 11,559 178Female 32,080 11,968 4,592 118 2,841 1,668 10,825 69
SOMALI REGIONTotal 7,162 2,008 243 - 1,797 1,487 1,627 -Male 5,117 1,228 140 - 1,736 1,325 688 -Female 2,045 780 102 - 61 162 939 -
BENISHANGUL - GUMUZ REGIONTotal 4,046 1,431 418 54 653 485 1,006 -Male 2,003 851 238 54 235 213 412 -Female 2,043 579 179 - 418 272 594 -
SNNP REGIONTotal 40,535 12,239 3,539 1,304 4,006 11,691 7,755 -Male 19,832 4,966 1,523 215 3,430 7,856 1,843 -Female 20,703 7,273 2,016 1,090 576 3,836 5,912 -
GAMBELLA REGIONTotal 817 392 110 - 148 41 126 -Male 315 134 - - 111 - 70 -Female 502 258 110 - 37 41 56 -
HARARI REGIONTotal 3,357 982 885 92 49 483 865 -Male 1,445 196 439 92 49 336 332 -Female 1,912 786 446 - - 147 533 -
ADDIS ABABA CITY ADMINISTRATIONTotal 44,929 10,737 11,658 2,093 1,038 7,964 9,917 1,522Male 25,169 6,731 5,753 1,396 1,038 5,530 4,322 400Female 19,760 4,006 5,905 697 - 2,434 5,595 1,122
DIRE DAWA ADMINISTRATIONTotal 3,960 747 1,260 - 263 791 899 -Male 2,088 173 676 - 263 617 358 -Female 1,872 573 584 - - 173 541 -
Created by PDF Generator (http://www.alientools.com/), to remove this mark, please buy the software.

Table 5.27 Currently Employed Population of Urban Areas Aged Ten Years and Above byAge Group, Sex, Whether Available and Ready to Work Additional Hours andPercent Available and Ready to Work Additional Hours- Country Total: 2012
Whether Available and Ready to Work Additional HoursAge Group
and Sex Total EmployedPersons
Seeking or Availableto Work Additional
Hours
Not Seeking orAvailable to
Work AdditionalHours
PercentAvailable andReady to work
Additional Hours
All AgesTotal 5,726,116 2,338,235 3,387,881 59.2Male 3,202,042 1,366,671 1,835,371 57.3Female 2,524,074 971,564 1,552,510 61.5
10-14Total 195,567 26,769 168,798 86.3Male 94,187 14,804 79,383 84.3Female 101,380 11,965 89,415 88.2
15-19Total 492,071 168,851 323,220 65.7Male 205,515 78,707 126,808 61.7Female 286,556 90,144 196,412 68.5
20-24Total 902,304 415,775 486,529 53.9Male 457,454 227,097 230,357 50.4Female 444,850 188,678 256,171 57.6
25-29Total 1,128,487 503,146 625,340 55.4Male 653,525 298,028 355,496 54.4Female 474,962 205,118 269,844 56.8
30-34Total 767,262 338,313 428,949 55.9Male 448,530 202,122 246,409 54.9Female 318,731 136,191 182,540 57.3
35-39Total 742,001 330,359 411,643 55.5Male 423,955 192,948 231,007 54.5Female 318,046 137,411 180,635 56.8
40-44Total 445,655 181,389 264,266 59.3Male 273,476 110,582 162,895 59.6Female 172,179 70,807 101,372 58.9
45-49Total 361,687 143,046 218,640 60.5Male 211,592 87,543 124,049 58.6Female 150,094 55,504 94,591 63.0
50-54Total 266,025 98,134 167,891 63.1Male 153,598 59,975 93,622 61.0Female 112,428 38,159 74,269 66.1
55-59Total 152,584 53,183 99,401 65.1Male 96,469 34,433 62,035 64.3Female 56,115 18,750 37,366 66.6
60-64Total 113,615 38,602 75,013 66.0Male 75,221 27,033 48,188 64.1Female 38,393 11,569 26,825 69.9
65+Total 158,859 40,668 118,191 74.4Male 108,519 33,399 75,120 69.2Female 50,340 7,270 43,070 85.6
Created by PDF Generator (http://www.alientools.com/), to remove this mark, please buy the software.
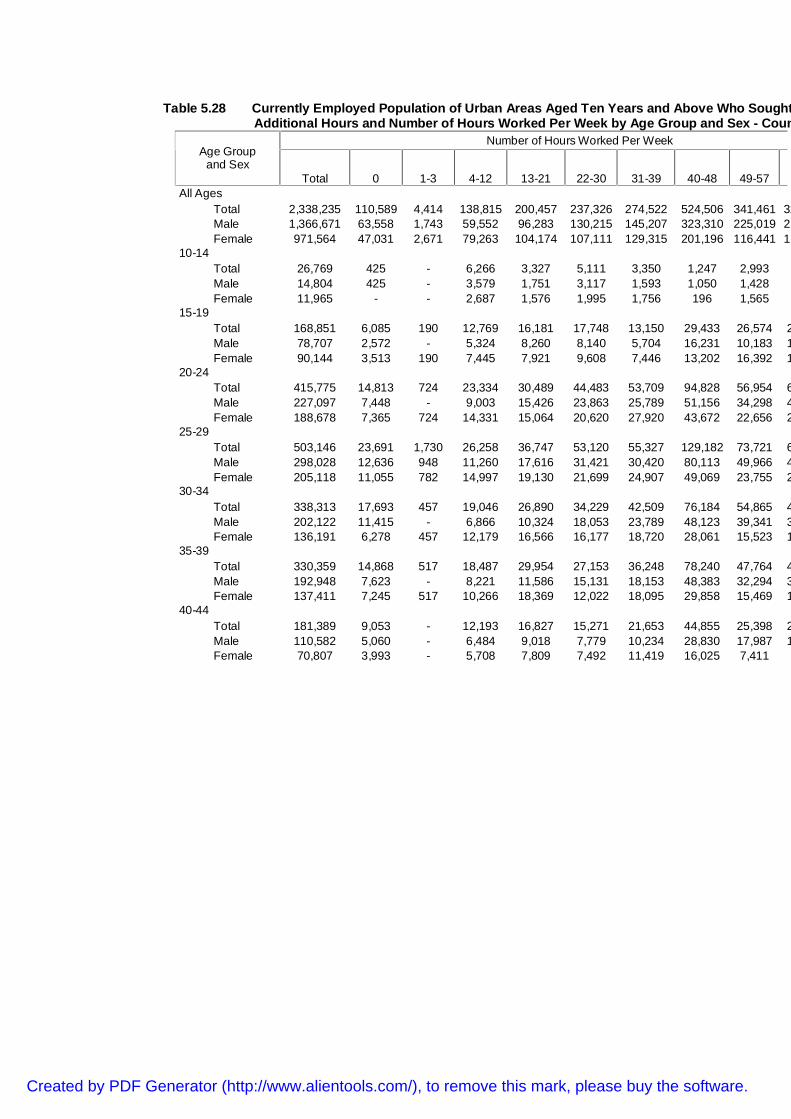
Table 5.28 Currently Employed Population of Urban Areas Aged Ten Years and Above Who Sought or Available to WorkAdditional Hours and Number of Hours Worked Per Week by Age Group and Sex - Country Total: 2012
Number of Hours Worked Per WeekAge Group
and SexTotal 0 1-3 4-12 13-21 22-30 31-39 40-48 49-57
All AgesTotal 2,338,235 110,589 4,414 138,815 200,457 237,326 274,522 524,506 341,461 326,555Male 1,366,671 63,558 1,743 59,552 96,283 130,215 145,207 323,310 225,019 211,241Female 971,564 47,031 2,671 79,263 104,174 107,111 129,315 201,196 116,441 115,314
10-14Total 26,769 425 - 6,266 3,327 5,111 3,350 1,247 2,993Male 14,804 425 - 3,579 1,751 3,117 1,593 1,050 1,428Female 11,965 - - 2,687 1,576 1,995 1,756 196 1,565
15-19Total 168,851 6,085 190 12,769 16,181 17,748 13,150 29,433 26,574 29,169Male 78,707 2,572 - 5,324 8,260 8,140 5,704 16,231 10,183 16,572Female 90,144 3,513 190 7,445 7,921 9,608 7,446 13,202 16,392 12,597
20-24Total 415,775 14,813 724 23,334 30,489 44,483 53,709 94,828 56,954 61,731Male 227,097 7,448 - 9,003 15,426 23,863 25,789 51,156 34,298 40,005Female 188,678 7,365 724 14,331 15,064 20,620 27,920 43,672 22,656 21,725
25-29Total 503,146 23,691 1,730 26,258 36,747 53,120 55,327 129,182 73,721 67,301Male 298,028 12,636 948 11,260 17,616 31,421 30,420 80,113 49,966 40,004Female 205,118 11,055 782 14,997 19,130 21,699 24,907 49,069 23,755 27,298
30-34Total 338,313 17,693 457 19,046 26,890 34,229 42,509 76,184 54,865 45,235Male 202,122 11,415 - 6,866 10,324 18,053 23,789 48,123 39,341 31,290Female 136,191 6,278 457 12,179 16,566 16,177 18,720 28,061 15,523 13,944
35-39Total 330,359 14,868 517 18,487 29,954 27,153 36,248 78,240 47,764 49,794Male 192,948 7,623 - 8,221 11,586 15,131 18,153 48,383 32,294 32,199Female 137,411 7,245 517 10,266 18,369 12,022 18,095 29,858 15,469 17,596
40-44Total 181,389 9,053 - 12,193 16,827 15,271 21,653 44,855 25,398 22,476Male 110,582 5,060 - 6,484 9,018 7,779 10,234 28,830 17,987 16,161Female 70,807 3,993 - 5,708 7,809 7,492 11,419 16,025 7,411
Created by PDF Generator (http://www.alientools.com/), to remove this mark, please buy the software.

Table 5.28 Cont’dNumber of Hours Worked Per Week
Age Groupand Sex
Total 0 1-3 4-12 13-21 22-30 31-39 40-48 49-5745-49
Total 143,046 5,924 - 7,616 13,747 14,201 20,717 26,994 24,369Male 87,543 2,951 - 3,841 6,530 6,999 13,229 16,523 18,983Female 55,504 2,973 - 3,775 7,216 7,202 7,488 10,470 5,385
50-54Total 98,134 7,255 367 4,049 11,741 11,845 12,600 20,683 10,331Male 59,975 3,850 367 459 7,701 5,929 6,862 14,196 7,032Female 38,159 3,405 - 3,590 4,040 5,916 5,737 6,487 3,300
55-59Total 53,183 2,968 - 2,849 4,830 6,633 8,263 11,191 5,731Male 34,433 2,011 - 1,835 1,654 4,147 4,626 8,520 4,263Female 18,750 957 - 1,015 3,176 2,486 3,637 2,671 1,468
60-64Total 38,602 2,469 428 3,222 4,818 2,648 3,442 5,489 6,553Male 27,033 2,322 428 1,156 2,950 1,767 2,008 4,857 4,532Female 11,569 147 - 2,066 1,868 881 1,434 632 2,021
65+Total 40,668 5,345 - 2,727 4,907 4,884 3,555 6,180 6,209Male 33,399 5,245 - 1,523 3,468 3,869 2,801 5,327 4,712Female 7,270 100 - 1,204 1,438 1,015 754 853 1,497
Created by PDF Generator (http://www.alientools.com/), to remove this mark, please buy the software.

Table 5.29 Currently Employed Population of Urban Areas Aged Ten Years and Above Whowere Willing and Available to Work Additional Hours and Type of Work Soughtby Region and Sex: 2012
Type of Work Sought or Available for
Region and Sex
TotalAt the present
main job
Other job inaddition to the
present
Other job withmore hours to
replace thepresent job Not Stated
COUNTRY TOTALTotal 2,338,235 701,121 1,111,159 524,323 1,632Male 1,366,671 443,822 643,326 278,268 1,254Female 971,564 257,299 467,832 246,055 378
TIGRAY REGIONTotal 191,629 70,990 93,392 27,248 -Male 95,777 40,515 44,910 10,351 -Female 95,853 30,475 48,481 16,897 -
AFFAR REGIONTotal 41,130 10,549 20,088 10,493 -Male 23,430 6,041 10,805 6,584 -Female 17,700 4,508 9,283 3,909 -
AMHARA REGIONTotal 427,523 165,880 160,584 101,059 -Male 244,888 99,232 92,316 53,340 -Female 182,634 66,647 68,268 47,719 -
OROMIA REGIONTotal 793,115 187,537 395,035 210,044 499Male 481,801 125,260 237,209 118,833 499Female 311,314 62,277 157,826 91,211 -
SOMALI REGIONTotal 72,980 22,446 38,844 11,690 -Male 46,922 13,877 25,834 7,210 -Female 26,058 8,569 13,010 4,480 -
BENISHANGUL GUMUZ REGIONTotal 27,104 8,428 12,905 5,771 -Male 14,782 4,748 7,340 2,694 -Female 12,322 3,680 5,565 3,077 -
SNNP REGIONTotal 319,331 94,092 166,349 58,890 -Male 188,733 65,937 94,555 28,241 -Female 130,598 28,154 71,794 30,650 -
GAMBELLA REGIONTotal 9,932 3,138 6,077 717 -Male 5,762 2,094 3,325 342 -Female 4,170 1,043 2,752 375 -
HARARI REGIONTotal 25,370 7,573 13,495 4,302 -Male 14,160 5,415 6,709 2,037 -Female 11,210 2,158 6,786 2,265 -
ADDIS ABABA CITYADMINISTRATION
Total 383,454 116,563 187,341 78,417 1,133Male 224,745 71,635 110,047 42,308 755Female 158,709 44,928 77,294 36,109 378
DIRE DAWA ADMINISTRATIONTotal 46,666 13,927 17,049 15,690 -Male 25,671 9,067 10,277 6,327 -Female 20,995 4,859 6,772 9,363 -
Created by PDF Generator (http://www.alientools.com/), to remove this mark, please buy the software.

Table 5.30 Currently Employed Population of Urban Areas Aged Ten Years and Aboveby Age Group, Sex, Employment Sector and Percentage Share of Informal-COUNTRY TOTAL: 2012
Sector of EconomyAge Groupand Sex
Total Formal Job Informal Job Not IdentifiedNot
Stated
PercentInformal
All AgesTotal 5,152,260 3,443,224 1,634,069 72,841 2,126 31.7Male 2,989,199 2,216,197 722,316 49,482 1,204 24.2Female 2,163,061 1,227,027 911,753 23,359 921 42.2
10-14Total 153,137 48,342 103,954 840 - 67.9Male 82,234 28,830 52,905 499 - 64.3Female 70,903 19,512 51,050 341 - 72.0
15-19Total 356,108 187,917 161,426 6,765 - 45.3Male 183,587 100,197 80,000 3,391 - 43.6Female 172,521 87,720 81,427 3,374 - 47.2
20-24Total 791,899 560,730 215,126 15,355 688 27.2Male 429,898 313,147 107,713 8,639 399 25.1Female 362,001 247,583 107,413 6,715 289 29.7
25-29Total 1,046,391 782,483 248,911 14,464 533 23.8Male 619,748 493,768 114,933 10,616 431 18.5Female 426,643 288,715 133,978 3,848 102 31.4
30-34Total 722,381 495,781 213,177 12,992 431 29.5Male 425,379 320,764 95,039 9,425 151 22.3Female 297,002 175,017 118,138 3,567 280 39.8
35-39Total 697,335 475,956 210,559 10,613 207 30.2Male 401,353 311,075 83,386 6,891 - 20.8Female 295,982 164,881 127,172 3,722 207 43.0
40-44Total 415,642 294,506 116,602 4,316 218 28.1Male 253,857 204,098 45,537 4,046 176 17.9Female 161,785 90,407 71,064 270 42 43.9
45-49Total 339,675 229,619 106,688 3,321 47 31.4Male 201,516 160,333 38,730 2,405 47 19.2Female 138,160 69,286 67,958 916 - 49.2
50-54Total 245,259 153,661 90,492 1,107 - 36.9Male 142,201 110,191 30,950 1,060 - 21.8Female 103,059 43,470 59,542 46 - 57.8
55-59Total 146,012 93,825 50,803 1,383 - 34.8Male 92,094 71,227 19,830 1,037 - 21.5Female 53,918 22,599 30,973 346 - 57.4
60-64Total 101,105 57,234 42,729 1,143 - 42.3Male 65,586 47,689 16,967 930 - 25.9Female 35,519 9,544 25,762 213 - 72.5
65+Total 137,315 63,171 73,602 542 - 53.6Male 91,746 54,878 36,326 542 - 39.6Female 45,569 8,293 37,276 - - 81.8
Created by PDF Generator (http://www.alientools.com/), to remove this mark, please buy the software.

Table 5.31 Currently Employed Population of Urban Areas Aged Ten Years and aboveby Region, Sex, Employment Sector of Economy and Percentage Share ofInformal Sector: 2012
Sector of EconomyRegion and Sex
Total Formal JobInformal
JobNot
Identified Not Stated
PercentInformal
COUNTRY TOTALTotal 5,152,260 3,443,224 1,634,069 72,841 2,126 31.7Male 2,989,199 2,216,197 722,316 49,482 1,204 24.2Female 2,163,061 1,227,027 911,753 23,359 921 42.2
TIGRAY REGIONTotal 361,724 249,484 107,547 4,540 153 29.7Male 191,545 144,778 44,190 2,577 - 23.1Female 170,180 104,706 63,356 1,964 153 37.2
AFFAR REGIONTotal 61,981 30,291 31,666 12 13 51.1Male 34,262 20,398 13,839 12 13 40.4Female 27,719 9,893 17,826 - - 64.3
AMHARA REGIONTotal 954,833 601,375 341,762 11,528 169 35.8Male 519,392 376,484 134,945 7,872 91 26.0Female 435,441 224,890 206,818 3,655 78 47.5
OROMIA REGIONTotal 1,503,530 959,416 529,107 14,479 528 35.2Male 899,247 648,305 242,184 8,582 176 26.9Female 604,283 311,111 286,923 5,898 352 47.5
SOMALI REGIONTotal 175,661 78,989 95,558 997 116 54.4Male 94,152 53,772 39,733 590 58 42.2Female 81,509 25,218 55,826 408 58 68.5
BENISHANGUL -GUMUZ REGIONTotal 64,363 40,204 23,874 285 - 37.1Male 36,334 27,500 8,705 129 - 24.0Female 28,029 12,705 15,169 155 - 54.1
SNNP REGIONTotal 759,119 449,476 299,835 9,528 280 39.5Male 435,676 302,415 126,350 6,912 - 29.0Female 323,443 147,061 173,485 2,616 280 53.6
GAMBELLA REGIONTotal 32,543 19,368 12,610 443 122 38.7Male 16,695 12,604 3,776 194 122 22.6Female 15,848 6,764 8,835 249 - 55.7
HARARI REGIONTotal 47,609 30,502 16,825 283 - 35.3Male 26,202 18,814 7,149 238 - 27.3Female 21,407 11,687 9,676 44 - 45.2
ADDIS ABABA CITYADMINISTRATION
Total 1,096,196 925,658 139,834 29,960 745 12.8Male 681,993 573,096 86,213 21,940 745 12.6Female 414,203 352,562 53,621 8,020 - 12.9
DIRE DAWA ADMINISTRATIONTotal 94,700 58,462 35,451 786 - 37.4Male 53,700 38,032 15,232 437 - 28.4Female 40,999 20,430 20,219 350 - 49.3
Created by PDF Generator (http://www.alientools.com/), to remove this mark, please buy the software.

Created by PDF Generator (http://www.alientools.com/), to remove this mark, please buy the software.

Table 5.32 Currently Employed Populations of Major Towns Aged Ten Years and aboveby Sex, Employment Sector and Percentage share of Informal: 2012
Sector of Economy
Major Towns and SexTotal
FormalJob
InformalJob
NotIdentified
NotStated
PercentInformal
MAJOR TOWNS TOTALTotal 1,972,859 1,538,311 391,352 41,711 1,485 19.8Male 1,192,225 958,999 201,601 30,421 1,204 16.9Female 780,634 579,312 189,751 11,289 281 24.3
MEKELE TOWNTotal 109,035 79,464 28,254 1,317 - 25.9Male 62,615 48,967 12,662 985 - 20.2Female 46,420 30,497 15,592 332 - 33.6
ASAYITA TOWNTotal 7,240 4,313 2,902 12 13 40.1Male 3,940 2,842 1,074 12 13 27.3Female 3,300 1,471 1,828 - - 55.4
GONDER TOWNTotal 90,957 63,400 26,135 1,254 169 28.7Male 50,101 38,212 10,620 1,178 91 21.2Female 40,856 25,187 15,515 75 78 38.0
DESSIE TOWNTotal 43,171 31,579 10,649 943 - 24.7Male 25,671 19,227 5,870 574 - 22.9Female 17,499 12,352 4,779 369 - 27.3
BAHIR DAR TOWNTotal 86,364 62,834 22,045 1,484 - 25.5Male 45,856 36,402 8,830 624 - 19.3Female 40,508 26,432 13,215 861 - 32.6
BISHOFTU TOWNTotal 36,491 26,795 9,446 249 - 25.9Male 21,973 17,008 4,755 210 - 21.6Female 14,518 9,787 4,691 40 - 32.3
ADAMA TOWNTotal 85,784 63,205 19,161 3,197 220 22.3Male 53,409 39,842 10,973 2,476 118 20.5Female 32,375 23,364 8,188 722 102 25.3
JIMMA TOWNTotal 52,997 38,683 14,167 47 101 26.7Male 32,103 24,462 7,536 47 58 23.5Female 20,895 14,221 6,631 - 42 31.7
SHASHEMENE TOWNTotal 38,776 25,607 12,818 351 - 33.1Male 25,016 18,858 5,895 262 - 23.6Female 13,760 6,748 6,923 88 - 50.3
JIJIGA TOWNTotal 37,557 20,958 16,209 273 116 43.2Male 22,646 15,152 7,212 223 58 31.8Female 14,911 5,806 8,996 50 58 60.3
ASOSA TOWNTotal 16,816 10,987 5,829 - - 34.7Male 9,802 7,501 2,301 - - 23.5Female 7,014 3,487 3,528 - - 50.3
Created by PDF Generator (http://www.alientools.com/), to remove this mark, please buy the software.

Table 5.32 Cont’d
Sector of EconomyMajor Towns and Sex
TotalFormal
JobInformal
JobNot
IdentifiedNot
Stated
PercentInformal
HAWASSA TOWNTotal 112,676 85,194 26,039 1,443 - 23.1Male 68,258 53,645 13,508 1,105 - 19.8Female 44,419 31,549 12,531 339 - 28.2
GAMBELLA TOWNTotal 16,491 10,670 5,588 111 122 33.9Male 8,941 6,938 1,770 111 122 19.8Female 7,550 3,732 3,818 - - 50.6
HARAR TOWNTotal 47,609 30,502 16,825 283 - 35.3Male 26,202 18,814 7,149 238 - 27.3Female 21,407 11,687 9,676 44 - 45.2
ADDIS ABABA CITYTotal 1,096,196 925,658 139,834 29,960 745 12.8Male 681,993 573,096 86,213 21,940 745 12.6Female 414,203 352,562 53,621 8,020 - 12.9
DIRE DAWA TOWNTotal 94,700 58,462 35,451 786 - 37.4Male 53,700 38,032 15,232 437 - 28.4Female 40,999 20,430 20,219 350 - 49.3
Created by PDF Generator (http://www.alientools.com/), to remove this mark, please buy the software.

Table 5.33 Distribution of Urban Population Aged Ten years and above Working in the Informal Sector by Major OccupGroup and Regions: 2012
Major Occupational Group
Region and SexTotal
EmployedPersons
LegislatorSenior
Officials &Managers Professional
Technicaland
AssociateProfessionals Clerks
Service,Shop &Marketsales
Workers
Skilledagricultural
andFishery
Craftsand
relatedtrades
COUNTRY TOTALTotal 1,634,069 1,455 2,533 13,310 9,114 611,980 100,118 515,483Male 722,316 1,316 2,325 11,226 5,029 179,428 62,199 216,059Female 911,753 140 207 2,084 4,085 432,553 37,919 299,424
TIGRAY REGIONTotal 107,547 99 498 218 109 30,298 7,602 46,243Male 44,190 99 498 218 - 4,499 4,842 17,174Female 63,356 - - - 109 25,799 2,760 29,068
AFFAR REGIONTotal 31,666 12 - 156 180 15,721 6,266 5,041Male 13,839 - - 156 180 3,252 5,622 2,143Female 17,826 12 - - - 12,468 644 2,898
AMHARA REGIONTotal 341,762 45 617 2,441 3,961 104,599 16,422 128,646Male 134,945 45 522 2,441 1,188 24,695 12,531 49,943Female 206,818 - 95 - 2,772 79,905 3,891 78,703
OROMIA REGIONTotal 529,107 126 502 2,010 2,002 196,377 30,229 169,050Male 242,184 126 466 1,268 2,002 53,101 15,128 75,313Female 286,923 - 36 743 - 143,276 15,100 93,737
SOMALI REGIONTotal 95,558 - - 1,959 - 67,441 8,341 5,604Male 39,733 - - 1,520 - 20,050 6,660 2,847Female 55,826 - - 439 - 47,391 1,681 2,758
BENISHANGUL GUMUZ REGIONTotal 23,874 - - 360 989 5,759 1,143 8,443Male 8,705 - - 240 153 1,732 887 2,017Female 15,169 - - 119 836 4,028 256 6,426
SNNP REGIONTotal 299,835 338 245 2,974 949 112,405 26,383 87,973Male 126,350 210 168 2,586 631 36,628 14,472 30,309Female 173,485 128 77 388 319 75,777 11,911 57,665
Created by PDF Generator (http://www.alientools.com/), to remove this mark, please buy the software.

Table 5.33 Cont’dMajor Occupational Group
Region and SexTotal
EmployedPersons
LegislatorSenior
Officials &Managers Professional
Technicaland
AssociateProfessionals Clerks
Service,Shop &Marketsales
Workers
Skilledagricultural
andFishery
Craftsand
relatedtrades
GAMBELLA REGIONTotal 12,610 - - - 33 4,502 1,037 5,886Male 3,776 - - - 33 1,399 754 925Female 8,835 - - - - 3,103 284 4,960
HARARI REGIONTotal 16,825 - - 49 195 9,414 - 4,065Male 7,149 - - - 147 1,939 - 2,896Female 9,676 - - 49 49 7,474 - 1,169
ADDIS ABABA CITYADMINISTRATION
Total 139,834 746 670 2,710 346 48,993 1,039 47,251Male 86,213 746 670 2,364 346 27,053 692 28,893Female 53,621 - - 346 - 21,941 346 18,358
DIRE DAWAADMINISTRATION
Total 35,451 90 - 434 350 16,471 1,656 7,280Male 15,232 90 - 434 350 5,079 610 3,599Female 20,219 - - - - 11,391 1,047 3,681
Created by PDF Generator (http://www.alientools.com/), to remove this mark, please buy the software.

Table 5.34: Distribution of Urban Population Aged Ten Years and AboveWorking in the Informal Sector by Region, Sex andMajor Branches of Industry: 2012
Major Sector of Economy
Region and Sex
Total
Manufacturing,Construction,
Mining &Quarrying
Whole Saleand Retail
Trade
OtherServiceSectors
Agriculture,Hunting,
Forestry &Fishing
COUNTRY TOTALTotal 1,634,069 429,067 544,201 531,414 129,387Male 722,316 220,541 202,458 221,462 77,855Female 911,753 208,526 341,742 309,952 51,532
TIGRAY REGIONTotal 107,547 34,867 19,327 43,121 10,232Male 44,190 18,244 5,540 13,074 7,334Female 63,356 16,623 13,787 30,047 2,898
AFFAR REGIONTotal 31,666 4,620 9,413 9,358 8,275Male 13,839 2,248 2,913 2,171 6,507Female 17,826 2,372 6,500 7,187 1,768
AMHARA REGIONTotal 341,762 110,422 89,833 112,560 28,947Male 134,945 53,287 25,971 38,123 17,563Female 206,818 57,135 63,862 74,437 11,383
OROMIA REGIONTotal 529,107 141,029 190,858 164,304 32,916Male 242,184 77,157 70,617 77,282 17,128Female 286,923 63,872 120,240 87,022 15,788
SOMALI REGIONTotal 95,558 4,666 54,107 27,428 9,357Male 39,733 2,509 15,882 14,002 7,340Female 55,826 2,157 38,225 13,426 2,017
BENISHANGUL GUMUZ REGIONTotal 23,874 6,989 3,947 9,497 3,441Male 8,705 2,454 1,548 2,664 2,038Female 15,169 4,535 2,398 6,833 1,403
SNNP REGIONTotal 299,835 71,119 87,393 109,948 31,375Male 126,350 29,077 37,218 42,255 17,801Female 173,485 42,042 50,175 67,693 13,574
GAMBELLA REGIONTotal 12,610 1,923 2,660 6,052 1,976Male 3,776 971 1,229 823 754Female 8,835 952 1,432 5,229 1,222
HARARI REGIONTotal 16,825 4,055 10,127 2,643 -Male 7,149 2,645 2,344 2,161 -Female 9,676 1,410 7,784 482 -
ADDIS ABABA CITY ADMINISTRATIONTotal 139,834 43,301 58,665 36,830 1,039Male 86,213 28,304 33,347 23,870 692Female 53,621 14,997 25,318 12,960 346
DIRE DAWA ADMINISTRATIONTotal 35,451 6,076 17,871 9,674 1,830Male 15,232 3,646 5,850 5,040 697Female 20,219 2,431 12,021 4,634 1,133
Created by PDF Generator (http://www.alientools.com/), to remove this mark, please buy the software.

Created by PDF Generator (http://www.alientools.com/), to remove this mark, please buy the software.

Table 5.35 Distribution of Urban Population Aged ten years and Above Working in the Informal Sector by Literacy Status andEducational Level, Sex and Regions: 2012
Highest Grade Completed for Literate
Region and Sex
Total Pre-schoolNon
FormalGrades
1-8
Secondarynot
completedSecondaryCompleted Preparatory
CertificateCompleted
DiplomaCompleted
Degreeand aboveCompleted
COUNTRY TOTALTotal 1,634,069 13,754 33,145 744,128 89,605 135,897 17,731 13,678 21,899Male 722,316 6,377 15,352 392,456 50,073 77,853 9,959 6,867 14,432Female 911,753 7,377 17,793 351,672 39,532 58,044 7,771 6,811 7,467
TIGRAY REGIONTotal 107,547 255 2,496 46,173 4,465 11,519 1,115 534 534Male 44,190 - 1,351 24,780 1,728 5,771 213 425 316Female 63,356 255 1,145 21,392 2,737 5,748 901 109 218
AFFAR REGIONTotal 31,666 - 1,065 14,113 1,669 464 156 25 191Male 13,839 - 682 7,064 1,345 369 156 - 24Female 17,826 - 384 7,048 324 96 - 25 168
AMHARA REGIONTotal 341,762 4,289 10,880 136,340 11,412 26,585 2,206 2,761 3,686Male 134,945 2,005 5,571 69,074 6,023 13,152 1,593 1,121 3,084Female 206,818 2,284 5,310 67,266 5,389 13,433 614 1,640 602
OROMIA REGIONTotal 529,107 6,222 9,061 264,614 31,873 42,951 4,095 4,759 10,923Male 242,184 2,366 4,430 144,928 16,583 22,136 1,793 2,897 5,664Female 286,923 3,857 4,632 119,686 15,290 20,815 2,302 1,862 5,259
SOMALI REGIONTotal 95,558 314 1,331 29,703 2,686 4,371 152 - -Male 39,733 314 492 15,135 2,026 3,540 101 - -Female 55,826 - 840 14,568 661 831 50 - -
BENISHANGULGUMUZ REGION
Total 23,874 150 772 9,895 1,639 1,617 498 37 305Male 8,705 113 119 4,405 725 766 253 - 163Female 15,169 37 653 5,490 914 852 245 37 143
SNNP REGIONTotal 299,835 1,215 2,628 159,202 16,641 27,269 3,120 3,396 2,450Male 126,350 444 754 76,407 9,803 15,492 1,239 1,237 1,952Female 173,485 771 1,874 82,796 6,838 11,778 1,881 2,159 498
Created by PDF Generator (http://www.alientools.com/), to remove this mark, please buy the software.

Table 5.35 Cont’dHighest Grade Completed for Literate
Region and Sex
Total Pre-schoolNon
FormalGrades
1-8
Secondarynot
completedSecondaryCompleted Preparatory
CertificateCompleted
DiplomaCompleted
Degreeand aboveCompleted
GAMBELLA REGIONTotal 12,610 - - 5,459 926 614 221 - -Male 3,776 - - 2,032 361 218 - - -Female 8,835 - - 3,427 565 395 221 - -
HARARI REGIONTotal 16,825 - 590 9,186 1,132 1,215 142 49 245Male 7,149 - 49 4,269 595 728 49 49 98Female 9,676 - 541 4,917 538 487 93 - 147
ADDIS ABABA CITYADMINISTRATION
Total 139,834 1,038 3,107 53,142 14,797 16,956 5,503 2,031 3,128Male 86,213 1,038 1,038 35,614 9,884 13,828 4,130 1,052 2,782Female 53,621 - 2,069 17,528 4,913 3,129 1,373 979 346
DIRE DAWAADMINISTRATION
Total 35,451 270 1,214 16,300 2,363 2,335 523 87 437Male 15,232 97 867 8,748 1,000 1,855 434 87 350Female 20,219 173 347 7,552 1,363 480 90 - 87
Created by PDF Generator (http://www.alientools.com/), to remove this mark, please buy the software.

Table 5.36 Distribution of Urban Population Aged Ten Years and Above Working in theInformal Sector by Regions, Sex and Size of Workers: 2012
Size of WorkersRegionand Sex
Total <10 11-19 20-29 30-39 40-49 50-59 60-69 70-79 80-89 90+Not
StatedCOUNTRY TOTAL
Total 1,634,069 1,597,368 16,779 4,053 2,913 763 552 56 - - 3,247 8,339Male 722,316 697,450 14,164 2,636 1,435 453 484 - - - 1,738 3,956Female 911,753 899,918 2,615 1,417 1,478 310 67 56 - - 1,510 4,383
TIGRAY REGIONTotal 107,547 104,951 1,506 226 109 - - - - - 109 646Male 44,190 42,144 1,279 226 109 - - - - - 109 323Female 63,356 62,807 226 - - - - - - - - 323
AFFAR REGIONTotal 31,666 31,378 - - - 144 - - - - - 144Male 13,839 13,695 - - - 144 - - - - - -Female 17,826 17,683 - - - - - - - - - 144
AMHARA REGIONTotal 341,762 334,959 3,737 1,570 438 - - - - - 573 486Male 134,945 130,493 2,553 735 373 - - - - - 573 217Female 206,818 204,466 1,184 835 65 - - - - - - 269Total 529,107 520,270 6,091 700 750 - 552 - - - 456 288Male 242,184 234,900 5,561 583 220 - 484 - - - 357 80Female 286,923 285,370 531 117 531 - 67 - - - 99 207
SOMALI REGIONTotal 95,558 95,346 213 - - - - - - - - -Male 39,733 39,571 162 - - - - - - - - -Female 55,826 55,775 50 - - - - - - - - -
BENISHANGUL GUMUZ REGIONTotal 23,874 23,846 28 - - - - - - - - -Male 8,705 8,677 28 - - - - - - - - -Female 15,169 15,169 - - - - - - - - - -
SNNP REGIONTotal 299,835 294,558 1,534 633 961 - - - - - 327 1,822Male 126,350 123,523 1,307 245 388 - - - - - 327 561Female 173,485 171,035 226 388 573 - - - - - - 1,261Total 12,610 12,132 295 127 - - - 56 - - - -Male 3,776 3,469 207 99 - - - - - - - -Female 8,835 8,663 88 28 - - - 56 - - - -
HARARI REGIONTotal 16,825 16,583 101 141 - - - - - - - -Male 7,149 6,956 101 92 - - - - - - - -Female 9,676 9,627 - 49 - - - - - - - -
ADDIS ABABA CITY ADMINISTRATIONTotal 139,834 128,153 3,101 656 656 619 - - - - 1,783 4,866Male 86,213 79,050 2,792 656 346 310 - - - - 372 2,688Female 53,621 49,103 310 - 310 310 - - - - 1,410 2,179
DIRE DAWA ADMINISTRATIONTotal 35,451 35,191 173 - - - - - - - - 87Male 15,232 14,972 173 - - - - - - - - 87Female 20,219 20,219 - - - - - - - - - -
Created by PDF Generator (http://www.alientools.com/), to remove this mark, please buy the software.

Table 5.37 Distribution of Urban Population aged ten years and Above Working in the Informal Sector by Regions, Sex and TypeWorking Places: 2012
Type of Working Place
Region and SexTotal
BusinessHouse Office
AtHome
OnStreet
Gulit orOpen
Market
FarmArea/Field Factory
Quarrying/mining
AnyWhere as
FoundConstruction
AreaCOUNTRY TOTAL
Total 1,634,069 151,500 11,810 499,431 136,996 302,073 85,059 4,645 3,502 263,256 51,091Male 722,316 70,258 6,526 114,125 75,085 86,727 55,817 3,380 3,274 202,648 42,692Female 911,753 81,242 5,284 385,306 61,912 215,346 29,242 1,265 228 60,608 8,398
TIGRAY REGIONTotal 107,547 11,428 850 49,752 5,047 9,443 4,406 - 1,462 16,400 2,635Male 44,190 2,543 386 10,227 2,605 2,678 4,065 - 1,462 14,382 2,527Female 63,356 8,886 464 39,525 2,443 6,766 341 - - 2,018
AFFAR REGIONTotal 31,666 2,683 72 11,426 3,779 1,530 3,167 12 464 4,017Male 13,839 983 - 1,930 1,232 427 2,461 12 464 2,077Female 17,826 1,700 72 9,497 2,547 1,102 706 - - 1,940
AMHARA REGIONTotal 341,762 27,220 2,467 121,852 18,748 56,718 17,716 368 207 57,194 11,755Male 134,945 11,507 2,009 26,039 11,197 14,058 13,417 368 207 38,579 8,298Female 206,818 15,713 458 95,813 7,551 42,659 4,298 - - 18,615 3,457
OROMIA REGIONTotal 529,107 49,023 2,578 154,473 47,779 117,410 17,659 2,045 314 86,874 17,875Male 242,184 24,141 976 36,913 28,420 29,872 10,193 1,531 314 72,792 15,938Female 286,923 24,882 1,602 117,559 19,359 87,538 7,466 515 - 14,081 1,937
SOMALI REGIONTotal 95,558 19,447 1,375 6,669 7,650 20,137 16,869 - 314 12,603Male 39,733 6,952 1,010 1,913 2,039 5,426 7,803 - 314 10,203Female 55,826 12,495 365 4,756 5,610 14,711 9,066 - - 2,400
BENISHANGUL GUMUZ REGIONTotal 23,874 1,595 139 8,444 980 2,264 3,689 - - 2,184Male 8,705 540 23 802 375 723 2,221 - - 1,868Female 15,169 1,055 115 7,642 606 1,541 1,469 - - 316
SNNP REGIONTotal 299,835 16,917 1,462 95,180 19,009 62,661 18,370 1,583 594 48,856 7,003Male 126,350 9,247 378 18,292 10,100 20,212 13,687 967 415 34,581 6,071Female 173,485 7,670 1,084 76,888 8,909 42,449 4,683 617 179 14,275
Created by PDF Generator (http://www.alientools.com/), to remove this mark, please buy the software.

Table 5.37 Cont’d
Type of Working Place
Region and SexTotal
BusinessHouse Office
AtHome
OnStreet
Gulit orOpen
Market
FarmArea/Field Factory
Quarrying/mining
AnyWhere as
FoundConstruction
AreaGAMBELLA REGIONTotal 12,610 1,161 276 4,514 486 3,154 410 - - 1,187
Male 3,776 482 71 372 127 764 410 - - 856Female 8,835 679 204 4,142 358 2,390 - - - 331
HARARI REGIONTotal 16,825 847 191 5,154 2,728 3,574 - 150 148 2,164 1,189Male 7,149 394 49 1,042 949 905 - 106 98 2,074 1,090Female 9,676 452 142 4,112 1,780 2,669 - 44 49 89
ADDIS ABABA CITY ADMINISTRATIONTotal 139,834 18,594 2,137 34,549 23,320 19,476 1,039 310 - 26,369 6,243Male 86,213 12,226 1,450 15,012 15,874 8,471 692 310 - 21,929 5,205Female 53,621 6,369 687 19,537 7,446 11,005 346 - - 4,440 1,038
DIRE DAWA ADMINISTRATIONTotal 35,451 2,585 263 7,418 7,469 5,706 1,734 176 - 5,409 2,049Male 15,232 1,243 173 1,584 2,167 3,190 867 87 - 3,306 1,831Female 20,219 1,342 90 5,834 5,303 2,516 867 90 - 2,102
Created by PDF Generator (http://www.alientools.com/), to remove this mark, please buy the software.

Table 5.38 Distribution of Urban Population Aged Ten Years and Above Working in the Informal Sector by Region, Order andTypes of Difficulties faced: 2012
RegionTypes of Difficulties
Total Tigray Afar Amhara Oromia SomalieBenishangul
-Gumuz SNNPR GambellaFirst DifficultiesTotal 1,634,069 107,547 31,666 341,762 529,107 95,558 23,874 299,835 12,610I do not have Difficulties 555,163 38,734 15,465 95,212 159,946 52,235 11,635 131,905 7,644Lack of Premises 142,796 5,793 1,685 33,788 42,048 4,641 1,510 16,769 705Lack of Working Capital 305,377 24,068 5,014 74,349 109,772 8,847 4,003 54,943 1,455Limited Market 252,664 17,249 5,138 57,109 87,937 10,420 2,307 35,574 1,452No Training/Inadequate Skill/ 11,789 1,060 85 2,365 2,026 746 28 2,252 170Difficulty in Obtaining License 11,356 396 96 1,325 5,917 421 381 1,471 -Lack of credit 19,351 1,673 108 1,069 6,881 4,138 37 2,417 28Access to raw material 74,913 4,581 1,161 15,257 24,517 2,838 523 12,979 379Lack of Working Material 10,657 1,388 188 3,089 2,587 - 222 1,981 28Lack of Enough Information 1,542 675 - - 469 52 - - -Pressure from Government Regulation 18,264 514 50 3,402 5,076 574 138 4,822 41Inadequate salary 41,377 3,262 376 11,028 13,705 450 318 3,956 175Inconvenient work place 79,730 2,394 1,640 20,115 26,467 4,593 489 14,810 252Others 107,248 5,761 516 23,117 41,677 5,605 2,282 15,676 281Not Stated 1,842 - 144 538 80 - - 280 -Second DifficultiesTotal 1,634,069 107,547 31,666 341,762 529,107 95,558 23,874 299,835 12,610I do not have Difficulties 933,302 66,675 22,644 177,007 287,956 78,443 16,075 194,382 9,117Lack of Premises 81,102 4,569 1,466 22,691 25,836 962 602 10,110 641Lack of Working Capital 139,834 8,481 1,545 33,973 43,949 4,036 1,916 24,409 1,087Limited Market 155,604 4,815 2,901 41,091 53,674 3,933 1,825 21,559 486No Training/Inadequate Skill/ 15,966 1,643 48 4,439 4,740 999 63 1,244 83Difficulty in Obtaining License 17,744 457 48 2,888 7,728 632 129 2,267 83Lack of credit 32,748 2,350 396 2,684 14,855 2,085 139 6,692 104Access to raw material 73,994 5,485 158 18,385 23,497 1,454 910 10,733 214Lack of Working Material 11,303 213 60 4,824 2,447 - 308 2,024 165Lack of Enough Information 6,662 1,816 - 1,867 1,153 - - 1,257 -Pressure from Government Regulation 12,784 638 60 1,931 2,428 358 267 3,485 -Pressure from Government Regulation 12,784 638 60 1,931 2,428 358 267 3,485 -Inadequate salary 21,007 2,005 176 5,529 10,340 151 - 1,813 31Inconvenient work place 80,746 5,713 1,720 13,550 27,673 2,343 972 13,038 490Others 49,326 2,687 299 10,258 22,751 162 671 6,541 109Not Stated 1,948 - 144 645 80 - - 280 -
Created by PDF Generator (http://www.alientools.com/), to remove this mark, please buy the software.

Table 5.38 Cont’d
RegionTypes of Difficulties
Total Tigray Afar Amhara Oromia SomalieBenishangul
-GumuzSNNPR Gambel
Third Difficulties
Total 1,634,069 107,547 31,666 341,762 529,107 95,558 23,874299,8
35
I do not have Difficulties 1,317,018 89,816 26,896 264,446 438,112 89,038 19,690255,2
48Lack of Premises 28,289 2,051 567 6,451 9,136 207 175 3,909Lack of Working Capital 30,208 1,632 911 7,716 9,060 310 465 2,864Limited Market 52,604 3,050 858 15,845 14,139 1,656 1,144 5,794No Training/Inadequate Skill/ 15,634 1,852 236 4,452 2,309 679 52 1,817Difficulty in Obtaining License 9,322 - 496 1,117 1,971 365 28 1,504Lack of credit 23,066 1,210 242 2,834 7,045 917 157 3,307Access to raw material 39,838 1,801 110 14,640 11,844 417 841 5,058Lack of Working Material 10,035 255 - 3,797 3,981 - 22 703Lack of Enough Information 2,988 842 12 96 245 52 - -Pressure from Government Regulation 13,548 - 188 4,026 1,953 70 363 2,731Pressure from Government Regulation 13,548 - 188 4,026 1,953 70 363 2,731Inadequate salary 5,057 508 353 1,477 1,061 52 - 297
Inconvenient work place 57,404 3,292 510 8,312 18,486 1,380 60212,30
3Others 27,110 1,238 144 5,909 9,683 415 334 4,020Not Stated 1,948 - 144 645 80 - - 280
Created by PDF Generator (http://www.alientools.com/), to remove this mark, please buy the software.

Table 5.39: Currently Employed population of Urban `areas Aged ten years and above byRegions, Sex, Mean Number of Hours Worked Per Week in Major Branches ofIndustry: 2012
Mean Number of Hours worked by Major Branches of Industry
Region and SexTotal
Manufacturing,Construction,
Mining &Quarrying
Whole Saleand Retail
Trade
OtherServiceSectors
Agriculture,Hunting,
Forestry &Fishing
NotStated
COUNTRY TOTALTotal 43.8 42.9 44.6 46.1 30.6 24.0Male 46.3 46.0 48.7 48.4 32.9 25.0Female 40.6 37.1 40.4 43.5 25.9 22.1
TIGRAY REGIONTotal 46.9 44.8 51.3 47.7 35.2 -Male 48.9 46.6 56.8 49.8 37.1 -Female 44.6 41.9 46.7 45.8 31.2 -
AFFAR REGIONTotal 42.4 41.1 48.9 43.2 38.3 -Male 43.7 40.5 51.5 46.1 40.6 -Female 40.8 42.2 47.2 40.5 32.1 -
AMHARA REGIONTotal 39.2 38.5 38.9 43.9 24.3 -Male 41.8 42.1 43.6 46.1 28.7 -Female 36.2 33.1 35.3 41.7 15.1 -
OROMIA REGIONTotal 42.3 42.1 42.3 44.5 31.5 37.3Male 45.0 44.9 46.5 47.2 31.8 47.7Female 38.6 36.3 38.1 40.9 30.7 7.1
SOMALI REGIONTotal 40.7 43.0 43.0 38.5 40.6 -Male 43.1 41.6 47.6 41.7 42.1 -Female 37.8 47.5 40.4 33.7 37.1 -
BENISHANGUL GUMUZREGION
Total 35.7 37.5 32.8 37.4 30.7 -Male 38.6 39.6 33.8 41.6 34.1 -Female 32.1 34.7 31.5 33.0 24.8 -
SNNP REGIONTotal 42.2 41.3 44.2 43.7 29.9 38.5Male 46.2 47.6 50.0 46.9 32.6 21.0Female 37.1 31.9 36.9 40.0 25.2 56.0
GAMBELLA REGIONTotal 43.1 44.2 49.7 41.9 40.7 -Male 45.5 49.4 53.7 44.1 40.1 -Female 40.4 36.1 44.5 39.7 41.6 -
HARARI REGIONTotal 41.7 39.8 43.8 41.0 42.2 -Male 43.5 42.3 48.4 41.9 42.2 -Female 39.5 33.3 40.9 39.9 - -
ADDIS ABABA CITY ADMINISTRATIONTotal 50.8 48.1 51.2 51.9 41.0 10.9Male 52.2 50.2 52.5 53.5 37.5 -Female 49.0 43.1 49.2 50.3 52.8 39.0
DIRE DAWA ADMINISTRATIONTotal 46.2 46.2 46.5 46.7 33.0 -Male 47.7 46.7 46.2 49.6 32.5 -Female 44.4 45.5 46.8 42.8 33.4 -
Created by PDF Generator (http://www.alientools.com/), to remove this mark, please buy the software.

Created by PDF Generator (http://www.alientools.com/), to remove this mark, please buy the software.

CHAPTER VI
UNEMPLOYEMENT IN URBAN AREAS
6.1. Introduction
Unemployment is one of the indicators that have been used to measure the extent of
unutilized human resource in the economy at a given area or region in a certain period
of time. It indicates the quantity and quality of the human labour a nation or a region
would have, and should be used to promote its economic development, but not
actually used. The unutilized human resource as a result of unemployment has its own
social and economic implication. Therefore, the availability of reliable and timely
statistical data on unemployment is vital to formulate and design new strategies as
well as to monitor the existing employment policies.
A wide range of information regarding unemployment and the characteristics of
unemployed population were collected in the 2012 Urban Employment and
Unemployment Survey. This information is useful to estimate the number of
unemployed population and rate of unemployment at various reporting levels.
This chapter presents the size of unemployed population and rate of unemployment at
national, regional and major urban levels. In addition, the characteristics of
unemployed population such as age, sex, education, training status, marital status,
previous work experience, duration of unemployment, type of jobs looking for,
problems in establishing own business or enterprise, actions taken to seek work …
etc., are presented in detail. These information were collected from persons aged ten
years and above by using the two known measurement approaches, namely current
and usual approaches. But, the results presented in this chapter refer only the current
activity status approach.
Created by PDF Generator (http://www.alientools.com/), to remove this mark, please buy the software.

During the data collection period, respondents in the sampled household were asked
detailed labour force questions using structured questionnaires. These includes:-
a. whether they were seeking for employment, if not reason for not
seeking.
b. whether available for work during the coming one month, if not reason for
not being available.
c. type of job looking for /i.e. self employment or paid employment or other/
d. type of problems faced to establish own business.
e. previous work experience and duration of unemployment.
Based on the responses obtained from the respondents aged ten years and above,
the measurement of unemployment was done using various methods.
6.2 Measurement of Unemployment
The measurement of unemployment is based on the following three criteria that mustbe satisfied simultaneously: “without work”, “currently available for work” ‘and“seeking work’’ (ILO, 1983). The standard definition of unemployment is based on the"seeking work" criterion that can be interpreted as activities or efforts that non-workingpersons performed to look for jobs during a specified reference period or prior to it(i.e., paid or self employment). The specific steps include registration at a public orprivate exchange; applying to employers; checking at worksites, farms, factory gates,market or other assembly places; placing or answering news paper advertisements;seeking assistance of friends or relatives; visit vacancy boards; looking for land,building, machinery or equipment to establish own enterprise, and arranging financialresources; applying for work permits and licenses…etc.
However, the standard definition of unemployment with its emphasis on seeking workcriterion might be restrictive and might not fully capture the prevailing employmentsituations in many developing countries including Ethiopia, where the labour market islargely unorganized or of limited scope, where labour absorption is inadequate orwhere the labour force is largely self-employed.
Created by PDF Generator (http://www.alientools.com/), to remove this mark, please buy the software.

Hence, the International standards introduced provisions, which allows for therelaxation of the seeking work criterion in certain situations. The provisions are twotypes, namely, partial relaxation and complete relaxation. Following therecommendations of the International standard and considering the prevailing nationalsituations, the employment and unemployment and related labour force surveys usedthe above provisions to measure the different forms of unemployment. The definitionof the two provisions is described as follows.
Under partial relaxation, the definition of unemployment includes discouraged jobseekers, future start and layoffs in addition to persons satisfying the standarddefinition. Discouraged job seekers are persons who want a job but did not take anyactive step to search for work because they believe that they cannot find one. Futurestarts are those persons without work who have made arrangements to take up paidemployment or to undertake self-employment activity at a date subsequent to thereference period. Layoff is a person whose contract of employment or activity hasbeen suspended by the employer for a specified or unspecified period at the end ofwhich the person concerned has a recognized right or recognized expectation tocover employment with the employer (ILO, 1990).
The completely relaxed definition of unemployment includes persons without work andthose who are available for work, including those who were or were not seeking work.That is, the seeking work criterion is completely relaxed and unemployment is basedon the “without work” and “availability” criterion only. The availability in this situation istested by asking the willingness to take up work for wage or salary in locally prevailingterms, or readiness to undertake self-employment activity; given the necessaryresources and facilities. It should be noted that fulltime students are considered asavailable if and only if they are ready to withdraw from their studies in order to accepta job.
This survey collected unemployment data in the standard, partially relaxed andcompletely relaxed options of measurements. After thorough evaluation andassessment of the results obtained using the three alternative and complementary
Created by PDF Generator (http://www.alientools.com/), to remove this mark, please buy the software.

measures; the rates obtained using the completely relaxed definition was found mostplausible and hence selected for reporting. In this survey, those persons aged tenyears and above who had no work or did not work at least four hours or did not havejob to return to, were asked to respond whether they were available or willing to workif job was found during the coming one month. Those who responded “Yes” answer tothis question were further tested whether they were ready to take a job underprevailing conditions. By doing so, those persons who had no job but available to workare considered as unemployed at the time of the survey.
6.3. Size and Rate of Urban Unemployment
The proportion of unemployed population aged ten years and above is described using
unemployment rate. Unemployment rate is computed as percentage of the
unemployed population over the total number of economically active population. The
rate indicates that the number of persons who are ready to participate or engaged in
the production of goods and services. A higher rate of unemployment implies the loss
of individual contributions to the growth of Growth Domestic Product (GDP) as well as
the national economy, and hence a waste of human resource.
The distribution of currently unemployed population aged ten years and above and
unemployment rate of urban areas of the country by region, age group and sex is
presented in Table 6.1. The survey result reveals that the unemployment rate at
national urban level was 17.5 percent. The corresponding rates for males and females
were 11.4 percent and 24.2 percent, respectively (Table 6.1). Unemployment rate in
the regions illustrates that the highest rate was recorded in Addis Ababa 23.0 percent
and Dire Dawa Administration 22.7 percent, while the lowest rate as compared to the
highest ones was found in Benishangul-Gumuz (7.1 percent) and Gambella (7.8
percent) regions. But in the other regions of the country, the rate was found in the
range 11 - 19 percent (Table 6.1).
Created by PDF Generator (http://www.alientools.com/), to remove this mark, please buy the software.

Table 6.2 shows the distribution of currently unemployed population of total major
towns and sixteen selected major towns classified by age group and sex. Among the
major towns, the highest unemployment rate above 20.0 percent was recorded in
Addis Ababa, Dire Dawa, Dessie, Bishoftu, Adama and Shashemene towns. The
lowest unemployment rate as compared to the highest ones was found in Gambella
town (7.9 percent).
With regard to literacy status and educational attainment of the currently unemployed
population of each region is shown in Table 6.3 and 6.4, while the training status and
types of training of the unemployed illustrated in Table 6.5. The distribution of
unemployed persons disaggregated by marital status, age group and sex is presented
in Table 6.6. Table 6.7 shows similar information for each region classified by sex.
Those persons aged ten years and above who were looking for work during the three
months prior to date of interview were asked to report what steps they have taken to
seek work and type of work they look for during this period. Accordingly, Table 6.8
presents the distribution of unemployed persons who were and not looking for work
during the three months prior to the survey date by sex and step taken to seek work
for urban areas of each region. Table 6.9 also provides data on type of job they were
looking for by sex and region.
The size of unemployed persons of urban areas of the country categorized by age
group sex, previous work experience and duration of unemployment is presented in
Table 6.10. The corresponding figure by sex and region is presented in Table 6.11.
The distribution of unemployed persons according to the type of problems they faced
to start own business by region and sex is shown in Table 6.12.
Created by PDF Generator (http://www.alientools.com/), to remove this mark, please buy the software.

Table 6.1 Currently Unemployed Population of Urban Areas Aged Ten Years and Aboveby Region, Age Group, Sex, and Unemployment Rate: 2012
Economically Active Unemployed Unemployment RateAge GroupTotal Male Female Total Male Female Total Male Female
COUNTRY TOTAL
All Ages 6,953,202 3,614,936 3,338,266 1,218,574 410,381 808,193 17.5 11.4 24.210-14 223,235 107,623 115,613 24,618 11,787 12,831 11.0 11.0 11.115-19 630,232 257,775 372,457 136,069 51,396 84,673 21.6 19.9 22.720-24 1,265,279 584,861 680,418 361,492 127,407 234,085 28.6 21.8 34.425-29 1,397,738 733,144 664,594 268,787 79,619 189,168 19.2 10.9 28.530-34 896,084 488,015 408,069 128,378 39,484 88,893 14.3 8.1 21.835-39 841,095 450,158 390,937 98,500 26,203 72,297 11.7 5.8 18.540-44 503,817 290,065 213,752 58,078 16,589 41,489 11.5 5.7 19.445-49 405,044 224,308 180,736 43,186 12,716 30,470 10.7 5.7 16.950-54 302,251 166,568 135,682 36,225 12,971 23,254 12.0 7.8 17.155-59 177,055 106,145 70,910 24,471 9,677 14,794 13.8 9.1 20.960-64 132,266 83,244 49,022 18,566 8,023 10,544 14.0 9.6 21.565+ 179,105 123,030 56,076 20,205 14,510 5,694 11.3 11.8 10.2
TIGRAY REGION
All Ages 487,785 231,098 256,688 94,756 25,996 68,761 19.4 11.2 26.810-14 8,130 3,701 4,430 603 281 323 7.4 7.6 7.315-19 48,786 18,557 30,229 12,014 4,398 7,615 24.6 23.7 25.220-24 96,134 37,694 58,441 30,545 9,254 21,291 31.8 24.6 36.425-29 102,681 46,399 56,283 23,393 5,335 18,059 22.8 11.5 32.130-34 62,243 33,157 29,086 8,462 1,365 7,097 13.6 4.1 24.435-39 53,728 27,800 25,928 6,513 1,480 5,033 12.1 5.3 19.440-44 31,431 17,916 13,515 4,051 1,298 2,753 12.9 7.2 20.445-49 24,888 11,624 13,264 3,210 630 2,580 12.9 5.4 19.550-54 20,545 10,689 9,856 1,941 536 1,406 9.4 5.0 14.355-59 12,404 6,352 6,052 1,290 254 1,036 10.4 4.0 17.160-64 12,696 7,443 5,254 1,506 434 1,072 11.9 5.8 20.465+ 14,119 9,768 4,351 1,227 732 495 8.7 7.5 11.4
AFFAR REGION
All Ages 86,914 46,082 40,832 9,846 2,425 7,421 11.3 5.3 18.210-14 4,358 1,607 2,751 227 - 227 5.2 - 8.315-19 6,049 3,060 2,989 684 311 372 11.3 10.2 12.420-24 11,302 5,811 5,491 2,455 506 1,949 21.7 8.7 35.525-29 17,134 8,613 8,521 2,266 559 1,707 13.2 6.5 20.030-34 11,896 6,277 5,619 1,173 409 763 9.9 6.5 13.635-39 11,420 6,138 5,282 1,203 48 1,156 10.5 0.8 21.940-44 9,520 5,096 4,424 856 343 513 9.0 6.7 11.645-49 6,205 3,561 2,645 541 12 529 8.7 0.3 20.050-54 4,042 2,578 1,464 406 201 204 10.0 7.8 13.955-59 1,850 996 855 12 12 - 0.6 1.2 -60-64 1,988 1,268 720 12 12 - 0.6 0.9 -65+ 1,149 1,077 72 12 12 - 1.0 1.1 -
Created by PDF Generator (http://www.alientools.com/), to remove this mark, please buy the software.

Table 6.1 Cont’dEconomically Active Unemployed Unemployment Rate
Age GroupTotal Male Female Total Male Female Total Male
Female
AMHARA REGION
All Ages 1,273,491 631,044 642,448 209,533 68,229 141,304 16.5 10.8 22.010-14 51,398 24,611 26,787 4,505 3,900 605 8.8 15.8 2.315-19 133,872 59,806 74,067 27,257 9,267 17,990 20.4 15.5 24.320-24 246,832 105,461 141,371 75,607 25,276 50,331 30.6 24.0 35.625-29 243,244 124,047 119,197 42,132 12,342 29,790 17.3 9.9 25.030-34 138,453 72,425 66,028 14,303 4,394 9,909 10.3 6.1 15.035-39 138,088 68,859 69,229 15,404 3,790 11,614 11.2 5.5 16.840-44 76,018 42,501 33,517 8,239 2,165 6,074 10.8 5.1 18.145-49 80,393 41,401 38,992 8,004 2,388 5,617 10.0 5.8 14.450-54 58,155 27,663 30,492 4,470 849 3,621 7.7 3.1 11.955-59 36,802 19,213 17,589 4,782 1,438 3,344 13.0 7.5 19.060-64 26,064 17,403 8,661 1,192 520 672 4.6 3.0 7.865+ 44,171 27,654 16,516 3,639 1,901 1,738 8.2 6.9 10.5
OROMIA REGION
All Ages 1,979,212 1,080,818 898,394 330,723 115,759 214,964 16.7 10.7 23.910-14 75,862 41,501 34,362 11,148 4,801 6,347 14.7 11.6 18.515-19 183,487 87,633 95,854 48,172 18,526 29,646 26.3 21.1 30.920-24 388,258 196,837 191,421 104,073 37,409 66,664 26.8 19.0 34.825-29 388,165 217,709 170,456 71,304 20,499 50,804 18.4 9.4 29.830-34 245,089 130,361 114,728 27,749 7,981 19,768 11.3 6.1 17.235-39 252,472 139,458 113,014 25,353 7,634 17,720 10.0 5.5 15.740-44 135,998 76,525 59,474 12,715 4,353 8,362 9.3 5.7 14.145-49 109,972 67,925 42,047 6,515 2,268 4,246 5.9 3.3 10.150-54 73,360 40,164 33,196 8,771 3,292 5,479 12.0 8.2 16.555-59 49,283 30,283 19,000 5,573 1,953 3,620 11.3 6.4 19.160-64 31,710 22,581 9,129 4,515 3,166 1,348 14.2 14.0 14.865+ 45,555 29,842 15,713 4,835 3,876 960 10.6 13.0 6.1
SOMALI REGION
All Ages 236,974 123,994 112,980 34,427 12,124 22,302 14.5 9.8 19.710-14 14,132 7,652 6,481 1,683 680 1,003 11.9 8.9 15.515-19 22,217 9,216 13,000 4,557 2,056 2,502 20.5 22.3 19.220-24 31,341 14,533 16,808 7,604 1,741 5,863 24.3 12.0 34.925-29 34,499 17,684 16,816 6,470 1,775 4,695 18.8 10.0 27.930-34 32,334 15,686 16,648 3,417 875 2,542 10.6 5.6 15.335-39 28,827 15,672 13,155 3,641 1,369 2,272 12.6 8.7 17.340-44 26,791 14,493 12,298 2,510 1,153 1,357 9.4 8.0 11.045-49 13,634 8,512 5,122 1,075 372 704 7.9 4.4 13.750-54 12,967 7,457 5,509 2,008 1,203 805 15.5 16.1 14.655-59 5,019 3,278 1,740 543 229 314 10.8 7.0 18.060-64 7,400 4,712 2,688 830 584 246 11.2 12.4 9.265+ 7,812 5,097 2,715 88 88 - 1.1 1.7 -
Created by PDF Generator (http://www.alientools.com/), to remove this mark, please buy the software.

Table 6.1 Cont’dEconomically Active Unemployed Unemployment RateAge Group
Total Male Female Total Male Female Total Male Female
BENISHANGUL GUMUZ REGION
All Ages 78,024 41,751 36,273 5,505 1,897 3,609 7.1 4.5 9.910-14 4,905 2,252 2,653 - - - - - -15-19 9,941 4,507 5,435 901 562 339 9.1 12.5 6.220-24 12,772 5,842 6,930 1,846 568 1,278 14.5 9.7 18.425-29 14,093 8,249 5,843 891 340 551 6.3 4.1 9.430-34 8,753 4,197 4,555 442 147 295 5.0 3.5 6.535-39 8,937 4,686 4,250 614 66 548 6.9 1.4 12.940-44 6,067 4,153 1,914 459 103 356 7.6 2.5 18.645-49 4,283 2,754 1,530 63 24 40 1.5 0.9 2.650-54 2,649 1,269 1,380 107 - 107 4.0 - 7.855-59 1,822 1,230 592 33 33 - 1.8 2.7 -60-64 1,401 811 590 95 - 95 6.8 - 16.165+ 2,400 1,799 600 53 53 - 2.2 2.9 -
SNNP REGION
All Ages 957,813 507,014 450,799119,17
6 40,404 78,771 12.4 8.0 17.510-14 47,049 20,093 26,956 3,566 628 2,938 7.6 3.1 10.915-19 93,698 38,973 54,724 12,899 5,855 7,044 13.8 15.0 12.920-24 168,084 84,187 83,897 36,312 13,773 22,540 21.6 16.4 26.925-29 187,389 103,942 83,447 27,120 7,899 19,221 14.5 7.6 23.030-34 121,863 70,160 51,703 13,033 4,344 8,688 10.7 6.2 16.835-39 113,550 56,327 57,224 8,881 1,698 7,182 7.8 3.0 12.640-44 74,895 45,409 29,486 4,519 1,232 3,287 6.0 2.7 11.145-49 52,509 28,672 23,838 3,177 1,007 2,170 6.1 3.5 9.150-54 39,803 25,212 14,591 3,479 1,491 1,988 8.7 5.9 13.655-59 19,868 11,612 8,256 1,916 616 1,300 9.6 5.3 15.760-64 15,789 7,229 8,560 1,815 601 1,215 11.5 8.3 14.265+ 23,317 15,200 8,117 2,460 1,262 1,198 10.6 8.3 14.8
GAMBELLA REGION
All Ages 38,759 19,281 19,478 3,020 484 2,536 7.8 2.5 13.010-14 429 190 239 115 27 88 26.8 14.2 36.815-19 2,454 769 1,686 417 27 390 17.0 3.5 23.120-24 7,115 2,644 4,471 814 55 759 11.4 2.1 17.025-29 9,710 4,972 4,738 858 143 715 8.8 2.9 15.130-34 5,658 3,266 2,392 406 152 254 7.2 4.7 10.635-39 5,663 3,157 2,506 221 - 221 3.9 - 8.840-44 2,989 1,631 1,358 188 80 109 6.3 4.9 8.045-49 2,306 1,036 1,270 - - - - - -50-54 1,537 1,025 511 - - - - - -55-59 382 274 108 - - - - - -60-64 266 129 137 - - - - - -65+ 250 188 62 - - - - - -
Created by PDF Generator (http://www.alientools.com/), to remove this mark, please buy the software.
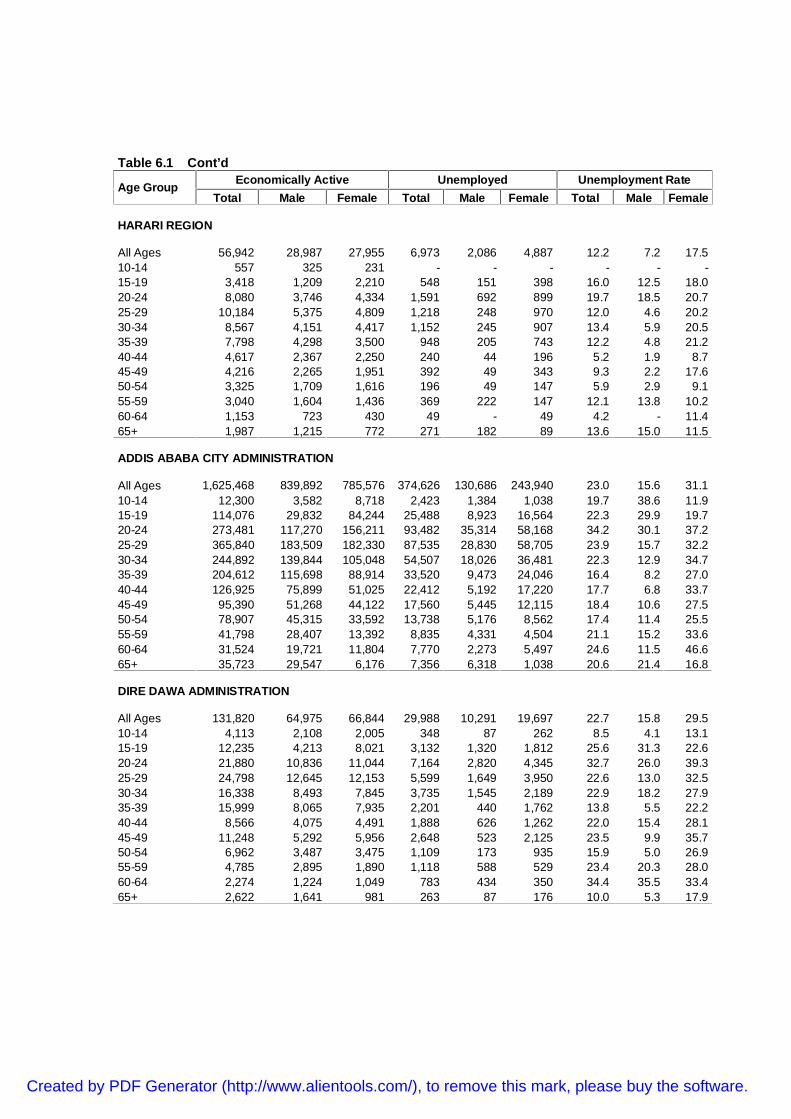
Table 6.1 Cont’dEconomically Active Unemployed Unemployment RateAge Group
Total Male Female Total Male Female Total Male Female
HARARI REGION
All Ages 56,942 28,987 27,955 6,973 2,086 4,887 12.2 7.2 17.510-14 557 325 231 - - - - - -15-19 3,418 1,209 2,210 548 151 398 16.0 12.5 18.020-24 8,080 3,746 4,334 1,591 692 899 19.7 18.5 20.725-29 10,184 5,375 4,809 1,218 248 970 12.0 4.6 20.230-34 8,567 4,151 4,417 1,152 245 907 13.4 5.9 20.535-39 7,798 4,298 3,500 948 205 743 12.2 4.8 21.240-44 4,617 2,367 2,250 240 44 196 5.2 1.9 8.745-49 4,216 2,265 1,951 392 49 343 9.3 2.2 17.650-54 3,325 1,709 1,616 196 49 147 5.9 2.9 9.155-59 3,040 1,604 1,436 369 222 147 12.1 13.8 10.260-64 1,153 723 430 49 - 49 4.2 - 11.465+ 1,987 1,215 772 271 182 89 13.6 15.0 11.5
ADDIS ABABA CITY ADMINISTRATION
All Ages 1,625,468 839,892 785,576 374,626 130,686 243,940 23.0 15.6 31.110-14 12,300 3,582 8,718 2,423 1,384 1,038 19.7 38.6 11.915-19 114,076 29,832 84,244 25,488 8,923 16,564 22.3 29.9 19.720-24 273,481 117,270 156,211 93,482 35,314 58,168 34.2 30.1 37.225-29 365,840 183,509 182,330 87,535 28,830 58,705 23.9 15.7 32.230-34 244,892 139,844 105,048 54,507 18,026 36,481 22.3 12.9 34.735-39 204,612 115,698 88,914 33,520 9,473 24,046 16.4 8.2 27.040-44 126,925 75,899 51,025 22,412 5,192 17,220 17.7 6.8 33.745-49 95,390 51,268 44,122 17,560 5,445 12,115 18.4 10.6 27.550-54 78,907 45,315 33,592 13,738 5,176 8,562 17.4 11.4 25.555-59 41,798 28,407 13,392 8,835 4,331 4,504 21.1 15.2 33.660-64 31,524 19,721 11,804 7,770 2,273 5,497 24.6 11.5 46.665+ 35,723 29,547 6,176 7,356 6,318 1,038 20.6 21.4 16.8
DIRE DAWA ADMINISTRATION
All Ages 131,820 64,975 66,844 29,988 10,291 19,697 22.7 15.8 29.510-14 4,113 2,108 2,005 348 87 262 8.5 4.1 13.115-19 12,235 4,213 8,021 3,132 1,320 1,812 25.6 31.3 22.620-24 21,880 10,836 11,044 7,164 2,820 4,345 32.7 26.0 39.325-29 24,798 12,645 12,153 5,599 1,649 3,950 22.6 13.0 32.530-34 16,338 8,493 7,845 3,735 1,545 2,189 22.9 18.2 27.935-39 15,999 8,065 7,935 2,201 440 1,762 13.8 5.5 22.240-44 8,566 4,075 4,491 1,888 626 1,262 22.0 15.4 28.145-49 11,248 5,292 5,956 2,648 523 2,125 23.5 9.9 35.750-54 6,962 3,487 3,475 1,109 173 935 15.9 5.0 26.955-59 4,785 2,895 1,890 1,118 588 529 23.4 20.3 28.060-64 2,274 1,224 1,049 783 434 350 34.4 35.5 33.465+ 2,622 1,641 981 263 87 176 10.0 5.3 17.9
Created by PDF Generator (http://www.alientools.com/), to remove this mark, please buy the software.

Table 6.2 Currently Unemployed Populations of Major Towns Aged Ten Years andAbove by Sex, Age Group and Unemployment Rate: 2012
Economically Active Unemployed Unemployment RateAgeGroup Total Male Female Total Male Female Total Male Female
COUNTRY TOTAL
All Ages 2,817,517 1,438,991 1,378,526 602,000 197,663 404,337 21.4 13.7 29.310-14 41,468 15,749 25,719 5,211 2,694 2,517 12.6 17.1 9.815-19 227,469 70,547 156,922 51,976 18,833 33,143 22.8 26.7 21.120-24 499,149 215,737 283,412 158,256 54,604 103,651 31.7 25.3 36.625-29 617,504 308,561 308,943 140,145 41,907 98,238 22.7 13.6 31.830-34 392,860 221,442 171,419 78,496 24,650 53,845 20.0 11.1 31.435-39 347,896 193,375 154,522 51,975 13,769 38,206 14.9 7.1 24.740-44 214,079 126,395 87,684 33,503 8,522 24,981 15.6 6.7 28.545-49 166,298 91,124 75,174 27,668 7,893 19,775 16.6 8.7 26.350-54 126,914 70,804 56,110 20,300 6,496 13,804 16.0 9.2 24.655-59 69,229 45,173 24,056 12,865 6,074 6,791 18.6 13.4 28.260-64 52,784 33,314 19,470 11,251 4,000 7,251 21.3 12.0 37.265+ 61,867 46,770 15,097 10,355 8,220 2,135 16.7 17.6 14.1
MEKELE TOWN
All Ages 151,489 73,787 77,702 29,944 7,951 21,993 19.8 10.8 28.310-14 2,150 436 1,714 - - - - - -15-19 14,423 5,349 9,074 2,908 2,042 866 20.2 38.2 9.520-24 28,167 10,314 17,853 8,808 2,162 6,646 31.3 21.0 37.225-29 35,278 14,374 20,904 10,268 2,142 8,127 29.1 14.9 38.930-34 18,804 10,775 8,029 2,914 428 2,486 15.5 4.0 31.035-39 20,178 12,425 7,752 2,257 634 1,622 11.2 5.1 20.940-44 12,710 8,595 4,115 543 322 221 4.3 3.7 5.445-49 6,556 3,312 3,244 1,057 - 1,057 16.1 - 32.650-54 5,214 3,173 2,041 338 111 227 6.5 3.5 11.155-59 2,489 1,326 1,163 307 - 307 12.3 - 26.460-64 2,253 1,505 748 215 - 215 9.5 - 28.765+ 3,268 2,202 1,066 327 109 218 10.0 5.0 20.5
ASAYITA TOWN
All Ages 9,218 4,910 4,309 849 286 564 9.2 5.8 13.110-14 251 143 108 - - - - - -15-19 756 289 467 108 24 84 14.3 8.3 18.020-24 1,511 695 816 288 72 215 19.1 10.4 26.325-29 2,064 1,171 892 107 59 48 5.2 5.0 5.430-34 1,136 586 551 96 12 84 8.5 2.0 15.235-39 1,081 589 491 107 48 60 9.9 8.1 12.240-44 634 370 264 47 23 24 7.4 6.2 9.145-49 599 372 227 36 12 24 6.0 3.2 10.650-54 421 168 254 25 - 25 5.9 - 9.855-59 252 156 96 12 12 - 4.8 7.7 -60-64 228 156 72 12 12 - 5.3 7.7 -65+ 286 214 72 12 12 - 4.2 5.6 -
Created by PDF Generator (http://www.alientools.com/), to remove this mark, please buy the software.

Table 6.2 Cont’dEconomically Active Unemployed Unemployment RateAge Group
Total Male Female Total Male Female Total Male Female
GONDER TOWN
All Ages 116,260 57,528 58,732 18,392 5,780 12,612 15.8 10.0 21.510-14 8,532 4,421 4,111 608 512 96 7.1 11.6 2.315-19 12,218 4,987 7,232 2,381 912 1,469 19.5 18.3 20.320-24 20,895 7,335 13,560 5,419 633 4,785 25.9 8.6 35.325-29 20,998 11,917 9,081 3,498 1,646 1,853 16.7 13.8 20.430-34 12,277 6,266 6,011 2,018 910 1,108 16.4 14.5 18.435-39 11,429 5,836 5,594 1,119 201 919 9.8 3.4 16.440-44 8,285 4,442 3,843 1,556 293 1,263 18.8 6.6 32.945-49 7,087 3,832 3,255 720 475 245 10.2 12.4 7.550-54 4,244 2,276 1,969 505 123 382 11.9 5.4 19.455-59 2,994 1,553 1,440 247 - 247 8.2 - 17.260-64 3,415 1,913 1,502 321 75 245 9.4 3.9 16.365+ 3,885 2,750 1,135 - - - - - -
DESSIE TOWN
All Ages 61,298 30,546 30,752 13,755 4,136 9,618 22.4 13.5 31.310-14 796 54 742 92 - 92 11.6 - 12.415-19 6,453 2,471 3,981 2,218 582 1,636 34.4 23.6 41.120-24 12,466 6,152 6,314 4,268 1,494 2,774 34.2 24.3 43.925-29 11,229 5,670 5,559 2,480 630 1,850 22.1 11.1 33.330-34 6,480 3,821 2,659 842 421 421 13.0 11.0 15.835-39 7,891 3,767 4,124 1,398 309 1,089 17.7 8.2 26.440-44 3,986 2,321 1,665 616 155 461 15.5 6.7 27.745-49 3,367 1,748 1,619 640 122 518 19.0 7.0 32.050-54 3,205 1,124 2,081 586 54 532 18.3 4.8 25.655-59 1,662 964 698 353 154 198 21.2 16.0 28.460-64 1,830 1,379 451 217 170 47 11.9 12.3 10.465+ 1,934 1,076 858 46 46 - 2.4 4.3 -
BAHIR DAR TOWN
All Ages 115,388 52,479 62,909 21,606 5,672 15,934 18.7 10.8 25.310-14 1,961 901 1,060 348 146 202 17.7 16.2 19.115-19 12,624 2,856 9,768 2,436 547 1,889 19.3 19.2 19.320-24 28,442 9,277 19,165 8,633 2,436 6,197 30.4 26.3 32.325-29 26,019 13,804 12,216 4,795 792 4,003 18.4 5.7 32.830-34 12,720 6,178 6,541 1,902 214 1,688 15.0 3.5 25.835-39 12,033 6,151 5,882 983 339 644 8.2 5.5 10.940-44 6,652 4,313 2,339 586 405 181 8.8 9.4 7.745-49 5,493 3,050 2,444 632 150 482 11.5 4.9 19.750-54 4,092 2,193 1,899 587 103 484 14.3 4.7 25.555-59 2,057 1,362 695 - - - - - -60-64 1,710 1,177 533 439 275 164 25.7 23.4 30.865+ 1,584 1,217 367 266 266 - 16.8 21.9 -
Created by PDF Generator (http://www.alientools.com/), to remove this mark, please buy the software.

Table 6.2 Cont’dEconomically Active Unemployed Unemployment RateAge Group
Total Male Female Total Male Female Total Male Female
BISHOFTU TOWN
All Ages 56,377 28,582 27,795 15,052 4,901 10,151 26.7 17.1 36.510-14 499 286 213 86 46 40 17.2 16.1 18.815-19 4,089 1,443 2,646 1,635 503 1,131 40.0 34.9 42.720-24 11,209 5,662 5,547 4,047 1,606 2,440 36.1 28.4 44.025-29 12,513 6,390 6,124 3,573 1,092 2,481 28.6 17.1 40.530-34 7,561 4,653 2,907 1,364 412 952 18.0 8.9 32.735-39 7,475 3,551 3,924 1,620 386 1,233 21.7 10.9 31.440-44 3,540 1,655 1,885 649 142 507 18.3 8.6 26.945-49 2,992 1,441 1,550 563 114 449 18.8 7.9 29.050-54 2,384 992 1,392 583 164 419 24.5 16.5 30.155-59 1,425 805 620 495 139 356 34.7 17.3 57.460-64 1,052 595 457 192 96 96 18.3 16.1 21.065+ 1,639 1,109 530 247 201 46 15.1 18.1 8.7
ADAMA TOWN
All Ages 123,171 63,334 59,837 29,899 8,097 21,802 24.3 12.8 36.410-14 1,152 477 675 427 300 128 37.1 62.9 19.015-19 13,169 5,844 7,325 4,386 1,885 2,502 33.3 32.3 34.220-24 22,766 10,509 12,257 7,106 1,701 5,405 31.2 16.2 44.125-29 29,002 12,947 16,055 7,931 1,341 6,590 27.3 10.4 41.030-34 16,463 8,982 7,480 3,256 663 2,592 19.8 7.4 34.735-39 14,967 9,062 5,905 2,447 764 1,683 16.3 8.4 28.540-44 8,341 4,858 3,482 1,406 498 908 16.9 10.3 26.145-49 7,168 4,741 2,427 872 183 689 12.2 3.9 28.450-54 3,957 2,075 1,882 776 186 590 19.6 9.0 31.355-59 1,990 1,267 723 461 267 195 23.2 21.1 27.060-64 1,698 842 857 225 - 225 13.3 - 26.365+ 2,499 1,729 770 605 309 295 24.2 17.9 38.3
JIMMA TOWN
All Ages 70,819 37,099 33,720 11,711 3,449 8,263 16.5 9.3 24.510-14 2,362 852 1,510 90 44 46 3.8 5.2 3.015-19 7,114 2,535 4,579 1,870 519 1,351 26.3 20.5 29.520-24 14,210 7,079 7,131 3,450 1,332 2,118 24.3 18.8 29.725-29 14,050 7,832 6,218 2,190 739 1,451 15.6 9.4 23.330-34 8,492 4,688 3,804 1,246 170 1,075 14.7 3.6 28.335-39 8,671 4,662 4,008 846 - 846 9.8 - 21.140-44 4,729 2,660 2,068 589 175 415 12.5 6.6 20.145-49 3,903 2,413 1,490 362 50 311 9.3 2.1 20.950-54 2,838 1,685 1,152 349 53 295 12.3 3.1 25.655-59 1,845 1,226 619 281 120 161 15.2 9.8 26.060-64 1,090 754 336 155 114 41 14.2 15.1 12.265+ 1,516 712 804 284 131 153 18.7 18.4 19.0
Created by PDF Generator (http://www.alientools.com/), to remove this mark, please buy the software.

Table 6.2 Cont’dEconomically Active Unemployed Unemployment RateAge Group
Total Male Female Total Male Female Total Male Female
SHASHEMENE TOWN
All Ages 60,565 32,633 27,932 14,606 4,098 10,508 24.1 12.6 37.610-14 1,182 526 655 234 97 137 19.8 18.4 20.915-19 5,612 2,558 3,055 1,793 494 1,300 31.9 19.3 42.620-24 10,845 5,481 5,364 3,464 940 2,524 31.9 17.2 47.125-29 14,343 7,111 7,232 4,017 997 3,020 28.0 14.0 41.830-34 8,968 5,018 3,949 1,660 378 1,282 18.5 7.5 32.535-39 7,193 4,217 2,977 1,404 509 895 19.5 12.1 30.140-44 4,912 2,904 2,007 745 99 646 15.2 3.4 32.245-49 2,873 1,750 1,123 387 128 259 13.5 7.3 23.150-54 1,972 1,079 893 477 126 352 24.2 11.7 39.455-59 803 630 174 74 39 35 9.2 6.2 20.160-64 1,076 786 290 299 239 60 27.8 30.4 20.765+ 785 573 212 52 52 - 6.6 9.1 -
JIJIGA TOWN
All Ages 50,418 26,548 23,870 9,476 2,558 6,918 18.8 9.6 29.010-14 1,355 420 935 225 51 174 16.6 12.1 18.615-19 3,631 1,411 2,220 713 298 415 19.6 21.1 18.720-24 7,405 2,860 4,546 2,617 462 2,155 35.3 16.2 47.425-29 9,792 4,852 4,940 1,973 496 1,477 20.1 10.2 29.930-34 6,865 3,820 3,045 957 243 714 13.9 6.4 23.435-39 7,080 4,074 3,006 1,377 394 983 19.4 9.7 32.740-44 4,990 3,145 1,844 602 52 550 12.1 1.7 29.845-49 3,934 2,775 1,158 422 211 211 10.7 7.6 18.250-54 2,202 1,144 1,058 253 102 151 11.5 8.9 14.355-59 1,326 895 430 50 50 - 3.8 5.6 -60-64 892 562 330 197 109 89 22.1 19.4 27.065+ 947 590 357 88 88 - 9.3 14.9 -
ASOSA TOWN
All Ages 20,119 10,962 9,157 2,189 803 1,385 10.9 7.3 15.110-14 744 345 398 - - - - - -15-19 2,416 731 1,685 570 231 339 23.6 31.6 20.120-24 3,698 1,782 1,916 609 185 425 16.5 10.4 22.225-29 4,195 2,339 1,855 355 165 190 8.5 7.1 10.230-34 2,864 1,597 1,267 256 23 233 8.9 1.4 18.435-39 2,679 1,767 912 147 66 80 5.5 3.7 8.840-44 1,417 1,029 387 70 23 47 4.9 2.2 12.145-49 779 640 139 63 24 40 8.1 3.8 28.850-54 506 274 232 31 - 31 6.1 - 13.455-59 399 199 200 33 33 - 8.3 16.6 -60-64 195 115 80 - - - - - -65+ 229 142 87 53 53 - 23.1 37.3 -
Created by PDF Generator (http://www.alientools.com/), to remove this mark, please buy the software.
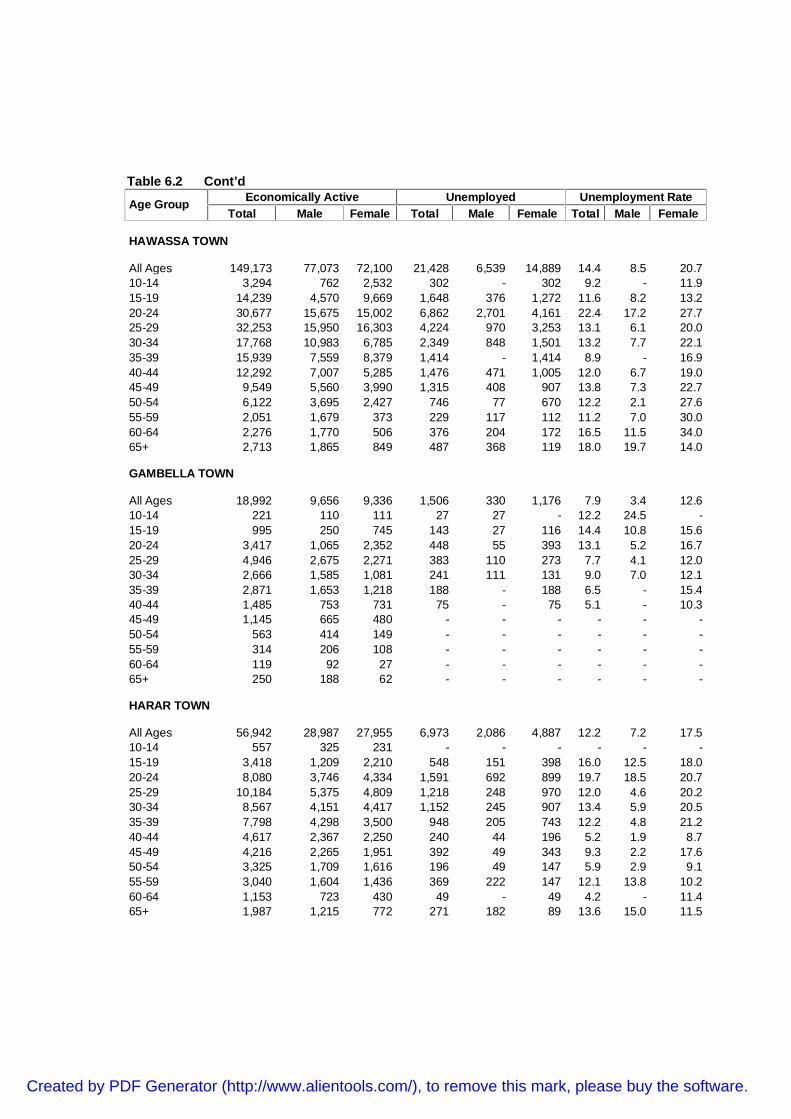
Table 6.2 Cont’dEconomically Active Unemployed Unemployment RateAge Group
Total Male Female Total Male Female Total Male Female
HAWASSA TOWN
All Ages 149,173 77,073 72,100 21,428 6,539 14,889 14.4 8.5 20.710-14 3,294 762 2,532 302 - 302 9.2 - 11.915-19 14,239 4,570 9,669 1,648 376 1,272 11.6 8.2 13.220-24 30,677 15,675 15,002 6,862 2,701 4,161 22.4 17.2 27.725-29 32,253 15,950 16,303 4,224 970 3,253 13.1 6.1 20.030-34 17,768 10,983 6,785 2,349 848 1,501 13.2 7.7 22.135-39 15,939 7,559 8,379 1,414 - 1,414 8.9 - 16.940-44 12,292 7,007 5,285 1,476 471 1,005 12.0 6.7 19.045-49 9,549 5,560 3,990 1,315 408 907 13.8 7.3 22.750-54 6,122 3,695 2,427 746 77 670 12.2 2.1 27.655-59 2,051 1,679 373 229 117 112 11.2 7.0 30.060-64 2,276 1,770 506 376 204 172 16.5 11.5 34.065+ 2,713 1,865 849 487 368 119 18.0 19.7 14.0
GAMBELLA TOWN
All Ages 18,992 9,656 9,336 1,506 330 1,176 7.9 3.4 12.610-14 221 110 111 27 27 - 12.2 24.5 -15-19 995 250 745 143 27 116 14.4 10.8 15.620-24 3,417 1,065 2,352 448 55 393 13.1 5.2 16.725-29 4,946 2,675 2,271 383 110 273 7.7 4.1 12.030-34 2,666 1,585 1,081 241 111 131 9.0 7.0 12.135-39 2,871 1,653 1,218 188 - 188 6.5 - 15.440-44 1,485 753 731 75 - 75 5.1 - 10.345-49 1,145 665 480 - - - - - -50-54 563 414 149 - - - - - -55-59 314 206 108 - - - - - -60-64 119 92 27 - - - - - -65+ 250 188 62 - - - - - -
HARAR TOWN
All Ages 56,942 28,987 27,955 6,973 2,086 4,887 12.2 7.2 17.510-14 557 325 231 - - - - - -15-19 3,418 1,209 2,210 548 151 398 16.0 12.5 18.020-24 8,080 3,746 4,334 1,591 692 899 19.7 18.5 20.725-29 10,184 5,375 4,809 1,218 248 970 12.0 4.6 20.230-34 8,567 4,151 4,417 1,152 245 907 13.4 5.9 20.535-39 7,798 4,298 3,500 948 205 743 12.2 4.8 21.240-44 4,617 2,367 2,250 240 44 196 5.2 1.9 8.745-49 4,216 2,265 1,951 392 49 343 9.3 2.2 17.650-54 3,325 1,709 1,616 196 49 147 5.9 2.9 9.155-59 3,040 1,604 1,436 369 222 147 12.1 13.8 10.260-64 1,153 723 430 49 - 49 4.2 - 11.465+ 1,987 1,215 772 271 182 89 13.6 15.0 11.5
Created by PDF Generator (http://www.alientools.com/), to remove this mark, please buy the software.

Table 6.2 Cont’dEconomically Active Unemployed Unemployment RateAge Group
Total Male Female Total Male Female Total Male Female
ADDIS ABABA CITYADMINISTRATION
All Ages 1,625,468 839,892 785,576 374,626 130,686 243,940 23.0 15.6 31.110-14 12,300 3,582 8,718 2,423 1,384 1,038 19.7 38.6 11.915-19 114,076 29,832 84,244 25,488 8,923 16,564 22.3 29.9 19.720-24 273,481 117,270 156,211 93,482 35,314 58,168 34.2 30.1 37.225-29 365,840 183,509 182,330 87,535 28,830 58,705 23.9 15.7 32.230-34 244,892 139,844 105,048 54,507 18,026 36,481 22.3 12.9 34.735-39 204,612 115,698 88,914 33,520 9,473 24,046 16.4 8.2 27.040-44 126,925 75,899 51,025 22,412 5,192 17,220 17.7 6.8 33.745-49 95,390 51,268 44,122 17,560 5,445 12,115 18.4 10.6 27.550-54 78,907 45,315 33,592 13,738 5,176 8,562 17.4 11.4 25.555-59 41,798 28,407 13,392 8,835 4,331 4,504 21.1 15.2 33.660-64 31,524 19,721 11,804 7,770 2,273 5,497 24.6 11.5 46.665+ 35,723 29,547 6,176 7,356 6,318 1,038 20.6 21.4 16.8
DIRE DAWA TOWN
All Ages 131,820 64,975 66,844 29,988 10,291 19,697 22.7 15.8 29.510-14 4,113 2,108 2,005 348 87 262 8.5 4.1 13.115-19 12,235 4,213 8,021 3,132 1,320 1,812 25.6 31.3 22.620-24 21,880 10,836 11,044 7,164 2,820 4,345 32.7 26.0 39.325-29 24,798 12,645 12,153 5,599 1,649 3,950 22.6 13.0 32.530-34 16,338 8,493 7,845 3,735 1,545 2,189 22.9 18.2 27.935-39 15,999 8,065 7,935 2,201 440 1,762 13.8 5.5 22.240-44 8,566 4,075 4,491 1,888 626 1,262 22.0 15.4 28.145-49 11,248 5,292 5,956 2,648 523 2,125 23.5 9.9 35.750-54 6,962 3,487 3,475 1,109 173 935 15.9 5.0 26.955-59 4,785 2,895 1,890 1,118 588 529 23.4 20.3 28.060-64 2,274 1,224 1,049 783 434 350 34.4 35.5 33.465+ 2,622 1,641 981 263 87 176 10.0 5.3 17.9
Created by PDF Generator (http://www.alientools.com/), to remove this mark, please buy the software.

Table 6.3 Currently Unemployed Population of Urban Areas Aged Ten Years and Above by Age Group, Sex, Literacy Statusand Educational Attainment : 2012
Literate
Age Group and SexTotal
UnemployedPersons Non
Formal Pre-schoolGrades
1-8
Secondarynot
completedSecondaryCompleted Preparatory
CertificateCompleted
DiplomaCompleted
COUNTRY TOTALTotal 1,218,574 14,845 5,024 408,959 104,955 279,438 42,464 35,314 105,843Male 410,381 5,720 355 126,308 46,542 108,597 19,296 9,608 45,500Female 808,193 9,125 4,669 282,650 58,412 170,841 23,168 25,706 60,343
10-14Total 24,618 - 1,345 19,127 210 25 - - -Male 11,787 - 314 10,877 - - - - -Female 12,831 - 1,031 8,250 210 25 - - -
15-19Total 136,069 210 346 57,147 12,045 41,911 3,672 6,878 6,488Male 51,396 210 - 17,545 5,948 19,040 1,636 2,137 3,377Female 84,673 - 346 39,602 6,098 22,872 2,036 4,741 3,112
20-24Total 361,492 12 97 101,443 25,342 92,187 21,445 15,014 57,907Male 127,407 12 - 24,955 12,297 39,250 10,173 2,944 24,677Female 234,085 - 97 76,488 13,046 52,937 11,272 12,070 33,229
25-29Total 268,787 908 2,551 89,877 25,762 61,321 11,758 9,972 20,861Male 79,619 319 - 24,935 8,298 19,069 4,964 2,317 9,120Female 189,168 588 2,551 64,942 17,464 42,253 6,794 7,655 11,741
30-34Total 128,378 717 77 42,659 15,377 31,774 3,738 1,737 8,441Male 39,484 454 - 12,645 6,739 9,571 1,748 1,223 2,841Female 88,893 263 77 30,014 8,637 22,202 1,991 513 5,600
35-39Total 98,500 2,095 102 30,796 11,202 23,211 727 1,161 4,714Male 26,203 509 - 8,234 3,912 7,222 204 648 1,396Female 72,297 1,587 102 22,561 7,290 15,989 522 513 3,318
Created by PDF Generator (http://www.alientools.com/), to remove this mark, please buy the software.

Table 6.3 Cont’dLiterate
Age Group and SexTotal
UnemployedPersons Non
Formal Pre-schoolGrades
1-8
Secondarynot
completedSecondaryCompleted Preparatory
CertificateCompleted
DiplomaCompleted
40-44Total 58,078 1,901 - 18,688 5,464 15,036 624 - 1,349Male 16,589 934 - 4,510 2,364 4,977 72 - 109Female 41,489 967 - 14,179 3,100 10,059 552 - 1,239
45-49Total 43,186 1,591 - 15,718 3,074 5,598 - 213 1,498Male 12,716 - - 5,173 1,386 3,255 - - 895Female 30,470 1,591 - 10,545 1,687 2,343 - 213 603
50-54Total 36,225 2,799 - 11,440 3,407 3,454 - 287 1,586Male 12,971 401 - 4,270 2,574 2,181 - 287 432Female 23,254 2,397 - 7,170 833 1,272 - - 1,155
55-59Total 24,471 1,527 41 8,962 761 2,657 - 50 465Male 9,677 805 41 4,383 713 1,770 - 50 119Female 14,794 722 - 4,578 47 887 - - 346
60-64Total 18,566 1,551 - 7,236 449 667 153 - 1,667Male 8,023 865 - 3,348 449 667 153 - 1,667Female 10,544 687 - 3,888 - - - - -
65+Total 20,205 1,534 465 5,866 1,863 1,597 346 - 868Male 14,510 1,211 - 5,433 1,863 1,597 346 - 868Female 5,694 323 465 433 - - - - -
Created by PDF Generator (http://www.alientools.com/), to remove this mark, please buy the software.

Table 6.4 Currently Unemployed Population of Urban Areas Aged Ten Years and Above by Region, Sex andEducational Attainment: 2012
All Literate
Region and Sex Totalunemployed
personsNon
FormalPre-
schoolGrades
1-8
Secondarynot
completedSecondaryCompleted Preparatory
CertificateCompleted
DiplomaCompleted
COUNTRY TOTALTotal 1,218,574 14,845 5,024 408,959 104,955 279,438 42,464 35,314 105,843Male 410,381 5,720 355 126,308 46,542 108,597 19,296 9,608 45,500Female 808,193 9,125 4,669 282,650 58,412 170,841 23,168 25,706 60,343
TIGRAY REGIONTotal 94,756 1,190 - 33,725 5,462 25,551 4,707 1,655 4,769Male 25,996 412 - 8,233 1,521 8,042 3,016 218 1,908Female 68,761 778 - 25,492 3,941 17,509 1,691 1,438 2,862
AFFAR REGIONTotal 9,846 526 - 3,676 406 1,192 24 85 511Male 2,425 36 - 1,434 49 156 12 61 224Female 7,421 491 - 2,242 357 1,037 13 24 287
AMHARA REGIONTotal 209,533 4,110 77 65,627 13,023 46,529 6,167 9,225 18,905Male 68,229 1,865 - 20,697 6,201 15,404 2,890 1,695 6,401Female 141,304 2,245 77 44,931 6,822 31,124 3,277 7,531 12,504
OROMIA REGIONTotal 330,723 2,340 2,755 119,082 23,941 70,570 9,790 8,855 37,683Male 115,759 1,342 - 38,174 11,734 32,182 3,395 2,407 16,151Female 214,964 998 2,755 80,907 12,207 38,388 6,395 6,448 21,532
SOMALI REGIONTotal 34,427 681 629 11,592 1,939 1,718 357 50 255Male 12,124 367 314 5,276 980 814 50 50Female 22,302 314 314 6,315 959 904 306 - 255
BENISHANGULGUMUZ REGION
Total 5,505 - - 2,175 500 1,018 273 80 378Male 1,897 - - 680 204 574 137 - 151Female 3,608 - - 1,495 297 444 136 80 227
Created by PDF Generator (http://www.alientools.com/), to remove this mark, please buy the software.
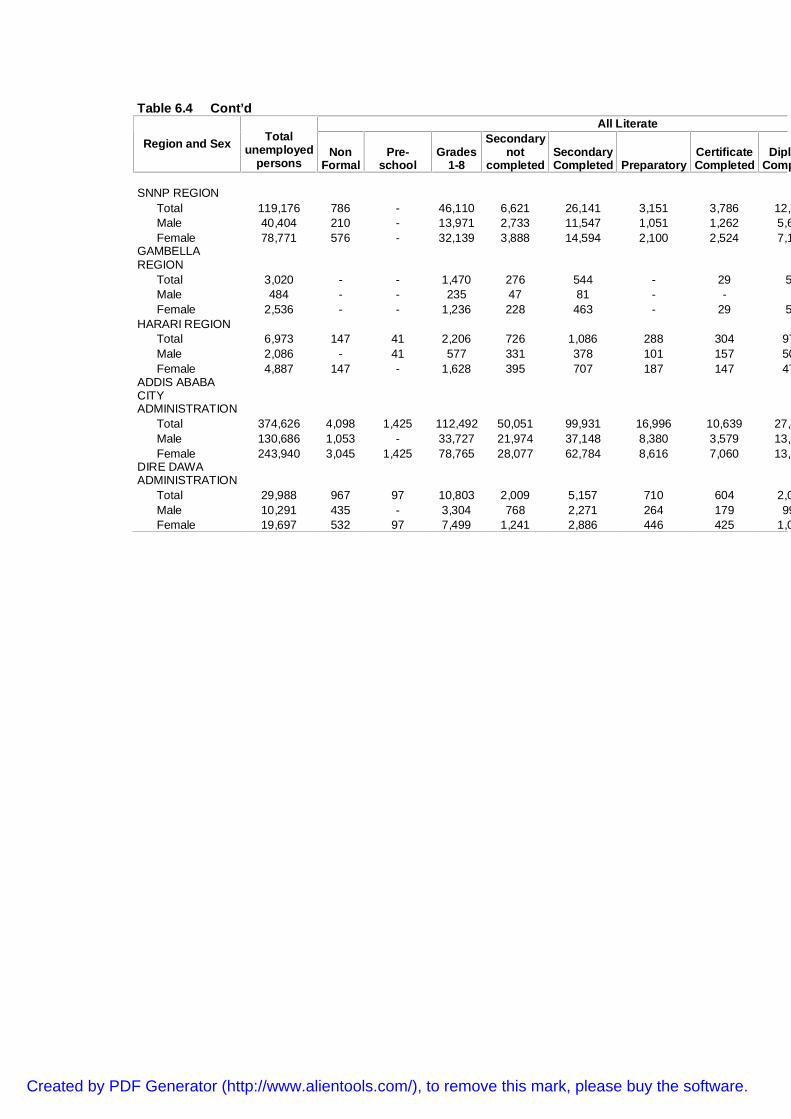
Table 6.4 Cont’dAll Literate
Region and Sex Totalunemployed
personsNon
FormalPre-
schoolGrades
1-8
Secondarynot
completedSecondaryCompleted Preparatory
CertificateCompleted
DiplomaCompleted
SNNP REGIONTotal 119,176 786 - 46,110 6,621 26,141 3,151 3,786 12,807Male 40,404 210 - 13,971 2,733 11,547 1,051 1,262 5,624Female 78,771 576 - 32,139 3,888 14,594 2,100 2,524 7,183
GAMBELLAREGION
Total 3,020 - - 1,470 276 544 - 29 59Male 484 - - 235 47 81 - -Female 2,536 - - 1,236 228 463 - 29 59
HARARI REGIONTotal 6,973 147 41 2,206 726 1,086 288 304 975Male 2,086 - 41 577 331 378 101 157 502Female 4,887 147 - 1,628 395 707 187 147 473
ADDIS ABABACITYADMINISTRATION
Total 374,626 4,098 1,425 112,492 50,051 99,931 16,996 10,639 27,440Male 130,686 1,053 - 33,727 21,974 37,148 8,380 3,579 13,541Female 243,940 3,045 1,425 78,765 28,077 62,784 8,616 7,060 13,898
DIRE DAWAADMINISTRATION
Total 29,988 967 97 10,803 2,009 5,157 710 604 2,061Male 10,291 435 - 3,304 768 2,271 264 179 998Female 19,697 532 97 7,499 1,241 2,886 446 425 1,062
Created by PDF Generator (http://www.alientools.com/), to remove this mark, please buy the software.

Table 6.5 Currently Unemployed Populations of Urban Areas Aged Ten Years and Above by Region, Sex, Training Status and Typeof Training : 2012
RegionTraining status andTypes of Training
Total Tigray Afar Amhara Oromia SomalieBenishangul-
Gumuz SNNPR GambelaAll Persons
Total 1,218,574 94,756 9,846 209,533 330,723 34,427 5,505 119,176Male 410,381 25,996 2,425 68,229 115,759 12,124 1,897 40,404Female 808,193 68,761 7,421 141,304 214,964 22,302 3,609 78,771
Not TrainedTotal 922,871 71,907 9,151 159,426 246,962 32,012 4,846 94,733Male 278,468 17,309 2,078 47,810 76,083 10,842 1,612 29,790Female 644,403 54,598 7,073 111,615 170,879 21,170 3,234 64,943
TrainedTotal 295,703 22,849 695 50,107 83,761 2,414 659 24,443Male 131,913 8,686 347 20,419 39,676 1,282 285 10,614Female 163,790 14,163 348 29,689 44,085 1,132 374 13,829
Not StatedTotal - - - - - - - -Male - - - - - - - -Female - - - - - - - -
Types of TrainingAgriculture
Total 3,002 529 176 704 529 50 - 101Male 2,112 206 176 654 489 50 - 101Female 890 323 - 50 40 - - -
Water and Soil ConservationTotal 109 - - - 34 - - 75Male - - - - - - - -Female 109 - - - 34 - - 75
Forestry ScienceTotal - - - - - - - -Male - - - - - - - -Female - - - - - - - -
General medicine, Ophthalmology Pathology, Internal medicine, Gynecology, Surgery, AnesthesiologyTotal 318 - - 276 42 - - -Male 318 - - 276 42 - - -Female - - - - - - - -
Created by PDF Generator (http://www.alientools.com/), to remove this mark, please buy the software.
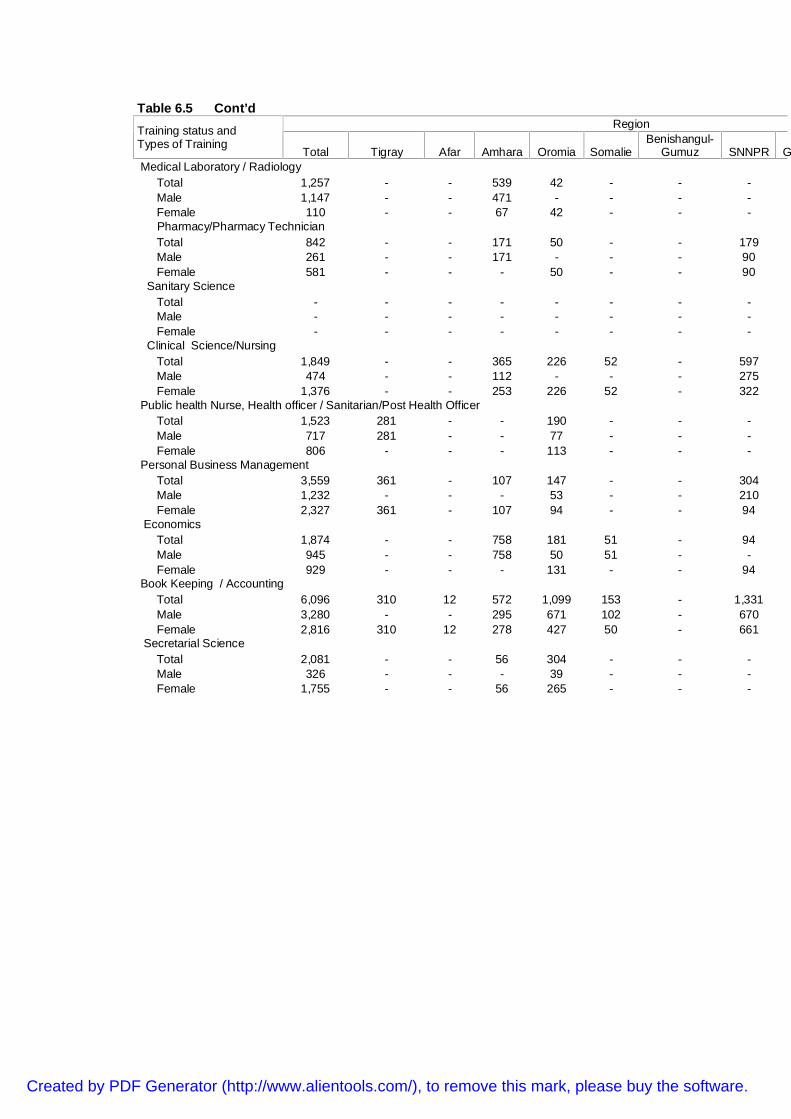
Table 6.5 Cont’dRegionTraining status and
Types of TrainingTotal Tigray Afar Amhara Oromia Somalie
Benishangul-Gumuz SNNPR Gambela
Medical Laboratory / RadiologyTotal 1,257 - - 539 42 - - -Male 1,147 - - 471 - - - -Female 110 - - 67 42 - - -Pharmacy/Pharmacy TechnicianTotal 842 - - 171 50 - - 179Male 261 - - 171 - - - 90Female 581 - - - 50 - - 90
Sanitary ScienceTotal - - - - - - - -Male - - - - - - - -Female - - - - - - - -
Clinical Science/NursingTotal 1,849 - - 365 226 52 - 597Male 474 - - 112 - - - 275Female 1,376 - - 253 226 52 - 322
Public health Nurse, Health officer / Sanitarian/Post Health OfficerTotal 1,523 281 - - 190 - - -Male 717 281 - - 77 - - -Female 806 - - - 113 - - -
Personal Business ManagementTotal 3,559 361 - 107 147 - - 304Male 1,232 - - - 53 - - 210Female 2,327 361 - 107 94 - - 94
EconomicsTotal 1,874 - - 758 181 51 - 94Male 945 - - 758 50 51 - -Female 929 - - - 131 - - 94
Book Keeping / AccountingTotal 6,096 310 12 572 1,099 153 - 1,331Male 3,280 - - 295 671 102 - 670Female 2,816 310 12 278 427 50 - 661
Secretarial ScienceTotal 2,081 - - 56 304 - - -Male 326 - - - 39 - - -Female 1,755 - - 56 265 - - -
Created by PDF Generator (http://www.alientools.com/), to remove this mark, please buy the software.
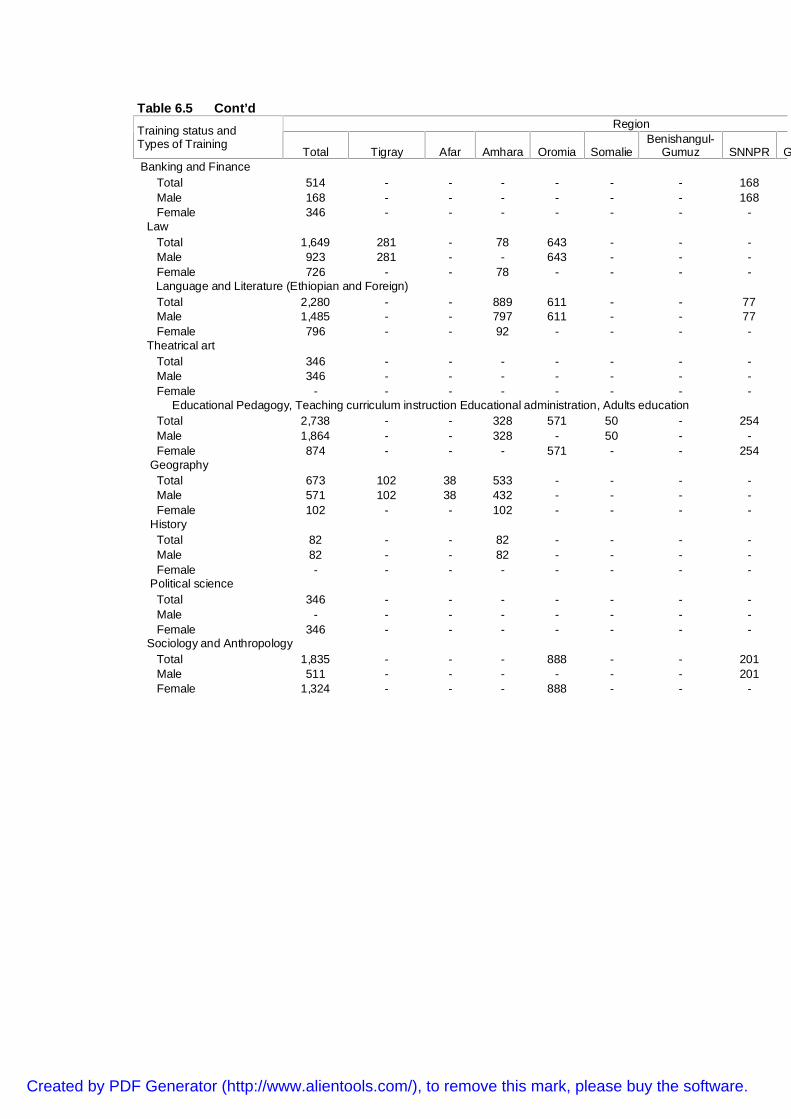
Table 6.5 Cont’dRegionTraining status and
Types of TrainingTotal Tigray Afar Amhara Oromia Somalie
Benishangul-Gumuz SNNPR Gambela
Banking and FinanceTotal 514 - - - - - - 168Male 168 - - - - - - 168Female 346 - - - - - - -
LawTotal 1,649 281 - 78 643 - - -Male 923 281 - - 643 - - -Female 726 - - 78 - - - -Language and Literature (Ethiopian and Foreign)Total 2,280 - - 889 611 - - 77Male 1,485 - - 797 611 - - 77Female 796 - - 92 - - - -
Theatrical artTotal 346 - - - - - - -Male 346 - - - - - - -Female - - - - - - - -
Educational Pedagogy, Teaching curriculum instruction Educational administration, Adults educationTotal 2,738 - - 328 571 50 - 254Male 1,864 - - 328 - 50 - -Female 874 - - - 571 - - 254
GeographyTotal 673 102 38 533 - - - -Male 571 102 38 432 - - - -Female 102 - - 102 - - - -
HistoryTotal 82 - - 82 - - - -Male 82 - - 82 - - - -Female - - - - - - - -
Political scienceTotal 346 - - - - - - -Male - - - - - - - -Female 346 - - - - - - -
Sociology and AnthropologyTotal 1,835 - - - 888 - - 201Male 511 - - - - - - 201Female 1,324 - - - 888 - - -
Created by PDF Generator (http://www.alientools.com/), to remove this mark, please buy the software.

Table 6.5 Cont’dRegionTraining status and
Types of TrainingTotal Tigray Afar Amhara Oromia Somalie
Benishangul-Gumuz SNNPR Gambela
PsychologyTotal 385 281 - 105 - - - -Male 385 281 - 105 - - - -Female - - - - - - - -
Civil Engineering/BuildingTotal 626 - - - - - - 280Male - - - - - - - -Female 626 - - - - - - 280
Mechanical EngineeringTotal 287 - - - - - - -Male 287 - - - - - - -Female - - - - - - - -
Electrical EngineeringTotal 391 - - 45 - - - -Male 391 - - 45 - - - -Female - - - - - - - -
Industrial EngineeringTotal - - - - - - - -Male - - - - - - - -Female - - - - - - - -
Municipality Engineering / ArchitectureTotal 44 - - - 44 - - -Male 44 - - - 44 - - -Female - - - - - - - -
Other types of Engineering, Dry Land, Bio-diversity, Hydraulic Engineering Irrigation EngineeringTotal 394 - - - 306 - - -Male 394 - - - 306 - - -Female - - - - - - - -
Automotive TechnologyTotal 122 - - - 122 - - -Male - - - - - - - -Female 122 - - - 122 - - -
Construction TechnologyTotal 1,822 109 - 269 - - - -Male 961 - - 269 - - - -Female 861 109 - - - - - -
Created by PDF Generator (http://www.alientools.com/), to remove this mark, please buy the software.

Table 6.5 Cont’dRegionTraining status and
Types of TrainingTotal Tigray Afar Amhara Oromia Somalie
Benishangul-Gumuz SNNPR Gambela
Drafting technologyTotal 269 - - 269 - - - -Male 269 - - 269 - - - -Female - - - - - - - -
Manufacturing TechnologyTotal - - - - - - - -Male - - - - - - - -Female - - - - - - - -
Metal TechnologyTotal 961 - - 45 360 - - 210Male 615 - - 45 360 - - 210Female 346 - - - - - - -
Veterinary Science, Animal HusbandryTotal 455 - - 109 - - - -Male 455 - - 109 - - - -Female - - - - - - - -
CommunicationTotal - - - - - - - -Male - - - - - - - -Female - - - - - - - -
Power, Energy and others like Instrumentation, Electrical Power Mechanical and Manufacturing PowerTotal 492 - - 89 - - - -Male 492 - - 89 - - - -Female - - - - - - - -
BiologyTotal 790 - - 82 451 - - 257Male - - - - - - - -Female 790 - - 82 451 - - 257
ChemistryTotal 1,100 - - 258 496 - - -Male 709 - - 258 451 - - -Female 392 - - - 46 - - -
GeologyTotal - - - - - - - -Male - - - - - - - -Female - - - - - - - -
Created by PDF Generator (http://www.alientools.com/), to remove this mark, please buy the software.

Table 6.5 Cont’dRegionTraining status and
Types of TrainingTotal Tigray Afar Amhara Oromia Somalie
Benishangul-Gumuz SNNPR Gambela
PhysicsTotal 187 - - - - - - 187Male 187 - - - - - - 187Female - - - - - - - -
MathematicsTotal 791 - 12 45 735 - - -Male 791 - 12 45 735 - - -Female - - - - - - - -
StatisticsTotal 416 - - - - - - -Male - - - - - - - -Female 416 - - - - - - -
DemographyTotal - - - - - - - -Male - - - - - - - -Female - - - - - - - -
Computer Science / Information ScienceTotal 3,923 109 - 742 505 - 33 -Male 2,336 109 - - 51 - - -Female 1,588 - - 742 454 - 33 -
Health and Physical EducationTotal 1,433 - - - 1,433 - - -Male 1,433 - - - 1,433 - - -Female - - - - - - - -
Meteorological ScienceTotal - - - - - - - -Male - - - - - - - -Female - - - - - - - -
Chemical EngineeringTotal - - - - - - - -Male - - - - - - - -Female - - - - - - - -
Textile EngineeringTotal 692 - - - - - - -Male 346 - - - - - - -Female 346 - - - - - - -
Created by PDF Generator (http://www.alientools.com/), to remove this mark, please buy the software.

Table 6.5 Cont’dRegionTraining status and
Types of TrainingTotal Tigray Afar Amhara Oromia Somalie
Benishangul-Gumuz SNNPR Gambela
Purchasing SupplyTotal 1,294 109 - 454 290 - - -Male 295 - - 89 206 - - -Female 999 109 - 365 84 - - -
Software EngineeringTotal - - - - - - - -Male - - - - - - - -Female - - - - - - - -
Home EconomicsTotal 4,284 552 - 1,460 503 - - -Male 1,526 - - 1,168 - - - -Female 2,759 552 - 292 503 - - -
Leather Handicraft TechnologyTotal 1,202 541 - - - - - -Male - - - - - - - -Female 1,202 541 - - - - - -
Decorative Work TrainingTotal 12,500 1,311 - 1,519 1,807 - 20 501Male 787 - - - - - - -Female 11,713 1,311 - 1,519 1,807 - 20 501
Video Photographic TrainingTotal 692 - - - - - - -Male 346 - - - - - - -Female 346 - - - - - - -
PotteryTotal 104 104 - - - - - -Male - - - - - - - -Female 104 104 - - - - - -
WeaveryTotal 829 - - 829 - - - -Male - - - - - - - -Female 829 - - 829 - - - -
Wood Work / CarpentryTotal 4,402 255 - 1,313 681 - - 258Male 3,492 255 - 1,055 543 - - 90Female 910 - - 258 137 - - 168
Created by PDF Generator (http://www.alientools.com/), to remove this mark, please buy the software.

Table 6.5 Cont’dRegionTraining status and
Types of TrainingTotal Tigray Afar Amhara Oromia Somalie
Benishangul-Gumuz SNNPR Gambela
Electrical WorkTotal 8,291 436 36 2,394 1,928 - 43 420Male 5,029 212 36 291 1,815 - - 420Female 3,262 224 - 2,103 113 - 43 -
Metal Welding and BindingTotal 1,826 667 - 750 225 - - -Male 1,398 667 - 477 168 - - -Female 428 - - 274 57 - - -
Auto Mechanics Including Motorcycle, Aircraft MaintenanceTotal 4,214 937 - 380 645 - - 275Male 3,617 341 - 380 645 - - 275Female 596 596 - - - - - -
MasonTotal 3,384 904 12 - 195 - - 280Male 2,092 623 12 - 155 - - -Female 1,293 281 - - 40 - - 280
TypingTotal 5,288 650 - 430 2,172 - 27 -Male - - - - - - - -Female 5,288 650 - 430 2,172 - 27 -
TailoringTotal 5,838 1,389 - 1,165 1,025 - - 234Male 372 254 - - 118 - - -Female 5,466 1,135 - 1,165 907 - - 234
DriverTotal 22,026 963 - 2,752 9,031 387 94 1,095Male 20,678 748 - 2,676 9,031 317 94 909Female 1,348 215 - 75 - 70 - 187
Development AgentTotal 692 - - - - - - -Male 346 - - - - - - -Female 346 - - - - - - -
Traditional Birth AttendantTotal 102 - - - 102 - - -Male - - - - - - - -Female 102 - - - 102 - - -
Created by PDF Generator (http://www.alientools.com/), to remove this mark, please buy the software.

Table 6.5 Cont’dRegionTraining status and
Types of TrainingTotal Tigray Afar Amhara Oromia Somalie
Benishangul-Gumuz SNNPR Gambela
Computer Applications and UsageTotal 10,260 270 37 848 1,304 758 - 787Male 2,052 - - 267 - - - -Female 8,208 270 37 582 1,304 758 - 787
Lower Scale Training of Agriculture (from Agarfa, Ardaeta and Baco)Total 42 - - - 42 - - -Male - - - - - - - -Female 42 - - - 42 - - -
Hotels and TourismTotal 22,074 1,267 12 2,459 6,790 - 24 3,440Male 5,317 577 - 223 1,412 - - 1,262Female 16,757 691 12 2,236 5,378 - 24 2,178
PoliceTotal 1,701 - - - 453 - - 421Male 1,433 - - - 185 - - 421Female 268 - - - 268 - - -
MilitaryTotal 1,525 254 - 196 41 - - 210Male 921 254 - 148 41 - - -Female 604 - - 47 - - - 210
CobblestoneTotal 3,569 1,098 - 931 904 50 - -Male 1,020 440 - 256 233 - - -Female 2,548 658 - 675 672 50 - -
EmbroideryTotal 2,553 431 - 319 990 - - 107Male - - - - - - - -Female 2,553 431 - 319 990 - - 107
PlumberyTotal 1,666 - - - 599 - - 375Male 1,666 - - - 599 - - 375Female - - - - - - - -
Created by PDF Generator (http://www.alientools.com/), to remove this mark, please buy the software.

Table 6.5 Cont’dRegionTraining status and
Types of TrainingTotal Tigray Afar Amhara Oromia Somalie
Benishangul-Gumuz SNNPR Gambela
Other Senior and Junior Professions / SpecifiedTotal 98,056 5,285 335 18,816 36,019 392 378 10,542Male 41,660 1,889 48 6,455 15,338 240 151 4,490Female 56,396 3,395 287 12,361 20,682 152 227 6,052
Other Skilled and Technical Professions / SpecifiedTotal 27,954 2,957 25 5,511 7,401 472 40 1,182Male 10,834 1,058 25 1,258 3,134 472 40 187Female 17,121 1,899 - 4,253 4,267 - - 996
Not Stated for type of trainingTotal 779 109 - 69 602 - - -Male 177 109 - 69 - - - -Female 602 - - - 602 - - -
Created by PDF Generator (http://www.alientools.com/), to remove this mark, please buy the software.

Table 6.6 Currently Unemployed Populations of Urban Areas Aged Ten Years and Above byAge Group, Sex and Marital Status, COUNTRY TOTAL: 2012
Marital StatusAge Group and Sex
All PersonsNever
Married Married Divorced Widowed SeparatedLive
togetherNot
StatedAll Ages
Total 1,218,574 540,337 536,678 55,232 52,852 22,331 10,964 179Male 410,381 279,311 106,270 9,789 7,588 4,985 2,260 179Female 808,193 261,026 430,408 45,444 45,264 17,347 8,704 -
10-14Total 24,618 24,618 - - - - - -Male 11,787 11,787 - - - - - -Female 12,831 12,831 - - - - - -
15-19Total 136,069 103,143 29,464 1,696 144 908 714 -Male 51,396 48,936 2,150 - - - 310 -Female 84,673 54,207 27,314 1,696 144 908 405 -
20-24Total 361,492 227,064 116,036 8,685 853 3,654 5,200 -Male 127,407 117,500 8,089 791 - 306 722 -Female 234,085 109,564 107,947 7,894 853 3,348 4,479 -
25-29Total 268,787 117,700 129,269 12,039 4,044 3,887 1,847 -Male 79,619 62,988 13,717 1,213 652 779 269 -Female 189,168 54,711 115,552 10,826 3,392 3,108 1,578 -
30-34Total 128,378 41,479 73,325 5,611 3,003 3,692 1,089 179Male 39,484 23,760 12,793 1,570 210 685 287 179Female 88,893 17,719 60,532 4,041 2,793 3,006 802 -
35-39Total 98,500 15,447 65,810 7,133 5,730 3,204 1,176 -Male 26,203 7,219 16,102 1,195 485 1,203 - -Female 72,297 8,229 49,708 5,939 5,245 2,001 1,176 -
40-44Total 58,078 5,289 38,788 6,782 6,189 838 193 -Male 16,589 2,538 10,879 1,561 1,317 189 104 -Female 41,489 2,751 27,908 5,221 4,872 648 88 -
45-49Total 43,186 2,508 27,981 1,845 8,019 2,743 90 -Male 12,716 1,782 9,555 604 612 163 - -Female 30,470 726 18,426 1,241 7,407 2,580 90 -
50-54Total 36,225 1,695 19,186 5,969 8,229 1,059 87 -Male 12,971 1,408 9,325 1,214 398 626 - -Female 23,254 287 9,862 4,755 7,831 432 87 -
55-59Total 24,471 324 15,299 1,865 6,255 246 482 -Male 9,677 324 7,108 430 1,206 127 482 -Female 14,794 - 8,191 1,435 5,049 119 - -
60-64Total 18,566 338 10,121 2,841 3,949 1,230 87 -Male 8,023 338 6,567 722 274 35 87 -Female 10,544 - 3,554 2,119 3,675 1,195 - -
65+Total 20,205 732 11,399 767 6,437 870 - -Male 14,510 732 9,985 490 2,434 870 - -Female 5,694 - 1,414 277 4,003 - - -
Created by PDF Generator (http://www.alientools.com/), to remove this mark, please buy the software.

Table 6.7 Currently Unemployed Population of Urban Areas Aged Ten Years and Above byRegion, Sex and Marital Status: 2012
Marital StatusRegion and Sex
All PersonsNever
Married Married Divorced Widowed SeparatedLive
togetherNot
StatedCOUNTRY TOTAL
Total 1,218,574 540,337 536,678 55,232 52,852 22,331 10,964 179Male 410,381 279,311 106,270 9,789 7,588 4,985 2,260 179Female 808,193 261,026 430,408 45,444 45,264 17,347 8,704 -
TIGRAY REGIONTotal 94,756 34,291 47,652 7,737 4,180 688 208 -Male 25,996 16,803 7,361 578 785 364 104 -Female 68,761 17,489 40,291 7,159 3,395 324 103 -
AFFAR REGIONTotal 9,846 1,914 5,767 945 1,125 24 72 -Male 2,425 1,244 966 179 - - 36 -Female 7,421 670 4,801 766 1,125 24 36 -
AMHARA REGIONTotal 209,533 85,831 98,694 13,179 9,822 1,202 806 -Male 68,229 45,735 19,075 1,965 916 45 494 -Female 141,304 40,096 79,619 11,214 8,905 1,157 311 -
OROMIA REGIONTotal 330,723 148,170 147,781 9,524 12,343 6,455 6,450 -Male 115,759 80,703 28,922 2,115 1,201 2,091 728 -Female 214,964 67,467 118,859 7,409 11,142 4,365 5,721 -
SOMALI REGIONTotal 34,427 8,574 22,803 967 749 1,282 51 -Male 12,124 5,059 6,716 110 88 101 51 -Female 22,302 3,515 16,088 857 661 1,181 - -
BENISHANGUL GUMUZREGION
Total 5,505 1,981 3,210 137 115 62 - -Male 1,897 1,378 519 - - - - -Female 3,609 603 2,690 137 115 62 - -
SNNP REGIONTotal 119,176 48,297 59,002 4,027 6,229 1,116 327 179Male 40,404 26,272 11,475 1,375 300 639 163 179Female 78,771 22,025 47,527 2,652 5,929 476 163 -
GAMBELLA REGIONTotal 3,020 569 2,261 116 47 27 - -Male 484 169 315 - - - - -Female 2,536 400 1,946 116 47 27 - -
HARARI REGIONTotal 6,973 2,313 3,572 196 573 320 - -Male 2,086 1,194 762 - - 130 - -Female 4,887 1,119 2,809 196 573 190 - -
ADDIS ABABA CITYADMINISTRATION
Total 374,626 194,616 135,114 17,106 15,670 10,545 1,576 -Male 130,686 94,181 27,027 3,380 4,059 1,441 597 -Female 243,940 100,434 108,086 13,726 11,611 9,104 979 -
DIRE DAWAADMINISTRATION
Total 29,988 13,780 10,824 1,299 1,999 610 1,476 -Male 10,291 6,573 3,133 87 239 173 87 -Female 19,697 7,208 7,691 1,212 1,760 437 1,390 -
Created by PDF Generator (http://www.alientools.com/), to remove this mark, please buy the software.

Created by PDF Generator (http://www.alientools.com/), to remove this mark, please buy the software.
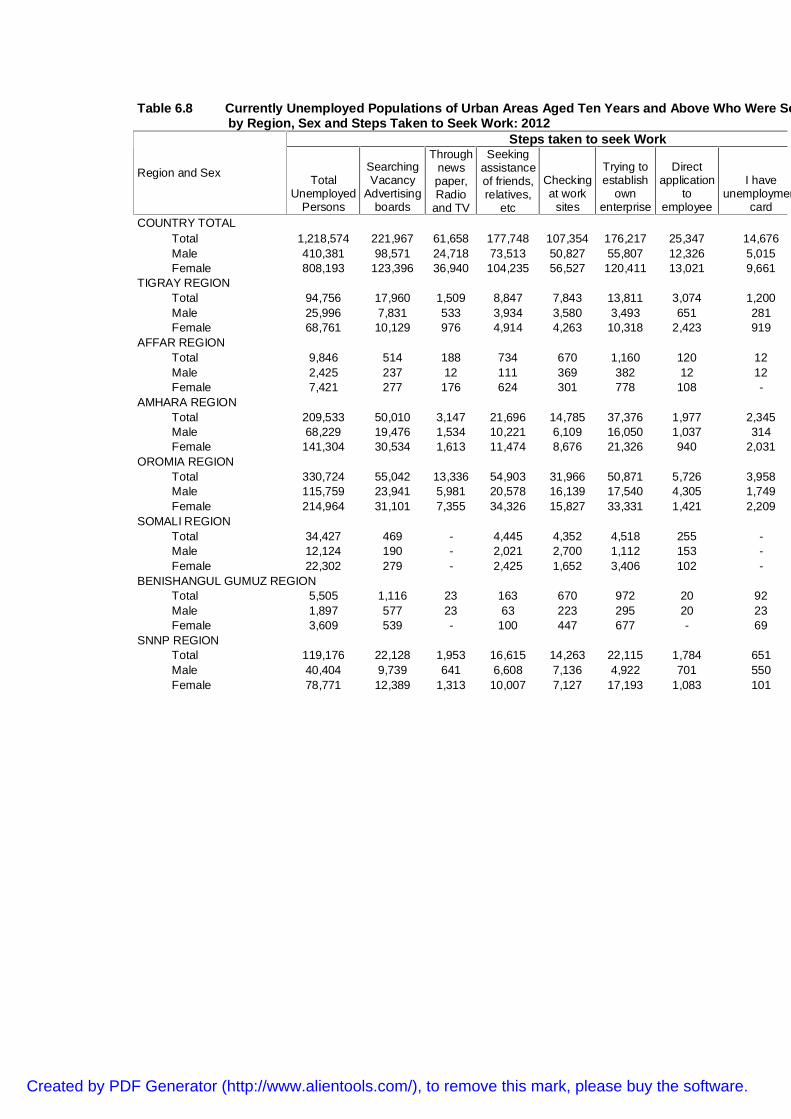
Table 6.8 Currently Unemployed Populations of Urban Areas Aged Ten Years and Above Who Were Seekingby Region, Sex and Steps Taken to Seek Work: 2012
Steps taken to seek Work
Region and Sex TotalUnemployed
Persons
SearchingVacancy
Advertisingboards
Throughnewspaper,Radio
and TV
Seekingassistanceof friends,relatives,
etc
Checkingat work
sites
Trying toestablish
ownenterprise
Directapplication
toemployee
I haveunemployment
cardCOUNTRY TOTAL
Total 1,218,574 221,967 61,658 177,748 107,354 176,217 25,347 14,676Male 410,381 98,571 24,718 73,513 50,827 55,807 12,326 5,015Female 808,193 123,396 36,940 104,235 56,527 120,411 13,021 9,661
TIGRAY REGIONTotal 94,756 17,960 1,509 8,847 7,843 13,811 3,074 1,200Male 25,996 7,831 533 3,934 3,580 3,493 651 281Female 68,761 10,129 976 4,914 4,263 10,318 2,423 919
AFFAR REGIONTotal 9,846 514 188 734 670 1,160 120 12Male 2,425 237 12 111 369 382 12 12Female 7,421 277 176 624 301 778 108 -
AMHARA REGIONTotal 209,533 50,010 3,147 21,696 14,785 37,376 1,977 2,345Male 68,229 19,476 1,534 10,221 6,109 16,050 1,037 314Female 141,304 30,534 1,613 11,474 8,676 21,326 940 2,031
OROMIA REGIONTotal 330,724 55,042 13,336 54,903 31,966 50,871 5,726 3,958Male 115,759 23,941 5,981 20,578 16,139 17,540 4,305 1,749Female 214,964 31,101 7,355 34,326 15,827 33,331 1,421 2,209
SOMALI REGIONTotal 34,427 469 - 4,445 4,352 4,518 255 -Male 12,124 190 - 2,021 2,700 1,112 153 -Female 22,302 279 - 2,425 1,652 3,406 102 -
BENISHANGUL GUMUZ REGIONTotal 5,505 1,116 23 163 670 972 20 92Male 1,897 577 23 63 223 295 20 23Female 3,609 539 - 100 447 677 - 69
SNNP REGIONTotal 119,176 22,128 1,953 16,615 14,263 22,115 1,784 651Male 40,404 9,739 641 6,608 7,136 4,922 701 550Female 78,771 12,389 1,313 10,007 7,127 17,193 1,083 101
Created by PDF Generator (http://www.alientools.com/), to remove this mark, please buy the software.

Table 6.8 Cont’dSteps taken to seek Work
Region and SexTotal
UnemployedPersons
SearchingVacancy
Advertisingboards
Throughnewspaper,Radio
and TV
Seekingassistanceof friends,relatives,
etc
Checkingat work
sites
Trying toestablish
ownenterprise
Directapplication
toemployee
I haveunemployment
cardGAMBELLA REGION
Total 3,020 349 - 91 245 482 146 88Male 484 27 - 62 125 113 27 -Female 2,536 322 - 29 120 369 119 88
HARARI REGIONTotal 6,973 1,265 93 689 929 1,384 147 -Male 2,086 517 43 493 239 195 49 -Female 4,887 748 49 196 690 1,189 98 -
ADDIS ABABA CITYADMIISTRATION
Total 374,626 67,153 41,233 65,387 27,051 40,057 11,423 6,331Male 130,686 33,680 15,864 27,262 11,996 10,831 4,960 2,086Female 243,940 33,474 25,369 38,126 15,054 29,226 6,463 4,245
DIRE DAWAADMINISTRATION
Total 29,988 5,961 176 4,176 4,581 3,472 675 -Male 10,291 2,357 87 2,161 2,211 874 412 -Female 19,697 3,604 90 2,015 2,370 2,598 263 -
Created by PDF Generator (http://www.alientools.com/), to remove this mark, please buy the software.
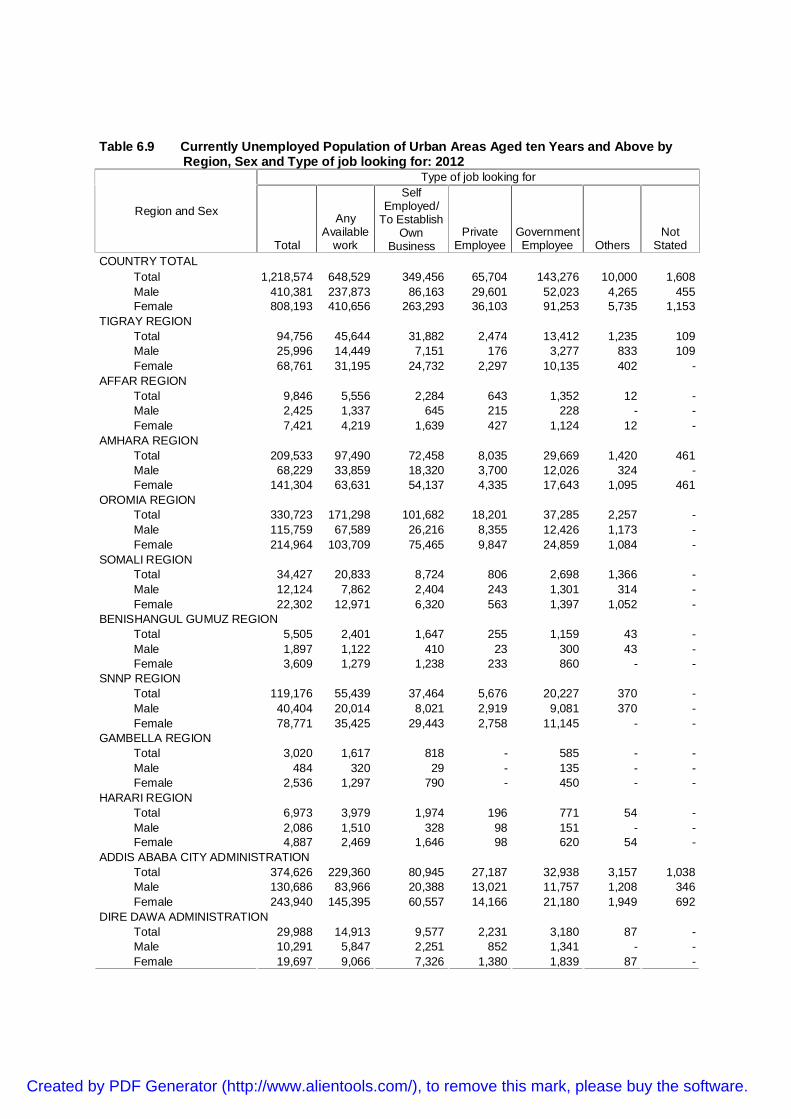
Table 6.9 Currently Unemployed Population of Urban Areas Aged ten Years and Above byRegion, Sex and Type of job looking for: 2012
Type of job looking for
Region and Sex
Total
AnyAvailable
work
SelfEmployed/
To EstablishOwn
BusinessPrivate
EmployeeGovernmentEmployee Others
NotStated
COUNTRY TOTALTotal 1,218,574 648,529 349,456 65,704 143,276 10,000 1,608Male 410,381 237,873 86,163 29,601 52,023 4,265 455Female 808,193 410,656 263,293 36,103 91,253 5,735 1,153
TIGRAY REGIONTotal 94,756 45,644 31,882 2,474 13,412 1,235 109Male 25,996 14,449 7,151 176 3,277 833 109Female 68,761 31,195 24,732 2,297 10,135 402 -
AFFAR REGIONTotal 9,846 5,556 2,284 643 1,352 12 -Male 2,425 1,337 645 215 228 - -Female 7,421 4,219 1,639 427 1,124 12 -
AMHARA REGIONTotal 209,533 97,490 72,458 8,035 29,669 1,420 461Male 68,229 33,859 18,320 3,700 12,026 324 -Female 141,304 63,631 54,137 4,335 17,643 1,095 461
OROMIA REGIONTotal 330,723 171,298 101,682 18,201 37,285 2,257 -Male 115,759 67,589 26,216 8,355 12,426 1,173 -Female 214,964 103,709 75,465 9,847 24,859 1,084 -
SOMALI REGIONTotal 34,427 20,833 8,724 806 2,698 1,366 -Male 12,124 7,862 2,404 243 1,301 314 -Female 22,302 12,971 6,320 563 1,397 1,052 -
BENISHANGUL GUMUZ REGIONTotal 5,505 2,401 1,647 255 1,159 43 -Male 1,897 1,122 410 23 300 43 -Female 3,609 1,279 1,238 233 860 - -
SNNP REGIONTotal 119,176 55,439 37,464 5,676 20,227 370 -Male 40,404 20,014 8,021 2,919 9,081 370 -Female 78,771 35,425 29,443 2,758 11,145 - -
GAMBELLA REGIONTotal 3,020 1,617 818 - 585 - -Male 484 320 29 - 135 - -Female 2,536 1,297 790 - 450 - -
HARARI REGIONTotal 6,973 3,979 1,974 196 771 54 -Male 2,086 1,510 328 98 151 - -Female 4,887 2,469 1,646 98 620 54 -
ADDIS ABABA CITY ADMINISTRATIONTotal 374,626 229,360 80,945 27,187 32,938 3,157 1,038Male 130,686 83,966 20,388 13,021 11,757 1,208 346Female 243,940 145,395 60,557 14,166 21,180 1,949 692
DIRE DAWA ADMINISTRATIONTotal 29,988 14,913 9,577 2,231 3,180 87 -Male 10,291 5,847 2,251 852 1,341 - -Female 19,697 9,066 7,326 1,380 1,839 87 -
Created by PDF Generator (http://www.alientools.com/), to remove this mark, please buy the software.

Created by PDF Generator (http://www.alientools.com/), to remove this mark, please buy the software.

Table 6.10 Currently Unemployed Populations of Urban Areas Aged Ten Years and Above by Age Group, Sex, Previous WorkExperience and Duration of Unemployment - Country Total: 2012
Unemployed Duration of Unemployment (In Months)Age Groupand Sex Total
UnemployedPersons
UnemployedWithout
WorkExperience
UnemployedWith WorkExperience
NotStated < 1 1-6 7-12 13-24 25-36 37-48 49-60
All Ages
Total 1,218,574 650,742 565,020 2,812 116,520 368,296 291,522 166,740 72,322 46,261 20,092 17,069
Male 410,381 235,185 174,695 501 31,729 144,060 107,715 50,953 22,286 12,384 7,096Female 808,193 415,558 390,325 2,311 84,790 224,236 183,808 115,788 50,035 33,877 12,997 13,99510-14
Total 24,618 8,985 15,633 - 7,694 9,914 4,047 386 - 923 314
Male 11,787 4,127 7,660 - 3,844 4,471 1,749 191 - 692 314Female 12,831 4,858 7,973 - 3,850 5,443 2,299 195 - 231 -15-19
Total 136,069 46,046 89,677 346 16,321 48,316 38,421 22,003 4,232 1,814 -
Male 51,396 18,443 32,953 - 4,303 20,743 13,593 8,328 2,507 140 -Female 84,673 27,603 56,724 346 12,018 27,573 24,828 13,675 1,725 1,674 -20-24
Total 361,492 159,672 201,428 393 29,790 115,878 98,108 55,553 24,147 14,139 3,744
Male 127,407 55,054 72,353 - 8,522 42,825 36,666 18,801 7,126 4,440 2,556Female 234,085 104,618 129,075 393 21,268 73,053 61,442 36,752 17,021 9,698 1,18825-29
Total 268,787 147,922 120,264 601 21,015 80,991 63,659 40,408 17,667 11,267 5,799
Male 79,619 44,419 35,091 109 4,626 31,089 20,132 10,737 4,458 2,731 1,023Female 189,168 103,503 85,173 492 16,388 49,902 43,528 29,671 13,210 8,537 4,77630-34
Total 128,378 83,150 44,516 712 11,756 36,761 24,838 17,590 7,962 6,221 2,126
Male 39,484 29,393 10,044 46 3,508 14,134 8,839 4,538 1,836 1,166 483Female 88,893 53,757 34,471 665 8,248 22,627 15,999 13,052 6,126 5,055 1,643
Created by PDF Generator (http://www.alientools.com/), to remove this mark, please buy the software.

35-39
Total 98,500 67,666 30,488 346 8,925 28,546 20,859 10,206 5,253 4,250 2,488
Male 26,203 21,964 3,893 346 1,589 10,018 6,696 2,489 1,352 1,087 588Female 72,297 45,702 26,595 - 7,336 18,528 14,163 7,717 3,901 3,163 1,90040-44
Total 58,078 35,989 22,089 - 6,094 12,959 13,314 7,636 3,964 2,778 1,276
Male 16,589 13,586 3,003 - 270 4,737 5,823 1,934 805 476 442
Female 41,489 22,403 19,086 - 5,824 8,222 7,491 5,702 3,159 2,302 834
Table 6.10 Cont’dUnemployed Duration of Unemployment (In Months)
Age Groupand Sex Total
UnemployedPersons
UnemployedWithout
WorkExperience
UnemployedWith WorkExperience
NotStated < 1 1-6 7-12 13-24 25-36 37-48 49-60
45-49
Total 43,186 27,982 15,204 - 4,801 9,679 10,388 4,170 1,541 1,134 1,988
Male 12,716 10,097 2,619 - 1,162 3,630 4,323 1,124 87 620 287
Female 30,470 17,886 12,584 - 3,640 6,049 6,065 3,045 1,455 514 1,70050-54
Total 36,225 26,056 10,100 69 2,186 9,801 6,993 3,448 2,886 1,280 763
Male 12,971 10,322 2,649 - 366 4,704 3,582 1,256 1,116 40 425
Female 23,254 15,735 7,451 69 1,820 5,097 3,411 2,192 1,770 1,240 33855-59
Total 24,471 16,148 8,323 - 3,169 5,339 5,239 2,495 2,897 638 215
Male 9,677 7,111 2,565 - 1,210 1,458 2,322 978 1,358 50 -
Female 14,794 9,037 5,757 - 1,959 3,881 2,917 1,517 1,538 588 21560-64
18,566 14,794 3,426 346 2,452 4,560 1,848 1,718 563 914 764
Created by PDF Generator (http://www.alientools.com/), to remove this mark, please buy the software.

Total
Male 8,023 7,870 153 - 458 2,672 1,157 493 433 39 405
Female 10,544 6,924 3,273 346 1,994 1,888 691 1,225 130 875 35965+
Total 20,205 16,331 3,874 - 2,317 5,554 3,807 1,127 1,209 904 616
Male 14,510 12,799 1,711 - 1,872 3,580 2,834 83 1,209 904 572
Female 5,694 3,532 2,163 - 445 1,973 973 1,045 - - 44
Created by PDF Generator (http://www.alientools.com/), to remove this mark, please buy the software.

Table 6.11 Currently Unemployed Populations of Urban Areas Aged Ten Years and Above by Region, Sex, Previous Work Experienceand Duration of Unemployment (In Months) : 2012
Unemployed Duration of Unemployment (In Months)
Region and Sex TotalUnemployed
Persons
UnemployedWithout
WorkExperience
UnemployedWith WorkExperience
NotStated < 1 1-6 7-12 13-24 25-36 37-48 49-60
COUNTRY TOTALTotal 1,218,574 650,742 565,020 2,812 116,520 368,296 291,522 166,740 72,322 46,261 20,092Male 410,381 235,185 174,695 501 31,729 144,060 107,715 50,953 22,286 12,384 7,096Female 808,193 415,558 390,325 2,311 84,790 224,236 183,808 115,788 50,035 33,877 12,997
TIGRAY REGIONTotal 94,756 48,322 45,901 533 5,072 27,504 19,044 14,864 7,884 2,068 920Male 25,996 15,635 10,252 109 1,048 9,933 5,482 4,048 1,566 814 705Female 68,761 32,687 35,649 424 4,024 17,572 13,562 10,816 6,319 1,254 215
AFFAR REGIONTotal 9,846 5,905 3,941 - 835 2,379 3,327 1,292 631 156 181Male 2,425 2,019 406 - 203 357 882 349 191 156 -Female 7,421 3,886 3,535 - 631 2,022 2,445 944 440 - 181
AMHARA REGIONTotal 209,533 102,717 106,240 576 28,180 69,359 48,436 28,891 6,983 7,723 3,496Male 68,229 38,804 29,378 46 6,638 25,833 18,520 6,999 2,131 2,906 1,751Female 141,304 63,913 76,861 530 21,542 43,525 29,916 21,892 4,853 4,817 1,745
OROMIA REGIONTotal 330,723 185,199 145,524 - 36,973 117,651 76,984 44,048 15,420 9,560 5,302Male 115,759 68,964 46,796 - 10,062 51,151 24,277 17,160 3,790 1,473 1,617Female 214,964 116,235 98,729 - 26,912 66,500 52,707 26,888 11,630 8,088 3,685
SOMALI REGIONTotal 34,427 15,905 18,522 - 5,576 7,579 9,538 3,884 1,656 1,064 679Male 12,124 6,369 5,755 - 1,294 2,638 3,827 1,548 435 173 365Female 22,302 9,535 12,767 - 4,282 4,941 5,711 2,335 1,221 891 314
BENISHANGUL GUMUZ REGIONTotal 5,505 3,224 2,281 - 1,069 2,019 989 653 239 284 20Male 1,897 1,165 732 - 446 752 324 85 40 197 -Female 3,609 2,059 1,550 - 623 1,266 665 568 200 87 20
SNNP REGIONTotal 119,176 61,259 57,598 319 9,043 36,470 33,874 13,160 8,860 6,796 979Male 40,404 19,941 20,464 - 2,885 15,547 12,312 3,431 2,182 2,464 96Female 78,771 41,318 37,134 319 6,158 20,923 21,563 9,728 6,678 4,333 884
Created by PDF Generator (http://www.alientools.com/), to remove this mark, please buy the software.

Table 6.11 Cont’dUnemployed Duration of Unemployment (In Months)
Region and Sex TotalUnemployed
Persons
UnemployedWithout
WorkExperience
UnemployedWith WorkExperience
NotStated < 1 1-6 7-12 13-24 25-36 37-48 49-60
GAMBELLA REGIONTotal 3,020 1,280 1,740 - 212 1,692 477 137 110 135 113Male 484 279 205 - 27 260 41 54 47 27 28Female 2,536 1,001 1,535 - 185 1,433 437 83 62 108 85
HARARI REGIONTotal 6,973 4,157 2,816 - 489 2,104 1,208 1,383 1,094 286 43Male 2,086 1,443 644 - 98 631 287 602 347 41Female 4,887 2,715 2,172 - 392 1,473 920 782 747 245 43
ADDIS ABABA CITYADMINISTRTAION
Total 374,626 202,880 170,361 1,384 23,318 94,509 92,404 54,581 27,033 16,968 7,686Male 130,686 73,861 56,479 346 7,798 34,309 39,303 15,302 10,945 3,612 2,360Female 243,940 129,019 113,883 1,038 15,520 60,200 53,101 39,279 16,088 13,356 5,326
DIRE DAWAADMINISTRATION
Total 29,988 19,894 10,094 - 5,752 7,030 5,241 3,847 2,411 1,223 672Male 10,291 6,706 3,585 - 1,230 2,649 2,460 1,374 613 523 173Female 19,697 13,188 6,510 - 4,522 4,381 2,781 2,473 1,799 700 499
Created by PDF Generator (http://www.alientools.com/), to remove this mark, please buy the software.

Table 6.12 Currently Unemployed Population of Urban Areas Aged Ten Years and Above by Region, Sex, Types of Problem Faced toEstablish Own Business: 2012
Problem Faced to start Own Business
Region and Sex
Total
I haveno
problem
Shortageof
FinanceLack ofTraining
Problemof workplace
Lack ofFinance
andTraining
Lack ofworkingPlaceand
Finance
Lack /Absence
of License
Shortage /Absence ofEquipment
Don'tKnow
COUNTRY TOTALTotal 350,718 44,007 188,694 5,068 28,886 9,399 36,773 1,373 710 2,583Male 86,618 17,648 42,364 811 4,716 4,041 8,585 460 - 703Female 264,100 26,359 146,330 4,257 24,170 5,357 28,189 913 710 1,879
TIGRAY REGIONTotal 31,991 3,967 18,293 896 648 1,147 3,258 - - 155Male 7,260 1,023 5,335 251 102 105 109 - -Female 24,732 2,944 12,958 645 547 1,043 3,149 - - 155
AFFAR REGIONTotal 2,284 12 1,767 - 62 - 156 - -Male 645 12 451 - 38 - - - -Female 1,639 - 1,316 - 24 - 156 - -
AMHARA REGIONTotal 72,919 4,999 40,196 888 7,217 1,519 13,736 483 -Male 18,320 2,365 9,202 169 1,837 780 3,680 - -Female 54,599 2,634 30,994 719 5,380 738 10,056 483 -
OROMIA REGIONTotal 101,682 13,960 59,824 1,522 7,145 1,897 6,902 407 304 531Male 26,216 6,019 15,198 51 905 1,121 834 - -Female 75,465 7,941 44,626 1,471 6,239 775 6,068 407 304 531
SOMALI REGIONTotal 8,724 1,551 5,492 161 832 - 373 - -Male 2,404 629 1,564 161 - - 51 - -Female 6,320 923 3,928 - 832 - 323 - -
BENISHANGUL GUMUZ REGIONTotal 1,647 281 451 31 95 270 191 23 -Male 410 95 62 - - 119 54 - -Female 1,238 185 390 31 95 151 138 23 -
SNNP REGIONTotal 37,464 4,602 20,247 1,137 2,630 1,525 1,602 114 - 210Male 8,021 1,486 3,086 179 - 725 861 114 -Female 29,443 3,116 17,161 958 2,630 800 741 - - 210
Created by PDF Generator (http://www.alientools.com/), to remove this mark, please buy the software.

Table 6.12 Cont’dProblem Faced to start Own Business
Region and Sex
Total
I haveno
problem
Shortageof
FinanceLack ofTraining
Problemof workplace
Lack ofFinance
andTraining
Lack ofworkingPlaceand
Finance
Lack /Absence
of License
Shortage /Absence ofEquipment
Don'tKnow
GAMBELLA REGIONTotal 818 136 515 - 33 33 33 - -Male 29 - 29 - - - - - -Female 790 136 486 - 33 33 33 - -
HARARI REGIONTotal 1,974 288 884 - 477 - 98 - 49Male 328 - 198 - 41 - - - -Female 1,646 288 685 - 436 - 98 - 49
ADDIS ABABA CITYADMINISTRATION
Total 81,638 13,337 35,632 346 9,045 2,769 9,817 346 357 1,427Male 20,734 5,672 6,453 - 1,707 1,038 2,737 346 - 703Female 60,904 7,665 29,179 346 7,338 1,730 7,081 - 357 724
DIRE DAWAADMINISTRATION
Total 9,577 875 5,394 87 701 239 607 - - 260Male 2,251 347 786 - 87 152 260 - -Female 7,326 528 4,608 87 615 87 347 - - 260
Created by PDF Generator (http://www.alientools.com/), to remove this mark, please buy the software.