the experience of gambling and its role in problem gambling
TRANSCRIPT
This article was downloaded by: [University of Connecticut]On: 11 October 2014, At: 13:48Publisher: RoutledgeInforma Ltd Registered in England and Wales Registered Number: 1072954 Registered office: Mortimer House,37-41 Mortimer Street, London W1T 3JH, UK
International Gambling StudiesPublication details, including instructions for authors and subscription information:http://www.tandfonline.com/loi/rigs20
The Experience of Gambling and its Role in ProblemGamblingNigel E. Turner a , Masood Zangeneh a & Nina Littman-Sharp ba Social, Prevention and Health Policy Research Department , The Centre for Addiction andMental Health , Toronto, Canadab Problem Gambling Service , The Centre for Addiction and Mental Health , Toronto, CanadaPublished online: 17 Feb 2007.
To cite this article: Nigel E. Turner , Masood Zangeneh & Nina Littman-Sharp (2006) The Experience of Gambling and its Rolein Problem Gambling, International Gambling Studies, 6:2, 237-266, DOI: 10.1080/14459790600928793
To link to this article: http://dx.doi.org/10.1080/14459790600928793
PLEASE SCROLL DOWN FOR ARTICLE
Taylor & Francis makes every effort to ensure the accuracy of all the information (the “Content”) containedin the publications on our platform. However, Taylor & Francis, our agents, and our licensors make norepresentations or warranties whatsoever as to the accuracy, completeness, or suitability for any purpose of theContent. Any opinions and views expressed in this publication are the opinions and views of the authors, andare not the views of or endorsed by Taylor & Francis. The accuracy of the Content should not be relied upon andshould be independently verified with primary sources of information. Taylor and Francis shall not be liable forany losses, actions, claims, proceedings, demands, costs, expenses, damages, and other liabilities whatsoeveror howsoever caused arising directly or indirectly in connection with, in relation to or arising out of the use ofthe Content.
This article may be used for research, teaching, and private study purposes. Any substantial or systematicreproduction, redistribution, reselling, loan, sub-licensing, systematic supply, or distribution in anyform to anyone is expressly forbidden. Terms & Conditions of access and use can be found at http://www.tandfonline.com/page/terms-and-conditions

The Experience of Gambling and its Role in Problem
Gambling
NIGEL E. TURNER,1 MASOOD ZANGENEH1 &NINA LITTMAN-SHARP2
1Social, Prevention and Health Policy Research Department, The Centre for Addiction and Mental
Health, Toronto, Canada; 2Problem Gambling Service, The Centre for Addiction and Mental Health,
Toronto, Canada
ABSTRACT This paper reports on the results of a psychological study conducted in Ontario,
Canada, that attempted to answer the question of why some people develop gambling problems while
others do not. A group of social gamblers (n ¼ 38), sub-clinical problem gamblers (n ¼ 33) and
pathological gamblers (n ¼ 34) completed a battery of questionnaires. Compared to non-problem
gamblers, pathological gamblers were more likely to report experiencing big wins early in their
gambling career, stressful life events, impulsivity, depression, using escape to cope with stress and a
poorer understanding of random events. We grouped these variables into three risk factors:
cognitive/experiential, emotional and impulsive and tested the extent to which each risk factor could
differentiate non-problem and pathological gamblers. Each risk factor correctly identified about three-
quarters of the pathological gamblers. More than half (53%) of the pathological gamblers had elevated
scores on all three risk factors. Interestingly, 60% of the sub-clinical cases had elevated scores on only
one risk factor. The results are interpreted in terms of a bio-psycho-social model of gambling
addiction.
Introduction
Overall 80% of adults in Canada report having gambled at least once in the past 6
months (Turner et al., 1999, 2005). In North America between 1 and 2% of the
general population are identified as having a gambling pathology (Shaffer et al.,
1999; Room et al., 1999). Pathological gambling is classified as an impulse control
disorder by the Diagnostic and Statistical Manual (DSM-IV) of the American
Psychiatric Association (1994). It is characterized by a pre-occupation with
gambling, chasing (increased bets to win back lost money), gambling to escape, an
inability to cut back, a need to place larger bets to achieve the same thrill
(tolerance), jeopardizing relationships or jobs in order to gamble, borrowing
money and involvement in criminal activities to feed the gambling habit. In
addition, some individuals gamble problematically (e.g. two or three symptoms)
but do not meet the DSM-IV criteria (five or more symptoms) for a clinical
diagnosis. In this paper we will use the phrase ‘sub-clinical problem gamblers’ to
refer to those who have experienced some problems but do not meet the clinical
criteria for pathological gambling and pathological gamblers to refer to people
who have clinically significant symptoms.
ISSN 1445-9795 print/1479-4276 online/06/020237-30 q 2006 Taylor & FrancisDOI: 10.1080/14459790600928793
International Gambling Studies, Vol. 6, No. 2, 237–266, November 2006
Dow
nloa
ded
by [
Uni
vers
ity o
f C
onne
ctic
ut]
at 1
3:48
11
Oct
ober
201
4
This paper examines correlates of pathological gambling with the goal ofproviding a better understanding of risk factors that may lead to pathologicalgambling. Numerous theories have been proposed to account for thedevelopment of pathological gambling (Griffiths, 1995; Shaffer, 2003; Peele,2003; Blanco, 2006). Pathological gambling used to be viewed as a moralweakness, a sin or a crime. In the 20th century the focus shifted away fromblaming pathological gamblers for their problem to viewing it as a disease. Thisdisease model has taken on many forms but generally focuses on pre-existing riskfactors including personality disorders, mood disorders (Gupta and Derevensky,1998; Jacobs, 1986, 1988) and more recently genetic risk factors (Blum et al., 2000).In recent years there has been emerging debate about where pathologicalgambling should be placed in terms of mental disorders (Shaffer, 2003; Dickerson,2003; Peele, 2003; Blanco, 2006). Shaffer (2003) for example has argued that the highrate of comorbidity suggests that pathological gambling belongs to a syndromeof related disorders linked by a common biological vulnerability. Peele (2003),however, has argued that problematic gambling is not a disease but ratheran addiction that results from experience. In addition, Blanco (2006) discussesreasons for classifying pathological gambling as an obsessive–compulsivedisorder, an affective disorder or an addictive disorder.
Theories of pathological gambling that assume a pre-existing disease ignore therole that the games themselves play in the development of a gambling problem.For instance most people buy lottery tickets (Turner et al., 2005) but lotteries arerarely associated with pathological gambling (Eckblad and von der Lippe, 1994;Kaplan, 1988). In contrast, blackjack and gaming machines (e.g. slot machines andvideo lottery terminals) are strongly associated with problematic gambling(Dorion and Nicki, 2001; Rush et al., 2002; Smith and Wynne, 2004).
Other researchers have focused on gamblers’ erroneous beliefs about the games.Pathological gamblers often believe that they can either control (illusion ofcontrol) or predict the outcome in games of chance (Wagenaar, 1988; Rogers, 1998;Ladouceur and Walker, 1996). For example, many pathological gamblers believethat after losing several times, they are due to win, which leads to a cognitiveentrapment as they wait for the expected win. Erroneous beliefs are also commonin the general public however (Turner et al., 2005) and thus it is important todetermine the extent to which faulty beliefs are correlated with problematicgambling. More specifically, identifying the types of erroneous beliefs moststrongly associated with problematic gambling would be useful.
Psychological theories such as those of Skinner (1953), Peele (2001) and Marlatt(1985) focus on the role of intermittent positive and negative reinforcement ingambling. Studies with rats and pigeons (see Skinner, 1953) have found that whenrewards are not given to an animal on every trial, the behaviour is less likely toextinguish (stop) when rewards are withheld than if the animal is rewarded onevery trial. A typical slot machine positively rewards the player on about 20% ofthe spins (mostly small prizes). In addition, the player may find that possibility ofa large win provides them with a dream that allows them to escape from stress(negative reinforcement). The experience of winning has frequently been linked tothe development of gambling problems (Custer and Milt, 1985; Turner and Liu,1999). Indeed, it is unlikely that pathological gambling would even exist if playershad no experience with wins. Consistent with this view, Wexler (2002) reportshow a relatively small win was the first step towards a serious gamblingcompulsion. Lottery winners, however, rarely go on to gamble pathologically
238 N. E. Turner et al.
Dow
nloa
ded
by [
Uni
vers
ity o
f C
onne
ctic
ut]
at 1
3:48
11
Oct
ober
201
4

suggesting that a win is not sufficient to lead to a gambling problem (Kaplan,1988). The key feature of the most problematic types of games (blackjack, slotmachines, craps) is that they run continuously whereas those associated withfewer problems, such as lotteries, tend to be discontinuous (lengthy gaps betweenevents). Most likely some combination of pre-existing problems, beliefs and theexperience of wins contribute to the process of turning a gambling hobby intopathology. In addition, there is likely an interactive feedback process between lifestress, gambling wins, gambling losses and the need to escape that entraps thepathological gambler in a cycle of winning, losing and escape.
Blaszczynski’s (2000) pathways model is a bio-psycho-social model (see alsoGriffiths and Delfabbro, 2001) that places various experiential, psychological,physiological and emotional factors into an over arching framework (pathways).According to this model there are three general groups of pathological gamblers: (1)Pathological gamblers who are otherwise ‘normal’. These people were essentiallyemotionally healthy people before they started gambling. Theymay have developedtheir problem because they were socially encouraged to gamble by friends or wereconditioned by the experience of wins to keep playing or because they helderroneous beliefs about their ability to win. (2) Emotionally vulnerable pathologicalgamblers developed their problem because they were under a lot of stress, weredepressed or needed to ‘escape’ from the reality of their lives. (3) Physiologicallyvulnerable pathological gamblers are peoplewho have a biologically based inabilityto control their impulses (e.g. attention deficit hyperactivity disorder).
The ‘pathways’ model does not characterise these pathways as being mutuallyexclusive but rather it views the risk factors as cumulative. A person who isemotionally vulnerable because of stressful life events might also hold erroneousviews about winning. Someone who is physiologically vulnerable might be bothdepressed and hold erroneous beliefs. People in pathway 3 are viewed as havinga more severe problem. Experiential processes operate in all pathways butimpulsivity only operates in pathway 3. As such, cognitive and experiential riskfactors should be more common amongst problematic gamblers but impulsivityshould be associated with more severe cases of problematic gambling.Blaszczynski’s (2000) work on the pathway model is mostly supported throughclinical experience. To date little research has been conducted to determinehow well the pathways model accounts for pathological gambling or the extent towhich different people are linked to different paths.
In an earlier study that was part of this project a series of interviews wereconducted with regular gamblers ranging from non-problem social gamblers toseverely pathological gamblers (Turner et al., 2002). According to these interviewssome pathological gamblers reported experiencing a big win the first time theygambled or showed signs of faulty beliefs about their chances of winning. Thesefindings are consistent with the ‘Otherwise Normal’ pathway. Other pathologicalgamblers reported stressful life events, the absence of social support, depression,anxiety and a reliance on escape as a way of coping with stress, which is consistentwith the emotional vulnerability pathway. Finally, some gamblers showed signs ofpoor impulse control, boredom susceptibility or a poor sense of direction in theirlife, which is consistent with the physiological vulnerability pathway. Thesefindings generally support the pathways model; however the gamblers weinterviewed were not necessarily linked to only one particular path. More oftenpathological gamblers had characteristics of more than one of these pathways.
Experience and Problem Gambling 239
Dow
nloa
ded
by [
Uni
vers
ity o
f C
onne
ctic
ut]
at 1
3:48
11
Oct
ober
201
4

The first purpose of the present study is to verify the findings of our interviewsusing the statistical analysis of questionnaire data obtained from a further generalpopulation sample. To accomplish this goal we put together a package ofquestionnaires related to the issues we identified from our interviews (e.g. stress,depression, erroneous beliefs, big wins, impulsivity) and examined correlationsbetween questionnaire responses and the severity of pathological gambling. Asecond objective is to determine the extent to which variables related to different‘pathways’ identify different pathological gamblers. It is hypothesised that theimportance of these three pathways, as defined by Blaszczynski (2000), can beassessed by testing the statistical significance of correlations between pathwayindicator variables and measures of pathological gambling. In addition, it ishypothesised that variables related to different pathway variables will identifydifferent pathological gamblers. To test this hypothesis we conducted a series ofseparate discriminant function analyses that test the extent to which (1) normal,(2) emotional and (3) physiological pathway variables discriminate betweenpathological and social gamblers and the extent of overlap between these pathways.In addition we examined where sub-clinical problem gamblers are placed in theseanalyses. It is hypothesised that sub-clinical problem gamblers will score higherthan social gamblers on fewer risk variables than pathological gamblers.
Method
Gamblers were sought through newspaper advertisements. The advertisementspecifically asked for people who had experienced wins. Our previous studies(Turner and Liu, 1999) with pathological gamblers suggest that newspaperadvertisements are an efficient means of obtaining participants. Past results fromthose contacted through newspapers have been similar to those accessed thatused random digit dialling, at a fraction of the cost. As the sample was obtainednon-randomly, generalising the results back to the population must be done withsome caution.
Sample Size
We mailed out a total of 198 questionnaires. One hundred and five surveys werereturned for a response rate of 53%. Of the participants, 38 were non-problemgamblers and 34 were pathological gamblers. The remaining 33 were not clearlypathological or non-problemandwere categorisedas sub-clinical problemgamblers.The classification of gamblers into sub-groupswas based on scores on the SOGSpastyear, DSM-IVand SOGS lifetime questionnaires using the following criteria:
1. Non-problem. (a) Past year SOGS ¼ , 2AND (b) DSM-IV score ¼ , 1AND (c) Lifetime SOGS ¼ , 3.
2. Sub-clinical. (a) 5 . Past year SOGS . 2OR (b) 5 . DSM-IV . ¼ 2OR (c) Non-problem current score but a SOGS lifetime ¼ . 4.
3. Pathological. (a) Past year SOGS . ¼ 4 and DSM-IV score . ¼ 5OR (b) DMS-IV . ¼ 4 and past year SOGS . ¼ 5.
240 N. E. Turner et al.
Dow
nloa
ded
by [
Uni
vers
ity o
f C
onne
ctic
ut]
at 1
3:48
11
Oct
ober
201
4
The development and testing of this classification scheme is described at thebeginning of the results section.
Procedure
Participants who responded to the advertisements were screened over thetelephone for their suitability. The screening focused on their gambling andtheir experiences of winning. We asked questions about the frequency of theirgambling, how long they have been gambling, the types of games played and theirexperience of wins. For this study, we were only interested in recruiting peoplewho gambled regularly. Respondents who were actively engaged in gamblingwere mailed a package of questionnaires.
Measures
Gambling and gambling problems. The package included several publishedquestionnaires, a gambling behaviour questionnaire and several measuresdeveloped from interviews with problem gamblers (Turner et al., 2002). Twomeasures of gambling pathology were used to determine a person’s problematicstatus: the past 12 months South Oaks Gambling Screen (SOGS; Lesieur andBlume, 1987, 1993; Abbott and Volberg, 1996), which is a valid and reliableinstrument for assessing problem gambling and a questionnaire based directly onthe DSM-IV criteria for pathological gambling (American Psychiatric Association,1994). We used these two measures to improve the accuracy of our classification.Both measures were phrased in terms of past 12 months. We also includeda lifetime SOGS. In addition a harmful consequence questionnaire was usedthat consisted of seven-point scale items asking about the experience of harm indifferent aspects of a person’s life (e.g. social, spiritual, financial). In previousresearch (Turner and Liu, 1999) this scale was found to be very reliable (a ¼ 0.95)and strongly correlated with SOGS scores (r ¼ 0.77). The Gambling LimitsQuestionnaire is an assortment of ten questions on how people gamble (see Turneret al., 2005). Six of these items are related to setting limits on gambling (a ¼ 0.70).The gambling behaviour questionnaire asked the respondents which of 16different types of games they had played in the past year, how often they playedeach game (times per year) and the typical amount of money they would risk at(‘bring to’) each session.
The winning experiences questionnaire (WEQ). The heart of the questionnairepackage was the winning experiences questionnaire. It was developed as a resultof three focus group and 17 individual interviews conducted during an earlierstudy as part of this project (see Turner et al., 2002). A summary of these interviewsis currently available at www.gamblingresearch.org under the title ‘Winnersstudy’. TheWinner’s study interviews explored the experience of the gambler andlaid the groundwork for the questionnaires used in the current study.
Normal pathway measures. The main focus of the study was to test the extent towhich variables related to the different pathways could explain pathologicalgambling. A major focus of the WEQ was measurement of risk variables thatwould be related to the ‘Normal’ pathway. WEQ measures related to the normalpathway include questions regarding the timing of the participant’s ‘first big win’,
Experience and Problem Gambling 241
Dow
nloa
ded
by [
Uni
vers
ity o
f C
onne
ctic
ut]
at 1
3:48
11
Oct
ober
201
4

the size of the win and the effect of the win. Other variables used to measure the‘Normal’ pathway included measures of the experience of wins, beliefs aboutrandom chance and strategies of play. In addition we included the gamblingbehaviour questionnaire along with several measures developed and tested inour previous research (Turner and Liu, 1999). Several measures were includedto examine beliefs regarding gambling: the 60-item gambling cognitionquestionnaire (GCQ; Toneatto, unpublished) was used to assess gambling-specific cognitive distortions; the 33-item random events knowledge test (Turner,unpublished questionnaire) was used to assess the participants’ understanding ofrandom events; and the 10-item chance test (a ¼ 0.65) was used to measure therespondents’ knowledge of game specific probability (e.g. the most likely outcomefrom rolling two dice is to roll a seven true/false). For the gambling cognitionquestionnaire (GCQ; Toneatto, unpublished), we used a combination of factoranalysis and conceptual groupings to define nine sub-scales (Turner and Liu,1999). Each sub-scale was reliable (a. 0.70) and was correlated significantly withproblem gambling. The persistence sub-scale, which measures the belief thatpersistence pays off, is the sub-scale most strongly correlated with pathologicalgambling (e.g. r ¼ 0.68). A reliability analysis of the random events knowledgetest (REKT; Turner and Liu, 1999) produced an initial a of 0.43, but after theremoval of unreliable items, the a equalled 0.70.The full 33-item scale wasincluded in the questionnaire package but all statistical analyses used the 22-itemversion.
Emotional pathway. The emotional pathway is more easily defined than the‘Normal’ pathway. Our focus was on measures of mood, anxiety, stress andcoping. To measure the emotional pathway we included the ways of copingquestionnaire (Folkman and Lazarus, 1988) and measures of depression (Radloff,1977; see also Robinson et al., 1991) and social anxiety (Leary, 1983; see alsoRobinson et al., 1991). Next we asked the respondents to check off life events orconditions they had experienced in the year before they started gambling. Theseitems were derived from the results of focus groups, interviews and from ourprevious research (Turner et al., 2002). The items were presented in the form of achecklist and consisted of roughly equal numbers of positive and negative events.In addition, we computed total stress (a ¼ 0.74) and total support (a ¼ 0.82)measures consisting of ten items each to assess the global impact of these variableson problem gambling. Two items were not included in this total score—a newbaby and a new car—because they are not clearly positive or negative (both arevery stressful but could indicate that a person is doing well). In addition, based onthe interviews, we compiled a checklist of events that could have triggered agambling problem. A screening question was placed before the triggerquestionnaire to ensure that only people who felt they had ‘ever’ had agambling problem would respond. The trigger questionnaire is distinguishedfrom the life events questionnaire in that it focused on the advent of problematicgambling, whereas the life events questionnaire focused on the year that theperson started gambling.
Impulsive or physiological pathway. The questionnaire included three measures:impulsivity (Barrat, 1987), thrill seeking and boredom susceptibility (Zuckerman,1979).
242 N. E. Turner et al.
Dow
nloa
ded
by [
Uni
vers
ity o
f C
onne
ctic
ut]
at 1
3:48
11
Oct
ober
201
4
Statistical Analysis
In this studywe have used 0.05 as the contrast wise Type I error rate. As such thereis a possibility that some of the findings reported in this paper are Type I errors.Using a more stringent Type I error rate would reduce the number of Type I errors,but it would also greatly increase the number of Type II errors. As a compromisewe recommend treating all findings reported with an estimated probabilitybetween 0.05 and 0.01 as tentative until replicated. We also recommend a focuswhere possible on the broader pattern of findings such as total stress or patternsacross related variables (e.g. all skill-related correlations), rather than on specificitems.
For effect size, we mostly report Spearman r correlation because it is non-parametric, is not affected by skewness and works equally well with discrete andcontinuous variables. The sample size has sufficient power to detect a correlationof r ¼ 0.27 (a moderately small effect), 80% of the time. When reporting groupdifferences (e.g. pathological vs sub-clinical problems vs non-problem) we use aone-way ANOVA followed by Bonferroni adjusted post hoc tests and the dstatistics for effect size (mean difference divided by the standard deviation). Effectsize differences d will mainly be reported when we feel the linear r does notadequately describe the observed effect. The sample size has the power to detectpairwise difference between groups of d ¼ 0.67 (a moderate strong effect) 80% ofthe time.
Results
Gambling Problems
Diagnosis and classification. To determine the optimal cut points between non-problem gamblers, sub-clinical problem gamblers and pathological gamblers weused various combinations of SOGS past year, DSM-IV and SOGS lifetime scoresto group the gamblers. Each of these groups was then entered into a discriminantfunction analysis as a grouping variable. We used the 11 items from the harmfulconsequences scale, the six items from the setting limits scale and the seven itemsfrom the persistence sub-scale of the GCQ as predictors. These items were used totest the cut points because the scales are reliable and strongly correlated withproblematic gambling. Cut-points of SOGS past year ¼ 0, DSM-IV ¼ 0 and SOGSlifetime ¼ 0 resulted in a correct placement rate of 85.7 between non-problemgamblers, sub-clinical problem gamblers and pathological gamblers and cutpoints of 3, 2 and 3 respectively resulted in a correct placement rate of 88.6%. Thehighest placement rate was found for the cut point of SOGS past year ¼ 2, DSM-IV ¼ 1 and SOGS lifetime ¼ 3, which yielded a placement rate of 89.5%. We alsovaried the cut point for pathological vs sub-clinical problem gamblers and foundthat the best cut-point was 5 on one scale (DSM-IVor SOGS past year) and 4 on theother (note that SOGS lifetime scores were not used to differentiate pathological vssub-clinical groups). These cut-points correctly placed 97.4% of non-problemgamblers, 85.3% of pathological gamblers and 84.8% of the sub-clinical cases. Nopathological gamblers were incorrectly placed in the non-problem group and nonon-problem gamblers were incorrectly placed in the pathological group.
Continuous gambling problem index scores. An examination of the data suggestedthat problems vary continuously from none to very severe. In addition to the
Experience and Problem Gambling 243
Dow
nloa
ded
by [
Uni
vers
ity o
f C
onne
ctic
ut]
at 1
3:48
11
Oct
ober
201
4

categorisation, we also wanted to have one single measure of problems for use as acontinuous measure for correlational analysis. Our data set contained fourmeasures of problematic gambling: DSM-IV, SOGS past year, SOGS lifetime andthe harmful consequences scale. These variables were highly correlated with eachother with coefficients ranging from 0.73 to 0.86.These four measures were enteredinto a factor analysis. The analysis suggested a single factor with an eigenvalue of3.34 that accounted for 83.6% of the total variance. We used the factor analysisprocedure to compute an aggregate problem gambling index score by extracting asingle factor score per person. This aggregate will be used throughout this paperwhen we are discussing problematic gambling as a continuous variable.
Subject demographics. Overall, slightly more than half of the sample were maleparticipants (56%). The proportion of males in the non-problem, sub-clinical andpathological groups were 45, 59 and 67% respectively, x2 ¼ 3.8, p ¼ 0.15. Eightyper cent of the sample had a high school education or greater. Non-problemgamblers (71%) were more likely to report a post high-school education,compared to the pathological (41%) and sub-clinical problem groups (39%),x2 ¼ 9.0, p ¼ 0.05 (df ¼ 4, n ¼ 105).
The average age of the sample was 38.5 years. The mean ages of the pathologicaland non-problem groups were similar at 36.3 and 37.5 respectively. At a mean of42.2 years, the sub-clinical group was somewhat older, though this difference didnot reach significance, F(2, 102) ¼ 1.8, ns. Roughly 50% of the sample wasemployed full time while 12.4% were either unemployed or on income assistance.Compared to non-problem gamblers, pathological gamblers and sub-clinicalproblem gamblers were less likely to be employed full time (42, 45 and 60%,respectively) and more likely to be disabled, retired or on income assistancethough these differences did not reach significance.
Gambling Behaviour
On average the sample reported being engaged in 4.5 (SD ¼ 2.8) games.Pathological gamblers (M ¼ 6.2, SD ¼ 3.4) reported engaging in significantlymore games than non-problem gamblers (M ¼ 3.5, SD ¼ 1.8) or sub-clinicalgamblers (M ¼ 3.8, SD ¼ 2.3), F(2,99) ¼ 11.2, p , 0.001, h 2 ¼ 0.18. On average,pathological gamblers reported having problems controlling their gambling in 3.2of the games they played. Sub-clinical problem gamblers reported havingproblems with 0.78 (SD ¼ 1.16) games.
The most common games played by the sample were lotteries (87.6%), instantlotteries (58.1%), slot machines (51.4%), bingo (44.8%) and casino card games(31.4%). Table 1 provides the percentages of the participants who reportedengaging in each of the games. Table 1 also provides for comparison participationrates from the general population taken from Turner et al. (2005). In every categoryexcept investments, all three groups reported engaging in substantially moregames than the general population.
The games played by the various groups were similar, however some importantdifferences were noted. People who scored higher on the aggregate problemgambling scores were more likely to be involved in sports lotteries, r(104) ¼ 33,p , 0.001, video poker, r(104) ¼ .32, p , 0.001, horse racing, r(104) ¼ 0.31,p, 0.001, sports betting, r(104) ¼ 0.29, p, 0.01, casino card games, r(104) ¼ 0.24,
244 N. E. Turner et al.
Dow
nloa
ded
by [
Uni
vers
ity o
f C
onne
ctic
ut]
at 1
3:48
11
Oct
ober
201
4

p , 0.05, internet gambling, r 12(104) ¼ 0.21, p , 0.05 and pull tabs (an instant
lottery also known as breakopen tickets) r(104) ¼ 0.20, p , 0.05.To compute gambling participation, we converted their gambling frequency
into days per year and added up their participation across the 16 game types. Onaverage, the participants gambled on 280 days per year (median ¼ 167 times peryear). The median number of days gambling for the non-problem gambler groupwas 129 times a year (about two times per week). Sub-clinical (median ¼ 167) andpathological gamblers (median ¼ 423) reported gambling more often than thenon-problem gamblers. The only significant difference was between pathologicalgamblers and non-problem gamblers, F(1,102) ¼ 12.6, p , 0.01, d ¼ 1.0.
Gambling expenditure was computed for each of the 16 types of gambling bymultiplying gambling occasions for each type of gambling by the reportedaverage money risked per type of gambling. After an examination of the meanswe removed stock market investments from this total because two non-problemgamblers reported substantial investment (e.g. $400,000 per year—all dollarsreferred to are Canadian dollars). Unlike other forms of gambling, an investmentis only a loss if it is sold at a loss. The money risked on the remaining 15 forms ofgambling was added together. The net result is not losses but potential lossesbecause it does not take into account wins. The median risked on gambling peryear according to our data by non-problem gamblers was $663 (log mean ¼ 2.8,SD ¼ 0.90). This translates into an average monthly risk of just over $53. Sub-clinical problem gamblers reported risking a median of $2864 (log mean ¼ 3.4, SD¼ 0.73), while the pathological gamblers in our sample reported a median of$11,048 (log mean ¼ 3.9, SD ¼ 0.94). A one-way ANOVA on the log values ofmoney risked, F(2, 101) ¼ 13.2, p , 0.001, found significant differences betweennon-problem and pathological groups, d ¼ 1.1, p , 0.001 and between
Table 1. Game participation rates for non-problem, sub-clinical problem andpathological groups as well as participation rates from the general public
Non-problem Sub-clinical Problem Turner et al. (2005)
38 33 34 2500Lotteries 84.2% 90.9% 88.2% 61.9%Scratch tickets 55.3% 54.6% 64.7% 39.2%Pull tabs 15.8% 15.2% 44.1% 12.5%Private card games 21.1% 18.2% 23.5% 8.1%Casino card games 15.8% 27.3% 52.9% 7.5%a
Other Table games 7.9% 21.2% 17.7%Slot machines 55.3% 45.5% 52.9% 21.5% b
Video poker 7.9% 6.1% 35.3%Investments 5.3% 6.1% 20.6% 48.4%Horse races 18.4% 27.3% 44.1% 6.2%Sports lotteries 13.2% 15.2% 50.0% 5.9%Bingo 26.3% 45.5% 64.7% 9.7%Real estate 0.0% 6.1% 0.0%Sports betting 15.8% 6.1% 41.2% 8.3%Internet 0.0% 0.0% 11.8%Other 2.6% 0.0% 11.8%
Source: Turner et al. (2005)Notes: aTable games in Turner et al. (2005) included both cards and other games (e.g. craps).bTurner et al. did not differentiate between slot machines and video poker devices.
Experience and Problem Gambling 245
Dow
nloa
ded
by [
Uni
vers
ity o
f C
onne
ctic
ut]
at 1
3:48
11
Oct
ober
201
4
non-problem and sub-clinical groups, d ¼ 0.72, p , 0.05. The difference betweenpathological and sub-clinical did not reach significance, d ¼ 0.53, ns.
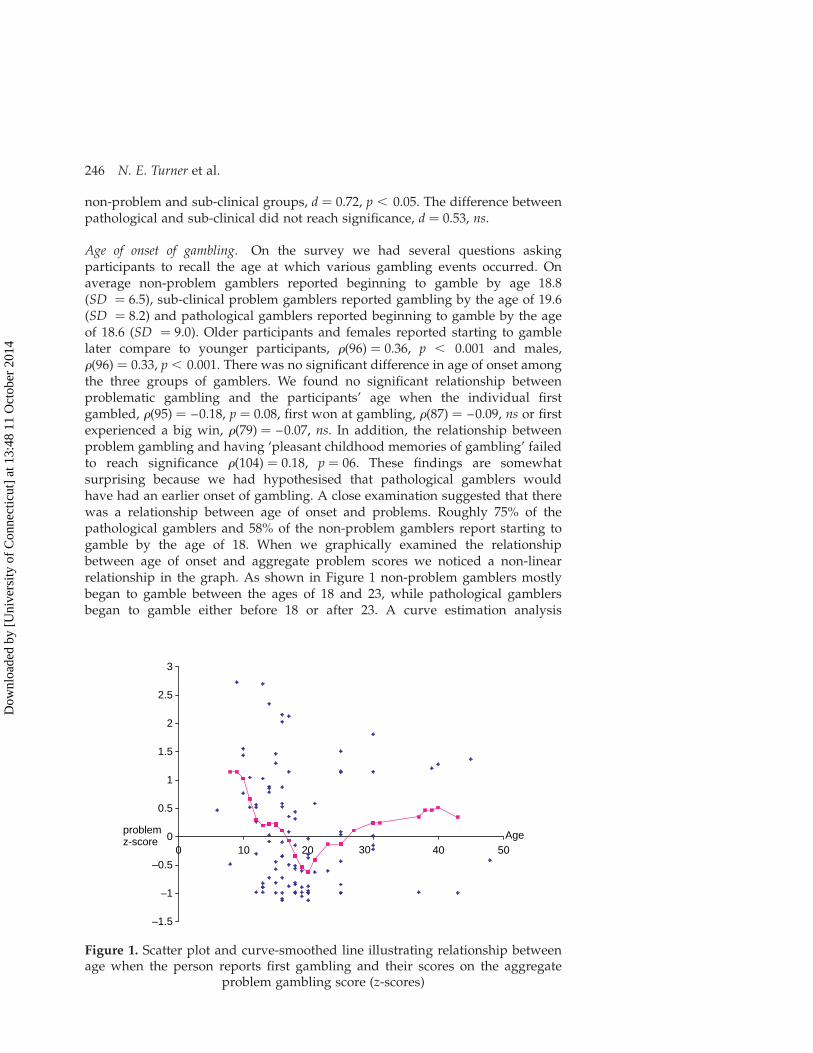
Age of onset of gambling. On the survey we had several questions askingparticipants to recall the age at which various gambling events occurred. Onaverage non-problem gamblers reported beginning to gamble by age 18.8(SD ¼ 6.5), sub-clinical problem gamblers reported gambling by the age of 19.6(SD ¼ 8.2) and pathological gamblers reported beginning to gamble by the ageof 18.6 (SD ¼ 9.0). Older participants and females reported starting to gamblelater compare to younger participants, r(96) ¼ 0.36, p , 0.001 and males,r(96) ¼ 0.33, p , 0.001. There was no significant difference in age of onset amongthe three groups of gamblers. We found no significant relationship betweenproblematic gambling and the participants’ age when the individual firstgambled, r(95) ¼ –0.18, p ¼ 0.08, first won at gambling, r(87) ¼ –0.09, ns or firstexperienced a big win, r(79) ¼ –0.07, ns. In addition, the relationship betweenproblem gambling and having ‘pleasant childhood memories of gambling’ failedto reach significance r(104) ¼ 0.18, p ¼ 06. These findings are somewhatsurprising because we had hypothesised that pathological gamblers wouldhave had an earlier onset of gambling. A close examination suggested that therewas a relationship between age of onset and problems. Roughly 75% of thepathological gamblers and 58% of the non-problem gamblers report starting togamble by the age of 18. When we graphically examined the relationshipbetween age of onset and aggregate problem scores we noticed a non-linearrelationship in the graph. As shown in Figure 1 non-problem gamblers mostlybegan to gamble between the ages of 18 and 23, while pathological gamblersbegan to gamble either before 18 or after 23. A curve estimation analysis
–1.5
–1
–0.5
0
0.5
1
1.5
2
2.5
3
0 10 20 30 40 50Ageproblem
z-score
Figure 1. Scatter plot and curve-smoothed line illustrating relationship betweenage when the person reports first gambling and their scores on the aggregate
problem gambling score (z-scores)
246 N. E. Turner et al.
Dow
nloa
ded
by [
Uni
vers
ity o
f C
onne
ctic
ut]
at 1
3:48
11
Oct
ober
201
4

indicated a significant quadratic, b ¼ 0.43, t ¼ 2.9, p, 0.01 and cubic effect, b ¼ –0.10, t ¼ –2.1, p , 0.05, R 2 ¼ 0.10, F(3, 91) ¼ 3.4, p , 0.05.
One possible explanation of the lack of an age effect may be the relatively recentintroduction into the province of casinos and slot venues at racetracks (e.g. thefirst casino opened in 1994). As evidence for this we found significant correlationsbetween respondents’ reported year of first big win and involvement with: casinocard games, r(79) ¼ 0.36, p , 0.01, other tables games, r(79) ¼ 0.39, p , 0.01 andslot machines, r(79) ¼ 0.32, p, 0.01. Those who play these games reported havinga more recent first big win. Year of first win was not related to participation in anyother game.
Gambling limits questionnaire. Six items measured the respondents tendency toset financial and time limits on their gamblingmeasured on a five-point scale (5 ¼
always; 1 ¼ never). The majority (68%) of non-problem gamblers and sub-clinicalproblem gamblers (78%) reported always or often setting a spending limit on theirgambling whereas only 41% of pathological gamblers reported setting a spendinglimit, r(104) ¼ –0.36, p , 0.001. The strongest limits effect was for the question‘How often do you gamble until closing time or as long as possible’, r(104) ¼ 0.61,p , 0.001. Non-problem gamblers (M ¼ 1.6, SD ¼ 0.8) report gambling untilclosing time much less often than sub-clinical problem gamblers (M ¼ 2.6, SD¼ 1.1) and pathological gamblers (M ¼ 3.4, SD ¼ 1.1). An aggregate limits scorecombining the six questions was strongly related to problematic gambling,r (105) ¼ –0.59, p , 0.001.
Big wins and losses. Thus far, we have discussed big wins and big losses withoutactually defining what a big win or a big loss is. In the survey we included twoquestions in an attempt to define/determine what people view as a big win and abig loss. In addition we asked the participants how much they would have to winto feel really happy and howmuch they would have to lose to feel really unhappy.The mean, median, mode and geometric mean of their answers are given inTable 2. Depending on the individual, a big win was anything from $25 to $100million, with a geometric mean of $2257.35. Big losses covered a considerablysmaller range from $1 to only $1 million, with geometric mean of $350.28. Arepeated measures analysis of variance on the log mean of these four monetaryestimates (big win, big loss, really happy, really unhappy) was highly significantF(3,258) ¼ 61.7, p , 0.0001. A post hoc test revealed that all four estimates differedsignificantly (big win . big loss . win really happy . loss really unhappy).There was no main effect of gambler type (non-problem vs sub-clinical vspathological) and no interaction of type with the monetary estimates. In summarythere are huge differences between what people think constitutes a big wincompared to a big loss, but overall pathological and non-problem gamblers havesimilar ideas about the size of wins and losses. Although the ANOVA test of theinteraction failed to reach significance, it should be noted that problematicgambling was correlated with the estimated size of a big loss, r(100) ¼ 0.22, p ,
0.05, suggesting a tendency for pathological gamblers to provide larger values forbig losses. The estimated size of a big wins or loss was not related to income,however, the size of a loss that would make one really unhappy, was positivelycorrelated with income, r(94) ¼ 0.28, p , 0.01.
Experience and Problem Gambling 247
Dow
nloa
ded
by [
Uni
vers
ity o
f C
onne
ctic
ut]
at 1
3:48
11
Oct
ober
201
4

Table 2. Descriptive statistics for the perception of the size of a big win or big loss
Variable N Median (Can$) Mean (Can$) Geometric mean (Can$) Log 10 mean SD log mean r
How much is a ‘big win’? 96 1000 1,176,305 2,257.35 3.35 1.17 0.15How much is a ‘big loss’? 96 300 11,555 350.28 2.55 0.77 0.22*Smallest win to feel really happy? 97 100 10,941 179.00 2.22 0.91 0.05Smallest loss to feel really unhappy? 97 100 215 95.17 1.99 0.59 0.07
*p , 0.05Note: Because of the skewed distribution, the median, log mean and geometric means are probably the best indicators of the central tendency of the numbers. Log meanswere computed by first adding 1 to the observed score, then taking the log 10 value of this number. The geometric means is essentially the log mean, translated back intoraw score units.
248N.E.Turner
etal.
Dow
nloa
ded
by [
Uni
vers
ity o
f C
onne
ctic
ut]
at 1
3:48
11
Oct
ober
201
4

Normal Pathway
Early wins. People who score higher on gambling problems were more likely toreport experiencing a win at some point in their gambling career, r(104) ¼ 0.42,p , 0.001. Specifically, pathological gamblers were more likely than non-problemgamblers to have experienced a win the first time they gambled seriously (e.g.excluding informal bets between friends; 26%), r(104) ¼ 0.29, p , 0.01 or to haveexperienced a win every now and then (44%), r(104) ¼ 0.18, p , 0.05. In fact, nosocial gambler and only 12% of sub-clinical problem gamblers reported winningthe first time they gambled seriously. No difference was found for winning inthe ‘early days after I learned how to gamble’, r(104) ¼ 0.13, ns or ‘recently’,r(104) ¼ 0.06, ns. Interestingly, we did not find any correlation between problemgambling and whether or not the participant’s first gambling experience wasmemorable, r(104) ¼ 0.07, ns or if the person had won, lost or broken evenr(98) ¼ 0.03. This appears to contradict the finding above that people who hadwon the first time they gambled seriously were more likely to be pathologicalgamblers. Having a big win during one’s first gambling episode, however, doesnot necessarily mean leaving with a big win.
First big win. We found a moderately strong correlation between the size of agamblers first win and problem gambling, r(92) ¼ 0.36, p , 0.001. The geometricmean for the non-problem gamblers was $139 (log mean ¼ 2.2, SD ¼ 0.7), for thesub-clinical problem group was $499 (log mean ¼ 2.7, SD ¼ 0.9) and for thepathological gamblers was $620 (log mean ¼ 2.8, SD ¼ 0.7). A one-way ANOVAon the log means revealed that the non-problem gambler group reportedsignificantly smaller first wins than either the sub-clinical ( p , 0.01; d ¼ 0.67) orpathological groups ( p , 0.001; d ¼ 0.78), F(2,92) ¼ 6.7, p , 0.01. No differencewas found between the sub-clinical and pathological groups (ns, d ¼ 11).
Largest loss. On the survey we also asked the participants about their largestsingle loss. Not surprisingly this figure was strongly correlated with aggregateproblem gambling scores, r(104) ¼ 0.60, p , 0.0001. The geometric mean forlargest loss by non-problem gamblers was $98.95, for sub-clinical problemgamblers was $306.20 and for the pathological gamblers was $697.70. The log 10mean for non-problem (M ¼ 1.96, SD ¼ 0.72) was significantly lower than themean for sub-clinical (M ¼ 2.51, SD ¼ 0.75, d ¼ 0.6) and pathological gamblers(M ¼ 2.81, SD ¼ 0.59, d ¼ 1.1), F(2,102) ¼ 14.1, p , 0.001. Sub-clinical gamblersreported lower mean losses compared to pathological gamblers, but this did notreach significance (d ¼ 0.38).
What makes a person want to gamble more? Scattered throughout the first two pagesof the Winners Questionnaire were seven questions that asked people aboutgambling related events that affect their desire to gamble. Although most of thesubjects (72%) reported wanting to gamble more after a big win, in generalproblematic gambling was correlated with wanting to gamble more after a bigwin, r(105) ¼ 0.21. Most of the pathological gamblers (73%) reported wanting togamble more after their first big win whereas only 21% of the non-problemgamblers reported wanting to gamble more after their first big win, r(93) ¼ 38.After a loss, people were more likely to report wanting to gamble less (43.8%),than wanting to gamble more (25.7%). Aggregate problem gambling scores were
Experience and Problem Gambling 249
Dow
nloa
ded
by [
Uni
vers
ity o
f C
onne
ctic
ut]
at 1
3:48
11
Oct
ober
201
4

correlated with a desire to gamble more after losses in general, r(105) ¼ 0.30, p ,
0.01 and after a loss followed by a win, r ¼ 28, p , 0.05. However, no correlationwas found between problematic gambling and a desire to gamble after one’slargest loss, r(105) ¼ 0.02, ns. Males and females did not differ on any of thesevariables.
Interestingly, the size of the participants’ first win was positively correlatedwith the persons’ views on what constitutes a big win r(90) ¼ 0.24, p , 0.05 andthe size of a loss that would make the person really unhappy, r(89) ¼ 23, p, 0.05.The size of their single largest loss was correlated with the participants estimatedsize of a big loss, r(100) ¼ 0.35, p, 0.001 and the size of a loss that wouldmake theperson really unhappy, r(98) ¼ 0.34, p , 0.001. People who had experiencedlarger losses appear to be able to tolerate larger future losses. These findingssuggest that the perception of both big wins and big losses are related to directexperience with wins and losses.
How does winning make you feel? In addition, we asked the respondents to checkoff which of a possible list of emotions they felt as a result of winning. Thesequestions were mostly derived from focus groups and interview findings (Turneret al., 2002) but some negative items were added to broaden coverage of the rangeof emotions that might result from winning. The most frequently endorsed itemswere ‘happy’ (89%) and ‘excited’ (77%). This was followed by a ‘rush’ (51%),‘increased self esteem’ (38%), ‘in control’ (28%) and ‘indifferent’ (5%). Only oneperson (1%) said that the experience of a win resulted in lowered self-esteem andno one checked off ‘depressed’ or ‘angry’. Thus, the majority of respondentsconsidered winning to be a very pleasant experience. In terms of problemgambling the only significant relationship was with self-esteem, r(104) ¼ 0.26,p, 0.01. Only 34.2% of non-problem gamblers endorsed this item whereas 58.8%of pathological gamblers endorsed this item. Interestingly only 21.2% of the sub-clinical gamblers endorsed the same item suggesting that the win is much lessimportant to the sub-clinical cases than to pathological gamblers. There was also atendency for pathological gamblers (41.2%) to endorse ‘felt in control’ more oftenthan non-problem gamblers (23.7%), but this item did not reach significance.Collectively, these findings suggest that the experience of a win is very similar forpathological and non-problem gamblers. Compared to non-problem gamblershowever, pathological gamblers identify their sense of self worth more closelywith the experience of winning.
Cognitive variables. We assessed the cognitive aspects of problem gambling usingthree different tests: The Random Events Knowledge Test (REKT), The ChanceTest and The Gambling Cognitions Questionnaire (GCQ). The REKT and TheChance Test were developed by Turner and Liu (1999) to study the relationshipbetween knowledge and problem gambling. The REKTmeasures the participants’understanding of the independence of random events, while the Chance Testmeasures their knowledge of the odds of a variety of gambling games. The GCQwas designed by Tony Toneatto to measure beliefs about strategy that can help onewin (Toneatto, unpublished).
The average score for correct responses on the full scale of the Random EventsKnowledge Test (total score) was 62.7% (SD ¼ 13.0%). We conducted a reliabilityanalysis and extracted the 22 most reliable items. The a of the full scale is 0.43, butafter all unreliable items are removed the a was 0.70. The average score of the
250 N. E. Turner et al.
Dow
nloa
ded
by [
Uni
vers
ity o
f C
onne
ctic
ut]
at 1
3:48
11
Oct
ober
201
4
revised scale was 65.7% (SD ¼ 16.4%). Both the full scale and the revisedscale were negatively correlated with problem gambling, (r ¼ –0.30, p, 0.01 andr ¼ –0.34, p , 0.01, respectively), suggesting that problematic gambling isassociated with a poorer understanding of the nature of random events. A one-way ANOVA followed by post hoc tests indicated that non-problem gamblers(M ¼ 71.3%, SD ¼ 16.5%) scored significantly higher than pathologicalgamblers (M ¼ 59.4%, SD ¼ 16.4%), d ¼ 0.72, p , 0.01. Sub-clinical problemgamblers (M ¼ 65.8%, SD ¼ 14.4%) did not differ from either non-problem orpathological gamblers.
Six items from the REKT were also used in Turner et al. (2005). In the presentstudy correct scores on four of these six items were found to be significantlynegatively correlated with problematic gambling. Table 3 presents a comparisonof data from the present study with the results of Turner et al. (2005) which furthersupports our argument that pathological gamblers have a poor understanding ofsome (but not all) aspects of random chance. We statistically compared theaccuracy of the three groups in the current study with the adjusted results fromTurner et al. (2005) (see note in Table 3) using the non-parametric (NPAR) binomialtest procedure. Pathological gamblers answered three questions correctlysignificantly less often than the general population in Turner et al. (2005).Interestingly, social gamblers in the present study were significantly less likelythan the general population to respond true to ‘staying at the same slot machineimproves your chances of winning’ yet were significantly more likely toincorrectly agree that ‘you have a better chance of becoming rich by gambling’than by working.
Scores on the Chance Test were positively related to gambling problemsr ¼ 0.23, p , 0.05. Although pathological gamblers have a poor understanding ofrandom events, they appear to understand their chances of winning in specificgames somewhat better than non-problem gamblers.
The GCQ was also included on the survey to examine the participants’ beliefsabout things they do to improve their chances of winning.We used nine sub-scalesthat we derived using a combination of factor analysis and conceptual similarityfrom the full 60-item version of the scale (Turner and Liu, 1999). Tony Toneatto hasdeveloped a shorter version of this scale for clinical assessment but the longerversion is more useful for the purpose of research. As we found in our previousresearch, each of the GCQ sub-scales was significantly related to problemgambling and, as with previous samples, the belief that persistence pays off wasmost strongly associated with problem gambling, r ¼ 0.65, p , 0.01. In addition,people who endorse items about the Gambler’s Fallacy, r ¼ 0.53, p , 0.01,Forgetting Losses, r ¼ 0.44, p, 0.01, Dreaming about Winning, r ¼ 0.41, p, 0.01,Avoiding Bad Luck, r ¼ 0.36, p , 0.01, betting on a Favourite or Lucky Number,r ¼ 0.35, p , 0.01, relying on Skill, r , 0.31, p , 0.01 or Feeling Lucky, r ¼ 0.28,p , 0.01, were also more likely to have gambling problems. However, whenentered into a regression analysis, only persistence provided unique variance inpredicting aggregate problem gambling scores.
Scores on the REKT and the Chance Test were uncorrelated, r ¼ 0.06, nsindicating that understanding the independence of random events is not the sameas knowing the odds of winning. REKT scores were negatively related to severalsub-scales of the GCQ. The strongest relationships were found for the avoidingbad luck, r ¼ –0.45, p , 0.001 and seeking out favourite numbers and places,r ¼ –0.50, p, 0.001. In addition, people who scored higher on the chance test also
Experience and Problem Gambling 251
Dow
nloa
ded
by [
Uni
vers
ity o
f C
onne
ctic
ut]
at 1
3:48
11
Oct
ober
201
4
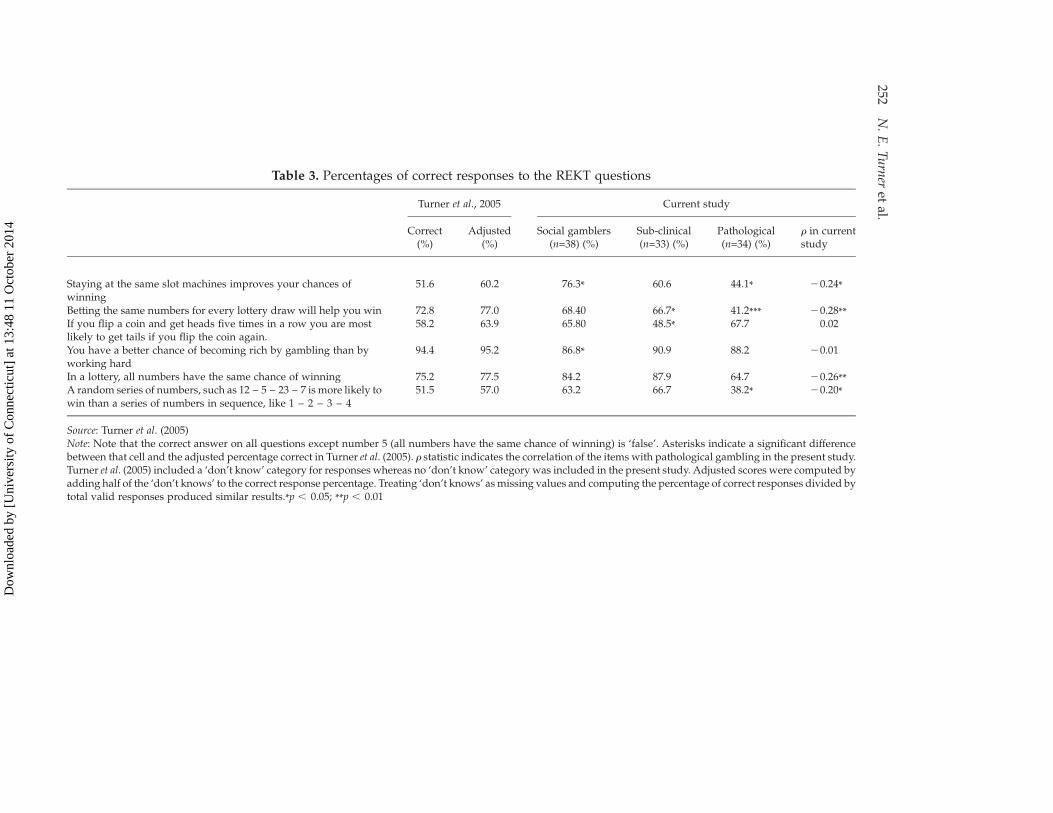
Table 3. Percentages of correct responses to the REKT questions
Turner et al., 2005 Current study
Correct(%)
Adjusted(%)
Social gamblers(n=38) (%)
Sub-clinical(n=33) (%)
Pathological(n=34) (%)
r in currentstudy
Staying at the same slot machines improves your chances ofwinning
51.6 60.2 76.3* 60.6 44.1* 20.24*
Betting the same numbers for every lottery draw will help you win 72.8 77.0 68.40 66.7* 41.2*** 20.28**If you flip a coin and get heads five times in a row you are mostlikely to get tails if you flip the coin again.
58.2 63.9 65.80 48.5* 67.7 0.02
You have a better chance of becoming rich by gambling than byworking hard
94.4 95.2 86.8* 90.9 88.2 20.01
In a lottery, all numbers have the same chance of winning 75.2 77.5 84.2 87.9 64.7 20.26**A random series of numbers, such as 12 – 5 – 23 – 7 is more likely towin than a series of numbers in sequence, like 1 – 2 – 3 – 4
51.5 57.0 63.2 66.7 38.2* 20.20*
Source: Turner et al. (2005)Note: Note that the correct answer on all questions except number 5 (all numbers have the same chance of winning) is ‘false’. Asterisks indicate a significant differencebetween that cell and the adjusted percentage correct in Turner et al. (2005). r statistic indicates the correlation of the items with pathological gambling in the present study.Turner et al. (2005) included a ‘don’t know’ category for responses whereas no ‘don’t know’ category was included in the present study. Adjusted scores were computed byadding half of the ‘don’t knows’ to the correct response percentage. Treating ‘don’t knows’ asmissing values and computing the percentage of correct responses divided bytotal valid responses produced similar results.*p , 0.05; **p , 0.01
252N.E.Turner
etal.
Dow
nloa
ded
by [
Uni
vers
ity o
f C
onne
ctic
ut]
at 1
3:48
11
Oct
ober
201
4

scored higher on the GCQ Skill sub-scale, r ¼ 0.19, p , 0.05. We also found asignificant relationship between involvement in games of skill (sports, poker,racing, etc.) and scores on the chance test (r ¼ 0.37, p, 0.001), but no relationshipbetween involvement in luck oriented games (bingo, lotteries, slot machines etc.)and scores on the chance test, r ¼ 0.02, ns. We found no relationship betweenREKT and frequency of playing games of skill (r ¼ 0.06) or luck (r ¼ 0.01). Theselast two findings suggest that people who play games that require skill do indeedhave more knowledge of the odds, but not more knowledge of random chance.
Emotional Pathway
We found a significant relationship between problematic gambling anddepression, r ¼ 0.48, p , 0.001 and interpersonal anxiety, r ¼ 0.26, p , 0.01.ANOVA post hoc tests indicated that pathological gamblers are more anxious(d ¼ 0.69, p, 0.01) and depressed (d ¼ 1.03, p, 0.001) compared to non-problemgamblers. Sub-clinical and pathological gamblers also differed significantly ondepression (d ¼ 0.8, p , 0.01) and anxiety (d ¼ 0.6, p , 0.05). However, sub-clinical and non-problem gamblers did not differ on these variables.
Life events. As can be seen in Table 4, the most common negative items chosenwere ‘lots of stress’ (35%), ‘difficulty at school’ (26%), ‘financial problems’ (26%)and ‘lack of romantic relationships’ (23%). For positive events, the most commonitems chosen were ‘doing well at work’ (25%), ‘supportive friends’ (24%),‘supportive family’ (24%) and a ‘career goal’ (22%). Pathological gamblers (35.3%)were three times more likely to report history of drug and alcohol abuse than non-problem gamblers (10.5%), r ¼ 0.24, p , 0.01. Similarly, pathological gamblers(41.2%) were three times more likely to report difficulty in school than non-problem gamblers (13.2%), r ¼ 0.26, p , 0.05. Problematic gambling was alsopositively correlated with being ‘under a lot of stress’, r ¼ 0.28, p , 0.01 and a‘lack of romantic relationships’, r ¼ 0.24, p , 0.05 and negatively correlated withhaving supportive friends, r ¼ –0.24, p, 0.05 and doing well at work, r ¼ –0.24,p , 0.05.
Total stress (sum of stressful life events) was negatively correlated withproblematic gambling, r(104) ¼ 0.32, p , 0.01 however, total support was notcorrelated with problematic gambling, r(104) ¼ –0.04, ns. A one-way ANOVA onthe total stress score followed by post-hoc tests found that non-problem gamblersscored significantly lower on stress than pathological gamblers, p, 0.001; d ¼ 0.70,F(1,102) ¼ 5.0, p , 0.01. No difference was found between non-problem and sub-clinical (d ¼ 0.18; ns) or between sub-clinical and pathological (d ¼ 0.52, ns).
Problem triggers. Thirty-six people completed this question: two-thirds of thepeople whom we have placed in the pathological gambler group and one-third ofthose whom we placed in the sub-clinical problem group. As indicated in Table 5,more than half of the respondents said that they started gambling problematicallywhen a new gambling venue opened (57.6%) and half of the respondents also saidthat they began gambling problematically because they felt their life was goingnowhere (54.5%). A third of the respondents reported that around the time theydeveloped their gambling problem, they had just experienced a stressful life event(33.3%) and nearly a third of the respondents experienced a big win (30.3%).Smaller numbers of the respondents reported changing their usual gambling
Experience and Problem Gambling 253
Dow
nloa
ded
by [
Uni
vers
ity o
f C
onne
ctic
ut]
at 1
3:48
11
Oct
ober
201
4

Table 4. Life events that happened during the year before the participants started gambling (n ¼ 105) broken down by problem status
Social gamblers(n=38) (%)
Sub-clinical problems(n=33) (%)
Pathological gamblers(n=34) (%) r
Parents divorced 13.2 12.1 20.6 0.07Financial problem 21.1 24.2 32.4 0.08Drug-alcohol abuse 10.5 15.2 35.3 0.21*Drug-alcohol abuse in the family 5.3 15.2 17.7 0.15Difficulty at school 13.2 24.2 41.2 0.26**Lots of stress 26.3 27.3 52.9 0.28**Sickness in the family 10.5 9.1 20.6 0.11Death in the family 15.8 12.1 17.7 0.00Lack of romantic relationship 13.2 24.2 32.4 0.24*Problematic romantic relationship 13.2 18.2 26.5 0.16Bought a car or house 5.3 12.1 8.8 0.03Supportive parents 23.7 27.3 20.6 20.08Supportive spouse/partner/girlfriend/boyfriend 13.2 21.2 11.8 20.06Supportive friends 29.0 27.3 14.7 20.24*Free from drug-alcohol abuse 13.2 27.3 26.5 0.11Doing well at school 15.8 18.2 17.7 0.04Doing well at work 31.6 33.3 8.8 20.24*Have career goal 26.3 24.2 17.7 20.08Free stress/low stress life 15.8 27.3 14.7 0.02Financially secured 21.1 24.2 17.7 20.01Satisfying romantic relationship 21.1 21.2 17.7 20.12Birth of child 7.9 9.1 2.9 20.06Total stress 14.2 18.2 29.7 0.32***
(18.6) (22.6) (22.8)Total support 22.1 25.2 16.8 20.04
(26.7) (28.0) (20.3)
Note: Correlations were conducted using the aggregate problem gambling index measure derived from SOGS, SOGS-lifetime, DSM-IV for pathological gambling and aharmful consequences scale.
* , 0.05; ** , 0.01; *** , 0.001
254N.E.Turner
etal.
Dow
nloa
ded
by [
Uni
vers
ity o
f C
onne
ctic
ut]
at 1
3:48
11
Oct
ober
201
4

strategy (18.2%), playing a different game (15.2%) or changing their game andexperiencing a big win (12.1%). In addition, 14% reported that their life was goingwell and only 8% reported that nothing unusual had happened. Four peopleadded additional ‘other’ events: health problems, lonely a lot, lots of problemsand divorce.
Coping strategies. Participants were given a list of coping strategies and asked torate how often they used each strategy. People who endorsed more gamblingproblem symptoms also scored higher on escape and avoidance coping (hoping fora miracle or drinking, eating etc. in order not to think about the problem), r ¼ 0.46,p , 0.01, distancing (detaching oneself and downplaying the situation), r ¼ 0.33,p , 0.01, taking responsibility (mostly related to blaming oneself), r ¼ 0.29, p ,
0.01 and confrontation (aggressive efforts to alter the situation), r ¼ 0.21, p , 0.01.A regression analysis found that only escape coping accounted for significantunique variance of problematic gambling. The two most positive coping skills,support coping and problem solving were not correlated with problematicgambling. Interestingly we found negative correlations between REKT scores andescape coping, r(105) ¼ –0.36, p, 0.01, suggesting that people who rely on escapeto cope with stress have a poorer understanding of random chance.
Impulsive Pathway
On the survey we asked the respondents three questions related to impulsivity.We found significant relationships between problematic gambling and boredomsusceptibility, r ¼ 0.35, p , 0.001 and impulsivity, r ¼ 0.37, p , 0.001. Norelationship was found between problem gambling and thrill seeking. ANOVApost hoc tests indicated that pathological gamblers are more impulsive (d ¼ 0.85,p , 0.001) and easily bored (d ¼ 0.58, p , 0.05). We did not find any significantdifference between sub-clinical and pathological gamblers or between sub-clinicaland non-problem gamblers on any of these variables. Interestingly we also found
Table 5. ‘What happened just before gambling became a problem for you?’(N ¼ 33)
Yes (%)
A new casino, bingo hall or other gambling venue opened up near where I live 57.6I felt that my life was going no where 54.5I experienced a stressful life event 33.3I had a big win 30.3I changed my usual playing strategy 18.2Everything was going well for me 15.2I changed my usual game 12.1I changed my usual gambling type or strategy and then experienced a big win 12.1Nothing unusual 9.1Not applicable 3.0
Note: Participants were invited to check off as many items as they wished. We only included the datafromproblem and sub-clinical gamblers in the Table above. People were asked to complete the questionif they ever felt they had had a gambling problem: two-thirds of the problem and a third of the sub-clinical problem gamblers completed this questionnaire. Note that three non-problem gamblers alsofilled out this questionnaire. One checked off ‘not applicable’, one checked off ‘changed usual strategy’and one checked off ‘big win’ and ‘changed usual game’.
Experience and Problem Gambling 255
Dow
nloa
ded
by [
Uni
vers
ity o
f C
onne
ctic
ut]
at 1
3:48
11
Oct
ober
201
4

that an early win was significantly correlated with impulsivity, r ¼ 0.29, p , 0.01and depression, r ¼ 0.28, p , 0.01.
Gender Effects
Overall, male and female participants in this study were remarkably similar. Theydid not differ in terms of anxiety, depression, impulsivity, stressful lifeexperiences, positive life experiences or coping strategies (escape coping, supportcoping). In addition we found no evidence of any non-additive (interactive)relationship between gender, problem severity and any of the above variables.
We found three gender differences in the participation rates of three specificgames. Males were more likely to report buying lottery tickets, r ¼ –0.19, p, 0.05and sport lottery tickets, r ¼ –0.39, p , 0.001 and less likely to report playingbingo, r ¼ 0.25, p , 0.05. No difference was found between the number of gamesplayed by males and females, however, female pathological gamblers reportedhaving problems with more games (M ¼ 4.4, SD ¼ 4.9) than male pathologicalgamblers (M ¼ 2.7, SD ¼ 2.4), but this was not significant t(32) ¼ 1.3, ns. In termsof triggers for problem gambling, males and females differed significantly on onlyone item. ‘My life was going no where’ was endorsed by 71% of females but onlyby 36% of the males, r(36) ¼ 0.34.
Females also reported starting to gamble later than males (r ¼ 0.36, p , 0.001).Only 23% of males waited until the age of 19 to start gambling (the legal age inCanada for most commercial games of chance) whereas 56% of the females waiteduntil 19 (or later) to start gambling. Age of onset was not linearly correlated withpathological gambling for either males or females (r ¼ –0.11, ns and r ¼ 0.16, ns,respectively).
One consistent gender difference found, was that compared to females, maleswere more likely to report preferring to play games of skill, r(105) ¼ –0.25, p ,
0.01 or using skill (GCQ) to help them win, r(105) ¼ –0.27, p , 0.01. In addition,males scored higher on the chance test of game related probability, r(105) ¼ –0.28,p , 0.01, more frequently reported participating in games that involve skill,r(105) ¼ –0.20, p , 0.05 and reported playing skill games more often thanfemales, r(105) ¼ –0.24, p , 0.05. We also found that males reported gamblingwith larger sums of money compared to females, r(105) ¼ –0.20, p, 0.05, havinglarger one day losses, r(105) ¼ –0.32, p , 0.05, larger past year losses,r(105) ¼ –0.27, p , 0.01 and larger lifetime losses r(105) ¼ –0.25, p , 0.01. Inaddition, males scored slightly higher on boredom susceptibility, r(105) ¼ –0.21,p , 0.05 and thrill seeking, r(105) ¼ –0.20, p , 0.05. In summary, males andfemales tend to be similar, however they differ in terms of their participation inskilled games, in terms of the amount of money they risk gambling and in terms ofrisk taking.
Discussion
The data presented in this paper suggests that pathological gambling is associatedwith a number of different variables. Pathological gamblers are more likely toreport experiencing a big win and this win often occurred the first time theparticipant ‘gambled seriously (not counting informal bets between friends)’.Pathological gamblers were found to have a significantly poorer understanding ofthe independence of random events compared to both the general population and
256 N. E. Turner et al.
Dow
nloa
ded
by [
Uni
vers
ity o
f C
onne
ctic
ut]
at 1
3:48
11
Oct
ober
201
4

compared to social gamblers. In contrast, we found that compared to non-problemgamblers, pathological gamblers tended to have a somewhat better knowledge ofgame specific probability.
We found that the size of one’s first win was significantly related to severity ofproblematic gambling. Interestingly, the sizes of the first wins were for the mostpart not particularly large. Thus, as speculated earlier, it is not the big wins thatmatter. A moderately large win of $500 may be sufficient to start a person on ajourney into problem gambling. It is also noteworthy that we did not find adifference in the reported size of wins between sub-clinical and pathologicalgroups. This suggests that the size of ones first win may explain problematicgambling, but not pathological gambling per se.
Contrary to our expectation, we did not find a linear correlation between age ofonset of gambling and severity of problem gambling. However, when we graphedthe relationship between the two variables we found evidence of a curve–linearrelationship between age of onset and severity of problem gambling. Most of thenon-problem gamblers in the sample reported that they began to gamble betweenthe ages of 18 and 23. Pathological gamblers most often started to gamble before 18or after 25. Although most pathological gamblers began to gamble in their youth,waiting until adulthood to gamble does not necessarily protect a person frompathological gambling. Interestingly, we did find significant correlations betweenthe reported year of a big win and participation in casino gambling games (cards,Table games and slot machines) suggesting that any age effect might be obscuredby the recent introduction of casino and slot gaming into the province.
The results of the stressful life events questionnaire suggests that people whoexperienced a lot of stress in the year just before they started gambling were morelikely to score higher on the problem gambling index score, while those who weredoing well at work or had social support were less likely to have gamblingproblems. The results for the sub-clinical group were interesting in that theyappear to fall between the pathological and non-problem groups, but are moresimilar to the non-problem gamblers. The Triggers questionnaire indicates that anew opportunity to gamble, a lack of direction in life, stress and the experience ofwinning are the factors most often involved in the development of a gamblingproblem which confirms the results of our interviews.
In summary, several findings reported in this study are consistent withBlaszczynski’s (2000) pathways model. Pathological gambling was associatedwith reports of early wins and erroneous beliefs about random chance thussupporting the normal pathway. Pathological gambling was also associated withstressful life events, reliance on escape to cope with stress, depression andinterpersonal anxiety, which provide evidence for the emotional vulnerablepathway. In addition pathological gambling was associated with impulsivity andboredom susceptibility, supporting the impulsive or physiological vulnerabilitypathway.
Pathways
Thus far we have presented evidence in support of the normal (experiential,behavioral and cognitive), emotional and impulsive pathways as defined byBlaszczynski (2000). In this final part of the paper we group our variables intonormal, emotional and impulsive risk variables and use discriminant functionanalyses to determine how well each group of variables accounts for pathological
Experience and Problem Gambling 257
Dow
nloa
ded
by [
Uni
vers
ity o
f C
onne
ctic
ut]
at 1
3:48
11
Oct
ober
201
4
gamblers. For this approach we used discriminant function analysis rather thanlogistic regression because we wanted to allow the variables to co-operate witheach other to form functions rather than to compete with each other for uniquevariance. Three separate discriminant analyses were conducted: (1) cognitive/experiential, (2) emotional/coping and (3) impulse control.
The sub-clinical participants were excluded from the computation ofparameters (set out of range). However, the program conveniently estimatedwhich group (non-problem or pathological) they resemble. In this analysis weonly used variables that are indirectly related to pathological gambling and couldbe called ‘risk factors’ (rather than symptoms). The risk factors we tested werederived from our interviews (see Turner et al., 2002) and confirmed in the aboveresults section of this paper. These analyses are not intended as definitive tests ofthe pathways model, but as an exploration of how well the theory fits the data.Replication with larger samples is needed before we can draw any firmconclusions. Note that this is a correlational study and in selecting a variable as a‘risk factor’ we are not claiming that the variable causes pathological gambling. Insome cases the reverse might well be true (e.g. depression).
Because the sample size is fairly small and some of the variables are notnormally distributed we also conducted 200 Monte Carlo simulations todetermine if the classification accuracy was greater than would occur by chance.This approach is called a permutation or randomisation test (Hayes, 1996; Hayes,2000) when used to define the type 1 error rate of non-normal t-tests or parallelanalyses when used with factor analysis (see Cota et al., 1993; Turner, 1998). In apermutation test, the researcher randomly creates a number of data sets in whichthe dependent and independent variables are scrambled. The results from thesimulated data can then be compared to real data. For these simulations we usedthe actual data for the predictors, but randomly sorted the grouping variable.
Normal (Cognitive/Experiential) Pathway
Individuals who have a gambling problem but are otherwise ‘normal’ maydevelop their problem because of either experiences of wins, socialisation to playor because of faulty beliefs about wins. We selected five variables for this analysis:size of first win, big win ever, big win first time gambling, big win every now andthen and Random Events Knowledge scores. The GCQ was not included in thisanalysis because it is too closely tied to symptoms (high scores imply excessivegambling). The canonical correlation was 0.61 and the overall l was 0.62, x2
(7) ¼ 31.0, p, 0.001. The function score for non-problem gamblers was20.73 andfor pathological gamblers the function score was 0.82. The structurematrix for thisanalysis and the significance tests for the variables are given in Table 6. Thisanalysis correctly identified 81.6% of non-problem gamblers as non-problemgamblers and 76.5% of pathological gamblers as pathological gamblers for anoverall placement accurate rate of 79.2%. A ‘leave one out’ cross validationanalysis correctly placed 75.0% of the sample. Placement accuracy was notassociated with gender, x2 (1) ¼ 0.03, ns. The observed placement accuracy was 3.5standard deviations above the mean placement accuracy of the randomisation test(M ¼ 61.2%, SD ¼ 5.2%, z ¼ 3.5, p , 0.001). These findings suggest that theclassification is significantly greater than would be obtained by chance. Usingthese function scores, 48.5% of the sub-clinical group were identified aspathological gamblers and 51.5% were identified as non-problem gamblers.
258 N. E. Turner et al.
Dow
nloa
ded
by [
Uni
vers
ity o
f C
onne
ctic
ut]
at 1
3:48
11
Oct
ober
201
4
Emotional Pathway
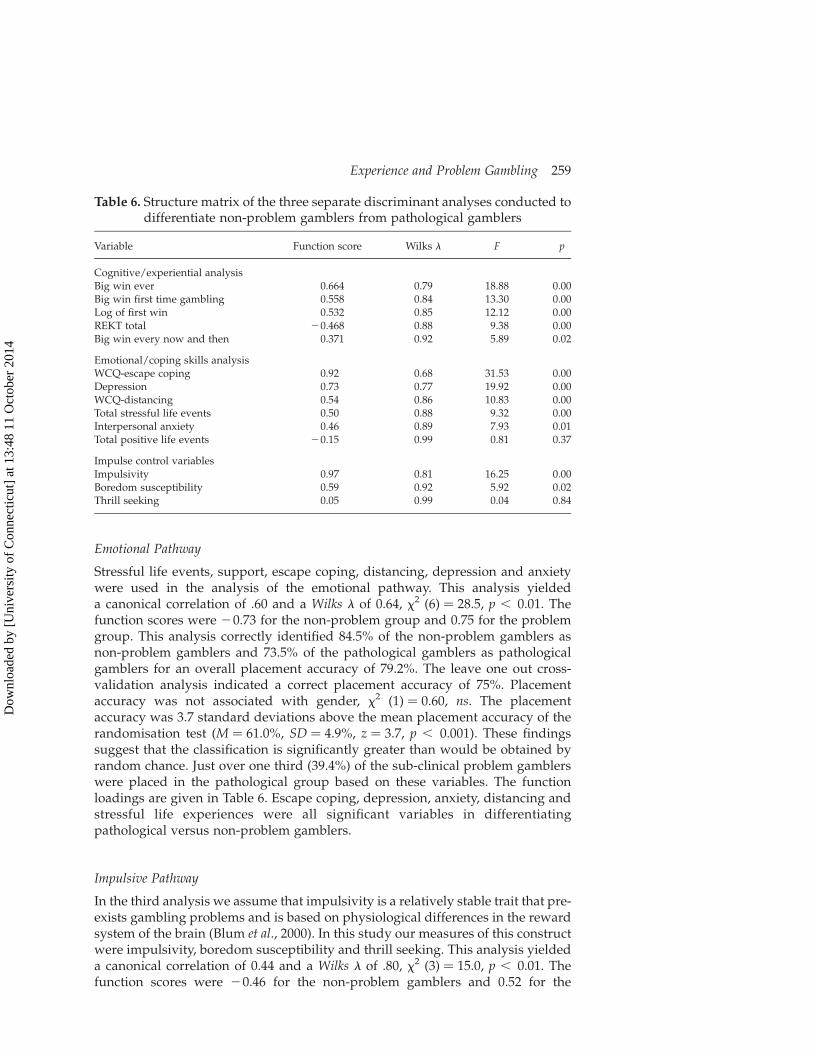
Stressful life events, support, escape coping, distancing, depression and anxietywere used in the analysis of the emotional pathway. This analysis yieldeda canonical correlation of .60 and a Wilks l of 0.64, x2 (6) ¼ 28.5, p , 0.01. Thefunction scores were 20.73 for the non-problem group and 0.75 for the problemgroup. This analysis correctly identified 84.5% of the non-problem gamblers asnon-problem gamblers and 73.5% of the pathological gamblers as pathologicalgamblers for an overall placement accuracy of 79.2%. The leave one out cross-validation analysis indicated a correct placement accuracy of 75%. Placementaccuracy was not associated with gender, x2 (1) ¼ 0.60, ns. The placementaccuracy was 3.7 standard deviations above the mean placement accuracy of therandomisation test (M ¼ 61.0%, SD ¼ 4.9%, z ¼ 3.7, p , 0.001). These findingssuggest that the classification is significantly greater than would be obtained byrandom chance. Just over one third (39.4%) of the sub-clinical problem gamblerswere placed in the pathological group based on these variables. The functionloadings are given in Table 6. Escape coping, depression, anxiety, distancing andstressful life experiences were all significant variables in differentiatingpathological versus non-problem gamblers.
Impulsive Pathway
In the third analysis we assume that impulsivity is a relatively stable trait that pre-exists gambling problems and is based on physiological differences in the rewardsystem of the brain (Blum et al., 2000). In this study our measures of this constructwere impulsivity, boredom susceptibility and thrill seeking. This analysis yieldeda canonical correlation of 0.44 and a Wilks l of .80, x2 (3) ¼ 15.0, p , 0.01. Thefunction scores were 20.46 for the non-problem gamblers and 0.52 for the
Table 6. Structure matrix of the three separate discriminant analyses conducted todifferentiate non-problem gamblers from pathological gamblers
Variable Function score Wilks l F p
Cognitive/experiential analysisBig win ever 0.664 0.79 18.88 0.00Big win first time gambling 0.558 0.84 13.30 0.00Log of first win 0.532 0.85 12.12 0.00REKT total 20.468 0.88 9.38 0.00Big win every now and then 0.371 0.92 5.89 0.02
Emotional/coping skills analysisWCQ-escape coping 0.92 0.68 31.53 0.00Depression 0.73 0.77 19.92 0.00WCQ-distancing 0.54 0.86 10.83 0.00Total stressful life events 0.50 0.88 9.32 0.00Interpersonal anxiety 0.46 0.89 7.93 0.01Total positive life events 20.15 0.99 0.81 0.37
Impulse control variablesImpulsivity 0.97 0.81 16.25 0.00Boredom susceptibility 0.59 0.92 5.92 0.02Thrill seeking 0.05 0.99 0.04 0.84
Experience and Problem Gambling 259
Dow
nloa
ded
by [
Uni
vers
ity o
f C
onne
ctic
ut]
at 1
3:48
11
Oct
ober
201
4
pathological gamblers. The function scores for the three variables are given inTable 6. Only boredom susceptibility and impulsivity contribute to the analysis.These three variables correctly placed 76.3% of the non-problem gamblers into thenon-problem group and 70.6% of the pathological gamblers into the problemgroup for an overall placement accuracy of 73.6%. The cross-validation analysisindicated a correct placement of 70.8%. Placement accuracy was not associatedwith gender, x2 (1) ¼ 0.09, ns. The placement accuracy was 2.8 standard deviationsabove the mean placement accuracy of the randomisation test (M ¼ 57.9%,SD ¼ 5.5%, z ¼ 2.8, p , 0.01). The analyses also placed 42.4% of the sub-clinicalgroup into the pathological gambler group.
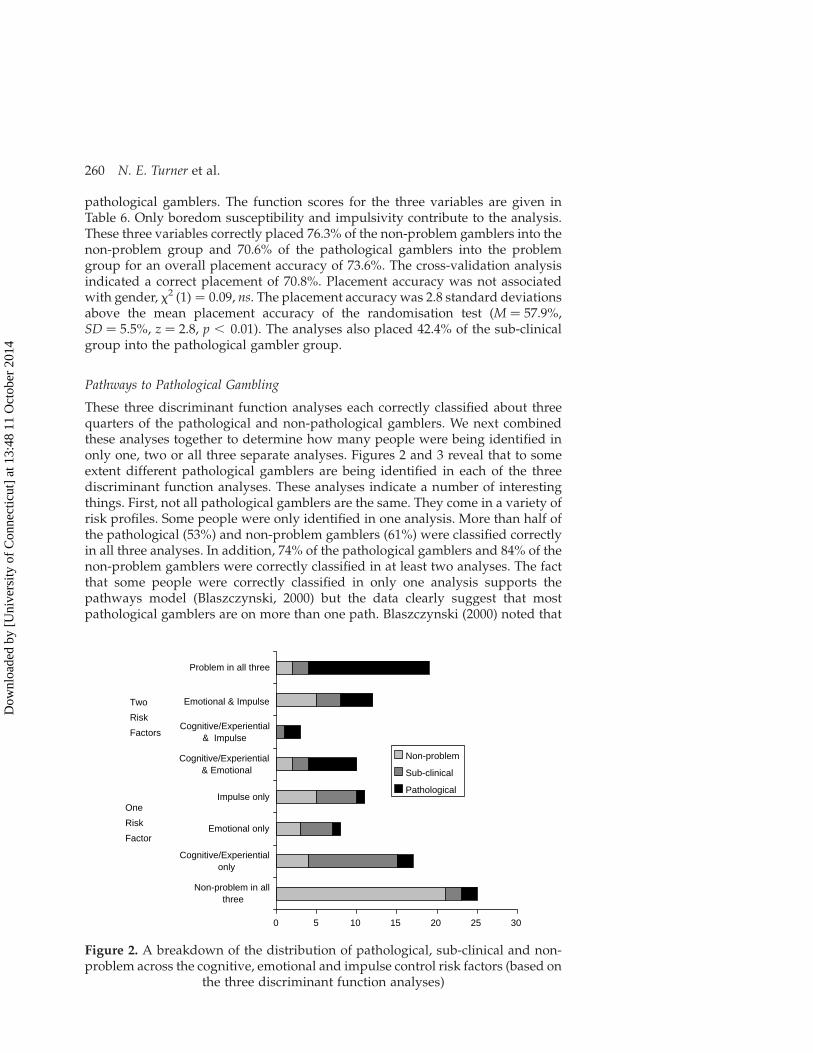
Pathways to Pathological Gambling
These three discriminant function analyses each correctly classified about threequarters of the pathological and non-pathological gamblers. We next combinedthese analyses together to determine how many people were being identified inonly one, two or all three separate analyses. Figures 2 and 3 reveal that to someextent different pathological gamblers are being identified in each of the threediscriminant function analyses. These analyses indicate a number of interestingthings. First, not all pathological gamblers are the same. They come in a variety ofrisk profiles. Some people were only identified in one analysis. More than half ofthe pathological (53%) and non-problem gamblers (61%) were classified correctlyin all three analyses. In addition, 74% of the pathological gamblers and 84% of thenon-problem gamblers were correctly classified in at least two analyses. The factthat some people were correctly classified in only one analysis supports thepathways model (Blaszczynski, 2000) but the data clearly suggest that mostpathological gamblers are on more than one path. Blaszczynski (2000) noted that
0 5 10 15 20 25 30
Non-problem in allthree
Cognitive/Experientialonly
Emotional only
Impulse only
Cognitive/Experiential& Emotional
Cognitive/Experiential& Impulse
Emotional & Impulse
Problem in all three
Non-problem
Sub-clinical
Pathological
Two
Risk
Factors
One
Risk
Factor
Figure 2. A breakdown of the distribution of pathological, sub-clinical and non-problem across the cognitive, emotional and impulse control risk factors (based on
the three discriminant function analyses)
260 N. E. Turner et al.
Dow
nloa
ded
by [
Uni
vers
ity o
f C
onne
ctic
ut]
at 1
3:48
11
Oct
ober
201
4
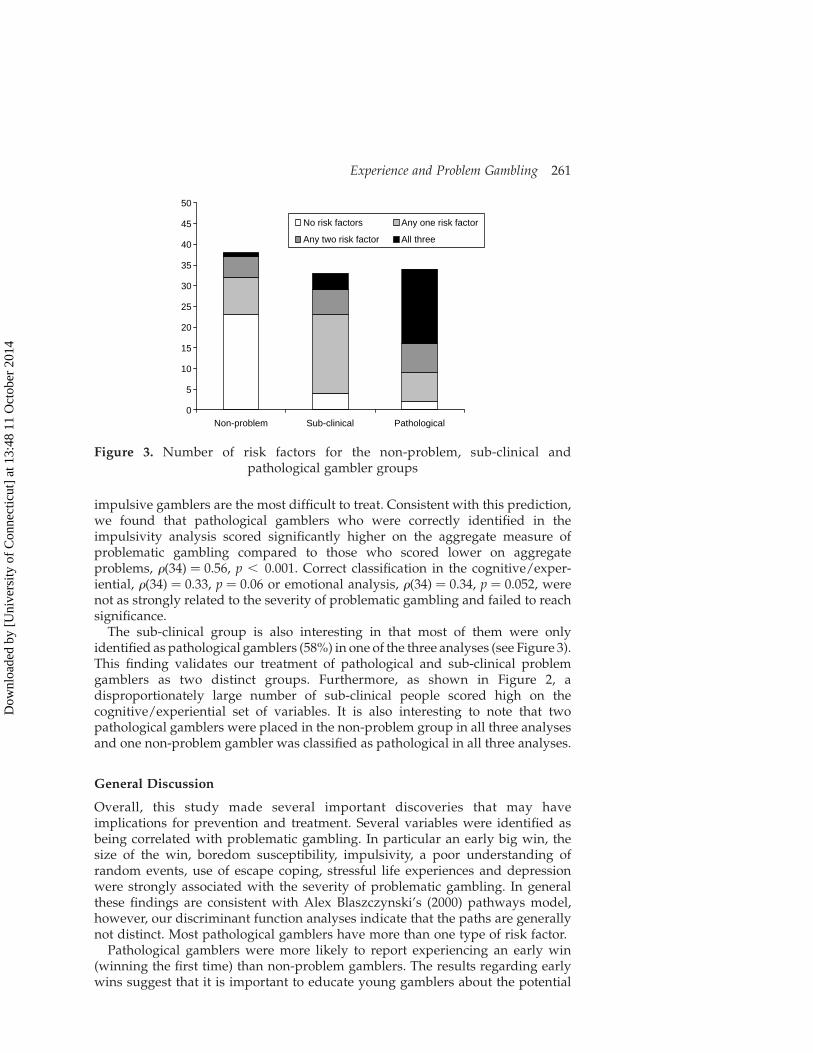
impulsive gamblers are the most difficult to treat. Consistent with this prediction,we found that pathological gamblers who were correctly identified in theimpulsivity analysis scored significantly higher on the aggregate measure ofproblematic gambling compared to those who scored lower on aggregateproblems, r(34) ¼ 0.56, p , 0.001. Correct classification in the cognitive/exper-iential, r(34) ¼ 0.33, p ¼ 0.06 or emotional analysis, r(34) ¼ 0.34, p ¼ 0.052, werenot as strongly related to the severity of problematic gambling and failed to reachsignificance.
The sub-clinical group is also interesting in that most of them were onlyidentified as pathological gamblers (58%) in one of the three analyses (see Figure 3).This finding validates our treatment of pathological and sub-clinical problemgamblers as two distinct groups. Furthermore, as shown in Figure 2, adisproportionately large number of sub-clinical people scored high on thecognitive/experiential set of variables. It is also interesting to note that twopathological gamblers were placed in the non-problem group in all three analysesand one non-problem gambler was classified as pathological in all three analyses.
General Discussion
Overall, this study made several important discoveries that may haveimplications for prevention and treatment. Several variables were identified asbeing correlated with problematic gambling. In particular an early big win, thesize of the win, boredom susceptibility, impulsivity, a poor understanding ofrandom events, use of escape coping, stressful life experiences and depressionwere strongly associated with the severity of problematic gambling. In generalthese findings are consistent with Alex Blaszczynski’s (2000) pathways model,however, our discriminant function analyses indicate that the paths are generallynot distinct. Most pathological gamblers have more than one type of risk factor.
Pathological gamblers were more likely to report experiencing an early win(winning the first time) than non-problem gamblers. The results regarding earlywins suggest that it is important to educate young gamblers about the potential
0
5
10
15
20
25
30
35
40
45
50
Non-problem Sub-clinical Pathological
No risk factors Any one risk factor
Any two risk factor All three
Figure 3. Number of risk factors for the non-problem, sub-clinical andpathological gambler groups
Experience and Problem Gambling 261
Dow
nloa
ded
by [
Uni
vers
ity o
f C
onne
ctic
ut]
at 1
3:48
11
Oct
ober
201
4
dangers of wins. Interestingly, the development of problematic gambling is notdependent upon a very large win. Rather it is the moderately sized wins and winsthat follow a loss that are associated with gambling problems. The effect of winsfor example was found to peak at around $1000, suggesting that a moderatelysized win is sufficient to establish problematic gambling behavior. This finding isconsistent with the description by Wexler (2002) of his own first win. In hisfascinating account, he describes how a win of $54 lead him to believe he couldbecome a millionaire.
The finding also produced clarification about the meaning of a ‘big win’. Formost people, a big win was somewhere between $1000 and $3000 and a big lossaverages between $300 and $400. Although we did find a trend towards larger bigloss estimates by pathological gamblers, overall the concept of big wins and lossesamongst these groups was remarkably similar. This is good news from a researchpoint of view because it suggests that when pathological and non-problemgamblers are surveyed about their experiences of big wins or losses their answersare comparable. However the large range of responses to these questions suggestsan enormous variation between individuals in terms of their concept of a big winor loss.
There were a number of findings supporting the view that stressful life events,depression, anxiety and poor coping skills (escape coping) are associated withproblematic gambling. These finding are consistent with previous research byGupta and Derevensky (1998) and support Jacob’s (1986; 1988) general model ofaddictions. The life events and triggers questionnaires suggest that in many casesthe stress pre-dated the gambling problem, however, it is difficult in aretrospective questionnaire to determine the extent to which negative affect wasa cause or an effect. We cannot be certain if the negative experiences actually pre-dated the gambling or if the current stress in a pathological gambler’s life biasedtheir interpretation of their youth. Interestingly the fact that escape coping was thestrongest effect amongst this set of variable suggests that problem gambling mayhave more to do with how gamblers cope with stress rather than the amount ofstress per se. Nonetheless, we cannot determine if their coping style was a cause oran effect of gambling problems.
Consistent with previous studies (Wagenaar, 1988; Rogers, 1998; Ladouceur andWalker, 1996) we found evidence for a relationship between erroneous beliefs andpathological gambling. Several GCQ sub-scales were associated with problemgambling, but the strongest relationship was not with beliefs in luck or skill, butrather in the belief that persistence pays off. We also found that knowledge ofrandomness was negatively related to aggregate gambling problems butknowledge of game specific probability was positively related to problemgambling. These findings suggest that pathological gamblers know the odds, butthey believe they can beat them because they do not understand the independenceof random events. These findings suggest that prevention information shouldfocus on the nature of random events rather than on the odds per se.
Pathological gamblers and non-problem gamblers report having similarreactions to wins. They most often feel happy, excited or feel a rush. However,pathological gamblers are more likely to report a boost in self-esteem as a result ofa win. Interestingly, people who reported feeling a boost in their self-esteemscored lower on REKT suggesting that the boost in self-esteem may be due toerroneous beliefs. Perhaps if an individual understands the nature of randomchance they may be less likely to interpret a win as a consequence of their
262 N. E. Turner et al.
Dow
nloa
ded
by [
Uni
vers
ity o
f C
onne
ctic
ut]
at 1
3:48
11
Oct
ober
201
4
behaviour. In addition people who had a poor knowledge of random chance alsoreport relying on escape to cope with stress. In contrast, those participants whoengage in more responsible gambling practices, such as setting limits alsoexhibited more knowledge of random events replicating the findings from Turneret al. (2005). These findings suggest that there is an important relationship betweenemotional and cognitive vulnerabilities and that it may be possible to preventsome problematic gambling through education about the independence ofrandom events.
This study offers strong insights into the complexity of problem gambling thatmay be useful in treatment. Individuals with a pre-existing emotionalvulnerability need help coping with stress and other emotional issues. Thosewho are physiologically impulsive may benefit from behaviour modificationprograms that teach a person how to control their impulses or from medicationsused in the treatment of impulse control disorders (e.g. ADHD).
Throughout our analysis we identified a number of variables that predictedproblem gambling: depression, use of escape coping, log value of first win,stressful life experiences around the time when the participant took up gambling,knowledge of randomness, impulsivity and boredom susceptibility. Thesefindings by and large support Blaszczynski’s (2000) pathway view of problemgambling. As expected, the impulse control analysis identified the fewestpathological gamblers, but those who were identified were the most severe casesof pathological gamblers. The results of the three separate discriminant functionanalyses found that variables related to the different paths identified differentpeople. However, we also found that most pathological gamblers have risk factorsrelated to two or three pathways. Consistent with Blaszczynski’s model we foundthat sub-clinical problem gamblers for the most part were only identified aspathological in one of the three analyses. Perhaps the main reason the sub-clinicalproblem gamblers have a relatively mild problem is that they only possess onetype of risk factor. The large number of sub-clinical people identified in thecognitive/experiential analysis is also consistent with Blaszczynski’s argumentthat the ‘normal’ pathway is the least severe group. One direction for future studywould be to determine if having only one risk factor at present (e.g. erroneousbeliefs) makes one vulnerable to developing a pathology if the person acquiresanother risk factors (e.g. a traumatic life event)?
As with all research there are a number of limitations to the findings of thispaper. First, the sample was non-random. Second, the sample was too small todetermine if the variables that differentiate non-problem and pathologicalgamblers are additive or interact in some manner. Third, the response rate wasonly 53%. This is good compared to other mail surveys but it means that we havedata from only half of those who could have been included in the study.We cannotdetermine if there were some characteristics of the people who did respond thatwere different from those who did not. Fourth, the sample is too small toadequately control for differences in the background and demographic variablesof the sample (e.g. ethnic group).We cannot rule out the possibility that our resultsare in part due to sampling problems. Fifth, several variables including stressfullife experiences, timing and size of previous wins are retrospective in nature andwe cannot verify the accuracy of these findings. Sixth our test packageincorporated too fewmeasures of impulsivity. Finally, the research is correlationalin nature and therefore any claims regarding the cause and effect relationshipsamong the variables cannot be made. Presented here is some compelling
Experience and Problem Gambling 263
Dow
nloa
ded
by [
Uni
vers
ity o
f C
onne
ctic
ut]
at 1
3:48
11
Oct
ober
201
4
information on variables that distinguish recreational gamblers from pathologicalgamblers. Further research is needed to verify these findings.
Summary
In summary, the data presented in this paper suggest that pathological gamblingis associated with a number of different variables including erroneous beliefsabout random events, early big wins, negative moods, stressful life events andimpulsivity. In general these findings are consistent with Blaszczynski’s (2000)pathways model. In fact we have not found any variable to predict pathologicalgambling that is inconsistent with this model. However, the discriminant functionanalyses conducted in this paper indicate that the paths are in general not distinctbut rather mostly overlap. Most pathological gamblers have elevated scores onmore than one type of risk factor. However, sub-clinical problem gamblers for themost part were only linked to one set of risk factors.
Acknowledgements
This study was funded by a grant from the Ontario Ministry of Health: SubstanceAbuse Bureau. The ideas expressed are those of the authors and do not necessarilyreflect those of either the Ontario Ministry of Health: Substance Abuse Bureau orthe Centre for Addiction and Mental Health. The study was reviewed andapproved by the CAMH research ethics board as Protocol #2/2000.
References
Abbott, M.W. and Volberg, R.A. 1996. ‘The New Zealand National Survey of Problem and PathologicalGambling’, Journal of Gambling Studies, 12(2), pp. 143–60.
American Psychiatric Association. 1994. Diagnostic and Statistical Manual of Mental Disorders (4th edn).American Psychiatric Association, Washington, DC.
Barrat, E.S. 1987. ‘Impulsiveness and anxiety: information processing and electroencephalographtopography’, Journal of Research in Personality, 21, pp. 453–63.
Blanco, C. 2006. ‘Theoretical models of pathological gambling’, Journal of Gambling Issues, 15. Availableat www.camh.net/egambling/issue15/index.html, accessed 5 September 2006.
Blaszczynski, A. 2000. ‘Pathways to pathological gambling: Identifying topologies’, Journal of Gambling
Issues, 1. Available at http://www.camh.net/egambling/issue1/feature/index.html, accessed 5September 2006.
Blum, K., Braverman, E.R. andHolder, J.M. 2000. ‘Reward deficiency syndrome: A biogenetic model forthe diagnosis and treatment of impulsive, addictive and compulsive behaviors’, Journal of
Psychoactive Drugs, 32, Suppl., pp. 1–112.Cota, A.A., Longman, R.S., Holden, R.R., Fekken, C. and Xinaris, S. 1993. ‘Interpolating 95 percentileeigenvalues from random data: an empirical example’, Education and Psychological Measurement, 53,pp. 585–96.
Custer, R.L. and Milt, H. 1985. When Luck Runs Out. Facts on File Publications, New York.Dickerson, M. 2003. ‘Pathological gambling: What’s in a name? Or, how the United States got it wrong’,in G. Reith (ed.) Gambling: Who Wins? Who Loses? Prometheus Books, Amherst, NY: pp. 191–207.
Dorion, J.P. and Nicki, R.M. 2001. ‘Epidemiology of problem gambling in Prince Edward Island:A Canadian microcosm’, Canadian Journal of Psychiatry, 46, pp. 413–7.
Eckblad, G.F. and von der Lippe, A.L. 1994. ‘Norwegian lottery winners: Cautious realists’, Journal ofGambling Studies, 10, pp. 305–22.
Folkman, S. and Lazarus, R.S. 1988. Ways of Coping Questionnaire Manual. Consulting PsychologistsPress, Redwood City, CA.
Griffiths, M. 1995. Adolescent Gambling. Routledge, London.
264 N. E. Turner et al.
Dow
nloa
ded
by [
Uni
vers
ity o
f C
onne
ctic
ut]
at 1
3:48
11
Oct
ober
201
4

Griffiths, M. and Delfabbro, P. 2001. ‘The biopsychosocial approach to gambling: contextual factors in
research and clinical interventions’, Journal of Gambling Issues, 5. Available at http://www.camh.net/
egambling/issue5/feature/index.html, accessed 4 September 2006.
Gupta, R. and Derevensky, J.L. 1998. ‘An empirical examination of Jacobs’ General Theory of
Addictions: Do adolescent gamblers fit the theory?’, Journal of Gambling Studies, 14(1), pp. 17–50.
Hayes, A.F. 1996. ‘Permutation test is not distribution-free: testing H. p=0’, Psychological Methods, 1,
pp. 184–98.
Hayes, A.F. 2000. ‘Randomization tests and the equality of variance assumption when comparing
groups means’, Animal Behavioral, 59, pp. 653–6.
Jacobs, D.F. 1986. ‘A general theory of addictions: a new theoretical model’, Journal of Gambling Behavior,
2, pp. 15–31.
Jacobs, D.F. 1988. ‘Evidence for a common dissociative-like reaction among addicts’, Journal of Gambling
Behavior, 4, pp. 27–37.
Kaplan, H.R. 1988. ‘Gambling among lottery winners: before and after the big score’, Journal of Gambling
Studies, 4, pp. 171–82.
Ladouceur, R. and Walker, M. 1996. ‘A cognitive perspective on gambling’, in P. Salkovskis (ed.) Trends
in Cognitive and Behavioural Therapies. John Wiley, Chichester, UK, pp. 89–120.
Lesieur, H.R. and Blume, S.B. 1987. ‘The South Oaks Gambling Screen (SOGS): A new instrument for
the identification of pathological gamblers’, American Journal of Psychiatry, 144(9), pp. 1184–8.
Lesieur, H.R. and Blume, S.B. 1993. ‘Revising the South Oaks Gambling Screen in different settings’,
Journal of Gambling Studies, 9, pp. 213–33.
Leary, M.R. 1983. ‘Social anxiousness: The construct and its measurement’, Journal of Personality
Assessment, 47, pp. 66–75.
Marlatt, G.A. 1985. ‘Situation determinants of relapse and skill-training interventions’, in G.A. Marlatt
and J.R. Gordon (eds) Relapse Prevention: Maintenance Strategies in the Treatment of Addictive Behaviours.
Guilford, New York: pp. 71–126.
Peele, S. 2001. ‘Is gambling an addiction like drug and alcohol addiction?’, Electronic Journal of Gambling
Issues, 3. Available at www.camh.net/egambling/issue3/index.html, accessed 4 September 2006.
Peele, S. 2003. ‘Is gambling an addiction like drug and alcohol addiction? Developing realistic and
useful conceptions of compulsive gambling’, in G. Reith (ed.) Gambling: Who Wins? Who Loses?
Prometheus Books, Amherst, NY: pp. 208–19.
Radloff, L.S. 1977. ‘The CES-D scale: A self-report depression scale for researcher in the general
population’, Applied Psychological Measurement, 1, pp. 385–401.
Robinson, J.P., Shaver, P.R. and Wrightsman, L.S. 1991. Measures of Personality and Social Psychological
Attitudes. Academic Press, Toronto.
Rogers, P. 1998. ‘The cognitive psychology of lottery gambling: A theoretical review’, Journal of
Gambling Studies, 14, pp. 111–34.
Room, R., Turner, N.E. and Ialomiteanu, A. 1999. ‘Community effects of the opening of the Niagara
Casino: A first report’, Addiction, 94, pp. 1449–66.
Rush, B., Moxam Shaw, R. and Urbanoski, K. 2002. ‘Characteristics of people seeking help from
specialized programs for the treatment of problem gambling in Ontario’, Electronic Journal of
Gambling Issues, 6, pp. 32–54 [Online]. Available at http://www.camh.net/egambling/issue6/index.
html, accessed 5 September 2006.
Shaffer, H.J. 2003. ‘A critical view of pathological gambling: Comorbidity makes for syndromes and
other strange bedfellows’, in G. Reith (ed.) Gambling: Who Wins? Who Loses? Prometheus Books,
Amherst, NY: pp. 175–90.
Shaffer, H.J., Hall, M.N. and Vander Bilt, J. 1999. ‘Estimating the prevalence of disordered gambling
behavior in the United States and Canada: A research synthesis’, American Journal of Public Health, 89,
pp. 1369–76.
Skinner, B.F. 1953. Science and Human Behavior. Free Press, New York.
Smith, G.J. and Wynne, H.J. 2004. VLT Gambling in Alberta: A Preliminary Analysis. Alberta Gambling
Research Institute. Available at www.abgaminginstitute.ualberta.ca/20.cfm, accessed 5 September
2006.
Toneatto, T. 1999. ‘The Gambling Cognitions Questionnaire’. Paper presented at the annual convention
of the American Psychological Association, Boston.
Turner, N.E. 1998. ‘Doubling vs. constant bets as strategies for gambling’, The Journal of Gambling
Studies, 14, pp. 413–29.
Turner, N.E. and Liu, E. 1999. ‘The naive human concept of random events’, Paper presented at the
August 1999 conference of the American Psychological Association, Boston.
Experience and Problem Gambling 265
Dow
nloa
ded
by [
Uni
vers
ity o
f C
onne
ctic
ut]
at 1
3:48
11
Oct
ober
201
4

Turner, N.E., Ialomiteanu, A. and Room, R. 1999. ‘Checkered expectations: predictors of approval ofopening a casino in the Niagara community’, Journal of Gambling Studies, 15, pp. 45–70.
Turner, N.E., Wiebe, J., Falkowski-Ham, A., Kelly, J. and Skinner, W. 2005. ‘Public awareness ofresponsible gambling and gambling behaviours in Ontario’, International Gambling Studies, 5(1),pp. 95–112.
Turner, N.E., Zangeneh, M., Littman Sharp, N. and Spence, W. 2002. ‘Why do some develop gamblingproblems while others do not?’, A report prepared for the Ministry of Health and Long Term Care.Available at http://www.gamblingresearch.org, accessed 5 September 2006 (search for Turner).
Wagenaar, W.A. 1988. Paradoxes of Gambling Behavior. Lawrence Erlbaum Associates, London.Wexler, A. 2002. ‘Arnie Wexler’s story: I am a recovering compulsive gambler who placed my last betApril 10, 1968’, The Electronic Journal of Gambling Issues, 7. Available at www.canh.net/egambling/issue7/index.html, accessed 5 September 2006.
Zuckerman, M. 1979. Sensation Seeking: Beyond the Optimal Level of Arousal. Lawrence ErlbaumAssociates, Hillsdale, NJ.
266 N. E. Turner et al.
Dow
nloa
ded
by [
Uni
vers
ity o
f C
onne
ctic
ut]
at 1
3:48
11
Oct
ober
201
4