gambling and problem gambling in saskatchewan - jogo remoto
TRANSCRIPT
GAMBLING AND PROBLEM GAMBLING IN SASKATCHEWAN
JANUARY 2002
FINA
L R
E
POR
T
Prepared by:Harold J. Wynne, Ph.D.
Canadian Centre on Substance Abuse Ottawa, Ontario
__________________________________________________________________________________________ Gambling and Problem Gambling in Saskatchewan (2002) Final Report
TABLE OF CONTENTS EXECUTIVE SUMMARY.............................................................................................................. i CHAPTER I � INTRODUCTION ................................................................................................. 1 1. Gaming in Saskatchewan Since 1993 ................................................................................. 2
1.1 Summary ................................................................................................................. 2 1.2 Background ............................................................................................................. 3
2. Researching Gambling and Problem Gambling.................................................................. 7
2.1 Prevalence Studies in Canada ................................................................................. 8 2.2 Problem Gambling as a Public Health Issue ......................................................... 10
3. Measuring Problem Gambling in Canada ......................................................................... 14 CHAPTER II - RESEARCH DESIGN ......................................................................................... 17 1. Purpose and Objectives ..................................................................................................... 17 2. Methodology ..................................................................................................................... 17
2.1 Research Questions ............................................................................................... 18 2.2 Telephone Survey.................................................................................................. 18 2.3 Questionnaire ........................................................................................................ 19 2.4 Identifying Gambler Sub-Types............................................................................ 23 2.5 Data Analysis ........................................................................................................ 24 2.6 Definition of Terms............................................................................................... 25 2.7 Limitations ............................................................................................................ 27
CHAPTER III � GAMBLING IN SASKATCHEWAN............................................................... 29 1. Gambling Prevalence ........................................................................................................ 29 2. Demographic Profile of Saskatchewan Gamblers............................................................. 30 3. Gambling Activities, Frequency of Play, and Expenditures for Gamblers ....................... 32 4. Changes in Gambling in Saskatchewan Since 1993 ......................................................... 34 CHAPTER IV � PROBLEM GAMBLING IN SASKATCHEWAN........................................... 37 1. Problem Gambling Prevalence.......................................................................................... 37 2. Demographic Profile of Saskatchewan Problem Gamblers .............................................. 38
__________________________________________________________________________________________ Gambling and Problem Gambling in Saskatchewan (2002) Final Report
3. Gambling Activities, Frequency of Play, and Expenditures for Problem Gamblers ....................................................................................................... 43
3.1 Gambling Activities .............................................................................................. 43 3.2 Frequency/Duration of Play and Expenditures ..................................................... 46
4. Gambling Motivation and Co-Participation...................................................................... 54 5. Problem Gambling Behaviour and Consequences ............................................................ 56
5.1 Problem Gambling Behaviour............................................................................... 56 5.2 Adverse Consequences of Problem Gambling Behaviour .................................... 60 5.3 Problem Gambling Correlates............................................................................... 65 5.4 Changes in Problem Gambling in Saskatchewan Since 1993............................... 66
CHAPTER V � SELECTED HEALTH STATUS INDICATORS IN SASKATCHEWAN GAMBLERS................................................................ 68 1. Health Problems ................................................................................................................ 68 2. Alcohol and Drug Use....................................................................................................... 70 CHAPTER VI � CONCLUSIONS AND IMPLICATIONS......................................................... 72 1. Gambling in Saskatchewan ............................................................................................... 72 1.1 Gambling Prevalence ............................................................................................ 72 1.2 Demographic Profile of Saskatchewan Gamblers................................................. 73 1.3 Gambling Activities, Frequency of Play and Expenditures for Gamblers.................................................................................... 73 1.4 Changes in Gambling in Saskatchewan Since 1993 ............................................. 74 2. Problem Gambling in Saskatchewan................................................................................. 75 2.1 Problem Gambling Prevalence.............................................................................. 75 2.2 Demographic Profile of Saskatchewan Problem Gamblers .................................. 75
2.3 Gambling Activities, Frequency of Play, Expenditures And Motivation for Problem Gamblers ................................................................ 77
2.4 Problem Gambling Behaviour and Consequences ................................................ 78 3. The Health Status of Saskatchewan Gamblers.................................................................. 80 4. Concluding Comment ....................................................................................................... 80
__________________________________________________________________________________________ Gambling and Problem Gambling in Saskatchewan (2002) Final Report
REFERENCES.............................................................................................................................. 82 APPENDIX 1 - Prairie Research Associates Inc. Telephone Survey Methodology Report......... 87
__________________________________________________________________________________________ Gambling and Problem Gambling in Saskatchewan (2002) Final Report
LIST OF TABLES Table 1 - Types of Gaming in Saskatchewan Between 1993 and 2000 ....................................... 3 Table 2 - Charitable Spending and Revenue Between 1993 and 2000......................................... 6 Table 3 - Saskatchewan Gambling and Problem Gambling Questionnaire Items...................... 19 Table 4 - New Non-CPGI Items Included and CPGI Items Excluded from the Saskatchewan Survey Instrument................................................................................ 21 Table 5 - Scored Items that Discriminate Gambler Sub-Types.................................................. 24 Table 6 - Saskatchewan Gamblers by Community..................................................................... 29 Table 7 - Gender, Age, and Marital Status of Gamblers ............................................................ 30 Table 8 - Education and Income................................................................................................. 31 Table 9 - Ethnicity ...................................................................................................................... 32 Table 10 - Gambling Activity, Frequency, and Expenditure........................................................ 33 Table 11- Comparison of Gambling Activities Between 1993 and 2001.................................... 34 Table 12 - Comparisons of Gambling Expenditures Between 1993 and 2001............................. 36 Table 13 - Classification of Saskatchewan Adult Gamblers by Sub-Type .................................. 37 Table 14 - Area of Residence of Saskatchewan Gambler Sub-Type............................................ 38 Table 15 - Gender, Age, and Marital Status of Problem Gamblers.............................................. 39 Table 16 - Education and Income................................................................................................. 40 Table 17 - Ethnicity ...................................................................................................................... 41 Table 18 - Minor Children Living in Residence........................................................................... 42 Table 19 - Employment Status and Occupation ........................................................................... 42 Table 20 � Gambling Activity by Gambler Sub-Type .................................................................. 46 Table 21 - Weekly Play by Game and Gambler Sub-Type .......................................................... 51 Table 22 - Duration of Play/Session by Gambler Sub-Type ........................................................ 52 Table 23 - Median Monthly Expenditure by Gambler Sub-Type................................................. 53 Table 24 - Reasons for Gambling by Gambler Sub-Type ............................................................ 54 Table 25 - Co-Participants by Gambler Sub-Type ....................................................................... 55 Table 26 - Problem Gambling Behaviour by Gambler Sub-Type................................................ 57 Table 27 - Recognition of Gambling Problem by Gambler Sub-Type......................................... 59 Table 28 - Adverse Consequences by Gambler Sub-Type........................................................... 61 Table 29 - Household Impact by Gambler Sub-Type................................................................... 62 Table 30 - Household Financial Impact by Gambler Sub-Type................................................... 64 Table 31 - Age of First Gambling Experience by Gambler Sub-Type......................................... 65 Table 32 - Family Gambling Problem by Gambler Sub-Type ..................................................... 66 Table 33 - Health Status by Gambler Sub-Type........................................................................... 69 Table 34 - Alcohol and Drug Use by Gambler Sub-Type ............................................................ 70 Table 35 - Comparison of Saskatchewan and Canadian PGSI Scores ......................................... 81
__________________________________________________________________________________________ Gambling and Problem Gambling in Saskatchewan (2002) Final Report
i
EXECUTIVE SUMMARY
Introduction
In 1993, the Government of Saskatchewan established the Minister�s Advisory Committee on the Social Impacts of Gaming. One of the Committee�s main initiatives was to conduct a province-wide survey to provide baseline data on gaming participation rates and the current prevalence of problem gambling. In 1994, the completed study was presented to the Ministers responsible for Health and the Saskatchewan Liquor and Gaming Authority and the study results and recommendations from the Committee helped shape the Saskatchewan government policy response to gaming and problem gambling. In 1998, the Saskatchewan government planned to replicate the provincial gambling study to determine if gaming participation and problem gambling prevalence rates had changed over the previous five years. However, at that time, there was growing concern amongst Canadian provinces that a new approach and measurement instrument was needed to guide problem gambling prevalence studies in the general population. Consequently, rather than conducting a five-year replication study that relied on dated methods, the Saskatchewan government chose to collaborate with the other provinces in developing a new survey instrument�the Canadian Problem Gambling Index (CPGI). In 2001, the CPGI was finally validated for use in Canadian problem gambling prevalence research, and Saskatchewan became the first province to apply this new instrument in a province-wide survey. This report presents the findings from this research.
Research Design The research design is a descriptive telephone survey of a random sample of 1,848 Saskatchewan adults 19 years-of-age and older. A survey questionnaire based on the new Canadian Problem Gambling Index (CPGI) guided the telephone interviews, and the survey achieved a 60% response rate, with results for the sample being accurate within ±2.3% nineteen times out of twenty. The CPGI identifies four sub-types of gamblers, namely those who (1) have no problems with their gambling, (2) are at low risk for developing a problem, (3) are at moderate risk, or (4) have a serious gambling problem. In research, this convention of classifying and labeling gambler sub-types helps researchers, clinicians, and program specialists identify and describe people who have a gambling problem or are at-risk for developing one. Unfortunately, the labels themselves can isolate and stigmatize the person with a gambling problem. There are numerous examples in health research where labels have ostracized the afflicted within societies (e.g., leper, addict, alcoholic, schizophrenic, AIDS victim), thus adding to the individual�s torment. While this study uses conventional labels including �at-risk gambler� and �problem gambler,� it must be stressed that the focus should be on the problem gambling behaviour, and not on the individual. This is a very important distinction that can help focus public health discussion and communication on the issue of problem gambling behaviour, rather than on problem gamblers, thus mitigating the potential harmful effect the problem gambling label may have for the individual.
__________________________________________________________________________________________ Gambling and Problem Gambling in Saskatchewan (2002) Final Report
ii
Gambling in Saskatchewan Gambling in Saskatchewan is clearly a very popular recreational and entertainment pastime as it is practiced in some form by 87% of the adult population throughout the province. Opportunities to gamble are ubiquitous, existing in legalized and provincially regulated venues (e.g., casinos, race tracks, bingo halls); private licensed premises (e.g., VLTs); shopping malls and convenience stores (e.g., lottery tickets, Sport Select); the family environment (e.g., card/board games), illegal gambling establishments (e.g., unregulated card rooms); the workplace (e.g., sports pools) and literally in the home, through the advent of Internet access to on-line gambling sites. Gambling in virtually every form is easily accessible to both urban and rural Saskatchewan residents, and study findings show that both groups take advantage of gambling opportunities that are available. Key Findings • 87% of Saskatchewan adults have
gambled on at least one activity in the past year.
• Saskatchewan gamblers are as likely to
reside in small towns/rural communities (85%) as in small cities, Regina, and Saskatoon (87%).
• Men (87%) and women (87%) are
equally likely to be gamblers. • Young adults age 25 to 30 (93%) are
most likely to be gamblers, while senior citizens 65 and older (79%) are least likely.
• Those with an annual household income
of less than $20,000 (78%) are least likely to have gambled in the past year.
• Saskatchewan adults are most likely to purchase raffle/fund raising (63.7%) and lottery (62.6%) tickets as their most preferred form of gambling. These are the only gambling activities that are engaged in by the majority of Saskatchewan gamblers.
• The next most preferred gambling
activity is the purchase of instant win or scratch tickets (27.5%), followed by gambling on coin slot machines at casinos (20.3%) and on VLTs in bars or lounges (17.7%).
• Most Saskatchewan gamblers do not
engage in any type of gambling activity on a weekly basis. The most prevalent weekly gambling activities are lottery ticket purchases (34.2%), bingo (23.9%), and playing Sport Select (23.5%).
• Saskatchewan gamblers spend the most
per month wagering on the following games: bingo ($20), casino table games ($20), coin slots ($17.50), VLTs ($15), and games of skill ($15).
Implications A policy question that faces all jurisdictions in North America is, �How much gambling is enough?� To address this policy question, it is advisable for all governments to examine the socio-economic costs and benefits of future gambling expansion.
Problem Gambling in Saskatchewan In this survey, Saskatchewan gamblers are classified into five sub-types, and the prevalence rates for each of these is as follows: • Non gamblers (13.4%) • Non-problem gamblers (71.4%) • Low risk gamblers (9.3%)
__________________________________________________________________________________________ Gambling and Problem Gambling in Saskatchewan (2002) Final Report
iii
• Moderate risk gamblers (4.7%) • Problem gamblers (1.2%) Based on these rates, it is estimated that between 87,800 and 122,200 adults in Saskatchewan are at risk for developing a gambling problem, and an additional 5,600 to 13,200 already have a serious gambling problem. At-risk and problem gamblers may be found in both urban and rural communities across the province, although residents in Regina and Saskatoon appear to be somewhat more at-risk, or to already be experiencing a serious gambling problem. Key Findings Demographics • Males are more likely than females to
have a gambling problem (1.6% vs. 1.3%) or to be at low or moderate risk for developing a problem (20.7% vs. 11.8%).
• The youngest age group (19-24 years) is
most likely to experience a gambling problem (2.4%) or to be at-risk for developing a problem (28.8%).
• In contrast, gamblers 70 years and older
are less likely to be at-risk for developing a gambling problem (12.4%) and none presently score as having a problem.
• Married gamblers are less likely than
single gamblers to have a gambling problem (0.8% vs. 2.3%) or to be at-risk (11.8% vs. 24.6%) for developing one.
• Gamblers who have not gone beyond a
high school education are at greater risk than those with a post-secondary education for developing a gambling problem (20.2% vs. 12.3%) or to already have a problem (2.4% vs. 0.6%).
• Gamblers with the lowest annual household income of <$20,000.00 (22.1%) are at the greatest risk for developing a gambling problem. Furthermore, these low-income gamblers (4.3%) are more likely than those in higher income groups to score as problem gamblers.
• Aboriginal gamblers are significantly
more likely than gamblers in other ethnic groups to be both at-risk for developing a gambling problem (34.7%) and to presently score as problem gamblers (12%).
• In the survey sample of 1848 adults,
there are reportedly 22 minors living in households where the respondent is a problem gambler and a further 192 living in a home where the respondent is at-risk for developing a gambling problem.
• The unemployed are more likely than
those who are employed to be at-risk for developing a gambling problem (26.2% vs. 15.8%) or to already be problem gamblers (7.1% vs. 1.1%).
Gambling Activities • Problem and at-risk gamblers are more
likely than non-problem gamblers to gamble on every type of activity, with the exception of purchasing raffle tickets, Internet gambling, and wagering on sports with a bookie (very few respondents gamble on these latter two activities).
• The greatest difference between problem
and non-problem gambler is for the following games: VLTs (78.3% vs. 14.8%), instant win tickets (78.3% vs. 27.7%), bingo (47.8% vs. 7.5%), coin slots (47.8% vs. 19.5%).
__________________________________________________________________________________________ Gambling and Problem Gambling in Saskatchewan (2002) Final Report
iv
• Problem and at-risk gamblers are more likely than non-problem gamblers to (1) wager weekly on every form of gambling activity; (2) wager for longer durations of time per gambling session, and (3) bet substantially more money each month on all forms of gambling. The exception is for purchasing raffle and fund-raising tickets, where there is little difference amongst the gambler sub-types.
• Problem gamblers (61.1%) are more
likely than non-problem gamblers (6.1%) to play VLTs weekly or more frequently.
• Problem gamblers are more likely than
non-problem gamblers to spend three or more hours/session at the following games: cards/board games with family or friends (66.7% vs. 37%); coin slots (45.5% vs. 8%); VLTs (44.4% vs. 1.1%).
• Problem gamblers are more likely than
non-problem gamblers to spend more each month on the following gambling activities: horse races ($400 vs. $5); VLTs ($200 vs. $10), coin slots ($200 vs. $10), bingo ($160 vs. $15.50).
Motivation • Most gamblers are motivated to wager
for three main reasons, namely (1) to win money, (2) for fun and entertainment, and (3) to support worthy causes. Problem and at-risk gamblers are most likely to endorse the former two reasons, and non-problem gamblers the latter.
• Problem gamblers are the most likely to
gamble alone, and the least likely to gamble with their spouse or partner. At-
risk gamblers are the most likely to gamble with friends or co-workers.
Problem gambling behaviour • In terms of their gambling behaviour,
problem and at-risk gamblers in Saskatchewan are more likely than non-problem gamblers to: • bet more than they can afford to lose
and to bet more than they intend. • increase wagers to maintain a
heightened level of excitement. • chase their gambling loses by
returning another day to win back their money.
• borrow money to finance their gambling.
• lie to family members about their gambling and hide evidence that they have been gambling.
• gamble to escape personal problems.
Consequences • As a result of this uncontrolled gambling
behaviour, problem and at-risk gamblers are more likely than non-problem gamblers to suffer adverse personal and social consequences, including:
• having people criticize their
gambling behaviour. • experiencing feelings of guilt. • experiencing negative financial
consequences, including receiving social assistance and food from the food bank and not paying household bills.
• having problems, including getting in serious arguments and physical attacks with family members or friends.
• having lost or nearly lost a relationship (including being separated or divorced), job, or
__________________________________________________________________________________________ Gambling and Problem Gambling in Saskatchewan (2002) Final Report
v
education/career opportunity as a result of uncontrolled gambling.
Health Status • Problem and at-risk gamblers are more
likely than non-problem gamblers to experience the following health-related problems: • psychological conditions, including
emotional illness, stress, anxiety, and depression.
• irritability and restlessness, including difficulty sleeping.
• learning disabilities. • suicide ideation • problems with alcohol, including
weekly or more frequent drinking and consuming more drinks per occasion.
• weekly or more frequent illegal drug use.
Problem recognition • Most Saskatchewan problem gamblers
are aware that they may have a gambling problem, and most want to stop gambling. Many have tried to do so unsuccessfully. Furthermore, problem gamblers are more likely to recognize that another family member also has a gambling problem.
Implications Problem gambling clearly afflicts a relatively small percentage (<2%) of the Saskatchewan population; however, there is a much larger percentage (14%) of adults who are at some level of risk for developing a problem. While these percentages seem small, especially when compared with the 70% of residents who enjoy gambling without experiencing any problems, they are nonetheless very significant when translated into the estimated number of people who
have a problem, or are in danger of developing one. So long as there is provincially sanctioned gambling in Saskatchewan, there must be a corresponding major governmental initiative to reduce the harm this causes for some residents Gambling Changes in Saskatchewan In both the 1993 and 2001 surveys, an identical number of Saskatchewan adults (87%) report having gambling on at least one activity in the past 12 months. Since the 1993 provincial gambling survey, there have been some changes in the types of gambling activities engaged in by Saskatchewan residents, including decreased participation in some activities (i.e., lotteries, sports pools, bets with friends, bingo, Sport Select, and horse races) and increased participation in others (i.e., raffles and VLTs). Monthly expenditures on all activities are greater in 2001 than 1993, with the largest monthly expenditure in both years being for bingo, and the greatest discrepancy being a three-fold increase for VLT play. Key Findings • In the 1993 and 2001 surveys, the top
ranked gambling activities were purchasing lottery (74% vs. 63%) and raffle tickets (57% vs. 64%).
• In 2001, fewer Saskatchewan gamblers
report wagering on all other gambling activities; with the exception of VLTs, where there is a slight increase over the past eight years (16% to 18%).
• For every gambling activity,
Saskatchewan gamblers in 2001 report
__________________________________________________________________________________________ Gambling and Problem Gambling in Saskatchewan (2002) Final Report
vi
spending more per month than did gamblers in 1993.
• For games included in both studies, the
largest monthly expenditure in each is for bingo (1993, $13.50; 2001, $20), and the largest difference is for VLT play (1993, $5; 2001, $15).
• It is not possible to directly compare
statistical changes in problem gambling prevalence rates and findings between the first prevalence study done in 1993 and the present study, as different research methods and screening instruments (i.e., CPGI vs. SOGS) are utilized in each.
Implications Comparisons between the 1993 and 2001 studies are limited, which demonstrates the need for a more sophisticated, longitudinal monitoring of gambling participation and expenditure rates for the entire inter-related constellation of gambling activities in Saskatchewan. This information will be valuable in advising policy decisions to expand, contract, or otherwise enhance/modify legalized gambling formats.
Gambling and Problem Gambling in Saskatchewan (2002) Final Report
1
CHAPTER I
INTRODUCTION
In 1993, the Saskatchewan government undertook a study to describe citizens� gambling involvement and to determine the prevalence of problem gambling in the adult population (Minister�s Advisory committee on the Social Impacts of Gaming, October, 1994). In the present study, the provincial government wishes to once again examine Saskatchewan adults� gambling practices, the prevalence of problem gambling in the adult population, and the socio-health implications of problem gambling in the province. The ultimate goal of this research is to provide information that will advise Saskatchewan Health and other allied agencies in the planning and development of prevention, education, treatment and subsequent research projects aimed at mitigating problem gambling in Saskatchewan. In the 1993 study, the South Oaks Gambling Screen (SOGS) was imbedded in the survey questionnaire and the SOGS was scored to identify non-problem, problem, and probable pathological gamblers in Saskatchewan. Recently, Saskatchewan Health participated in an inter-provincial Canadian research project that sought to conceptualize, operationally define, and subsequently measure problem gambling in the general population. A major outcome from this research was the development and validation of a new measurement instrument�the Canadian Problem Gambling Index (CPGI)�and the present Saskatchewan problem gambling prevalence survey is guided by the new CPGI (Ferris, Wynne, & Single, 1999). By utilizing the CPGI, the present study identifies non-problem, low-risk, moderate risk, and problem gamblers in Saskatchewan and explores differences amongst these gambler sub-types. The Canadian Centre on Substance Abuse (CCSA) in Ottawa conducted the three-year inter-provincial research project that resulted in the development of the CPGI, and the CCSA contracted with Saskatchewan Health to complete the present Saskatchewan gambling research project. Dr. Harold Wynne was the research team leader for the CPGI national research project and, on behalf of the CCSA, he was the principal investigator for this Saskatchewan problem gambling prevalence study. Evan Morris, a Regina researcher who has worked with Saskatchewan Health, served as the research project manager and Barbara Kahan of Kael Consulting in Regina provided professional statistical data analysis services to the project. Prairie Research Associates of Winnipeg was retained to conduct the telephone survey of adult Saskatchewan residents. The focus of this study is two fold; that is, to describe the gambling practices of adult Saskatchewan residents and to gain insight into the issue of problem gambling behaviour in this population. This introductory chapter begins with a brief update of gambling changes in Saskatchewan since the 1993 gambling study was conducted. It then proceeds with a discussion of researching gambling and problem gambling, problem gambling as a public health issue, and concludes with a brief discussion of the Measuring Problem Gambling in Canada project, which resulted in the development of the problem gambling measurement instrument (the CPGI) utilized in this study.
Gambling and Problem Gambling in Saskatchewan (2002) Final Report
2
1. Gaming in Saskatchewan Since 1993
1.1 Summary
As with the rest of Canada, Saskatchewan has seen significant changes to gaming in the province over the last ten years. In the early 1990s, gaming was widely available in the form of bingos, breakopen tickets, raffles, lotteries, and horse racing.
Electronic gaming was introduced in 1992 with the provincial VLT program. By the end of 1992, about 200 machines had been installed in approximately 70 sites in the southeast of the province. In the fall of 1993, when the survey for the initial problem gambling prevalence study was conducted, about 2300 machines were operational in approximately 500 sites throughout the province. As of March 31st, 2001, 3561 VLTs were located among 643 sites. The maximum number of VLTs that may operate in the province has been set by the government at 3600.
In 1993, casino gaming involved only table games play and was offered on a part-time periodic basis by seven exhibition associations (Lloydminster, Swift Current, Moose Jaw, Saskatoon, Regina, Prince Albert, and North Battleford). A total of 574 days of gaming were offered among these seven sites in 1993. In 1996, five fulltime commercial casinos were opened at which table game and slot machine play continues to be offered. The largest casino is located in Regina and operated by the Saskatchewan Gaming Corporation. The Saskatchewan Indian Gaming Authority operates casinos in North Battleford, Prince Albert, Yorkton, and on the White Bear First Nation. In 2001, in addition to the commercial casinos, the exhibition association in Saskatoon operates a fulltime casino with table games and VLTs, and the exhibition association in Moose Jaw operates a 4 day per week schedule, also with table games and VLTs.
Charitable gaming includes bingo, breakopen tickets, and raffles. Since 1993, the spending and net revenue generated by charitable gaming has declined about 10% overall. The largest decline in activity has been in breakopen ticket sales. Bingo spending has declined; however, industry restructuring has allowed the net proceeds to beneficiaries to be maintained. Since 1993, the number of fulltime (Class A) bingo halls has dropped through industry consolidation from 45 to 33. Raffle activity has grown; however, it remains the smallest part of the gaming market.
Horse racing continues to be available at the two main tracks, Marquis Downs on the Saskatoon Exhibition Association grounds, and Queensbury Downs on the Regina Exhibition Association grounds. The Yorkton Exhibition Association also hosts several days of racing each year. Wagering on horse racing declined approximately 13% from 1993 to 2001.
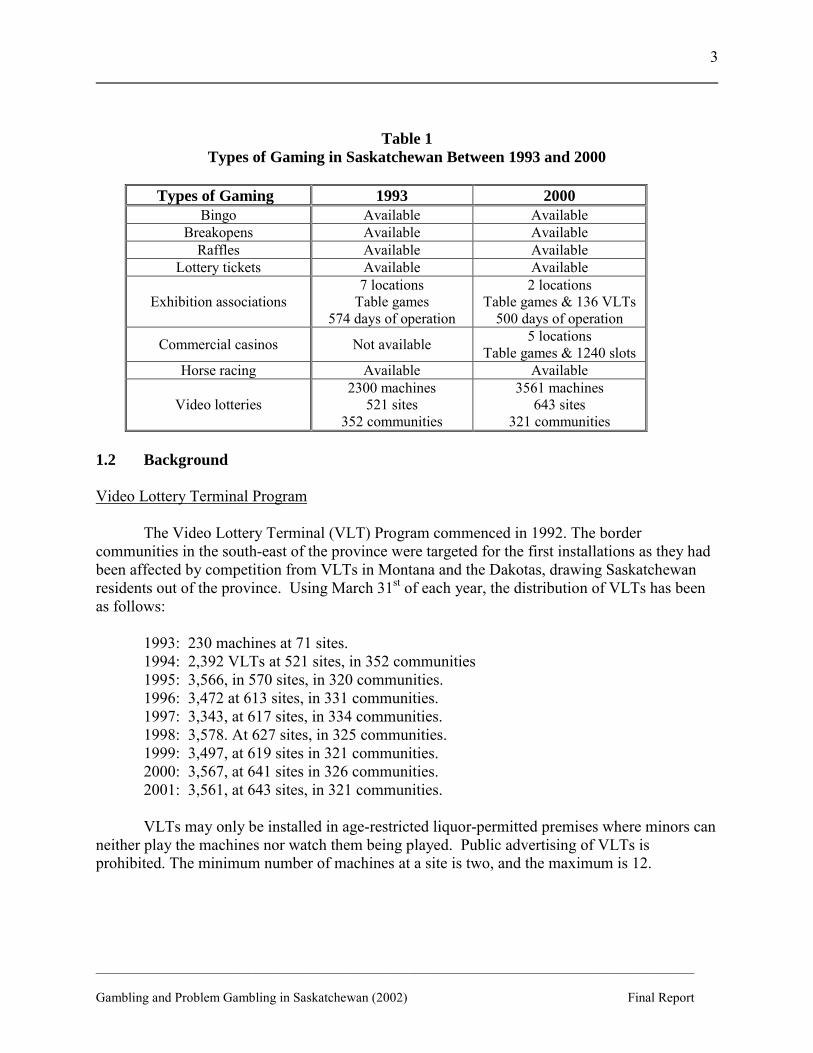
There were no major changes in lottery activity during the 1993 to 2001 period. Sales have remained steady however increasing expenses have meant a decline in the net proceeds to the beneficiaries. Table 1 provides a summary of gaming changes in Saskatchewan between 1993 and 2000.
__________________________________________________________________________________________ Gambling and Problem Gambling in Saskatchewan (2002) Final Report
3
Table 1 Types of Gaming in Saskatchewan Between 1993 and 2000
Types of Gaming 1993 2000
Bingo Available Available Breakopens Available Available
Raffles Available Available Lottery tickets Available Available
Exhibition associations 7 locations
Table games 574 days of operation
2 locations Table games & 136 VLTs
500 days of operation
Commercial casinos Not available 5 locations Table games & 1240 slots
Horse racing Available Available
Video lotteries 2300 machines
521 sites 352 communities
3561 machines 643 sites
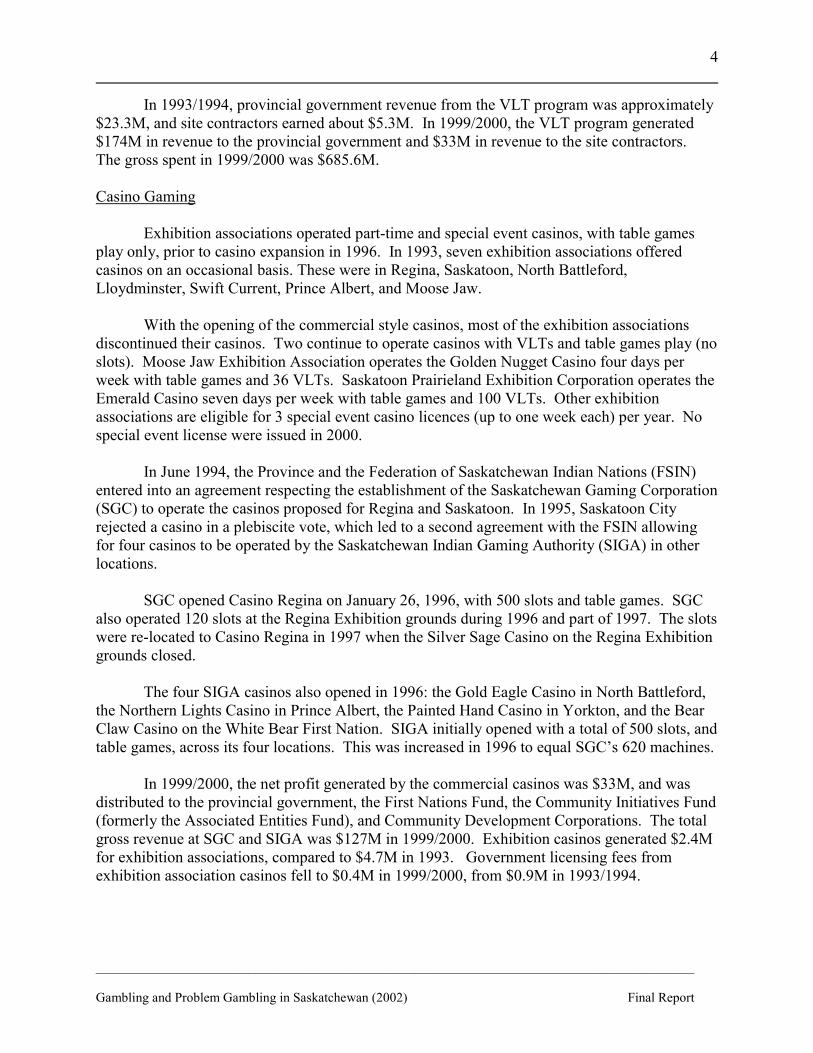
321 communities 1.2 Background Video Lottery Terminal Program
The Video Lottery Terminal (VLT) Program commenced in 1992. The border
communities in the south-east of the province were targeted for the first installations as they had been affected by competition from VLTs in Montana and the Dakotas, drawing Saskatchewan residents out of the province. Using March 31st of each year, the distribution of VLTs has been as follows:
1993: 230 machines at 71 sites. 1994: 2,392 VLTs at 521 sites, in 352 communities 1995: 3,566, in 570 sites, in 320 communities. 1996: 3,472 at 613 sites, in 331 communities. 1997: 3,343, at 617 sites, in 334 communities. 1998: 3,578. At 627 sites, in 325 communities. 1999: 3,497, at 619 sites in 321 communities. 2000: 3,567, at 641 sites in 326 communities. 2001: 3,561, at 643 sites, in 321 communities.
VLTs may only be installed in age-restricted liquor-permitted premises where minors can
neither play the machines nor watch them being played. Public advertising of VLTs is prohibited. The minimum number of machines at a site is two, and the maximum is 12.
__________________________________________________________________________________________ Gambling and Problem Gambling in Saskatchewan (2002) Final Report
4
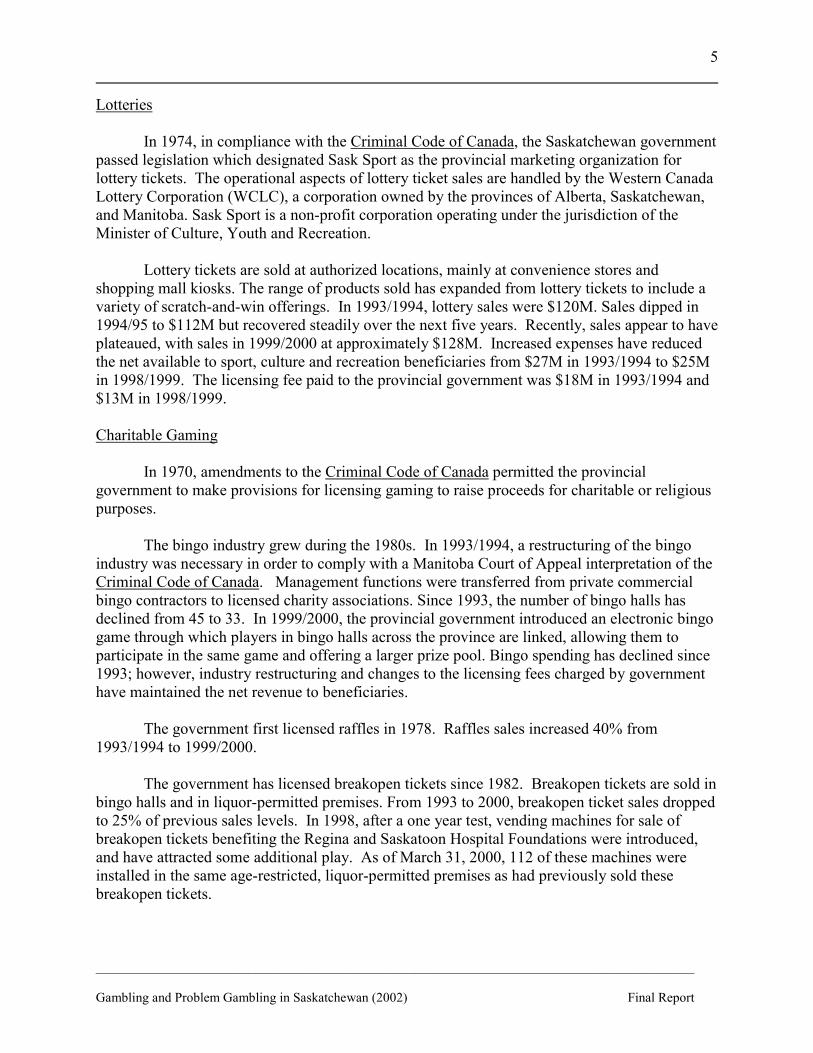
In 1993/1994, provincial government revenue from the VLT program was approximately $23.3M, and site contractors earned about $5.3M. In 1999/2000, the VLT program generated $174M in revenue to the provincial government and $33M in revenue to the site contractors. The gross spent in 1999/2000 was $685.6M. Casino Gaming
Exhibition associations operated part-time and special event casinos, with table games play only, prior to casino expansion in 1996. In 1993, seven exhibition associations offered casinos on an occasional basis. These were in Regina, Saskatoon, North Battleford, Lloydminster, Swift Current, Prince Albert, and Moose Jaw.
With the opening of the commercial style casinos, most of the exhibition associations discontinued their casinos. Two continue to operate casinos with VLTs and table games play (no slots). Moose Jaw Exhibition Association operates the Golden Nugget Casino four days per week with table games and 36 VLTs. Saskatoon Prairieland Exhibition Corporation operates the Emerald Casino seven days per week with table games and 100 VLTs. Other exhibition associations are eligible for 3 special event casino licences (up to one week each) per year. No special event license were issued in 2000.
In June 1994, the Province and the Federation of Saskatchewan Indian Nations (FSIN) entered into an agreement respecting the establishment of the Saskatchewan Gaming Corporation (SGC) to operate the casinos proposed for Regina and Saskatoon. In 1995, Saskatoon City rejected a casino in a plebiscite vote, which led to a second agreement with the FSIN allowing for four casinos to be operated by the Saskatchewan Indian Gaming Authority (SIGA) in other locations.
SGC opened Casino Regina on January 26, 1996, with 500 slots and table games. SGC also operated 120 slots at the Regina Exhibition grounds during 1996 and part of 1997. The slots were re-located to Casino Regina in 1997 when the Silver Sage Casino on the Regina Exhibition grounds closed.
The four SIGA casinos also opened in 1996: the Gold Eagle Casino in North Battleford, the Northern Lights Casino in Prince Albert, the Painted Hand Casino in Yorkton, and the Bear Claw Casino on the White Bear First Nation. SIGA initially opened with a total of 500 slots, and table games, across its four locations. This was increased in 1996 to equal SGC�s 620 machines.
In 1999/2000, the net profit generated by the commercial casinos was $33M, and was distributed to the provincial government, the First Nations Fund, the Community Initiatives Fund (formerly the Associated Entities Fund), and Community Development Corporations. The total gross revenue at SGC and SIGA was $127M in 1999/2000. Exhibition casinos generated $2.4M for exhibition associations, compared to $4.7M in 1993. Government licensing fees from exhibition association casinos fell to $0.4M in 1999/2000, from $0.9M in 1993/1994.
__________________________________________________________________________________________ Gambling and Problem Gambling in Saskatchewan (2002) Final Report
5
Lotteries
In 1974, in compliance with the Criminal Code of Canada, the Saskatchewan government passed legislation which designated Sask Sport as the provincial marketing organization for lottery tickets. The operational aspects of lottery ticket sales are handled by the Western Canada Lottery Corporation (WCLC), a corporation owned by the provinces of Alberta, Saskatchewan, and Manitoba. Sask Sport is a non-profit corporation operating under the jurisdiction of the Minister of Culture, Youth and Recreation.
Lottery tickets are sold at authorized locations, mainly at convenience stores and shopping mall kiosks. The range of products sold has expanded from lottery tickets to include a variety of scratch-and-win offerings. In 1993/1994, lottery sales were $120M. Sales dipped in 1994/95 to $112M but recovered steadily over the next five years. Recently, sales appear to have plateaued, with sales in 1999/2000 at approximately $128M. Increased expenses have reduced the net available to sport, culture and recreation beneficiaries from $27M in 1993/1994 to $25M in 1998/1999. The licensing fee paid to the provincial government was $18M in 1993/1994 and $13M in 1998/1999.
Charitable Gaming
In 1970, amendments to the Criminal Code of Canada permitted the provincial government to make provisions for licensing gaming to raise proceeds for charitable or religious purposes.
The bingo industry grew during the 1980s. In 1993/1994, a restructuring of the bingo industry was necessary in order to comply with a Manitoba Court of Appeal interpretation of the Criminal Code of Canada. Management functions were transferred from private commercial bingo contractors to licensed charity associations. Since 1993, the number of bingo halls has declined from 45 to 33. In 1999/2000, the provincial government introduced an electronic bingo game through which players in bingo halls across the province are linked, allowing them to participate in the same game and offering a larger prize pool. Bingo spending has declined since 1993; however, industry restructuring and changes to the licensing fees charged by government have maintained the net revenue to beneficiaries.
The government first licensed raffles in 1978. Raffles sales increased 40% from 1993/1994 to 1999/2000.
The government has licensed breakopen tickets since 1982. Breakopen tickets are sold in bingo halls and in liquor-permitted premises. From 1993 to 2000, breakopen ticket sales dropped to 25% of previous sales levels. In 1998, after a one year test, vending machines for sale of breakopen tickets benefiting the Regina and Saskatoon Hospital Foundations were introduced, and have attracted some additional play. As of March 31, 2000, 112 of these machines were installed in the same age-restricted, liquor-permitted premises as had previously sold these breakopen tickets.
__________________________________________________________________________________________ Gambling and Problem Gambling in Saskatchewan (2002) Final Report
6
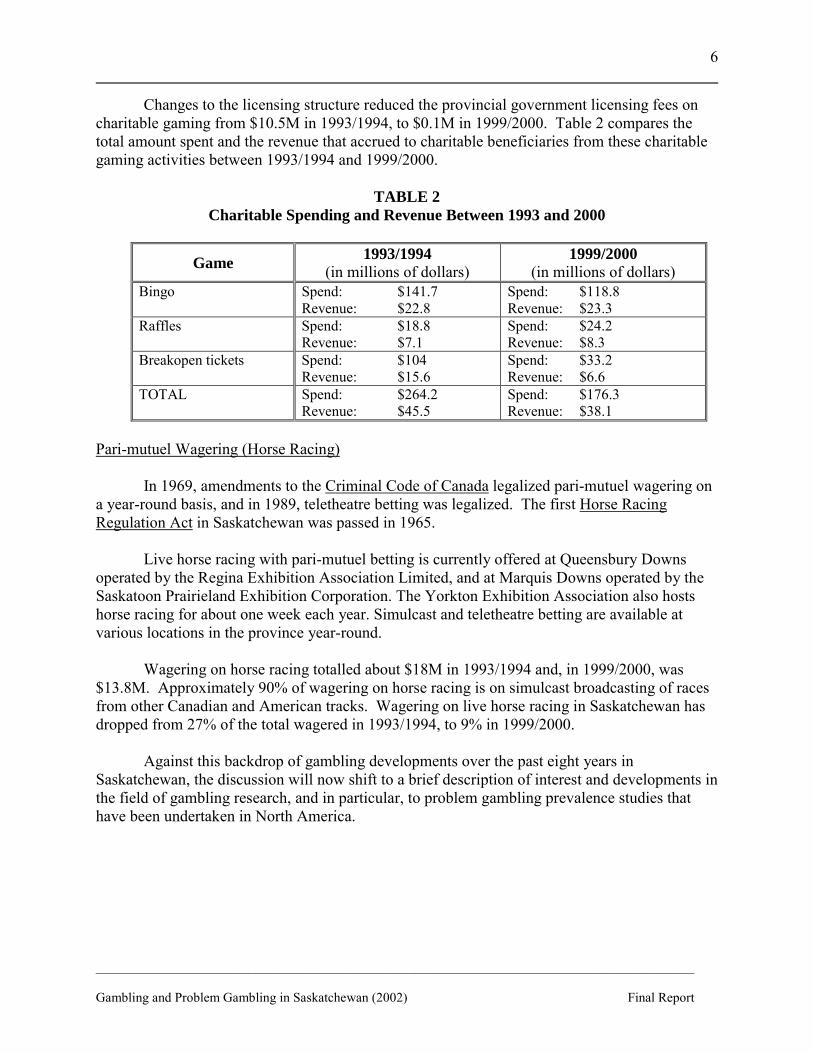
Changes to the licensing structure reduced the provincial government licensing fees on charitable gaming from $10.5M in 1993/1994, to $0.1M in 1999/2000. Table 2 compares the total amount spent and the revenue that accrued to charitable beneficiaries from these charitable gaming activities between 1993/1994 and 1999/2000.
TABLE 2 Charitable Spending and Revenue Between 1993 and 2000
Game 1993/1994 (in millions of dollars)
1999/2000 (in millions of dollars)
Bingo Spend: $141.7 Revenue: $22.8
Spend: $118.8 Revenue: $23.3
Raffles Spend: $18.8 Revenue: $7.1
Spend: $24.2 Revenue: $8.3
Breakopen tickets Spend: $104 Revenue: $15.6
Spend: $33.2 Revenue: $6.6
TOTAL Spend: $264.2 Revenue: $45.5
Spend: $176.3 Revenue: $38.1
Pari-mutuel Wagering (Horse Racing)
In 1969, amendments to the Criminal Code of Canada legalized pari-mutuel wagering on a year-round basis, and in 1989, teletheatre betting was legalized. The first Horse Racing Regulation Act in Saskatchewan was passed in 1965.
Live horse racing with pari-mutuel betting is currently offered at Queensbury Downs operated by the Regina Exhibition Association Limited, and at Marquis Downs operated by the Saskatoon Prairieland Exhibition Corporation. The Yorkton Exhibition Association also hosts horse racing for about one week each year. Simulcast and teletheatre betting are available at various locations in the province year-round.
Wagering on horse racing totalled about $18M in 1993/1994 and, in 1999/2000, was $13.8M. Approximately 90% of wagering on horse racing is on simulcast broadcasting of races from other Canadian and American tracks. Wagering on live horse racing in Saskatchewan has dropped from 27% of the total wagered in 1993/1994, to 9% in 1999/2000.
Against this backdrop of gambling developments over the past eight years in
Saskatchewan, the discussion will now shift to a brief description of interest and developments in the field of gambling research, and in particular, to problem gambling prevalence studies that have been undertaken in North America.
__________________________________________________________________________________________ Gambling and Problem Gambling in Saskatchewan (2002) Final Report
7
2. Researching Gambling and Problem Gambling
Since antiquity, gambling in human societies has been ubiquitous. For a brief history of gambling, readers are referred to Robert Wildman�s seminal book entitled Gambling: An Attempt at an Integration (1997). Wildman explores the early efforts of researchers to examine and explain human motivations for gambling. For instance, he notes that France (1902) postulated an evolutionary perspective �that during the proverbial hard times, such as a famine or natural calamity, only individuals who were willing to risk the adoption of new behavior and lifestyles were likely to survive� (Wildman, 1997, p.3). It follows from France�s perspective that we are descendants of risk-taking man and that, therefore, �gambling� is ingrained in our very being. France�s theory is merely cited to illustrate the early research interest in the latter part of the 19th century in studying and explaining man�s propensity for gambling, and it does not suggest there is widespread endorsement for this evolutionary perspective. In fact, other researchers have posited different explanations for gambling, as noted by Wildman:
• Freud (1928) contributes the psychoanalytic viewpoint in his classic attempt to
explore the causes of the Russian novelist Dostoevsky�s excessive gambling. • The sociologist Stocking (1930) posited that gambling is a continuation of primitive
magical/religious ceremonies. • Zola (1967) examined gambling as a focus of socialization. In a classic anecdotal
account of men who gambled in a �lower class setting,� he observed that only when gambling in a group were these men allowed to experience a sense of competence and respectability.
• Knapp (1976) relied on behavioral or learning theory to elaborate on the role of
intermittent reinforcement in attracting and keep the gambler at play. In casinos, this included the use of (1) stimuli such as flashing lights, bells/music, and brightly colored symbols; and (2) response priming, through such devices as giving away free coins or offering free pulls on slot machines.
• Kusyszyn (1976) researched gambling as a form of adult play, and viewed this
recreational pursuit as a normal, healthy and positive outlet for intelligent, inquiring adults.
As well as these early attempts by researchers to explain man�s propensity for gambling,
other research foci in the 20th century have included: (1) personalogical and individual factors relevant to gambling; (2) the mental and physical status of gamblers; (3) typologies of gamblers; (4) the demographics of gambling; (5) motivations for gambling; (6) the mathematics of gambling; (7) the societal implications of gambling; and (8) treatment of those with gambling problems (Wildman, 1997).
__________________________________________________________________________________________ Gambling and Problem Gambling in Saskatchewan (2002) Final Report
8
While it has long been recognized that some people have a problem with their gambling, it was not until the establishment of Gamblers Anonymous (GA) in Los Angeles in 1957 that a concerted effort was made to help treat so-called compulsive gamblers. In 1972, Dr. Robert Custer established the first inpatient treatment program for compulsive gamblers in North America at the Veteran Affairs (VA) hospital in Brecksville, Ohio. Dr. Custer�s seminal book When Luck Runs Out (1985) is still considered a classic in the treatment of problem gambling. Since these earliest efforts to help individuals, research interest in compulsive or problem gambling has grown substantially.
Since the late 1980s, a major focus of problem gambling research in North America has
been to determine the pervasiveness of this disorder in the general population. To this end, researchers in Canada and the United States have conducted numerous population surveys to ascertain the prevalence of problem gambling. In epidemiology, the term prevalence refers to the number of existing cases of a disease or health condition in a population at some designated time (Last, 1995). In contrast, the term incidence describes the rate of development of a disease or health condition in a group over a certain period of time. To date, there have been many epidemiological problem gambling prevalence studies conducted on populations in jurisdictions in Canada, the United States, and in other countries around the world. Interestingly, there has not been a single incidence study that tracks the development of new cases of a problem gambling disorder in a population over a designated time period. In their meta-analysis of disordered gambling prevalence studies in North America, Shaffer et al. (1997) lament this over-focus on prevalence studies and encourage researchers to begin conducting problem gambling incidence studies:
It is time for the field of disordered gambling studies to conduct true incidence research by prospectively exploring the factors and circumstances that shift the scope and severity of disordered gambling in the United States and Canada. (p.66).
2.1 Prevalence Studies in Canada
The first gambling prevalence study ever conducted was the 1974 U.S. national survey
undertaken by Kallick et al. (1979) for the Commission on the Review of the National Policy Toward Gambling (Volberg and Steadman, 1989). The first Canadian problem gambling prevalence study was conducted in Quebec by Robert Ladouceur (1991).
Since these earliest studies, there has been a proliferation of problem gambling
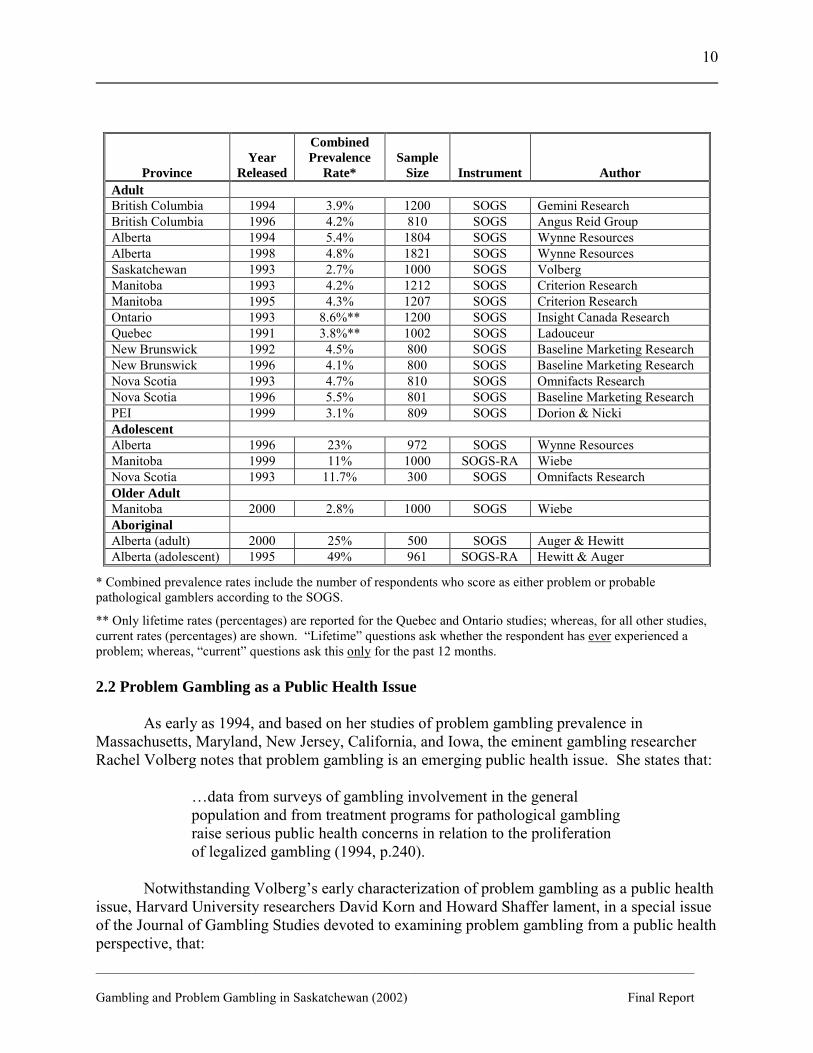
prevalence research in both Canada and the United States. The Shaffer et al. (1997) meta-analysis of problem gambling prevalence studies in North America identifies 120 such studies that are subsequently included in the researchers� analysis. These studies are categorized according to population characteristics, state/province, instrument used, time frame, sample size, author, and year released. Readers are referred to the tables appended to the Shaffer et al. meta-analysis final report for more details of these prevalence studies.
The list below presents information on provincial-level gambling prevalence studies
undertaken in Canada. There have been multiple studies undertaken in five provinces (British
__________________________________________________________________________________________ Gambling and Problem Gambling in Saskatchewan (2002) Final Report
9
Columbia, Alberta, Manitoba, New Brunswick, Nova Scotia), with the greatest number being conducted in Alberta (5 studies). The only true replication study was conducted in Alberta (Wynne Resources, 1998). A replication study is one that uses the same research design and methodology, including sampling respondents from the same population; using the same questionnaire and instrument(s); and using the same sample size. Replication studies provide more confidence when it comes to comparing changes in problem gambling prevalence rates over time.
It is evident from the list of prevalence studies that the South Oaks Gambling Screen
(SOGS) has been used in every provincial problem gambling prevalence study conducted in Canada to date; in two adolescent studies, the SOGS-RA (Winters et al., 1993), which is a revision designed specifically for use with adolescents, is used. Although the SOGS is used to classify three gambler sub-types (i.e., non-problem, problem, and probable pathological gamblers), it is not possible to directly compare the combined prevalence rates amongst provinces because these studies: (1) examine different populations using differing sample sizes; (2) use different survey questionnaires; (3) word and score SOGS items somewhat differently; (4) experience differing response rates; and (5) utilize different survey administration protocols (e.g., training/supervising interviewers and completing call-backs). In view of these limitations, the prevalence rate data displayed in the list should be treated as being largely impressionistic, and readers are cautioned against making direct statistical comparisons amongst provinces.
With this caution in mind, some trends are apparent; notably, that the combined problem
gambling prevalence rates are highest for both adolescent and Aboriginal populations. In the Alberta, Manitoba, and Nova Scotia adolescent prevalence studies, combined rates are significantly higher than those reported for the adult populations in any province; interestingly, the Alberta adolescent rate is substantially higher than the rates in Manitoba and Nova Scotia. The highest prevalence rate reported in any study is for Aboriginal adolescents in Alberta, where nearly half of the respondents allegedly have a gambling problem. Aboriginal adults in Alberta appear much less likely than Aboriginal adolescents in that province to have a gambling problem; however, the prevalence rate for Aboriginal adults is still substantially higher than for all other populations in Canada, except for non-Aboriginal adolescents in Alberta. It is very likely that these adolescent and Aboriginal problem gambling prevalence rates are over-estimates, having been influenced by the use of a classification instrument (SOGS) that has not been validated for use in either special population.
It should be noted that there have been other Canadian epidemiological problem
gambling prevalence studies conducted within special populations, notably: (1) Quebec and Nova Scotia studies of college, high school, and primary school students (Ladouceur and Mireault, 1988; Gaboury & Ladouceur, 1998; Ladouceur, Dubé, & Bujold, 1994a, 1994b; Nova Scotia Department of Health, 1996); (2) Ontario studies of adolescents/adults in specific geographic regions (Insight Research, 1994; Govoni et al, 1996a, 1996b); (3) Ontario studies of treatment populations (Donwood, 1996); and (4) Ontario combined substance abuse/problem gambling/opinion surveys (Ferris & Stirpe, 1995; Smart & Ferris, 1996). Insofar as none of these studies are attempts to provide a definitive, baseline estimate of the prevalence of gambling in that province, they are not included in the list of provincial prevalence studies.
__________________________________________________________________________________________ Gambling and Problem Gambling in Saskatchewan (2002) Final Report
10
Province
Year
Released
Combined Prevalence
Rate*
Sample
Size
Instrument
Author Adult British Columbia 1994 3.9% 1200 SOGS Gemini Research British Columbia 1996 4.2% 810 SOGS Angus Reid Group Alberta 1994 5.4% 1804 SOGS Wynne Resources Alberta 1998 4.8% 1821 SOGS Wynne Resources Saskatchewan 1993 2.7% 1000 SOGS Volberg Manitoba 1993 4.2% 1212 SOGS Criterion Research Manitoba 1995 4.3% 1207 SOGS Criterion Research Ontario 1993 8.6%** 1200 SOGS Insight Canada Research Quebec 1991 3.8%** 1002 SOGS Ladouceur New Brunswick 1992 4.5% 800 SOGS Baseline Marketing Research New Brunswick 1996 4.1% 800 SOGS Baseline Marketing Research Nova Scotia 1993 4.7% 810 SOGS Omnifacts Research Nova Scotia 1996 5.5% 801 SOGS Baseline Marketing Research PEI 1999 3.1% 809 SOGS Dorion & Nicki Adolescent Alberta 1996 23% 972 SOGS Wynne Resources Manitoba 1999 11% 1000 SOGS-RA Wiebe Nova Scotia 1993 11.7% 300 SOGS Omnifacts Research Older Adult Manitoba 2000 2.8% 1000 SOGS Wiebe Aboriginal Alberta (adult) 2000 25% 500 SOGS Auger & Hewitt Alberta (adolescent) 1995 49% 961 SOGS-RA Hewitt & Auger
* Combined prevalence rates include the number of respondents who score as either problem or probable pathological gamblers according to the SOGS.
** Only lifetime rates (percentages) are reported for the Quebec and Ontario studies; whereas, for all other studies, current rates (percentages) are shown. �Lifetime� questions ask whether the respondent has ever experienced a problem; whereas, �current� questions ask this only for the past 12 months. 2.2 Problem Gambling as a Public Health Issue
As early as 1994, and based on her studies of problem gambling prevalence in Massachusetts, Maryland, New Jersey, California, and Iowa, the eminent gambling researcher Rachel Volberg notes that problem gambling is an emerging public health issue. She states that:
�data from surveys of gambling involvement in the general population and from treatment programs for pathological gambling raise serious public health concerns in relation to the proliferation of legalized gambling (1994, p.240).
Notwithstanding Volberg�s early characterization of problem gambling as a public health issue, Harvard University researchers David Korn and Howard Shaffer lament, in a special issue of the Journal of Gambling Studies devoted to examining problem gambling from a public health perspective, that:
__________________________________________________________________________________________ Gambling and Problem Gambling in Saskatchewan (2002) Final Report
11
�public health largely has been absent from the social and economic policy decisions surrounding the legalization and expansion of gambling. In addition, there has been little attention focused on gambling as a public health matter. This may be due to a lack of awareness, lack of interest, or a belief that this is not a matter appropriate for public health involvement (1999, p.298).
Korn and Shaffer acknowledge, however, that there is an emerging interest in addressing
problem gambling within three public health areas, namely public policy, research, and public health practice, and they offer the following examples to support their observation (Korn & Shaffer, 1999, pp. 298-306): Public policy
• In 1994, the American Medical Association adopted a resolution citing the addictive
potential of gambling and called on states to set aside a fixed percentage of gambling revenues for education, prevention and treatment (American Medical Association, 1994).
• The Canadian National Council of Welfare published a report in 1996 that
recommended restrictions on certain types of gambling (National Council of Welfare, 1996).
• In 1998, the Canadian Council of Churches, representing eighteen Christian
denominations, wrote the federal Minister of Justice urging the establishment of an independent review of the impact of province-sponsored gambling in Canada.
• In 1993, the Canadian Public Health Association identified gambling as a public
health issue by adopting a formal resolution at its annual general meeting seeking funds to coordinate a national health impact assessment of regulated gambling in Canada, but its efforts were subsequently unsuccessful. In 1999, a second CPHA resolution related to the impact of VLTs was approved.
Research
• Between 1977 and 1997, there were 152 prevalence studies reported in Canada and
the United States, with more than half of these completed after 1992 (Shaffer, Hall & Vander Bilt, 1997).
• In 1999 the National Opinion Research Center published the second national problem
gambling prevalence study in the United States (Gerstein et al, 1999). To date, there is only one published prospective longitudinal study of disordered gambling incidence, and this was not the primary purpose of this research (Cunningham-Williams, Cottler, Compton, & Spitznagel, 1998).
__________________________________________________________________________________________ Gambling and Problem Gambling in Saskatchewan (2002) Final Report
12
• Korn and Shaffer conducted a review of the gambling-related literature in public
health journals and they identified only 18 articles. At the time of their literature review, the Canadian Public Health Association Journal had not published any article focusing on gambling. It should be noted that, in 2001, David Korn published what appears to be the first article in a Canadian medical/health journal (Canadian Medical Association Journal) that discusses problem gambling as a public health issue (Korn, 2001).
Public health practice
• The first community-based initiatives in public awareness concerning the risks of
gambling and the existence of a medical condition called �compulsive gambling� were promulgated through non-public health organizations beginning in 1972 with the founding of the National Council on Problem Gambling in the United States and in Canada in 1983 with the Canadian Foundation on Compulsive Gambling.
• In Canada, the first public expenditures for gambling-related health services were
made in New Brunswick during 1993 to fund its help line services. Currently, all ten Canadian provinces allocate money for gambling treatment.
• In Mississauga, a Canadian Medical Officer of Health proposed community criteria
which local governments must meet before introducing video lottery terminals (VLTs) (Cole, 1998).
• In Atlantic City, a major destination casino resort participates in the Healthy Cities
Project, an international public health movement that it joined in 1993. (Anthony, 1998).
• In Prince Edward Island, a group of family doctors successfully persuaded the
provincial government to remove VLTs from convenience stores. • At the federal level, Health Canada has yet to show a strong interest in gambling but
has changed its addiction program name to Alcohol, Drugs and Dependency Issues to acknowledge the existence of gambling addiction.
• Neither the American nor Canadian Public Health Associations have identified
gambling as an established public health interest category. The Canadian Public Health Association has recently redressed this last lament of Korn and Shaffer. As their first resolution in 2000, the CPHA adopted the position paper entitled Gambling Expansion In Canada: An Emerging Public Health Issue (www.cpha.ca/english/policy/resolu/2000s/2000/page1.htm). Dr. David Korn and Dr. Harvey Skinner of the Department of Public Health Sciences, University of Toronto, developed this position paper, and it includes the following description of the value of viewing problem gambling from a public health perspective:
__________________________________________________________________________________________ Gambling and Problem Gambling in Saskatchewan (2002) Final Report
13
There is considerable value in adopting a public health perspective on gambling. It offers a broad viewpoint on gambling in society � not solely a focus on problem and pathological gambling. This is similar to the approach taken in alcohol studies. A public health approach emphasizes prevention and harm reduction strategies to address gambling-related problems and to decrease the adverse consequences of gambling behaviour. It addresses not only the risk of problems for the gambler but also the quality of life of families and communities affected by gambling. It embodies public health values that reflect concern for the impact of gambling expansion on vulnerable, marginalized and at-risk population groups. A public health position recognizes that there are both costs and benefits associated with gambling. By appreciating the health, social and economic dimensions of gambling, public health professionals can develop strategies that minimize gambling�s negative impacts while recognizing its potential benefits. (p.3)
With this resolution, the Canadian Public Health Association is prepared to play a leadership role in engaging policy makers, researchers and health practitioners in �minimizing gambling�s negative impacts while balancing its potential benefits� (p.5). To facilitate this role, the position paper recommends that the CPHA take the following four action steps:
1. Endorse the position that expansion of gambling in Canada has significant health and public policy impacts. CPHA should take a leadership role in the national debate; position gambling as part of a new public health thrust that addresses quality of life issues for individuals, families and communities; and establish a mechanism/interest group within CPHA to support this function.
2. Adopt the following goals to provide a focus for public health action and
accountability: a. Prevent gambling-related problems in individuals and groups at risk of gambling
addiction. b. Promote balanced and informed attitudes, behaviours and policies towards
gambling and gamblers both by individuals and by communities. c. Protect vulnerable groups from gambling-related harm.
3. Convene a public health think tank on gambling. This would bring together
participants from, for example, the gambling industry, addictions, education, public health and population health fields. The forum could focus on public health concerns � including the impact on vulnerable groups � and build momentum for an action agenda.
4. Advocate for a national public policy review of gambling expansion that analyzes the
effectiveness of our public ownership and accountability framework, studies the
__________________________________________________________________________________________ Gambling and Problem Gambling in Saskatchewan (2002) Final Report
14
Canada-wide prevalence of problem and pathological gambling, and assesses associated health and socioeconomic costs/benefits. (p.5)
There is great promise in addressing problem gambling from a public health perspective, and it is evident that through organizations such as the Canadian Public Health Association that Canada is in the avant-garde of this movement. There was even earlier recognition in Canada of the merit of this public health perspective when the Canadian provinces embarked on a national research project to re-conceptualize and measure problem gambling, and the discussion now turns to a brief description of this important initiative as it relates directly to the Saskatchewan study.
3. Measuring Problem Gambling in Canada
In Canada, the emerging interest in examining problem gambling from a public health perspective has been embraced by a growing number of addictions specialists, health professionals, and senior policy makers from government health departments, non-government organizations, and community agencies. In September 1996, a group of these professionals from different provinces met in Winnipeg to discuss problem gambling research, treatment, and prevention in Canada. There was a common concern expressed that with labels such as �pathological gambling,� research and treatment in this field has been over-focused on addressing this so-called addiction from a medical perspective. There was consensus amongst the inter-provincial group that, while there is an acknowledged clinical condition that may be referred to as pathological gambling, the issue of problem gambling in a community context has a far broader impact and is less well understood. To redress this dominant medical perspective that focuses on the individual problem gambler, an inter-provincial steering committee was formed at the Winnipeg meeting and this group was charged with the tasks of (1) drafting a position paper that re-conceptualized problem gambling within a community health context; (2) developing an operational definition of problem gambling that could be used to guide future community-based research; and (3) developing and validating an instrument that could be used in epidemiological health studies of problem gambling in the general population. Each province contributed funding or other support to what became a three-year national research project (1997-2000) that was titled Measuring Problem Gambling in Canada (Ferris, Wynne, & Single, 1999). The Canadian Centre on Substance Abuse in Ottawa undertook this research challenge on behalf of the inter-provincial steering committee, and the research team of Dr. Harold Wynne, Jackie Ferris, and Dr. Eric Single completed this project in two phases.
In Phase I, the team conducted an extensive review of the problem gambling literature, including theoretical underpinnings, conceptual frameworks and models, competing definitions and labels, and instruments utilized to identify problem gambler sub-types. With feedback from an international panel of expert problem gambling researchers and program specialists, the study team developed: (1) an integrated conceptual framework to guide community-based studies of problem gambling; (2) an operational definition of problem gambling; and (3) a draft measurement instrument entitled the Canadian Problem Gambling Index (CPGI). In Phase II of
__________________________________________________________________________________________ Gambling and Problem Gambling in Saskatchewan (2002) Final Report
15
the study, the research team further refined the CPGI questionnaire items and ultimately determined its validity and reliability in a national study of 3,120 adult Canadians.
It is beyond the scope of this discussion to describe the Measuring Problem Gambling in Canada findings and readers may view and download the Phase I and II final reports, as well as the Users Manual for the CPGI, from the Canadian Centre on Substance Abuse web site (www.ccsa.ca). However, as the Canadian Problem Gambling Index (CPGI) is utilized in the Saskatchewan study, it is appropriate to briefly describe this new instrument.
Canadian Problem Gambling Index A main goal of the Measuring Problem Gambling in Canada inter-provincial research project was to develop a new instrument that would accurately identify and classify non-problem, at-risk, and problem gamblers in the general population. Heretofore, instruments such as the South Oaks Gambling Screen and DSM IV manual diagnostic criteria for �pathological gambling� were mainly used in general population gambling prevalence studies, notwithstanding that these measures were validated on clinical populations of problem gamblers. The research task became one of developing and validating a new instrument that could be used in surveys of non-clinical populations; that is, within the general public in Canadian communities. In developing the CPGI, the research team considered theories and models that have been used to explain problem gambling, and reviewed various measures that have been developed to identify problem gamblers and those who are at risk for developing a gambling problem. The instruments reviewed included the following: South Oaks Gambling Screen, and its derivatives (SOGS-R, SOGS-RA, SOGS-Plus); the American Psychiatric Association�s DSM III and IV for classifying pathological gamblers; Massachusetts Gambling Screen (Shaffer et al., 1994); Gamblers Anonymous 20 questions; Cumulative Clinical Signs Measure (Culleton, 1989); Life Areas Problem Measure (Ferris and Stirpe, 1995; Smart and Ferris, 1996); and other measures developed by individual researchers (i.e., Compulsive Gambling Signs and Progression Slide Rule (Massachusetts Council on Compulsive Gambling, 1994); Addiction Severity Index (Lesieur and Blume, 1992); Pathological Gambling Signs Index (Ladouceur and Mireault, 1988; Lesieur and Klein, 1987); and various clinical assessment interview protocols (Taber, 1985; Laventhol & Horwath et al., 1986). The 20-item South Oaks Gambling Screen (SOGS) and its derivatives are the most widely used screening instruments and it is the SOGS that was used in the 1993 Saskatchewan gambling prevalence study. There have been significant criticisms of the SOGS, including:
• It was developed in a clinical population, and yet is used in general population
studies (Lesieur and Blume, 1993). • It is inappropriate for establishing prevalence rates as it results in a low predictive
value for the SOGS given the very low rate of occurrence of the disorder in the general population (Culleton, 1989).
__________________________________________________________________________________________ Gambling and Problem Gambling in Saskatchewan (2002) Final Report
16
• In general population surveys, the SOGS results in a high number of false positives (Culleton, 1989; Abbot and Volberg, 1992; Dickerson, 1993).
• In his meta-analysis of gambling prevalence studies, Shaffer et al. (1997) found
that the SOGS provided significantly higher estimates of gambling problems than the DSM criteria.
In developing the CPGI, the research team carefully considered these criticisms of the
SOGS and of the other instruments reviewed. The team then content-analysed each of these instruments to identify domains and variables that each purported to measure and, based on this analysis, specific domains, variables and items (i.e., survey questions) were incorporated into the first draft of the CPGI. This draft was subsequently shared with an international panel of gambling research experts for their comments and, when this was completed, the CPGI was further modified and then pilot-tested with three groups (i.e., a general population random sample, regular gamblers who responded to newspaper ads, and problem gamblers in treatment).
Following the pilot-testing phase, the 31-item CPGI was tested in an English/French national general population survey on a sample of 3,120 adult Canadians drawn from all provinces. To test the reliability of the new instrument, the CPGI was re-administered to a sample of 417 respondents from the initial survey. Finally, to further validate the classification accuracy of the CPGI, problem gambling clinicians conducted clinical interviews with 143 survey respondents.
As a result of this validation research project, the CPGI is the first gambling
measurement instrument to have been subjected to rigorous testing prior to being utilized in community-based gambling research projects. Moreover, it is the only problem gambling measurement instrument to have established and published psychometric properties before being used in gambling research projects (these psychometric properties may be reviewed in the User Manual developed by Ferris and Wynne, 2001 � www.ccsa.ca). The Canadian Problem Gambling Index is the instrument that is utilized in this survey of adult gambling and problem gambling in Saskatchewan. Modifications and enhancements to the CPGI for this survey are described in the methodology section of this report.
__________________________________________________________________________________________ Gambling and Problem Gambling in Saskatchewan (2002) Final Report
17
CHAPTER II
RESEARCH DESIGN
1. Purpose and Objectives The purpose of this research is to examine gambling and problem gambling amongst Saskatchewan adults from a community health perspective. The goal of the research is to describe the current scope and characteristics of gambling and problem gambling within the adult population in Saskatchewan.
To achieve this purpose and goal, the following research objectives have been posited: 1. To describe and compare the demographic characteristics of adult Saskatchewan non-
gamblers and gambler sub-types (i.e. non-problem, low risk, moderate risk, problem gamblers).
2. To describe and compare the gambling activities of adult Saskatchewan gambler sub-
types (i.e. non-problem, low risk, moderate risk, problem gamblers). 3. To describe and compare problem gambling behaviour and consequences for adult
Saskatchewan gambler sub-types (i.e. non-problem, low risk, moderate risk, problem gamblers).
4. To describe and compare the health status of adult Saskatchewan gambler sub-types (i.e.
non-problem, low risk, moderate risk, problem gamblers). 5. To compare present Saskatchewan research findings with results from the 1993
Saskatchewan prevalence study. 6. To offer conclusions and discuss implications that may assist Saskatchewan Health and
allied agencies in designing or modifying treatment, prevention, and education programs that will help address problem gambling.
2. Methodology The research design is a descriptive survey of adult Saskatchewan residents� (i.e. 19 years-of-age and older) gambling participation, problem gambling behaviour and consequences, and related personal health status. A telephone survey methodology is employed to garner information from a large, province-wide sample of Saskatchewan residents (N=1,848) and statistical data are presented and discussed in this report.
__________________________________________________________________________________________ Gambling and Problem Gambling in Saskatchewan (2002) Final Report
18
2.1 Research Questions To guide this inquiry and to achieve the study objectives, the following research questions are posed:
1. What is the demographic profile of gambler sub-types (i.e. non-gamblers, non-problem gamblers, low-risk gamblers, moderate-risk gamblers, problem gamblers)?
2. How does type of gambling activity, frequency/duration of time spent at play,
expenditures, and motivation to gamble compare amongst gambler sub-types?
3. What are the characteristics and consequences of problem gambling behaviour amongst gambler sub-types?
4. How do personal health status indicators compare amongst gambler sub-types?
5. How do findings from this study compare with those presented in the October, 1993
Saskatchewan gambling study entitled Report on the Social Impacts of Gaming and the Impact of Gaming Expansion on Charitable Beneficiaries?
2.2 Telephone Survey
In this study, a random sample of 1,848 Saskatchewan adults 19 years-of-age and older were interviewed by telephone. Prairie Research Associates Inc. (PRA) of Winnipeg, Manitoba conducted this telephone survey in April and May 2001. Appendix 1 contains the full methodology report prepared by PRA, including (a) how the research was conducted, (b) issues that were encountered and addressed during the telephone interviewing process, and (c) the survey questionnaire that was utilized. Two different methods for calculating the survey response rate are presented, and the second method, which is the standard for community surveys, indicates the response rate is 59.7%. The margin of error for the sample is ±2.3% at the 95% confidence level (i.e., accurate nineteen times out of twenty).
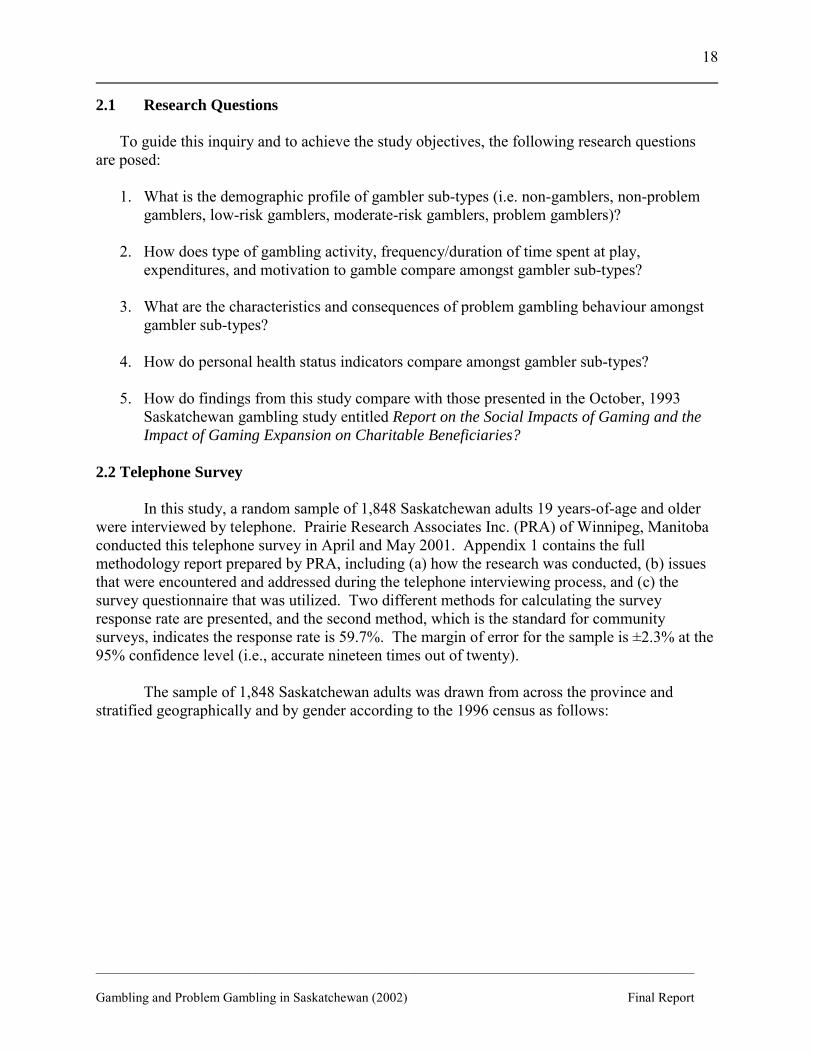
The sample of 1,848 Saskatchewan adults was drawn from across the province and
stratified geographically and by gender according to the 1996 census as follows:
__________________________________________________________________________________________ Gambling and Problem Gambling in Saskatchewan (2002) Final Report
19
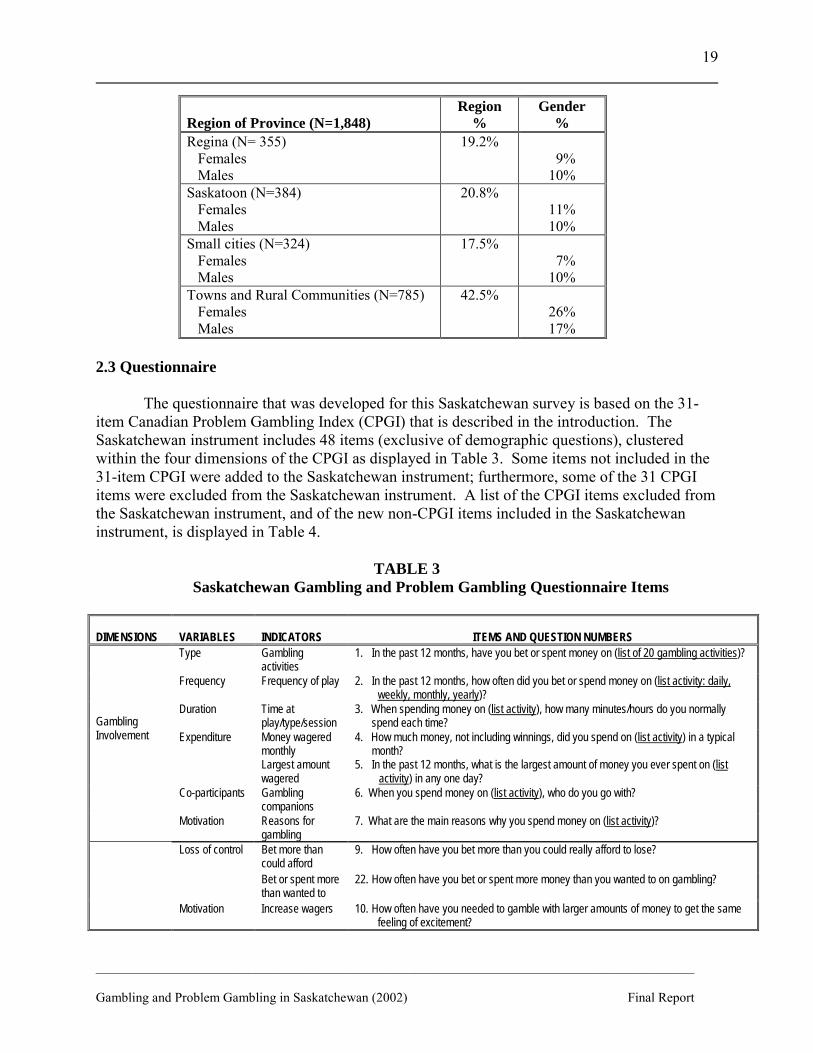
Region of Province (N=1,848)
Region %
Gender %
Regina (N= 355) Females Males
19.2%
9% 10%
Saskatoon (N=384) Females Males
20.8%
11% 10%
Small cities (N=324) Females Males
17.5%
7% 10%
Towns and Rural Communities (N=785) Females Males
42.5%
26% 17%
2.3 Questionnaire
The questionnaire that was developed for this Saskatchewan survey is based on the 31-item Canadian Problem Gambling Index (CPGI) that is described in the introduction. The Saskatchewan instrument includes 48 items (exclusive of demographic questions), clustered within the four dimensions of the CPGI as displayed in Table 3. Some items not included in the 31-item CPGI were added to the Saskatchewan instrument; furthermore, some of the 31 CPGI items were excluded from the Saskatchewan instrument. A list of the CPGI items excluded from the Saskatchewan instrument, and of the new non-CPGI items included in the Saskatchewan instrument, is displayed in Table 4.
TABLE 3 Saskatchewan Gambling and Problem Gambling Questionnaire Items
DIMENSIONS
VARIABLES
INDICATORS
ITEMS AND QUESTION NUMBERS
Type Gambling activities
1. In the past 12 months, have you bet or spent money on (list of 20 gambling activities)?
Frequency Frequency of play 2. In the past 12 months, how often did you bet or spend money on (list activity: daily, weekly, monthly, yearly)?
Duration Time at play/type/session
3. When spending money on (list activity), how many minutes/hours do you normally spend each time?
Expenditure Money wagered monthly Largest amount wagered
4. How much money, not including winnings, did you spend on (list activity) in a typical month? 5. In the past 12 months, what is the largest amount of money you ever spent on (list
activity) in any one day? Co-participants Gambling
companions 6. When you spend money on (list activity), who do you go with?
Gambling Involvement
Motivation Reasons for gambling
7. What are the main reasons why you spend money on (list activity)?
Loss of control Bet more than could afford
9. How often have you bet more than you could really afford to lose?
Bet or spent more than wanted to
22. How often have you bet or spent more money than you wanted to on gambling?
Motivation Increase wagers 10. How often have you needed to gamble with larger amounts of money to get the same feeling of excitement?
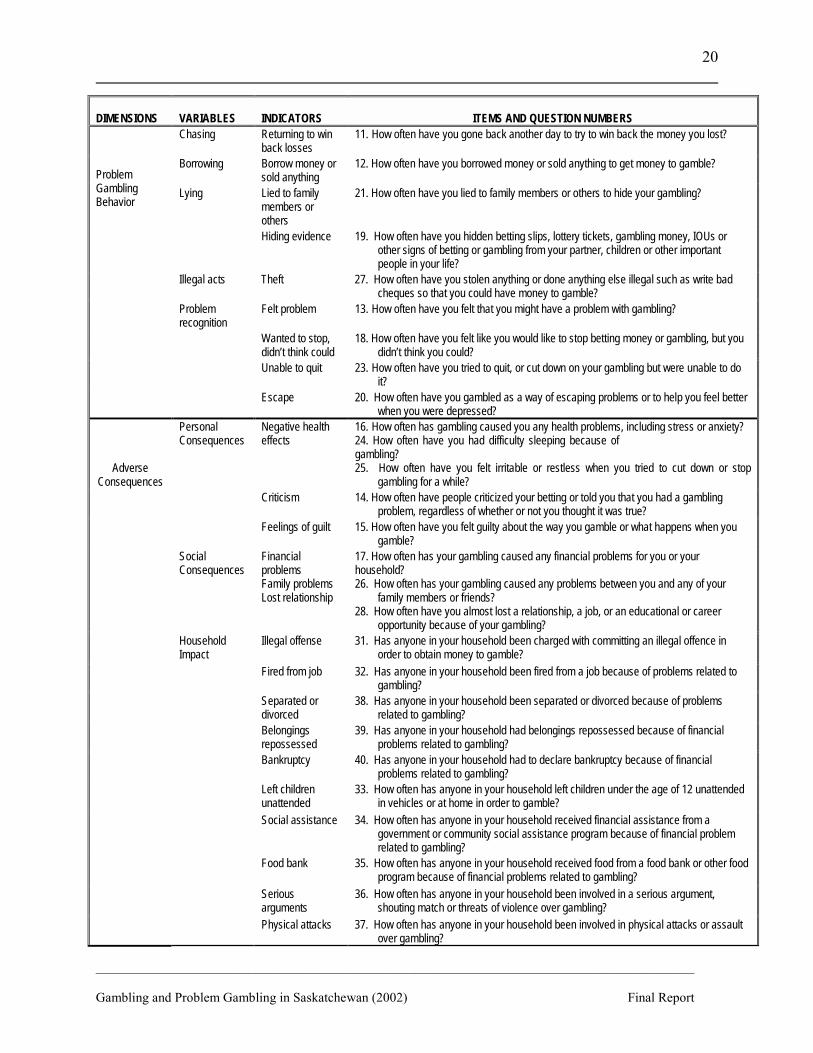
__________________________________________________________________________________________ Gambling and Problem Gambling in Saskatchewan (2002) Final Report
20
DIMENSIONS
VARIABLES
INDICATORS
ITEMS AND QUESTION NUMBERS
Chasing Returning to win back losses
11. How often have you gone back another day to try to win back the money you lost?
Borrowing Borrow money or sold anything
12. How often have you borrowed money or sold anything to get money to gamble?
Lying Lied to family members or others
21. How often have you lied to family members or others to hide your gambling?
Hiding evidence 19. How often have you hidden betting slips, lottery tickets, gambling money, IOUs or other signs of betting or gambling from your partner, children or other important people in your life?
Illegal acts Theft 27. How often have you stolen anything or done anything else illegal such as write bad cheques so that you could have money to gamble?
Problem recognition
Felt problem 13. How often have you felt that you might have a problem with gambling?
Wanted to stop, didn’t think could
18. How often have you felt like you would like to stop betting money or gambling, but you didn’t think you could?
Unable to quit 23. How often have you tried to quit, or cut down on your gambling but were unable to do it?
Problem Gambling Behavior
Escape 20. How often have you gambled as a way of escaping problems or to help you feel better when you were depressed?
Negative health effects
16. How often has gambling caused you any health problems, including stress or anxiety? 24. How often have you had difficulty sleeping because of gambling? 25. How often have you felt irritable or restless when you tried to cut down or stop
gambling for a while? Criticism 14. How often have people criticized your betting or told you that you had a gambling
problem, regardless of whether or not you thought it was true?
Personal Consequences
Feelings of guilt 15. How often have you felt guilty about the way you gamble or what happens when you gamble?
Social Consequences
Financial problems Family problems Lost relationship
17. How often has your gambling caused any financial problems for you or your household? 26. How often has your gambling caused any problems between you and any of your
family members or friends? 28. How often have you almost lost a relationship, a job, or an educational or career
opportunity because of your gambling? Household Impact
Illegal offense 31. Has anyone in your household been charged with committing an illegal offence in order to obtain money to gamble?
Fired from job 32. Has anyone in your household been fired from a job because of problems related to gambling?
Separated or divorced
38. Has anyone in your household been separated or divorced because of problems related to gambling?
Belongings repossessed
39. Has anyone in your household had belongings repossessed because of financial problems related to gambling?
Bankruptcy 40. Has anyone in your household had to declare bankruptcy because of financial problems related to gambling?
Left children unattended
33. How often has anyone in your household left children under the age of 12 unattended in vehicles or at home in order to gamble?
Social assistance 34. How often has anyone in your household received financial assistance from a government or community social assistance program because of financial problem related to gambling?
Food bank 35. How often has anyone in your household received food from a food bank or other food program because of financial problems related to gambling?
Serious arguments
36. How often has anyone in your household been involved in a serious argument, shouting match or threats of violence over gambling?
Adverse Consequences
Physical attacks 37. How often has anyone in your household been involved in physical attacks or assault over gambling?
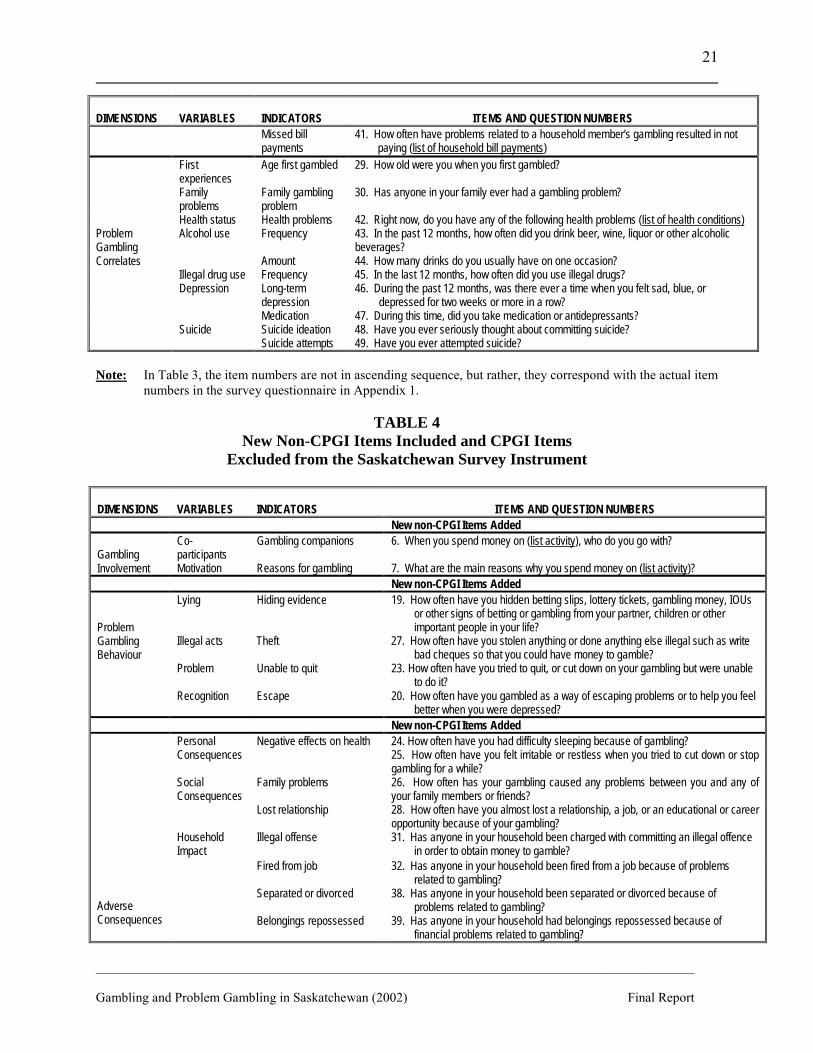
__________________________________________________________________________________________ Gambling and Problem Gambling in Saskatchewan (2002) Final Report
21
DIMENSIONS
VARIABLES
INDICATORS
ITEMS AND QUESTION NUMBERS
Missed bill payments
41. How often have problems related to a household member's gambling resulted in not paying (list of household bill payments)
First experiences
Age first gambled 29. How old were you when you first gambled?
Family problems
Family gambling problem
30. Has anyone in your family ever had a gambling problem?
Health status Health problems 42. Right now, do you have any of the following health problems (list of health conditions) Alcohol use Frequency 43. In the past 12 months, how often did you drink beer, wine, liquor or other alcoholic
beverages? Amount 44. How many drinks do you usually have on one occasion? Illegal drug use Frequency 45. In the last 12 months, how often did you use illegal drugs? Depression Long-term
depression 46. During the past 12 months, was there ever a time when you felt sad, blue, or
depressed for two weeks or more in a row? Medication 47. During this time, did you take medication or antidepressants? Suicide Suicide ideation 48. Have you ever seriously thought about committing suicide?
Problem Gambling Correlates
Suicide attempts 49. Have you ever attempted suicide? Note: In Table 3, the item numbers are not in ascending sequence, but rather, they correspond with the actual item
numbers in the survey questionnaire in Appendix 1.
TABLE 4 New Non-CPGI Items Included and CPGI Items
Excluded from the Saskatchewan Survey Instrument
DIMENSIONS
VARIABLES
INDICATORS
ITEMS AND QUESTION NUMBERS
New non-CPGI Items Added Co-participants
Gambling companions 6. When you spend money on (list activity), who do you go with? Gambling Involvement Motivation Reasons for gambling 7. What are the main reasons why you spend money on (list activity)? New non-CPGI Items Added
Lying Hiding evidence 19. How often have you hidden betting slips, lottery tickets, gambling money, IOUs or other signs of betting or gambling from your partner, children or other important people in your life?
Illegal acts Theft 27. How often have you stolen anything or done anything else illegal such as write bad cheques so that you could have money to gamble?
Problem Unable to quit 23. How often have you tried to quit, or cut down on your gambling but were unable to do it?
Problem Gambling Behaviour
Recognition Escape 20. How often have you gambled as a way of escaping problems or to help you feel better when you were depressed?
New non-CPGI Items Added Negative effects on health 24. How often have you had difficulty sleeping because of gambling? Personal
Consequences 25. How often have you felt irritable or restless when you tried to cut down or stop gambling for a while?
Family problems 26. How often has your gambling caused any problems between you and any of your family members or friends?
Social Consequences
Lost relationship 28. How often have you almost lost a relationship, a job, or an educational or career opportunity because of your gambling?
Household Impact
Illegal offense 31. Has anyone in your household been charged with committing an illegal offence in order to obtain money to gamble?
Fired from job 32. Has anyone in your household been fired from a job because of problems related to gambling?
Separated or divorced 38. Has anyone in your household been separated or divorced because of problems related to gambling?
Adverse Consequences Belongings repossessed 39. Has anyone in your household had belongings repossessed because of
financial problems related to gambling?
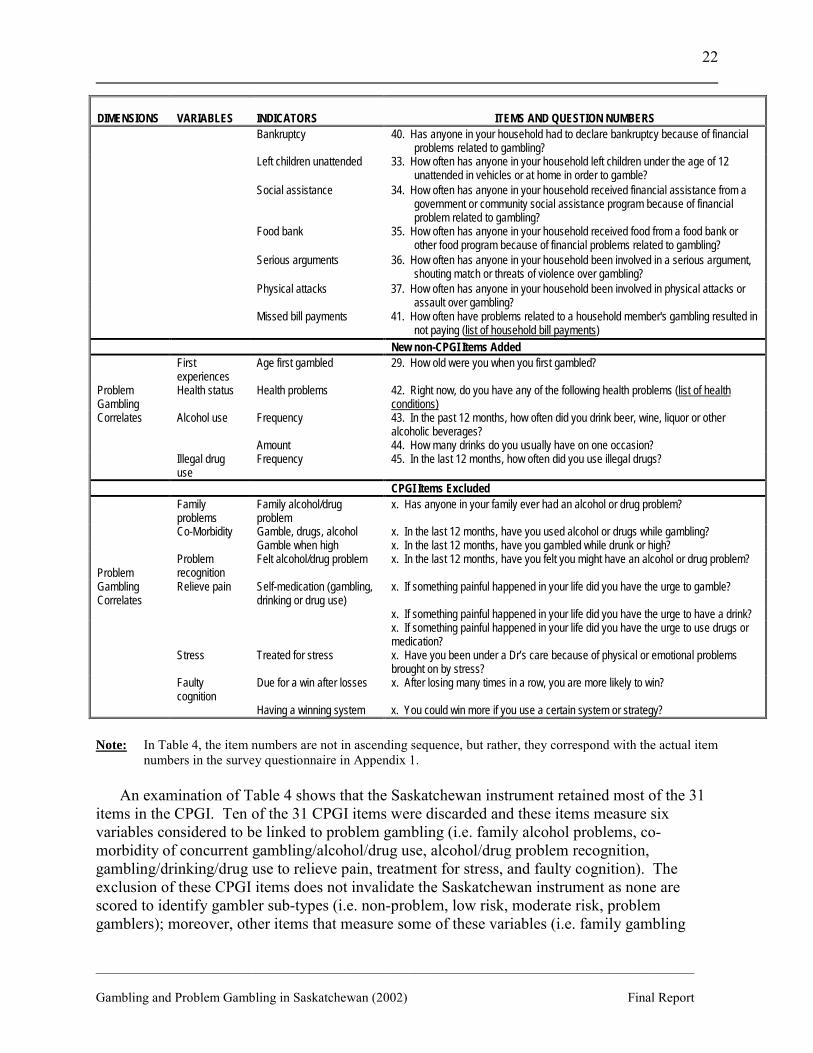
__________________________________________________________________________________________ Gambling and Problem Gambling in Saskatchewan (2002) Final Report
22
DIMENSIONS
VARIABLES
INDICATORS
ITEMS AND QUESTION NUMBERS
Bankruptcy 40. Has anyone in your household had to declare bankruptcy because of financial problems related to gambling?
Left children unattended 33. How often has anyone in your household left children under the age of 12 unattended in vehicles or at home in order to gamble?
Social assistance 34. How often has anyone in your household received financial assistance from a government or community social assistance program because of financial problem related to gambling?
Food bank 35. How often has anyone in your household received food from a food bank or other food program because of financial problems related to gambling?
Serious arguments 36. How often has anyone in your household been involved in a serious argument, shouting match or threats of violence over gambling?
Physical attacks 37. How often has anyone in your household been involved in physical attacks or assault over gambling?
Missed bill payments 41. How often have problems related to a household member's gambling resulted in not paying (list of household bill payments)
New non-CPGI Items Added First experiences
Age first gambled 29. How old were you when you first gambled?
Health status Health problems 42. Right now, do you have any of the following health problems (list of health conditions)
Alcohol use Frequency 43. In the past 12 months, how often did you drink beer, wine, liquor or other alcoholic beverages?
Amount 44. How many drinks do you usually have on one occasion?
Problem Gambling Correlates
Illegal drug use
Frequency 45. In the last 12 months, how often did you use illegal drugs?
CPGI Items Excluded Family problems
Family alcohol/drug problem
x. Has anyone in your family ever had an alcohol or drug problem?
Co-Morbidity Gamble, drugs, alcohol x. In the last 12 months, have you used alcohol or drugs while gambling? Gamble when high x. In the last 12 months, have you gambled while drunk or high? Problem recognition
Felt alcohol/drug problem x. In the last 12 months, have you felt you might have an alcohol or drug problem?
Relieve pain Self-medication (gambling, drinking or drug use)
x. If something painful happened in your life did you have the urge to gamble?
x. If something painful happened in your life did you have the urge to have a drink? x. If something painful happened in your life did you have the urge to use drugs or
medication? Stress Treated for stress x. Have you been under a Dr’s care because of physical or emotional problems
brought on by stress? Faulty cognition
Due for a win after losses x. After losing many times in a row, you are more likely to win?
Problem Gambling Correlates
Having a winning system x. You could win more if you use a certain system or strategy? Note: In Table 4, the item numbers are not in ascending sequence, but rather, they correspond with the actual item
numbers in the survey questionnaire in Appendix 1. An examination of Table 4 shows that the Saskatchewan instrument retained most of the 31 items in the CPGI. Ten of the 31 CPGI items were discarded and these items measure six variables considered to be linked to problem gambling (i.e. family alcohol problems, co-morbidity of concurrent gambling/alcohol/drug use, alcohol/drug problem recognition, gambling/drinking/drug use to relieve pain, treatment for stress, and faulty cognition). The exclusion of these CPGI items does not invalidate the Saskatchewan instrument as none are scored to identify gambler sub-types (i.e. non-problem, low risk, moderate risk, problem gamblers); moreover, other items that measure some of these variables (i.e. family gambling
__________________________________________________________________________________________ Gambling and Problem Gambling in Saskatchewan (2002) Final Report
23
problem, alcohol and illegal drug use, and recognition of a gambling problem) remain in the Saskatchewan instrument. Finally, the Saskatchewan survey instrument adds new items that strengthen the scope of the inquiry, notably in the �adverse consequences� and �problem gambling correlates� dimensions of the CPGI. For instance, a series of 11 items that tap the impact of gambling on the household have been added. Similarly, a checklist of health problems has been added to determine and compare the relative health status of gambler sub-types. Examining these new prospective problem gambling correlates will not only provide important information for Saskatchewan health planners, but it will add to the �correlates pool� of the CPGI, thus advancing the further development of this Canadian instrument. 2.4 Identifying Gambler Sub-Types The central task in all problem gambling prevalence studies conducted in Canada, the United States, and in countries throughout the world is to first identify gambler sub-types according to the severity of their gambling problem. In these surveys of the general population, it is imperative to be able to differentiate people who do not have a gambling problem from those who clearly do, or who are at heightened risk for developing a problem. To accomplish this task, various problem gambling screening instruments have been utilized in problem gambling prevalence research over the past two decades and these instruments have been briefly presented and discussed in the introductory section of this report. As stated previously, the newly developed Canadian Problem Gambling Index (CPGI) is the instrument that forms the basis for the Saskatchewan survey questionnaire that is used to collect data in this study. Within the 31-item CPGI, nine items form a sub-scale that has been named the Problem Gambling Severity Index (PGSI), and the PGSI discriminates four gambler sub-types, namely: non-problem gamblers, low risk gamblers, moderate risk gamblers, and problem gamblers. The nine PGSI items that are scored are presented in Table 5.
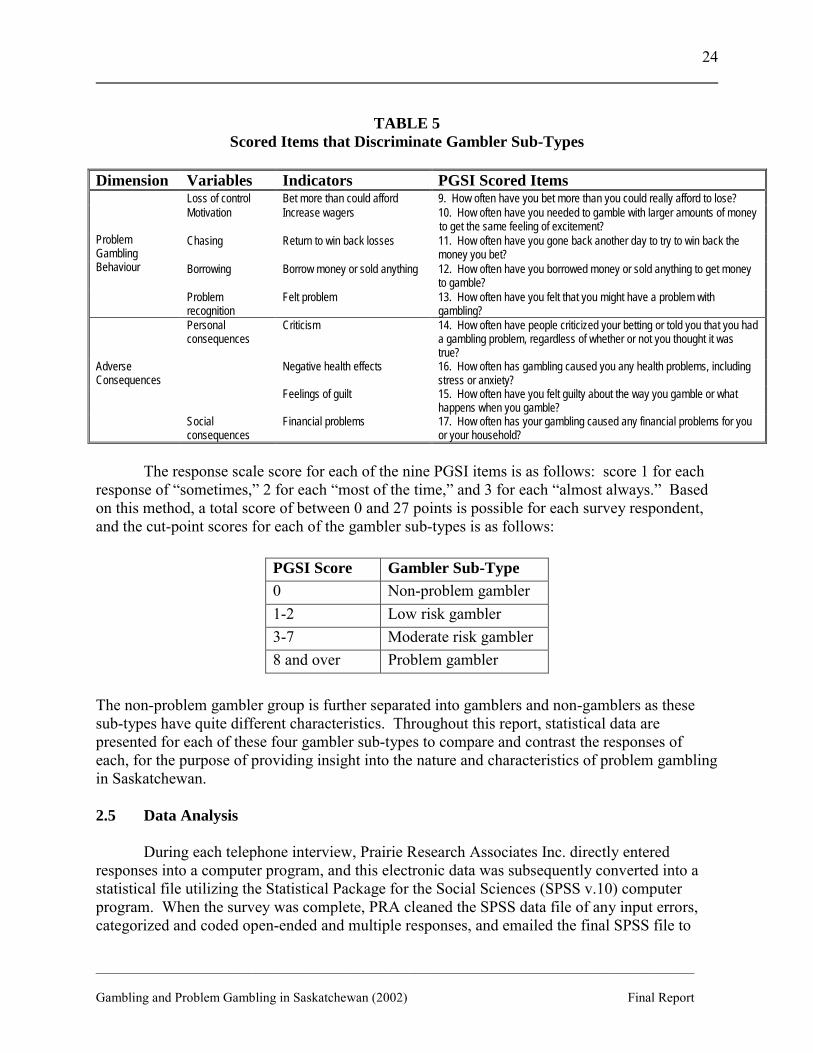
__________________________________________________________________________________________ Gambling and Problem Gambling in Saskatchewan (2002) Final Report
24
TABLE 5
Scored Items that Discriminate Gambler Sub-Types
Dimension Variables Indicators PGSI Scored Items Loss of control Bet more than could afford 9. How often have you bet more than you could really afford to lose? Motivation Increase wagers 10. How often have you needed to gamble with larger amounts of money
to get the same feeling of excitement? Chasing Return to win back losses 11. How often have you gone back another day to try to win back the
money you bet? Borrowing Borrow money or sold anything 12. How often have you borrowed money or sold anything to get money
to gamble?
Problem Gambling Behaviour
Problem recognition
Felt problem 13. How often have you felt that you might have a problem with gambling?
Criticism 14. How often have people criticized your betting or told you that you had a gambling problem, regardless of whether or not you thought it was true?
Negative health effects 16. How often has gambling caused you any health problems, including stress or anxiety?
Personal consequences
Feelings of guilt 15. How often have you felt guilty about the way you gamble or what happens when you gamble?
Adverse Consequences
Social consequences
Financial problems 17. How often has your gambling caused any financial problems for you or your household?
The response scale score for each of the nine PGSI items is as follows: score 1 for each
response of �sometimes,� 2 for each �most of the time,� and 3 for each �almost always.� Based on this method, a total score of between 0 and 27 points is possible for each survey respondent, and the cut-point scores for each of the gambler sub-types is as follows:
PGSI Score Gambler Sub-Type 0 Non-problem gambler 1-2 Low risk gambler 3-7 Moderate risk gambler 8 and over Problem gambler
The non-problem gambler group is further separated into gamblers and non-gamblers as these sub-types have quite different characteristics. Throughout this report, statistical data are presented for each of these four gambler sub-types to compare and contrast the responses of each, for the purpose of providing insight into the nature and characteristics of problem gambling in Saskatchewan. 2.5 Data Analysis
During each telephone interview, Prairie Research Associates Inc. directly entered
responses into a computer program, and this electronic data was subsequently converted into a statistical file utilizing the Statistical Package for the Social Sciences (SPSS v.10) computer program. When the survey was complete, PRA cleaned the SPSS data file of any input errors, categorized and coded open-ended and multiple responses, and emailed the final SPSS file to
__________________________________________________________________________________________ Gambling and Problem Gambling in Saskatchewan (2002) Final Report
25
Barbara Kahan of Kael Consulting and Evan Morris of EcoTech Research in Regina for subsequent analysis.
The Regina consultants analysed the statistical data using SPSS according to a framework provided by Dr. Wynne, the principal investigator, and this analysis mainly included calculating frequency distributions and cross-tabulations by gambler sub-type for each of the survey items. Chi-square tests of statistical significance were computed and these are displayed, along with frequency distributions, in tables in the results section of this report. Data are presented in tables in the results section, and this information is typically displayed as the number and percentage of respondents who fall within a particular cell. In some cases, the percentage for a group of cells does not total 100% due to rounding or some missing data (e.g., respondents answering, �don�t know� or �refused to answer� to some of the questions). 2.6 Definition of Terms
A number of gambling-related terms are used throughout this report and the following definitions are provided to describe the meaning attached to these. Gambling The definition of �gambling� adopted for this study comes from the sociologist Devereux (1979), who suggests that gambling means wagering money or other belongings on chance activities or events with random or uncertain outcomes. This definition is supported in the Webster�s Encyclopedic Unabridged Dictionary (1996) where gambling is defined as �to stake or risk money or anything of value on the outcome of something involving chance.� In colloquial usage, gambling often refers to many day-to-day activities or circumstances people find themselves in. For instance, it is frequently said that farming, marriage, changing jobs, or venturing outside in a lightning storm constitutes a �gamble.� While this is true, gambling on games of chance specifically designed to allow the punter to risk his or her money is clearly a different form of gambling. In this situation, the �game� has been set up specifically to allow the gambler to risk money or valuables on a random occurrence, whether pure luck (e.g. VLTs) or a modicum of skill (e.g. poker) is involved. In contrast, farming is not a game or event that is set up for the sole purpose of allowing the farmer to risk money or valuables, notwithstanding that farming is truly a risky business. In this study, respondents are asked to relate their experiences relative to gambling on these �games� that are specifically set up to allow them to risk their money against the hope of winning more. In this sense, gambling at roulette in a casino is viewed as gambling, whereas, farming is not. Problem Gambling
This study incorporates the following definition of problem gambling that was adopted by the Canadian Interprovincial Steering Committee as part of the development of the Canadian Problem Gambling Index:
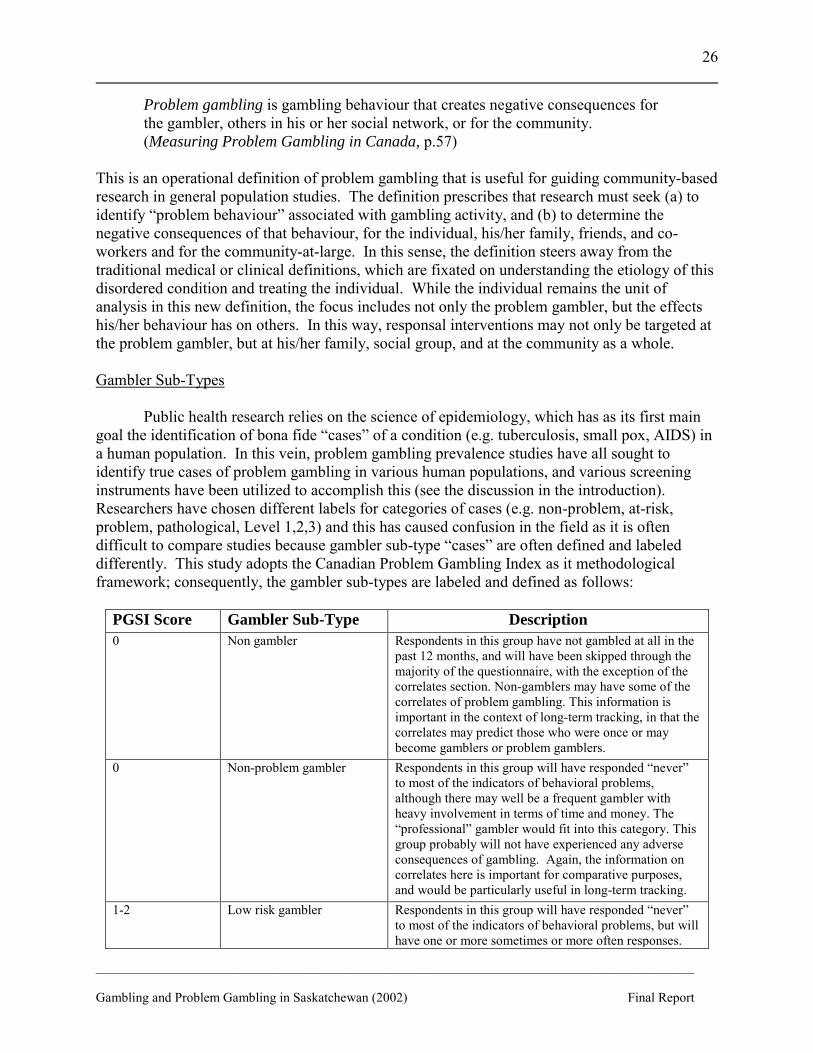
__________________________________________________________________________________________ Gambling and Problem Gambling in Saskatchewan (2002) Final Report
26
Problem gambling is gambling behaviour that creates negative consequences for the gambler, others in his or her social network, or for the community. (Measuring Problem Gambling in Canada, p.57)
This is an operational definition of problem gambling that is useful for guiding community-based research in general population studies. The definition prescribes that research must seek (a) to identify �problem behaviour� associated with gambling activity, and (b) to determine the negative consequences of that behaviour, for the individual, his/her family, friends, and co-workers and for the community-at-large. In this sense, the definition steers away from the traditional medical or clinical definitions, which are fixated on understanding the etiology of this disordered condition and treating the individual. While the individual remains the unit of analysis in this new definition, the focus includes not only the problem gambler, but the effects his/her behaviour has on others. In this way, responsal interventions may not only be targeted at the problem gambler, but at his/her family, social group, and at the community as a whole. Gambler Sub-Types
Public health research relies on the science of epidemiology, which has as its first main
goal the identification of bona fide �cases� of a condition (e.g. tuberculosis, small pox, AIDS) in a human population. In this vein, problem gambling prevalence studies have all sought to identify true cases of problem gambling in various human populations, and various screening instruments have been utilized to accomplish this (see the discussion in the introduction). Researchers have chosen different labels for categories of cases (e.g. non-problem, at-risk, problem, pathological, Level 1,2,3) and this has caused confusion in the field as it is often difficult to compare studies because gambler sub-type �cases� are often defined and labeled differently. This study adopts the Canadian Problem Gambling Index as it methodological framework; consequently, the gambler sub-types are labeled and defined as follows:
PGSI Score Gambler Sub-Type Description 0 Non gambler Respondents in this group have not gambled at all in the
past 12 months, and will have been skipped through the majority of the questionnaire, with the exception of the correlates section. Non-gamblers may have some of the correlates of problem gambling. This information is important in the context of long-term tracking, in that the correlates may predict those who were once or may become gamblers or problem gamblers.
0 Non-problem gambler Respondents in this group will have responded �never� to most of the indicators of behavioral problems, although there may well be a frequent gambler with heavy involvement in terms of time and money. The �professional� gambler would fit into this category. This group probably will not have experienced any adverse consequences of gambling. Again, the information on correlates here is important for comparative purposes, and would be particularly useful in long-term tracking.
1-2 Low risk gambler Respondents in this group will have responded �never� to most of the indicators of behavioral problems, but will have one or more sometimes or more often responses.
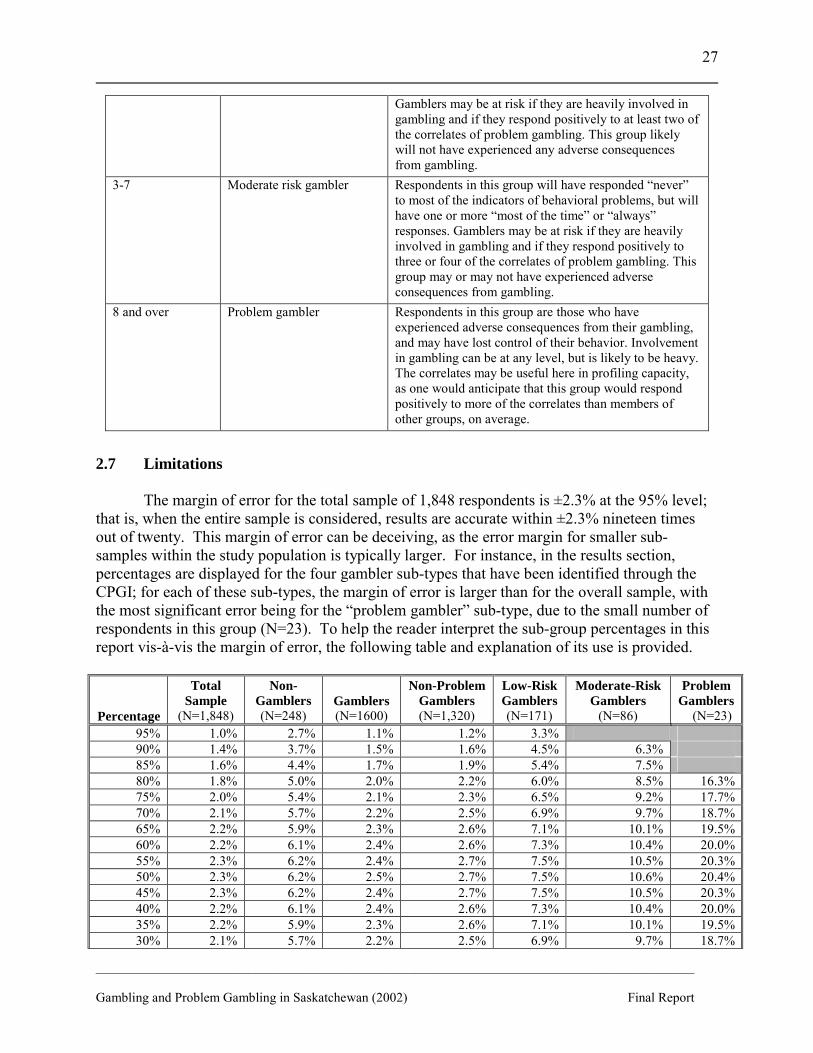
__________________________________________________________________________________________ Gambling and Problem Gambling in Saskatchewan (2002) Final Report
27
Gamblers may be at risk if they are heavily involved in gambling and if they respond positively to at least two of the correlates of problem gambling. This group likely will not have experienced any adverse consequences from gambling.
3-7 Moderate risk gambler Respondents in this group will have responded �never� to most of the indicators of behavioral problems, but will have one or more �most of the time� or �always� responses. Gamblers may be at risk if they are heavily involved in gambling and if they respond positively to three or four of the correlates of problem gambling. This group may or may not have experienced adverse consequences from gambling.
8 and over Problem gambler Respondents in this group are those who have experienced adverse consequences from their gambling, and may have lost control of their behavior. Involvement in gambling can be at any level, but is likely to be heavy. The correlates may be useful here in profiling capacity, as one would anticipate that this group would respond positively to more of the correlates than members of other groups, on average.
2.7 Limitations
The margin of error for the total sample of 1,848 respondents is ±2.3% at the 95% level; that is, when the entire sample is considered, results are accurate within ±2.3% nineteen times out of twenty. This margin of error can be deceiving, as the error margin for smaller sub-samples within the study population is typically larger. For instance, in the results section, percentages are displayed for the four gambler sub-types that have been identified through the CPGI; for each of these sub-types, the margin of error is larger than for the overall sample, with the most significant error being for the �problem gambler� sub-type, due to the small number of respondents in this group (N=23). To help the reader interpret the sub-group percentages in this report vis-à-vis the margin of error, the following table and explanation of its use is provided.
Percentage
Total Sample
(N=1,848)
Non- Gamblers (N=248)
Gamblers (N=1600)
Non-Problem Gamblers (N=1,320)
Low-Risk Gamblers (N=171)
Moderate-Risk Gamblers
(N=86)
Problem Gamblers
(N=23) 95% 1.0% 2.7% 1.1% 1.2% 3.3% 90% 1.4% 3.7% 1.5% 1.6% 4.5% 6.3% 85% 1.6% 4.4% 1.7% 1.9% 5.4% 7.5% 80% 1.8% 5.0% 2.0% 2.2% 6.0% 8.5% 16.3% 75% 2.0% 5.4% 2.1% 2.3% 6.5% 9.2% 17.7% 70% 2.1% 5.7% 2.2% 2.5% 6.9% 9.7% 18.7% 65% 2.2% 5.9% 2.3% 2.6% 7.1% 10.1% 19.5% 60% 2.2% 6.1% 2.4% 2.6% 7.3% 10.4% 20.0% 55% 2.3% 6.2% 2.4% 2.7% 7.5% 10.5% 20.3% 50% 2.3% 6.2% 2.5% 2.7% 7.5% 10.6% 20.4% 45% 2.3% 6.2% 2.4% 2.7% 7.5% 10.5% 20.3% 40% 2.2% 6.1% 2.4% 2.6% 7.3% 10.4% 20.0% 35% 2.2% 5.9% 2.3% 2.6% 7.1% 10.1% 19.5% 30% 2.1% 5.7% 2.2% 2.5% 6.9% 9.7% 18.7%
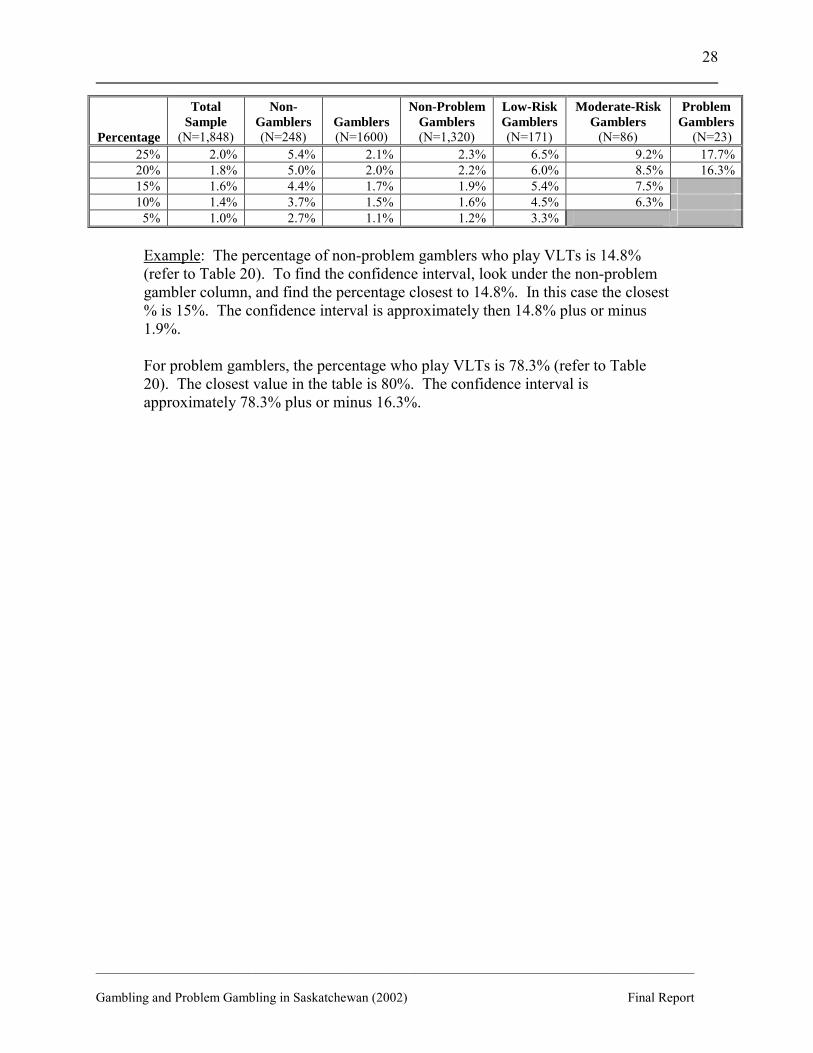
__________________________________________________________________________________________ Gambling and Problem Gambling in Saskatchewan (2002) Final Report
28
Percentage
Total Sample
(N=1,848)
Non- Gamblers (N=248)
Gamblers (N=1600)
Non-Problem Gamblers (N=1,320)
Low-Risk Gamblers (N=171)
Moderate-Risk Gamblers
(N=86)
Problem Gamblers
(N=23) 25% 2.0% 5.4% 2.1% 2.3% 6.5% 9.2% 17.7% 20% 1.8% 5.0% 2.0% 2.2% 6.0% 8.5% 16.3% 15% 1.6% 4.4% 1.7% 1.9% 5.4% 7.5% 10% 1.4% 3.7% 1.5% 1.6% 4.5% 6.3%
5% 1.0% 2.7% 1.1% 1.2% 3.3% Example: The percentage of non-problem gamblers who play VLTs is 14.8% (refer to Table 20). To find the confidence interval, look under the non-problem gambler column, and find the percentage closest to 14.8%. In this case the closest % is 15%. The confidence interval is approximately then 14.8% plus or minus 1.9%. For problem gamblers, the percentage who play VLTs is 78.3% (refer to Table 20). The closest value in the table is 80%. The confidence interval is approximately 78.3% plus or minus 16.3%.
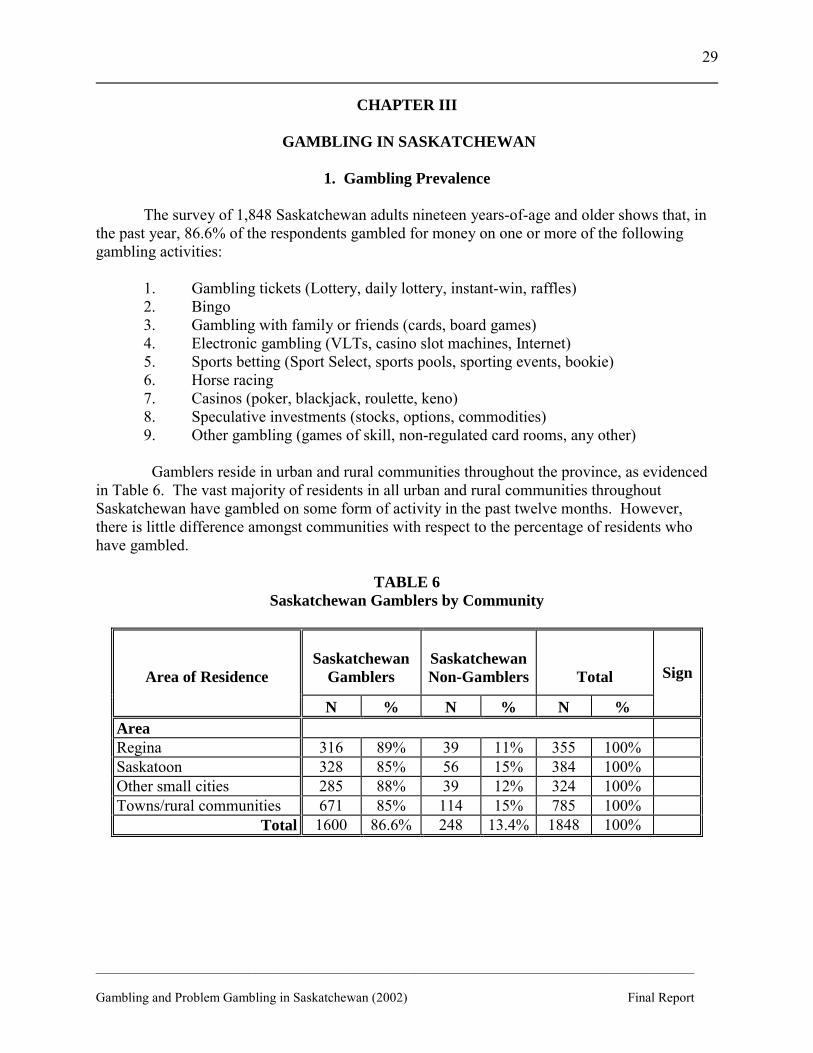
__________________________________________________________________________________________ Gambling and Problem Gambling in Saskatchewan (2002) Final Report
29
CHAPTER III
GAMBLING IN SASKATCHEWAN
1. Gambling Prevalence
The survey of 1,848 Saskatchewan adults nineteen years-of-age and older shows that, in the past year, 86.6% of the respondents gambled for money on one or more of the following gambling activities:
1. Gambling tickets (Lottery, daily lottery, instant-win, raffles) 2. Bingo 3. Gambling with family or friends (cards, board games) 4. Electronic gambling (VLTs, casino slot machines, Internet) 5. Sports betting (Sport Select, sports pools, sporting events, bookie) 6. Horse racing 7. Casinos (poker, blackjack, roulette, keno) 8. Speculative investments (stocks, options, commodities) 9. Other gambling (games of skill, non-regulated card rooms, any other) Gamblers reside in urban and rural communities throughout the province, as evidenced
in Table 6. The vast majority of residents in all urban and rural communities throughout Saskatchewan have gambled on some form of activity in the past twelve months. However, there is little difference amongst communities with respect to the percentage of residents who have gambled.
TABLE 6
Saskatchewan Gamblers by Community
Saskatchewan
Gamblers
Saskatchewan Non-Gamblers
Total
Area of Residence
N % N % N %
Sign
Area Regina 316 89% 39 11% 355 100% Saskatoon 328 85% 56 15% 384 100% Other small cities 285 88% 39 12% 324 100% Towns/rural communities 671 85% 114 15% 785 100%
Total 1600 86.6% 248 13.4% 1848 100%
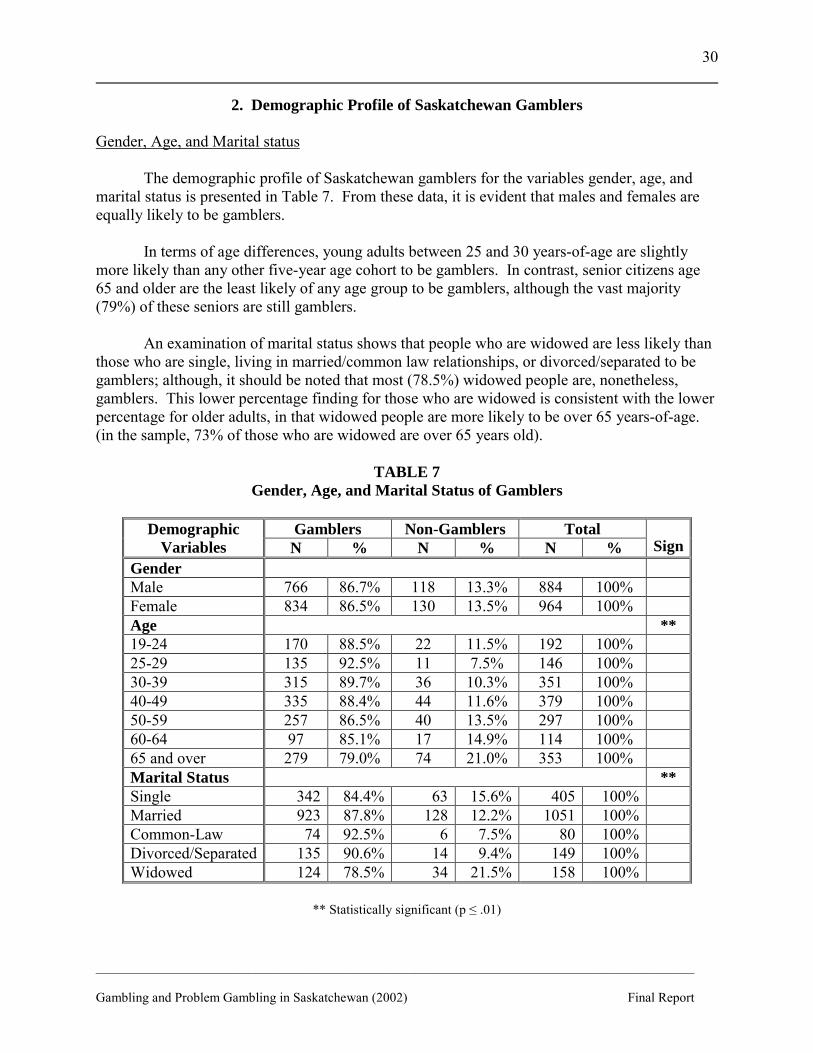
__________________________________________________________________________________________ Gambling and Problem Gambling in Saskatchewan (2002) Final Report
30
2. Demographic Profile of Saskatchewan Gamblers
Gender, Age, and Marital status The demographic profile of Saskatchewan gamblers for the variables gender, age, and
marital status is presented in Table 7. From these data, it is evident that males and females are equally likely to be gamblers.
In terms of age differences, young adults between 25 and 30 years-of-age are slightly
more likely than any other five-year age cohort to be gamblers. In contrast, senior citizens age 65 and older are the least likely of any age group to be gamblers, although the vast majority (79%) of these seniors are still gamblers.
An examination of marital status shows that people who are widowed are less likely than
those who are single, living in married/common law relationships, or divorced/separated to be gamblers; although, it should be noted that most (78.5%) widowed people are, nonetheless, gamblers. This lower percentage finding for those who are widowed is consistent with the lower percentage for older adults, in that widowed people are more likely to be over 65 years-of-age. (in the sample, 73% of those who are widowed are over 65 years old).
TABLE 7
Gender, Age, and Marital Status of Gamblers
Gamblers Non-Gamblers Total Demographic Variables N % N % N % Sign
Gender Male 766 86.7% 118 13.3% 884 100% Female 834 86.5% 130 13.5% 964 100% Age ** 19-24 170 88.5% 22 11.5% 192 100% 25-29 135 92.5% 11 7.5% 146 100% 30-39 315 89.7% 36 10.3% 351 100% 40-49 335 88.4% 44 11.6% 379 100% 50-59 257 86.5% 40 13.5% 297 100% 60-64 97 85.1% 17 14.9% 114 100% 65 and over 279 79.0% 74 21.0% 353 100% Marital Status ** Single 342 84.4% 63 15.6% 405 100% Married 923 87.8% 128 12.2% 1051 100% Common-Law 74 92.5% 6 7.5% 80 100% Divorced/Separated 135 90.6% 14 9.4% 149 100% Widowed 124 78.5% 34 21.5% 158 100%
** Statistically significant (p ≤ .01)

__________________________________________________________________________________________ Gambling and Problem Gambling in Saskatchewan (2002) Final Report
31
Education and Income
The relationship between education, income and gambling is presented in Table 8. Those people who reported that they never went beyond elementary school are significantly less likely to be gamblers than those who have achieved a high school or post-secondary education. However, as the total number of respondents reporting they received only an elementary school education is relatively small (N=22), this finding is less significant due to the margin of error.
When respondents are compared according to their annual household income levels, it is apparent that those with the lowest income (i.e., less than $20,000 annually) are significantly less likely than those with higher incomes to have gambled in the past year. Notwithstanding this finding, it is also apparent that the vast majority of respondents in each of the five income groups are gamblers.
In education and social research, the high correlation between education and income is well known. Consequently, the study finding that those who have achieved no higher than an elementary school education are also more likely to have an annual household income of less than $20,000 is not surprising. Of the 22 respondents with an elementary school education only, 14 divulged their annual household income, with 10 of the 14 (71%) reporting an annual household income of less than $20,000. Both the lowest education and income respondents are less likely than higher education/income groups to be gamblers, notwithstanding that most respondents in all education/income groups report having gambled in the past year.
TABLE 8
Education and Income
Gamblers Non-Gamblers Total Demographic Variables N % N % N % Sign
Education ** Elementary School 14 63.6% 8 36.4% 22 100% High School 743 85.7% 124 14.3% 867 100% College, Technical, University
762 88.4% 100 11.6% 862 100%
Advanced Degree 71 83.5% 14 16.5% 85 100% Annual Household Income ** Less than $20,000 230 77.7% 66 22.3% 296 100% $20,000-$39,000 452 89.2% 55 10.8% 507 100% $40,000-$59,000 335 91.5% 31 8.5% 366 100% $60,000-$79.000 172 93.5% 12 6.5% 184 100% $80,000 and over 191 95.0% 10 5.0% 201 100%
** Statistically significant (p ≤ .01)
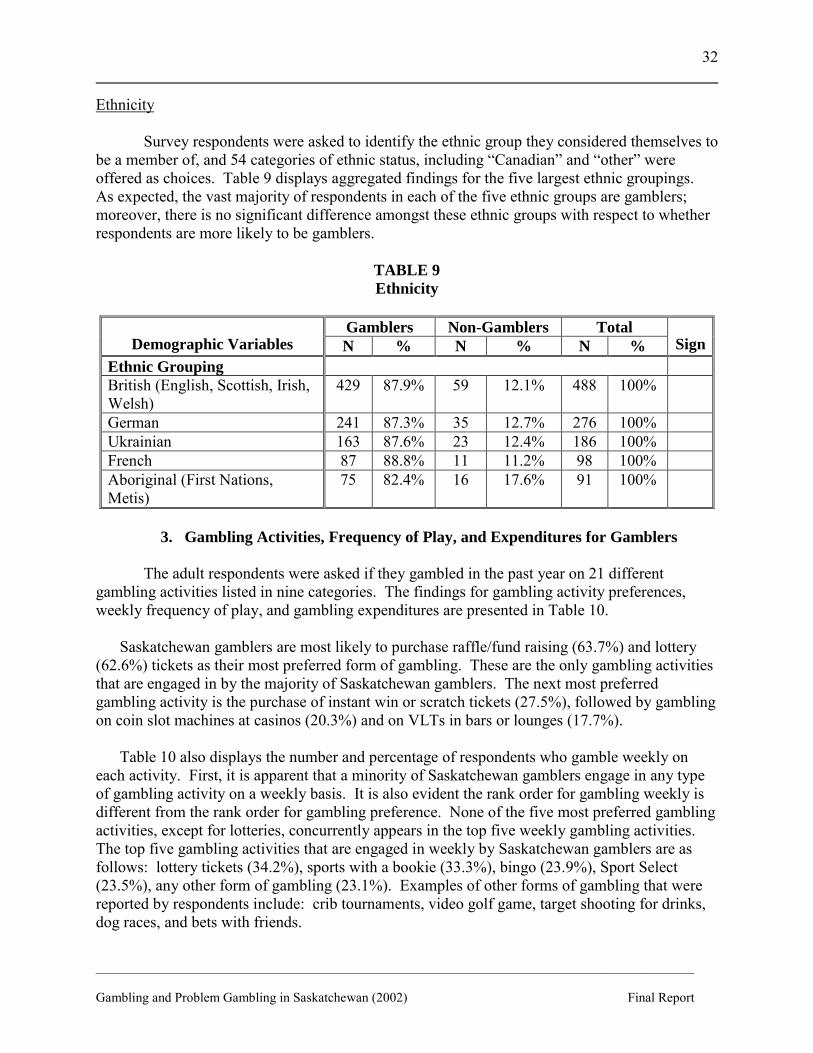
__________________________________________________________________________________________ Gambling and Problem Gambling in Saskatchewan (2002) Final Report
32
Ethnicity
Survey respondents were asked to identify the ethnic group they considered themselves to be a member of, and 54 categories of ethnic status, including �Canadian� and �other� were offered as choices. Table 9 displays aggregated findings for the five largest ethnic groupings. As expected, the vast majority of respondents in each of the five ethnic groups are gamblers; moreover, there is no significant difference amongst these ethnic groups with respect to whether respondents are more likely to be gamblers.
TABLE 9 Ethnicity
Gamblers Non-Gamblers Total
Demographic Variables N % N % N % SignEthnic Grouping British (English, Scottish, Irish, Welsh)
429 87.9% 59 12.1% 488 100%
German 241 87.3% 35 12.7% 276 100% Ukrainian 163 87.6% 23 12.4% 186 100% French 87 88.8% 11 11.2% 98 100% Aboriginal (First Nations, Metis)
75 82.4% 16 17.6% 91 100%
3. Gambling Activities, Frequency of Play, and Expenditures for Gamblers
The adult respondents were asked if they gambled in the past year on 21 different
gambling activities listed in nine categories. The findings for gambling activity preferences, weekly frequency of play, and gambling expenditures are presented in Table 10.
Saskatchewan gamblers are most likely to purchase raffle/fund raising (63.7%) and lottery (62.6%) tickets as their most preferred form of gambling. These are the only gambling activities that are engaged in by the majority of Saskatchewan gamblers. The next most preferred gambling activity is the purchase of instant win or scratch tickets (27.5%), followed by gambling on coin slot machines at casinos (20.3%) and on VLTs in bars or lounges (17.7%). Table 10 also displays the number and percentage of respondents who gamble weekly on each activity. First, it is apparent that a minority of Saskatchewan gamblers engage in any type of gambling activity on a weekly basis. It is also evident the rank order for gambling weekly is different from the rank order for gambling preference. None of the five most preferred gambling activities, except for lotteries, concurrently appears in the top five weekly gambling activities. The top five gambling activities that are engaged in weekly by Saskatchewan gamblers are as follows: lottery tickets (34.2%), sports with a bookie (33.3%), bingo (23.9%), Sport Select (23.5%), any other form of gambling (23.1%). Examples of other forms of gambling that were reported by respondents include: crib tournaments, video golf game, target shooting for drinks, dog races, and bets with friends.
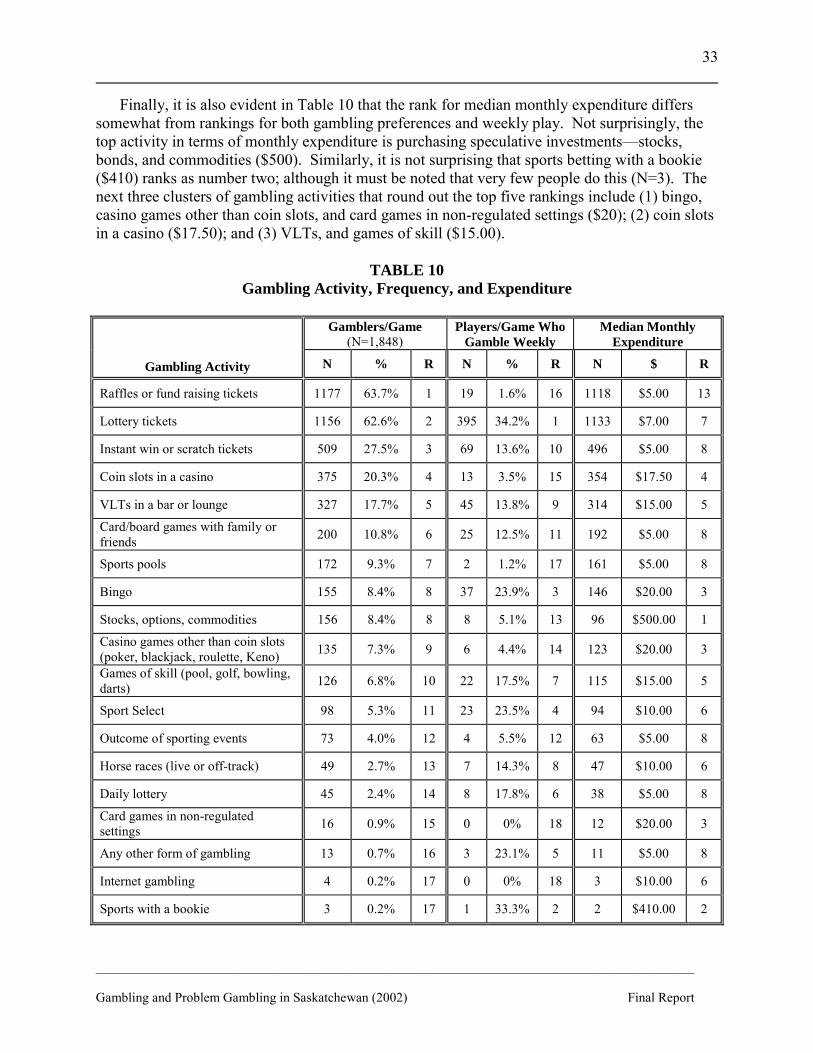
__________________________________________________________________________________________ Gambling and Problem Gambling in Saskatchewan (2002) Final Report
33
Finally, it is also evident in Table 10 that the rank for median monthly expenditure differs somewhat from rankings for both gambling preferences and weekly play. Not surprisingly, the top activity in terms of monthly expenditure is purchasing speculative investments�stocks, bonds, and commodities ($500). Similarly, it is not surprising that sports betting with a bookie ($410) ranks as number two; although it must be noted that very few people do this (N=3). The next three clusters of gambling activities that round out the top five rankings include (1) bingo, casino games other than coin slots, and card games in non-regulated settings ($20); (2) coin slots in a casino ($17.50); and (3) VLTs, and games of skill ($15.00).
TABLE 10 Gambling Activity, Frequency, and Expenditure
Gamblers/Game
(N=1,848) Players/Game Who
Gamble Weekly Median Monthly
Expenditure
Gambling Activity N % R N % R N $ R
Raffles or fund raising tickets 1177 63.7% 1 19 1.6% 16 1118 $5.00 13
Lottery tickets 1156 62.6% 2 395 34.2% 1 1133 $7.00 7
Instant win or scratch tickets 509 27.5% 3 69 13.6% 10 496 $5.00 8
Coin slots in a casino 375 20.3% 4 13 3.5% 15 354 $17.50 4
VLTs in a bar or lounge 327 17.7% 5 45 13.8% 9 314 $15.00 5
Card/board games with family or friends 200 10.8% 6 25 12.5% 11 192 $5.00 8
Sports pools 172 9.3% 7 2 1.2% 17 161 $5.00 8
Bingo 155 8.4% 8 37 23.9% 3 146 $20.00 3
Stocks, options, commodities 156 8.4% 8 8 5.1% 13 96 $500.00 1
Casino games other than coin slots (poker, blackjack, roulette, Keno) 135 7.3% 9 6 4.4% 14 123 $20.00 3
Games of skill (pool, golf, bowling, darts) 126 6.8% 10 22 17.5% 7 115 $15.00 5
Sport Select 98 5.3% 11 23 23.5% 4 94 $10.00 6
Outcome of sporting events 73 4.0% 12 4 5.5% 12 63 $5.00 8
Horse races (live or off-track) 49 2.7% 13 7 14.3% 8 47 $10.00 6
Daily lottery 45 2.4% 14 8 17.8% 6 38 $5.00 8
Card games in non-regulated settings 16 0.9% 15 0 0% 18 12 $20.00 3
Any other form of gambling 13 0.7% 16 3 23.1% 5 11 $5.00 8
Internet gambling 4 0.2% 17 0 0% 18 3 $10.00 6
Sports with a bookie 3 0.2% 17 1 33.3% 2 2 $410.00 2
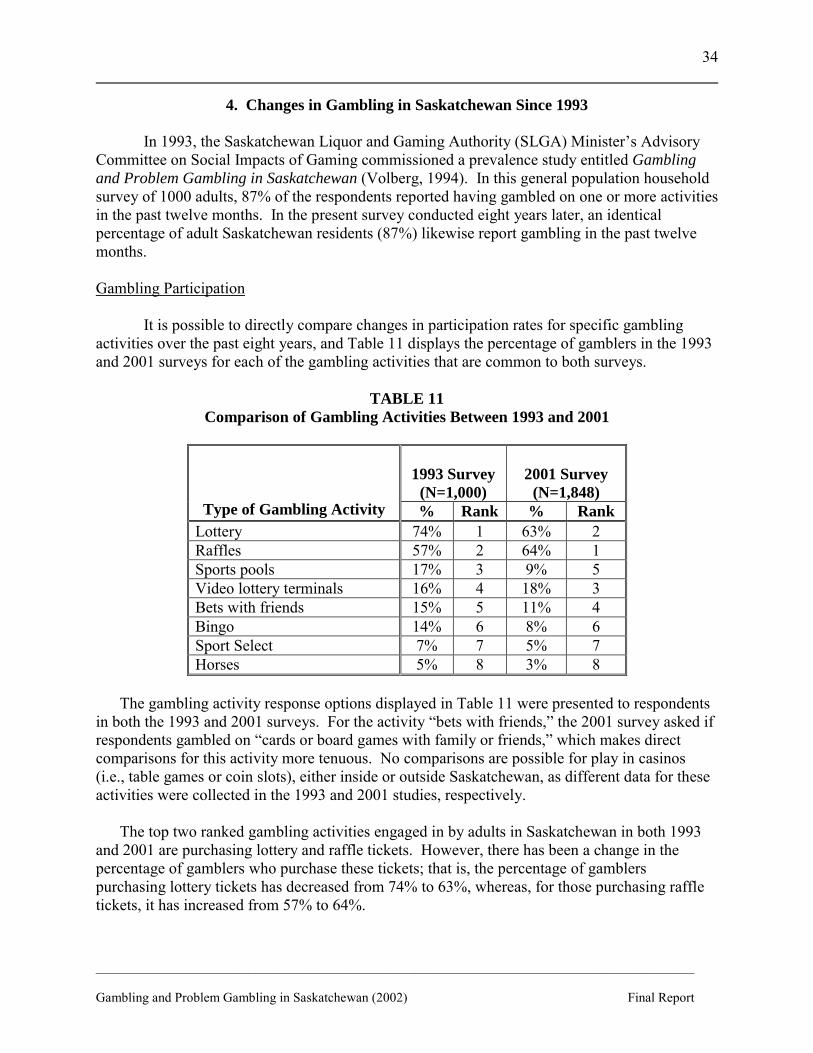
__________________________________________________________________________________________ Gambling and Problem Gambling in Saskatchewan (2002) Final Report
34
4. Changes in Gambling in Saskatchewan Since 1993
In 1993, the Saskatchewan Liquor and Gaming Authority (SLGA) Minister�s Advisory Committee on Social Impacts of Gaming commissioned a prevalence study entitled Gambling and Problem Gambling in Saskatchewan (Volberg, 1994). In this general population household survey of 1000 adults, 87% of the respondents reported having gambled on one or more activities in the past twelve months. In the present survey conducted eight years later, an identical percentage of adult Saskatchewan residents (87%) likewise report gambling in the past twelve months.
Gambling Participation
It is possible to directly compare changes in participation rates for specific gambling
activities over the past eight years, and Table 11 displays the percentage of gamblers in the 1993 and 2001 surveys for each of the gambling activities that are common to both surveys.
TABLE 11 Comparison of Gambling Activities Between 1993 and 2001
1993 Survey (N=1,000)
2001 Survey
(N=1,848)
Type of Gambling Activity % Rank % Rank Lottery 74% 1 63% 2 Raffles 57% 2 64% 1 Sports pools 17% 3 9% 5 Video lottery terminals 16% 4 18% 3 Bets with friends 15% 5 11% 4 Bingo 14% 6 8% 6 Sport Select 7% 7 5% 7 Horses 5% 8 3% 8
The gambling activity response options displayed in Table 11 were presented to respondents in both the 1993 and 2001 surveys. For the activity �bets with friends,� the 2001 survey asked if respondents gambled on �cards or board games with family or friends,� which makes direct comparisons for this activity more tenuous. No comparisons are possible for play in casinos (i.e., table games or coin slots), either inside or outside Saskatchewan, as different data for these activities were collected in the 1993 and 2001 studies, respectively. The top two ranked gambling activities engaged in by adults in Saskatchewan in both 1993 and 2001 are purchasing lottery and raffle tickets. However, there has been a change in the percentage of gamblers who purchase these tickets; that is, the percentage of gamblers purchasing lottery tickets has decreased from 74% to 63%, whereas, for those purchasing raffle tickets, it has increased from 57% to 64%.

__________________________________________________________________________________________ Gambling and Problem Gambling in Saskatchewan (2002) Final Report
35
In terms of ranking, the third ranked activity in 1993 (wagering in sports pools) has slipped to 5th place and decreased in the percentage of participants (i.e., down from 17% in 1993 to 9% in 2001). In contrast, the 4th ranked activity in 1993 (VLT play) has moved to 3rd place in 2001, and the participation rate has increased somewhat (i.e., 16% to 18%).
For �bets with friends,� �bingo,� �Sport Select,� and �horses,� there appears to have been
a decrease from 1993 to 2001 in the percentage of Saskatchewan adults wagering on these activities.
Gambling Expenditures
In both the 1993 and 2001 gambling surveys, respondents were asked how much they spent per month on the gambling activities that were presented to them. Table 12 compares the median monthly expenditure for each comparable game that was included in both the 1993 and 2001 surveys.
The comparison of respondents� gambling expenditures between the 1993 and 2001
surveys shows that for every gambling activity, the 2001 survey respondents report spending more per month than did the 1993 gamblers.
For games included in both studies, the largest expenditure in each is for bingo (1993,
$13.50; 2001, $20). The largest difference for comparable games between the two studies is for VLT play (1993, $5; 2001, $15), as gamblers in 2001 report spending three times more than those in 1993 on this activity.
Gambling expenditure data should be evaluated with caution, as they are based on recollection and self-report and do not include gambling in the province by non-residents and tourists, as Volberg correctly points out in the 1993 Saskatchewan gambling survey report. As such, her reminder is worth repeating: �These data are best suited for analyzing the relative importance of different types of gambling in the general population rather than for ascertaining absolute spending levels on different types of wagering (Volberg, 1994, p.8).�
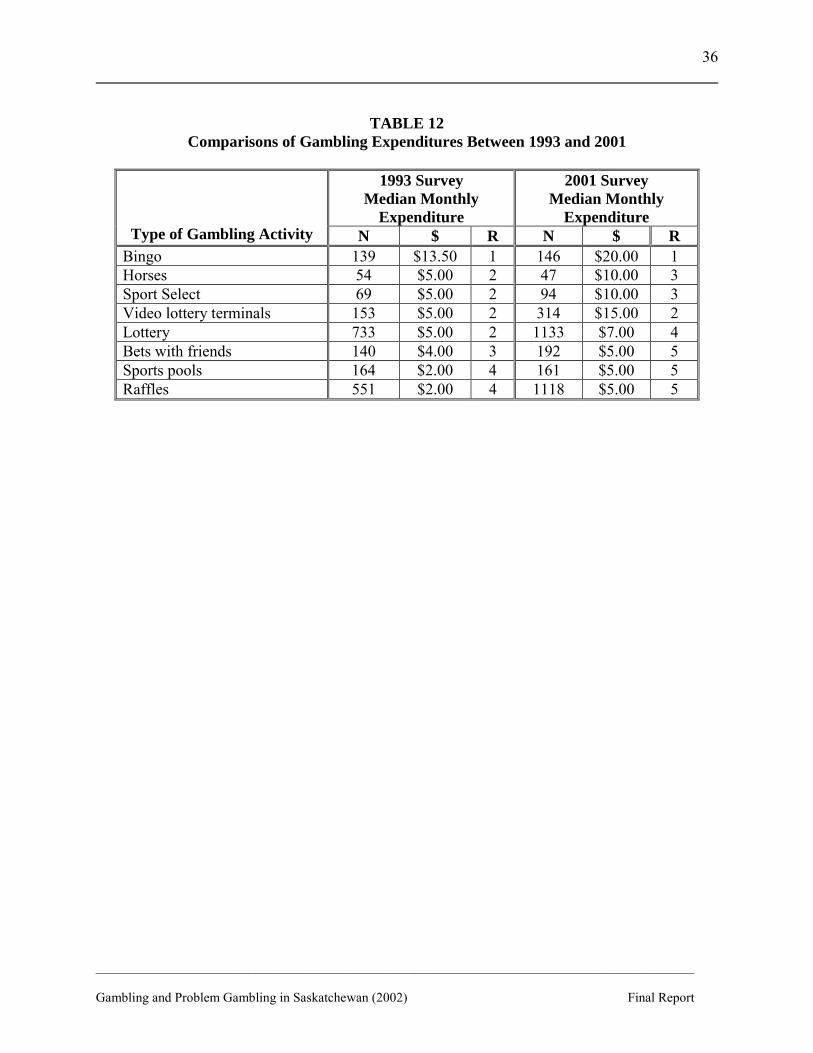
__________________________________________________________________________________________ Gambling and Problem Gambling in Saskatchewan (2002) Final Report
36
TABLE 12
Comparisons of Gambling Expenditures Between 1993 and 2001
1993 Survey Median Monthly
Expenditure
2001 Survey Median Monthly
Expenditure Type of Gambling Activity N $ R N $ R
Bingo 139 $13.50 1 146 $20.00 1 Horses 54 $5.00 2 47 $10.00 3 Sport Select 69 $5.00 2 94 $10.00 3 Video lottery terminals 153 $5.00 2 314 $15.00 2 Lottery 733 $5.00 2 1133 $7.00 4 Bets with friends 140 $4.00 3 192 $5.00 5 Sports pools 164 $2.00 4 161 $5.00 5 Raffles 551 $2.00 4 1118 $5.00 5
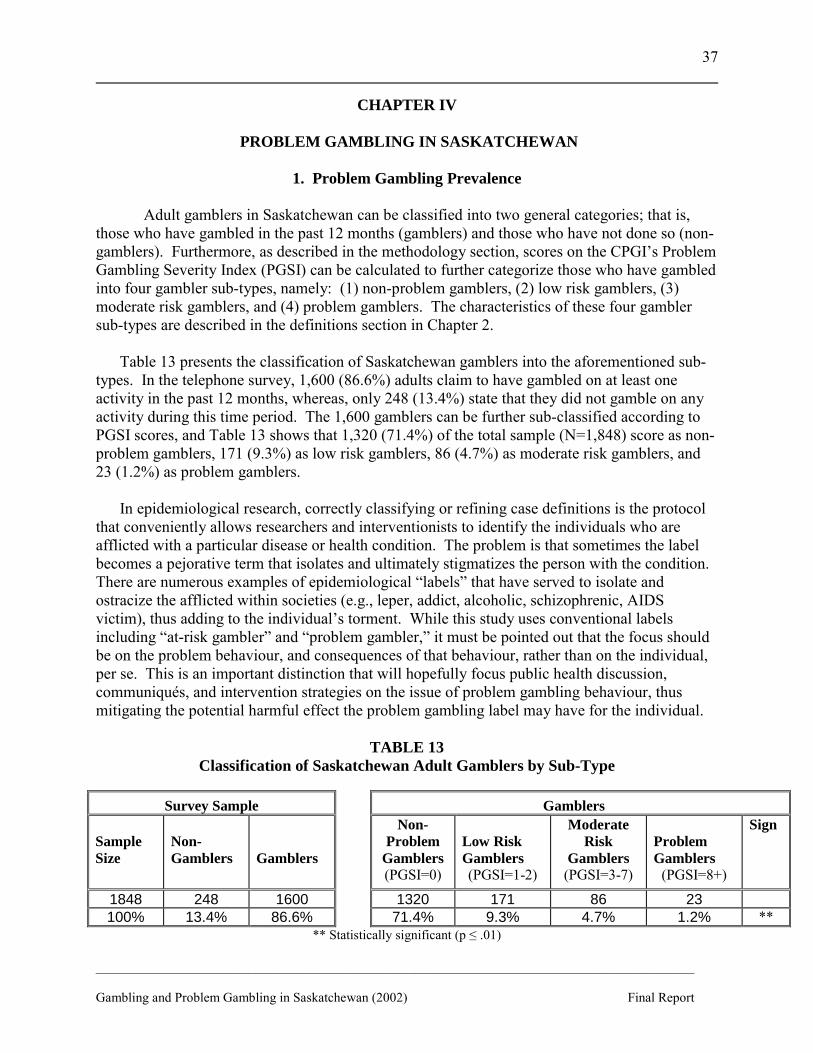
__________________________________________________________________________________________ Gambling and Problem Gambling in Saskatchewan (2002) Final Report
37
CHAPTER IV
PROBLEM GAMBLING IN SASKATCHEWAN
1. Problem Gambling Prevalence
Adult gamblers in Saskatchewan can be classified into two general categories; that is, those who have gambled in the past 12 months (gamblers) and those who have not done so (non-gamblers). Furthermore, as described in the methodology section, scores on the CPGI�s Problem Gambling Severity Index (PGSI) can be calculated to further categorize those who have gambled into four gambler sub-types, namely: (1) non-problem gamblers, (2) low risk gamblers, (3) moderate risk gamblers, and (4) problem gamblers. The characteristics of these four gambler sub-types are described in the definitions section in Chapter 2. Table 13 presents the classification of Saskatchewan gamblers into the aforementioned sub-types. In the telephone survey, 1,600 (86.6%) adults claim to have gambled on at least one activity in the past 12 months, whereas, only 248 (13.4%) state that they did not gamble on any activity during this time period. The 1,600 gamblers can be further sub-classified according to PGSI scores, and Table 13 shows that 1,320 (71.4%) of the total sample (N=1,848) score as non-problem gamblers, 171 (9.3%) as low risk gamblers, 86 (4.7%) as moderate risk gamblers, and 23 (1.2%) as problem gamblers. In epidemiological research, correctly classifying or refining case definitions is the protocol that conveniently allows researchers and interventionists to identify the individuals who are afflicted with a particular disease or health condition. The problem is that sometimes the label becomes a pejorative term that isolates and ultimately stigmatizes the person with the condition. There are numerous examples of epidemiological �labels� that have served to isolate and ostracize the afflicted within societies (e.g., leper, addict, alcoholic, schizophrenic, AIDS victim), thus adding to the individual�s torment. While this study uses conventional labels including �at-risk gambler� and �problem gambler,� it must be pointed out that the focus should be on the problem behaviour, and consequences of that behaviour, rather than on the individual, per se. This is an important distinction that will hopefully focus public health discussion, communiqués, and intervention strategies on the issue of problem gambling behaviour, thus mitigating the potential harmful effect the problem gambling label may have for the individual.
TABLE 13 Classification of Saskatchewan Adult Gamblers by Sub-Type
Survey Sample Gamblers Sample Size
Non-Gamblers
Gamblers
Non-Problem
Gamblers (PGSI=0)
Low Risk Gamblers (PGSI=1-2)
Moderate Risk
Gamblers (PGSI=3-7)
Problem Gamblers
(PGSI=8+)
Sign
1848 248 1600 1320 171 86 23 100% 13.4% 86.6% 71.4% 9.3% 4.7% 1.2% **
** Statistically significant (p ≤ .01)
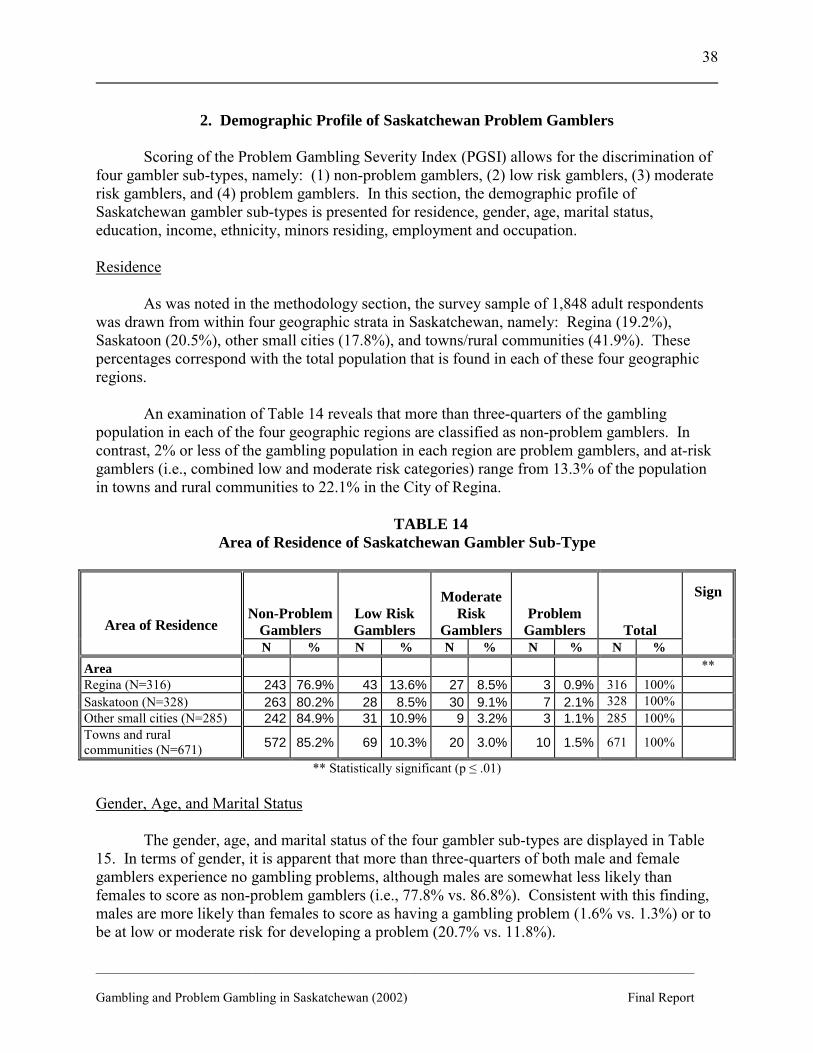
__________________________________________________________________________________________ Gambling and Problem Gambling in Saskatchewan (2002) Final Report
38
2. Demographic Profile of Saskatchewan Problem Gamblers
Scoring of the Problem Gambling Severity Index (PGSI) allows for the discrimination of
four gambler sub-types, namely: (1) non-problem gamblers, (2) low risk gamblers, (3) moderate risk gamblers, and (4) problem gamblers. In this section, the demographic profile of Saskatchewan gambler sub-types is presented for residence, gender, age, marital status, education, income, ethnicity, minors residing, employment and occupation.
Residence
As was noted in the methodology section, the survey sample of 1,848 adult respondents
was drawn from within four geographic strata in Saskatchewan, namely: Regina (19.2%), Saskatoon (20.5%), other small cities (17.8%), and towns/rural communities (41.9%). These percentages correspond with the total population that is found in each of these four geographic regions.
An examination of Table 14 reveals that more than three-quarters of the gambling
population in each of the four geographic regions are classified as non-problem gamblers. In contrast, 2% or less of the gambling population in each region are problem gamblers, and at-risk gamblers (i.e., combined low and moderate risk categories) range from 13.3% of the population in towns and rural communities to 22.1% in the City of Regina.
TABLE 14
Area of Residence of Saskatchewan Gambler Sub-Type
Non-Problem Gamblers
Low Risk Gamblers
Moderate Risk
Gamblers Problem
Gamblers
Total
Area of Residence N % N % N % N % N %
Sign
Area ** Regina (N=316) 243 76.9% 43 13.6% 27 8.5% 3 0.9% 316 100% Saskatoon (N=328) 263 80.2% 28 8.5% 30 9.1% 7 2.1% 328 100% Other small cities (N=285) 242 84.9% 31 10.9% 9 3.2% 3 1.1% 285 100% Towns and rural communities (N=671) 572 85.2% 69 10.3% 20 3.0% 10 1.5% 671 100%
** Statistically significant (p ≤ .01) Gender, Age, and Marital Status
The gender, age, and marital status of the four gambler sub-types are displayed in Table
15. In terms of gender, it is apparent that more than three-quarters of both male and female gamblers experience no gambling problems, although males are somewhat less likely than females to score as non-problem gamblers (i.e., 77.8% vs. 86.8%). Consistent with this finding, males are more likely than females to score as having a gambling problem (1.6% vs. 1.3%) or to be at low or moderate risk for developing a problem (20.7% vs. 11.8%).
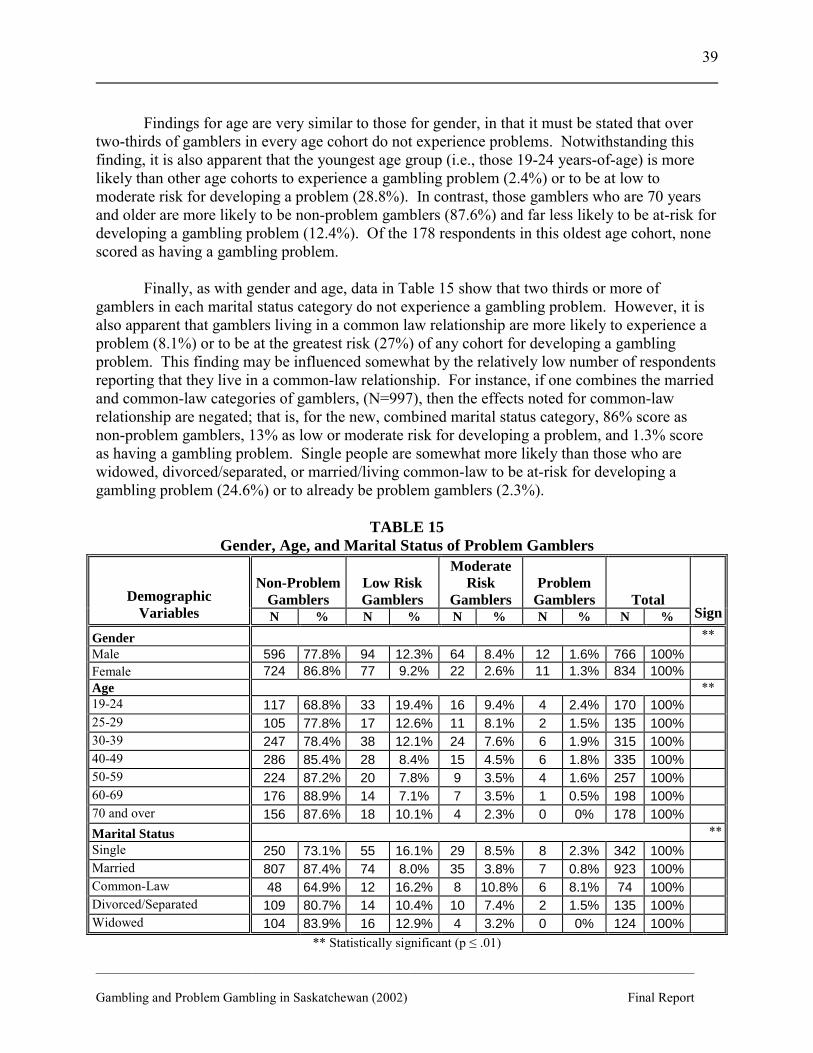
__________________________________________________________________________________________ Gambling and Problem Gambling in Saskatchewan (2002) Final Report
39
Findings for age are very similar to those for gender, in that it must be stated that over
two-thirds of gamblers in every age cohort do not experience problems. Notwithstanding this finding, it is also apparent that the youngest age group (i.e., those 19-24 years-of-age) is more likely than other age cohorts to experience a gambling problem (2.4%) or to be at low to moderate risk for developing a problem (28.8%). In contrast, those gamblers who are 70 years and older are more likely to be non-problem gamblers (87.6%) and far less likely to be at-risk for developing a gambling problem (12.4%). Of the 178 respondents in this oldest age cohort, none scored as having a gambling problem.
Finally, as with gender and age, data in Table 15 show that two thirds or more of
gamblers in each marital status category do not experience a gambling problem. However, it is also apparent that gamblers living in a common law relationship are more likely to experience a problem (8.1%) or to be at the greatest risk (27%) of any cohort for developing a gambling problem. This finding may be influenced somewhat by the relatively low number of respondents reporting that they live in a common-law relationship. For instance, if one combines the married and common-law categories of gamblers, (N=997), then the effects noted for common-law relationship are negated; that is, for the new, combined marital status category, 86% score as non-problem gamblers, 13% as low or moderate risk for developing a problem, and 1.3% score as having a gambling problem. Single people are somewhat more likely than those who are widowed, divorced/separated, or married/living common-law to be at-risk for developing a gambling problem (24.6%) or to already be problem gamblers (2.3%).
TABLE 15 Gender, Age, and Marital Status of Problem Gamblers
Non-Problem
Gamblers
Low Risk Gamblers
Moderate Risk
Gamblers
Problem
Gamblers
Total
Demographic Variables N % N % N % N % N %
Sign
Gender ** Male 596 77.8% 94 12.3% 64 8.4% 12 1.6% 766 100% Female 724 86.8% 77 9.2% 22 2.6% 11 1.3% 834 100% Age ** 19-24 117 68.8% 33 19.4% 16 9.4% 4 2.4% 170 100% 25-29 105 77.8% 17 12.6% 11 8.1% 2 1.5% 135 100% 30-39 247 78.4% 38 12.1% 24 7.6% 6 1.9% 315 100% 40-49 286 85.4% 28 8.4% 15 4.5% 6 1.8% 335 100% 50-59 224 87.2% 20 7.8% 9 3.5% 4 1.6% 257 100% 60-69 176 88.9% 14 7.1% 7 3.5% 1 0.5% 198 100% 70 and over 156 87.6% 18 10.1% 4 2.3% 0 0% 178 100% Marital Status ** Single 250 73.1% 55 16.1% 29 8.5% 8 2.3% 342 100% Married 807 87.4% 74 8.0% 35 3.8% 7 0.8% 923 100% Common-Law 48 64.9% 12 16.2% 8 10.8% 6 8.1% 74 100% Divorced/Separated 109 80.7% 14 10.4% 10 7.4% 2 1.5% 135 100% Widowed 104 83.9% 16 12.9% 4 3.2% 0 0% 124 100%
** Statistically significant (p ≤ .01)

__________________________________________________________________________________________ Gambling and Problem Gambling in Saskatchewan (2002) Final Report
40
Education and Income
The relationship between problem gambling and the education and income demographic variables is presented in Table 16. The questionnaire provided fourteen response categories for level of education and twelve for income level, respectively. These categories have been aggregated in Table 16 into four education and five income groupings, as these more clearly illuminate the main differences amongst gambler sub-types for these variables.
First, it is evident that, for all education groupings, the majority of gamblers do not
experience a problem associated with their gambling. However, it appears that those who have never gone beyond high school in their education are at greater risk for developing a gambling problem, or already have a problem. For instance, if the �elementary school� and �high school� categories are combined and compared with the combined categories �college, technical, university� and �advanced degree,� an interesting finding appears. That is, those who have not gone beyond a high school education are at greater risk than those with a post-secondary education for developing a gambling problem (20.2% vs. 12.3%). Moreover, the former are also more likely than those with a post-secondary education to score as problem gamblers (2.4% vs. 0.6%).
Second, as with education cohorts, the majority of gamblers in every income category do not experience any gambling-related problems. Nevertheless, those gamblers with the lowest annual household income of <$20,000.00 are at the greatest risk of the five income cohorts for developing a gambling problem (22.1%). Furthermore, these low-income gamblers are far more likely than those in other income groups to score as problem gamblers (4.3%).
As mentioned earlier, there is a well-known direct correlation between education and income. The data in Table 16 appears to provide preliminary evidence of a relationship between lower levels of education and income and problem gambling in Saskatchewan, however, this possibility needs to be explored through further research.
TABLE 16 Education and Income
Non-Problem
Gamblers Low Risk Gamblers
Moderate Risk
Gamblers Problem
Gamblers
Total
Demographic Variables
N % N % N % N % N %
Sign
Education * Elementary School 8 57.1% 3 21.4% 2 14.3% 1 7.1% 14 100% High School 578 77.8% 100 13.5% 48 6.5% 17 2.3% 743 100% College, Technical, University 664 87.1% 61 8.0% 32 4.2% 5 0.7% 762 100%
Advanced Degree 61 85.9% 6 8.5% 4 5.6% 0 0% 71 100% Annual Household Income * Less than $20,000 169 73.5% 33 14.3% 18 7.8% 10 4.3% 230 100% $20,000-$39,000 374 82.7% 43 9.5% 30 6.6% 5 1.1% 452 100%
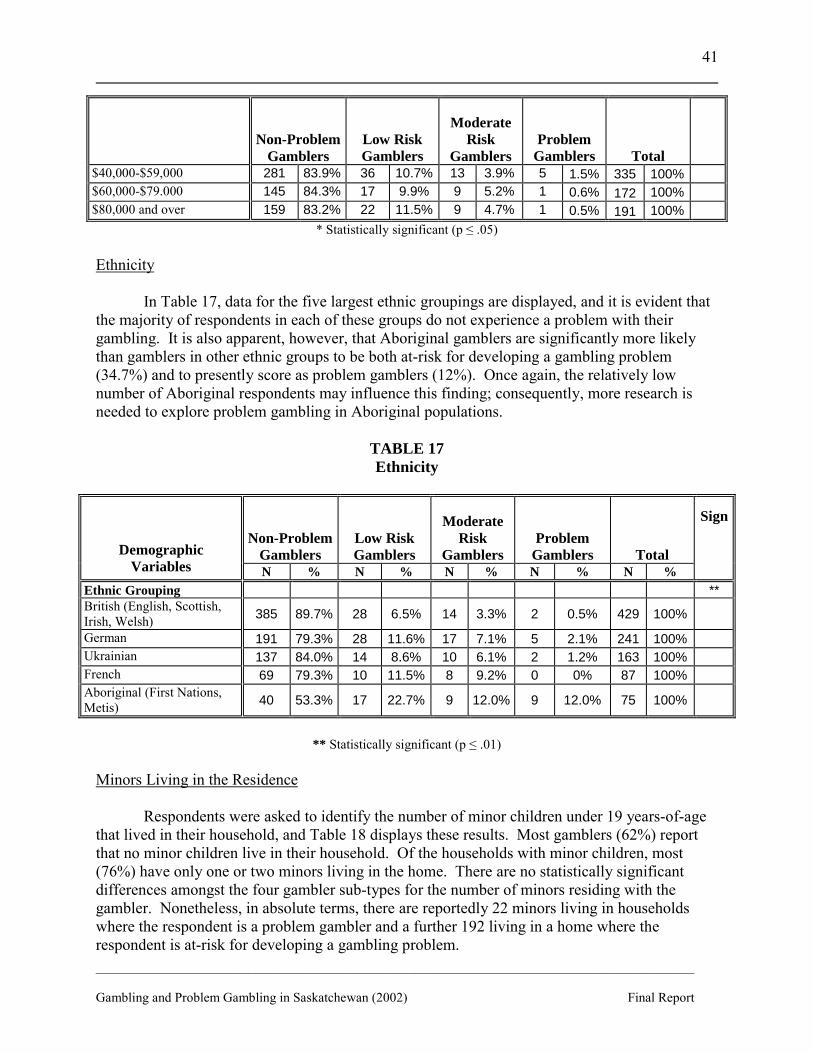
__________________________________________________________________________________________ Gambling and Problem Gambling in Saskatchewan (2002) Final Report
41
Non-Problem
Gamblers Low Risk Gamblers
Moderate Risk
Gamblers Problem
Gamblers
Total $40,000-$59,000 281 83.9% 36 10.7% 13 3.9% 5 1.5% 335 100% $60,000-$79.000 145 84.3% 17 9.9% 9 5.2% 1 0.6% 172 100% $80,000 and over 159 83.2% 22 11.5% 9 4.7% 1 0.5% 191 100%
* Statistically significant (p ≤ .05) Ethnicity
In Table 17, data for the five largest ethnic groupings are displayed, and it is evident that the majority of respondents in each of these groups do not experience a problem with their gambling. It is also apparent, however, that Aboriginal gamblers are significantly more likely than gamblers in other ethnic groups to be both at-risk for developing a gambling problem (34.7%) and to presently score as problem gamblers (12%). Once again, the relatively low number of Aboriginal respondents may influence this finding; consequently, more research is needed to explore problem gambling in Aboriginal populations.
TABLE 17 Ethnicity
Non-Problem
Gamblers
Low Risk Gamblers
Moderate Risk
Gamblers
Problem
Gamblers
Total
Demographic Variables N % N % N % N % N %
Sign
Ethnic Grouping ** British (English, Scottish, Irish, Welsh) 385 89.7% 28 6.5% 14 3.3% 2 0.5% 429 100%
German 191 79.3% 28 11.6% 17 7.1% 5 2.1% 241 100% Ukrainian 137 84.0% 14 8.6% 10 6.1% 2 1.2% 163 100% French 69 79.3% 10 11.5% 8 9.2% 0 0% 87 100% Aboriginal (First Nations, Metis) 40 53.3% 17 22.7% 9 12.0% 9 12.0% 75 100%
** Statistically significant (p ≤ .01)
Minors Living in the Residence
Respondents were asked to identify the number of minor children under 19 years-of-age
that lived in their household, and Table 18 displays these results. Most gamblers (62%) report that no minor children live in their household. Of the households with minor children, most (76%) have only one or two minors living in the home. There are no statistically significant differences amongst the four gambler sub-types for the number of minors residing with the gambler. Nonetheless, in absolute terms, there are reportedly 22 minors living in households where the respondent is a problem gambler and a further 192 living in a home where the respondent is at-risk for developing a gambling problem.
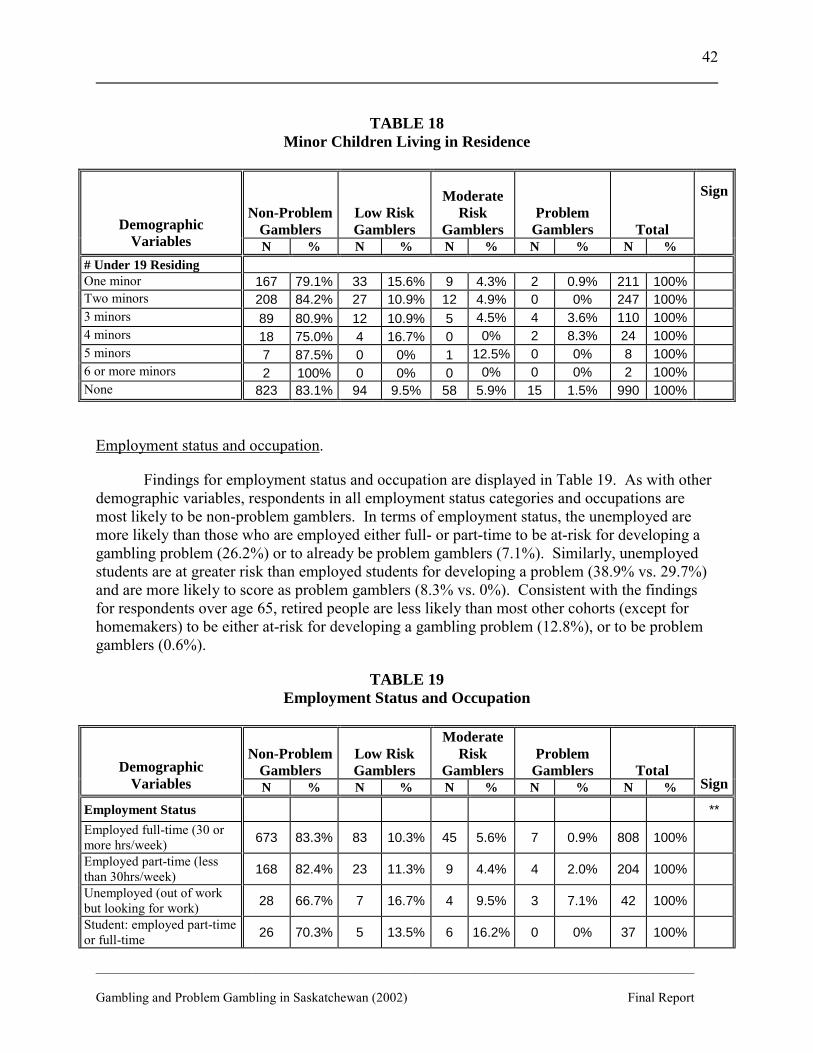
__________________________________________________________________________________________ Gambling and Problem Gambling in Saskatchewan (2002) Final Report
42
TABLE 18
Minor Children Living in Residence
Non-Problem
Gamblers
Low Risk Gamblers
Moderate Risk
Gamblers Problem
Gamblers Total
Demographic Variables N % N % N % N % N %
Sign
# Under 19 Residing One minor 167 79.1% 33 15.6% 9 4.3% 2 0.9% 211 100% Two minors 208 84.2% 27 10.9% 12 4.9% 0 0% 247 100% 3 minors 89 80.9% 12 10.9% 5 4.5% 4 3.6% 110 100% 4 minors 18 75.0% 4 16.7% 0 0% 2 8.3% 24 100% 5 minors 7 87.5% 0 0% 1 12.5% 0 0% 8 100% 6 or more minors 2 100% 0 0% 0 0% 0 0% 2 100% None 823 83.1% 94 9.5% 58 5.9% 15 1.5% 990 100%
Employment status and occupation.
Findings for employment status and occupation are displayed in Table 19. As with other demographic variables, respondents in all employment status categories and occupations are most likely to be non-problem gamblers. In terms of employment status, the unemployed are more likely than those who are employed either full- or part-time to be at-risk for developing a gambling problem (26.2%) or to already be problem gamblers (7.1%). Similarly, unemployed students are at greater risk than employed students for developing a problem (38.9% vs. 29.7%) and are more likely to score as problem gamblers (8.3% vs. 0%). Consistent with the findings for respondents over age 65, retired people are less likely than most other cohorts (except for homemakers) to be either at-risk for developing a gambling problem (12.8%), or to be problem gamblers (0.6%).
TABLE 19 Employment Status and Occupation
Non-Problem Gamblers
Low Risk Gamblers
Moderate Risk
Gamblers
Problem
Gamblers
Total Demographic Variables N % N % N % N % N % Sign
Employment Status ** Employed full-time (30 or more hrs/week) 673 83.3% 83 10.3% 45 5.6% 7 0.9% 808 100%
Employed part-time (less than 30hrs/week) 168 82.4% 23 11.3% 9 4.4% 4 2.0% 204 100%
Unemployed (out of work but looking for work) 28 66.7% 7 16.7% 4 9.5% 3 7.1% 42 100%
Student: employed part-time or full-time 26 70.3% 5 13.5% 6 16.2% 0 0% 37 100%
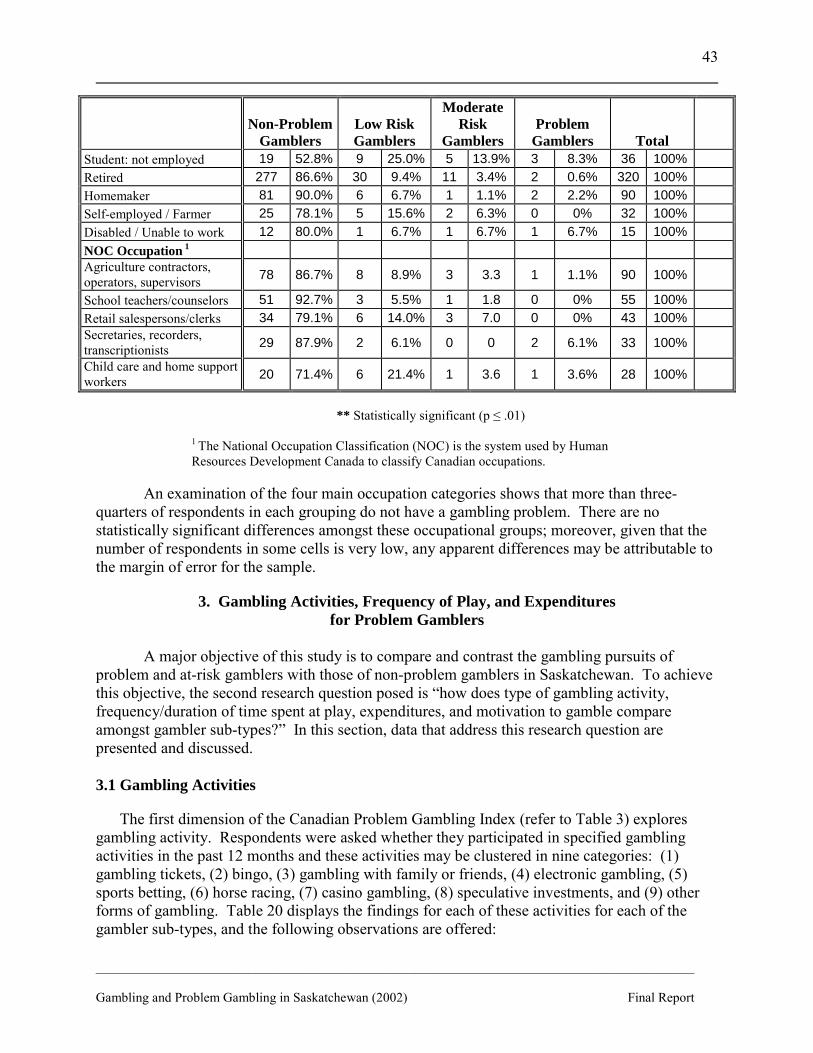
__________________________________________________________________________________________ Gambling and Problem Gambling in Saskatchewan (2002) Final Report
43
Non-Problem
Gamblers
Low Risk Gamblers
Moderate Risk
Gamblers
Problem
Gamblers
Total Student: not employed 19 52.8% 9 25.0% 5 13.9% 3 8.3% 36 100% Retired 277 86.6% 30 9.4% 11 3.4% 2 0.6% 320 100% Homemaker 81 90.0% 6 6.7% 1 1.1% 2 2.2% 90 100% Self-employed / Farmer 25 78.1% 5 15.6% 2 6.3% 0 0% 32 100% Disabled / Unable to work 12 80.0% 1 6.7% 1 6.7% 1 6.7% 15 100% NOC Occupation 1 Agriculture contractors, operators, supervisors 78 86.7% 8 8.9% 3 3.3 1 1.1% 90 100%
School teachers/counselors 51 92.7% 3 5.5% 1 1.8 0 0% 55 100% Retail salespersons/clerks 34 79.1% 6 14.0% 3 7.0 0 0% 43 100% Secretaries, recorders, transcriptionists 29 87.9% 2 6.1% 0 0 2 6.1% 33 100%
Child care and home support workers 20 71.4% 6 21.4% 1 3.6 1 3.6% 28 100%
** Statistically significant (p ≤ .01)
1 The National Occupation Classification (NOC) is the system used by Human Resources Development Canada to classify Canadian occupations.
An examination of the four main occupation categories shows that more than three-
quarters of respondents in each grouping do not have a gambling problem. There are no statistically significant differences amongst these occupational groups; moreover, given that the number of respondents in some cells is very low, any apparent differences may be attributable to the margin of error for the sample.
3. Gambling Activities, Frequency of Play, and Expenditures for Problem Gamblers
A major objective of this study is to compare and contrast the gambling pursuits of
problem and at-risk gamblers with those of non-problem gamblers in Saskatchewan. To achieve this objective, the second research question posed is �how does type of gambling activity, frequency/duration of time spent at play, expenditures, and motivation to gamble compare amongst gambler sub-types?� In this section, data that address this research question are presented and discussed. 3.1 Gambling Activities
The first dimension of the Canadian Problem Gambling Index (refer to Table 3) explores gambling activity. Respondents were asked whether they participated in specified gambling activities in the past 12 months and these activities may be clustered in nine categories: (1) gambling tickets, (2) bingo, (3) gambling with family or friends, (4) electronic gambling, (5) sports betting, (6) horse racing, (7) casino gambling, (8) speculative investments, and (9) other forms of gambling. Table 20 displays the findings for each of these activities for each of the gambler sub-types, and the following observations are offered:
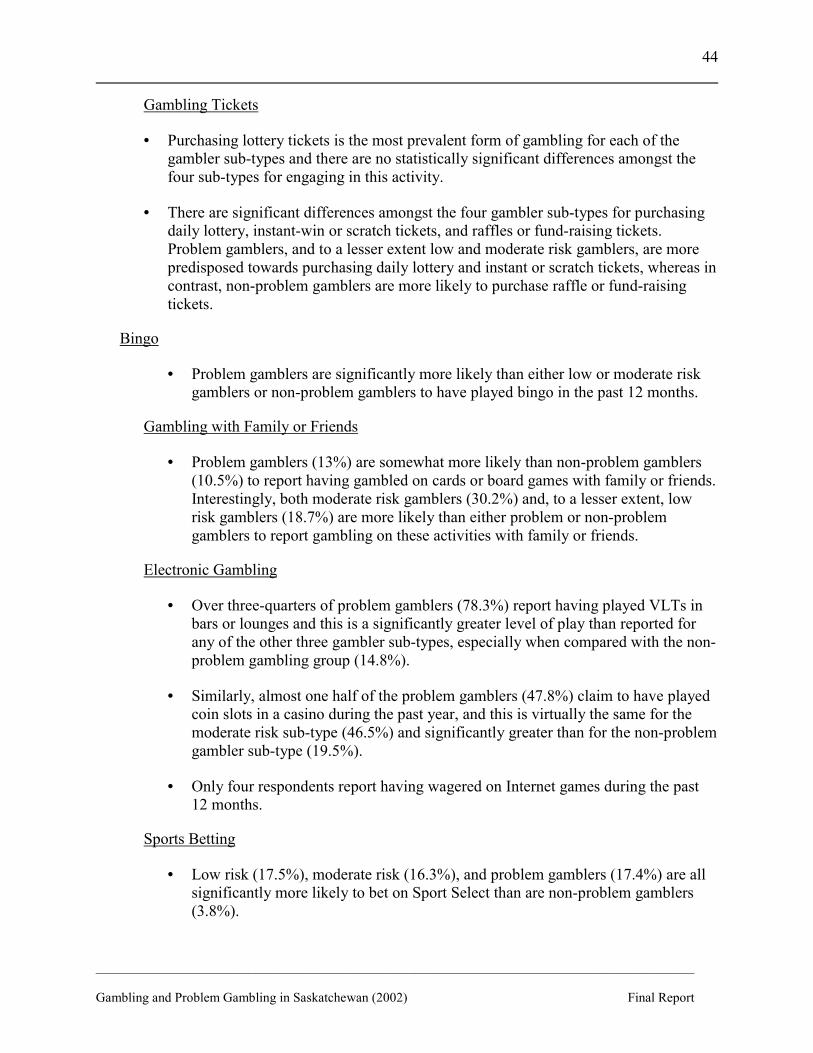
__________________________________________________________________________________________ Gambling and Problem Gambling in Saskatchewan (2002) Final Report
44
Gambling Tickets
• Purchasing lottery tickets is the most prevalent form of gambling for each of the gambler sub-types and there are no statistically significant differences amongst the four sub-types for engaging in this activity.
• There are significant differences amongst the four gambler sub-types for purchasing daily lottery, instant-win or scratch tickets, and raffles or fund-raising tickets. Problem gamblers, and to a lesser extent low and moderate risk gamblers, are more predisposed towards purchasing daily lottery and instant or scratch tickets, whereas in contrast, non-problem gamblers are more likely to purchase raffle or fund-raising tickets.
Bingo
• Problem gamblers are significantly more likely than either low or moderate risk gamblers or non-problem gamblers to have played bingo in the past 12 months.
Gambling with Family or Friends
• Problem gamblers (13%) are somewhat more likely than non-problem gamblers (10.5%) to report having gambled on cards or board games with family or friends. Interestingly, both moderate risk gamblers (30.2%) and, to a lesser extent, low risk gamblers (18.7%) are more likely than either problem or non-problem gamblers to report gambling on these activities with family or friends.
Electronic Gambling
• Over three-quarters of problem gamblers (78.3%) report having played VLTs in bars or lounges and this is a significantly greater level of play than reported for any of the other three gambler sub-types, especially when compared with the non-problem gambling group (14.8%).
• Similarly, almost one half of the problem gamblers (47.8%) claim to have played coin slots in a casino during the past year, and this is virtually the same for the moderate risk sub-type (46.5%) and significantly greater than for the non-problem gambler sub-type (19.5%).
• Only four respondents report having wagered on Internet games during the past 12 months.
Sports Betting
• Low risk (17.5%), moderate risk (16.3%), and problem gamblers (17.4%) are all significantly more likely to bet on Sport Select than are non-problem gamblers (3.8%).
__________________________________________________________________________________________ Gambling and Problem Gambling in Saskatchewan (2002) Final Report
45
• Low risk (19.9%) and moderate risk (17.4%) gamblers are more likely than either problem (8.7%) or non-problem (9.2%) gamblers to bet in sports pools.
• Moderate risk gamblers (15.1%) and, to a lesser extent low risk (8.8%) and problem (8.7%) gamblers, are more likely than non-problem gamblers (3.3%) to wager on the outcome of sporting events.
• Only three respondents report having wagered on sports with a bookie in the past 12 months.
Horse Racing
• Both problem gamblers (13%) and moderate risk gamblers (14%) are significantly more likely than either low risk (4.1%) or non-problem (2%) gamblers to wager on horse races, either at the track or off-track.
Casino Gambling
• Both problem gamblers (26.1%) and moderate risk gamblers (39.5%) are significantly more likely than either low risk (16.4%) or non-problem (5.1%) gamblers to bet on casino games other than coin slots (e.g., poker, blackjack, roulette and Keno).
Speculative Investments
• Problem gamblers (4.3%) are less likely than any of the other three gambler sub-types to have purchased speculative investments in the past year. Those at low (15.8%) and moderate risk (14%) for developing a gambling problem are more likely than non-problem gamblers (8.8%) to have done so. These findings, however, are not statistically significant.
Other Gambling
• Both low risk (21.1%) and moderate risk (23.3%) gamblers are significantly more likely than either problem (8.7%) or non-problem (5.2%) gamblers to have wagered on games of skill such as pool, golf, bowling, or darts.
• Few respondents report having gambled in card games in non-regulated settings, such as card rooms, or on any other form of gambling; however, those who do so are more likely to be low risk, moderate risk, or problem gamblers.
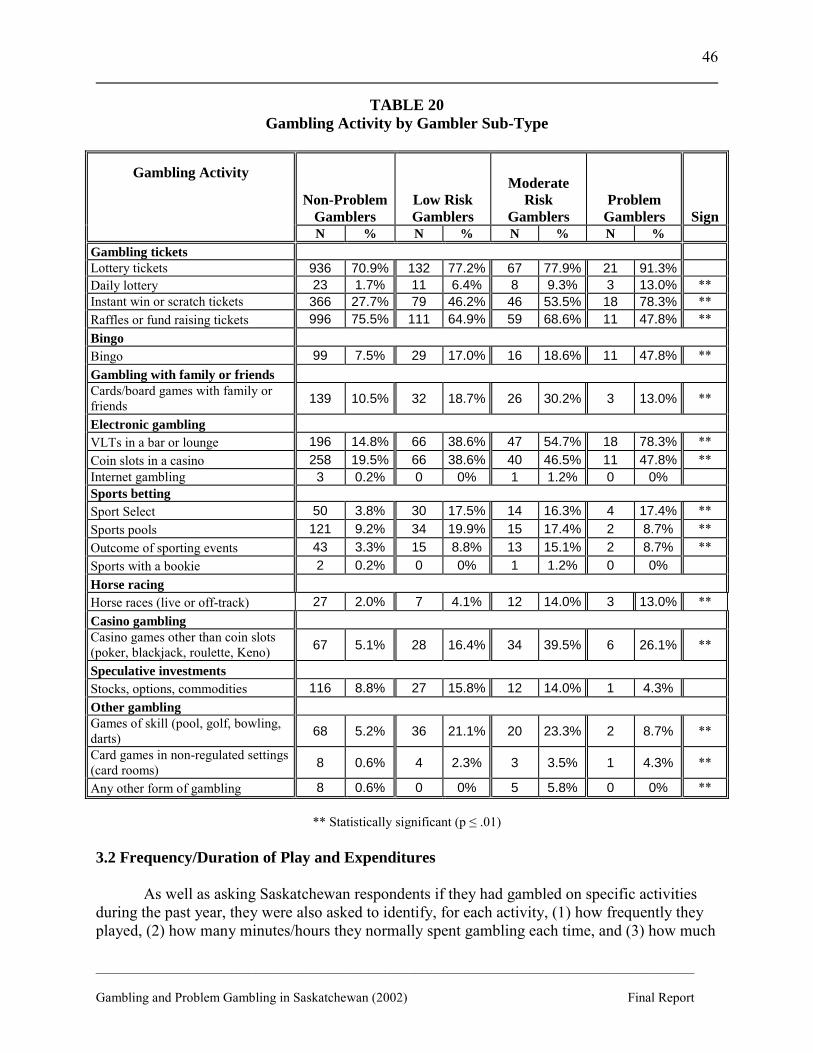
__________________________________________________________________________________________ Gambling and Problem Gambling in Saskatchewan (2002) Final Report
46
TABLE 20 Gambling Activity by Gambler Sub-Type
Non-Problem
Gamblers
Low Risk Gamblers
Moderate Risk
Gamblers
Problem
Gamblers Sign
Gambling Activity
N % N % N % N % Gambling tickets Lottery tickets 936 70.9% 132 77.2% 67 77.9% 21 91.3% Daily lottery 23 1.7% 11 6.4% 8 9.3% 3 13.0% ** Instant win or scratch tickets 366 27.7% 79 46.2% 46 53.5% 18 78.3% ** Raffles or fund raising tickets 996 75.5% 111 64.9% 59 68.6% 11 47.8% ** Bingo Bingo 99 7.5% 29 17.0% 16 18.6% 11 47.8% ** Gambling with family or friends Cards/board games with family or friends 139 10.5% 32 18.7% 26 30.2% 3 13.0% **
Electronic gambling VLTs in a bar or lounge 196 14.8% 66 38.6% 47 54.7% 18 78.3% ** Coin slots in a casino 258 19.5% 66 38.6% 40 46.5% 11 47.8% ** Internet gambling 3 0.2% 0 0% 1 1.2% 0 0% Sports betting Sport Select 50 3.8% 30 17.5% 14 16.3% 4 17.4% ** Sports pools 121 9.2% 34 19.9% 15 17.4% 2 8.7% ** Outcome of sporting events 43 3.3% 15 8.8% 13 15.1% 2 8.7% ** Sports with a bookie 2 0.2% 0 0% 1 1.2% 0 0% Horse racing Horse races (live or off-track) 27 2.0% 7 4.1% 12 14.0% 3 13.0% ** Casino gambling Casino games other than coin slots (poker, blackjack, roulette, Keno) 67 5.1% 28 16.4% 34 39.5% 6 26.1% **
Speculative investments Stocks, options, commodities 116 8.8% 27 15.8% 12 14.0% 1 4.3% Other gambling Games of skill (pool, golf, bowling, darts) 68 5.2% 36 21.1% 20 23.3% 2 8.7% **
Card games in non-regulated settings (card rooms) 8 0.6% 4 2.3% 3 3.5% 1 4.3% **
Any other form of gambling 8 0.6% 0 0% 5 5.8% 0 0% **
** Statistically significant (p ≤ .01) 3.2 Frequency/Duration of Play and Expenditures
As well as asking Saskatchewan respondents if they had gambled on specific activities
during the past year, they were also asked to identify, for each activity, (1) how frequently they played, (2) how many minutes/hours they normally spent gambling each time, and (3) how much
__________________________________________________________________________________________ Gambling and Problem Gambling in Saskatchewan (2002) Final Report
47
money they spent, not including winnings, in a typical month. Tables 21, 22 and 23 display data in these three areas for each of the gambling activities queried and the following results are posited:
Gambling Tickets
• All gambler sub-types are more likely to purchase lottery tickets (e.g. Lotto 649, Super 7) as opposed to daily lottery, instant-win tickets, or raffle tickets on a weekly basis or less.
• There are significant differences amongst the four gambler sub-types for the purchase of lottery, instant scratch, and raffle/fund raising tickets on a weekly basis or more frequently. The most pronounced difference is for the purchase of instant win tickets, where problem gamblers (33.4%) are three times more likely to do this on a weekly basis or more than are non-problem gamblers (9.9%).
• In terms of duration of play, the vast majority of gamblers within each sub-type spend very little time purchasing gambling tickets (i.e. less than one hour/session).
• With respect to the median monthly expenditure on all types of gambling tickets, low
risk, moderate risk, and problem gamblers spend more money than do non-problem gamblers, with one notable exceptions; that is, problem gamblers spend less/month on raffle tickets than any of the other three groups.
Bingo
• Both moderate risk (31.3%) and problem gamblers (27.3%) are somewhat more likely than non-problem gamblers (22.3%) to play bingo once/week or more, although it must be noted that these apparent differences are not statistically significant.
• When playing bingo, both moderate risk (62.5%) and problem gamblers (63.6%) are more likely than either low risk (41.4%) or non-problem gamblers (29.5%) to do so for three hours or more.
• Problem gamblers report spending over ten times more than non-problem gamblers per month on bingo ($160 vs. $15.50). Similarly, moderate risk gamblers spend two times more than non-problem gamblers ($32.50 vs. $15.50), however, the expenditure differences between low risk and non-problem gamblers is less pronounced ($20 vs. $15.50).
Gambling with Family or Friends
• Problem gamblers are significantly more likely than any other gambler sub-type to play cards or board games with family or friends for money on a weekly basis or more frequently. This difference is most evident for problem gamblers (66.6%) versus non-problem gamblers (11.5%), although moderate risk gamblers (19.2%) are

__________________________________________________________________________________________ Gambling and Problem Gambling in Saskatchewan (2002) Final Report
48
also more likely than non-problem gamblers to engage in this activity with this level of frequency.
• Problem gamblers (66.7%), moderate risk gamblers (66.7%), and low risk gamblers (50%) are each more likely than non-problem gamblers (37%) to wager on these activities with family/friends for three hours ore more during a typical session.
• Problem gamblers ($100), and to a lesser extent moderate risk ($15) and low risk ($10) gamblers, wager significantly more monthly than non-problem ($3) gamblers on card/board games with family or friends.
Electronic Gambling
• In terms of VLT play that is weekly or more frequent, there is a dramatic difference amongst gambler sub-types. Problem gamblers (61.1%) are ten times more likely than non-problem gamblers (6.1%) to play VLTs this frequently, and both low (15.1%) and moderate risk (25.5%) gamblers are significantly more likely than non-problem gamblers to play the VLTs weekly or more frequently.
• Gamblers in all sub-types are less likely to play coin slots in casinos weekly or more
frequently than they are to visit bars or lounges with the same frequency to play the VLTs. As for coin slot play in a casino, moderate risk gamblers (10%), and to a lesser extent low risk gamblers (4.5%), are more likely than non-problem gamblers to engage in this activity weekly. Interestingly, none of the problem gamblers report playing coin slot machines weekly.
• As with frequency of play, there is a significant difference between problem (44.4%),
and to a lesser extent and moderate risk (8.7%), gamblers and non-problem gamblers (1.1%) relative to the duration of time spent in excess of three hours or more at VLT play/session.
• Although no problem gamblers report playing coin slots weekly, they (45.5%) are
five times more likely than non-problem gamblers (8%) to play for three hours or more per session. Similarly, both low risk (19.6%) and moderate risk (26.3%) gamblers are significantly more likely than non-problem gamblers to play for this duration of time.
• As with frequency and duration of play, there is a significant difference amongst
gambler sub-types with respect to the average amount spent/month on VLTs. Problem gamblers ($200) report spending twenty times more on average/month on VLT play than do non-problem gamblers ($10). Differences in expenditure between both moderate ($40) and low risk ($20) gamblers and non-problem gamblers ($10) are, likewise, significant.
__________________________________________________________________________________________ Gambling and Problem Gambling in Saskatchewan (2002) Final Report
49
• As with VLT play, average monthly coin slot expenditures vary significantly amongst the gambler sub-types. Monthly expenditures on casino slot machines are identical to the amounts spent on VLTs for each of the four sub-groups.
• There are no significant differences amongst the gambler sub-types regarding
gambling on the Internet as only four respondents reported having gambled on the Internet in the past year.
Sports Betting
• For purchasing Sport Select tickets, there is a significant difference amongst gambler
sub-types. Both problem (50%) and moderate risk (57.2%) gamblers, and to a lesser extent low risk gamblers (19.9%), are more likely than non-problem gamblers (14%) to report playing Sport Select weekly or more frequently.
• Of all gambler sub-types, only two non-problem gamblers report gambling on sports
pools on a weekly basis or more frequently. Similarly, very few respondents (four) report wagering weekly on sporting events such as the outcome of football or hockey games.
• None of the gamblers report spending more than 3 hours/session on Sport Select. In
fact, all respondents, except for one moderate risk gambler, report spending less than one hour/session playing Sport Select.
• In terms of duration of play, most gamblers engage in sports pool betting for less than
one hour, although some non-problem (9.3%), low risk (12.4%), and moderate risk (6.7%) gamblers spend more than three hours/session, typically participating in events such as hockey drafts.
• There are no significant differences amongst the four gambler sub-types with respect
to the duration of their wagering on sporting events and all respondents except two report spending less than three hours at this pursuit.
• Problem ($30), moderate risks ($30), and low risk gamblers ($20) spend a
significantly greater amount each month on Sport Select than do non-problem gamblers ($5).
• Problem ($155), and to a lesser extent moderate risk ($10) and low risk ($5) gamblers
who participate in sports pools, report spending substantially more each month than do non-problem gamblers ($3).
• Only three respondents from the study sample claim to have wagered on sports with a bookie and one of these individuals is at moderate risk for developing a gambling problem. This individual claims to spend a substantial amount on this type of gambling on average/month ($800), although he spends a relative short amount of time (less than one hour) doing so.
__________________________________________________________________________________________ Gambling and Problem Gambling in Saskatchewan (2002) Final Report
50
Horse Racing
• While it appears that the problem (33.3%), moderate risk (25%), and low risk gamblers (14.3%) are more likely than non-problem gamblers (7.4%) to bet on horse races weekly or more frequently, these differences are not statistically significant.
• Few gamblers report spending 3 or more hours wagering on horse races, however, moderate risk gamblers (41.7%) are more likely than the other groups to do so.
• For those who gamble on horse racing, both problem gamblers ($400), and to a lesser extent moderate risk gamblers ($30) report spending significantly more each month than either low risk ($5) or non-problem gamblers ($5).
Casino Gambling • Relatively few respondents report gambling on casino games other than coin slots
(i.e., poker, blackjack, roulette, keno) on a weekly basis or more frequently. There are, however, statistically significant differences amongst the gambler sub-types for this activity, with problem gamblers (33.4%) being more likely than the other groups to do so.
• When they gamble on casino games, most gamblers in each of the four sub-types do
so for less than three hours at a typical session. However, for those who gamble three hours or more, moderate risk (30.3%), problem (16.7%), and to a lesser extent low risk gamblers (12%), are somewhat more likely to do so than non-problem gamblers (9.5%).
• Interestingly, there are no significant differences amongst the four gambler sub-types
for monthly expenditures on casino games other than coin slots (i.e., poker, blackjack, roulette, keno).
Speculative Investments
• Only eight respondents report purchasing speculative investments weekly and there
are no statistically significant differences amongst the four gambler sub-types.
• Similarly, there are no significant differences amongst the four gambler sub-types relative to the duration of the time spent trading on speculative investments.
• For all gambling activities probed, respondents report spending substantially more on
speculative investments than on any other type of activity. The one problem gambler ($2000) and the eight gamblers at moderate risk ($2500) for developing a problem spend substantially more monthly than either low risk ($200) or non-problem gamblers ($500) on speculative investments.
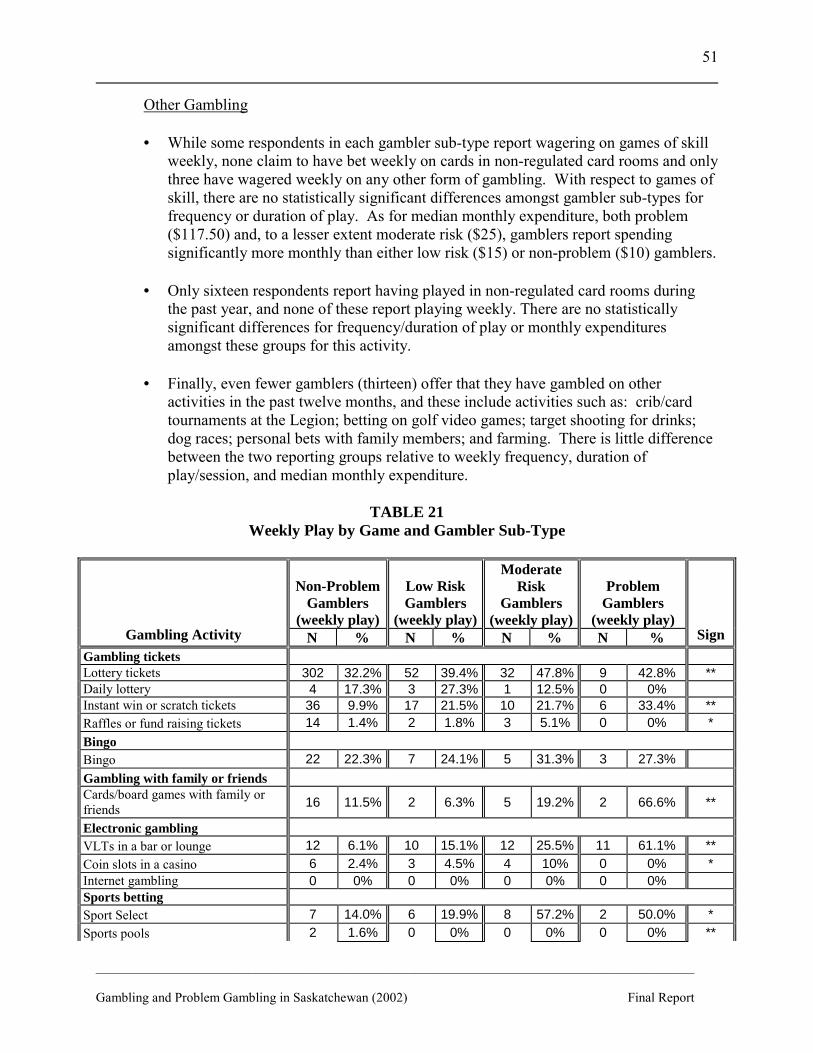
__________________________________________________________________________________________ Gambling and Problem Gambling in Saskatchewan (2002) Final Report
51
Other Gambling • While some respondents in each gambler sub-type report wagering on games of skill
weekly, none claim to have bet weekly on cards in non-regulated card rooms and only three have wagered weekly on any other form of gambling. With respect to games of skill, there are no statistically significant differences amongst gambler sub-types for frequency or duration of play. As for median monthly expenditure, both problem ($117.50) and, to a lesser extent moderate risk ($25), gamblers report spending significantly more monthly than either low risk ($15) or non-problem ($10) gamblers.
• Only sixteen respondents report having played in non-regulated card rooms during
the past year, and none of these report playing weekly. There are no statistically significant differences for frequency/duration of play or monthly expenditures amongst these groups for this activity.
• Finally, even fewer gamblers (thirteen) offer that they have gambled on other
activities in the past twelve months, and these include activities such as: crib/card tournaments at the Legion; betting on golf video games; target shooting for drinks; dog races; personal bets with family members; and farming. There is little difference between the two reporting groups relative to weekly frequency, duration of play/session, and median monthly expenditure.
TABLE 21
Weekly Play by Game and Gambler Sub-Type
Non-Problem Gamblers
(weekly play)
Low Risk Gamblers
(weekly play)
Moderate Risk
Gamblers (weekly play)
Problem Gamblers
(weekly play) Gambling Activity N % N % N % N % Sign
Gambling tickets Lottery tickets 302 32.2% 52 39.4% 32 47.8% 9 42.8% ** Daily lottery 4 17.3% 3 27.3% 1 12.5% 0 0% Instant win or scratch tickets 36 9.9% 17 21.5% 10 21.7% 6 33.4% ** Raffles or fund raising tickets 14 1.4% 2 1.8% 3 5.1% 0 0% * Bingo Bingo 22 22.3% 7 24.1% 5 31.3% 3 27.3% Gambling with family or friends Cards/board games with family or friends 16 11.5% 2 6.3% 5 19.2% 2 66.6% **
Electronic gambling VLTs in a bar or lounge 12 6.1% 10 15.1% 12 25.5% 11 61.1% ** Coin slots in a casino 6 2.4% 3 4.5% 4 10% 0 0% * Internet gambling 0 0% 0 0% 0 0% 0 0% Sports betting Sport Select 7 14.0% 6 19.9% 8 57.2% 2 50.0% * Sports pools 2 1.6% 0 0% 0 0% 0 0% **
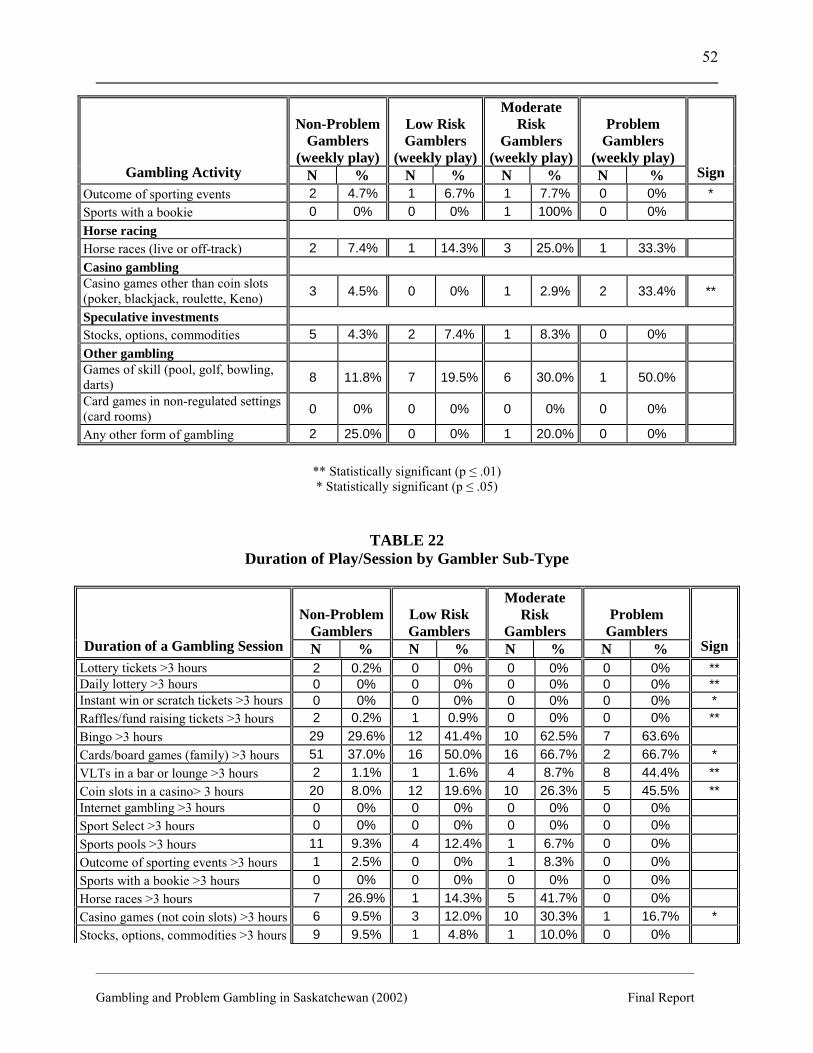
__________________________________________________________________________________________ Gambling and Problem Gambling in Saskatchewan (2002) Final Report
52
Non-Problem Gamblers
(weekly play)
Low Risk Gamblers
(weekly play)
Moderate Risk
Gamblers (weekly play)
Problem Gamblers
(weekly play) Gambling Activity N % N % N % N % Sign
Outcome of sporting events 2 4.7% 1 6.7% 1 7.7% 0 0% * Sports with a bookie 0 0% 0 0% 1 100% 0 0% Horse racing Horse races (live or off-track) 2 7.4% 1 14.3% 3 25.0% 1 33.3% Casino gambling Casino games other than coin slots (poker, blackjack, roulette, Keno) 3 4.5% 0 0% 1 2.9% 2 33.4% **
Speculative investments Stocks, options, commodities 5 4.3% 2 7.4% 1 8.3% 0 0% Other gambling Games of skill (pool, golf, bowling, darts) 8 11.8% 7 19.5% 6 30.0% 1 50.0%
Card games in non-regulated settings (card rooms) 0 0% 0 0% 0 0% 0 0%
Any other form of gambling 2 25.0% 0 0% 1 20.0% 0 0%
** Statistically significant (p ≤ .01) * Statistically significant (p ≤ .05)
TABLE 22 Duration of Play/Session by Gambler Sub-Type
Non-Problem Gamblers
Low Risk Gamblers
Moderate Risk
Gamblers Problem
Gamblers Duration of a Gambling Session N % N % N % N % Sign
Lottery tickets >3 hours 2 0.2% 0 0% 0 0% 0 0% ** Daily lottery >3 hours 0 0% 0 0% 0 0% 0 0% ** Instant win or scratch tickets >3 hours 0 0% 0 0% 0 0% 0 0% * Raffles/fund raising tickets >3 hours 2 0.2% 1 0.9% 0 0% 0 0% ** Bingo >3 hours 29 29.6% 12 41.4% 10 62.5% 7 63.6% Cards/board games (family) >3 hours 51 37.0% 16 50.0% 16 66.7% 2 66.7% * VLTs in a bar or lounge >3 hours 2 1.1% 1 1.6% 4 8.7% 8 44.4% ** Coin slots in a casino> 3 hours 20 8.0% 12 19.6% 10 26.3% 5 45.5% ** Internet gambling >3 hours 0 0% 0 0% 0 0% 0 0% Sport Select >3 hours 0 0% 0 0% 0 0% 0 0% Sports pools >3 hours 11 9.3% 4 12.4% 1 6.7% 0 0% Outcome of sporting events >3 hours 1 2.5% 0 0% 1 8.3% 0 0% Sports with a bookie >3 hours 0 0% 0 0% 0 0% 0 0% Horse races >3 hours 7 26.9% 1 14.3% 5 41.7% 0 0% Casino games (not coin slots) >3 hours 6 9.5% 3 12.0% 10 30.3% 1 16.7% * Stocks, options, commodities >3 hours 9 9.5% 1 4.8% 1 10.0% 0 0%
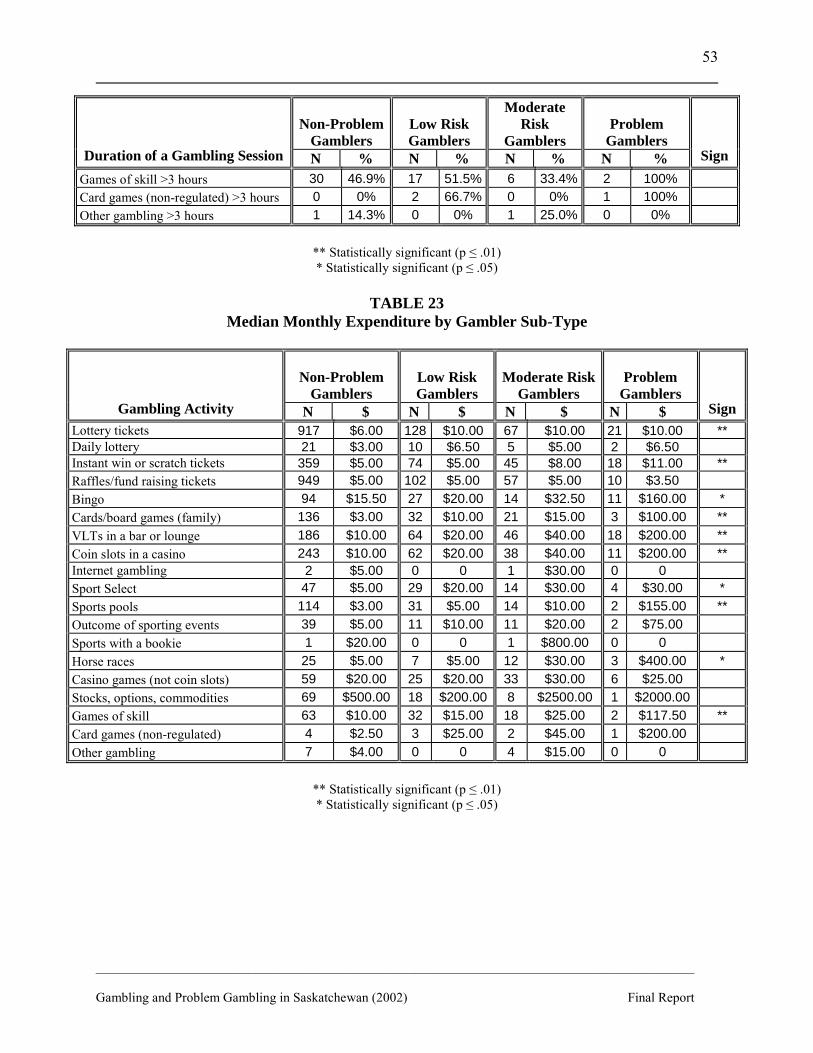
__________________________________________________________________________________________ Gambling and Problem Gambling in Saskatchewan (2002) Final Report
53
Non-Problem Gamblers
Low Risk Gamblers
Moderate Risk
Gamblers Problem
Gamblers Duration of a Gambling Session N % N % N % N % Sign
Games of skill >3 hours 30 46.9% 17 51.5% 6 33.4% 2 100% Card games (non-regulated) >3 hours 0 0% 2 66.7% 0 0% 1 100% Other gambling >3 hours 1 14.3% 0 0% 1 25.0% 0 0%
** Statistically significant (p ≤ .01) * Statistically significant (p ≤ .05)
TABLE 23
Median Monthly Expenditure by Gambler Sub-Type
Non-Problem Gamblers
Low Risk Gamblers
Moderate Risk Gamblers
Problem Gamblers
Gambling Activity N $ N $ N $ N $ Sign Lottery tickets 917 $6.00 128 $10.00 67 $10.00 21 $10.00 ** Daily lottery 21 $3.00 10 $6.50 5 $5.00 2 $6.50 Instant win or scratch tickets 359 $5.00 74 $5.00 45 $8.00 18 $11.00 ** Raffles/fund raising tickets 949 $5.00 102 $5.00 57 $5.00 10 $3.50 Bingo 94 $15.50 27 $20.00 14 $32.50 11 $160.00 * Cards/board games (family) 136 $3.00 32 $10.00 21 $15.00 3 $100.00 ** VLTs in a bar or lounge 186 $10.00 64 $20.00 46 $40.00 18 $200.00 ** Coin slots in a casino 243 $10.00 62 $20.00 38 $40.00 11 $200.00 ** Internet gambling 2 $5.00 0 0 1 $30.00 0 0 Sport Select 47 $5.00 29 $20.00 14 $30.00 4 $30.00 * Sports pools 114 $3.00 31 $5.00 14 $10.00 2 $155.00 ** Outcome of sporting events 39 $5.00 11 $10.00 11 $20.00 2 $75.00 Sports with a bookie 1 $20.00 0 0 1 $800.00 0 0 Horse races 25 $5.00 7 $5.00 12 $30.00 3 $400.00 * Casino games (not coin slots) 59 $20.00 25 $20.00 33 $30.00 6 $25.00 Stocks, options, commodities 69 $500.00 18 $200.00 8 $2500.00 1 $2000.00 Games of skill 63 $10.00 32 $15.00 18 $25.00 2 $117.50 ** Card games (non-regulated) 4 $2.50 3 $25.00 2 $45.00 1 $200.00 Other gambling 7 $4.00 0 0 4 $15.00 0 0
** Statistically significant (p ≤ .01) * Statistically significant (p ≤ .05)
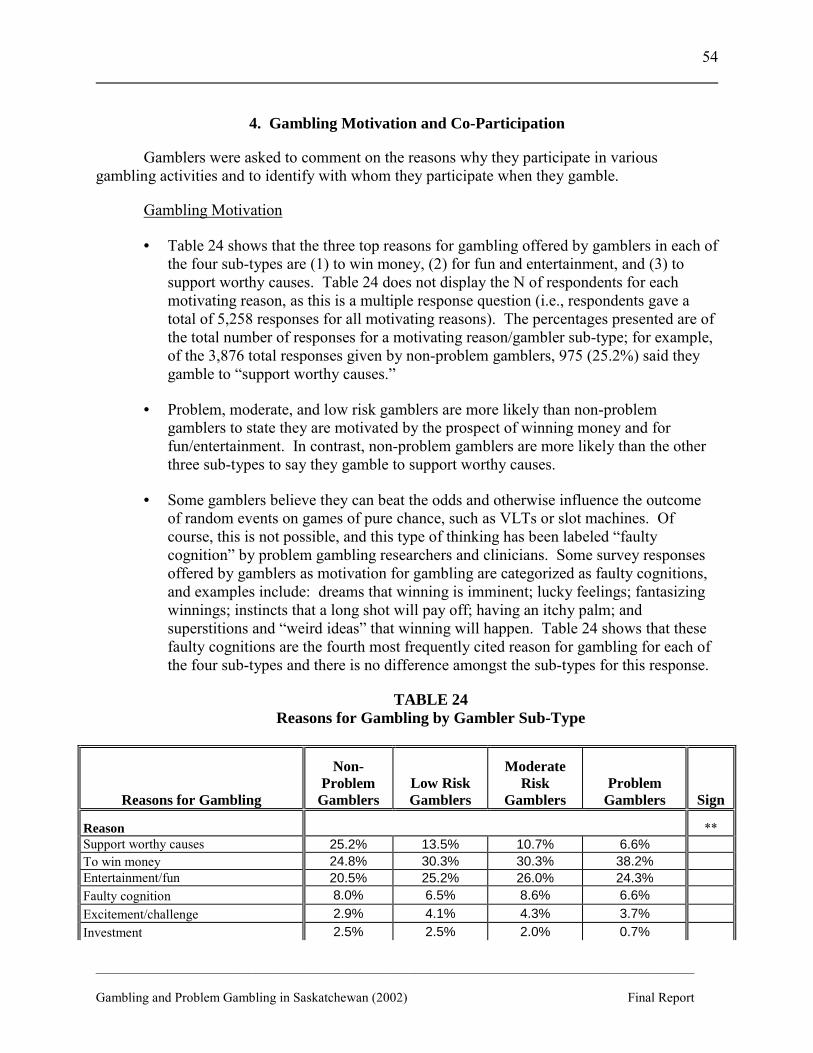
__________________________________________________________________________________________ Gambling and Problem Gambling in Saskatchewan (2002) Final Report
54
4. Gambling Motivation and Co-Participation
Gamblers were asked to comment on the reasons why they participate in various gambling activities and to identify with whom they participate when they gamble.
Gambling Motivation
• Table 24 shows that the three top reasons for gambling offered by gamblers in each of the four sub-types are (1) to win money, (2) for fun and entertainment, and (3) to support worthy causes. Table 24 does not display the N of respondents for each motivating reason, as this is a multiple response question (i.e., respondents gave a total of 5,258 responses for all motivating reasons). The percentages presented are of the total number of responses for a motivating reason/gambler sub-type; for example, of the 3,876 total responses given by non-problem gamblers, 975 (25.2%) said they gamble to �support worthy causes.�
• Problem, moderate, and low risk gamblers are more likely than non-problem gamblers to state they are motivated by the prospect of winning money and for fun/entertainment. In contrast, non-problem gamblers are more likely than the other three sub-types to say they gamble to support worthy causes.
• Some gamblers believe they can beat the odds and otherwise influence the outcome of random events on games of pure chance, such as VLTs or slot machines. Of course, this is not possible, and this type of thinking has been labeled �faulty cognition� by problem gambling researchers and clinicians. Some survey responses offered by gamblers as motivation for gambling are categorized as faulty cognitions, and examples include: dreams that winning is imminent; lucky feelings; fantasizing winnings; instincts that a long shot will pay off; having an itchy palm; and superstitions and �weird ideas� that winning will happen. Table 24 shows that these faulty cognitions are the fourth most frequently cited reason for gambling for each of the four sub-types and there is no difference amongst the sub-types for this response.
TABLE 24 Reasons for Gambling by Gambler Sub-Type
Reasons for Gambling
Non-Problem
Gamblers Low Risk Gamblers
Moderate Risk
Gamblers Problem
Gamblers
Sign
Reason ** Support worthy causes 25.2% 13.5% 10.7% 6.6% To win money 24.8% 30.3% 30.3% 38.2% Entertainment/fun 20.5% 25.2% 26.0% 24.3% Faulty cognition 8.0% 6.5% 8.6% 6.6% Excitement/challenge 2.9% 4.1% 4.3% 3.7% Investment 2.5% 2.5% 2.0% 0.7%
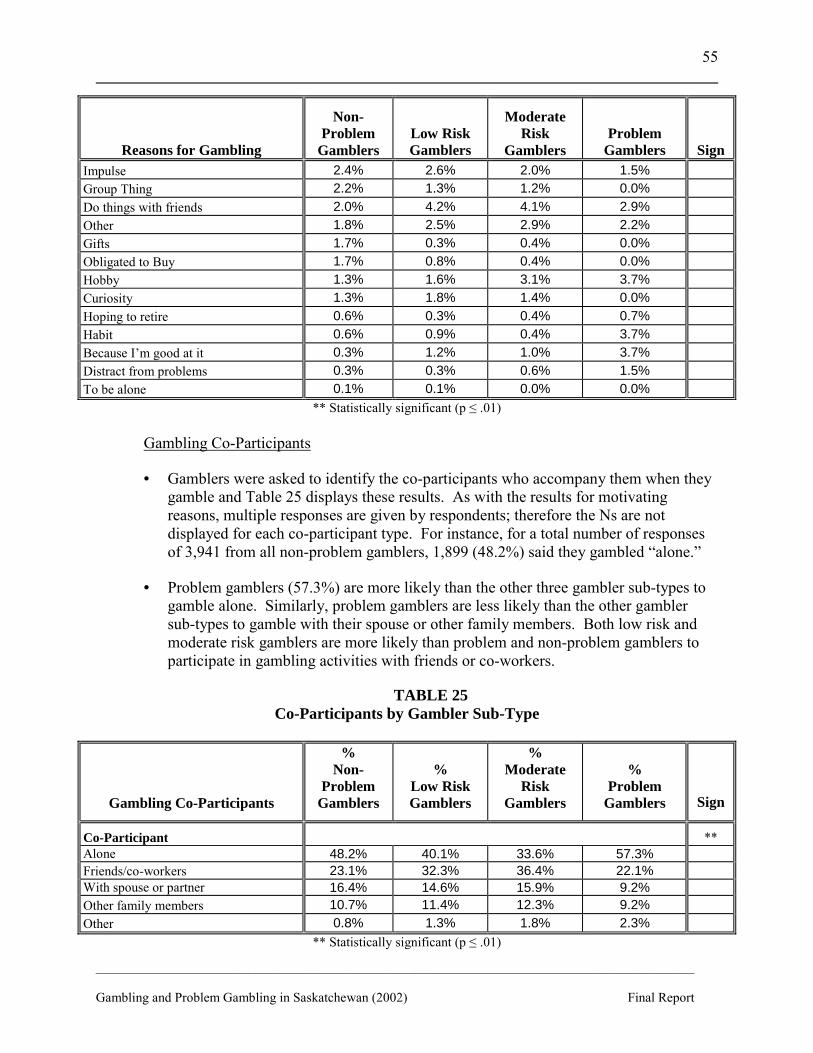
__________________________________________________________________________________________ Gambling and Problem Gambling in Saskatchewan (2002) Final Report
55
Reasons for Gambling
Non-Problem
Gamblers Low Risk Gamblers
Moderate Risk
Gamblers Problem
Gamblers
Sign Impulse 2.4% 2.6% 2.0% 1.5% Group Thing 2.2% 1.3% 1.2% 0.0% Do things with friends 2.0% 4.2% 4.1% 2.9% Other 1.8% 2.5% 2.9% 2.2% Gifts 1.7% 0.3% 0.4% 0.0% Obligated to Buy 1.7% 0.8% 0.4% 0.0% Hobby 1.3% 1.6% 3.1% 3.7% Curiosity 1.3% 1.8% 1.4% 0.0% Hoping to retire 0.6% 0.3% 0.4% 0.7% Habit 0.6% 0.9% 0.4% 3.7% Because I�m good at it 0.3% 1.2% 1.0% 3.7% Distract from problems 0.3% 0.3% 0.6% 1.5% To be alone 0.1% 0.1% 0.0% 0.0%
** Statistically significant (p ≤ .01)
Gambling Co-Participants
• Gamblers were asked to identify the co-participants who accompany them when they gamble and Table 25 displays these results. As with the results for motivating reasons, multiple responses are given by respondents; therefore the Ns are not displayed for each co-participant type. For instance, for a total number of responses of 3,941 from all non-problem gamblers, 1,899 (48.2%) said they gambled �alone.�
• Problem gamblers (57.3%) are more likely than the other three gambler sub-types to gamble alone. Similarly, problem gamblers are less likely than the other gambler sub-types to gamble with their spouse or other family members. Both low risk and moderate risk gamblers are more likely than problem and non-problem gamblers to participate in gambling activities with friends or co-workers.
TABLE 25 Co-Participants by Gambler Sub-Type
Gambling Co-Participants
% Non-
Problem Gamblers
%
Low Risk Gamblers
% Moderate
Risk Gamblers
%
Problem Gamblers
Sign
Co-Participant ** Alone 48.2% 40.1% 33.6% 57.3% Friends/co-workers 23.1% 32.3% 36.4% 22.1% With spouse or partner 16.4% 14.6% 15.9% 9.2% Other family members 10.7% 11.4% 12.3% 9.2% Other 0.8% 1.3% 1.8% 2.3%
** Statistically significant (p ≤ .01)
__________________________________________________________________________________________ Gambling and Problem Gambling in Saskatchewan (2002) Final Report
56
5. Problem Gambling Behaviour and Consequences
A main focus of the study is to examine the characteristics of problem gambling within
the adult population in Saskatchewan. To this end, the third research question that guided the study is, �what are the characteristics and consequences of problem gambling behaviour amongst gambler sub-types?� The Canadian Problem Gambling Index includes two main dimensions that examine problem gambling behaviour and adverse consequences of that behaviour and items that tap these dimensions are included in the survey questionnaire. In the results that follow, characteristics of both problem gambler behaviour and the adverse consequences of this behaviour are presented for each of the four gambler sub-types. 5.1 Problem Gambling Behaviour
Gambling research identifies behaviour that is associated with problem gambling, and this includes: betting more than one can afford to lose; betting or spending more than one wants to; increasing wagers to maintain the level of excitement; returning another day to win back loses; borrowing or selling property to obtain money to gamble; lying and hiding evidence of gambling from family members; and committing illegal acts such as stealing to get money to gamble. All the screening instruments, such as the South Oaks Gambling Screen, that discriminate problem gambler sub-types incorporate at least some of these behavioural variables. The nine-item Problem Gambling Severity Index (PGSI) used in this study, includes the following four behavioural and one problem recognition items:
• How often have you bet more than you could really afford to lose? • How often have you needed to gamble with larger amounts of money to get the same
feeling of excitement? • How often have you gone back another day to try to win back the money you lost? • How often have you borrowed money or sold anything to get money to gamble? • How often have you felt that you might have a problem with gambling?
Table 26 displays the results of responses to the four scored PGSI behavioral items for
each of the gambler sub-types, and also displays responses to four additional unscored non-PGSI items deemed to provide additional information about problem gambling behaviour. There are statistically significant differences amongst the four gambler sub-types for each of these items, and this is to be expected given that four of the eight items themselves are used to identify these sub-types. Nevertheless, the dramatic response differences between problem gamblers and other gambler sub-types, illustrates the extent to which problem gambling behaviour is clearly differentiated. The following results are noted:
• In terms of loss of control, problem and moderate risk gamblers are significantly
more likely than low risk and non-problem gamblers to (1) bet more than they can afford to lose (65.2% and 13.9%), and (2) bet more than they intend (56.5% and 5.8%), �most of the time� or �almost always.�
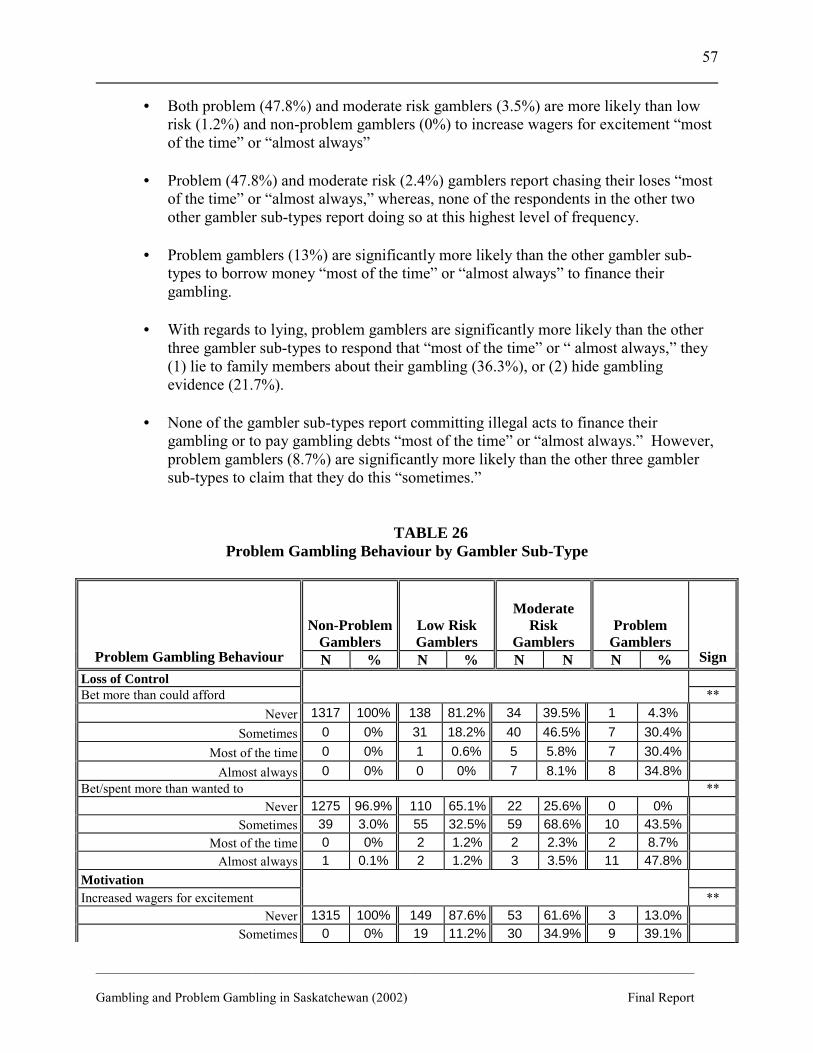
__________________________________________________________________________________________ Gambling and Problem Gambling in Saskatchewan (2002) Final Report
57
• Both problem (47.8%) and moderate risk gamblers (3.5%) are more likely than low risk (1.2%) and non-problem gamblers (0%) to increase wagers for excitement �most of the time� or �almost always�
• Problem (47.8%) and moderate risk (2.4%) gamblers report chasing their loses �most
of the time� or �almost always,� whereas, none of the respondents in the other two other gambler sub-types report doing so at this highest level of frequency.
• Problem gamblers (13%) are significantly more likely than the other gambler sub-
types to borrow money �most of the time� or �almost always� to finance their gambling.
• With regards to lying, problem gamblers are significantly more likely than the other
three gambler sub-types to respond that �most of the time� or � almost always,� they (1) lie to family members about their gambling (36.3%), or (2) hide gambling evidence (21.7%).
• None of the gambler sub-types report committing illegal acts to finance their
gambling or to pay gambling debts �most of the time� or �almost always.� However, problem gamblers (8.7%) are significantly more likely than the other three gambler sub-types to claim that they do this �sometimes.�
TABLE 26 Problem Gambling Behaviour by Gambler Sub-Type
Non-Problem
Gamblers
Low Risk Gamblers
Moderate Risk
Gamblers
Problem
Gamblers Problem Gambling Behaviour N % N % N N N % Sign
Loss of Control Bet more than could afford **
Never 1317 100% 138 81.2% 34 39.5% 1 4.3% Sometimes 0 0% 31 18.2% 40 46.5% 7 30.4%
Most of the time 0 0% 1 0.6% 5 5.8% 7 30.4% Almost always 0 0% 0 0% 7 8.1% 8 34.8%
Bet/spent more than wanted to ** Never 1275 96.9% 110 65.1% 22 25.6% 0 0%
Sometimes 39 3.0% 55 32.5% 59 68.6% 10 43.5% Most of the time 0 0% 2 1.2% 2 2.3% 2 8.7%
Almost always 1 0.1% 2 1.2% 3 3.5% 11 47.8% Motivation Increased wagers for excitement
**
Never 1315 100% 149 87.6% 53 61.6% 3 13.0% Sometimes 0 0% 19 11.2% 30 34.9% 9 39.1%

__________________________________________________________________________________________ Gambling and Problem Gambling in Saskatchewan (2002) Final Report
58
Non-Problem
Gamblers
Low Risk Gamblers
Moderate Risk
Gamblers
Problem
Gamblers Problem Gambling Behaviour N % N % N N N % Sign
Most of the time 0 0% 2 1.2% 3 3.5% 7 30.4% Almost always 0 0% 0 0% 0 0% 4 17.4%
Chasing Returning to win back losses
**
Never 1315 100% 129 75.4% 43 50.0% 5 21.7% Sometimes 0 0% 42 24.6% 41 47.7% 7 30.4%
Most of the time 0 0% 0 0% 1 1.2% 5 21.7% Almost always 0 0% 0 0% 1 1.2% 6 26.1%
Borrowing Borrowing/selling to get gambling money
**
Never 1316 99.7% 163 95.3% 71 82.6% 13 56.5% Sometimes 0 0% 7 4.1% 15 17.4% 7 30.4%
Most of the time 0 0% 1 0.6% 0 0% 3 13.0% Almost always 4 0.3% 0 0% 0 0% 0 0%
Lying Lied to family members or others
**
Never 1315 100% 164 95.9% 76 88.4% 10 45.5% Sometimes 0 0% 7 4.1% 9 10.5% 4 18.2%
Most of the time 0 0% 0 0% 0 0% 1 4.5% Almost always 0 0% 0 0% 1 1.2% 7 31.8%
Hid evidence of gambling ** Never 1310 99.7% 168 98.2% 75 87.2% 14 60.9%
Sometimes 3 0.2% 3 1.8% 8 9.3% 4 17.4% Most of the time 0 0% 0 0% 0 0% 1 4.3%
Almost always 1 0.1% 0 0% 3 3.5% 4 17.4% Illegal acts Stealing or committing illegal acts
**
Never 1315 100% 170 100% 85 98.8% 21 91.3% Sometimes 0 0% 0 0% 1 1.2% 2 8.7%
Most of the time 0 0% 0 0% 0 0% 0 0% Almost always 0 0% 0 0% 0 0% 0 0%
** Statistically significant (p ≤ .01)
One of the indicators of whether a gambler has a problem is the individual�s feeling that he or she might have a problem, and this �problem recognition� item is one of the nine items that are scored in the PGSI to discriminate the four gambler sub-types. As such, it is to be expected that problem gamblers will score highest on this item as compared with the other three gambler sub-types, and this is the case for responses aggregated for �most of the time� and �almost
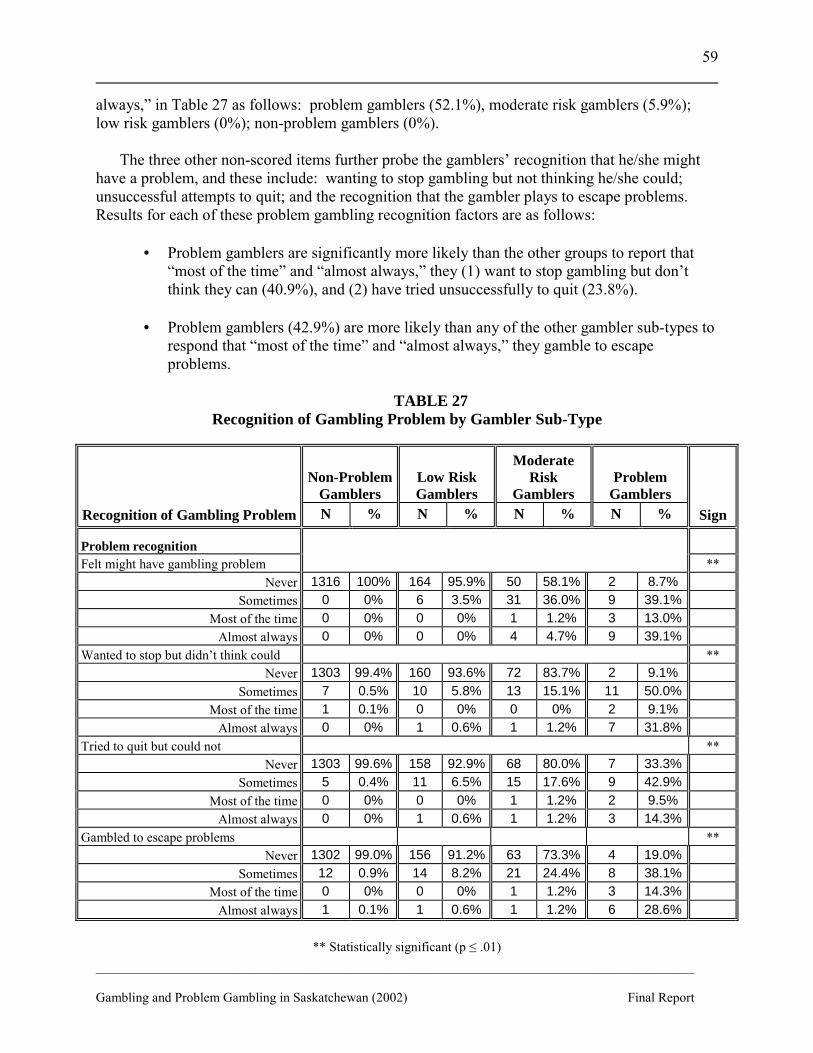
__________________________________________________________________________________________ Gambling and Problem Gambling in Saskatchewan (2002) Final Report
59
always,� in Table 27 as follows: problem gamblers (52.1%), moderate risk gamblers (5.9%); low risk gamblers (0%); non-problem gamblers (0%). The three other non-scored items further probe the gamblers� recognition that he/she might have a problem, and these include: wanting to stop gambling but not thinking he/she could; unsuccessful attempts to quit; and the recognition that the gambler plays to escape problems. Results for each of these problem gambling recognition factors are as follows:
• Problem gamblers are significantly more likely than the other groups to report that �most of the time� and �almost always,� they (1) want to stop gambling but don�t think they can (40.9%), and (2) have tried unsuccessfully to quit (23.8%).
• Problem gamblers (42.9%) are more likely than any of the other gambler sub-types to
respond that �most of the time� and �almost always,� they gamble to escape problems.
TABLE 27
Recognition of Gambling Problem by Gambler Sub-Type
Non-Problem Gamblers
Low Risk Gamblers
Moderate Risk
Gamblers Problem
Gamblers Recognition of Gambling Problem N % N % N % N % Sign
Problem recognition Felt might have gambling problem **
Never 1316 100% 164 95.9% 50 58.1% 2 8.7% Sometimes 0 0% 6 3.5% 31 36.0% 9 39.1%
Most of the time 0 0% 0 0% 1 1.2% 3 13.0% Almost always 0 0% 0 0% 4 4.7% 9 39.1%
Wanted to stop but didn�t think could ** Never 1303 99.4% 160 93.6% 72 83.7% 2 9.1%
Sometimes 7 0.5% 10 5.8% 13 15.1% 11 50.0% Most of the time 1 0.1% 0 0% 0 0% 2 9.1%
Almost always 0 0% 1 0.6% 1 1.2% 7 31.8% Tried to quit but could not **
Never 1303 99.6% 158 92.9% 68 80.0% 7 33.3% Sometimes 5 0.4% 11 6.5% 15 17.6% 9 42.9%
Most of the time 0 0% 0 0% 1 1.2% 2 9.5% Almost always 0 0% 1 0.6% 1 1.2% 3 14.3%
Gambled to escape problems ** Never 1302 99.0% 156 91.2% 63 73.3% 4 19.0%
Sometimes 12 0.9% 14 8.2% 21 24.4% 8 38.1% Most of the time 0 0% 0 0% 1 1.2% 3 14.3%
Almost always 1 0.1% 1 0.6% 1 1.2% 6 28.6%
** Statistically significant (p ≤ .01)

__________________________________________________________________________________________ Gambling and Problem Gambling in Saskatchewan (2002) Final Report
60
5.2 Adverse Consequences of Problem Gambling Behaviour
Problem gambling behaviour has adverse consequences for the gambler, his/her family and friends, and for the community-at-large. Four scored items on the Problem Gambling Severity Index (PGSI) measure these adverse consequences, and these include:
• How often has gambling caused you any health problems, including stress or anxiety? • How often have people criticized your betting or told you that you had a gambling
problem, regardless of whether or not you thought it was true? • How often has your gambling caused any financial problems for you or your
household? • How often have you felt guilty about the way you gamble or what happens when you
gamble? Table 28 displays the comparative results for gambler sub-types for each of these four
scored PGSI items as well as for an additional four unscored items that have been added to provide more information about the personal and social consequences of problem gambling behaviour, and highlights are described below.
Personal Consequences
• Problem gamblers are significantly more likely than the other three gambler sub-types to report that �most of the time� and �almost always� they have (1) health problems including stress and anxiety (39.1%); (2) difficulty sleeping (30.4%); and (3) feelings of irritability and restlessness related to their gambling (21.7%).
• Problem gamblers are significantly more likely than other gambler sub-types to have people criticize their gambling (30.4%) and to have feelings of guilt related to their gambling (65.2%) �most of the time� or �almost always.�
Social Consequences
• Problem gamblers are significantly more likely than the other three gambler sub-types to have their problem behaviour result in (1) adverse financial consequences for themselves or their household (39.1%); (2) problems with family members or friends (26.1%); and (3) the loss or near loss of a relationship, job or educational/career opportunity (17.3%) �most of the time� or �almost always.�
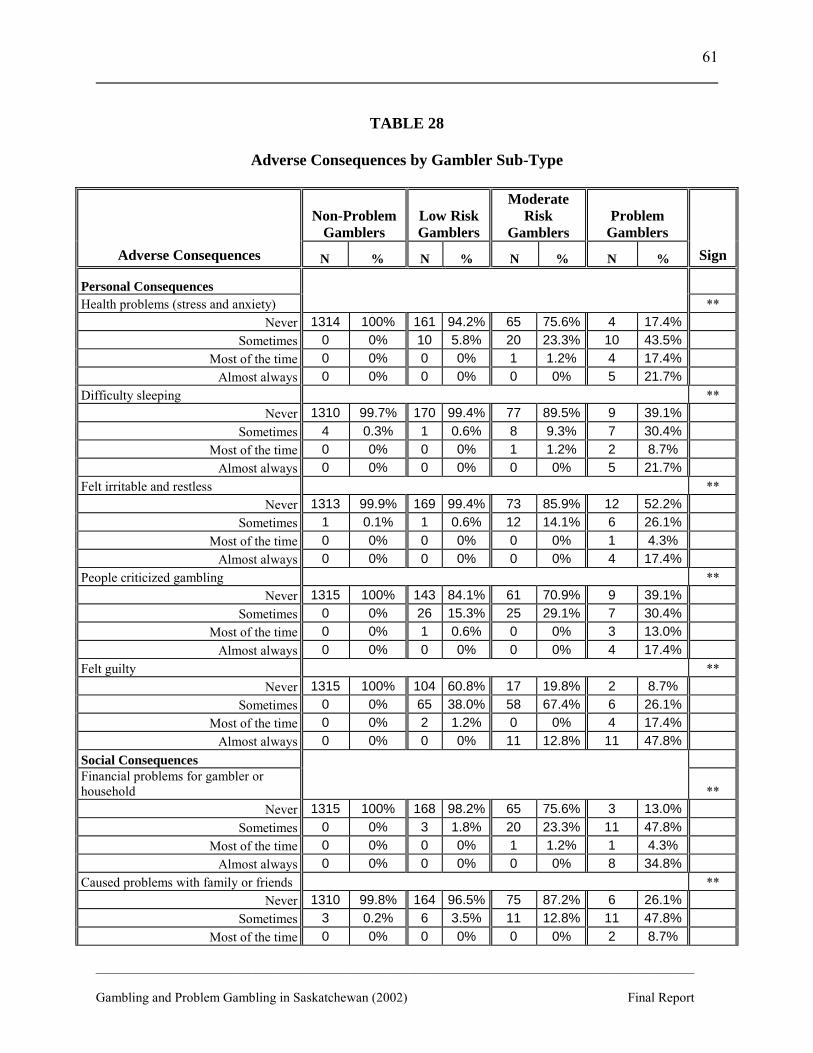
__________________________________________________________________________________________ Gambling and Problem Gambling in Saskatchewan (2002) Final Report
61
TABLE 28
Adverse Consequences by Gambler Sub-Type
Non-Problem Gamblers
Low Risk Gamblers
Moderate Risk
Gamblers Problem
Gamblers Adverse Consequences N % N % N % N % Sign
Personal Consequences Health problems (stress and anxiety) **
Never 1314 100% 161 94.2% 65 75.6% 4 17.4% Sometimes 0 0% 10 5.8% 20 23.3% 10 43.5%
Most of the time 0 0% 0 0% 1 1.2% 4 17.4% Almost always 0 0% 0 0% 0 0% 5 21.7%
Difficulty sleeping ** Never 1310 99.7% 170 99.4% 77 89.5% 9 39.1%
Sometimes 4 0.3% 1 0.6% 8 9.3% 7 30.4% Most of the time 0 0% 0 0% 1 1.2% 2 8.7%
Almost always 0 0% 0 0% 0 0% 5 21.7% Felt irritable and restless **
Never 1313 99.9% 169 99.4% 73 85.9% 12 52.2% Sometimes 1 0.1% 1 0.6% 12 14.1% 6 26.1%
Most of the time 0 0% 0 0% 0 0% 1 4.3% Almost always 0 0% 0 0% 0 0% 4 17.4%
People criticized gambling ** Never 1315 100% 143 84.1% 61 70.9% 9 39.1%
Sometimes 0 0% 26 15.3% 25 29.1% 7 30.4% Most of the time 0 0% 1 0.6% 0 0% 3 13.0%
Almost always 0 0% 0 0% 0 0% 4 17.4% Felt guilty **
Never 1315 100% 104 60.8% 17 19.8% 2 8.7% Sometimes 0 0% 65 38.0% 58 67.4% 6 26.1%
Most of the time 0 0% 2 1.2% 0 0% 4 17.4% Almost always 0 0% 0 0% 11 12.8% 11 47.8%
Social Consequences Financial problems for gambler or household
**
Never 1315 100% 168 98.2% 65 75.6% 3 13.0% Sometimes 0 0% 3 1.8% 20 23.3% 11 47.8%
Most of the time 0 0% 0 0% 1 1.2% 1 4.3% Almost always 0 0% 0 0% 0 0% 8 34.8%
Caused problems with family or friends ** Never 1310 99.8% 164 96.5% 75 87.2% 6 26.1%
Sometimes 3 0.2% 6 3.5% 11 12.8% 11 47.8% Most of the time 0 0% 0 0% 0 0% 2 8.7%
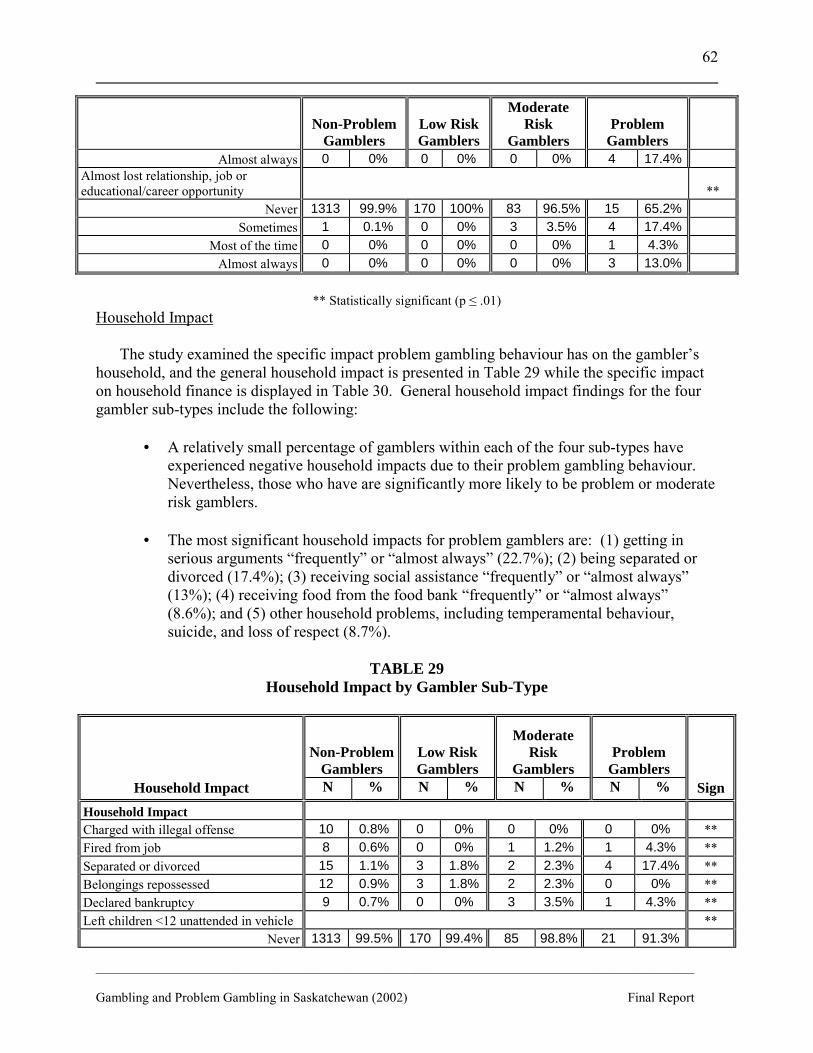
__________________________________________________________________________________________ Gambling and Problem Gambling in Saskatchewan (2002) Final Report
62
Non-Problem Gamblers
Low Risk Gamblers
Moderate Risk
Gamblers Problem
Gamblers Almost always 0 0% 0 0% 0 0% 4 17.4%
Almost lost relationship, job or educational/career opportunity **
Never 1313 99.9% 170 100% 83 96.5% 15 65.2% Sometimes 1 0.1% 0 0% 3 3.5% 4 17.4%
Most of the time 0 0% 0 0% 0 0% 1 4.3% Almost always 0 0% 0 0% 0 0% 3 13.0%
** Statistically significant (p ≤ .01)
Household Impact
The study examined the specific impact problem gambling behaviour has on the gambler�s household, and the general household impact is presented in Table 29 while the specific impact on household finance is displayed in Table 30. General household impact findings for the four gambler sub-types include the following:
• A relatively small percentage of gamblers within each of the four sub-types have experienced negative household impacts due to their problem gambling behaviour. Nevertheless, those who have are significantly more likely to be problem or moderate risk gamblers.
• The most significant household impacts for problem gamblers are: (1) getting in
serious arguments �frequently� or �almost always� (22.7%); (2) being separated or divorced (17.4%); (3) receiving social assistance �frequently� or �almost always� (13%); (4) receiving food from the food bank �frequently� or �almost always� (8.6%); and (5) other household problems, including temperamental behaviour, suicide, and loss of respect (8.7%).
TABLE 29
Household Impact by Gambler Sub-Type
Non-ProblemGamblers
Low Risk Gamblers
Moderate Risk
Gamblers Problem
Gamblers Household Impact N % N % N % N % Sign
Household Impact Charged with illegal offense 10 0.8% 0 0% 0 0% 0 0% ** Fired from job 8 0.6% 0 0% 1 1.2% 1 4.3% ** Separated or divorced 15 1.1% 3 1.8% 2 2.3% 4 17.4% ** Belongings repossessed 12 0.9% 3 1.8% 2 2.3% 0 0% ** Declared bankruptcy 9 0.7% 0 0% 3 3.5% 1 4.3% ** Left children <12 unattended in vehicle **
Never 1313 99.5% 170 99.4% 85 98.8% 21 91.3%
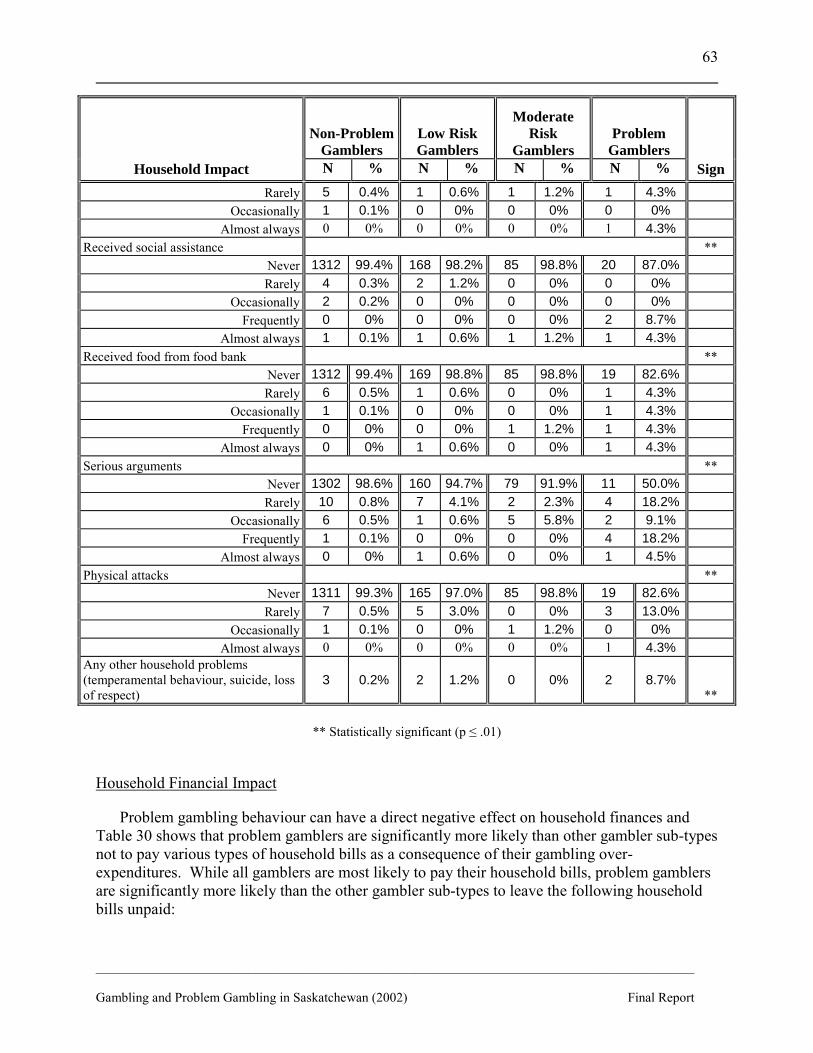
__________________________________________________________________________________________ Gambling and Problem Gambling in Saskatchewan (2002) Final Report
63
Non-ProblemGamblers
Low Risk Gamblers
Moderate Risk
Gamblers Problem
Gamblers Household Impact N % N % N % N % Sign
Rarely 5 0.4% 1 0.6% 1 1.2% 1 4.3% Occasionally 1 0.1% 0 0% 0 0% 0 0%
Almost always 0 0% 0 0% 0 0% 1 4.3% Received social assistance **
Never 1312 99.4% 168 98.2% 85 98.8% 20 87.0% Rarely 4 0.3% 2 1.2% 0 0% 0 0%
Occasionally 2 0.2% 0 0% 0 0% 0 0% Frequently 0 0% 0 0% 0 0% 2 8.7%
Almost always 1 0.1% 1 0.6% 1 1.2% 1 4.3% Received food from food bank **
Never 1312 99.4% 169 98.8% 85 98.8% 19 82.6% Rarely 6 0.5% 1 0.6% 0 0% 1 4.3%
Occasionally 1 0.1% 0 0% 0 0% 1 4.3% Frequently 0 0% 0 0% 1 1.2% 1 4.3%
Almost always 0 0% 1 0.6% 0 0% 1 4.3% Serious arguments **
Never 1302 98.6% 160 94.7% 79 91.9% 11 50.0% Rarely 10 0.8% 7 4.1% 2 2.3% 4 18.2%
Occasionally 6 0.5% 1 0.6% 5 5.8% 2 9.1% Frequently 1 0.1% 0 0% 0 0% 4 18.2%
Almost always 0 0% 1 0.6% 0 0% 1 4.5% Physical attacks **
Never 1311 99.3% 165 97.0% 85 98.8% 19 82.6% Rarely 7 0.5% 5 3.0% 0 0% 3 13.0%
Occasionally 1 0.1% 0 0% 1 1.2% 0 0% Almost always 0 0% 0 0% 0 0% 1 4.3%
Any other household problems (temperamental behaviour, suicide, loss of respect)
3 0.2% 2 1.2% 0 0% 2 8.7% **
** Statistically significant (p ≤ .01)
Household Financial Impact
Problem gambling behaviour can have a direct negative effect on household finances and Table 30 shows that problem gamblers are significantly more likely than other gambler sub-types not to pay various types of household bills as a consequence of their gambling over-expenditures. While all gamblers are most likely to pay their household bills, problem gamblers are significantly more likely than the other gambler sub-types to leave the following household bills unpaid:
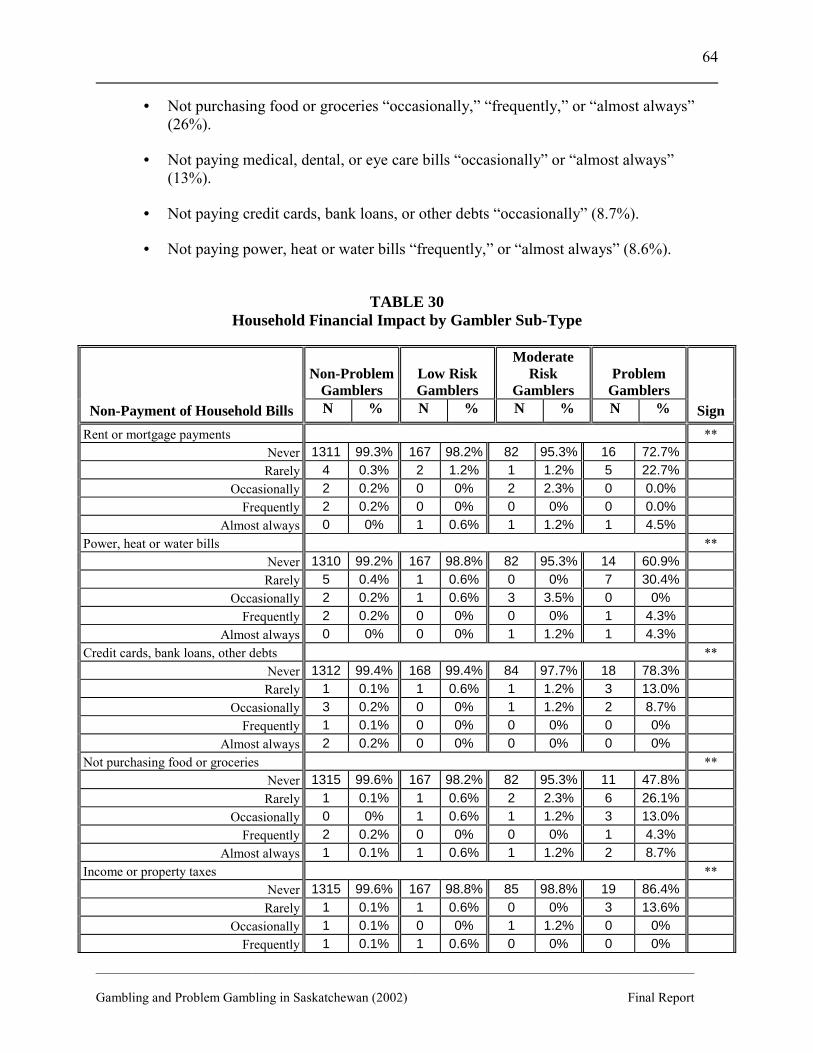
__________________________________________________________________________________________ Gambling and Problem Gambling in Saskatchewan (2002) Final Report
64
• Not purchasing food or groceries �occasionally,� �frequently,� or �almost always� (26%).
• Not paying medical, dental, or eye care bills �occasionally� or �almost always� (13%).
• Not paying credit cards, bank loans, or other debts �occasionally� (8.7%).
• Not paying power, heat or water bills �frequently,� or �almost always� (8.6%).
TABLE 30
Household Financial Impact by Gambler Sub-Type
Non-ProblemGamblers
Low Risk Gamblers
Moderate Risk
Gamblers Problem
Gamblers Non-Payment of Household Bills N % N % N % N % Sign
Rent or mortgage payments ** Never 1311 99.3% 167 98.2% 82 95.3% 16 72.7% Rarely 4 0.3% 2 1.2% 1 1.2% 5 22.7%
Occasionally 2 0.2% 0 0% 2 2.3% 0 0.0% Frequently 2 0.2% 0 0% 0 0% 0 0.0%
Almost always 0 0% 1 0.6% 1 1.2% 1 4.5% Power, heat or water bills **
Never 1310 99.2% 167 98.8% 82 95.3% 14 60.9% Rarely 5 0.4% 1 0.6% 0 0% 7 30.4%
Occasionally 2 0.2% 1 0.6% 3 3.5% 0 0% Frequently 2 0.2% 0 0% 0 0% 1 4.3%
Almost always 0 0% 0 0% 1 1.2% 1 4.3% Credit cards, bank loans, other debts **
Never 1312 99.4% 168 99.4% 84 97.7% 18 78.3% Rarely 1 0.1% 1 0.6% 1 1.2% 3 13.0%
Occasionally 3 0.2% 0 0% 1 1.2% 2 8.7% Frequently 1 0.1% 0 0% 0 0% 0 0%
Almost always 2 0.2% 0 0% 0 0% 0 0% Not purchasing food or groceries **
Never 1315 99.6% 167 98.2% 82 95.3% 11 47.8% Rarely 1 0.1% 1 0.6% 2 2.3% 6 26.1%
Occasionally 0 0% 1 0.6% 1 1.2% 3 13.0% Frequently 2 0.2% 0 0% 0 0% 1 4.3%
Almost always 1 0.1% 1 0.6% 1 1.2% 2 8.7% Income or property taxes **
Never 1315 99.6% 167 98.8% 85 98.8% 19 86.4% Rarely 1 0.1% 1 0.6% 0 0% 3 13.6%
Occasionally 1 0.1% 0 0% 1 1.2% 0 0% Frequently 1 0.1% 1 0.6% 0 0% 0 0%

__________________________________________________________________________________________ Gambling and Problem Gambling in Saskatchewan (2002) Final Report
65
Non-ProblemGamblers
Low Risk Gamblers
Moderate Risk
Gamblers Problem
Gamblers Non-Payment of Household Bills N % N % N % N % Sign
Almost always 1 0.1% 0 0% 0 0% 0 0% Alimony or child support **
Never 1317 99.8% 168 99.4% 86 100% 21 100% Rarely 1 0.1% 1 0.6% 0 0% 0 0%
Frequently 1 0.1% 0 0% 0 0% 0 0% Medication, dental, eye care **
Never 1313 99.5% 168 99.4% 83 96.5% 19 82.6% Rarely 3 0.2% 1 0.6% 1 1.2% 1 4.3%
Occasionally 2 0.2% 0 0% 2 2.3% 1 4.3% Almost always 1 0.1% 0 0% 0 0% 2 8.7%
** Statistically significant (p ≤ .01)
5.3 Problem Gambling Correlates
The final of four dimensions included in the Canadian Problem Gambling Index explores variables known to be highly correlated with problem gambling and in the Saskatchewan study, two such correlates were examined, namely (1) the age the respondent�s first gambling experience, and (2) whether a family member had a gambling problem.
Table 31 shows that there are no statistically significant differences amongst the four gambler sub-types with respect to the age of the respondent�s first gambling experience. Notwithstanding that there are no significant differences, it is interesting to note that 68.2% of problem gamblers as compared with 41.4% of non-problem gamblers report having had their first gambling experience by the age of 15 years.
TABLE 31 Age of First Gambling Experience by Gambler Sub-Type
Non-ProblemGamblers
Low Risk Gamblers
Moderate Risk
Gamblers Problem
Gamblers Age of First Gambling Experience N % N % N % N % Sign Age First Gambled 5 years or younger 22 1.9% 4 2.5% 1 1.2% 0 0.0% 6 to 10 years 189 16.4% 35 21.6% 20 24.4% 5 22.7% 11 to 15 years 266 23.1% 39 24.1% 20 24.4% 10 45.5% 16 to 20 years 366 31.8% 40 27.2% 28 34.1% 4 18.2% Over 20 years 307 26.7% 40 24.7% 13 15.9% 3 13.6%
Table 32 shows that problem gamblers (36.4%), and to a lesser extent moderate risk (22,5%) and low risk (21.3%) gamblers are significantly more likely than non-problem gamblers (11.6%) to have a family member with a gambling problem.
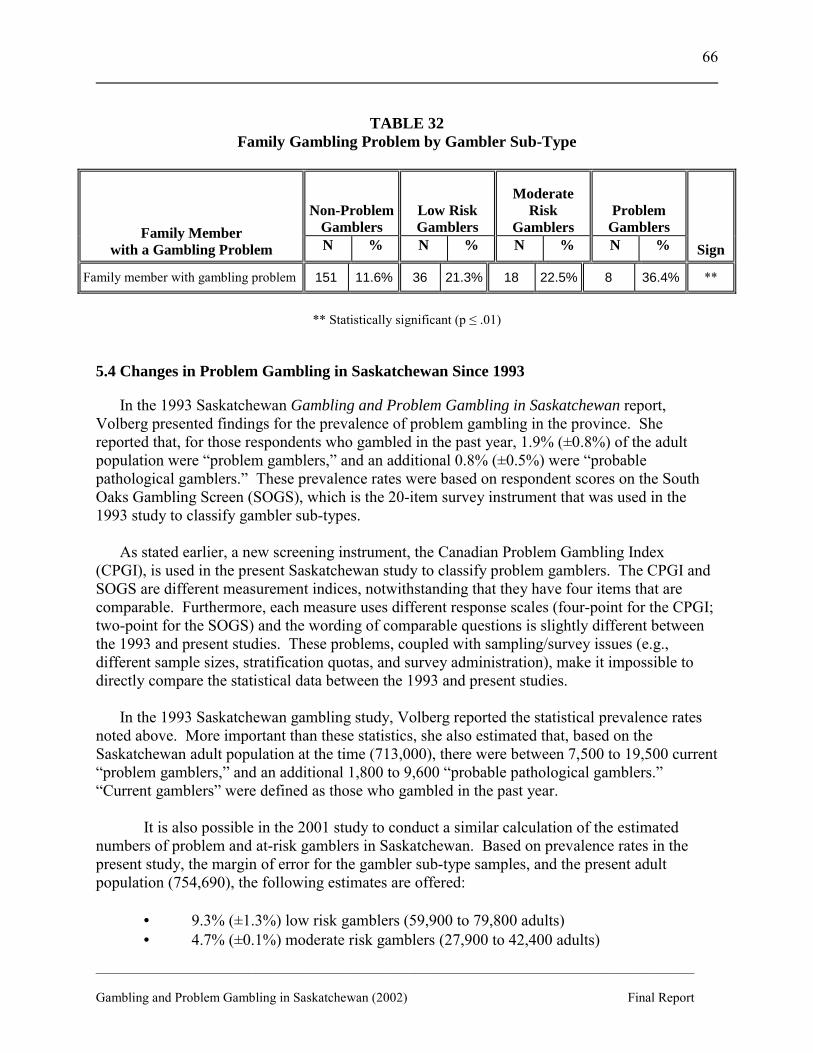
__________________________________________________________________________________________ Gambling and Problem Gambling in Saskatchewan (2002) Final Report
66
TABLE 32
Family Gambling Problem by Gambler Sub-Type
Non-ProblemGamblers
Low Risk Gamblers
Moderate Risk
Gamblers Problem
Gamblers Family Member with a Gambling Problem N % N % N % N % Sign
Family member with gambling problem 151 11.6% 36 21.3% 18 22.5% 8 36.4% **
** Statistically significant (p ≤ .01)
5.4 Changes in Problem Gambling in Saskatchewan Since 1993
In the 1993 Saskatchewan Gambling and Problem Gambling in Saskatchewan report, Volberg presented findings for the prevalence of problem gambling in the province. She reported that, for those respondents who gambled in the past year, 1.9% (±0.8%) of the adult population were �problem gamblers,� and an additional 0.8% (±0.5%) were �probable pathological gamblers.� These prevalence rates were based on respondent scores on the South Oaks Gambling Screen (SOGS), which is the 20-item survey instrument that was used in the 1993 study to classify gambler sub-types. As stated earlier, a new screening instrument, the Canadian Problem Gambling Index (CPGI), is used in the present Saskatchewan study to classify problem gamblers. The CPGI and SOGS are different measurement indices, notwithstanding that they have four items that are comparable. Furthermore, each measure uses different response scales (four-point for the CPGI; two-point for the SOGS) and the wording of comparable questions is slightly different between the 1993 and present studies. These problems, coupled with sampling/survey issues (e.g., different sample sizes, stratification quotas, and survey administration), make it impossible to directly compare the statistical data between the 1993 and present studies. In the 1993 Saskatchewan gambling study, Volberg reported the statistical prevalence rates noted above. More important than these statistics, she also estimated that, based on the Saskatchewan adult population at the time (713,000), there were between 7,500 to 19,500 current �problem gamblers,� and an additional 1,800 to 9,600 �probable pathological gamblers.� �Current gamblers� were defined as those who gambled in the past year.
It is also possible in the 2001 study to conduct a similar calculation of the estimated numbers of problem and at-risk gamblers in Saskatchewan. Based on prevalence rates in the present study, the margin of error for the gambler sub-type samples, and the present adult population (754,690), the following estimates are offered:
• 9.3% (±1.3%) low risk gamblers (59,900 to 79,800 adults) • 4.7% (±0.1%) moderate risk gamblers (27,900 to 42,400 adults)
__________________________________________________________________________________________ Gambling and Problem Gambling in Saskatchewan (2002) Final Report
67
• 1.2% (±0.5%) problem gamblers (5,600 to 13,200 adults) Rather than dwelling on changes in the prevalence rate statistics, which is problematic at best as noted above, it is arguably far more important to note that there are a significant number of Saskatchewan adults who continue to have either a severe gambling problem or who are at risk of developing a problem.
__________________________________________________________________________________________ Gambling and Problem Gambling in Saskatchewan (2002) Final Report
68
CHAPTER V
SELECTED HEALTH STATUS INDICATORS IN SASKATCHEWAN GAMBLERS
As discussed in the introductory chapter, problem gambling is now recognized as a serious public health issue. To examine the correlation between this issue and other health problems, the following research question is posed: �How do personal health status indicators compare amongst gambler sub-types?� To address this question, general and specific health problems are examined, along with selected health status variables and alcohol and illegal drug use. The findings relative to these variables are presented below.
1. Health Problems
The correlation amongst (1) fourteen general health, (2) fourteen specific health, and (3) four depression health status variables and the four gambler sub-types are presented in Table 36. In terms of general health problems, there are statistically significant differences between problem gamblers and the other three gambler sub-types for the following variables:
• Emotional problems (problem gamblers, 39.1%; non-problem gamblers, 3.7%) • Problem with alcohol (problem gamblers, 34.8%; non-problem gamblers, 0.9%) • Psychological condition/emotional illness (problem gamblers, 21.7%; non-problem
gamblers, 2.6%) • Learning disabilities (problem gamblers, 13%; non-problem gamblers, 1.1%) • Hearing difficulties (moderate risk gamblers, 11.6%; non-problem gamblers, 6.3%)
There are no statistically significant differences amongst the four gambler sub-types for any of the specific health problems or conditions presented to respondents.
Table 33 also shows that for the depression variables, there are statistically significant differences amongst the gambler sub-types for (1) depression that lasts two weeks or more, and (2) suicidal thoughts, as follows:
• Problem gamblers (56.5%) are four times more likely than non-problem gamblers (13.3%) to have felt sad, blue or depressed for more than two weeks at a time.
• Problem gamblers (43.5%) and, to a lesser extent moderate risk gamblers (14%), are more likely than non-problem gamblers (5.6%) to have had suicidal thoughts; however, there is no statistically significant difference amongst the four gambler sub-types with respect to those who have actually gone from suicide ideation to suicide attempts.
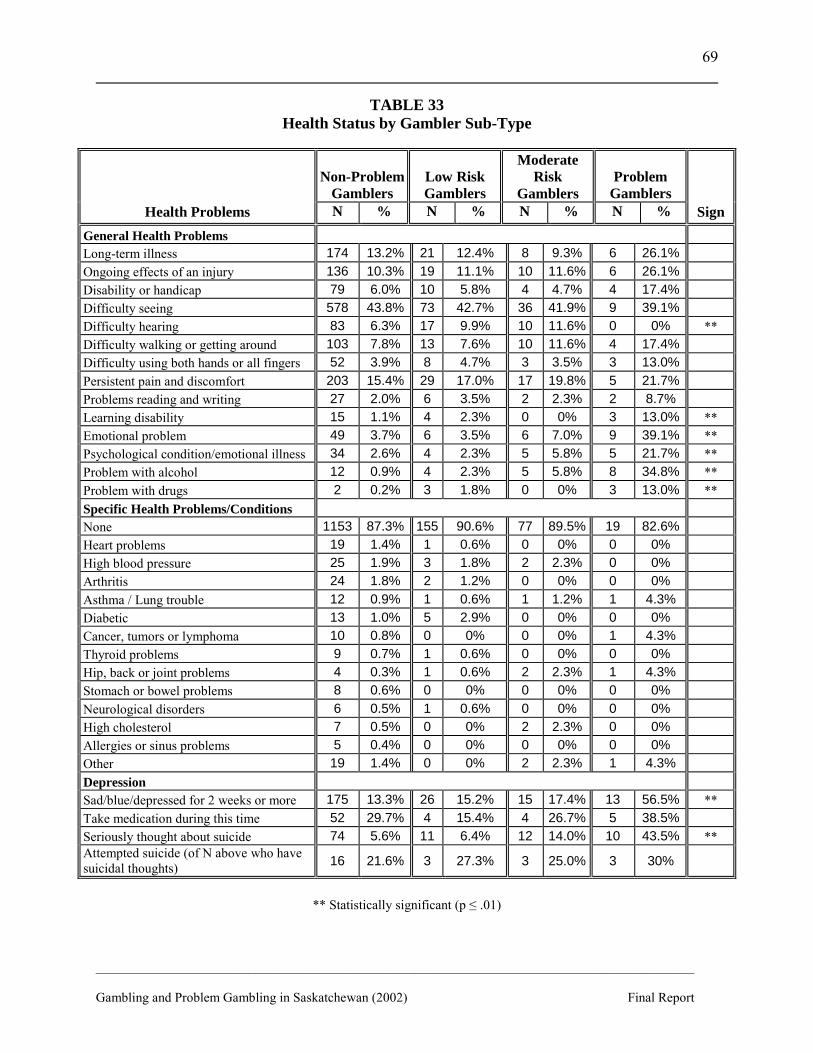
__________________________________________________________________________________________ Gambling and Problem Gambling in Saskatchewan (2002) Final Report
69
TABLE 33 Health Status by Gambler Sub-Type
Non-Problem Gamblers
Low Risk Gamblers
Moderate Risk
Gamblers Problem
Gamblers Health Problems N % N % N % N % Sign
General Health Problems Long-term illness 174 13.2% 21 12.4% 8 9.3% 6 26.1% Ongoing effects of an injury 136 10.3% 19 11.1% 10 11.6% 6 26.1% Disability or handicap 79 6.0% 10 5.8% 4 4.7% 4 17.4% Difficulty seeing 578 43.8% 73 42.7% 36 41.9% 9 39.1% Difficulty hearing 83 6.3% 17 9.9% 10 11.6% 0 0% ** Difficulty walking or getting around 103 7.8% 13 7.6% 10 11.6% 4 17.4% Difficulty using both hands or all fingers 52 3.9% 8 4.7% 3 3.5% 3 13.0% Persistent pain and discomfort 203 15.4% 29 17.0% 17 19.8% 5 21.7% Problems reading and writing 27 2.0% 6 3.5% 2 2.3% 2 8.7% Learning disability 15 1.1% 4 2.3% 0 0% 3 13.0% ** Emotional problem 49 3.7% 6 3.5% 6 7.0% 9 39.1% ** Psychological condition/emotional illness 34 2.6% 4 2.3% 5 5.8% 5 21.7% ** Problem with alcohol 12 0.9% 4 2.3% 5 5.8% 8 34.8% ** Problem with drugs 2 0.2% 3 1.8% 0 0% 3 13.0% ** Specific Health Problems/Conditions None 1153 87.3% 155 90.6% 77 89.5% 19 82.6% Heart problems 19 1.4% 1 0.6% 0 0% 0 0% High blood pressure 25 1.9% 3 1.8% 2 2.3% 0 0% Arthritis 24 1.8% 2 1.2% 0 0% 0 0% Asthma / Lung trouble 12 0.9% 1 0.6% 1 1.2% 1 4.3% Diabetic 13 1.0% 5 2.9% 0 0% 0 0% Cancer, tumors or lymphoma 10 0.8% 0 0% 0 0% 1 4.3% Thyroid problems 9 0.7% 1 0.6% 0 0% 0 0% Hip, back or joint problems 4 0.3% 1 0.6% 2 2.3% 1 4.3% Stomach or bowel problems 8 0.6% 0 0% 0 0% 0 0% Neurological disorders 6 0.5% 1 0.6% 0 0% 0 0% High cholesterol 7 0.5% 0 0% 2 2.3% 0 0% Allergies or sinus problems 5 0.4% 0 0% 0 0% 0 0% Other 19 1.4% 0 0% 2 2.3% 1 4.3% Depression Sad/blue/depressed for 2 weeks or more 175 13.3% 26 15.2% 15 17.4% 13 56.5% ** Take medication during this time 52 29.7% 4 15.4% 4 26.7% 5 38.5% Seriously thought about suicide 74 5.6% 11 6.4% 12 14.0% 10 43.5% ** Attempted suicide (of N above who have suicidal thoughts) 16 21.6% 3 27.3% 3 25.0% 3 30%
** Statistically significant (p ≤ .01)
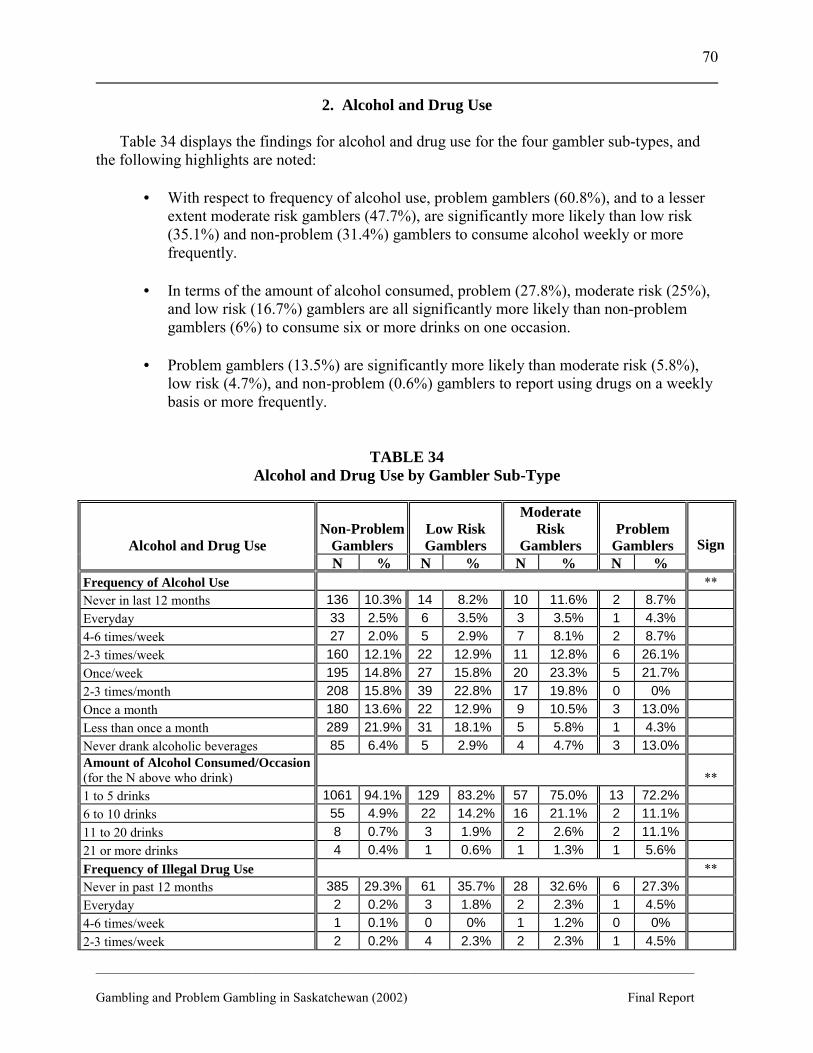
__________________________________________________________________________________________ Gambling and Problem Gambling in Saskatchewan (2002) Final Report
70
2. Alcohol and Drug Use Table 34 displays the findings for alcohol and drug use for the four gambler sub-types, and the following highlights are noted:
• With respect to frequency of alcohol use, problem gamblers (60.8%), and to a lesser extent moderate risk gamblers (47.7%), are significantly more likely than low risk (35.1%) and non-problem (31.4%) gamblers to consume alcohol weekly or more frequently.
• In terms of the amount of alcohol consumed, problem (27.8%), moderate risk (25%),
and low risk (16.7%) gamblers are all significantly more likely than non-problem gamblers (6%) to consume six or more drinks on one occasion.
• Problem gamblers (13.5%) are significantly more likely than moderate risk (5.8%),
low risk (4.7%), and non-problem (0.6%) gamblers to report using drugs on a weekly basis or more frequently.
TABLE 34 Alcohol and Drug Use by Gambler Sub-Type
Non-Problem
Gamblers
Low Risk Gamblers
Moderate Risk
Gamblers
Problem
Gamblers
Alcohol and Drug Use N % N % N % N %
Sign
Frequency of Alcohol Use ** Never in last 12 months 136 10.3% 14 8.2% 10 11.6% 2 8.7% Everyday 33 2.5% 6 3.5% 3 3.5% 1 4.3% 4-6 times/week 27 2.0% 5 2.9% 7 8.1% 2 8.7% 2-3 times/week 160 12.1% 22 12.9% 11 12.8% 6 26.1% Once/week 195 14.8% 27 15.8% 20 23.3% 5 21.7% 2-3 times/month 208 15.8% 39 22.8% 17 19.8% 0 0% Once a month 180 13.6% 22 12.9% 9 10.5% 3 13.0% Less than once a month 289 21.9% 31 18.1% 5 5.8% 1 4.3% Never drank alcoholic beverages 85 6.4% 5 2.9% 4 4.7% 3 13.0% Amount of Alcohol Consumed/Occasion (for the N above who drink) ** 1 to 5 drinks 1061 94.1% 129 83.2% 57 75.0% 13 72.2% 6 to 10 drinks 55 4.9% 22 14.2% 16 21.1% 2 11.1% 11 to 20 drinks 8 0.7% 3 1.9% 2 2.6% 2 11.1% 21 or more drinks 4 0.4% 1 0.6% 1 1.3% 1 5.6% Frequency of Illegal Drug Use ** Never in past 12 months 385 29.3% 61 35.7% 28 32.6% 6 27.3% Everyday 2 0.2% 3 1.8% 2 2.3% 1 4.5% 4-6 times/week 1 0.1% 0 0% 1 1.2% 0 0% 2-3 times/week 2 0.2% 4 2.3% 2 2.3% 1 4.5%
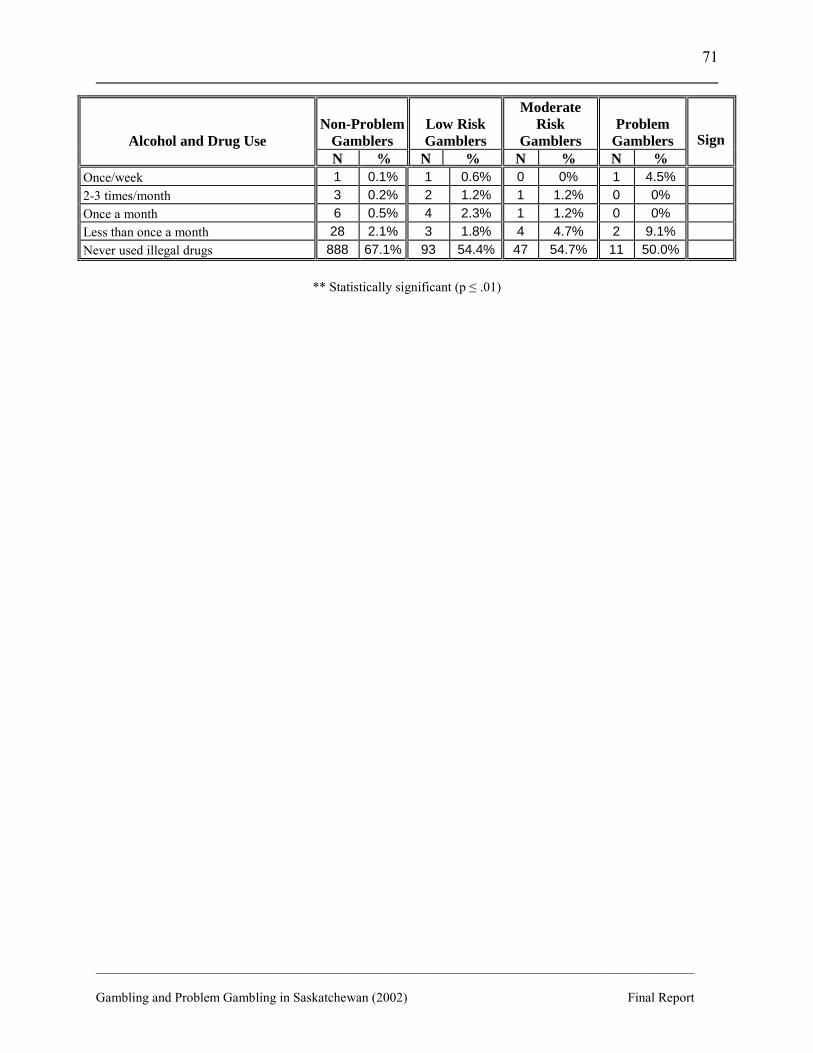
__________________________________________________________________________________________ Gambling and Problem Gambling in Saskatchewan (2002) Final Report
71
Non-Problem
Gamblers
Low Risk Gamblers
Moderate Risk
Gamblers
Problem
Gamblers
Alcohol and Drug Use N % N % N % N %
Sign
Once/week 1 0.1% 1 0.6% 0 0% 1 4.5% 2-3 times/month 3 0.2% 2 1.2% 1 1.2% 0 0% Once a month 6 0.5% 4 2.3% 1 1.2% 0 0% Less than once a month 28 2.1% 3 1.8% 4 4.7% 2 9.1% Never used illegal drugs 888 67.1% 93 54.4% 47 54.7% 11 50.0%
** Statistically significant (p ≤ .01)
__________________________________________________________________________________________ Gambling and Problem Gambling in Saskatchewan (2002) Final Report
72
CHAPTER VI
CONCLUSIONS AND IMPLICATIONS
In this final chapter, conclusions based on the study findings are presented for consideration and some implications of these results are briefly discussed. This study of gambling and problem gambling in Saskatchewan is large in scope and a wealth of statistical data has been gathered. Moreover, these data are open to various types of analyses and interpretations and this report should be viewed as the first attempt to present the overall main survey findings and conclusions. It is envisaged that subsequent secondary analyses of the study data set will provide further insights into gambling and the public health issue of problem gambling in the Saskatchewan community. The study is guided by the five specific research questions presented in the research design chapter, and study findings relative to these questions are reported in three main chapters, namely: (1) gambling in Saskatchewan, (2) problem gambling in Saskatchewan, and (3) the health status of Saskatchewan gamblers. In this final chapter, conclusions and the implications that flow from these are organized according to the findings as presented in these three chapters.
1. Gambling in Saskatchewan 1.1 Gambling Prevalence
Conclusion. Gambling in Saskatchewan is clearly a very popular recreational and entertainment pastime as it is practiced in some form by 87% of the adult population throughout the province. Opportunities to gamble are ubiquitous, existing in legalized and provincially regulated venues (e.g., casinos, race tracks, bingo halls); private licensed premises (e.g., VLTs); shopping malls and convenience stores (e.g., lottery tickets, Sport Select); the family environment (e.g., card/board games); illegal gambling establishments (e.g., unregulated card rooms); the workplace (e.g., sports pools); and literally in the home, through the advent of Internet access to on-line gambling sites. Gambling in virtually every form is easily accessible to both urban and rural Saskatchewan residents, and study findings show that both groups take advantage of gambling opportunities that are available.
Implication. A policy question that faces all jurisdictions in North America is, �How
much gambling is �enough?� The first section in Chapter I tracks the expansion of gambling in Saskatchewan since the last survey done in 1993, and it is readily apparent that there has been significant growth in the expansion of various types of gambling across the province over the past eight years. For instance, the number of VLTs located in bars and lounges has increased from 2,392 in 1993 to 3,561 in 2001; an increase of almost 50 percent. Similarly, five commercial casino locations with table games and 1,240 coin slots have been added to the gambling mix over the past eight years, where before, only part-time and special events casinos operated. The introduction of simulcast and teletheatre betting on horse races brought this pastime to Saskatchewan residents who do not live anywhere near a live race track. Finally, new lottery products have been added, notably a variety of new instant scratch-and-win offerings.
__________________________________________________________________________________________ Gambling and Problem Gambling in Saskatchewan (2002) Final Report
73
Undoubtedly, these types of legalized gambling activities provide a source of entertainment and recreational value for Saskatchewan residents, revenues for government services and charitable good works, and economic benefits for private companies. Nonetheless, these benefits are also offset to some extent by socio-economic costs associated with problem gambling, negative impacts on other forms of entertainment and businesses, the re-distributive effects of employment and individual/community cash-flow, and other similar prospective costs that are just now beginning to be studied.
To address this policy question, it is advisable for all governments to examine the socio-
economic costs and benefits of gambling expansion. Presently, an international, state-sponsored planning committee is endeavoring to develop �best practice guidelines� for conducting such gambling cost-benefit analyses, and the ensuing research promises to provide the evidence that jurisdictions need to inform their future gambling policy decisions.
1.2 Demographic Profile of Saskatchewan Gamblers Conclusion. In terms of gender, age, and marital status it may be concluded that, in general, gambling is equally likely to be engaged in by both men and women, irrespective of their age or marital status. Implication. In market terms, it is apparent that gambling in Saskatchewan has successfully penetrated all gender and age strata. Secondary analysis of the survey data set would determine which particular types of gambling appeal to the sexes and different age groups. This analysis could conceivably help policy-makers determine which forms of gambling should be expanded or contracted, to maximize potential benefits and minimize costs. Conclusion. While the majority of Saskatchewan gamblers in all education and income groups gamble on some type of activity, those with less than a high school education and who have an annual household income of less than $20,000 are less likely to do so. Implication. The high correlation between education and income is well established in social research, therefore, it is not surprising to find that both those with a lower education and correspondingly lower income are somewhat less likely to gamblers. To the extent that gambling is an enjoyable entertainment pastime, it is conceivable that those who have less discretionary income are not able to take advantage of these recreational opportunities. Again, a secondary analysis of the study data will help identify which particular gambling activities are pursued by those with lower education and income, and this may have policy implications for altering the legalized gambling mix to be more considerate of these marginalized people. 1.3 Gambling Activities, Frequency of Play, and Expenditures for Gamblers
Conclusion. The most practiced form of gambling in Saskatchewan, and the only one that is engaged in by the majority of adult gamblers, is purchasing lottery and raffle/fund-raising tickets. Furthermore, this gambling pursuit is the most likely of all the gambling activities to be engaged in weekly by players, although only one-third of these gamblers buy lottery/raffle tickets every week. Notwithstanding this penchant Saskatchewan gamblers have for purchasing
__________________________________________________________________________________________ Gambling and Problem Gambling in Saskatchewan (2002) Final Report
74
lottery and raffle tickets, the amount of money they spend doing so is relatively small ($7/month).
Implications. Clearly, the most successful form of legalized gambling in Saskatchewan,
in terms of market penetration and public participation, has been for lottery products, raffles and fund-raising tickets. This is not surprising given that, since the 1969 changes to the Criminal Code of Canada legalized provincial lotteries, these have been the most widely promoted of all state-sanctioned gambling activities. People have been successfully persuaded that, for a very small wager, they can �dream the dream� of becoming a millionaire, or that they can win an instant and substantial prize. Despite this penetration, lottery sales in Saskatchewan seem to have plateaued at $128 million in 1999/2000, with the result that there is reduced funding available to sport, culture and recreation beneficiaries and to government for license fees. It remains to be seen whether lottery sales will experience a downturn in favor of other gambling activities, with the result that community beneficiaries may continue to be adversely affected. Once again, this has policy implications for the Saskatchewan government as it strives to derive the most appropriate, net beneficial mix of legalized gambling opportunities for the province.
1.4 Changes in Gambling in Saskatchewan Since 1993
Conclusion. Since the 1993 provincial gambling survey, there have been some changes in the types of gambling activities engaged in by Saskatchewan residents, including decreased participation in some activities (i.e., lotteries, sports pools, bets with friends, bingo, Sport Select, and horse races) and increased participation in others (i.e., raffles and VLTs). Monthly expenditures on all activities are greater in 2001 than 1993, with the largest monthly expenditure in both years being for bingo, and the greatest discrepancy being a three-fold increase for VLT play. Implications. The first chapter identifies changes in the introduction of gambling activities and to corresponding revenues over the past eight years and, for the most part, these changes seem to correspond with differences in participation rates between the 1993 and 2001 studies. For instance, the number of VLTs have increased significantly, which is consistent with the comparative finding that VLT participation rates have increased somewhat (i.e., from 16% to 18%), while expenditures have increased three-fold (i.e., from $5 to $15 per month). In contrast, the number of bingo halls has been reduced from 45 to 33; therefore, it is not surprising that reported participation rates have decreased, although monthly expenditures have increased, perhaps due to the introduction of electronic bingo. This crude trend analysis points to the need for a more sophisticated, longitudinal monitoring of gambling participation and expenditure rates for the entire inter-related constellation of gambling activities in the province. This information will be valuable in advising policy decisions to expand, contract, or otherwise enhance/modify legalized gambling formats.
__________________________________________________________________________________________ Gambling and Problem Gambling in Saskatchewan (2002) Final Report
75
2. Problem Gambling in Saskatchewan
2.1 Problem Gambling Prevalence
Conclusion. In this study of gambling and problem gambling in Saskatchewan,
respondents are classified as either being gamblers (86.6%) or non-gamblers (13.4%). Gamblers are further classified using the nine-item Problem Gambling Severity Index (PGSI) into four sub-types, and based on PGSI scores, classification rates for these sub-types are as follows: non-problem gamblers (71.4%); low risk gamblers (9.3%); moderate risk gamblers (4.7%); problem gamblers (1.2%). Moreover, at-risk and problem gamblers may be found in both urban and rural communities across the province, although residents in Regina and Saskatoon appear to be somewhat more at-risk, or to already be experiencing a serious gambling problem.
Implications. Problem gambling clearly afflicts a relatively small percentage (<2%) of
the Saskatchewan population; however, there is a much larger percentage (14%) of adults who are at some level of risk for developing a problem. While these percentages seem small, especially when compared with the 70% of residents who enjoy gambling without experiencing any problems, they are nonetheless very significant when translated into the estimated number of people who have a problem, or are in danger of developing one. So long as there is provincially sanctioned gambling in Saskatchewan, there must be a corresponding major governmental initiative to reduce the harm this causes for some residents. Furthermore, to the extent this study serves as a baseline measure for at-risk and problem gambling behaviour, future regular replication studies should be conducted to ascertain whether problem and at-risk gambling is worsening, and/or by extension, whether harm reduction strategic initiatives are having the desired effect. Specific research and harm reduction interventions should be focused on Regina and Saskatoon as the prevalence of at-risk and problem gambling is highest in these major cities.
2.2 Demographic Profile of Saskatchewan Problem Gamblers
Conclusion. Although males and females are equally likely to gamble, males are more likely to have a gambling problem, or to be at risk for developing one. Furthermore, in terms of age, gamblers between 19 and 24 years old are the most likely age cohort to be at-risk or to have a problem; in contrast, those age 70 or older are the least likely. Finally, single people are more likely than married, divorced/separated, or widowed people to have a gambling problem or to be at-risk.
Implications. While gender, age, and marital status does not appear to differentiate
gamblers from non-gamblers, these demographic variables do discriminate gambler sub-types to a greater extent. In prevalence studies, the common profile of a problem gambler that is often presented is that of a young, single male and the Saskatchewan research supports this. While caution must be exercised, lest this profile cause females, married people, and those in other age cohorts to be overlooked, there must nonetheless be a special focus on mitigating problem gambling in this young, single male cohort.
__________________________________________________________________________________________ Gambling and Problem Gambling in Saskatchewan (2002) Final Report
76
Conclusion. Those who have less than a high school education are more likely to have a
gambling problem or to be at-risk for developing one. Similarly, those who have reported the lowest annual household income (i.e., < $20,000) are most likely to have a problem or to be at-risk.
Implication. In social and educational research, the high correlation between low
education and low income is well documented. The Saskatchewan findings clearly show that there is a correlation between at-risk and problem gambling and low education and income. This finding needs to be followed up in a secondary analysis of the study data to determine what other variables may also correlate highly with low education/income and at-risk/problem gambling (e.g., other demographic variables, type of game, frequency/duration of play, problem gambling behaviour and consequences, health status). This type of analysis may help refine treatment and prevention interventions targeted at this seemingly disadvantaged group. Conclusion. Aboriginal gamblers are significantly more likely than gamblers in other ethnic groups to be both at-risk for developing a gambling problem and to presently be experiencing a serious problem. Implications. Of the twenty-three problem gamblers in the study, nine (39%) report that they are of Aboriginal ancestry (i.e., First Nations or Metis). A further 11% score as moderate risk and 10% as low risk for developing a gambling problem. These statistics are especially significant given that only 5% of Saskatchewan gamblers report they are Aboriginal and that the overall sample was under-representative of this special population. Findings from problem gambling prevalence studies in other Canadian and United States jurisdictions generally support these Saskatchewan findings of pervasive gambling problems in Aboriginal populations. In view of these common findings, a special initiative should be undertaken at least in Saskatchewan and, preferably across Canada if not North America, to explicate this serious public health issue in Aboriginal populations and to plan effective intervention strategies to mitigate the problem. Conclusion. There are a substantial number of Saskatchewan minors under 19 years-of-age who live in a home with someone who has a gambling problem (22 minors) or who is at-risk for developing a problem (192 minors). Implication. It is well documented in the problem gambling literature that children and adolescents who are socialized in a home where a parent or significant other has a gambling problem are at increased risk for developing a problem themselves at some point in their lives. Research also shows that there is a significant correlation between problem gambling and a first early gambling experience, usually in the company of a parent or older family member. For instance, the Saskatchewan study findings show that problem gamblers are more likely than non-problem gamblers to have had their first gambling experience before age 15. In view of this, public awareness campaign messages should highlight the prospective harm that parents� uncontrolled gambling may cause for their children, emphasizing the need for parents to model responsible gambling behaviour, if they must expose their children to (their) gambling at all.
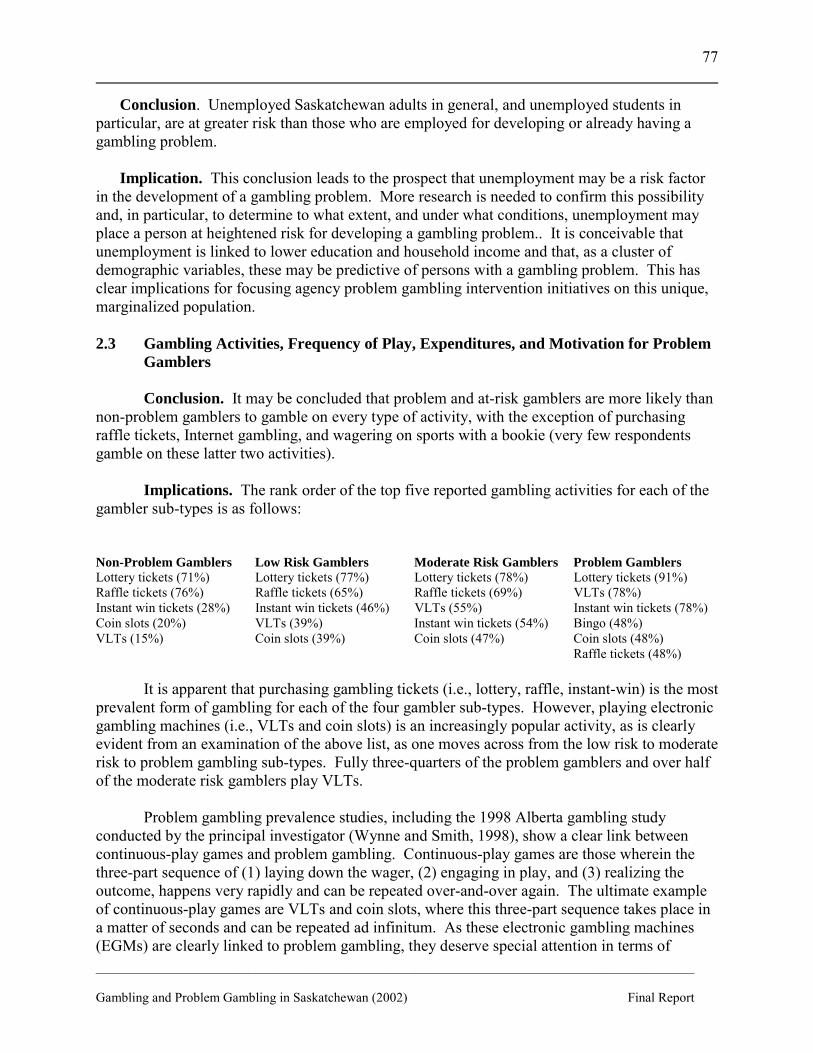
__________________________________________________________________________________________ Gambling and Problem Gambling in Saskatchewan (2002) Final Report
77
Conclusion. Unemployed Saskatchewan adults in general, and unemployed students in particular, are at greater risk than those who are employed for developing or already having a gambling problem. Implication. This conclusion leads to the prospect that unemployment may be a risk factor in the development of a gambling problem. More research is needed to confirm this possibility and, in particular, to determine to what extent, and under what conditions, unemployment may place a person at heightened risk for developing a gambling problem.. It is conceivable that unemployment is linked to lower education and household income and that, as a cluster of demographic variables, these may be predictive of persons with a gambling problem. This has clear implications for focusing agency problem gambling intervention initiatives on this unique, marginalized population. 2.3 Gambling Activities, Frequency of Play, Expenditures, and Motivation for Problem
Gamblers
Conclusion. It may be concluded that problem and at-risk gamblers are more likely than non-problem gamblers to gamble on every type of activity, with the exception of purchasing raffle tickets, Internet gambling, and wagering on sports with a bookie (very few respondents gamble on these latter two activities).
Implications. The rank order of the top five reported gambling activities for each of the
gambler sub-types is as follows:
Non-Problem Gamblers Low Risk Gamblers Moderate Risk Gamblers Problem Gamblers Lottery tickets (71%) Lottery tickets (77%) Lottery tickets (78%) Lottery tickets (91%) Raffle tickets (76%) Raffle tickets (65%) Raffle tickets (69%) VLTs (78%) Instant win tickets (28%) Instant win tickets (46%) VLTs (55%) Instant win tickets (78%) Coin slots (20%) VLTs (15%)
VLTs (39%) Coin slots (39%)
Instant win tickets (54%) Coin slots (47%)
Bingo (48%) Coin slots (48%) Raffle tickets (48%)
It is apparent that purchasing gambling tickets (i.e., lottery, raffle, instant-win) is the most
prevalent form of gambling for each of the four gambler sub-types. However, playing electronic gambling machines (i.e., VLTs and coin slots) is an increasingly popular activity, as is clearly evident from an examination of the above list, as one moves across from the low risk to moderate risk to problem gambling sub-types. Fully three-quarters of the problem gamblers and over half of the moderate risk gamblers play VLTs.
Problem gambling prevalence studies, including the 1998 Alberta gambling study
conducted by the principal investigator (Wynne and Smith, 1998), show a clear link between continuous-play games and problem gambling. Continuous-play games are those wherein the three-part sequence of (1) laying down the wager, (2) engaging in play, and (3) realizing the outcome, happens very rapidly and can be repeated over-and-over again. The ultimate example of continuous-play games are VLTs and coin slots, where this three-part sequence takes place in a matter of seconds and can be repeated ad infinitum. As these electronic gambling machines (EGMs) are clearly linked to problem gambling, they deserve special attention in terms of
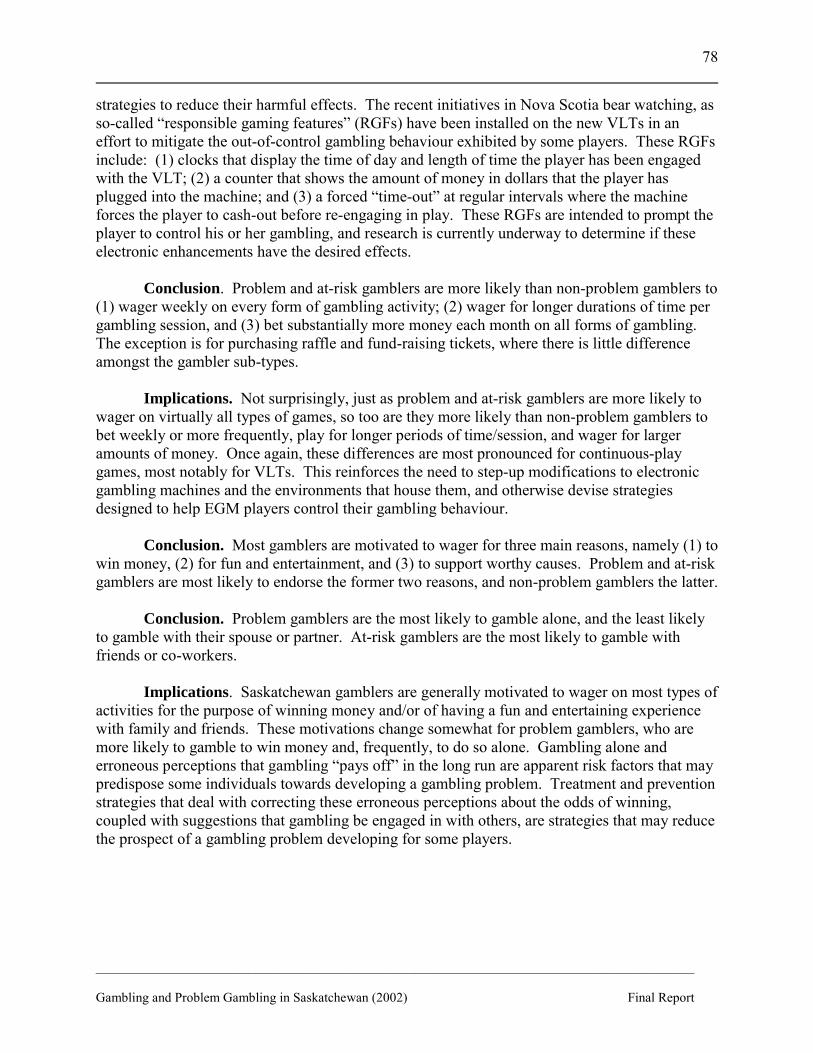
__________________________________________________________________________________________ Gambling and Problem Gambling in Saskatchewan (2002) Final Report
78
strategies to reduce their harmful effects. The recent initiatives in Nova Scotia bear watching, as so-called �responsible gaming features� (RGFs) have been installed on the new VLTs in an effort to mitigate the out-of-control gambling behaviour exhibited by some players. These RGFs include: (1) clocks that display the time of day and length of time the player has been engaged with the VLT; (2) a counter that shows the amount of money in dollars that the player has plugged into the machine; and (3) a forced �time-out� at regular intervals where the machine forces the player to cash-out before re-engaging in play. These RGFs are intended to prompt the player to control his or her gambling, and research is currently underway to determine if these electronic enhancements have the desired effects.
Conclusion. Problem and at-risk gamblers are more likely than non-problem gamblers to
(1) wager weekly on every form of gambling activity; (2) wager for longer durations of time per gambling session, and (3) bet substantially more money each month on all forms of gambling. The exception is for purchasing raffle and fund-raising tickets, where there is little difference amongst the gambler sub-types.
Implications. Not surprisingly, just as problem and at-risk gamblers are more likely to
wager on virtually all types of games, so too are they more likely than non-problem gamblers to bet weekly or more frequently, play for longer periods of time/session, and wager for larger amounts of money. Once again, these differences are most pronounced for continuous-play games, most notably for VLTs. This reinforces the need to step-up modifications to electronic gambling machines and the environments that house them, and otherwise devise strategies designed to help EGM players control their gambling behaviour.
Conclusion. Most gamblers are motivated to wager for three main reasons, namely (1) to
win money, (2) for fun and entertainment, and (3) to support worthy causes. Problem and at-risk gamblers are most likely to endorse the former two reasons, and non-problem gamblers the latter.
Conclusion. Problem gamblers are the most likely to gamble alone, and the least likely
to gamble with their spouse or partner. At-risk gamblers are the most likely to gamble with friends or co-workers.
Implications. Saskatchewan gamblers are generally motivated to wager on most types of
activities for the purpose of winning money and/or of having a fun and entertaining experience with family and friends. These motivations change somewhat for problem gamblers, who are more likely to gamble to win money and, frequently, to do so alone. Gambling alone and erroneous perceptions that gambling �pays off� in the long run are apparent risk factors that may predispose some individuals towards developing a gambling problem. Treatment and prevention strategies that deal with correcting these erroneous perceptions about the odds of winning, coupled with suggestions that gambling be engaged in with others, are strategies that may reduce the prospect of a gambling problem developing for some players.
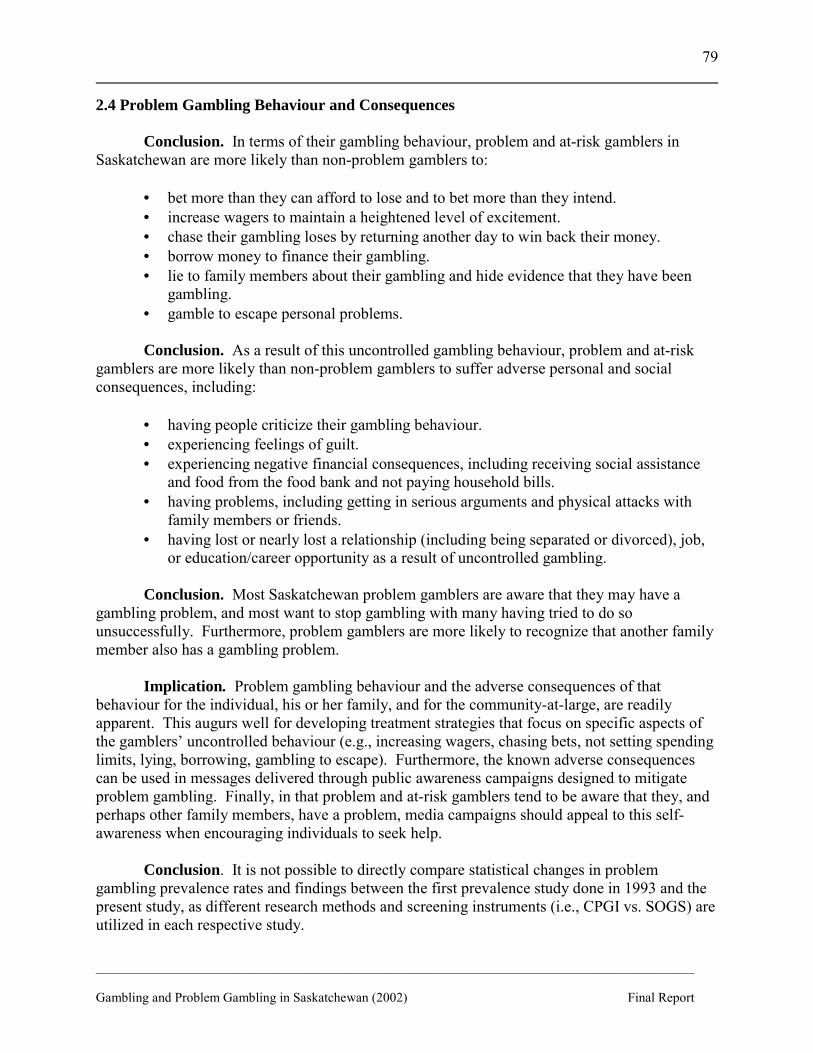
__________________________________________________________________________________________ Gambling and Problem Gambling in Saskatchewan (2002) Final Report
79
2.4 Problem Gambling Behaviour and Consequences
Conclusion. In terms of their gambling behaviour, problem and at-risk gamblers in Saskatchewan are more likely than non-problem gamblers to:
• bet more than they can afford to lose and to bet more than they intend. • increase wagers to maintain a heightened level of excitement. • chase their gambling loses by returning another day to win back their money. • borrow money to finance their gambling. • lie to family members about their gambling and hide evidence that they have been
gambling. • gamble to escape personal problems.
Conclusion. As a result of this uncontrolled gambling behaviour, problem and at-risk
gamblers are more likely than non-problem gamblers to suffer adverse personal and social consequences, including:
• having people criticize their gambling behaviour. • experiencing feelings of guilt. • experiencing negative financial consequences, including receiving social assistance
and food from the food bank and not paying household bills. • having problems, including getting in serious arguments and physical attacks with
family members or friends. • having lost or nearly lost a relationship (including being separated or divorced), job,
or education/career opportunity as a result of uncontrolled gambling. Conclusion. Most Saskatchewan problem gamblers are aware that they may have a
gambling problem, and most want to stop gambling with many having tried to do so unsuccessfully. Furthermore, problem gamblers are more likely to recognize that another family member also has a gambling problem.
Implication. Problem gambling behaviour and the adverse consequences of that behaviour for the individual, his or her family, and for the community-at-large, are readily apparent. This augurs well for developing treatment strategies that focus on specific aspects of the gamblers� uncontrolled behaviour (e.g., increasing wagers, chasing bets, not setting spending limits, lying, borrowing, gambling to escape). Furthermore, the known adverse consequences can be used in messages delivered through public awareness campaigns designed to mitigate problem gambling. Finally, in that problem and at-risk gamblers tend to be aware that they, and perhaps other family members, have a problem, media campaigns should appeal to this self-awareness when encouraging individuals to seek help.
Conclusion. It is not possible to directly compare statistical changes in problem gambling prevalence rates and findings between the first prevalence study done in 1993 and the present study, as different research methods and screening instruments (i.e., CPGI vs. SOGS) are utilized in each respective study.
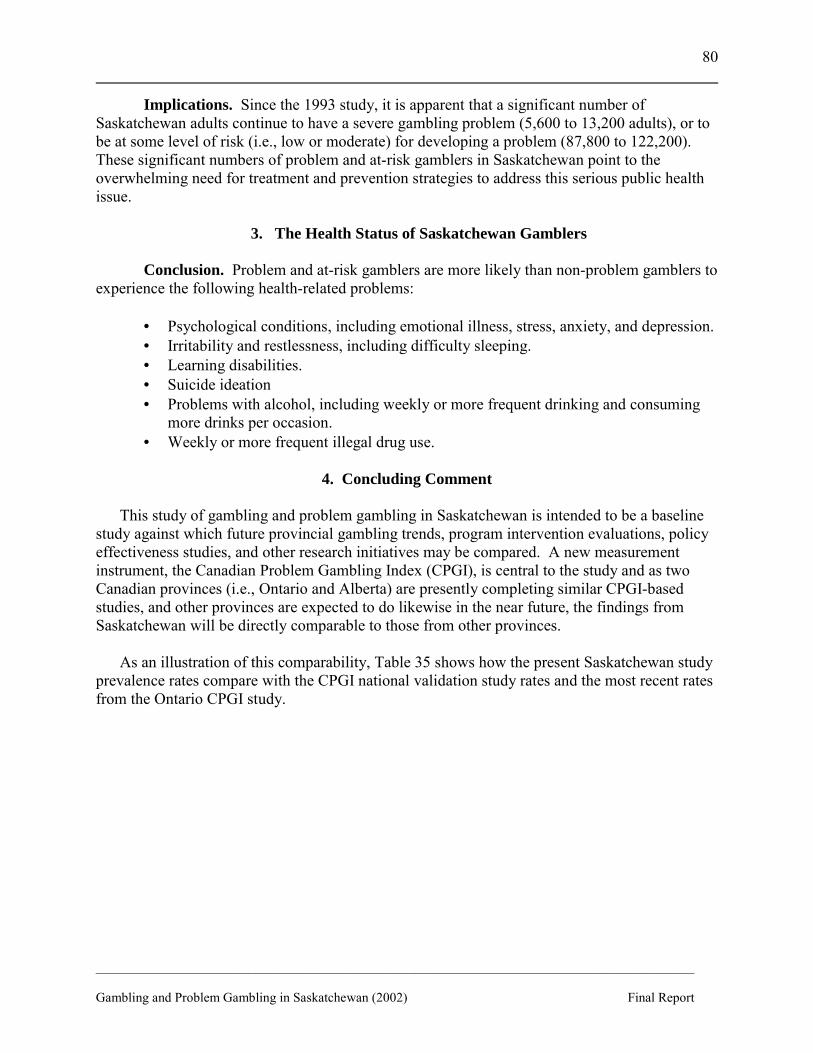
__________________________________________________________________________________________ Gambling and Problem Gambling in Saskatchewan (2002) Final Report
80
Implications. Since the 1993 study, it is apparent that a significant number of Saskatchewan adults continue to have a severe gambling problem (5,600 to 13,200 adults), or to be at some level of risk (i.e., low or moderate) for developing a problem (87,800 to 122,200). These significant numbers of problem and at-risk gamblers in Saskatchewan point to the overwhelming need for treatment and prevention strategies to address this serious public health issue.
3. The Health Status of Saskatchewan Gamblers
Conclusion. Problem and at-risk gamblers are more likely than non-problem gamblers to experience the following health-related problems:
• Psychological conditions, including emotional illness, stress, anxiety, and depression. • Irritability and restlessness, including difficulty sleeping. • Learning disabilities. • Suicide ideation • Problems with alcohol, including weekly or more frequent drinking and consuming
more drinks per occasion. • Weekly or more frequent illegal drug use.
4. Concluding Comment
This study of gambling and problem gambling in Saskatchewan is intended to be a baseline study against which future provincial gambling trends, program intervention evaluations, policy effectiveness studies, and other research initiatives may be compared. A new measurement instrument, the Canadian Problem Gambling Index (CPGI), is central to the study and as two Canadian provinces (i.e., Ontario and Alberta) are presently completing similar CPGI-based studies, and other provinces are expected to do likewise in the near future, the findings from Saskatchewan will be directly comparable to those from other provinces. As an illustration of this comparability, Table 35 shows how the present Saskatchewan study prevalence rates compare with the CPGI national validation study rates and the most recent rates from the Ontario CPGI study.
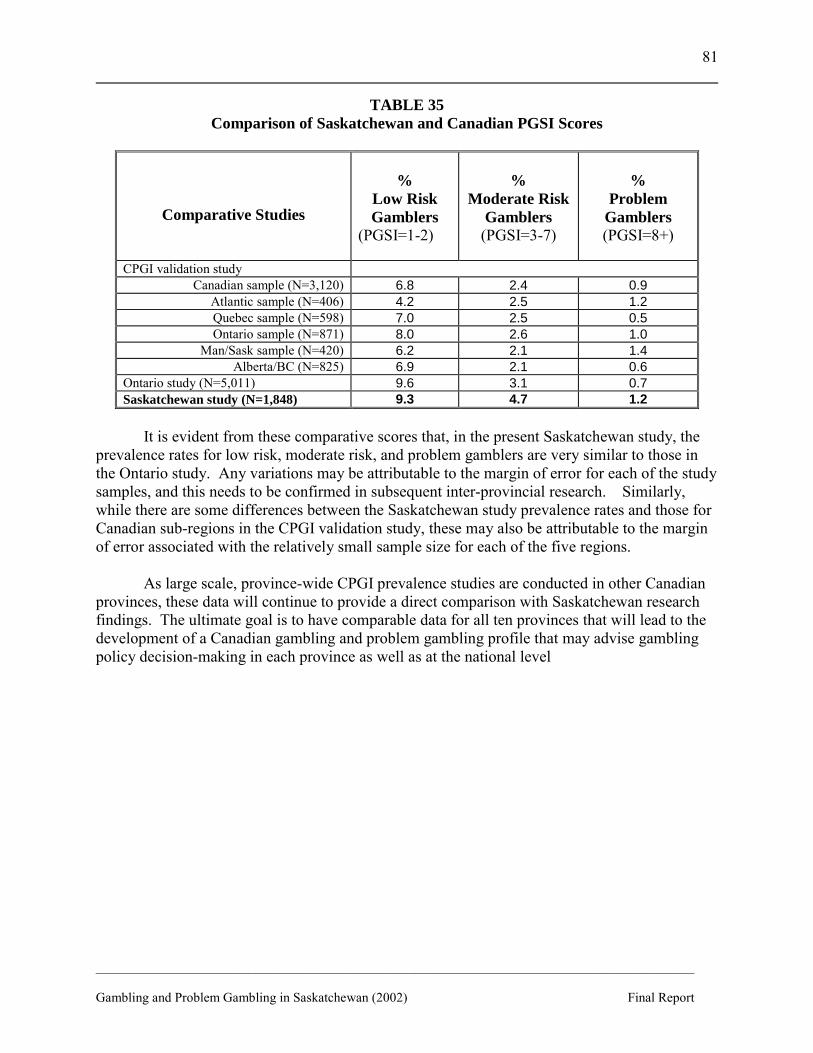
__________________________________________________________________________________________ Gambling and Problem Gambling in Saskatchewan (2002) Final Report
81
TABLE 35 Comparison of Saskatchewan and Canadian PGSI Scores
Comparative Studies
%
Low Risk Gamblers
(PGSI=1-2)
%
Moderate Risk Gamblers
(PGSI=3-7)
%
Problem Gamblers (PGSI=8+)
CPGI validation study Canadian sample (N=3,120) 6.8 2.4 0.9
Atlantic sample (N=406) 4.2 2.5 1.2 Quebec sample (N=598) 7.0 2.5 0.5 Ontario sample (N=871) 8.0 2.6 1.0
Man/Sask sample (N=420) 6.2 2.1 1.4 Alberta/BC (N=825) 6.9 2.1 0.6
Ontario study (N=5,011) 9.6 3.1 0.7 Saskatchewan study (N=1,848) 9.3 4.7 1.2
It is evident from these comparative scores that, in the present Saskatchewan study, the
prevalence rates for low risk, moderate risk, and problem gamblers are very similar to those in the Ontario study. Any variations may be attributable to the margin of error for each of the study samples, and this needs to be confirmed in subsequent inter-provincial research. Similarly, while there are some differences between the Saskatchewan study prevalence rates and those for Canadian sub-regions in the CPGI validation study, these may also be attributable to the margin of error associated with the relatively small sample size for each of the five regions.
As large scale, province-wide CPGI prevalence studies are conducted in other Canadian
provinces, these data will continue to provide a direct comparison with Saskatchewan research findings. The ultimate goal is to have comparable data for all ten provinces that will lead to the development of a Canadian gambling and problem gambling profile that may advise gambling policy decision-making in each province as well as at the national level
__________________________________________________________________________________________ Gambling and Problem Gambling in Saskatchewan (2002) Final Report
82
REFERENCES
Abbott, M.W. & Volberg, R. (1992). Gambling and problem gambling in New Zealand: A report on Phase One of the National Survey. Wellington, NZ: New Zealand Department of Internal Affairs. American Medical Association. (1994). Resolution No. 430 Warning: Gambling can become compulsive behavior. Angus Reid Group. (1996). Problem gambling surey 1996: Final report. Submitted to the British Columbia Lottery Corporation. Vancouver, BC: Author. Anthony, G. (1998). Report to the community. Egg Harbor Township, New Jersey: AtlantiCare Foundation. Auger, D. & Hewitt, D. (2000). Dream chaser: Alberta Aboriginal adult gambling prevalence study. Edmonton, AB: Nechi Training, Research & Health Promotions Institute. Baseline Market Research. (1992). Final report: Prevalence study: Problem gambling. Prepared for Department of finance, Province of New Brunswick. New Brunswick: Author. Baseline Market Research. (1996a). Final report: 1996 prevalence study on problem gambling in Nova Scotia. Prepared for Nova Scotia Department of Health. Halifax, NS: Author. Baseline Market Research. (1996b). Final report: Prevalence study: Problem gambling: Wave 2. Prepared for Department of Finance. Fredericton: New Brunswick Department of Finance. Cole, P. (1998). Report on gambling as a public health issue. Report to Municipal Councils of Brampton, Missassauga, Caledonia. Missassauga: Peel Region Health Department. Criterion Research Corp. (1993). Problem gambling study: Final report. Report to the Manitoba Lotteries foundation. Winnipeg, Man: Author. Criterion Research Corp. (1995). Problem gambling study: Final report. Report prepared for the Manitoba Lotteries Corporation. Winnipeg, Man: Author. Culleton, R.P. (1989). The prevalence rates of pathological gambling: A look at methods. Journal of Gambling Behaviour, 5(1), 22-41. Cunningham-Williams, R.M., Cottler, L.B., Compton, W.M. & Spitznagel, E.L. (1998). Taking chances: Problem gamblers and mental health disorders�results from the St. Louis epidemiologic catchment area study. American Journal of Public Health, 88(7), 1093-1096. Custer, R. & Milt, H. (1985). When luck runs out. New York, NY: Facts on File.
__________________________________________________________________________________________ Gambling and Problem Gambling in Saskatchewan (2002) Final Report
83
Devereux, E.C. (1979). Gambling. In The International Encyclopedia of the Social Sciences, Vol. 17. New York: Macmillan. Dickerson, M. (1993). Internal and external determinants of persistent gambling: Problems in generalizing from one form of gambling to another. Journal of gambling Studies, 9(3), 225-245. Donwood Problem Gambling Program. (1996). Pilot project; Final Report. Toronto, ON: Author. Doiron, J. & Nicki, R. (1999). The prevalence of problem gambling in Prince Edward Island. Prepared for the Prince Edward Island Department of Health and Social Service. Prince Edward Island: Author. Ferris, J. & Stirpe, T. (1995). Gambling in Ontario: A report from a general population survey on gambling-related problems and opinions. Toronto, ON: Addiction Research Foundation, Problem and Compulsive Gambling Project. Ferris, J. & Wynne, H. (February, 2001). The Canadian Problem Gambling Index final report. Phase II final report to the Canadian Inter-Provincial Task Force on Problem Gambling. Ferris, J. & Wynne, H. (January, 2001). The Canadian problem gambling index: User Manual. Report to the Canadian Inter-Provincial Task Force on Problem Gambling. Ferris, J., Wynne, H., & Single, E. (April, 1999). Measuring problem gambling in Canada. Phase I final report to the Canadian Inter-Provincial Task Force on Problem Gambling. France, C.J. (1902). The gambling impulse. American Journal of Psychology, 13, 364-407. Freud, S. (1928). Dostoevsky and parricide. The standard edition of the complete works of Sigmund Freud. J. Starchey (ed. and translator), Vol. 21, 222-242. Gaboury, A. & Ladouceur, R. (1998). Evaluation of a prevention program for pathological gambling among adolescents. Journal of Primary Prevention, 14(1), 21-28. Gemini Research & Angus Reid Group. (1994). Social gaming and problem gambling in British Columbia. Report to the British Columbia Lottery Corporation. Roaring Spring, PA: Gemini Research. Gerstein, D., Murphy, S., Toce, M., Hoffmann, J., Palmer, A., Johnson, R., Larison, C., Chuchro, I., Bard, A., Engelman, L., Hill, M., Buie, T., Volberg, R., Harwood, H., Tucker, A., Christiansen, E. & Cummings, W. (1999). Gambling impact and behavior study: Report to the National Gambling Impact Study Commission. National Opinion Research Center, University of Chicago.
__________________________________________________________________________________________ Gambling and Problem Gambling in Saskatchewan (2002) Final Report
84
Govoni, R., & Frisch, G.R. (1996a). The impact of the Windsor casino on adult gambling in the City of Windsor. Windsor, ON: University of Windsor Department of Psychology, Problem Gambling Research Group. Govoni, R., Rupcich, N., & Frisch, G.R. (1996b). Gambling behavior of adolescent gamblers. Journal of Gambling Studies, 12(3), 305-317. Hewitt, D. & Auger, D. (1995). Firewatch on Aboriginal adolescent gambling. Edmonton, AB: Nechi Training, Research & Health Promotions Institute. Insight Canada Research. (1993). Prevalence of problem & pathological gambling in Ontario using the South Oaks Gambling Screen. Toronto, ON: Author. Insight Canada Research. (1994). An exploration of the prevalence of pathological gambling behaviour among adolescents in Ontario. Willowdale, ON: Canadian Foundation on Compulsive Gambling. Kallick, M., Suits, D., Dielman, T. & Hybels, J. (1979). A survey of American gambling attitudes and behavior. Research Report Series, Survey Research Center, Institute for Social Research. Ann Arbor: University of Michigan Press. Knapp, T.J. (1976). A functional analysis of gambling behavior. In W.R. Eadington (ed.), Gambling and society (276-294). Springfield, IL: Thomas. Korn, D.A. (2001). Expansion of gambling in Canada: Implications for health and social policy. Canadian Medical Association Journal, 163(1), 61-64. Korn, D.A. & Skinner, H. (2000). Canadian Public Health Association 2000 Position Paper on Gambling Expansion in Canada: An Emerging Public Health Issue. 2000 CPHA Resolution No. 1. Korn, D.A. & Shaffer, H.J. (1999). Gambling and the health of the public: Adopting a public health perspective. Journal of Gambling Studies, 15(4), 289-365. Kusyszyn, I. (1976). How gambling saved me from a misspent sabbatical. In W.R. Eadington (ed.), Gambling and society. Springfield, IL: Thomas. Ladouceur. R. (1991). Prevalence estimates of pathological gamblers in Quebec, Canada. Canadian Journal of Psychiatry, 36, 732-734. Ladouceur, R., Dubé, D., & Bujold, A. (1994a). Gambling among primary school students. Journal of Gambling Studies, 10(4), 363-370. Ladouceur, R., Dubé, D., & Bujold, A. (1994b). Prevalence of pathological gambling and related problems among college students in the Quebec metropolitan area. Canadian Journal of Psychiatry, 39, 289-293.
__________________________________________________________________________________________ Gambling and Problem Gambling in Saskatchewan (2002) Final Report
85
Ladouceur, R. & Mireault, C. (1988). Gambling behaviors among high school students in the Quebec area. Journal of gambling Behavior, 4(1), 3-12. Last, J, ed.. (1995). A dictionary of epidemiology 3rd ed. New York: Oxford University Press. Laventhol & Horwath, David CWI & Associates, & Survey Research Associates, Inc. (1986). The effects of legalized gambling on the citizens of the State of Connecticut. Newington: State of Connecticut Division of Special Revenue. Lesieur, H.R., & Blume, S.B. (1993). Revising the South Oaks Gambling Screen in different settings. Journal of Gambling Studies, 9. 213-223. Lesieur, H.R. & Blume, S.B. (1992). Modifying the Addiction Severity Index for use with pathological gamblers. The American Journal on Addictions, 1, 240-247. Lesieur, H.R. & Klein, R. (1987). Pathological gambling among high school students. Addictive Behaviors, 12, 129-135. Massachusetts Council on Compulsive Gambling. (1994). Compulsive gambling signs and progression slide rule. Minister�s Advisory Committee on the Social Impacts of Gaming (October, 1994). Report on the social impacts of gaming and the impact of gaming expansion on charitable beneficiaries. Report to the Minister Responsible for the Saskatchewan Liquor and Gaming Authority. National Council of Welfare. (1996). Gambling in Canada. Ottawa: National Council of Welfare. Nova Scotia Department of Health Drug Dependency Services Division & Dalhousie University. (1996). Nova Scotia student drug use 1996. Halifax, NS: Nova Scotia Department of Health, Drug Dependency Services. Omnifacts Research. (1993). An examination of the prevalence of gambling in Nova Scotia. Report #93090. Halifax: Nova Scotia Department of Health, Drug Dependency Services. Shaffer, H.J., LaBrie, R., Scanlan, K.M. & Cummings, T.N. (1994). Pathological gambling among adolescents: Massachusetts Gambling Screen (MAGS). Journal of Gambling Studies, 10. 339-362. Shaffer, H.J., Hall, M.N., & Vander Bilt, J. (1997). Estimating the prevalence of disordered gambling behavior in the United States and Canada: A meta-analysis. Boston: Presidents and Fellows of Harvard College. Smart, R. & Ferris, J. (1996). Alcohol, drugs and gambling in the Ontario adult population, 1994. Canadian Journal of Psychiatry, 4(1). 36-45.
__________________________________________________________________________________________ Gambling and Problem Gambling in Saskatchewan (2002) Final Report
86
Taber, J.I. (1985). Pathological gambling: The initial screening interview. Journal of Gambling Behavior, 1(1), 23-34. Stocking, C (1931). Gambling. The Encyclopedia of the Social Sciences, Vol. G. New York, NY: MacMillan. Volberg, R.A. (1994). The prevalence and demographics of pathological gamblers: Implications for public health. American Journal of Public Health, 84(2), 237-241. Volberg, R.A. (1994). Gambling and problem gambling in Saskatchewan. Report to the Minister�s Advisory Committee on the Social Impacts of Gaming. Northampton, MA: Gemini Research. Volberg, R.A. & Steadman, H.J. (1989). Policy implications of prevalence estimates of pathological gambling. In H. Shaffer, S. Stein, B. Gambino, & T. Cummings (eds.), Compulsive Gambling. Lexington, MA: Lexington Books. 163-174. Wiebe, J. (1999). Manitoba Youth Gambling Prevalence Study. Winnipeg, Man: Addictions Foundation of Manitoba. Wiebe, J. (2000). Prevalence of gambling and problem gambling among older adults in Manitoba. Winnipeg, Man: Addictions Foundation of Manitoba. Wiebe, J., Single, E., & Falkowski-Ham, A. (2001). Measuring gambling and problem gambling in Ontario. Canadian Centre on Substance Abuse and Responsible Gambling Council (Ontario): Author. Wildman, R. (1997). Gambling: An attempt at an integration. Edmonton, AB: Wynne Resources. Wynne, H. & Smith, G. (In progress). Measuring problem gambling in Alberta with the Canadian Problem Gambling Index. Edmonton, AB: Alberta Gaming Research Institute. Wynne Resources. (1994). Gambling and problem gambling in Alberta. Report prepared for Alberta Lotteries and Gaming. Edmonton, AB: Author. Wynne Resources. (1996). Adolescent gambling and problem gambling in Alberta. Edmonton, AB: Alberta Alcohol & Drug Abuse Commission. Wynne Resources.. (1998). Gambling and problem gambling in Alberta. Report to the Alberta Alcohol and Drug Abuse Commission. Zola, I.K. (1967). Observations on gambling in a lower-class setting. In R.D. Herman (ed.), Gambling. (19-32). New York, NY: Harper & Row.
__________________________________________________________________________________________ Gambling and Problem Gambling in Saskatchewan (2002) Final Report
87
APPENDIX 1
Prairie Research Associates Inc. Telephone Survey Methodology Report
METHODOLOGY REPORT
Problem Gambling Survey
June 15, 2001
Prepared For:
Saskatchewan Health
Saskatchewan Health Problem Gambling Survey June 15, 2001
Table of Contents
1.0 HOW WAS THIS RESEARCH CONDUCTED? .............................................................. 1 1.1 Random Selection Within Households ................................................................... 1 1.2 Weighting ................................................................................................................ 1 1.3 Demographic Profile ............................................................................................... 2 1.4 The Birthday Method for Respondent Selection..................................................... 4
2.0 OTHER ISSUES ................................................................................................................. 5 2.1 Call Monitoring....................................................................................................... 5 2.2 Pre-test and On-going Interviewer Training ........................................................... 5 2.3 Survey Timing......................................................................................................... 5 2.4 Problem Gambling Indicators ................................................................................. 6 2.5 Activities Listed as Gambling................................................................................. 6 2.6 Ethnicity Question................................................................................................... 6 2.7 Strong Opinions on Gambling ................................................................................ 6 2.8 Media Reports ......................................................................................................... 7 2.9 Further Research ..................................................................................................... 7
APPENDIX A QUESTIONNAIRE APPENDIX B CALL RECORD
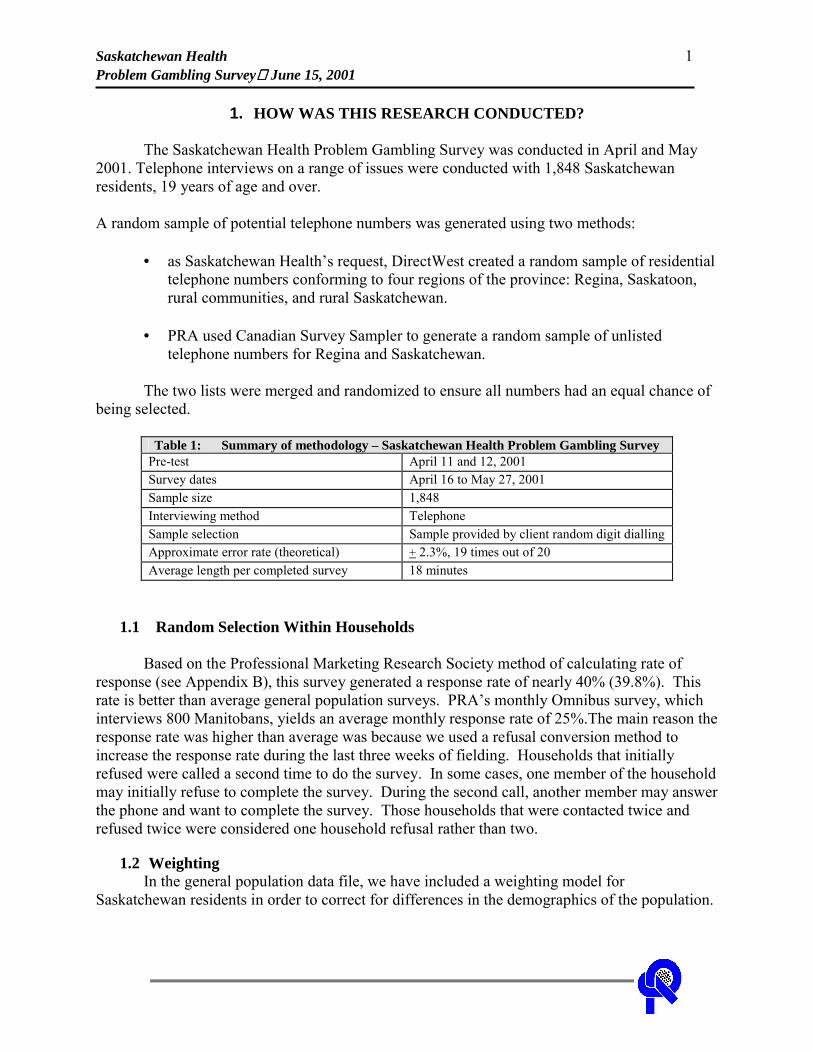
Saskatchewan Health 1 Problem Gambling Survey June 15, 2001
1. HOW WAS THIS RESEARCH CONDUCTED? The Saskatchewan Health Problem Gambling Survey was conducted in April and May
2001. Telephone interviews on a range of issues were conducted with 1,848 Saskatchewan residents, 19 years of age and over.
A random sample of potential telephone numbers was generated using two methods:
• as Saskatchewan Health�s request, DirectWest created a random sample of residential
telephone numbers conforming to four regions of the province: Regina, Saskatoon, rural communities, and rural Saskatchewan.
• PRA used Canadian Survey Sampler to generate a random sample of unlisted
telephone numbers for Regina and Saskatchewan.
The two lists were merged and randomized to ensure all numbers had an equal chance of being selected.
Table 1: Summary of methodology – Saskatchewan Health Problem Gambling Survey
Pre-test April 11 and 12, 2001 Survey dates April 16 to May 27, 2001 Sample size 1,848 Interviewing method Telephone Sample selection Sample provided by client random digit dialling Approximate error rate (theoretical) + 2.3%, 19 times out of 20 Average length per completed survey 18 minutes
1.1 Random Selection Within Households
Based on the Professional Marketing Research Society method of calculating rate of response (see Appendix B), this survey generated a response rate of nearly 40% (39.8%). This rate is better than average general population surveys. PRA�s monthly Omnibus survey, which interviews 800 Manitobans, yields an average monthly response rate of 25%.The main reason the response rate was higher than average was because we used a refusal conversion method to increase the response rate during the last three weeks of fielding. Households that initially refused were called a second time to do the survey. In some cases, one member of the household may initially refuse to complete the survey. During the second call, another member may answer the phone and want to complete the survey. Those households that were contacted twice and refused twice were considered one household refusal rather than two.
1.2 Weighting In the general population data file, we have included a weighting model for
Saskatchewan residents in order to correct for differences in the demographics of the population.
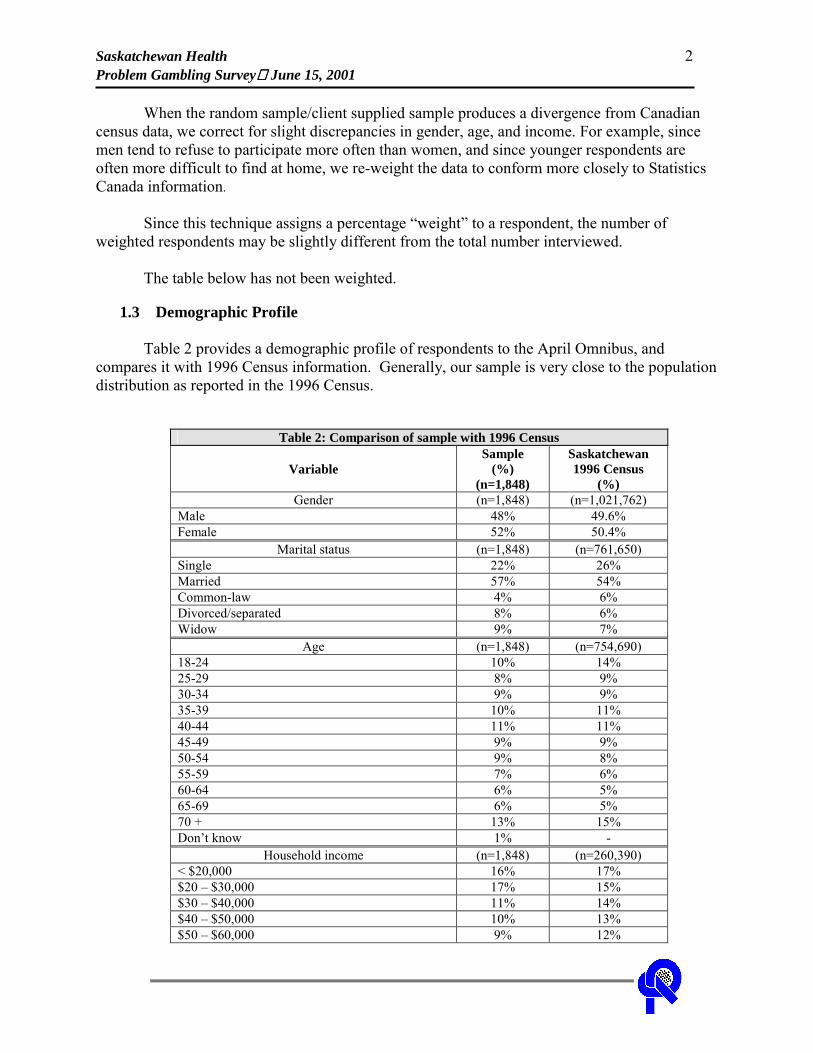
Saskatchewan Health 2 Problem Gambling Survey June 15, 2001
When the random sample/client supplied sample produces a divergence from Canadian census data, we correct for slight discrepancies in gender, age, and income. For example, since men tend to refuse to participate more often than women, and since younger respondents are often more difficult to find at home, we re-weight the data to conform more closely to Statistics Canada information.
Since this technique assigns a percentage �weight� to a respondent, the number of weighted respondents may be slightly different from the total number interviewed.
The table below has not been weighted.
1.3 Demographic Profile
Table 2 provides a demographic profile of respondents to the April Omnibus, and compares it with 1996 Census information. Generally, our sample is very close to the population distribution as reported in the 1996 Census.
Table 2: Comparison of sample with 1996 Census
Variable Sample
(%) (n=1,848)
Saskatchewan 1996 Census
(%) Gender (n=1,848) (n=1,021,762)
Male 48% 49.6% Female 52% 50.4%
Marital status (n=1,848) (n=761,650) Single 22% 26% Married 57% 54% Common-law 4% 6% Divorced/separated 8% 6% Widow 9% 7%
Age (n=1,848) (n=754,690) 18-24 10% 14% 25-29 8% 9% 30-34 9% 9% 35-39 10% 11% 40-44 11% 11% 45-49 9% 9% 50-54 9% 8% 55-59 7% 6% 60-64 6% 5% 65-69 6% 5% 70 + 13% 15% Don�t know 1% -
Household income (n=1,848) (n=260,390) < $20,000 16% 17% $20 � $30,000 17% 15% $30 � $40,000 11% 14% $40 � $50,000 10% 13% $50 � $60,000 9% 12%
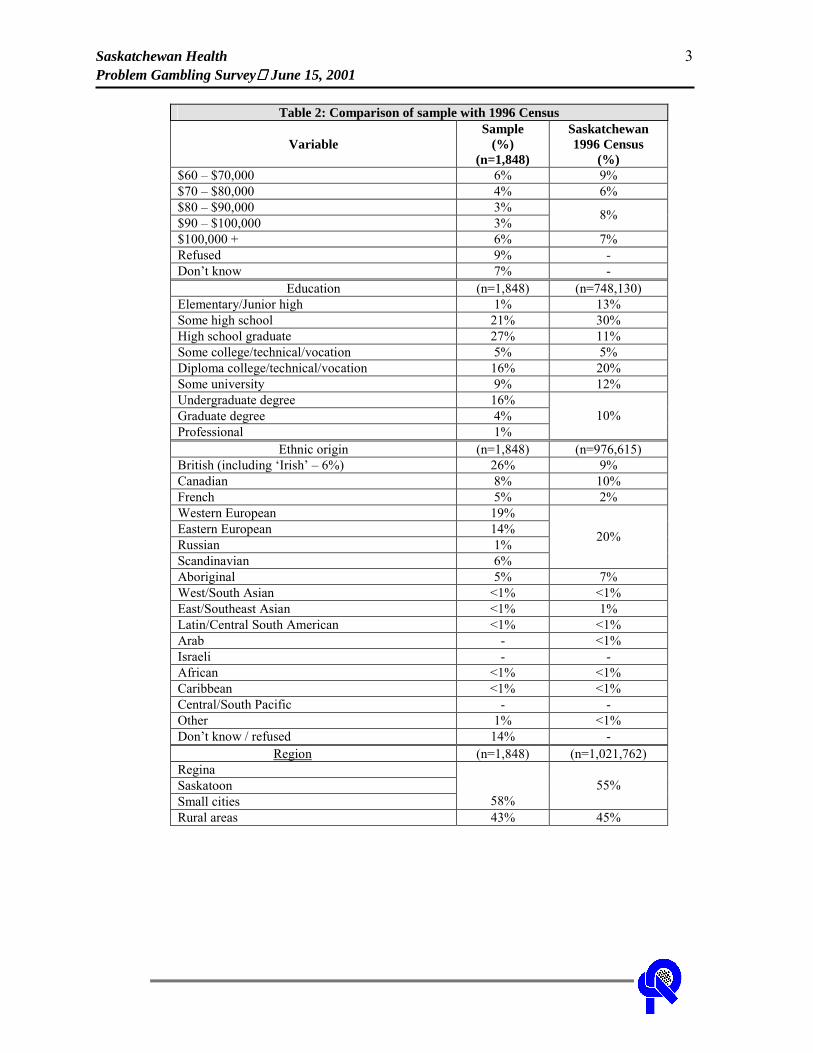
Saskatchewan Health 3 Problem Gambling Survey June 15, 2001
Table 2: Comparison of sample with 1996 Census
Variable Sample
(%) (n=1,848)
Saskatchewan 1996 Census
(%) $60 � $70,000 6% 9% $70 � $80,000 4% 6% $80 � $90,000 3% $90 � $100,000 3% 8%
$100,000 + 6% 7% Refused 9% - Don�t know 7% -
Education (n=1,848) (n=748,130) Elementary/Junior high 1% 13% Some high school 21% 30% High school graduate 27% 11% Some college/technical/vocation 5% 5% Diploma college/technical/vocation 16% 20% Some university 9% 12% Undergraduate degree 16% Graduate degree 4% Professional 1%
10%
Ethnic origin (n=1,848) (n=976,615) British (including �Irish� � 6%) 26% 9% Canadian 8% 10% French 5% 2% Western European 19% Eastern European 14% Russian 1% Scandinavian 6%
20%
Aboriginal 5% 7% West/South Asian <1% <1% East/Southeast Asian <1% 1% Latin/Central South American <1% <1% Arab - <1% Israeli - - African <1% <1% Caribbean <1% <1% Central/South Pacific - - Other 1% <1% Don�t know / refused 14% -
Region (n=1,848) (n=1,021,762) Regina Saskatoon Small cities 58%
55%
Rural areas 43% 45%
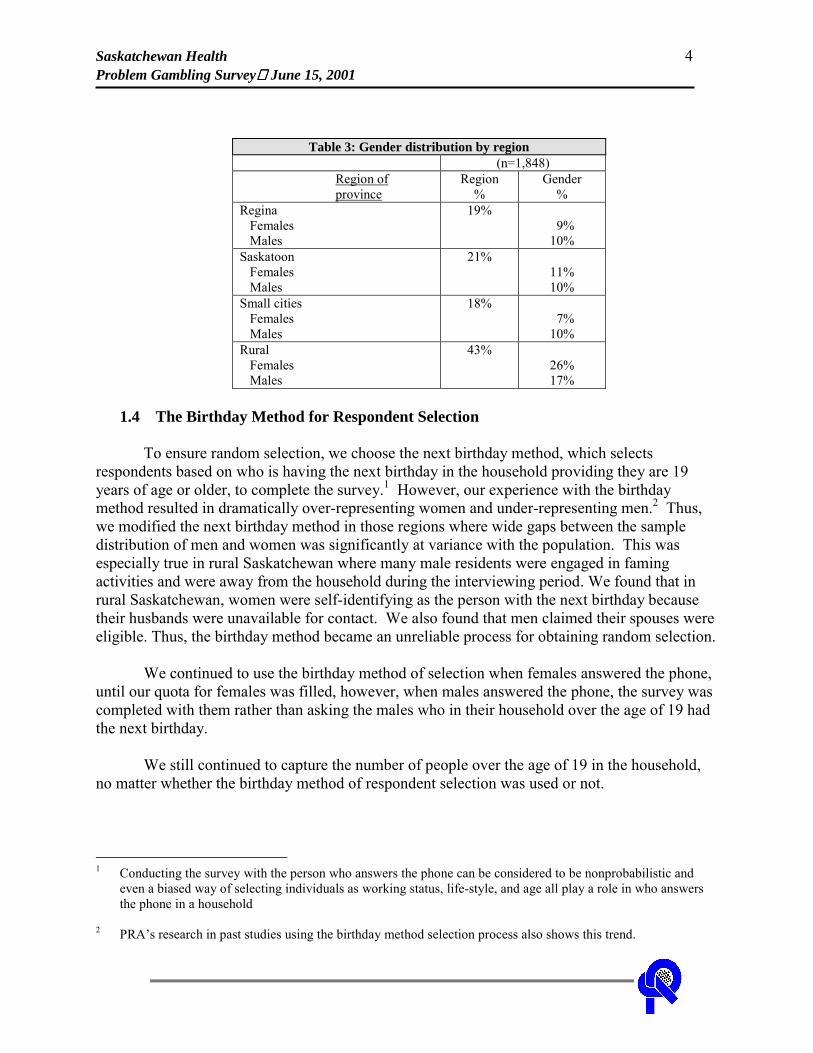
Saskatchewan Health 4 Problem Gambling Survey June 15, 2001
Table 3: Gender distribution by region (n=1,848) Region of province
Region %
Gender %
Regina Females Males
19%
9% 10%
Saskatoon Females Males
21%
11% 10%
Small cities Females Males
18%
7% 10%
Rural Females Males
43%
26% 17%
1.4 The Birthday Method for Respondent Selection
To ensure random selection, we choose the next birthday method, which selects respondents based on who is having the next birthday in the household providing they are 19 years of age or older, to complete the survey.1 However, our experience with the birthday method resulted in dramatically over-representing women and under-representing men.2 Thus, we modified the next birthday method in those regions where wide gaps between the sample distribution of men and women was significantly at variance with the population. This was especially true in rural Saskatchewan where many male residents were engaged in faming activities and were away from the household during the interviewing period. We found that in rural Saskatchewan, women were self-identifying as the person with the next birthday because their husbands were unavailable for contact. We also found that men claimed their spouses were eligible. Thus, the birthday method became an unreliable process for obtaining random selection.
We continued to use the birthday method of selection when females answered the phone,
until our quota for females was filled, however, when males answered the phone, the survey was completed with them rather than asking the males who in their household over the age of 19 had the next birthday.
We still continued to capture the number of people over the age of 19 in the household,
no matter whether the birthday method of respondent selection was used or not.
1 Conducting the survey with the person who answers the phone can be considered to be nonprobabilistic and
even a biased way of selecting individuals as working status, life-style, and age all play a role in who answers the phone in a household
2 PRA�s research in past studies using the birthday method selection process also shows this trend.
Saskatchewan Health 5 Problem Gambling Survey June 15, 2001
Our CATI system was programmed to track gender throughout the fielding process. We made screening adjustments based on the gender split tracked by the CATI system, and screened for men as necessary.
2. OTHER ISSUES
The following section details various issues and general comments about the survey.
2.1 Call Monitoring
During the 25,914 calls that were made on this project3, 1,231 (5%) were monitored. Among the 1,848 completed interviews, 414 (23%) were monitored. Monitoring ensures the quality of the interview and can serve as a useful teaching tool to enhance interviewers� telephone-interviewing skills. Where necessary, interviewers received feedback on their telephone manner, rapport with respondents, and comprehension of the survey itself.
2.2 Pre-test and On-going Interviewer Training All telephone interviewers who worked on this project were extensively trained before
completing any telephone interviews.
Pre-test training covered interviewer techniques for broaching sensitive topics with respondents. The survey was also thoroughly discussed and practiced among the interviewers so that they were familiar with the instrument�s complex skip patterns.
On-going interviewer training was conducted, especially each time changes were made to
questionnaire wording, coding categories, or when new interviewers were assigned to the project.
Interviewers were encouraged to provide the project manager with feedback about questionnaire wording and respondents� comprehension levels as issues arose. Frequently, questionnaire wording was changed because of interviewers� suggestions.
2.3 Survey Timing
Although field operations were done evenly throughout the fielding process, the aim was
to survey all rural respondents as soon as possible due to the timing of the survey. In order to complete the survey with the quota of just under 800 respondents in this area, approximately four to five weeks was needed. Many rural respondents are farmers or involved in the agricultural sector in some capacity. This presented a challenge for the survey as male respondents were not available at the time of contact. In some cases, respondents expressed their discontent with PRA (and Saskatchewan Health) that we would expect them to have the time to complete a survey during one of their busiest times of the year. The timing of the survey, coupled with the birthday method of respondent selection, led to difficulties finding male respondents in rural 3 This number includes the refusal conversion calls that were completed where some respondents were called
two times to complete the survey and refused each time.
Saskatchewan Health 6 Problem Gambling Survey June 15, 2001
Saskatchewan. The timing of the survey prevented us from completing the survey in rural Saskatchewan in a more timely matter.
2.4 Problem Gambling Indicators
Some respondents had very little gambling experience and felt some questions did not
apply to them. This was especially true of questions asked as part of the Problem Gambling Indication Section. Some respondents asked why they needed to be asked these questions when they did not gamble or only rarely gamble. Although we modified the introduction to this section to explain the reason for these questions, some respondents were still annoyed with having to respond to them.
2.5 Activities Listed as Gambling
Some respondents did not consider various activities listed at the beginning of the survey
to even be gambling activities. Those activities most commonly included questions about speculative investments (i.e., spent money on stock options, commodities markets not including mutual funds, and RRSPs) and questions about money spent on raffles or fundraising tickets, especially if they were associated with silent auctions respondents participated in at community centres or church events designed for fundraising.
2.6 Ethnicity Question
In general, some respondents hesitated to provide their ethnicity, not because of the
sensitive nature of the question, but because they do not consider themselves to be anything but Canadian. Originally, PRA and Saskatchewan Health decided that those who answered �Canadian� would be further probed to capture from where their ancestors originated and those who insisted that they were Canadian would be coded as �other.� However, among the 1,848 respondents interviewed, only 140 would identify their ethnicity as Canadian. When this trend was noticed at the beginning of the fielding process, a code of Canadian was created and those responses were no longer classified as �other.�
2.7 Strong Opinions on Gambling
At the end of the survey, interviewers were encouraged to provide comments on anything
about the survey. In some cases, respondents said that they had family members who had been affected by problem gambling in some way including bankruptcy, divorce, and even suicide. Other respondents commented on the effects of gambling in general, the government�s role in gambling, or even on the purpose for commissioning this survey. Where possible, comments by interviewers about data quality (i.e., an interviewer may have suspected a respondent to have a gambling addiction and subsequently lied to the interviewer at some part of the survey) were captured as best as possible. However, it is important to note that these comments were at the discretion of the interviewer and should be considered subjective.
Saskatchewan Health 7 Problem Gambling Survey June 15, 2001
2.8 Media Reports
During the fielding process, there were a number of media reports on the effects of gambling or issues related to gambling, one of which included a man in Montreal who committed suicide in a casino parking lot. The suicide was suspected to have resulted from the man�s addiction to gambling and its financial and emotional effects on his family. At this same time, the province of New Brunswick held a referendum to determine the future of video lottery terminals (VLTs) in the province. Media coverage on the active campaigning on both sides of the debate made national news headlines. The impact of media influence on our field operations is uncertain since no respondents mentioned either the suicide or the referendum.
2.9 Further Research
Among all 1,848 respondents, 1,609 or 87% said that Saskatchewan Health could contact
them for a short follow-up interview. All respondents are expecting to hear the results of this survey either directly in the way of follow-up research or in a media release from the government. However, in agreeing that they could be contacted for further research, few respondents offered another phone number for contact (i.e., work or cell phone number).

APPENDIX A QUESTIONNAIRE
Saskatchewan Health 1 Problem Gambling Survey June 15, 2001
SASKATCHEWAN 2001 – PROBLEM GAMBLING PREVALENCE SURVEY Hello, my name is ______ and I am calling from Prairie Research. We are conducting a survey for Saskatchewan Health on the gambling attitudes and activities of Saskatchewan residents and we would like to include your views. Your response will help Saskatchewan Health develop new programs and services in the province. Your household is one of 1,800 being randomly surveyed throughout Saskatchewan.
---------! NEXT SCREEN TO CONTINUE
QA QA. First of all, can you tell me how many adults 19 years or older live in this household? (RECORD THE NUMBER).
$R 2 25 No one 19 or older � THANK & TERMINATE CALL AS NON-QUALIFIED..00 => /INT01 Only 1 person 19 or older in household .................................................................01 Refused (Terminate call and thank them for their time) ........................................99 => /INT01
QB => +1 if NOT QA=00,01,99 IF ONLY ONE PERSON 19 YEARS OR OLDER IN HOUSEHOLD ASK: QB. I would like to speak to that person would that be you? Yes � (CONTINUE WITH SURVEY) ....................................................................1 No � CORRECT PERSON COMING TO PHONE (GO BACK TO INTR1).........2 => /INTR1 No � CORRECT PERSON NOT AVAILABLE (GET CORRECT PERSON�S NAME & SCHEDULE CALL-BACK / TERMINATE CALL.................................................................................3 => /INT01 No Response (TERMINATE CALL � REFUSAL).................................................9 => /INT01
QC => +1 if QB=1 IF MORE THAN ONE PERSON 19 YEARS OR OLDER IN HOUSEHOLD ASK QC. I would like to speak to the person in your household 19 years or older who has the next birthday would that be you? IF NO, ASK: �May I please speak to that person?� Yes, Speaking to correct person already � (CONTINUE WITH SURVEY) ...........1 No, but correct person coming to phone (GO BACK TO INTR1) ..........................2 => /INTR1 No � CORRECT PERSON NOT AVAILABLE (GET CORRECT PERSON�S NAME & SCHEDULE CALL-BACK / TERMINATE CALL.................................................................................3 => /INT01 No Response (TERMINATE CALL � REFUSAL).................................................9 => /INT01
INTR3 Great! I would like to interview you and I�m hoping that now is a good time for you. The interview will take about 15 minutes, depending on how many of the questions apply to you. (PROMPT: IF THE PERSON NEVER GAMBLES, DOESN�T BELIEVE IN IT, ETC. SAY: �We understand that not everyone gambles, but your input is still very important to us.�) CONTINUE WITH SURVEY.................................................................................1 ARRANGE CALL-BACK ......................................................................................2 => /INT01 NO RESPONSE / REFUSAL � (TERMINATE CALL) .........................................9 => /INT01
Saskatchewan Health 2 Problem Gambling Survey June 15, 2001
INTR4 Before we start, I�d like to assure you that your participation is voluntary and that any information you provide will be kept completely confidential. If there are any questions that you do not wish to answer, please feel free to point these out to me and I�ll go on to the next question.(You have the right to terminate the interview at any time.) CONTINUE WITH SURVEY.................................................................................1 ARRANGE CALL-BACK ......................................................................................2 => /INT01 NO RESPONSE / REFUSAL � (TERMINATE CALL) .........................................9 => /INT01
INTR5 May I continue with the survey now? (PROMPT: IF THE PERSON NEVER GAMBLES, DOESN�T BELIEVE IN IT, ETC. SAY: �We understand that not everyone gambles, but your opinions are still very important to us.�)
ADDITIONAL HELP � PRESS F8 Yes, Agree to do survey now � (THANK THEM AND GO TO Q.1).....................1 => /Q1 Schedule call-back to do survey...............................................................................2 => /INT01 Refused to do interview (TERMINATE AND THANK THEM FORTHEIR TIME) 3 => /INT01
INT01 INITIAL CALL STATUS SCREEN ----------------------- RECORD CALL STATUS BELOW -------------------------
YES, CONTINUE WITH SURVEY .....................................................................01 N Hard appointment...................................................................................................04 => /NAME Soft appointment ....................................................................................................05 => /NAME Not in service .........................................................................................................10 => /END Fax/Modem line .....................................................................................................11 => /END Business line ..........................................................................................................12 => /END Household refusal ..................................................................................................20 => /END Respondent refusal.................................................................................................21 => /END Quota Filled ...........................................................................................................22 => /END Soft Refusal............................................................................................................23 => /END Termination � Mid interview .................................................................................24 N => /END Busy .......................................................................................................................30 => /END No answer ..............................................................................................................31 => /END Answering machine ...............................................................................................32 => /END Other ......................................................................................................................50 O => /END _________________________________________________________________
Language/Heath/Hearing problem.........................................................................60 => /END Non-qualified respondent.......................................................................................70 => /END
REG REGION OF PHONE NUMBER
REGION:
REGINA ................................................................................................................01 SASKATOON .......................................................................................................02 Other Small cities...................................................................................................03 Rural Areas ............................................................................................................04
Saskatchewan Health 3 Problem Gambling Survey June 15, 2001
SECTION 1: GAMBLING ACTIVITY Q1. First, we�d like to ask some questions about gambling activities you may have participated in. People bet money and gamble on many different things including buying lottery tickets, playing bingo, or card games with their friends. I am going to read a list of some activities that you might have participated in. --------------------! NEXT SCREEN TO CONTINUE LIST OF ACTIVITIES • Lottery • Daily lottery tickets (e.g. Pick 3) • Instant-win or scratch tickets (e.g. breakopen or pull tabs) • Raffle or fundraising tickets • Bingo • Card/board games with family or friends • Vlts in a bar or restaurant lounge • Casino slot machines • Gambling on the Internet • Sport Select • Sports pools • Outcome of sporting events • Sports with a bookie • Horse racing • Casino games other than coin slots (e.g. poker, blackjack, roulette, keno) • Stocks, options, commodities • Games of skill for money (e.g. pool, golf, bowling, darts) • Card games in non-regulated settings • Other forms of gambling � 1 • Other forms of gambling � 2 • Other forms of gambling � 3
Q1A-Q1V – GAMBLING ACTIVITIES Q1. In the past 12 months, have you spent money on (LIST ACTIVITIES)? Yes ...........................................................................................................................1 No ............................................................................................................................2 Don�t Know .............................................................................................................8 No Response ............................................................................................................9
Saskatchewan Health 4 Problem Gambling Survey June 15, 2001
=> Q2 if NOT Q1=1 Q2A – Q2V - GAMBLING FREQUENCY Q2. In the past 12 months, how often did you spend money on (LIST ACTIVITIES)? Daily.......................................................................................................................01 2 to 6 times/week ...................................................................................................02 About once/week ...................................................................................................03 2-3 times/month .....................................................................................................04 About once/month..................................................................................................05 Between 6-11 times/year........................................................................................06 Between 1-5 times/year..........................................................................................07 never / not in the past year .....................................................................................00 Don�t Know ...........................................................................................................88 Refused / No Response ..........................................................................................99
Q3A – Q3V HOW MUCH TIME NORMALLY SPENT EACH TIME Q3. When spending money on (LIST ACTIVITIES), �how many minutes or hours do you normally spend EACH TIME? (INTERVIEWER: ENTER VALUE HERE AND GO TO NEXT SCREEN TO SPECIFY WHETHER MINUTES OR HOURS)
(Refers to their buying habits in the past 12 months) $R 1 480 Less than 1 minute / hour .....................................................................................000 Don�t Know .........................................................................................................888 Refused / No Response ........................................................................................999
=> +1 if Q3=888,999 Q3A1 – Q3V1 TIME SPENT Q31. TIME SPENT (INTERVIEWER: ENTER WHETHER MINUTES OR HOURS) Minutes ....................................................................................................................1 Hours........................................................................................................................2
Q4A – Q4V AMOUNT OF MONEY SPENT MONTHLY ON GAMBLING ACTIVITIES Q4. How much money, not including winnings, did you spend on (LIST ACTIVITIES) in a TYPICAL month? (ENTER NUMBER OF DOLLARS BELOW) (INTERVIEWER: IF ASKED FOR CLARIFICATION, SAY: �We mean spending that is out of pocket, and doesn�t include money won and THEN spent.�)
(Refers to their buying habits in the past 12 months ) $R 1 75000 Less than 1 dollar .............................................................................................00000 Don�t Know .....................................................................................................88888 Refused / No Response ....................................................................................99999
Q5A – Q5V LARGEST AMOUNT OF MONEY SPENT IN ONE DAY Q5. In the past 12 months, what is the largest amount of money you ever spent on (LIST ACTIVITIES) in any ONE day? (ENTER NUMBER OF DOLLARS BELOW) $R 1 75000 Less than 1 dollar .............................................................................................00000 Don�t Know .....................................................................................................88888 Refused / No Response ....................................................................................99999
Saskatchewan Health 5 Problem Gambling Survey June 15, 2001
Q6A – Q6V WHO DO YOU GO WITH TO GAMBLE Q6. When you spend money on (LIST ACTIVITIES)... who do you go with? (READ TO PROMPT IF NECESSARY) (RECORD ALL RESPONSES) Alone......................................................................................................................01 With spouse or partner ...........................................................................................02 With other family members ...................................................................................03 With friends or co-workers, or ...............................................................................04 With some other individual or group (SPECIFY)..................................................66 O (DO NOT READ) Don�t Know .............................................................................88 X (DO NOT READ) Refused / No Response ............................................................99 X
Q7A – Q7V MAIN REASONS WHY YOU SPEND MONEY GAMBLING ACTIVITIES Q7. What are the main reasons why you spend money on (LIST ACTIVITIES)? (PROMPT: Why do you spend money on them?) (RECORD ALL RESPONSES) Main reasons (SPECIFY).......................................................................................66 O (DO NOT READ) Don�t Know .............................................................................88 X (DO NOT READ) Refused / No Response ............................................................99 X
DUMM1 SKIP LOGIC PAGE FOR NON-GAMBLERS INTERVIEWERS: IF RESPONDENT HAS NOT SAID �YES� TO ANY GAMBLING ACTIVITY IN THE LAST 12 MONTHS (Q1A-Q1T) � CODE RESPONSE 2 BELOW, OTHERWISE CHOOSE RESPONSE CODE 1 TO GO TO PROBLEM GAMBLING SECTION (Q1A-Q1T RESPONSES:<Q1A >/<Q1B >/<Q1C >/<Q1D >/<Q1E >/<Q1F >/<Q1G >/<Q1H >/<Q1I >/<Q1J >/<Q1K >/<Q1L >/<Q1M >/<Q1N >/<Q1O >/<Q1P >/<Q1R >/<Q1S >/<Q1T >) GAMBLING ACTIVITY ........................................................................................1 D NO GAMBLING ACTIVITY .................................................................................2 => Q29
Q9X SECTION 2: PROBLEM GAMBLING Q9X. The next series of question are part of a standard measurement scale which was recently developed in Canada for use in surveys similar to this one.Saskatchewan Health is interested in determining whether involvement in gambling is presenting any problems for �ndividuals,their households, or their communities. They are being asked of all respondents who indicate that they�ve participated in any type of gambling activity in the last 12 months.
Try to be as precise as possible. Answers will be confidential.
Q9 Q9. Thinking about the past 12 months, How often have you bet more than you could really afford to lose? Would you say: ( 1/ 934) Never........................................................................................................................1 Sometimes................................................................................................................2 Most of the time .......................................................................................................3 Almost always..........................................................................................................4 (DO NOT READ) Don�t Know ...............................................................................8 (DO NOT READ) Refused / No Response ..............................................................9
Saskatchewan Health 6 Problem Gambling Survey June 15, 2001
Q10 Q10. Thinking about the past 12 months, How often have you needed to gamble with larger amounts of money to get the same feeling of excitement? Never........................................................................................................................1 Sometimes................................................................................................................2 Most of the time .......................................................................................................3 Almost always..........................................................................................................4 (DO NOT READ) Don�t Know ...............................................................................8 (DO NOT READ) Refused / No Response ..............................................................9
Q11 Q11. Thinking about the past 12 months, How often have you gone back another day to try to win back the money you lost? Never........................................................................................................................1 Sometimes................................................................................................................2 Most of the time .......................................................................................................3 Almost always..........................................................................................................4 (DO NOT READ) Don�t Know ...............................................................................8 (DO NOT READ) Refused / No Response ..............................................................9
Q12 Q12. Thinking about the past 12 months, How often have you borrowed money or sold anything to get money to gamble? Never........................................................................................................................1 Sometimes................................................................................................................2 Most of the time .......................................................................................................3 Almost always..........................................................................................................4 (DO NOT READ) Don�t Know ...............................................................................8 (DO NOT READ) Refused / No Response ..............................................................9
Q13 Q13. Thinking about the past 12 months, How often have you felt that you might have a problem with gambling? Never........................................................................................................................1 Sometimes................................................................................................................2 Most of the time .......................................................................................................3 Almost always..........................................................................................................4 (DO NOT READ) Don�t Know ...............................................................................8 (DO NOT READ) Refused / No Response ..............................................................9
Q14 Q14. Thinking about the past 12 months, How often have people criticized your betting or told you that you had a gambling problem, regardless of whether or not you thought it was true? Never........................................................................................................................1 Sometimes................................................................................................................2 Most of the time .......................................................................................................3 Almost always..........................................................................................................4 (DO NOT READ) Don�t Know ...............................................................................8 (DO NOT READ) Refused / No Response ..............................................................9
Saskatchewan Health 7 Problem Gambling Survey June 15, 2001
Q15 Q15. Thinking about the past 12 months, How often have you felt guilty about the way you gamble, or what happens when you gamble? Never........................................................................................................................1 Sometimes................................................................................................................2 Most of the time .......................................................................................................3 Almost always..........................................................................................................4 (DO NOT READ) Don�t Know ...............................................................................8 (DO NOT READ) Refused / No Response ..............................................................9
Q16 Q16. Thinking about the past 12 months, How often has your gambling caused you any health problems, including stress or anxiety? Never........................................................................................................................1 Sometimes................................................................................................................2 Most of the time .......................................................................................................3 Almost always..........................................................................................................4 (DO NOT READ) Don�t Know ...............................................................................8 (DO NOT READ) Refused / No Response ..............................................................9
Q17 Q17. Thinking about the past 12 months, How often has your gambling caused any financial problems for you or your household? Never........................................................................................................................1 Sometimes................................................................................................................2 Most of the time .......................................................................................................3 Almost always..........................................................................................................4 (DO NOT READ) Don�t Know ...............................................................................8 (DO NOT READ) Refused / No Response ..............................................................9
Q18 Q18. Thinking about the past 12 months, How often have you felt like you would like to stop betting money or gambling but you didn�t think you could? Never........................................................................................................................1 Sometimes................................................................................................................2 Most of the time .......................................................................................................3 Almost always..........................................................................................................4 (DO NOT READ) Don�t Know ...............................................................................8 (DO NOT READ) Refused / No Response ..............................................................9
Q19 Q19. Thinking about the past 12 months, How often have you hidden betting slips, lottery tickets, gambling money, IOUs or other signs of betting or gambling from your partner, children or other important people in your life? Never........................................................................................................................1 Sometimes................................................................................................................2 Most of the time .......................................................................................................3 Almost always..........................................................................................................4 (DO NOT READ) Don�t Know ...............................................................................8 (DO NOT READ) Refused / No Response ..............................................................9
Saskatchewan Health 8 Problem Gambling Survey June 15, 2001
Q20 Q20. Thinking about the past 12 months, How often have you gambled as a way of escaping problems or to help you feel better when you were depressed? Never........................................................................................................................1 Sometimes................................................................................................................2 Most of the time .......................................................................................................3 Almost always..........................................................................................................4 (DO NOT READ) Don�t Know ...............................................................................8 (DO NOT READ) Refused / No Response ..............................................................9
Q21 Q21. Thinking about the past 12 months, How often have you lied to family members or others to hide your gambling? Never........................................................................................................................1 Sometimes................................................................................................................2 Most of the time .......................................................................................................3 Almost always..........................................................................................................4 (DO NOT READ) Don�t Know ...............................................................................8 (DO NOT READ) Refused / No Response ..............................................................9
Q22 Q22. Thinking about the past 12 months, How often have you bet or spent more money than you wanted to on gambling? Never........................................................................................................................1 Sometimes................................................................................................................2 Most of the time .......................................................................................................3 Almost always..........................................................................................................4 (DO NOT READ) Don�t Know ...............................................................................8 (DO NOT READ) Refused / No Response ..............................................................9
Q23 Q23. Thinking about the past 12 months, How often have you tried to quit, or cut down on your gambling but were unable to do it? Never........................................................................................................................1 Sometimes................................................................................................................2 Most of the time .......................................................................................................3 Almost always..........................................................................................................4 (DO NOT READ) Don�t Know ...............................................................................8 (DO NOT READ) Refused / No Response ..............................................................9
Q24 Q24. Thinking about the past 12 months, How often have you had difficulty sleeping because of gambling? Never........................................................................................................................1 Sometimes................................................................................................................2 Most of the time .......................................................................................................3 Almost always..........................................................................................................4 (DO NOT READ) Don�t Know ...............................................................................8 (DO NOT READ) Refused / No Response ..............................................................9
Saskatchewan Health 9 Problem Gambling Survey June 15, 2001
Q25 Q25. Thinking about the past 12 months, How often have you felt irritable or restless when you tried to cut down or stop gambling for a while? Never........................................................................................................................1 Sometimes................................................................................................................2 Most of the time .......................................................................................................3 Almost always..........................................................................................................4 (DO NOT READ) Don�t Know ...............................................................................8 (DO NOT READ) Refused / No Response ..............................................................9
Q26 Q26. Thinking about the past 12 months, How often has your gambling caused any problems between you and any of your family members or friends? Never........................................................................................................................1 Sometimes................................................................................................................2 Most of the time .......................................................................................................3 Almost always..........................................................................................................4 (DO NOT READ) Don�t Know ...............................................................................8 (DO NOT READ) Refused / No Response ..............................................................9
Q27 Q27. Thinking about the past 12 months, How often have you stolen anything or done anything else illegal such as write bad cheques so that you could have money to gamble? Never........................................................................................................................1 Sometimes................................................................................................................2 Most of the time .......................................................................................................3 Almost always..........................................................................................................4 (DO NOT READ) Don�t Know ...............................................................................8 (DO NOT READ) Refused / No Response ..............................................................9
Q28 Q28. Thinking about the past 12 months, How often have you almost lost a relationship, a job, or an educational or career opportunity because of your gambling? Never........................................................................................................................1 Sometimes................................................................................................................2 Most of the time .......................................................................................................3 Almost always..........................................................................................................4 (DO NOT READ) Don�t Know ...............................................................................8 (DO NOT READ) Refused / No Response ..............................................................9
Q29 Q29. And now thinking about the past, including such activities as games of chance with family or friends where you have risked money, even if it was a small amount,�.. how old were you when you first gambled? (ENTER AGE IN YEARS IF 6 OR OLDER) $R 6 97 Never tried gambling ...........................................................................................000 Five years of age or younger................................................................................005 Don�t Know .........................................................................................................888 Refused / No Response ........................................................................................999
Saskatchewan Health 10 Problem Gambling Survey June 15, 2001
Q30 Q30. Has anyone in your family EVER had a gambling problem? (PROMPT: This includes your extended family) Yes ...........................................................................................................................1 No ............................................................................................................................2 Don�t Know .............................................................................................................8 Refused / No Response ............................................................................................9
Q31X Q31X. Gambling may have negative consequences for the gambler and on other members of the family. For the following questions we�d like you to think about the last 12 months and all members of your household,including yourself.It is important for the analysis of the survey that everyone is asked these questions.
----------! NEXT SCREEN TO CONTINUE
Q31 Q31. Has anyone in your household: Been charged with committing an illegal offence in order to obtain money to gamble?
( In the last 12 months ) Yes ...........................................................................................................................1 No ............................................................................................................................2 Don�t Know .............................................................................................................8 Refused / No Response ............................................................................................9
Q32 Q32. Has anyone in your household: Been fired from a job because of problems related to gambling?
( In the last 12 months ) Yes ...........................................................................................................................1 No ............................................................................................................................2 Don�t Know .............................................................................................................8 Refused / No Response ............................................................................................9
Q38 Q38. Has anyone in your household: Been separated or divorced because of problems related to gambling?
( In the last 12 months ) Yes ...........................................................................................................................1 No ............................................................................................................................2 Don�t Know .............................................................................................................8 Refused / No Response ............................................................................................9
Saskatchewan Health 11 Problem Gambling Survey June 15, 2001
Q39 Q39. Has anyone in your household: Had belongings repossessed because of financial problems related to gambling?
( In the last 12 months ) Yes ...........................................................................................................................1 No ............................................................................................................................2 Don�t Know .............................................................................................................8 Refused / No Response ............................................................................................9
Q40 Q40. Has anyone in your household: Had to declare bankruptcy because of financial problems related to gambling?
( In the last 12 months ) Yes ...........................................................................................................................1 No ............................................................................................................................2 Don�t Know .............................................................................................................8 Refused / No Response ............................................................................................9
Q33X Q33X. The next set of questions continue to focus on all members of your household including yourself, and are being asked of everyone. Please answer either �Never�, �Rarely�, �Occasionally�, �Frequently� or �Almost always� to the following questions. -------------! NEXT SCREEN TO CONTINUE
Q33 Q33.How often�. Has anyone in your household: Left children under the age of 12 unattended in vehicles or at home in order to Gamble? Would you say� (READ)
( In the last 12 months ) Never........................................................................................................................1 Rarely.......................................................................................................................2 Occasionally.............................................................................................................3 Frequently ................................................................................................................4 Almost always..........................................................................................................5 (DO NOT READ) Don�t Know ...............................................................................8 (DO NOT READ) Refused / No Response ..............................................................9
Q34 Q34.How often�. Has anyone in your household: (PROMPT: Because of Gambling..) Received financial assistance from a government or community social assistance program because of financial problem related to Gambling? Would you say�
( In the last 12 months ) Never........................................................................................................................1 Rarely.......................................................................................................................2 Occasionally.............................................................................................................3 Frequently ................................................................................................................4 Almost always..........................................................................................................5 (DO NOT READ) Don�t Know ...............................................................................8 (DO NOT READ) Refused / No Response ..............................................................9
Saskatchewan Health 12 Problem Gambling Survey June 15, 2001
Q35 Q35.How often�. Has anyone in your household: (PROMPT: Because of Gambling..) Received food from a food bank or other food program because of financial problems related to Gambling? Would you say� (READ)
( In the last 12 months ) Never........................................................................................................................1 Rarely.......................................................................................................................2 Occasionally.............................................................................................................3 Frequently ................................................................................................................4 Almost always..........................................................................................................5 (DO NOT READ) Don�t Know ...............................................................................8 (DO NOT READ) Refused / No Response ..............................................................9
Q36 Q36.How often�. Has anyone in your household: Been involved in a serious argument, shouting match or threats of violence over Gambling? Would you say� (READ)
( In the last 12 months ) Never........................................................................................................................1 Rarely.......................................................................................................................2 Occasionally.............................................................................................................3 Frequently ................................................................................................................4 Almost always..........................................................................................................5 (DO NOT READ) Don�t Know ...............................................................................8 (DO NOT READ) Refused / No Response ..............................................................9
Q37 Q37.How often�.Has anyone in your household: Been involved in physical attacks or assault over Gambling? Would you say� (READ)
( In the last 12 months ) Never........................................................................................................................1 Rarely.......................................................................................................................2 Occasionally.............................................................................................................3 Frequently ................................................................................................................4 Almost always..........................................................................................................5 (DO NOT READ) Don�t Know ...............................................................................8 (DO NOT READ) Refused / No Response ..............................................................9
Q41A – Q41K Q41. In the past 12 months, How often have problems related to a household member�s Gambling resulted in: (LIST)? Would you say� (READ) Never........................................................................................................................1 Rarely.......................................................................................................................2 Occasionally.............................................................................................................3 Frequently ................................................................................................................4 Almost always..........................................................................................................5 (DO NOT READ) Don�t Know ...............................................................................8 (DO NOT READ) Refused / No Response ..............................................................9 LIST • Not paying rent or mortgage payments • Not paying power, heat, or water bills
Saskatchewan Health 13 Problem Gambling Survey June 15, 2001
• Not paying credit card payments, bank loans, or other debits • Not purchasing food or groceries • Not paying income tax or property taxes • Not paying alimony or child support payments • Not being able to afford personal health care such as medication, dental or eye care • Any other problems � 1 • Any other problems � 2 • Any other problems � 3
SECTION 3: POPULATION HEALTH QUESTIONS Q42.Next we would like to ask you a few questions about your personal health. Please remember that all your responses will be kept strictly confidential. (Saskatchewan Health is also interested in determining the health status of respondents)---------------------------! NEXT SCREEN TO CONTINUE
Q42A – Q42O Q42. Right now, do you have any of the following health problems� (LIST) Yes ...........................................................................................................................1 No ............................................................................................................................2 Don�t Know .............................................................................................................8 Refused / No Response ............................................................................................9 LIST • Long term illness • Ongoing effects of an injury • Disability or handicap • Emotional problem • Difficulty seeing with or without glasses • Difficulty hearing with or without a hearing aid • Difficulty using both hands or all fingers • Learning disability • Problem with alcohol • Problem with drugs • Problems reading and writing • Difficulty walking or getting around • Persistent pain and discomfort • Psychological condition or emotional illness • Other health problems
Saskatchewan Health 14 Problem Gambling Survey June 15, 2001
Q43 Q43. In the last 12 months, how often did you drink beer, wine, liquor or other alcoholic beverages? Was it � (READ) everyday.................................................................................................................01 4-6 times/week .......................................................................................................02 2-3 times/week .......................................................................................................03 once/week ..............................................................................................................04 2-3 times/month .....................................................................................................05 once a month ..........................................................................................................06 Less than once a month..........................................................................................07 never in last 12 months ..........................................................................................00 Never drank alcoholic beverages ...........................................................................77 X => Q45 (DO NOT READ) Don�t Know .............................................................................88 X (DO NOT READ) Refused / No Response ............................................................99 X
Q44 Q44. How many drinks do you usually have on ONE OCCASION (one glass of wine, one bottle of beer, or 1 ½ oz. Of liquor is the equivalent of 1 drink)? (ENTER NUMBER OF DRINKS BELOW) $R 1 65 Do not drink alcohol ..............................................................................................77 X Don�t Know ...........................................................................................................88 X Refused / No Response ..........................................................................................99 X
Q45 Q45. In the last 12 months, how often did you use illegal drugs? Was it � (READ) Everyday ................................................................................................................01 4-6 times/week .......................................................................................................02 2-3 times/week .......................................................................................................03 once/week ..............................................................................................................04 2-3 times/month .....................................................................................................05 once a month ..........................................................................................................06 Less than once a month..........................................................................................07 never in past 12 months .........................................................................................00 Never used illegal drugs.........................................................................................77 X (DO NOT READ) Don�t Know .............................................................................88 X (DO NOT READ) Refused / No Response ............................................................99 X
Q46 Q46. During the past 12 months, was there ever a time when you felt sad, blue, or depressed for Two Weeks or more in a row? Yes ...........................................................................................................................1 No ............................................................................................................................2 => Q48 Don�t Know .............................................................................................................8 => Q48 Refused / No Response ............................................................................................9 => Q48
Saskatchewan Health 15 Problem Gambling Survey June 15, 2001
Q47 Q47. During this time, did you take medication or antidepressants? (PROMT: Did you take medication to help you deal with your sadness or feelings of depression?) Yes ...........................................................................................................................1 No ............................................................................................................................2 Don�t Know .............................................................................................................8 Refused / No Response ............................................................................................9
Q48 Q48. Have you ever seriously thought about committing suicide? Yes ...........................................................................................................................1 No ............................................................................................................................2 => Q50X Don�t Know .............................................................................................................8 Refused / No Response ............................................................................................9
Q49 Q49. Have you ever attempted suicide? Yes ...........................................................................................................................1 No ............................................................................................................................2 Don�t Know .............................................................................................................8 Refused / No Response ............................................................................................9
Q50X SECTION 4: DEMOGRAPHICS Q50X. We just have a few more questions left � they are just to confirm some basic background information. Like all your other answers, this information will be kept strictly confidential. ---------------------! NEXT SCREEN TO CONTINUE
Q51 Q51. In what year were you born? (ENTER FULL YEAR) $R 1900 1982 Don�t Know / Refused / No Response ...............................................................8888
Q52 Q52. What is your marital status? Single (never married) .............................................................................................1 Married.....................................................................................................................2 Common-law............................................................................................................3 Divorced or separated ..............................................................................................4 Widowed ..................................................................................................................5 (DO NOT READ) Don�t know................................................................................8 (DO NOT READ) Refused / No Response ..............................................................9
Saskatchewan Health 16 Problem Gambling Survey June 15, 2001
Q53 Q53. What is the highest level of education you have completed? No schooling ..........................................................................................................01 Some elementary school (Grades K-5) ..................................................................02 Completed elementary school (Grade 6)................................................................03 Some high school/junior high (Grades 7-11) .........................................................04 Completed high school (Grade 12 or 13) ...............................................................05 Some community college.......................................................................................06 Some technical school............................................................................................07 Completed community college (certificate, diploma) ............................................08 Completed technical school (certificate, diploma).................................................09 Some University.....................................................................................................10 Completed Bachelor�s Degree (Arts, Science, Engineering) .................................11 Completed Master�s degree: (MA, MSc, MLS, MSW) .........................................12 Completed Doctoral Degree: (PhD, EdD)..............................................................13 Professional Degree (Law, Medicine, Dentistry) ...................................................14 (DO NOT READ) Don�t know..............................................................................88 (DO NOT READ) Refused / No Response ............................................................99
Q54 Q54. In addition to being Canadian, to what other ethnic or cultural group do you belong? If you have multiple ethnic or cultural origins, which ONE do you identify with most. (READ FROM THE LIST TO PROMPT IF NECESSARY). -------------! PRESS F7 FOR ADDITIONAL HELP Aboriginal / First Nations / North American Indian / Metis / Inuit......................000 Austrian................................................................................................................001 Black ....................................................................................................................002 Belgian .................................................................................................................003 Bohemian .............................................................................................................004 Bulgarian..............................................................................................................005 Chilean .................................................................................................................006 Chinese.................................................................................................................007 Croatian................................................................................................................008 Czech ...................................................................................................................009 Danish ..................................................................................................................010 Dutch....................................................................................................................011 East Indian ...........................................................................................................012 English .................................................................................................................013 Filipino.................................................................................................................014 Finnish .................................................................................................................015 French ..................................................................................................................016 German.................................................................................................................017 Greek....................................................................................................................018 Hungarian.............................................................................................................019 Icelandic...............................................................................................................020 Indonesian............................................................................................................021 Iranian ..................................................................................................................022 Irish ......................................................................................................................023 Italian ...................................................................................................................024 Jamaican...............................................................................................................025 Japanese ...............................................................................................................026 Jewish...................................................................................................................027 Korean..................................................................................................................028 Laotian .................................................................................................................029
Saskatchewan Health 17 Problem Gambling Survey June 15, 2001
Latvian .................................................................................................................030 Lebanese ..............................................................................................................031 Mennonite ............................................................................................................032 Norwegian............................................................................................................033 Pakistani...............................................................................................................034 Peruvian ...............................................................................................................035 Polish ...................................................................................................................036 Romanian .............................................................................................................037 Russian.................................................................................................................038 Salvadorian ..........................................................................................................039 Scandinavian ........................................................................................................040 Scottish.................................................................................................................041 Serbian .................................................................................................................042 Slovakian .............................................................................................................043 Spanish.................................................................................................................044 Swedish................................................................................................................045 Trinidian...............................................................................................................046 Tobagan ...............................................................................................................047 Ukranian...............................................................................................................048 Vietnamese...........................................................................................................049 Welsh ...................................................................................................................050 West Indian ..........................................................................................................051 Yugoslavian .........................................................................................................052 Canadian ..............................................................................................................053 Other (SPECIFY).................................................................................................666 O (DO NOT READ) Don�t Know ...........................................................................888 X (DO NOT READ) Refused / No Response ..........................................................999 X
Q55 => /Q58 if NOT Q54=000 ASK ONLY IF “ABORIGINAL” CHOSEN IN Q54 Q55. Is your Aboriginal ancestry either� (READ) First Nations/North American Indian/Treaty/Status Indian ...................................01 Metis ......................................................................................................................02 Inuit ........................................................................................................................03 Other (SPECIFY)...................................................................................................66 O (DO NOT READ) Don�t Know .............................................................................88 X (DO NOT READ) Refused / No Response ............................................................99 X
Q56 => /+1 if NOT Q55=01 ASK ONLY IF NOT “First Nations/North American Indian” CHOSEN IN Q55 Q56. Are you� (READ) Treaty or status.........................................................................................................1 Non-status ................................................................................................................2 (DO NOT READ) Don�t Know ...............................................................................8 (DO NOT READ) Refused / No Response ..............................................................9
Saskatchewan Health 18 Problem Gambling Survey June 15, 2001
Q57 => /+1 if NOT Q54=WR & Q58=WR 57. Which of the following categories best describes your total household income before taxes in the last 12 months? (If �farm/self employed,� record amount after deducting operating expenses). Is it � (READ) less than $20,000....................................................................................................01 between $20,000 and $30,000 ($29,999.99) ..........................................................02 between $30,000 and $40,000................................................................................03 between $40,000 and $50,000................................................................................04 between $50,000 and $60,000................................................................................05 between $60,000 and $70,000................................................................................06 between $70,000 and $80,000................................................................................07 between $80,000 and $90,000................................................................................08 between $90,000 and $100,000..............................................................................09 between $100,000 and $120,000............................................................................10 between $120,000 and $150,000,...........................................................................11 More than $150,000 ...............................................................................................12 (DO NOT READ) Don�t Know .............................................................................88 (DO NOT READ) Refused / No Response ............................................................99
Q58 => /Q63 if NOT Q57=WR & NOT Q58=WR Q58. What is your present job status? Are you employed full-time, employed part-time, unemployed, a student, retired or a homemaker? (INTERVIEWER: IF RESPONDENT GIVES MORE THAN ONE ANSWER, RECORD THE ONE THAT APPEARS FIRST ON THE LIST) Employed full-time (30 or more hrs/week)............................................................01 Employed part-time (less than 30hrs/week)...........................................................02 Unemployed (out of work but looking for work)...................................................03 Student�employed part-time or full-time.............................................................04 Student�not employed..........................................................................................05 => Q60 Retired....................................................................................................................06 => Q60 Homemaker............................................................................................................07 => Q60 Other (SPECIFY)...................................................................................................66 O (DO NOT READ) Don�t Know .............................................................................88 => Q60 (DO NOT READ) Refused / No Response ............................................................99 => Q60
Q59 Q59. What type of work do you currently do (or, what do you do when you are employed)? (INTERVIEWER: IF NECESSARY, SAY �What is your job title?�) $R 0 5999 Occupation (SPECIFY)......................................................................................6688 O (DO NOT READ) Don�t Know .........................................................................8888 (DO NOT READ) Refused / No Response ........................................................9999
Saskatchewan Health 19 Problem Gambling Survey June 15, 2001
Q60 Q60. How many people under 19 years-of-age live with you? None.......................................................................................................................00 One.........................................................................................................................01 Two ........................................................................................................................02 Three ......................................................................................................................03 Four........................................................................................................................04 Five ........................................................................................................................05 Six ..........................................................................................................................06 seven or more.........................................................................................................07 Don�t Know ...........................................................................................................88 Refused / No Response ..........................................................................................99
Q61 RE-ADDED BEFORE PRE-TEST Q61. Do you live on� (READ) A farm......................................................................................................................1 => /Q57 An acreage ...............................................................................................................2 => /Q57 A reserve ..................................................................................................................3 => /Q57 A village or hamlet...................................................................................................5 => /Q57 A town or city ..........................................................................................................6 => /Q57 (DO NOT READ) Resort area .................................................................................4 => /Q57 (DO NOT READ) Don�t Know ...............................................................................8 => /Q57 (DO NOT READ) No Response ..............................................................................9 => /Q57
Q63 SECTION 5: COMPLETION INFORMATION Q63. This ends our survey. In the event that my supervisor wishes to verify this interview, may I please have your first name? (DO NOT RECORD JUST THEIR FIRST INITIAL IF POSSIBLE) (RECORD LAST NAME IF OFFERED ON FOLLOWING SCREEN). (ENTER �999� FOR REFUSAL)
RESPONDENT�S FIRST NAME
Q63A Q63A. RESPONDENT OFFERED LAST NAME? Yes ...........................................................................................................................1 No ............................................................................................................................2 => Q64
Q63B Q63B. ENTER LAST NAME BELOW
Q64 Q64. Saskatchewan Health may wish to conduct follow-up research on problem gambling issues sometime in the future. To do this, we may wish to speak to some people again. May we call you for a short follow up interview? Yes ...........................................................................................................................1 No ............................................................................................................................2 => Q66 Refused / No Response ............................................................................................8 => Q66
Saskatchewan Health 20 Problem Gambling Survey June 15, 2001
Q65 Q65. Is there another phone number where you can be reached? Yes ...........................................................................................................................1 No ............................................................................................................................2 => Q66 Refused / No Response ............................................................................................8 => Q66
Q65A Q65A. May I please have that other phone number? RECORD NUMBER IN THIS FORMAT: 306-555-5555 999-999-9999
Q66 Q66. We like to know whether we reach people from all areas of Saskatchewan. To do this, can we please have the first three characters of your postal code?
A9A Don�t Know .........................................................................................................888 Refused / No Response ........................................................................................999
Q67 END OF RESPONDENT QUESTIONS Q67. Thank you for helping us with this survey. Your responses are very important to us, and we do appreciate the time it has taken to answer our questions. (INTERVIEWER: PLEASE NOTE ANYTHING ABOUT THE RESPONDENT OR THE INTERVIEW SITUATION THAT SEEMS IMPORTANT TO INTERPRETING THE INFORMATION GIVEN) (INTERVIEWER COMMENTS ON RESPONDENT/INTERVIEW SITUATION (SPECIFY) 66 O No comments .........................................................................................................00 X
Q50 (RECORD GENDER: - DO NOT ASK UNLESS UNSURE) Q50. (DO NOT ASK UNLESS UNSURE) ---- Are you male or female? Male .........................................................................................................................1 Female......................................................................................................................2 Refused / No Response ............................................................................................9
GENDER INTERVIEWER DECLARATION INTERVIEWER READ & ENTER RESPONSE BELOW: I declare that this interview was conducted in accordance with the interviewing and sampling instructions given by Prairie Research Associates Inc. I Agree that the information given by the respondent will be kept confidential.
GENDER: Agreement with the above declaration ------ GO TO CALL STATUS PAGE & CODE AS COMPLETION1
Saskatchewan Health 21 Problem Gambling Survey June 15, 2001
F7 PROMPTS FOR QUESTION Q54 – RACIAL OR ETHNIC GROUP F7. IF THE RESPONDENT SAYS �CANADIAN� or �AMERICAN� SAY: �Most Canadians/Americans have some other racial or ethnic origin, even if it is from many generations ago. Thinking about this, would you say you are:� REFER TO LIST AGAIN (Q54) PUTTING �Canadian� or �American� AFTER EACH RESPONSE (e.g. Chinese-Canadian).
-----------------! PRESS ENTER TO RETURN TO Q54
F8 ADDITIONAL HELP SCREEN If you have any questions about the survey, you can phone toll-free the Study Supervisor, Kerry Dangerfield of Prairie Research in Winnipeg at 1-888-877-6744 for further information.
PRESS ENTER TO RETURN TO SURVEY

APPENDIX B CALL RECORD
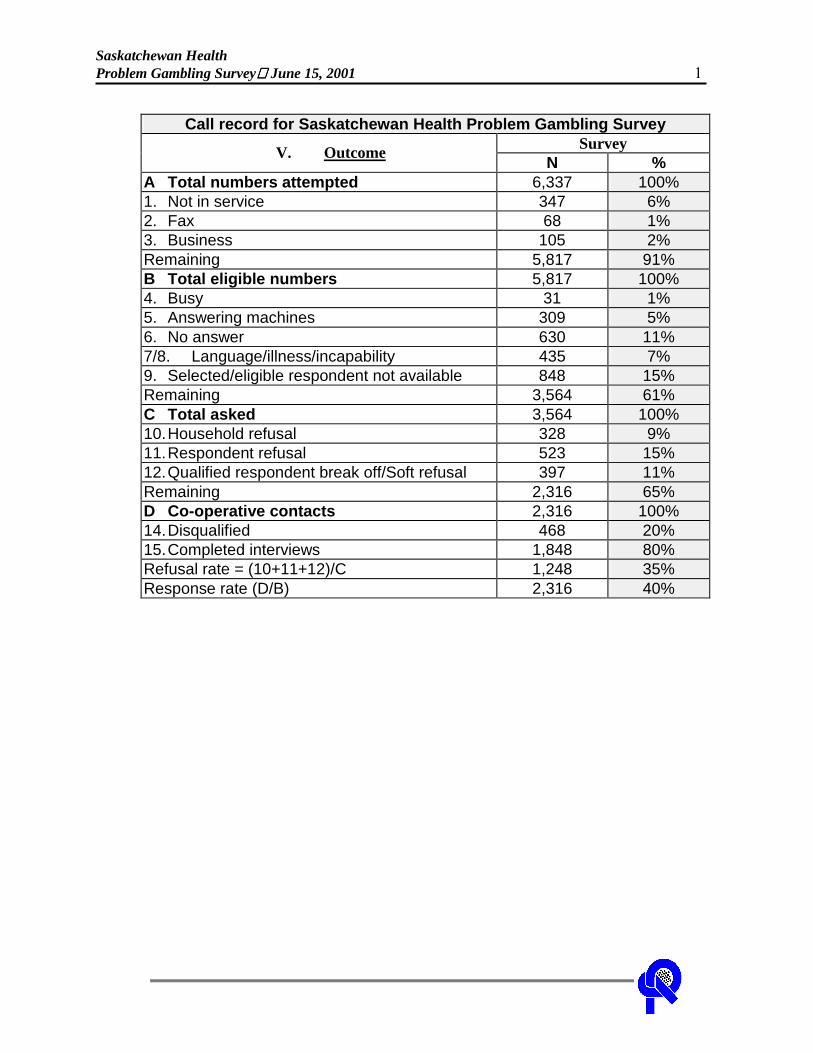
Saskatchewan Health Problem Gambling Survey June 15, 2001 1
Call record for Saskatchewan Health Problem Gambling Survey
Survey V. Outcome N % A Total numbers attempted 6,337 100% 1. Not in service 347 6% 2. Fax 68 1% 3. Business 105 2% Remaining 5,817 91% B Total eligible numbers 5,817 100% 4. Busy 31 1% 5. Answering machines 309 5% 6. No answer 630 11% 7/8. Language/illness/incapability 435 7% 9. Selected/eligible respondent not available 848 15% Remaining 3,564 61% C Total asked 3,564 100% 10. Household refusal 328 9% 11. Respondent refusal 523 15% 12. Qualified respondent break off/Soft refusal 397 11% Remaining 2,316 65% D Co-operative contacts 2,316 100% 14. Disqualified 468 20% 15. Completed interviews 1,848 80% Refusal rate = (10+11+12)/C 1,248 35% Response rate (D/B) 2,316 40%
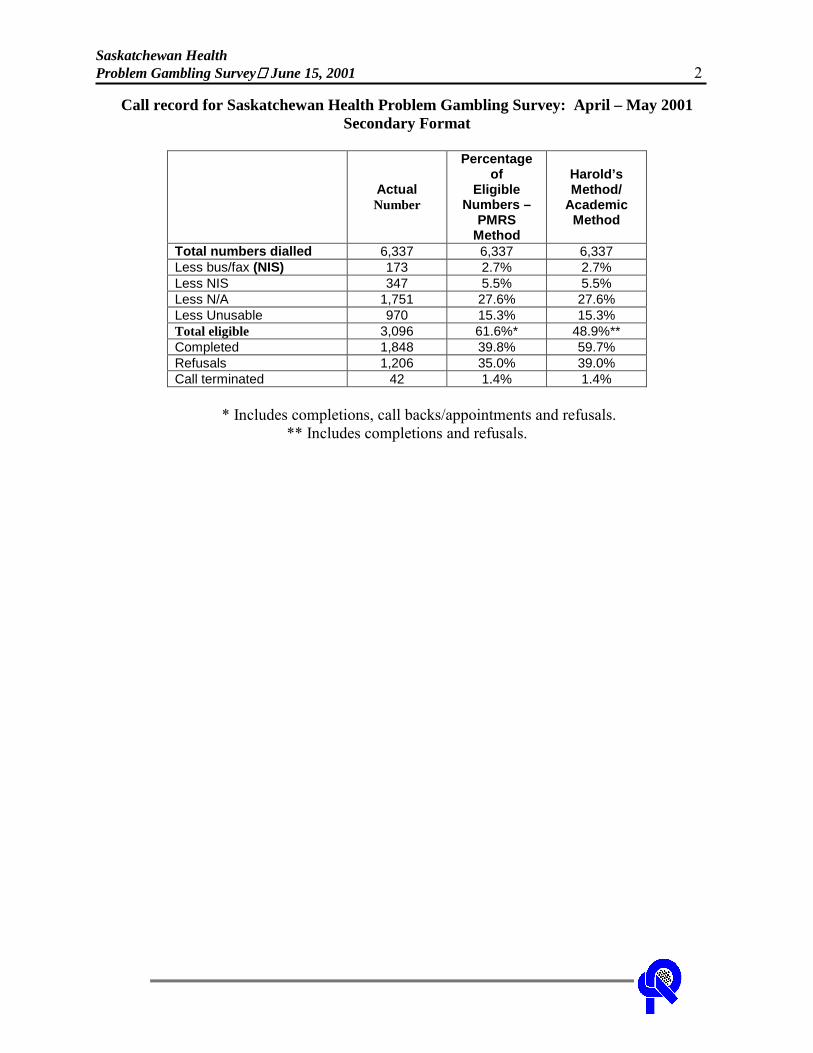
Saskatchewan Health Problem Gambling Survey June 15, 2001 2
Call record for Saskatchewan Health Problem Gambling Survey: April – May 2001 Secondary Format
Actual Number
Percentage of
Eligible Numbers –
PMRS Method
Harold’s Method/
Academic Method
Total numbers dialled 6,337 6,337 6,337 Less bus/fax (NIS) 173 2.7% 2.7% Less NIS 347 5.5% 5.5% Less N/A 1,751 27.6% 27.6% Less Unusable 970 15.3% 15.3% Total eligible 3,096 61.6%* 48.9%** Completed 1,848 39.8% 59.7% Refusals 1,206 35.0% 39.0% Call terminated 42 1.4% 1.4%
* Includes completions, call backs/appointments and refusals.
** Includes completions and refusals.