the existence and persistence of a winner’s curse: new...
TRANSCRIPT
†Associate Professor of Economics, Loyola College in Maryland, Baltimore, MD 21210;Phone: 410-617-5831; E-mail: [email protected].
††Professor of Economics, Loyola College in Maryland, Baltimore, MD 21210; Phone:410-617-2313; E-mail: swalters@ [email protected].
Working Paper Series, Paper No. 06-25
The Existence and Persistence of a Winner’s Curse: New Evidence from the (Baseball) Field
John D. Burger† and Stephen J.K. Walters††
October 2006 (Revised: July 2007)
AbstractThis study takes advantage of recent developments in the measurement and valuation of
individual output in the baseball labor market to (i) reassess prior evidence that this market isafflicted by the winner’s curse phenomenon and (ii) test whether bidders learn to avoid this curseover time. Though we find no evidence of negative average returns on player contracts for theearliest cohort of baseball free agents, we conclude that teams in that era failed to efficientlydiscount their bids in accord with available information, especially about risk. What is more,evidence from a larger sample of players signed in the late 1990s shows that teams havecontinued to overvalue inconsistent free agents and failed to limit their bids to conform toplayers’ lower values in small markets. This is consistent with experimental evidence that findsbounded-rational behavior when bidders are faced with complex valuation problems involvingmultiple elements.
JEL Classification Codes: D44, D81, J41, C93
Keywords: fairness, efficiency wages, wage differentials
*The authors gratefully acknowledge the assistance of John Fizel, participants at the 2006Western Economic Association International Conference, two anonymous referees, and editorJulie Hotchkiss, whose efforts greatly improved this manuscript. Burger acknowledgessabbatical support from the Sellinger School of Business and Management at Loyola College inMaryland. Capable research assistance was provided by Louis Miserendino and John Walters;the usual disclaimers apply.
2
The Existence and Persistence of a Winner’s Curse:
New Evidence from the (Baseball) Field
Abstract: This study takes advantage of recent developments in the measurement and
valuation of individual output in the baseball labor market to (i) reassess prior evidence
that this market is afflicted by the winner’s curse phenomenon and (ii) test whether
bidders learn to avoid this curse over time. Though we find no evidence of negative
average returns on player contracts for the earliest cohort of baseball free agents, we
conclude that teams in that era failed to efficiently discount their bids in accord with
available information, especially about risk. What is more, evidence from a larger
sample of players signed in the late 1990s shows that teams have continued to overvalue
inconsistent free agents and failed to limit their bids to conform to players’ lower values
in small markets. This is consistent with experimental evidence that finds bounded-
rational behavior when bidders are faced with complex valuation problems involving
multiple elements.

3
1. Introduction
In controlled experiments, bidders at auction often fall prey to a winner’s curse, failing to
consider factors conducive to overbidding and thus earning disappointing or even negative
returns. What is more, this curse appears to be persistent, disappearing slowly (if at all) when
experiments are structured to allow subjects to learn from past auction outcomes and modify
their bidding behavior.1
Evidence of a winner’s curse in naturally-occurring markets is less common because of
data availability problems, and is less robust because there are often alternative explanations for
apparent overbidding. For example, Capen, Clapp, and Campbell (1971) found overbidding and
low returns on federal auctions of offshore oil leases, but Hendricks and Porter (1988) concluded
that the pattern of bids on such leases was consistent with rational behavior in the presence of
asymmetric information. In the corporate takeover market, the suggestion by Roll (1986) that
hubris causes acquiring firms to ignore curse considerations and overpay for target firms has
been supported by Varaiya (1988), but in the market for initial public offerings of common stock
there is evidence that investors are aware of a curse and compensated for it (Koh and Walter
1989; Levis 1990).
Some of the field evidence on overbidding comes from the baseball labor market, where
detailed performance data enable accurate ex post evaluations of returns on player contracts. The
first such study, by Cassing and Douglas (1980), concluded that the majority of free agent
players signed in the late 1970s2 yielded negative returns for teams—specifically, that these
players were paid 20 percent more than their estimated marginal revenue products (MRPs).
Follow-up studies have muddied the waters a bit. Evidence consistent with a curse has come
from Zimbalist (1992, p. 128), who claimed that free agents’ salaries exceeded their MRPs by as
4
much as 40 percent during the late 1980s, and Kahn (1993, p. 163), who interpreted free agents’
increased contract duration as an indication of supra-competitive compensation. On the other
hand, Sommers and Quinton (1982), Raimondo (1983), and MacDonald and Reynolds (1994)
concluded that free agents’ salaries generally were commensurate with their MRPs rather than
significantly above them. Despite this apparent empirical draw, it is common to name the
baseball labor market as one afflicted by a winner’s curse in textbook discussions of the topic
and in surveys of the theoretical and empirical literature on it.3
Even if all the evidence from the baseball labor market pointed to the same conclusion,
however, it would be desirable to revisit this issue because of recent advances in both the
precision with which individual output in this market can be measured and the methods by which
that output is valued. Baseball statistics have long been part of the appeal of the game for fans
and tools for decision makers, and in recent years the data available for performance analysis
have been improved significantly. In valuing players, it is no longer necessary to rely on rough
approximations of individual players’ marginal products (often based on regressions that
correlated team success with a few summary measures of hitting or pitching efficiency4), as
many early studies of free agents’ salaries did. What is more, recent research on pay and
performance in the industry makes clear that attaching value to individual players’ output is more
complex than previously thought. In particular, the finding by Burger and Walters (2003) and
Solow and Krautmann (2007) that players’ MRPs are affected by the size of the market in which
they play—and not uniform across teams, as is commonly assumed—means that prior judgments
about overbidding may be erroneous because they are based on comparisons of players’ salaries
to misestimated MRPs.5
5
These advances suggest another important reason to evaluate the bidding for baseball free
agents: Even if there are signs of a curse in free agency’s early days, it is possible that
experience or improvements in the tools used in formulating bids may lead to better decisions
over time. The sport’s free agent market has been in operation for three decades and the bidding
organizations have been constant over that period (though, of course, many executives within
those organizations have come and gone), providing a wonderful opportunity to assess whether
those who fall prey to a curse learn to avoid it or not; nevertheless, the question of persistence of
a winner’s curse in baseball has never been addressed properly.6
Accordingly, in this study we both revisit the era from which the earlier evidence of a
curse arose and examine a more recent cohort of free agents to learn whether bidder behavior has
changed over time. Though we do not find the sort of gross overbidding (i.e., negative average
returns) claimed in some prior studies, we do find evidence that bidders in the late ‘70s
systematically failed to properly adjust their bids in accord with available information, especially
about risk. Further—and somewhat surprisingly7—the passage of decades has not eliminated
these errors, which remain for a large sample of free agent contracts signed in the late ‘90s and
recently concluded. These findings highlight the difficulty of making efficient decisions in a
competitive, high-stakes environment when the elements influencing an asset’s value are many,
complex, and volatile. Our results are broadly consistent with experimental evidence on
bounded rationality, and should prove of interest not just to labor and sports economists but to all
those interested in the burgeoning fields of behavioral economics and finance.
2. Methodology
Tests for Average Realized Returns

6
In a full-information, competitive equilibrium, a profit-maximizing team ought to pay a
player a wage (w) no more than his expected MRP, which equals his expected marginal physical
product times its value in the team’s market. In an auction setting, efficient bidders will adjust
their estimates of a good’s expected value in light of signals from the market—e.g., the number
of bidders and/or measures of the variance in their valuations. Given the practical difficulties of
modeling bidders’ expectations-formation process and the lack of data about signals available to
them during this process, it is customary to perform an ex post examination of winning bids as a
basic, “first-pass” test of their efficiency. In effect, if bidders are avoiding systematic errors in
forming their expectations about an asset’s value and/or in adjusting their bids for risk and
uncertainty, a necessary (though not sufficient) condition for efficient bidding is that, on average,
w ≤ realized MRP and average realized returns ≥ zero.
The method commonly used to measure a player’s MRP originated with Scully (1974),
though subsequent research has greatly refined its precision.8 The process involves two steps:
(1) econometrically estimating the relationship between a team’s output of wins (which may be a
proxy for the quality of the spectacle fans are consuming) and its revenue in order to obtain the
marginal revenue associated with each extra win; (2) multiplying this marginal win value
(MWV) by the player’s marginal output of wins.
As noted earlier, recent research by Burger and Walters (2003) and Solow and
Krautmann (2007) has shown that MWVs are a positive function of the size of a team’s
particular market—i.e., market size affects both the intercept and slope of a team’s revenue
function, so a given level of individual output will have greater value in large markets than in
small ones. The failure to recognize this fact is a major deficiency of earlier studies of
overbidding in baseball; almost all, therefore, are based on estimated MRPs which are
7
erroneous—likely too small for players signed by large-market teams and too large for players
on small-market teams. The direction of any bias in results is unclear, and will depend on
whether a particular year’s auction involves disproportionate participation by large- or small-
market teams. What is more, ignoring the effect of market size on players’ MRPs means that
prior researchers have overlooked an important question related to the rationality of bidders: do
they properly adjust their bids for this source of variation in value?
Accordingly, we have estimated team-specific revenue functions and MWVs for the early
1980s and the late 1990s. (For a detailed discussion of the sources and any limitations of the
data employed throughout this study, see the Appendix.) We employ the former (in Section 3) to
re-assess returns on contracts in the first few years of the free agency system in the late 1970s;
the latter are used (in Section 4) to gauge returns on free agent contracts which were signed prior
to the 1998 and 1999 seasons and which all have run their course.
For both eras, we used pooled time-series and cross-sectional data to estimate the
requisite team revenue functions. For the early ‘80s regressions, the dependent variable was total
revenue for team i in year t; in the later period, when revenue sharing led to different slopes for
teams’ total and locally-generated revenue functions, the dependent variable was local revenue.
For both eras, the independent variables of prime interest (given the need for market-specific
MWVs) were:
POPit, the population in team i’s Consolidated Metropolitan Statistical Area (CMSA)9 in
year t;
WINSit, team i’s win total in year t;
POPWINSit, an interaction term, population times wins for team i in year t.
8
We also included two control variables: a dummy variable indicating whether a team played in a
stadium constructed within a decade of year t (since enhanced facilities commonly shift the
revenue function), and a stadium age variable to allow for decay in the stadium’s effect on
revenue.
In addition, we tested specifications with a variety of additional explanatory variables—
including lagged team wins, a dummy variable for post-season participation in year t-1, and
nonlinear revenue models. These alternative specifications exhibited little variation in overall
explanatory power and estimated MWVs. Table 1 displays the regression coefficients for the
key independent variables and resulting MWVs in two sample markets for each of the eras.10
<< Insert Table 1 about here >>
The effect of market size on teams’ marginal revenue is relatively weak for the early
sample. For example, in 1982—the midpoint of our revenue data for the early free agent era—
we estimate that each extra win added $316,000 to revenue in New York and $241,000 in
Toronto (the median-sized market) in 1982 dollars. This ratio increased significantly in the late
‘90s, by which time an extra win was worth $2.53 million (1998 dollars) in New York (net of
revenue-sharing) and $1.01 million in the median market (Florida). To date, no other studies
have assessed whether these sizeable inter-team and inter-temporal variances in values have
made it harder for teams to avoid overbidding.
Given these estimates of teams’ MWVs, we employ measures of each free agent’s annual
output of marginal wins over the life of his contract to calculate his MRP and compare it to his
contract cost. Prior studies of the returns on free agent contracts have tended to look only at
player performance for a single year or at average annual performance over an entire career,
which can yield misleading conclusions given that (a) individual productivity—thanks to
9
injuries, “slumps,” etc.—is so highly variable and (b) even a period covered by a multi-year
contract may not conform to lifetime averages. What is more, prior studies have tended to look
at fragments of a player’s prospective contribution to output, such as slugging percentage for
position players and strikeout-to-walk ratios for pitchers.11 Instead, we rely on an aggregate
measure of player output (developed by the expert baseball statisticians who publish the annual
compendium Baseball Prospectus) that includes all possible means by which a player may
produce marginal wins via batting, fielding, base-running, or pitching. Specifically, we use their
“wins above a replacement-caliber player” (WARP) measure of each player’s marginal
productivity in wins per year.12 In essence, the WARP measure recognizes that team wins are a
function of runs created and prevented; it quantifies the myriad ways (homeruns, stolen bases,
stellar fielding plays, effective pitching, etc.) in which players either create or prevent runs and
aggregates these measures into precise estimates of a player’s contribution to his team’s win total
(relative to a marginal player).
As one example of the extent to which earlier studies used methods that produced suspect
valuations, consider the judgment by Cassing and Douglas (1980, p. 116) that the $806,250 per
year, four-year contract to which the Philadelphia Phillies signed Pete Rose in 1979 represented
a huge overpayment. Cassing and Douglas calculated Rose’s annual MRP as a mere $411,698
based on his lifetime slugging average of .433. In the case of a multi-faceted player like Rose,
however, slugging performance is a poor proxy for total contribution to team output. By the
WARP measure, Rose produced 5.5 marginal wins per year over the life of this contract. What
is more, Philadelphia is a larger-than-average market; we estimate the annual value of those wins
at $1.11 million in that market. So, even apart from any revenue realized because of Rose’s “star
10
appeal”—which all our MRP estimates conservatively omit—we find no evidence of negative
realized returns on this particular player.
Other Behavioral Tests for Overbidding
If negative realized returns on winning bids might clearly indicate the presence of a
winner’s curse, positive returns are not, in general, sufficient to rule it out. Efficient bidders
should anticipate and correct for the winner’s adverse selection problem, and curse-adjusted bids
may involve substantial discounts below non-curse-adjusted valuations. Thus, it is certainly
possible for a winner’s curse to deliver below-equilibrium returns without yielding negative
returns.13
Accordingly, we also test whether bidders efficiently used other information available to
them when formulating their salary offers by constructing a simple model of each free agent’s
expected productivity and correlating this with the winning bid for his services. Specifically, for
both data samples we regressed the average annual salary paid to each free agent by the winning
bidder on the following explanatory variables (where available and relevant):
TREND, to control for general salary inflation over time;
WARPAVGj, player j’s average annual output of marginal wins, measured by WARP,
over the three seasons prior to signing the free agent contract;
WARPVARj, the variance in player j’s WARP over the three seasons prior to signing the
contract;
AGEj, player j’s age in the first year of the free agent contract;
EXPj, the number of years of major league experience for player j in the first year of his
free agent contract;
11
BIDDERSj, the number of teams that drafted player j and were eligible to bid for his
services (a variable that is available only for the earlier cohort of free agents, since the “free
agent draft” was eliminated in a later collective bargaining agreement);
POP, the size of the winning bidder’s market, proxied by population in its CMSA;
TEAMCHANGE, a dummy variable that equals 1 if the free agent signed a contract with a
new team (a variable that is relevant only for the latter cohort of free agents, since all players in
the earlier era changed teams).
This model posits that the winning bid for player j should, while controlling for his age
and experience level, be a positive function of his expected productivity (proxied by
WARPAVGj). Of interest is whether there is evidence that this bid is appropriately adjusted for
prior variance in player j’s performance (WARPVARj), information about the extent of
competition for his services (BIDDERSj), the size of the bidder’s market (POP), and the
possibility of asymmetric information (TEAMCHANGE).
The expected effects of the latter two variables are straightforward. Teams in more
populous markets should be willing to bid more for any expected level of output because it will
generate more marginal revenue for them. On the other hand, a prospective “new team” should
bid more cautiously for a player because, ceteris paribus, his current employer likely has more
information about his health, motivation, etc. Accordingly, the expected sign on POP is positive
and that on TEAMCHANGE is negative.
The possible effect of BIDDERSj is more complicated to sort out. It is customary to
assume that a player’s physical productivity will not differ across teams (i.e., there are negligible
complementarities in production in baseball, so a player’s output for team A is likely to be the
same for B, C, etc.). The aforementioned time variance in individual productivity means that
12
this component of value is likely to be uniform across bidders but uncertain. However, given
that teams’ MWVs are market specific, each team’s valuation of that output will be different.
Baseball’s annual free agent bazaar thus has elements of both a common- and private-value
auction, and is best described—using Milgrom and Weber’s (1982) terminology—as an affiliated
value auction. In consequence, it will be impossible to say, a priori, how teams should adjust
their bids from their estimates of a player’s expected MRP in light of information about the
number of other bidders. In a pure common-value auction, an increase in the number of bidders
n should lead to more cautious bidding behavior (because as n rises the expected amount by
which the highest estimate of future productivity exceeds the true value also rises). In a private-
value auction, however, the reverse is true (because as n rises so does the expectation of the
value of the next-highest valuing bidder). Which effect will dominate is an empirical question,
and in Section 3 we offer some evidence on that score.
Greater variance in a player’s prior performance (WARPVARj) should increase expected
variance in bidders’ valuations and therefore should lead to more cautious bidding in both
common- and private-value auctions. In the former, greater variance increases the expected
amount by which the highest value will exceed the true value, so rational bidders should adjust
their bids downward. In the latter, where the goal is simply to exceed the next-highest bidder’s
valuation, greater variance increases the expected gap between valuations and similarly suggests
downward adjustment of bids. We therefore expect a negative sign on WARPVARj. The only
contrary suggestion—that high-variance workers will earn a wage premium for their “upside
potential”—has come from Lazear (1998). The argument here is that employers may value
“high ceiling” workers because the upper tail of the productivity distribution can be retained and
the lower tail discarded, so variance or risk creates option value in a particular worker. Bollinger
13
and Hotchkiss (2003) have found support for this theory in the baseball labor market, but only
among players ineligible for free agency; they make clear that the necessary conditions for this
effect do not apply to free agents. Indeed, free agents’ contracts are both sizeable and
guaranteed, so discarding under-performers is very costly. Consistency should be highly valued
among available free agents.
3. Did Teams Realize Negative Returns on Free Agents in the Late 1970s?
As we have already noted, Cassing and Douglas (1980) concluded that there was gross
overbidding on free agents signed over the period 1975-’80. When we use superior measures of
individual productivity and market-size-specific MWVs to quantify players MRPs over the full
lives of these contracts, however, we find sizable positive returns on the average free agent
signed during this era.
Recall that our revenue function for the early period is estimated using data from 1980-
’84, but we wish to assess the free agent signings during the 1975-’80 period. We resolve this
timing mismatch by estimating a time-varying MWV index. The index is constructed using
Scully’s (1974) estimates of MWVs in 1969 as the initial benchmark, our own estimate of 1982
MWVs as a second benchmark, and assuming a constant growth rate of MWVs between the two
benchmarks. Team revenues in these years grew far more rapidly than general inflation, and
merely using the CPI to adjust MWVs (as Cassing and Douglas did) likely produces biased
estimates; in this case, had we deflated via the CPI, our estimated MWVs would probably be too
high for the relevant period, biasing our tests against rejecting a null hypothesis of efficient (w ≤
MRP) bidding.
<<Insert Table 2 about here >>

14
The first two rows of Table 2 display the results of our ex post analysis of the 44
contracts analyzed by Cassing and Douglas (C&D) as well as a larger sample that includes 16
additional free agents for whom we were able to obtain contract information when we searched
secondary sources to check the accuracy of C&D’s reported salary figures. Sorting contracts
into those for which the player’s MRP exceeded his salary over the life of the contract (a “win”
for his employer) and those for which salary exceeded MRP (a “loss”), we find that teams won
34 of 44 contests. By contrast, C&D reported a win-loss record of 16-28. What is more, the
aggregate return to bidders in the free agent market over this period exceeded 70 percent using
the C&D sample (they reported -20 percent), and exceeded 50 percent using the augmented
sample (which included contracts for some free agents of more marginal quality).
In retrospect, our results probably should not be surprising. Scully (1974, p. 929)
estimated that before players won limited free agency in arbitration (and greatly reduced teams’
monopsony power) star players received a mere 15 percent of their MRPs as salary. What would
have been truly astounding is the scenario envisaged by C&D—that within a few years of the
onset of free agency, expectations about the value of players adjusted upward so rapidly that not
only were salaries commensurate with MRPs, but far above them. In point of fact, players and
fans were a bit surprised by the rapid escalation of salaries post-free agency, and relatively few
players tested the waters of the open market. Even if team owners might have had a good idea
about how much MRPs exceeded salaries in the earlier reserve-clause era, they found that they
could retain the bulk of their best players at reasonable salaries and really didn’t need to bid
aggressively for free agents—at least for a while.
In that regard, some hints of changing market conditions emerge when we divide the
1975-’80 period in half. Aggregate returns on free agent contracts are 77 percent in the first
15
subsample period (1975-’77), dropping to 46 percent in the second (1978-’80), and the number
of free agents available is far higher in the second subsample. This is quite consistent with the
notion that this was a transition era for baseball salaries, and while negative average realized
returns were not present (contrary to C&D), the falling rates of return on free agent contracts
suggest at least a possibility that this could change over time.
<<Insert Table 3 about here>>
The presence of positive realized returns is (as discussed in Section 2) a necessary but
insufficient condition for rejecting the winner’s curse. More sophisticated tests of the efficiency
of bidding in the early era of free agency are contained in the salary regressions presented in
Table 3, which displays regression results for our entire sample of late ’70s free agents alongside
results for the sub-sample used by C&D. The basic controls for past player productivity
(WARPAVG), age, and experience all have the expected signs and are generally highly
statistically significant; ceteris paribus, winning bidders properly paid more for more productive
and experienced players, and less for merely older ones. Of greater interest, however, are the
impacts of the number of bidders, past variance of player productivity, and bidders’ market size.
The positive and significant coefficient on BIDDERS in both samples, which might signal
a failure to adjust bids for a winner’s curse in a pure common-value auction, here suggests the
dominance of private components of value. Given that bidders’ valuations of free agents will
vary with market size, teams must adjust their bids upward in the presence of more bidders to
ensure that they outbid the next biggest market, and apparently did so.
The coefficient on POP is positive but weakly significant in the total sample and
insignificant in the C&D sample. This might suggest that while bidders in this early era
understood the positive correlation between market size and player value and generally adjusted
16
bids in the appropriate direction, they may have had difficulty making market-specific bid
adjustments of the right size. Referring once again to Table 2, we note that for late ‘70s free
agents aggregate returns were slightly lower in below-median-sized markets (51 percent) than in
larger ones (58 percent). This issue will merit close examination in the later era.
The coefficients on WARPVAR in Table 3 are positive and significant in both samples.
This suggests that bidders in this era failed to adjust bids downward for high-risk, inconsistent
players. In the winner’s curse literature, it is common to say that overbidding is a result of the
fact that the winning bidder is the one who is most overoptimistic about the good’s true value
(and, of course, that bidder’s failure to make appropriate adjustments for this possibility). A
failure to discount for inconsistency—and, in fact, to pay a premium for it—certainly appears
consistent with excessive optimism. In essence, the positive coefficients on WARPAVG show
that teams in this era looked at a free agent’s recent performance in forming expectations about
his future value, but the positive coefficients on WARPVAR suggest that they may have over-
weighted his good years and under-weighted bad ones in formulating their bids.
The generally high aggregate rates of return on late ‘70s free agent contracts suggest this
“over-optimism bias” might not have been quantitatively significant during this early period.
But when coupled with the aforementioned hints of declining returns over time, its existence is
consistent with the suggestion by Blecherman and Camerer (1996, p. 10) that collusion by
owners to hold down free agent salaries during the 1980s might have been curse-related, since
pooling information and limiting the number of bidders can mitigate a curse in experimental
settings. Of course, collusion is a way to higher profits even absent curse-related complications,
but this evidence means we cannot rule out the possibility that owners might have had at least
one alternative motive for their market-rigging efforts in the ’80s.
17
4. Are Teams Victims of a Winner’s Curse Now?
By the 1990s, baseball industry revenues had been growing rapidly for many years, team
owners had been spanked with a large penalty for their collusive behavior in the previous
decade,14 and free agency was an established part of the sport’s landscape. Had higher stakes in
the free agent market and the unavailability of “cooperative” solutions to bidding problems
yielded overbidding and/or exacerbated other curse-related phenomena, or had teams learned to
avoid such problems? The final column of Table 2 contains some interesting answers.15
We find sizeable differences between results for this cohort of 203 free agents and the
earlier-era players. First, teams no longer win the great majority of their bets on free agents. In
Table 2 we report a win-loss record of 95-108 in this later era, although a sign test fails to reject
the null hypothesis of a 50-50 split or better. Further, aggregate returns on these contracts were
depressed relative to the 1970s, though non-negative. With an estimated average return of 3.28
percent we fail to reject the null hypothesis of aggregate MRP ≥ Salary.
While there is no evidence of negative average returns for this entire cohort, a different
picture emerges when the sample is divided into large- and small-market bidders (i.e., teams in
above- and below-median-population CMSAs). Teams in large markets won 58 of 102 bets on
free agents, but those in small markets won only 37 of 101. We estimate small-market teams’
aggregate returns on free agent contracts at roughly -29 percent, a significantly negative figure.
In other words, there are signs that small-market teams systematically failed to limit their bids to
conform to free agents’ diminished value in such markets.
<<Insert Table 4 about here >>
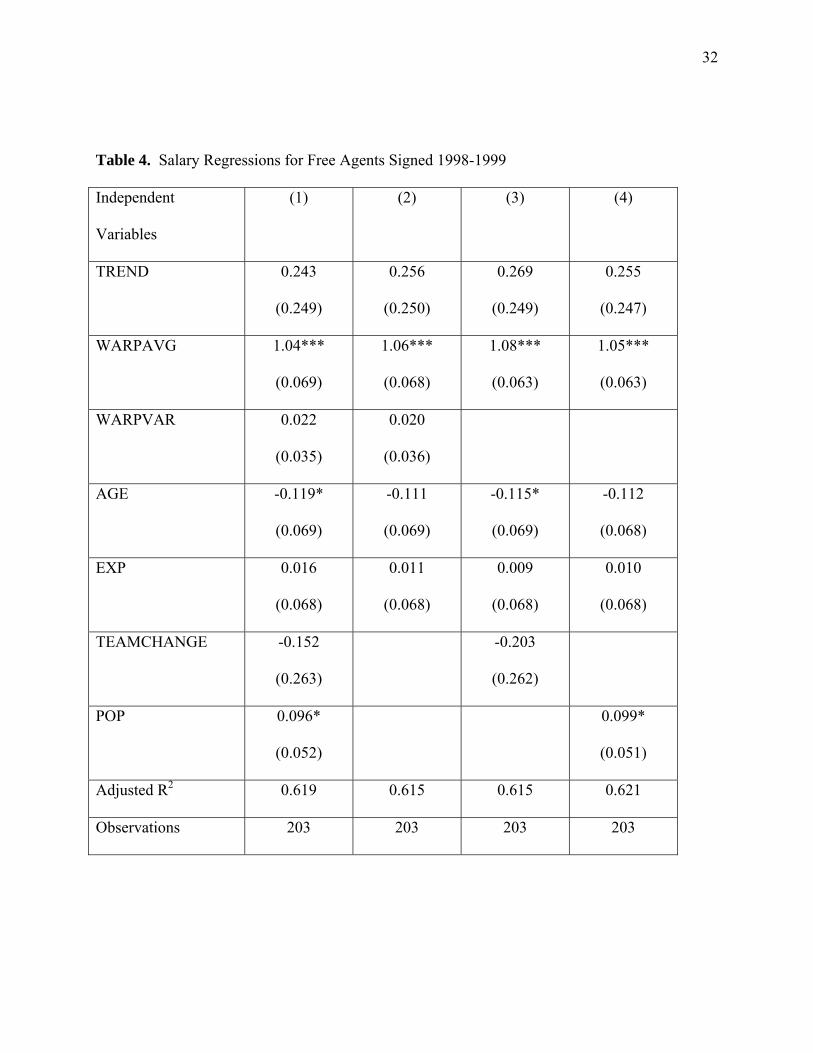
18
The salary equations presented in Table 4 also suggest that teams did not use available
information efficiently when they formulated their bids. Coefficients on the basic expectations-
formation and control variables (TREND, WARPAVG, AGE, EXP) have expected signs and are
consistent with appropriate bidder conduct in all specifications. However, the coefficients on
WARPVAR are positive, just as in the earlier era (though they are now insignificantly different
from zero). Teams should have reduced their bids for risky, inconsistent players rather than
increasing them (or ignoring inconsistency entirely); it appears that teams continued to over-
weight good years and fall victim to over-optimism bias.
The coefficients on POP are positive and weakly statistically significant. When coupled
with the evidence of negative returns for small-market teams summarized in Table 2 and
discussed above, it seems reasonable to conclude that teams in this era continued to adjust their
bids in the right direction for market size but had difficulty making adjustments of the proper
size. We speculate that this might be a by-product of the industry’s rapidly-changing revenue
environment. When industry revenue growth is high (and volatile), as it has been in major
league baseball in recent years, sorting out the various influences on firm revenue will be a
complex task. On occasion, therefore, it will be tempting to ascribe to one’s own conduct or
market characteristics some revenue growth that results from more general factors (possibly
manifesting “false uniqueness bias”).
Finally, the estimated coefficients on TEAMCHANGE are negative but insignificant.
This may signal that asymmetric information problems are negligible in the free agent market.
Perhaps, thanks to intensive scouting and exchanges of medical reports, etc., bidders know just
as much about free agents as their former employers do. It is also possible, however, that teams
failed to make proper adjustments for information asymmetries. One way to shed light on this
19
issue is to split the sample and compare returns on free agents who switched teams to those who
did not. The last two rows of Table 2 show the results: teams acquiring free agents from other
rosters suffered inferior win-loss records and lower returns relative to free agents that remained
with their initial team. There are, of course, a number of possible explanations for the generally
lower returns to players who switched teams (e.g., that players who chose not to move were
willing to play for a “home town discount” in exchange for the stability and security of a familiar
environment). Nevertheless, the possibility that teams failed to discount their bids for this
element of risk—an information deficit relative to at least one other bidder—cannot be ignored.
5. Summary and Concluding Remarks
This fresh inquiry into a possible winner’s curse in the market for baseball free agents
leads to some provocative, if tentative, conclusions. Unlike Cassing and Douglas (1980) and
some others, we find no evidence that winners in this auction, on average, actually lost money
(which might be called a “strong form” curse) on their investments during the early years of free
agency in the late 1970s. During that era, the average free agent’s MRP exceeded his salary by a
comfortable margin. Nevertheless, even in this cohort there are indications that winning bidders
failed to use all available information in formulating efficient bids, suggesting that their returns
might have proven disappointing (or were the result of a “weak form” curse). In particular,
teams over-valued risky free agents, failing to discount their bids for prior variance in
performance in an environment where consistency and dependability should be highly valued.
Our examination of a later and larger cohort of free agents, all of whom signed contracts
in the late ‘90s, provides further evidence consistent with a weak-form curse. Though average
salaries roughly equaled these players’ MRPs, realized returns fell sharply relative to those in the
20
earlier era and the likelihood that the winning bidder would lose money on a contract increased
(though aggregate team win-loss records were not statistically different from a 50-50 split). In
addition, we find that bidders continued to have difficulty efficiently adjusting their bids for
available information. Despite two decades of experience making large bets on outcomes in the
free agent market, winning bidders continued to fail to discount their bids for inconsistency/risk.
What is more, small-city teams failed to limit their bids to levels consistent with players’ MRPs
in their markets; teams in below-median-sized markets actually lost money, on average, on the
contracts they signed in this later era. Finally, lower realized returns on free agents who
switched teams might signal that their new employers ignored a possible information asymmetry
in this market, failing to discount their bids for this source of risk.
These findings support considerable experimental evidence that when bidders are faced
with a complex problem involving multiple elements affecting valuations, their behavior is often
consistent with bounded rationality.16 Of particular note is the persistence of the bidding
inefficiencies we have identified. Though the stakes in this market are high and considerable
resources have been devoted to making better decisions over the decades of free agency in major
league baseball, teams evidently have not learned how to avoid earning returns that must be
disappointing to them, perhaps because of some biases (e.g., over-optimism, false uniqueness)
that are simply difficult to shed.
It is possible to argue, of course, that this field evidence simply reflects that teams are not
particularly concerned about efficiency—i.e., that sports franchises are the playthings of owners
who care more about winning trophies than earning profits. We can’t rule this hypothesis out, at
least in some cases, but we would note that the desire to win is not entirely inconsistent with
efficient bidding. The resources available to a team (whether its revenues or the wealth of its

21
owner) remain finite, and wasting money in the free agent market carries sizeable opportunity
costs: teams could use these funds on additional coaching, scouting, acquisition of younger
talent (ineligible for free agency), etc. It is, in addition, hard to believe that indifference to
efficiency is so widely shared in this industry that outcomes in it tell us nothing.
In any case, researchers should not consider the matter of a winner’s curse in baseball to
be a settled question; those attracted to the topic will find there is much to be done. For example,
the slow (nonexistent?) pace of learning in this setting certainly merits further study. Perhaps
time-series analysis of decisions by particular teams (or individuals) will tell us the extent to
which bidders learn from prior losses or, perhaps, become over-optimistic when their most recent
bets are successful. We remain confident that data from the sports field will continue to yield
important insights about behavior in the “real” world.
22
References
Blecherman, Barry, and Colin F. Camerer. 1996. Is there a Winner’s Curse in the market for
baseball players? Evidence from the field. Social Science Working Paper 966, California
Institute of Technology.
Bollinger, Christopher R., and Julie L. Hotchkiss. 2003. The upside potential of hiring risky
workers: Evidence from the baseball industry. Journal of Labor Economics 21:923-44.
Bruggink, Thomas H., and David R. Rose, Jr. 1990. Financial restraint in the free agent labor
market for Major League Baseball: Players look at strike three. Southern Economic Journal
56:1029-43.
Burger, John D., and Stephen J.K. Walters. 2003. Market size, pay, and performance: A general
model and application to Major League Baseball. Journal of Sports Economics 4:108-25.
Capen, E.C., R.V. Clapp, and W.M. Campbell. 1971. Competitive bidding in high risk
situations. Journal of Petroleum Technology 23:641-53.
Cassing, James, and Richard W. Douglas. 1980. Implications of the auction mechanism in
baseball’s free agent draft. Southern Economic Journal 46:110-21.
Charness, Gary, and Dan Levin. 2005. The origin of the Winner's Curse: A laboratory study.
Working paper, UCLA Department of Economics, available at http://www.econ.ohio-
state.edu/levin/wpapers/origin_012405.pdf.
Fort, Rodney D. 2006. Sports economics. 2nd edition. Upper Saddle River, NJ: Pearson
Prentice Hall.
Hendricks, Kenneth, and Robert H. Porter. 1988. An empirical study of an auction with
asymmetric information. American Economic Review 78:865-83.
23
Kagel, John H., and Dan Levin. 2002. Common value auctions and the winner's curse.
Princeton and Oxford: Princeton University Press.
Kahn, Lawrence M. 1993. Free Agency, Long-Term Contracts and Compensation in Major
League Baseball: Estimates from Panel Data. Review of Economics and Statistics 75: 157-64.
Koh, Francis, and Terry Walter. 1989. A direct test of Rock's model of the pricing of
unseasoned issues. Journal of Financial Economics 23:251-72.
Krautmann, Anthony C. 1999. What's wrong with Scully-estimates of a player's marginal
revenue product. Economic Inquiry 37:369-81.
Lazear, Edward P. 1998. Hiring risky workers. In Internal labour markets, incentives and
employment, edited by Isao Ohashi and Toshiaki Tachibanaki. New York: St. Martin's Press,
pp. 143-58.
Leeds, Michael, and Peter von Allmen. 2005. The economics of sports. 2nd edition. Boston:
Pearson Addison Wesley.
Levis, Mario. 1990. The Winner's Curse problem, interest costs and the underpricing of initial
public offerings. Economic Journal 100:76-89.
MacDonald, Don N., and Morgan O. Reynolds. 1994. Are baseball players paid their marginal
products? Managerial and Decision Economics 15:443-57.
Milgrom, Paul R. and Robert J. Weber. 1982. A Theory of Auctions and Competitive Bidding.
Econometrica 50:1089-1122.
Raimondo, Henry J. 1983. Free agents' impact on the labor market for baseball players.
Journal of Labor Research 4:183-93.
Roll, Richard. 1986. The hubris hypothesis of corporate takeovers. Journal of Business
59:197-216.
24
Scully, Gerald W. 1974. Pay and performance in Major League Baseball. American Economic
Review 64:915-30.
Scully, Gerald W. 1989. The Business of Major League Baseball. Chicago, IL: University of
Chicago Press.
Solow, John L., and Anthony C. Krautmann. 2007. Leveling the Playing Field or Just Lowering
Salaries? The Effects of Redistribution in Baseball. Southern Economic Journal 73:947-58.
Sommers, Paul M., and Noel Quinton. 1982. Pay and performance in Major League Baseball:
The case of the first family of free agents. The Journal of Human Resources 42:426-36.
Thaler, Richard H. 1992. The winner's curse: Paradoxes and anomalies of economic life.
Princeton, NJ: Princeton University Press.
Varaiya, Nikhil P. 1988. The 'Winner's Curse' hypothesis and corporate takeovers. Managerial
and Decision Economics 9:209-19.
Zimbalist, Andrew. 1992. Salaries and performance: Beyond the Scully model. In Diamonds
are forever: The business of baseball, edited by Paul M. Sommers. Washington, DC: Brookings
Institution, pp. 109-33.
25
1 For an excellent review of this literature, see Kagel and Levin (2002).
2 The institution of free agency, in which players with sufficient seniority can auction their
services to the highest bidder, began in the baseball labor market in 1976, thanks to an
arbitrator’s decision the previous year.
3 See, for example, Fort (2006, p. 229), Leeds and von Allmen (2005, p. 196), and Thaler (1992,
p. 56).
4 See Scully (1974, 1989).
5 The fact that players’ MRPs are market-specific also means that it is erroneous to model
baseball’s annual free agent bazaar as a common-value auction, as is usually done. More will be
said about this issue later.
6 An unpublished paper by Blecherman and Camerer (1996) looked at a sample of 32 free agents
from 1990 and claimed to find a continuing winner’s curse, but their estimates of players’ MRPs
are flawed (e.g., though they recognize that market size affects MRP, they argue that small-
market teams generate higher marginal revenue per win than large-market teams).
7 Fort has opined that “It is hard to believe that there would be any systematic overbidding for
players based on either inexperience or misinformation as time went by” (2006, p. 229).
8 Krautmann (1999) made some important criticisms of the Scully method. Unfortunately, his
proposed alternative—a “free market returns” approach—is inapplicable here. That approach
assumes competition aligns free agent salaries with MRPs, and that is what we are trying to test.
We concur, however, with Krautmann’s argument that Scully’s method of estimating players’
physical productivity is flawed, and so rely on more refined measures, described later, that have
been developed by expert baseball statisticians.
26
9 In two-team markets, total CMSA population was divided evenly between the teams.
10Results from all alternative specifications are available from the authors upon request.
11 A player’s slugging percentage equals the number of total bases he produces on hits divided by
his times at bat; it is a useful measure of a player’s ability to hit (especially for power), but
ignores his defensive contributions and ability to steal bases. A pitcher’s strikeout-to-walk ratio
tends to be weakly correlated with his overall ability to prevent runs, and is uncorrelated with his
playing time (a key element of his overall productivity).
12 A replacement-caliber player is defined as one that is freely available, e.g., by calling up a
minor-leaguer. The potential output of such marginal players varies by position. We use
Baseball Prospectus’s WARP3 (for version three) measure, which adjusts annual performance
data for the player’s home park and the historical era in which he played.
13 We thank an anonymous referee for emphasizing this point.
14 See Bruggink and Rose (1990).
15 MRPs for this sample are calculated net of the revenue sharing tax.
16 See, e.g., Charness and Levin (2005).
27
Table 1. Estimated Team Revenue Functions and Marginal Win Values for Two Eras
1980-1984 1995-2001 TREND
3.38***
(0.588)
5.90***
(0.843)
POP
0.341
(1.84)
-13.1***
(5.08)
WINS
0.200**
(0.09)
0.114
(0.278)
POPWINS
0.013
(0.022)
0.239***
(0.061)
STADIUM
0.343
(5.40)
40.0***
(5.40)
AGE
-0.108
(0.410)
-2.36**
(0.915)
Adjusted R2 0.546
0.670
MWV in median market $0.241 M
$ 1.01 M
MWV in largest market $ 0.316 M
$ 2.53 M
Notes: The dependent variable in each regression is real team revenue (1982 and 1998 dollars
respectively). Standard errors are in parentheses; ***, **, and * denote significance at one, five,
and ten percent levels, respectively.
28
Table 2. Ex Post Evaluation of Free Agent Contracts Signed 1975-1980 and 1998-1999
Sample Tested
Win-Loss Record,
Aggregate Return (%)
1975-1980 1998-1999
C&D Subsample
W-L Record
Sign test
Aggregate Return
t-test (null: MRP ≥ Salary)
34-10
(p=0.999)
71.64%
(p=0.999)
NA
Full Sample
W-L Record
Sign test
Aggregate Return
t-test (null: MRP ≥ Salary)
39-21
(p=0.993)
54.96%
(p=0.999)
95-108
(p=0.200)
3.28%
(p=0.653)
1975-’77 Subsample
W-L Record
Sign test
Aggregate Return
t-test (null: MRP ≥ Salary)
13-4
(p=0.994)
77.35%
(p=0.998)
NA
1978-’80 Subsample
W-L Record
Sign test
Aggregate Return
26-17
(p=0.937)
46.34%
NA
29
t-test (null: MRP ≥ Salary) (p=0.994)
Large Markets
W-L Record
Sign test
Aggregate Return
t-test (null: MRP ≥ Salary)
20-9
(p=0.988)
58.36%
(p=0.995)
58-44
(p=0.979)
25.18%
(p=0.978)
Small Markets
W-L Record
Sign test
Aggregate Return
t-test (null: MRP ≥ Salary)
19-12
(p=0.925)
51.01%
(p=0.995)
37-64
(p=0.005)
-28.84%
(p=0.001)
Player Changed Teams
W-L Record
Sign test
Aggregate Return
t-test (null: MRP ≥ Salary)
NA
58-78
(p=0.051)
-10.77%
(p=0.122)
No Change of Team
W-L Record
Sign test
Aggregate Return
t-test (null: MRP ≥ Salary)
NA
37-30
(p=0.836)
34.63%
(p=0.978)
Notes: W-L Record reports the number of free agents for which MRP > Salary (a Win for the
Owner/Team) compared to the number of signees for which Salary > MRP (a Loss). Aggregate
30
Return reports the proportion by which the revenue generated by free agents over their entire
contracts exceeded (or was exceeded by) the total amount spent on their salaries.
Sign test reports the probability that the observed number of wins (or less) occurs under the null
hypothesis of a 50-50 distribution; t-test reports the probability that the observed aggregate
return will occur under the null hypothesis that MRP ≥ Salary (one-tailed test).
31
Table 3. Salary Regressions for Free Agents Signed 1975-1980
Independent Variables Total Sample C&D Sample
TREND
0.020
(0.016)
0.038
(0.021)
WARPAVG
0.048***
(0.009)
0.061***
(0.011)
WARPVAR
0.014***
(0.005)
0.020***
(0.006)
AGE
-0.020
(0.013)
-0.044**
(0.017)
EXP
0.030**
(0.012)
0.053***
(0.017)
BIDDERS
0.018***
(0.005)
0.014*
(0.007)
POP 0.012*
(0.006)
0.006
(0.008)
Adjusted R2 0.662 0.665
Observations 60 44
Notes: Average annual salary over the contract is the dependent variable in each regression.
Standard errors are in parentheses; ***, **, and * denote significance at one, five, and ten
percent levels, respectively. The last column restricts the sample to the 44 free agents studied in
Cassing and Douglas (1980).
32
Table 4. Salary Regressions for Free Agents Signed 1998-1999 Independent
Variables
(1) (2) (3) (4)
TREND
0.243
(0.249)
0.256
(0.250)
0.269
(0.249)
0.255
(0.247)
WARPAVG
1.04***
(0.069)
1.06***
(0.068)
1.08***
(0.063)
1.05***
(0.063)
WARPVAR
0.022
(0.035)
0.020
(0.036)
AGE
-0.119*
(0.069)
-0.111
(0.069)
-0.115*
(0.069)
-0.112
(0.068)
EXP
0.016
(0.068)
0.011
(0.068)
0.009
(0.068)
0.010
(0.068)
TEAMCHANGE
-0.152
(0.263)
-0.203
(0.262)
POP 0.096*
(0.052)
0.099*
(0.051)
Adjusted R2 0.619 0.615 0.615 0.621
Observations 203 203 203 203

33
Notes: Average annual salary over the contract is the dependent variable in each regression.
Standard errors are in parentheses; ***, **, and * denote significance at one, five, and ten
percent levels, respectively.
34
Appendix: Data Sources
(1) Team total revenue data for 1980, 1982, and 1984 were obtained from Scully (1989,
pp. 120-21), who credits Roger G. Noll (a consultant to the players’ union).
(2) Team local revenue data for 1995-2001 were obtained from the Updated Supplement
to the Report of the Independent Members of the Commissioner’s Blue Ribbon Panel on
Baseball Economics, available at http://www.roadsidephotos.com/baseball/BRPanelupd.htm.
(3) Team market size is proxied by total population in its CMSA, obtained from the U.S.
Census Bureau at http://www.census.gov/ and from Statistics Canada at
http://www40.statcan.ca/l01/cst01/. Linear interpolations were used for years when such data are
unavailable. In two-team markets, each team was assigned half the CMSA population.
(4) Team performance data, stadium information, and some individual player data (e.g.,
age, experience, some salaries) were obtained from http://www.baseball-reference.com/.
(5) Individual player performance data (WARP3) were obtained from
http://www.baseballprospectus.com./.
(6) Data on eligible free agents and their contract terms in both samples (1970s and
1990s) were obtained from various issues of The Sporting News Baseball Guide, an annual
statistical compendium published by The Sporting News, St. Louis, MO.
All data are available from the authors on request.