joan costa-font, alistair mcguire, tom stanley publication ... · joan costa-font, alistair...
TRANSCRIPT

Joan Costa-Font, Alistair McGuire, Tom Stanley
Publication Selection in Health Policy Research:
the Winner’s Curse Hypothesis
Working paper No: 25/2012 January 2012 LSE Health

Publication Selection in Health Policy Research: the Winner’s Curse Hypothesis Joan Costa-Font1, Alistair McGuire2, Tom Stanley3
1Department of Social Policy and European Institute, London School of Economics and Political Science 2Department of Social Policy, London School of Economics and Political Science 3Department of Economics and Business, Hendrix College Working Paper No.25/2012 First published in January 2012 by: LSE Health The London School of Economics and Political Science Houghton Street London WC2A 2AE © Joan Costa-Font, Alistair McGuire, Tom Stanley All rights reserved. No part of this paper may be reprinted or reproduced or utilised in any form or by any electronic, mechanical or other means, now known or hereafter invented, including photocopying and recording, or in any information storage or retrieve system, without permission in writing from the publishers. British Library Cataloguing in Publication Data. A catalogue record for this publication is available from the British Library. ISSN 2047-8879 Corresponding Author: Joan Costa-Font European Institute Cowdray House London School of Economics and Political Science Houghton Street London WC2A 2AE [email protected]

1
Abstract
There is a widely discussed problem of publication bias in medical and health services
research. Where quantitative effects form the basis of a publication a ‘winner’s curse’ curse
may apply. This phenomenon may occur as prospective authors of research papers compete
by reporting ‘more extreme and spectacular results’ in order to increase the chances of their
paper being accepted for publication. This paper examines this phenomenon using
quantitative findings on income and price elasticities as reported in health economics
research. We find robust statistical evidence that higher-impact journals preferentially report
larger empirical estimates of these elasticities. That is, we find robust evidence of a winner’s
curse hypothesis contributing to the existence of publication bias found in both the income
and the price elasticities of health care and drugs, as well as value of life research.
2
Contents
1 Introduction 3
2 Publication Selection and the Winner’s Curse 4
Publication Selection …………………………………………… 4
A Winner’s Curse of Research Publication …………………… 5
Identifying and Correcting Publication Bias …………………… 6
3 Can Health Research Be Winner’s Cursed? 13
Meta-Analysis Data ……………………………………………… 13
Testing the Winner’s Curse Hypothesis ……………………… 13
Evidence from elasticity estimates …………………………… 17
4 Conclusion 18
References 21
Footnotes 27
3
I. INTRODUCTION
The rapid growth of health policy research has led to the use of economics based concepts in
policymaking, including the application of income and price elasticity estimates. More
specifically, for three decades, economists have debated whether the income elasticity of
health care demand suggests that health care is a luxury (Newhouse, 1977) with obvious
consequences for public intervention in health care financing.1 Existing studies show mixed
results with some scholars suggesting a potential empirical bias (See Costa-Font et al, 2011).
Similarly, many studies have been devoted to estimating the price elasticity for prescription
drugs using survey, observational and experimental data, partly to inform copayment levels
for these products, but there have been marked differences in these estimated elasticities (see
Gemmill et al, 2007). Such examples suggest that there might be an alternative explanation to
the patterns of reported research results as found in health research. The purpose of this paper
is to explore whether there is, in fact, a “winner’s curse” in published health policy research.
Some researchers have suggested that the publication of medical research suffers from
a phenomenon defined as ‘winner’s curse.’2 More precisely they state that “The current
system of publication in biomedical research provides a distorted view of the reality of
scientific data that are generated in the laboratory and clinic. . . . (T)he more extreme,
spectacular results (the largest treatment effects, the strongest associations, or the most
unusually novel and exciting biological stories) may be preferentially published” (Young et
al., 2008).
The purpose of this paper is to test the ‘winner’s curse’ hypothesis as it applies to
specific aspects of health economics research and, in the process, to investigate the health
care-income elasticity puzzle more deeply. Recently developed meta-regression analysis
(MRA) methods that are able to identify and correct publication selection bias are applied to
exisiting findings and suggest confirmation of a ‘winner’s curse’ in two areas of health
research: health care income elasticities and prescription drug price elasticities (Gemmill et
al., 2007; Stanley, 2008; Moreno et al., 2009; Costa-Font et al., 2011). That is, these methods
allow investigation of potential publication bias in these two areas of health research and
whether higher impact journals amplify this bias by reporting the largest effects.
Our findings have important implications for health care policy and financing.
Whether health care is a luxury or a necessity is more than a technical debate about the finer
points of econometrics and its application. This health care-luxury issue may be
misinterpreted to have important health policy implications. If health care were considered a
4
luxury good, or so the argument goes, then demand will increase more rapidly than income,
and richer countries should be expected to spend more than poorer countries per capita. Also,
some might use such a ‘luxury’ status to suggest that public financing should play a
subsidiary role. The use and abuse of such economic distinctions can be seen in the recent
debate around the US health care reform (Glied, 2009; Phelps, 2010).
Furthermore, the price elasticity of prescription drugs is a fundamental parameter in
the design of drug reimbursement and levels of copayment. The policy importance of this key
elasticity is increasing as prescription medicines progressively represent a larger share of total
health expenditures. Although there is a sizable literature on price and expenditure
elasticities of prescribed drugs, estimates vary greatly. Thus, it is critical to have a
comprehensive and quantitative summary of this large literature, which disentangles potential
biases and heterogeneity.
II. PUBLICATION SELECTION AND THE WINNER’S CURSE
Publication Selection
For a half-century, medical researchers, as well as some economists have expressed concerns
about the detrimental effects of publication selection (Sterling, 1959; Tullock, 1959; Feige,
1975; Rosenthal, 1979; Lovell, 1983; Begg and Berlin, 1988; DeLong and Lang, 1992; Card
and Krueger, 1995; Sterling, Rosenbaum and Weinkam, 1995; Copas, 1999). Publication
selection bias is widely acknowledged as a threat to scientific practice and statistical
inference. When reported results are selected for statistical significance or for some ‘positive’
finding, empirical phenomena can be manufactured, becoming mere artifacts of the
publication selection process. For example, the efficacy of intravenous magnesium to treat
myocardial infarction (‘heart attack’) and the adverse employment effect of raising the
minimum wage are seen by many researchers as established facts; yet, these effects can be
shown to be nothing more than publication selection bias (Egger and Smith, 1995; Higgins
and Spiegelhalter, 2002; Doucouliagos and Stanley, 2009).
Publication selection is the preference for statistically significant or ‘positive’
findings. In the social sciences, it may manifest itself through editors, reviewers, and
researchers themselves having a preference for statistically significant findings. This practice
has been colorfully called the ‘file drawer’ problem to describe the tendency for researchers to
file away, and hence not publish or report, their insignificant results (Rosenthal, 1979).

5
The real problem of publication selection is not its widespread existence, but rather the
potentially large biases it imparts upon any summary of empirical findings, medical or
economic. For example, the average reported value of a statistical life may be biased by a
factor of five or more (Doucouliagos et al., 2012), and a similar exaggeration is found among
the adverse employment effects of minimum wage raises (Doucouliagos and Stanley, 2009).
Or to use another health care example, the increased rate of smoking cessation caused by
using nicotine replacement therapy (the patch) is likely to be exaggerated three fold (see
below). Accommodating publication selection places the efficacy of nicotine replacement
therapy in jeopardy. The spillover effects of such biases into the policy arena may thus have
damaging effects.
A Winner’s Curse of Research Publication
Recently, collaboration between medical researchers and economists offers an economic
interpretation for the “file drawer” problem (Young et al., 2008). That is, they give an
economic explanation to the widely observed phenomenon of publication selection. Fierce
competition among researchers for the scarce space in the top academic journals allows
editors and reviewers to demand “more extreme, spectacular results.”3 Young et al. (2008)
call this phenomenon the ‘winner’s curse’ after the price anomaly where bidders pay an
irrationally high price in a common value auction market in an effort to ‘win.’ This
connection to the winner’s curse is to view the bid as the size and importance of the reported
research findings. As Johnson (2008) summarizes this phenomenon for the Economist,
“(T)he winners could be the ones most likely to oversell themselves—to trumpet dramatic or
important results that later turn out to be false.” 4
Unfortunately, there is little to distinguish this ‘winner’s curse of research publication’
(WCRP) from the long established and better-known “file drawer” problem of publication
selection. However, if WCRP were correct, then the severity of publication bias should vary
directly with the amount of competition for scarce journal space. In a publishing context,
journal quality, which is widely though imperfectly, measured by impact factor, could serve
as a proxy for the strength of the competition among researchers. In general, higher ranked
journals attract a larger number of papers, accept a smaller proportion of them, and can
thereby demand more significant, striking or novel results. Thus, we have a testable
hypothesis that distinguishes WCRP from the more general phenomenon of publication
selection, because general publication selection need not be correlated with journal impact
factor. 5

6
To recap, the winner’s curse implies that the magnitude of reported empirical effects
will be positively associated with journal input factor, ceteris paribus, after more
conventional publication selection bias is accommodated. We test this hypothesis explicitly
in Section III using estimated aggregate income elasticities of health care and price elasticities
for prescribed drugs. First, however, we review meta-analytic methods designed to identify
and correct publication selection bias illustrating through using published data on the effect of
antidepressant medications, nicotine replacement therapy, aggregate income elasticities for
health care and prescription drug price elasticities.
Identifying and Correcting Publication Bias
By now, publication selection bias has been found in dozens of areas of economics research.
Examples include: Ashenfelter and Greenstone (2004) and Doucouliagos et al. (2012) for the
value of life; Rose and Stanley (2005) for the common currency effect on trade; Mookerjee
(2006) for openness and economic growth, Krassoi-Peach and Stanley (2009) for efficiency
wages, Doucouliagos and Stanley (2009) for the employment effects of minimum wages, and
Nelson (2011) for the relation of adolescent drinking to marketing. Of course, not all areas of
empirical economics will contain notable publication selection.
In medical research, where publication selection is widely acknowledged to be a
severe problem, “the most commonly used method to detect publication bias is an informal
examination of a funnel plot” (Sutton et al., 2000, p.1574). A ‘funnel graph’ is a scatter
diagram of an estimate and its precision (1/SEi). When there is no publication selection, this
scatter diagram should resemble an inverted funnel, hence the name. A good example of this
expected funnel symmetry is seen among the 73 randomized clinical trials (RCT) of
antidepressants registered at the US Food and Drug Administration (FDA) (double-blind,
placebo-controls Phase II and III). Medical researchers regard the FDA registry as the ‘gold
standard,’ because all such clinical trials must, by law, be registered with the FDA. Figure 1
plots effect sizes (Glass’s g) on the horizontal axis against the precision of these effect sizes
(or 1/SEi) on the vertical axis—(Turner et al., 2008).

7
Figure 1: FDA Antidepressant Trials
2
3
4
5
6
7
8
9
10
11
Pre
cisi
on
-.4 -.2 0 .2 .4 .6 .8 1
g
FDAPublished
Source: Turner et al. (2008).
Note how this graph, Figure 1, resembles an inverted funnel, or perhaps a ‘Christmas tree’ in
this example. Because these estimates’ precisions are placed on the vertical axis, we expect
the estimates to be widely dispersed at the bottom and more tightly packed, horizontally, at
the top. However, it is symmetry or its absence (asymmetry) that truly matters. When there
is no publication selection, we expect the funnel graph to be roughly symmetric, see the
diamonds in Figure 1. The results of the 73 clinical trials of antidepressants registered at the
FDA are approximately symmetric; however, the fifty that are published are very skewed,
showing clear signs of being selected to be positive and statistically significant (Turner et al.,
2008; Moreno et al., 2009b).
Symmetry follows from the fact that each reported estimate will be randomly and
symmetrically distributed around the ‘true effect,’ assuming for the moment that
heterogeneity is not coincidentally related to SE. Furthermore, when researchers report t-
values, they are assuming that their estimates are independent of their standard errors;
otherwise, the t-test would be invalid. Of course, there is likely to be more than one ‘true
effect’ (i.e., heterogeneity), which is routinely modeled by multiple meta-regression analysis.
Publication selection can be easily placed into this larger, multivariate context of
8
heterogeneity and other types of bias —see Tables 3-5 below. Before returning to these
important complexities, publication selection needs to be more fully discussed.
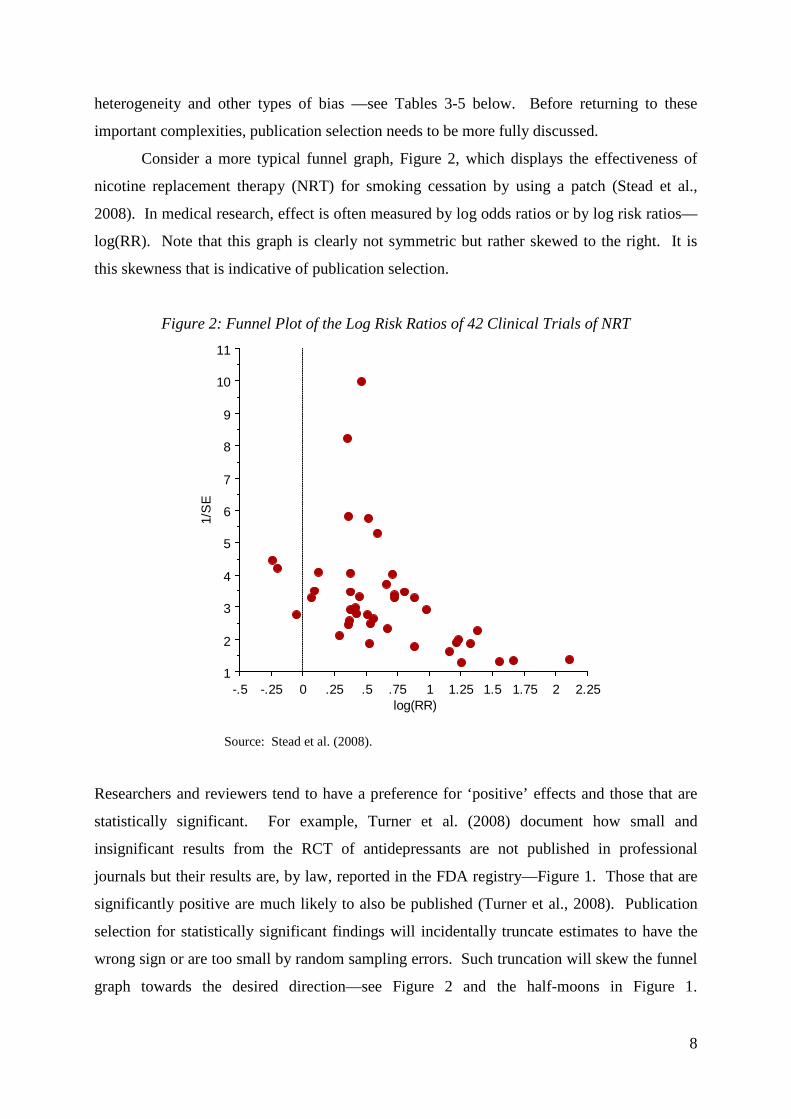
Consider a more typical funnel graph, Figure 2, which displays the effectiveness of
nicotine replacement therapy (NRT) for smoking cessation by using a patch (Stead et al.,
2008). In medical research, effect is often measured by log odds ratios or by log risk ratios—
log(RR). Note that this graph is clearly not symmetric but rather skewed to the right. It is
this skewness that is indicative of publication selection.
Figure 2: Funnel Plot of the Log Risk Ratios of 42 Clinical Trials of NRT
1
2
3
4
5
6
7
8
9
10
11
1/S
E
-.5 -.25 0 .25 .5 .75 1 1.25 1.5 1.75 2 2.25log(RR)
Source: Stead et al. (2008).
Researchers and reviewers tend to have a preference for ‘positive’ effects and those that are
statistically significant. For example, Turner et al. (2008) document how small and
insignificant results from the RCT of antidepressants are not published in professional
journals but their results are, by law, reported in the FDA registry—Figure 1. Those that are
significantly positive are much likely to also be published (Turner et al., 2008). Publication
selection for statistically significant findings will incidentally truncate estimates to have the
wrong sign or are too small by random sampling errors. Such truncation will skew the funnel
graph towards the desired direction—see Figure 2 and the half-moons in Figure 1.
9
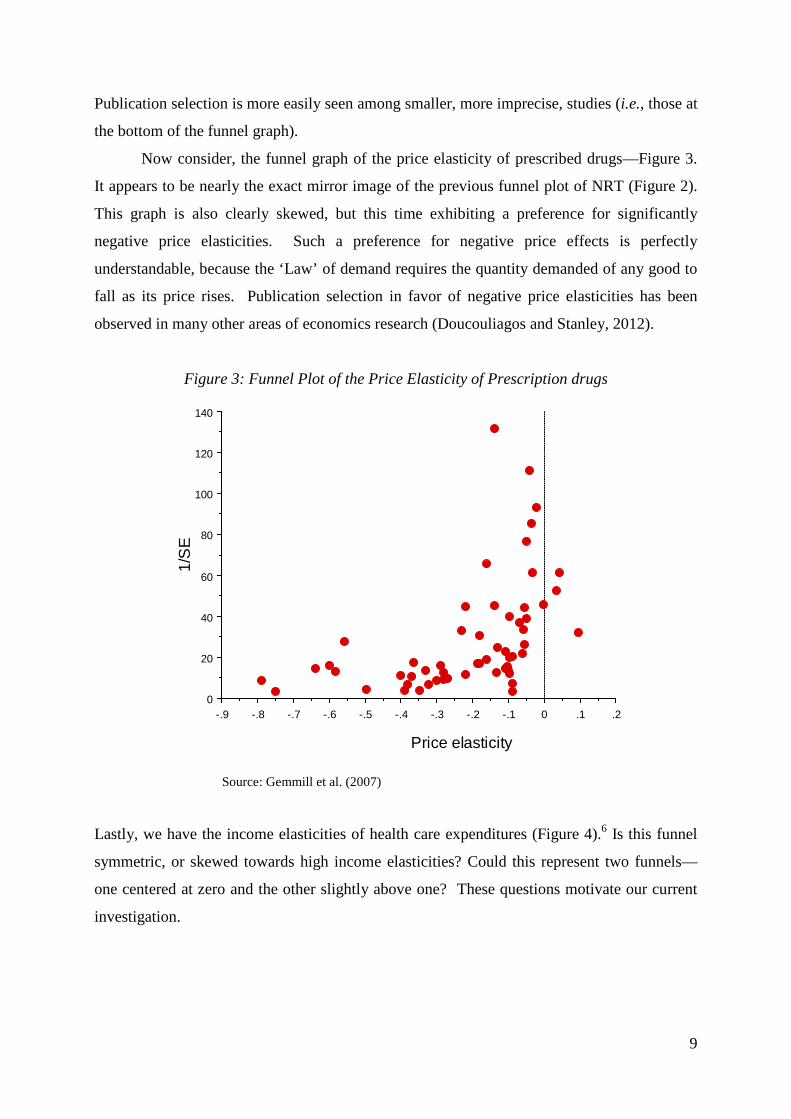
Publication selection is more easily seen among smaller, more imprecise, studies (i.e., those at
the bottom of the funnel graph).
Now consider, the funnel graph of the price elasticity of prescribed drugs—Figure 3.
It appears to be nearly the exact mirror image of the previous funnel plot of NRT (Figure 2).
This graph is also clearly skewed, but this time exhibiting a preference for significantly
negative price elasticities. Such a preference for negative price effects is perfectly
understandable, because the ‘Law’ of demand requires the quantity demanded of any good to
fall as its price rises. Publication selection in favor of negative price elasticities has been
observed in many other areas of economics research (Doucouliagos and Stanley, 2012).
Figure 3: Funnel Plot of the Price Elasticity of Prescription drugs
0
20
40
60
80
100
120
140
1/S
E
-.9 -.8 -.7 -.6 -.5 -.4 -.3 -.2 -.1 0 .1 .2
Price elasticity
Source: Gemmill et al. (2007)
Lastly, we have the income elasticities of health care expenditures (Figure 4).6 Is this funnel
symmetric, or skewed towards high income elasticities? Could this represent two funnels—
one centered at zero and the other slightly above one? These questions motivate our current
investigation.

10
Figure 4: Funnel Plot of Income Elasticities of Health Care
0
50
100
-2 -1 0 1 2 3 4 5
Income elasticity
Prec
isio
n (1
/Se)
Source: Costa-Font et al. (2011).
Although these funnel graphs can be quite suggestive (Stanley and Doucouliagos, 2010), any
visual inspection will remain somewhat subjective. To avoid subjective or idiosyncratic
interpretations of funnel graphs, statistical tests have been designed to test their symmetry and
to test for the presence of an underlying genuine effect.
With publication selection, researchers who have small samples and low precision will
be forced to search more intensely across model specifications, data, and econometric
techniques until they find larger estimates. Otherwise, their results will not be statistically
significant. In contrast, researchers with more precise estimates need not search quite so hard
from the practically infinite model specifications to find statistical significance and will
thereby be satisfied with smaller estimated effects. When publication selection is present, the
reported effects are positively correlated with their standard errors.
The conventional method to identify and accommodate publication bias is the simple
meta-regression model:
effecti = β + α SEi + εi (1)
11
(Egger et al., 1997; Stanley, 2008). Where effecti is some estimated empirical effect, often an
elasticity, and SEi is its standard error. Equation (1) is the meta-regression equivalent of a
funnel graph (Stanley and Doucouliagos, 2010).
The conventional t-test of H0: α=0 from MRA model (1) is a valid, if low power, test
for the presence of publication bias (Egger et al, 1997; Stanley, 2008). On the other hand, the
t-test of H0: β=0 is a powerful test for the presence of an authentic empirical effect beyond
publication selection (Stanley, 2005; Stanley, 2008). These tests have been called the ‘funnel-
asymmetry test’ (FAT) and the ‘precision-effect test’ (PET), respectively, and can be used to
confirm (or deny) objectively the subjective impression gleaned from a visual inspection of a
funnel graph.
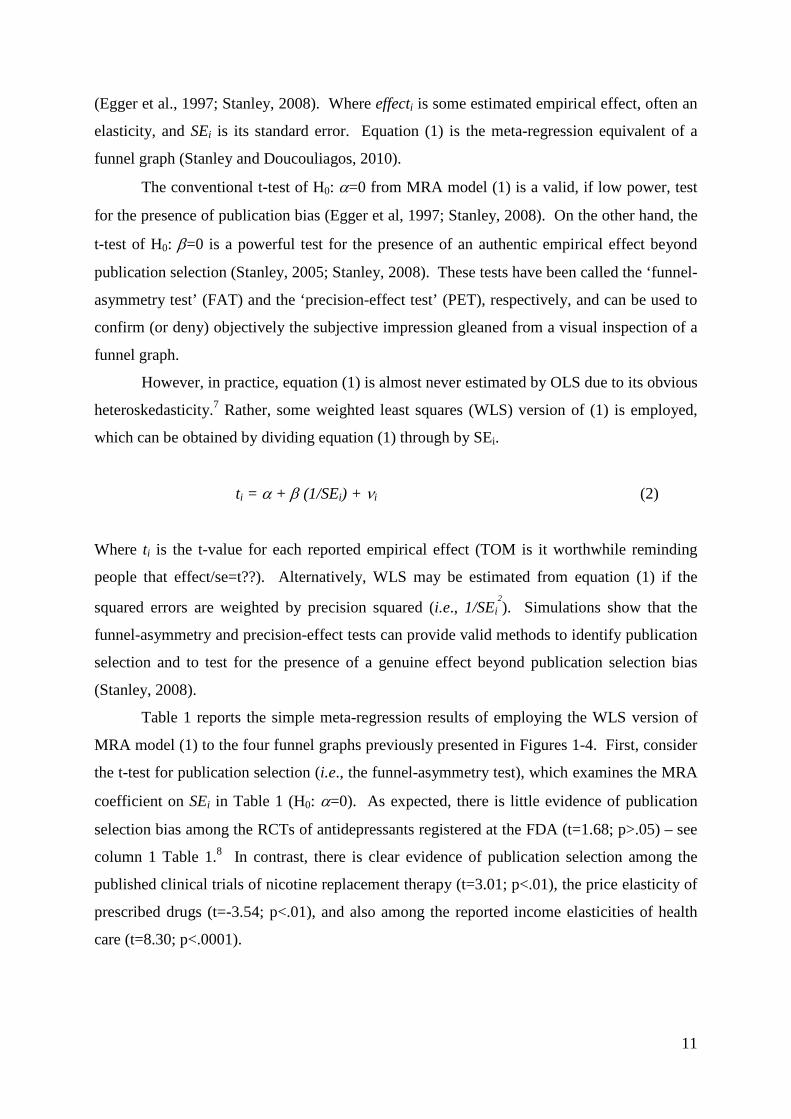
However, in practice, equation (1) is almost never estimated by OLS due to its obvious
heteroskedasticity.7 Rather, some weighted least squares (WLS) version of (1) is employed,
which can be obtained by dividing equation (1) through by SEi.
ti = α + β (1/SEi) + νi (2)
Where ti is the t-value for each reported empirical effect (TOM is it worthwhile reminding
people that effect/se=t??). Alternatively, WLS may be estimated from equation (1) if the
squared errors are weighted by precision squared (i.e., 1/SEi2). Simulations show that the
funnel-asymmetry and precision-effect tests can provide valid methods to identify publication
selection and to test for the presence of a genuine effect beyond publication selection bias
(Stanley, 2008).
Table 1 reports the simple meta-regression results of employing the WLS version of
MRA model (1) to the four funnel graphs previously presented in Figures 1-4. First, consider
the t-test for publication selection (i.e., the funnel-asymmetry test), which examines the MRA
coefficient on SEi in Table 1 (H0: α=0). As expected, there is little evidence of publication
selection bias among the RCTs of antidepressants registered at the FDA (t=1.68; p>.05) – see
column 1 Table 1.8 In contrast, there is clear evidence of publication selection among the
published clinical trials of nicotine replacement therapy (t=3.01; p<.01), the price elasticity of
prescribed drugs (t=-3.54; p<.01), and also among the reported income elasticities of health
care (t=8.30; p<.0001).

12
Table 1: Simple Meta-Regression Model of Publication Bias and Genuine Effect (WLS)
Variables
FDA Anti-depressant Trials (1)
NRT Patch
(2)
Price Elasticity of Prescribed
Drugs (3)
Income Elasticity of Health Care
(4) Intercept .20 (2.77)*
.20(2.00) -.039(-2.23) -.0006 (-0.11)
SEi .73 (1.68)*
1.09(3.01) -2.50 (-3.54) 6.01(8.30)
n 73 42 57 164 *t-values are reported in parenthesis.
After allowing for publication selection, evidence of genuine effects is greatly reduced. If we
strictly apply a two-tail precision-effect test to nicotine replacement therapy (H0: β=0), we fail
to find significant evidence of an empirical effect (t=2.00; p>.05)—see column 2 Table 1.
However, because pharmaceutical companies are looking for a positive effect, a one-tail,
directional hypothesis is quite appropriate and results in finding significant evidence of a
positive effect for NRT (one-tail p<.05). There is more clear evidence that antidepressants
have a small effect (t=2.77; p<.01)— column 1Table 1. Similarly, there is clear evidence of a
genuine price effect, albeit a small one, for prescription drugs (t=-2.23; p<.05) – column 3
Table 1. In contrast, there is no evidence that rising incomes increase the demand for health
care, regardless of the level of significance one chooses or how one specifies the hypotheses
(t=-0.03; p>>.05)— column 4 Table 1. In other words, after allowing for publication
selection, no evidence of any income effect on health care expenditures remains. Needless to
say, this is not consistent with the strong aggregate income effect on health care that defines
the luxury hypothesis (reject H0: β > 1; t=-198.1; p<.0001).
Of course, empirical research is likely to be much more complex than what can be
captured by any single variable. No doubt, there are factors other than publication selection
that affect reported results, and their omission can potentially bias these results. Implicit in
our simple MRA model of publication selection is the assumption that there is a single
underlying empirical effect that each study is estimating, though imperfectly. However,
heterogeneity is routinely observed among reported economic estimates, and this area of
research is no exception. Thus, we need to consider a more complex meta-regression model
that accommodates heterogeneity as well as publication selection. In the next section, we
explicitly address this issue by investigating any of a number of multivariate MRA models.

13
III. CAN HEALTH RESEARCH BE WINNER’S CURSED?
Meta-Analysis Data
Having illustrated the publication selection in our examples above, we now focus on a meta-
analysis of health care income and price elasticites and whether there is evidence of a
‘winner’s curse’ in the area of health research. Meta-analysis requires a comprehensive
collection of all available estimates on some empirical phenomenon. Our search identified
and cross-referenced published studies using Econlit, Medline, and Sociofile. From each
study, we have extracted a set of relevant characteristics including: standard errors, journal
impact factor, the year of publication, type of data, level of aggregation, econometric
techniques used, and health system. Descriptive statistics for these variables are reported in
Table 2. All income elasticity estimates come from aggregate studies (national or regional),
because it is at the aggregate level where the health care-luxury good conundrum exists.
Table 2. Definitions of the variables and summary statistics Variable Definition Mean Median Standard
Deviation Income Elasticity of Health Care (n=164) Estimated elasticity Income elasticity of demand 0.950 0.942 0.663 SE Standard error of this elasticity 1.205 0.295 5.170 Controls Region 1 if regional data are used 0.236 0.000 0.426 Year Year reported 2000 2003 6.091 NHS Percent of NHS data used 0.526 0.500 0.403 Public 1 if public expenditures 0.079 0.000 0.270 Impact Journal impact factor 0.894 0.300 0.923 Panel 1 if panel data are used 0.164 0.000 0.371 Price Elasticity of Prescription Drugs (n=57) Estimated elasticity Price elasticity of demand -0.209 -0.140 0.204 SE Standard error of this elasticity 0.070 0.052 0.069 Controls Impact Journal impact factor 0.954 0.156 1.226 Tax 1 if tax based system 0.617 1.000 0.490 Shi 1 if social health insurance 0.217 0.000 0.415 Short 1 if for a short run elasticity 0.483 0.000 0.504 Chronic 1 if for a chronic condition 0.267 0,000 0.058
Testing the Winner’s Curse Hypothesis
To test the winner’s curse hypothesis (WCRP) in a multivariate context, we use a general-to-
specific approach (Davidson et al., 1978). That is, all coded variables are included in the

14
WLS version of MRA model (1), and insignificant variables are removed one at a time. “The
strength of general to specific modeling is that model construction proceeds from a very
general model in a more structured, ordered (and statistically valid) fashion, and in this way
avoids the worst of data mining” (Charemza and Deadman 1997, p. 78). The results are
presented in columns 1 and 5 of Table 3.
Table 3: WLS Multivariate MRA (Dependent Variable = Estimated Elasticity)
Income Elasticity of Health Care Price Elasticity of
Prescribed Drugs Variables Column 1 2 3 4 5
Intercept .562 (4.59)* .489 (4.09)* .484 (4.06)* .001 (.11) * -0.005 (-0.24)
Impact .265 (3.84) .307 (4.56) .314 (4.72) .352 (5.11) -0.026 (-3.02)
SE 2.437 (2.94) 2.498 (2.98) 2.444 (2.93) 3.822 (4.79) -2.721 (-4.10)
NHS -.561 (-4.59) -.487 (-4.08) -.483 (-4.06) --- ---
Year -.021 (-2.34) -.002 (-.64) --- --- ---
Public .086 (2.26) --- --- --- ---
Adj R2 .46 .44 .44 .39 .278 *t-values are reported in parenthesis.
The remaining columns in Table 3 remove the other moderator variables from the income
elasticity MRA to ensure our main findings are robust to the choice of moderator variables.
In all cases, the MRA coefficient on Impact is statistically significant (p<.01), unambiguously
corroborating WCRP. Impact is positive and statistically significant in all MRA models for
income elasticities and significantly negative for price elasticities of prescribed drugs,
directions that one would expect a prori.
The MRA coefficient on Impact is quite large (0.265—0.352) for income elasticites,
easily making important practical differences in the reported elasticities. For example, when
this estimated winner’s curse effect is applied to the highest-rated journal, reported income
elasticities would be expected to increase by 0.66 to 0.88 from this selection alone. When the
estimated WCRP is combined with the estimated publication bias from SE in Table 3, their
combined effect increases expected elasticity anywhere from 1.00 to 1.42, again for the

15
highest-rated journal. Needless to say, observed publication bias and WCRP are large enough
to make an absolute necessity (i.e., income elasticity=0) appear to be a luxury. Thus, these
results indicate both the WCRP hypothesis and publication selection among reported health
care income elasticities, regardless of which MRA model is employed.
The pattern of variation found among these estimated MRA coefficients of publication
selection (SE) is also instructive. Publication selection bias is estimated to be the largest when
no other moderator variables are included in equation (1), α̂ =6.009 (Table 1 column 4). As
moderator variables are added to this simple MRA model, the magnitude of publication
selection is reduced. In particular, when Impact is included the coefficient on SE falls to
3.822 (Table 3 column 4). Note that the MRA models reported in Table 1 column 4 and
Table 3 column 4 differ only by the inclusion of Impact. It seems clear, therefore, that Impact
picks up some of the publication selection bias previously identified by SE’s MRA
coefficient. Thus as expected, the winner’s curse replaces part of the observed publication
selection among income elasticities on health care, giving added corroboration to the
operation of a winner’s curse in this area of research. Note further how the coefficients on SE
and Impact both decline as additional moderators are added to our MRA model (Table 3).
Such a coherent pattern would be expected if the associated types of data (NHS and Public)
were differentially selected in an effort to report large income effects.10
As a further check of the robustness of these central findings, we also estimate the
general-to-specific MRA model (column 1 Table 3) in several additional ways. It is widely
recognized that reported empirical estimates will be dependent on one another if multiple
estimates are collected from a single study (Stanley and Jarrell, 1989; Stanley, 2001). Table 4
accounts for possible intra-study dependence using a variety of plausible assumptions about
its structure. For our purposes, the most important finding is that the size, sign and
significance of both WCRP (Impact) and publication selection bias (SE) remain unchanged.11

16
Table 4: Intra-Study Dependence and Robustness Checks Dependent Variable = Estimated Income Elasticity of Health Care
Variables Column 1:
WLS 2: Cluster-
Robust 3: REML
Intercept .562 (4.59)* .562 (3.79)* .348 (3.02)*
Impact .265 (3.84) .265 (3.01) .333 (3.16)
SE 2.437 (2.94) 2.437 (2.95) 3.95 (2.12)
NHS -.561 (-4.59) -.561 (-3.77) -.347 (-3.01)
Year -.021 (-2.34) -.021 (-2.20) -.020 (-2.00)
Public .086 (2.26) .086 (2.20) .077 (1.65)
Adj R2 .46 .46 --- *t-values are reported in parenthesis.
For convenience, column 1 Table 3, which reports the general-to-specific WLS MRA, is also
reported in column 1 Table 4. Column 2 Table 4 calculates cluster-robust standard errors
when the data are clustered by study. Column 3 treats our meta-data as uneven panels
structured across studies and reported estimates within studies. REML (restricted maximum
likelihood) allows for random study effects and can be considered a mixed-effect multilevel
model. The only notable difference among any of the statistical results is that one ancillary
moderator variable (Public) is not statistically significant when a multilevel structure is
employed. In all cases, our central hypotheses concerning publication selection are all
corroborated.
As an additional check on the robustness of this robust corroboration of WCRP among
health care elasticities, we apply these same MRA methods to a second area of health
economics—price elasticities of prescribed drugs.12 Table 3 column 5 reports the general-to-
specific MRA for prescription drug elasticities. Only Impact and SE are statistically
significant. Their estimated MRA coefficients confirm both a publication bias for
significantly negative price elasticity (t=-3.02; p<.01) and WCRP (t=-4.10; p<.001).
Interestingly, when corrected for these publication biases, no statistically significant price
effect remains (t=-0.24; p>>.05). That is, there is insufficient evidence to conclude that price
increases of prescription drugs will cause any decrease in their use once both of these types of
publication selection are accommodated. Likewise, when we include the other moderator
17
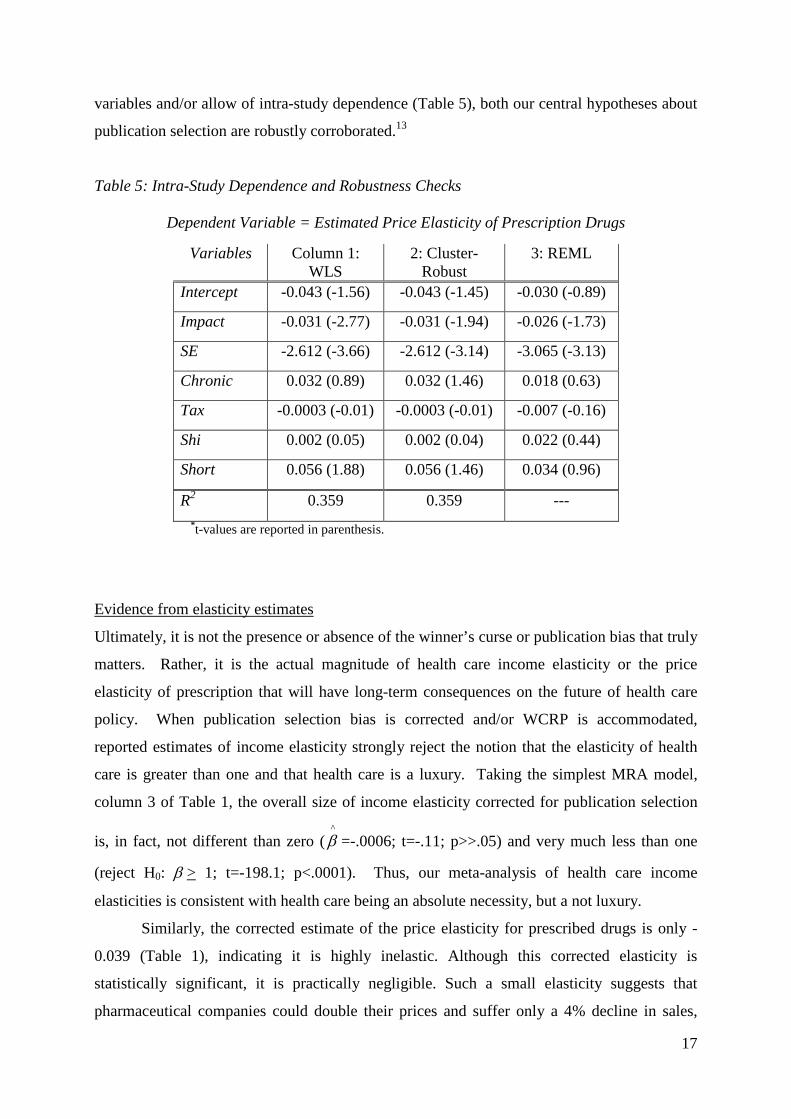
variables and/or allow of intra-study dependence (Table 5), both our central hypotheses about
publication selection are robustly corroborated.13
Table 5: Intra-Study Dependence and Robustness Checks
Dependent Variable = Estimated Price Elasticity of Prescription Drugs
Variables Column 1: WLS
2: Cluster-Robust
3: REML
Intercept -0.043 (-1.56) -0.043 (-1.45) -0.030 (-0.89)
Impact -0.031 (-2.77) -0.031 (-1.94) -0.026 (-1.73)
SE -2.612 (-3.66) -2.612 (-3.14) -3.065 (-3.13)
Chronic 0.032 (0.89) 0.032 (1.46) 0.018 (0.63)
Tax -0.0003 (-0.01) -0.0003 (-0.01) -0.007 (-0.16)
Shi 0.002 (0.05) 0.002 (0.04) 0.022 (0.44)
Short 0.056 (1.88) 0.056 (1.46) 0.034 (0.96)
R2 0.359 0.359 --- *t-values are reported in parenthesis.
Evidence from elasticity estimates
Ultimately, it is not the presence or absence of the winner’s curse or publication bias that truly
matters. Rather, it is the actual magnitude of health care income elasticity or the price
elasticity of prescription that will have long-term consequences on the future of health care
policy. When publication selection bias is corrected and/or WCRP is accommodated,
reported estimates of income elasticity strongly reject the notion that the elasticity of health
care is greater than one and that health care is a luxury. Taking the simplest MRA model,
column 3 of Table 1, the overall size of income elasticity corrected for publication selection
is, in fact, not different than zero (^β =-.0006; t=-.11; p>>.05) and very much less than one
(reject H0: β > 1; t=-198.1; p<.0001). Thus, our meta-analysis of health care income
elasticities is consistent with health care being an absolute necessity, but a not luxury.
Similarly, the corrected estimate of the price elasticity for prescribed drugs is only -
0.039 (Table 1), indicating it is highly inelastic. Although this corrected elasticity is
statistically significant, it is practically negligible. Such a small elasticity suggests that
pharmaceutical companies could double their prices and suffer only a 4% decline in sales,

18
earning them a 92% increase in their revenues. This finding is consistent with the idea that
prescribed drugs, like health care in general, are a strong necessity, even at the aggregate
level.
When we use a multivariate MRA that includes the impact factor and possibly other
moderator variables, some judgment is required to identify the best estimate of these health
care related elasticities. That is, we must choose the best or most appropriate values for the
other independent variables. As the winner’s curse reflects a form of publication bias, the
best estimate of income elasticity that minimizes this bias assumes that SE=0 and Impact=0.
When we impute the elasticities using these values in the multiple MRAs of the price
elasticity of prescribed drugs, no statistically or practically significant price effect remains,
regardless of our choice of the other moderating variables.
Applying this approach to estimate the income elasticity of health care we find that it
is not statistically different from zero either ( β̂ =.001; t=.11; accept H0: β = 0), column 4
Table 3. Adding the proportion of the sample that comes from a National Health Service
(NHS) type system complicates but does not change this overall assessment. If we assume
that everyone is covered by an NHS type system, we get the same results. However, if
NHS=0 (i.e., no one is funded by the NHS), the estimate of income elasticity increases to 0.48
but is still much less than one (reject H0: β > 1; t=-4.33; p<.001). Note that the MRA
coefficient on NHS is negative and statistically significant, as one would expect. As a greater
proportion of the sample is covered by an NHS type system, health care expenditures would
be expected to be less sensitive to income changes because of centralized price setting.
Regardless of which MRA model we use in Table 3 or 4, reasonable choices of the values on
the other moderating variables return the prediction that health care is a necessity. Once
allowance is made for publication selection, the notion that health care is a necessity is
robustly corroborated by our MRA.
IV. CONCLUSION
This paper reports evidence consistent with the hypothesis of a winner’s curse and publication
selection bias in health care research on income and price elasticities. The winner’s curse
hypothesis claims that “the more extreme, spectacular results” are those preferentially
selected for publication (Young et al., 2008). This hypothesis is directly related to the long

19
recognized and widely accepted problem of publication selection. If health research were to
contain a winner’s curse, we would expect to find that larger and more statistically significant
findings are reported by higher impact journals. Our meta-analysis of health economics
research on aggregate income and pharmaceutical price elasticites exhibits precisely this
pattern; thus, indicating WCRP. Our meta-regression analysis identifies a clear and robust
pattern in published health research. Higher impact journals report larger income elasticities.
Once allowance is made for publication selection bias and/or WCRP, the research
record clearly rejects the idea that health care has an income elasticity greater than one and
therefore that it is a ‘luxury’ good, in any sense of this term. All the corrected estimates of
the income elasticity of health care are less than one but often not statistically different than
zero, implying that health care is, if anything an absolute necessity. As Doucouliagos and
Stanley (2012) show, when an area of research contains contested theories, selection biases
are minimised. In contrast, when there is a widely accepted view (e.g., that prescribed drugs
are price sensitive or that health care is an aggregate luxury good), reported results tend to
confirm the consensus view, leading to large selection bias unless corrected by MRA.
We do not wish to claim that the winner’s curse and publication selection bias are the
only explanation of the widely reported evidence that health care is a luxury at the aggregate
level. No doubt there are other potential explanations for the patterns that we find among
reported price and income elasticities; certainly in the case of the income elasticity similar
data have been used in multiple studies for example. Moreover, we did not and cannot
entirely control for biases associated with spurious regressions, endogeneity, or omitting price
and technology variables in the income equations. Thus, it is possible that what we identify
as publication selection bias or the winner’s curse may also be explained by a systematic
selection of any number of these or other biases. However, if there is systematic selection of
given estimate levels, as our MRA finds, then WCRP and publication selection remain a
valid, if not unique, explanation. After all, such preferential selection of random errors and
biases is the very definition of WCRP and publication selection bias.
If our meta-analysis is accepted then it clearly shows that the income elasticity of
aggregate health care is not statistically greater than one, and that there is practically no
reduction in the consumption of prescribed drugs due to increases in prices. Thus policy
inferences built around the notion that health care is a luxury are wrong not only because they
misuse a microeconomic concept in a macroeconomic setting, but also because the published
research record, when corrected for publication bias, is not consistent with the notion that
aggregate health care is a luxury. While the shifting of copayments on to patients through

20
demand-risk sharing may do little to combat moral hazard in consumption or rising health
care expenditure generally.

21
References
AHCPR Trends in Personal Health Care Expenditures, Health Insurance and Payment
Sources, community based population, 1987–1995. Agency for Health Care Policy
and Research, Center for Cost and Financing Studies, National Medical Expenditure
Survey data, March, 1997.
American Psychological Association. Publication Manual of the American Psychological
Association (4th ed.). Washington, 1994.
Ashenfelter, O. and Greenstone, M. “Estimating the Value of a Statistical Life: The Importance
of Omitted Variables and Publication Bias.” American Economic Review 94, 2004, 454-
60,
Australian Government Productivity Commission. Impact of Advances in Medical Technology
on Australia, Commonwealth of Australia, Melbourne, 2005.
Barros, P. “The Black Box of Health Expenditure Growth Determinants,” Health Economics, 7,
1998, 533-544.
Begg, C. B. and Berlin, J.A. “Publication Bias: A Problem in Interpreting Medical Data,”
Journal of the Royal Statistical Society A, 151, 1988, 419-445.
Blomqvist, A. and Carter, R. “Is Health Care Really a Luxury”, Journal of Health Economics,
16, 1997, 207-229.
Carrion-i-Silvestre, J.L. “Health Care Expenditure and GDP: Are They Broken Stationary?”
Journal of Health Economics 24, 2005, 839–854.
Card, D. and Krueger, A.B. “Time-Series Minimum-Wage Studies: A Meta-Analysis,”
American Economic Review, 85, 1995, 238-243.
Carver, R.P. “The Case Against Statistical Testing,” Harvard Educational Review, 48, 1978,
378-399.
Charemza, Wojciech and Derek Deadman. New Directions in Econometric Practice, 2nd
edition. Cheltenham: Russell Edward Elgar, 1997.
Cohen, J. “The Earth Is Round (p < .05),” American Psychologist, 49, 1994, 997-1003.
Copas, J. “What Works? Selectivity Models and Meta-Analysis,” Journal of the Royal
Statistical Society, A , 161, 1999, 95-105.
Costa-Font, J., Gammill, M. and Rubert, G. “Biases in the healthcare luxury good hypothesis:
A meta-regression analysis,” Journal of the Royal Statistical Society A, 174, 2011, 95-
102.

22
Daniel, L.G., “The Statistical Significance Controversy Is Definitely Not Over: A Rejoinder
to Responses by Thompson, Knapp, and Levin,” Research in the Schools, 5, 1998, 63-
65.
Davidson, J., Hendry, D., Srba, F. and S. Yeo. “Econometric Modeling of the Aggregate
Time-Series Relationship between Consumers’ Expenditures and Income in the
United Kingdom.” Economic Journal 88, 1978, 661-692.
Davidson, R. and MacKinnon, J.G. Econometric theory and methods. Oxford: Oxford
University Press, 2004. De Long, J.B. and Lang, K. “Are All Economic Hypotheses False?” Journal of Political
Economy, 100, 1992, 1257-72.
Di Matteo, L., Di Matteo, R. “Evidence on the Determinants of Canadian Provincial Health
Expenditures 1965–1991.” Journal of Health Economics 17, 1998, 211–228.
Doucouliagos, H. “Publication Bias in the Economic Freedom and Economic Growth
Literature.” Journal of Economic Surveys, 19, 2005, 367-88.
Doucouliagos, H. and Stanley, T.D. “Publication Selection Bias in Minimum-Wage
Research? A Meta-Regression Analysis,” British Journal of Industrial Relations, 47,
2009, 406-29.
Doucouliagos, H. and Stanley, T.D. “Theory Competition and Selectivity.” Journal of
Economic Surveys, 2012, forthcoming.
Doucouliagos, H., Stanley, T.D. and Giles, M. “Are Estimates of the Value of a Statistical
Life Exaggerated?” Journal of Health Economics, 2012, forthcoming.
Egger, M., and Smith, D.G. “Misleading Meta-Analysis,” British Medical Journal, 311, 1995,
753-4.
Egger, M., Smith, D.G., Scheider, M., and Minder, C. “Bias in Meta-Analysis Detected by a
Simple, Graphical Test,” British Medical Journal, 316, 1997, 629-34.
Feige, E.L. “The Consequence of Journal Editorial Policies and a Suggestion for Revision,”
Journal of Political Economy, 83, 1975, 1291-5.
Gemmill, M. C. & Joan Costa-Font, J. and McGuire, A. "In search of a corrected prescription
drug Elasticity estimate: a meta-regression approach," Health Economics, 16, 2007,
627-643
Gerdtham, Ulf-G. & Jonsson, Bengt. "International comparisons of health expenditure:
Theory, data and econometric analysis," in: A. J. Culyer & J. P. Newhouse (eds.),
Handbook of Health Economics, 11-53, Amsterdam: Elsevier, 2000.

23
Gerdtham, U.-G., Lothgren, M. “On Stationarity and Cointegration of International Health
Expenditure and GDP.” Journal of Health Economics, 19, 2000, 461–475.
Gerdtham, U.G., Sogaard, J., Andersson, F., Jonsson, B. “An Econometric Analysis of Health
Care Expenditure: A Cross-Section Study of the OECD Countries,” Journal of Health
Economics 11, 1992, 63–84.
Getzen, T.E., “Health Care is an Individual Necessity and a National Luxury: Applying
Multilevel Decision Models to the Analysis of Health Care Expenditures.” Journal of
Health Economics, 19, 2000, 259-270.
Glied, S. (2009) “Mandates and the Affordability of Health Care.” Inquiry, 46, 2009, 203-
214.
Görg, H. and Strobl, E. “Multinational Companies and Productivity Spillovers: A Meta-
Analysis.” Economic Journal, 111, 2001, F723-740.
Granger, C.W.J. “Spurious Regressions in Econometrics,” in B. Baltagi (ed.) A Companion to
Econometric Theory, Oxford: Blackwell, 557-61, 2001.
Granger, C.W.J. and Newbold, P. “Spurious Regressions in Econometrics.” Journal of
Econometrics, 2, 1974, 111-20.
Hansen, P. and King, A. “Health Care Expenditure and GDP: Panel Data Unit Root Tests –
Comment” Journal of Health Economics, 17, 1998, 377-381
Harlow, L. L., Mulaik, S. A., and Steiger, J. H. (Eds.) What If There Were No Significance
Tests? Mahwah, NJ: Erlbaum, 1997.
Higgins J.P.T. and Spiegelhalter D.J. “Being Sceptical about Meta-Analyses: A Bayesian
Perspective on Magnesium Trials in Myocardial Infarction,” International Journal of
Epidemiology, 31, 2002, 96-104.
Hong, H. and Shum S.G. “Increasing Competition and the Winner’s Curse: Evidence from
Procurement.” Review of Economic Studies, 69, 2002, 871-98.
Hopewell, S., Loudon, K., Clarke, M.J., Oxman, A.D. and K. Dickersin, K. “Publication Bias
in Clinical Trials due to Statistical Significance or Direction of Trial Result,”
Cochrane Review, Issue 1, 2009. http://www.thecochranelibrary.com.
Ioannidis J.P.A. “Contradicted and Initially Stronger Effects in Highly Cited Clinical
Research,” Journal of the American Medical Association, 294, 2005, 218-28.
Jewell, T., Lee, J., Tieslau, M., Strazicich, M.C. “Stationarity of Health Expenditures and
GDP: Evidence from Panel Unit Root Tests with Heterogeneous Structural Breaks.”
Journal of Health Economics 22, 2003, 313–323.
Johnson, A. “Publish and Be Wrong,” Economist, October 9, 2008.

24
Krakovsky, M. “Register or Perish,” Scientific American, 291, 2004, 18-20, Dec.
Krassoi-Peach, E. and Stanley, T.D. “Efficiency Wages, Productivity and Simultaneity: A
Meta-Regression Analysis,” Journal of Labor Research, 30, 2009, 262-8.
Laird, N. and Mosteller, F. “Discussion of the Paper by Begg and Berlin.” Journal of the
Royal Statistical Society (Series A),151, 1988, 456. Leu, R. E. “The Public-Private Mix and International Health Care Costs,” in: Culyer, A. J. and
Jonsson, B.(eds.) Public and Private Health Services: Complementarities and
Conflicts, New York.Blackwell, 41-63, 1986.
Lovell, M.C. “Data Mining,” The Review of Economics and Statistics, 65, 1983, 1-12.
McCoskey, S. and Selden, T. “Health Care Expenditure and GDP: Panel Data Unit Root Test
Results,” Journal of Health Economics,17, 1998, 369-376
Mookerjee, R. A. “Meta-Analysis of the Export Growth Hypothesis.” Economics Letters 91,
2006, 395-401.
Moreno, S.G., Sutton, A.J., Ades, A., Stanley, T.D Abrams, K.R., Peters, J.L., and Cooper,
N.J. “Assessment of regression-based methods to adjust for publication bias through a
comprehensive simulation study,” BMC Medical Research Methodology, 9:2, 2009a,
http://www.biomedcentral.com/1471-2288/9/2.
Moreno, S.G., Sutton, A.J., Turner E.H., Abrams, K.R., Cooper, N.J, Palmer, T.M. and Ades,
A.E. “Novel methods to deal with publication biases: Secondary analysis of
antidepressant trials in the FDA trial registry database and related journal
publications,” British Medical Journal, 339, 2009b, 494-98.
Nelson J. “Alcohol Marketing, Adolescent Drinking and Publication Bias in Longitudinal
Studies: A Critical Survey Using Meta-Analysis.” Journal of Economic Surveys, 25,
2011, 191–232.
Newhouse, J.P. “Medical Care Expenditure: A Cross-National Survey.” Journal of Human
Resources, 12, 1977, 115-125.
Newhouse J. P. “Cross-National Differences in Health Spending: What Do They Mean?”
Journal Health Economics, 6, 1987, 159–162.
Newhouse J.P. “Medical Care Costs: How Much Welfare Loss?” Journal of Economic
Perspectives 6(3), 1992, 3-21.
Parkin, D., McGuire, A. and Yule, B. “Aggregate Health Care Expenditures and National
Income: Is Health Care a Luxury Good?” Journal of Health Economics 6, 1987, 109-
127.

25
Phelps, C.E. Eight Questions You Should Ask About Our Health Care System (Even if the
Answers Make You Sick), Stanford CA: Hoover Institution Press, 2010.
Rose, A.K. and Stanley, T.D. “A Meta-Analysis of the Effect of Common Currencies on
International Trade,” Journal of Economic Surveys, 19, 2005, 347-65.
Rosenthal, R. “The ‘File Drawer Problem’ and Tolerance for Null Results,” Psychological
Bulletin, 86, 1979, 638-41.
Stanley, T.D. “Wheat from Chaff: Meta-Analysis as Quantitative Literature Review,” Journal
of Economic Perspectives, 15, 2001, 131-50.
Stanley, T.D. “Beyond Publication Selection,” Journal of Economic Surveys, 19, 2005, 309-
345.
Stanley, T.D. “Meta-Regression Methods for Detecting and Estimating Empirical Effect in
the Presence of Publication Bias. Oxford Bulletin of Economics and Statistics, 70,
2008, 103-127.
Stanley, T.D. and S.B. Jarrell. “Meta-Regression Analysis: A Quantitative Method of
Literature Surveys,” Journal of Economic Surveys, 3, 1989, 54-67.
Stanley, T.D. and H. Doucouliagos. “Picture This: A Simple Graph That Reveals Much Ado
About Research,” Journal of Economic Surveys, 24, 2010, 170-91.
Stead, L.F., Perera, R., Bullen, C., Mant, D., and Lancaster, T. “Nicotine Replacement
Therapy for Smoking Cessation,” The Cochrane Library, Issue 2, 2008.
http://www.thecochranelibrary.com.
Sterling T.D. “Publication Decisions and their Possible Effects on Inferences Drawn from Tests
of Significance,” Journal of the American Statistical Association, 54, 1959, 30-34.
Sterling, T.D., Rosenbaum, W.L. and Weinkam, J.J. “Publication Decisions Revisited: The
Effect of the Outcome of Statistical Tests on the Decision to Publish and Vice Versa.
American Statistician, 439, 1995, 108-112.
Sutton, A.J., Abrams, K.R., Jones, D. R., Sheldon, T. A. and Song, F. Methods for Meta-
analysis in Medical Research, Chichester: John Wiley and Sons, 2000.
Thaler, R.H. “Anomalies: The Winner’s Curse,” Journal of Economic Perspectives, 2, 1988,
191-202.
Tullock, G. “Publication Decisions and Tests of Significance – A Comment,” Journal of the
American Statistical Association 54, 1959, 593.
Turner, E.H., Matthews, A.M., Linardatos, E., Tell. R.A. and Rosenthal, R. “Selective
Publication of Antidepressant Trials and Its Influence on Apparent Efficacy,” New
England Journal of Medicine, 358, 2008, 252-60.

26
Young N.S., Ioannidis J.P.A., Al-Ubaydli, O. “Why Current Publication Practices May
Distort Science,” PLoS Med, 5, 2008. doi:10.1371/journal.pmed.0050201.
27
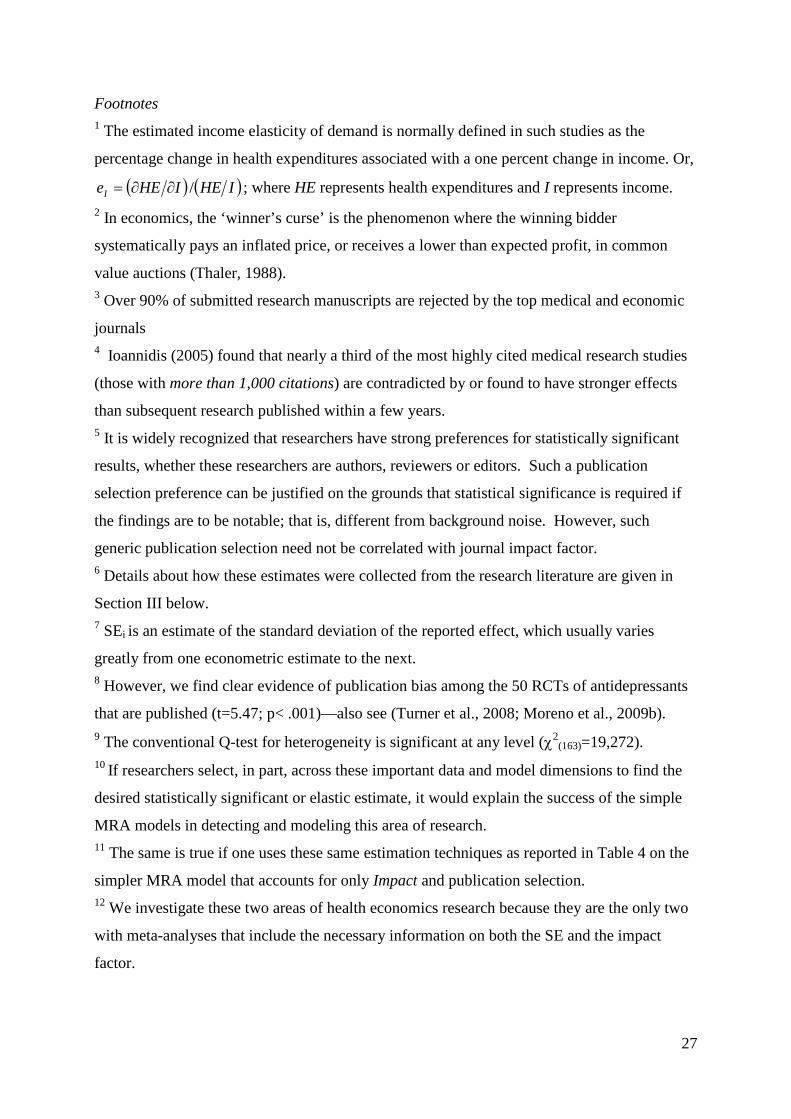
Footnotes 1 The estimated income elasticity of demand is normally defined in such studies as the
percentage change in health expenditures associated with a one percent change in income. Or,
( ) ( )IHEIHEeI /∂∂= ; where HE represents health expenditures and I represents income. 2 In economics, the ‘winner’s curse’ is the phenomenon where the winning bidder
systematically pays an inflated price, or receives a lower than expected profit, in common
value auctions (Thaler, 1988). 3 Over 90% of submitted research manuscripts are rejected by the top medical and economic
journals 4 Ioannidis (2005) found that nearly a third of the most highly cited medical research studies
(those with more than 1,000 citations) are contradicted by or found to have stronger effects
than subsequent research published within a few years. 5 It is widely recognized that researchers have strong preferences for statistically significant
results, whether these researchers are authors, reviewers or editors. Such a publication
selection preference can be justified on the grounds that statistical significance is required if
the findings are to be notable; that is, different from background noise. However, such
generic publication selection need not be correlated with journal impact factor. 6 Details about how these estimates were collected from the research literature are given in
Section III below. 7 SEi is an estimate of the standard deviation of the reported effect, which usually varies
greatly from one econometric estimate to the next. 8 However, we find clear evidence of publication bias among the 50 RCTs of antidepressants
that are published (t=5.47; p< .001)—also see (Turner et al., 2008; Moreno et al., 2009b). 9 The conventional Q-test for heterogeneity is significant at any level (χ2
(163)=19,272). 10 If researchers select, in part, across these important data and model dimensions to find the
desired statistically significant or elastic estimate, it would explain the success of the simple
MRA models in detecting and modeling this area of research. 11 The same is true if one uses these same estimation techniques as reported in Table 4 on the
simpler MRA model that accounts for only Impact and publication selection. 12 We investigate these two areas of health economics research because they are the only two
with meta-analyses that include the necessary information on both the SE and the impact
factor.

28
13 These hypotheses about publication selection are directional. Thus, conducting a one–tail
test is entirely appropriate. The MRA coefficients on Impact in all columns are thereby
statistically significant at the conventional .05, or lower, level (Table 5).

For further information on this or any of the
Health publications contact:
Naho Ollason
Managing Editor
LSE Health
The London School of Economics and Political Science
Houghton Street
London WC2A 2AE
Tel: + 44 (0)20 7955 6989
Fax: + 44 (0)20 7955 6090
Email: [email protected]
Website: lse.ac.uk/LSEHealthAndSocialCare/aboutUs/LSEHealth/home.aspx
11_0997 Working paper 24 new size:Layout 1 20/1/12 15:24 Page 2