the evolution of amorphous hydrocarbons in the ism: dust
TRANSCRIPT

arX
iv:1
411.
6293
v1 [
astr
o-ph
.GA
] 23
Nov
201
4Astronomy & Astrophysicsmanuscript no. APJones˙etal˙2013˙final c© ESO 2014November 25, 2014
The evolution of amorphous hydrocarbons in the ISM:dust modelling from a new vantage point
A.P. Jones1,2, L. Fanciullo1,2, M. Kohler1,2, L. Verstraete1,2, V. Guillet1,2, M. Bocchio1,2, N. Ysard1,2
1 CNRS, Institut d’Astrophysique Spatiale, UMR8617, Orsay F-91405, France2 Universite Paris Sud, Institut d’Astrophysique Spatiale, UMR8617, Orsay F-91405, France
e-mail:[email protected]
Received 12 April 2013/ Accepted 15 July 2013
ABSTRACT
Context. The evolution of amorphous hydrocarbon materials, a-C(:H), principally resulting from ultraviolet (UV) photon absorption-induced processing, are likely at the heart of the variations in the observed properties of dust in the interstellar medium.Aims. The consequences of the size-dependent and compositional variations in a-C(:H), from aliphatic-rich a-C:H to aromatic-richa-C, are studied within the context of the interstellar dustextinction and emission.Methods. Newly-derived optical property data for a-C(:H) materials, combined with that for an amorphous forsterite-type silicatewith iron nano-particle inclusions, a-SilFe, are used to explore dust evolution in the interstellar medium.Results. We present a new dust model that consists of a power-law distribution of small a-C grains and log-normal distributions oflarge a-SilFe and a-C(:H) grains. The model, which is firmly anchored by laboratory-data, is shown to quite naturally explain thevariations in the infrared (IR) to far-ultraviolet (FUV) extinction, the 217 nm UV bump, the IR absorption and emission bands and theIR-mm dust emission.Conclusions. The major strengths of the new model are its inherent simplicity and built-in capacity to follow dust evolution ininterstellar media. We show that mantle accretion in molecular clouds and UV photo-processing in photo-dominated regions arelikely the major drivers of dust evolution.
Key words. Interstellar Medium: dust, emission, extinction – Interstellar Medium: molecules – Interstellar Medium: general
1. Introduction
The evolution of interstellar dust is a key but complex issuethat is now receiving some well-focussed attention. In particular,hydrocarbon solids (i.e., a-C:H and a-C, also known as HAC)present a particular challenge because of their inherent com-plexity and also because they appear to be rather vulnerabletodestruction (e.g., Serra Dıaz-Cano & Jones 2008; Jones & Nuth2011). Further, they appear to undergo rather complex, size-dependent evolution arising, principally, from ultraviolet (UV)photon absorption leading to photo- or thermal-processing(e.g.,Jones 2009, 2012a,b,c) and incident ion and electron collisionsin shock waves and in a hot gas (e.g., Micelotta et al. 2010a,b;Bocchio et al. 2012). The evolution of their properties havere-ceived quite some interest as a model for the solid carbonaceousmatter in the interstellar medium (ISM,e.g., Jones et al. 1990;Duley 1995; Duley et al. 1997; Dartois et al. 2004a,b, 2005;Pino et al. 2008; Serra Dıaz-Cano & Jones 2008; Jones 2009;Godard & Dartois 2010; Godard et al. 2011; Compiegne et al.2011), in circumstellar media (e.g., Goto et al. 2003; Sloan et al.2007) and in the Solar System (e.g., Dalle Ore et al. 2011).
By dustevolutionwe here meana change in the observableproperties of the dust arising from processes such as accretion,coagulation, (photo-)fragmentation, erosion and grain chargeeffects.This evolution may be constructive, as for accretion andcoagulation and lead to an increase in the total dust mass and/orits mean size, or destructive, as for (photo-)fragmentation anderosion and lead to a decrease in the total dust mass and/or itsmean size.
The evolution of hydrocarbon solids was recently elu-cidated in detail in the series of preceding papers and theircorrigenda (Jones 2012a,b,c,d,e, hereafter called papersI,II and III) and this work builds upon these foundations inorder to explore some of the consequences arising from theuse of the optEC(s)(a) optical property data to explain theobserved interstellar dust extinction and emission properties. Asdescribed in papers I to III, amorphous hydrocarbon particlesare macroscopically-structured (i.e., a contiguous network ofatoms), solid-state materials consisting of only carbon andhydrogen atoms. For reference, a-C:H materials are H-rich(∼ 15− 60 at. % H), aliphatic-rich and wide band gap (> 1 eV),whereas a-C materials are H-poor (. 15 at. % H), aromatic-rich and narrow band gap (∼ −0.1 to 1 eV). The designationa-C(:H) is used here to cover the whole family of H-richa-C:H to H-poor a-C carbonaceous solids, whose propertieshave been well-studied within both the physics and astro-physics communities (e.g., Phillips 1979; Dohler et al. 1980;Thorpe 1983; Robertson 1986; Robertson & O’Reilly 1987;Angus & Jansen 1988; Angus & Hayman 1988; Robertson1988; Tamor & Wu 1990; Robertson 1991; Mennella et al.1995, 1996; Ferrari & Robertson 2000; Robertson 2001,2002; Mennella et al. 2003; Ferrari & Robertson 2004;Kassavetis et al. 2007; Llamas-Jansa et al. 2007; Mennella2008; Gadallah et al. 2011).
This paper uses a slightly-modified version of the laboratory-constrained optEC(s)(a) data presented in paper III, which nat-urally explain many of the observed properties attributed tocarbonaceous dust in the ISM. Here we insert these data
1
Please give a shorter version with:\authorrunning and/or \titilerunning prior to \maketitle
into the DustEM dust extinction and emission calculator(Compiegne et al. 2011) in order to quantitatively examineandexplore their viability as a tool in explaining the range of in-terstellar hydrocarbon dust extinction and emission observablesand their associated (non-)correlations.
This work is a departure from the ‘traditional’ interstel-lar dust modelling methodology because it adopts a ‘holistic’or ‘global’ approach, in which we are able to coherently varythe dust properties over extreme-ultraviolet (EUV) to cm wave-lengths. The result is a dust model that self-consistently explainsalmost all dust observables. This is important because it pavesthe way for an investigation of the interdependencies betweenthe dust observables and, hence, their variations, correlations andnon- or anti-correlations.
This paper is organised as follows: Sections 2 and 3 sum-marise a-C(:H) dust photo-processing and its re-formationandre-accretion in the ISM, Section 4 briefly summarises the con-straints imposed on dust models by experimental data and diffuseISM dust observations, Section 5 presents our new evolutionarydust model, Section 6 discusses the astrophysical implicationsof the new model, Section 7 gives a schematic view of the a-C(:H) dust life-cycle and explores its evolution and variation inthe ISM and Section 8 concludes this work.
2. Carbon dust photo-processing
Carbonaceous dust will be processed (evolve) as it traverses theISM from its sites of formation to its demise in energetic re-gions and its eventual re-birth in some dense phase of the ISM(e.g., Jones & Nuth 2011). For small hydrocarbon grains andpolycyclic aromatic hydrocarbons (PAHs), species of moleculardimensions, this processing can be catastrophic because high-energy photon absorption and electron collisions will result inhighly electronically-excited particles that undergo dissociationbefore they can relax radiatively (e.g., Micelotta et al. 2010a,b;Bocchio et al. 2012).
Principal among the processes that affect the structure andcomposition of a-C(:H) dust is the photolytic and/or thermal pro-cessing arising from UV-EUV photon absorption (e.g., papers IIand III). As shown in papers II and III the relevant time-scales fora-C(:H) photo-processing will be composition-dependent (i.e.,depend on the H content,XH, which is directly proportional tothe optical band gap,Eg) and also size-dependent. The character-istic time-scale for the direct photo-processing (photo-darkeningor aromatisation) of a-C(:H) grains in the diffuse ISM appearsto be relatively short and of the order of a million years for a-C(:H) nano-particles (see papers II and III and their corrigenda).Thus, it is to be expected that small grains and thin mantles,ofa-C(:H), ought to be maximally-aromatised in the diffuse ISM1.Large a-C(:H) grains (a ≥ 200 nm) will, however, remain pre-dominantly aliphatic-rich because their cores, which are not UVphoto-processed, make up≥ 70% of the grain volume. This ap-pears to be qualitatively consistent with observations,i.e., thatthe smaller carbonaceous particles are “aromatic-rich” while thelarger carbonaceous grains are “aliphatic-rich” and that the car-bon mantle/coating on amorphous silicate dust must be ratheraromatic (e.g., Brooke et al. 1999).
Adamson et al. (1999) showed that the 3.4µm absorptionband is not polarised along the line of sight towards the GalacticCentre source Sagittarius A IRS 7. At the time there were
1 Complete aromatisation is expected to occur to a depth of≃ 20 nm,which is where the optical depth for EUV-UV photons (Ehν & 10 eV)reaches unity for all a-C(:H) materials (see paper II).
no spectropolarimetric observations of the 9.7µm silicate bandalong this line of sight. This led Li & Greenberg (2002) to con-clude that there was, at that time, no reason to reject a sili-cate core-carbonaceous organic mantle interstellar dust model.The modelling work by Li & Greenberg (2002) showed that, al-though both the 3.4µm CH and 9.7µm silicate bands are ex-pected to be polarised, they are unlikely to be polarised to thesame degree. However, Chiar et al. (2006) found that the 3.4µmband is essentially unpolarised along the same Galactic Centrelines of sight towards GCS 3-II and GCS 3-IV where the 9.7µmsilicate band is polarised. Thus, it is clear that any carbonaceousmaterial associated with the silicate dust cannot be aliphatic-rich because of the lack of polarisation of the 3.4µm absorp-tion band. This then implies that there must be a population oflarge (a ≫ 20 nm) carbonaceous grains in the ISM that containa significant aliphatic-rich component that is the origin ofthe3.4µm absorption band (e.g., Jones 2012a,c) and that this dustcomponent is separate from the large, amorphous silicate grainpopulation.
However, the exact nature of, and time-scale for, UVphoton-induced processing is rather difficult to quantify becauseof uncertainties in the wavelength-dependence of the photo-dissociation cross-sections, and the importance of competingchannels, such as UV photon absorption leading to heating orfluorescence (e.g., paper III). In this work we therefore keep anopen mind on this subject, construct a viable model for interstel-lar carbonaceous dust, using the optEC(s)(a) data, that best fitsthe observations and the variations in those observations.
3. a-C:H re-formation/accretion in the ISM
The work presented in paper II indicates that enhanced largeparticle (a ≥ 100 nm) scattering at near-IR to IR wavelengths(1 − 5µm) occurs in wide band gap a-C:H materials (i.e.,aliphatic-rich a-C:H withEg > 1.25 eV). Carbon accretion fromthe gas phase in a moderately extinguished medium (AV & 1)will tend to form wide band gap a-C:H mantles on all grains.Such mantles, accreted in cloud cores, could be an explanationfor the “cloudshine” observed predominantly in theH (1.6µm)and Ks (2.2µm) bands and explained as starlight scattered bythe dust in cloud interiors (Foster & Goodman 2006). Possiblyalso related to a-C:H mantling is the observed “coreshine” effectobserved in the Spitzer IRAC 3.6 and 4.5µm bands, which isassumed to arise from cloud core dust emission (Pagani et al.2010; Steinacker et al. 2010). It is possible that the observed“coreshine” could also be due to the scattering of starlightbya-C:H grain mantles or it could be due to luminescence from H-rich, a-C:H nano-particles recently released from carbonaceousmantles accreted within molecular clouds. The latter scenario issimilar to the recently-proposed mechanism for fullerene forma-tion around planetary nebulæ via the photo-processing and vi-brational excitation of “arophatic” clusters derived froma-C:Hparticles formed in denser regions (Bernard-Salas et al. 2012;Micelotta et al. 2012).
The observed “cloudshine” and “coreshine” can therefore bere-interpreted in terms of the scattering and/or emission by H-rich, carbonaceous grains formed by the accretion of gas phasecarbon into aliphatic-rich mantles within molecular clouds. Aninitially-accreted a-C(:H) mantle will probably be ratherH-poor(i.e., a-C) where the ambient radiation field is only weakly atten-uated because of UV photon-driven dehydrogenation. However,with increasing density and extinction the accreting mantle willbe H-rich (i.e., a-C:H). The maximum thickness of an a-C(:H)mantle is likely to be of the order of a few nm (e.g., Jones et al.
2

Please give a shorter version with:\authorrunning and/or \titilerunning prior to \maketitle
1990). This carbonaceous mantle accretion-transformation sce-nario could quite naturally explain the observed variations inthe far-infrared (FIR) to mm dust emission in the transitionbe-tween high-density/low-excitation molecular clouds and low-density/high-excitation photon-dominated regions (PDRs, seeSection 7.2).
4. Diffuse ISM dust constraints
Observations, complimented by fundamental solid-state physics,optical property modelling and experimental data, impose strin-gent constraints on interstellar dust analogue materials andthe models that use these data. Any viable dust model musttherefore be carefully constructed within the framework oftheseconstraints.
Observational constraintsinclude the:
1. λ-dependent EUV to FIR extinction,2. λ-dependent albedo and scattering,3. uniformity of the curvature of the far-ultraviolet (FUV)ex-
tinction,4. fixed UV bump position and limited variations in width,5. FUV, UV bump, visible/near-IR (NIR) and mid-IR (MIR)
(non-)correlations,6. FUV and UV bump (non-)correlations with (C/H)dust,7. λ-dependent polarisation; polarisation-to-extinction ratio,8. NIR-FIR absorption and emission bands,9. extended red emission (ERE) and blue luminescence (BL),
10. full EUV-cm dust spectral energy distribution (SED),11. cosmic abundance constraints (O, C, Si, Mg, Fe . . . ),12. known dust sources and pre-solar grain compositions,13. x-ray halo and absorption data,14. inferable dust (re-)formation processes in the ISM, and15. physical reasonableness and survivability in the ISM.
Experimental constraints include the measured behaviours of:
1. material optical properties,2. T-dependence of dust analogue optical properties,3. quantum efficiency of likely ERE and BL carriers, and4. material deposition onto a substrate (accretion).
Modelling constraints include the:
1. shape (irregularity) and structure (core-mantle, aggregate),2. dust size distribution (power law, log-normal, . . . ),3. small size (a . 10 nm) of FUV and UV bump carriers, and4. a de-coupling of the FUV, UV bump and visible extinction.
As shown by Greenberg & Chlewicki (1983), particles thatproduce the UV bump at 217 nm, apparently, cannot contributesignificantly to the FUV extinction and, further, the particlesthat are responsible for the UV bump can only make a smallcontribution to the extinction longwards of∼ 170 nm. Theyalso infer that the physical characteristics of the FUV ex-tinction carriers“remain fairly stable once the grains haveemerged from the molecular cloud phase of their evolution.”Greenberg & Chlewicki (1983) also convincingly show that anydust model for which the FUV extinction is a sum of car-bonaceous/graphite and silicate contributions is inconsistentwith observations. The Mathis et al. (1977) and Draine & Lee(1984) models, and also the more recent Li & Draine (2001) andCompiegne et al. (2011) models, do not satisfy this constraint.
Fitzpatrick (2004) and Fitzpatrick & Massa (2007, 2009)have undertaken the most recent and detailed series of analy-ses of the extinction curve component (non-)correlations andwe will use these studies as the basis for comparison of theoptEC(s)(a) model data with observations. From these works wenote that the major observed trends and variations that needtobe explained by any viable dust model are:
1. The FUV extinction rise (or curvature) and the intercept ofan underlying linear component at infinite wavelength, in anE(λ − V)/E(B − V) vs.1/λ plot, are very well correlated.
2. The 217 nm UV bump characteristics:– small peak position variations: 4.5903± 0.0085µm−1
(217.85± 0.91 nm).– a range of UV bump widths: FWHM 1.00± 0.15µm−1.– no correlation between peak position and width.– broader where the FUV curvature is greater.– strongest for intermediate levels of FUV extinction.– weaker for high or low FUV extinction.– weaker for low or high values ofRV .
3. The FUV extinction rise and UV bump do not appear to cor-relate with the abundance of the mid-IR (12 and 25µm) emit-ters (Boulanger et al. 1994).
4. The IR extinction, forλ > 1µm, exhibit a power-law-like be-haviour that is a function ofRV (Fitzpatrick & Massa 2009).
5. Towards a more realistic interstellar dust model
Based on earlier considerations (e.g., Jones et al. 1990; Jones2001; Jones & Nuth 2011), the work of Kohler et al. (2011,2012),Plancksatellite observations (Planck Collaboration et al.2011b,a), and the optEC(s)(a) model data (papers I to III), wesuggest that the usual decomposition of the interstellar dustspecies into two major populations of amorphous carbona-ceous and silicate grains remains the most viable explanation.However, the newly-available optEC(s)(a) data imply that ma-terial composition and size effects likely play an important role.The a-C(:H) component is the detailed subject of this, and papersI–III, and has properties determined by and calibrated against theavailable laboratory data.
5.1. Interstellar dust components
In the ISM it is hard to see how the silicate and carbonaceousdust populations could be completely segregated becausemixing, even at some minor (contaminant) level, must occur.Thus, the amorphous silicates must be mixed, to some degree,with a carbonaceous dust component (e.g., Mathis & Whiffen1989; Jones et al. 1990). In Table 1 and Fig. 1 we summariseour assumed dust properties as a function of size and in thefollowing we describe these in more detail:1) a-C(:H) grains with size-dependent properties:2 This pop-ulation represents a fundamental continuity in composition andsize distribution, which is qualitatively consistent witha-C:Hdust that has been exposed to the “equilibriating effects” of thelocal ISRF for at least 106 yr (see Fig. 18 in the Corrigendumto paper III), i.e., long enough for any sub-nm particles to be
2 For a-C(:H) particles, with fewer than several thousand atoms, sur-face hydrogenation becomes important. Also, the aromatic cluster sizesare limited by the particle radius and the band gap for small (a < 30 nm)a-C particles can be significantly higher than expected. Forexample, fora-C the band gap can be as low as≃ −0.1 eV but for a 1 nm radius a-Cparticle the band gap cannot be smaller than 0.7 eV (for full details seepaper III).
3

Please give a shorter version with:\authorrunning and/or \titilerunning prior to \maketitle
Table 1: The model dust compositions based on the optEC(s)(a) data and the dust observables.
material typical radius [nm] Eg(bulk) [ eV ] Eg(eff.) [ eV ] FUV UV bump vis.-NIR EBs 3.4µm abs. IR-mm
a-C < 1 0.1 > 0.8 • • × • × ×
a-C 1− 5 0.1 0.1− 0.8 • • ◦ ◦ × ×
a-C 5− 20 0.1 0.1 ◦ ◦ ◦ × × ◦
a-C:H/a-C 100− 200 2.5/0.1 2.5/0.1 × × ◦ × • •
a-SilFe/a-C 100− 200 ∼8/0.1 ∼8/0.1 × × • × × •
Notes:1. The materials for core/mantle particles are indicated as such in column 1.2. The symbols•, ◦ and× indicate major, minor and no contributions to the observed,FUV extinction, UV bump at 217 nm, visible-NIRextinction, emission bands (EBs), 3.4µm absorption and IR-mm continuum emission.3. The outer surfaces of the a-C:H grains are UV photo-processed (into a-C) to a depth of 20 nm (see paper II).4. The accreted and UV photo-processed a-C mantle on the amorphous silicates is 5 nm thick.5. The relative contributions of the small a-C particles to the UV bump and FUV extinction depend on the size distribution(see Sections 6.2.1and 6.2.2).
See Jones et al. (A&A, 558 A62, 2013)
Fig. 1: The model dust populations, as seen in cross-section. Inthe upper part the a-C:H/a-C grains are shown, where black rep-resents aromatic-rich material and white aliphatic-rich material.In the lower part amorphous silicate grains (green) are shownwith a 5 nm thick coagulated/accreted a-C mantle. The particleradii are indicated on a logarithmic scale.
aromatised to a-C.3 Any particles larger than a few tens of nmin radius will be incompletely aromatised or will consist ofanaliphatic-rich core surrounded by a more absorbing, aromatisedmantle layer. (Therefore, carbonaceous mantles. 20 nm thickwill be completely aromatised, see following.)2) a-Sil grains ± a-C(:H) mantles: The interpreta-tion of recent observations made by thePlanck satellite(Planck Collaboration et al. 2011b,a), coupled withHerscheland IRASdata, shows that the observed dust emission spectralenergy distribution (SED) in the diffuse ISM can be em-pirically, and extremely well, fit with a single temperature(Tdust ∼ 18 K), emissivity-modified (β ≃ 1.8) black-body. Thisstrongly suggests that the dust emission at long wavelengths
3 Aromatised a-C nano-particles consist of small aromatic clusters,with a few aromatic rings per cluster, that are covalently-linked togetherby aliphatic and olefinic bridging structures. They are three-dimensionalnetworks that intimately mix predominantly aromatic carbon but whichalso contain a significant aliphatic and olefinic carbon component in asingle, contiguous chemical structure. The term PAH cannotbe appliedto them because they are not purely aromatic carbon structures.
is dominated by emission from a single dust population thatmixes, predominantly, amorphous silicate (a-Sil) materials (e.g.,Coupeaud et al. 2011) with a carbonaceous (a-C or a-C:H)component in the form of mantles or accreted small grains(e.g., Kohler et al. 2011, 2012). The surface a-C(:H), whetheraccreted as a mantle or formed by the coagulation of small a-Cparticles, must be. 20 nm thick (the depth at which the opticaldepth for the FUV processing photons is unity) otherwiseit will be incompletely photolysedto a-C (see paper II). Ana-C:H mantle would be traceable through the polarisation ofthe aliphatic C−H 3.4µm absorption band, which will followthat of the host a-Sil. The presence of an a-C:H mantle on a-Sildust is inconsistent with observations (Adamson et al. 1999;Chiar et al. 2006). In our model we assume 5 nm thick a-Cmantles (Eg = 0.1 eV) on the a-Sil grains.For the amorphous silicate optical properties we use those foran amorphous forsterite-type silicate with iron incorporatedinto the material as nano-particle inclusions, a-SilFe, whichis equivalent to incorporating iron directly into the silicatelattice structure. In Appendix A we discuss the consequencesof this form of amorphous silicate, in relation to those of theusually-adopted optical properties for ‘astronomical silicates’(e.g., Draine & Lee 1984; Greenberg & Li 1996). We will in-vestigate the optical properties of the range of likely interstellaramorphous silicate dust analogue materials in a future paper.3) Coagulated, a-C(:H)-mantled a-Sil grains: Enhanced dustemissivities in denser regions of the ISM perhaps indicate theonset of dust coagulation into larger inhomogeneous aggre-gates, which is consistent with recent modelling results (e.g.,Kohler et al. 2011, 2012). This component therefore representsa coagulated mixing of all dust components, possibly with anadditional a-C:H mantle material accreted from the remnantcarbon in the gas phase, and also ice mantles in dense molecularclouds.
Comparing these dust populations with those used in theCompiegne et al. (2011) DustEM model, we find that there is nodirect one-for-one correspondence because of overlappingprop-erties. However, and in general, the small carbonaceous grains(a . 20 nm) are the carriers of the same observables as thecombined DustEM PAH and small amorphous carbon, SamC,grains. (Taken together we note that the combined DustEMPAH+SamC particles have a similar size distribution to oursmall a-C(:H) particles with a power-law size distribution.) Thelarge a-C:H/a-C grains are equivalent to the DustEM large amor-
4

Please give a shorter version with:\authorrunning and/or \titilerunning prior to \maketitle
phous carbon, LamC, grains and the large carbon-coated amor-phous silicates equivalent to the DustEM amorphous silicate,aSil, grains. Compared to most other dust models, we use anaturally-continuous distribution of carbonaceous grainproper-ties rather than separate and disconnected populations of smallcarbon grains and PAHs. For the model proposed here we find itnecessary to add an a-C mantle to the Fe-containing amorphoussilicate grains in order to increase their emissivity and decreasetheir temperature (see Appendix A and Section 6.2.6).
The proposed dust model has the advantage of adding a car-bonaceous component to the large (a ∼ 10− 4000 nm) silicatepopulation (see Fig. 1) that does not exhibit a 3.4µm aliphaticcarbon band but which ought to show a weak 3.3µm aromaticCH band and other associated CH and CC bands. However, aswe show later (see Section 6.1), the a-C mantles on the a-Silgrains do not appear to manifest any absorption features in the3µm region. In any event, the IR absorption signatures of thea-C mantles will not be observable in the diffuse ISM becausethey will be swamped by emission bands at the same wave-lengths. Observations of a 3.3µm aromatic CH band in absorp-tion would be possible along lines of sight where the emissionbands are weak or absent (e.g., towards young stellar objectsand the Galactic Centre, Smith et al. 1989; Sellgren et al. 1995;Brooke et al. 1999; Chiar et al. 2000). Brooke et al. (1999) findthat the optical depth of the 3.25µm ‘aromatic’ absorption fea-ture in their spectra correlates better with the optical depth of thesilicate feature than with the water ice feature, perhaps indicat-ing an aromatic carbon component more intimately associatedwith the amorphous silicate grains than with their accretedicemantles.
6. Astrophysical implications
The Li & Greenberg (1997) three-component dust model con-sists of large organic refractory-coated silicates (responsible forthe visible extinction and polarisation), empirical UV bump-carrying particles (with a weak contribution to the visibleex-tinction) and PAHs (responsible for the FUV extinction). Inthis model the extinction can naturally be decomposed intothree separate populations and it thus satisfies the observed ex-tinction constraints and (non-)correlations. It also satisfies theobserved wavelength-dependent polarisation and extinction-to-polarisation ratio. As we shall see the dust model that wehave developed bears some qualitatively-similar traits totheLi & Greenberg (1997) model. However, our model uses onlytwo dust materials,i.e., a-SilFe and a-C(:H). In the model two ofthe dust observables, the FUV extinction and the UV bump, aredue to the size-dependent properties of a-C(:H).
In order to illustrate the utility of the optEC(s)(a) data for ISMdust modelling we present a surprisingly-simple dust model,based on the discussion presented in the previous section. Thismodel uses three dust populations but only two dust materials(see Figs. 1 and 2):
1. A power-law distribution, with an exponential tail4, of small(0.4 to≃ 100 nm), a-C(:H) particles that have been photo-processed to depths of 20 nm and that show a continuity ofsize-dependent optical properties,
4 This exponential cut-off is required in order to limit the size of thelargest a-C particles when we explore variations in the power-law indexdue to dust evolution (see Section 6.2.1).
Fig. 2: The standard dust model size distributions. a-C-coated(Eg = 0.1 eV, mantle depth 5 nm) amorphous forsterite-type sil-icate grains with∼ 70% of the available iron in metallic, nano-particle inclusions (triple dot-dashed). Core/mantle, a-C:H/a-C (Eg = 2.5/0.1eV) particles: large, log-normal (dotted) andsmall, power-law with an exponential tail (dash-dotted). Thegrey line shows the overall a-C(:H) grain size distribution, withphysically-continuous properties, which is only separated into‘large’ and ’small’ components for modelling convenience.
2. a log-normal size distribution of large (≃ 200 nm) a-C:Hgrains (Eg = 2.5 eV)5 with an outer, photo-processed, a-Clayer (20 nm thick,Eg = 0.1 eV), and
3. a log-normal size distribution of large (≃ 200 nm) amor-phous forsterite-type silicate grains, with Fe nano-particle in-clusions (containing∼ 70 %≡ 22 ppm of the cosmic iron),6
that are coated with 5 nm thick a-C mantles (Eg = 0.1 eV).
With this model we are able to achieve an excellent fit to thedust observables using a coherent set of physically-realistic a-C(:H) and a-SilFe data that are based on laboratory measure-ments. In order to maximise the usefulness of the model wehave “astronomicalised” the optEC(s)(a) data. All of the re-quired adjustments are rather minor and physically-justified (seeAppendix C). With these modified data we have re-visited thecomparison of the optical properties of nm-sized a-C(:H) parti-cles with those of “astronomical PAHs” (as per paper III,i.e., seeSection C.4).
The model results are not particularly sensitive to the largea-C:H/a-C grain size distribution, which contains a relativelysmall fraction of the dust mass. We find that removing the largea-C:H/a-C dust component and extending the small a-C:H/a-Cgrain power law to 4900 nm gives an equally good fit to the dustobservables. However, at mm wavelengths the fit is not so goodbut we note that this is in a region where the amorphous silicateemission is not yet well constrained.
5 The dust extinction and emission results are not sensitive to the corea-C:H material band gap as long as it is≫ 0 eV. However, the observedIR absorption bands in the 3− 4µm region and the derived aliphaticCH2/CH3 ratio both require that the large a-C(:H) grain core materialhas a wide band gap,i.e., Eg & 2.5 eV (see paper I and paper III and thecorrigendum to paper III).
6 We note that adding 100 % of the cosmic iron into the silicatesdoesnot significantly modify the results.
5

Please give a shorter version with:\authorrunning and/or \titilerunning prior to \maketitle
In the following sub-sections we present the detailed extinc-tion and emission predictions for our dust model and comparethem to the observations of dust in the diffuse ISM.
6.1. A diffuse ISM dust model
The use of the optEC(s)(a) data, as derived in papers II and III,is quite naturally able to explain the major dust observables.However, the fit to the UV bump, the 6− 9µm emission bandsand the∼ 10− 40µm MIR continuum emission is not entirelysatisfactory. We note that the latter two deficiencies are related,for a better account for the 6− 9µm emission bands leads to in-creased energy-loss via band emission for the larger a-C:H par-ticles, which are then cooler and show weaker continuum emis-sion in the∼ 10−40µm region. Also, an increase in the IR bandintensities in the 6− 9µm region leads to a slight increase inthe extinction on the short wavelength side of the 9.7µm silicateband (see Fig. 3 top right). We note that the 9.7µm band in ourlaboratory data-derived a-SilFe is too narrow in comparison withthe Mathis (1990) extinction profile (see Fig. 3, top right, andAppendix A), even with the addition of carbonaceous mantles.However, the extinction towards the Galactic Centre observed byLutz et al. (1996) looks rather different in that the short wave-length dip appears to be filled in, tantalisingly exhibitingwhatcould be broad absorption bands in the 3−4 and 6−8µm regions(similar to but much stronger than those of the a-C:H materialsseen in Fig. 3 top right).
As mentioned above, we have adjusted the optEC(s)(a) datain a physically-meaningful way in order to get a good fit tothe astronomical data.7 Following our use of the publishedoptEC(s)(a) data we find that it is difficult to interpolate for in-termediate particle sizes because of the sharp IR bands, whichare composition- and size-dependent. Thus, the optical propertydata ideally need to be calculatedfrom scratchfor each requiredparticle size.8
Using the DustEM tool (Compiegne et al. 2011) we have cal-culated the predicted properties for our dust model. The smalland large a-C(:H) grain size distributions are shown separatelyin Fig. 2 but they do in fact form a single grain population withsize-dependent properties (the grey line in Fig. 2), which are im-portant fora . 30 nm (the separation into two distributions issimply a modelling convenience). Fig. 3 shows the UV-visibleextinction curve, the albedo,9 the IR extinction and the emis-sion spectrum (i.e., the SED). In this model the large a-C(:H)grain mass is about one tenth of that of the amorphous sili-cates, which reflects the lower resilience of carbonaceous dustto ISM dust processing, compared to silicate dust (see later, andalso Serra Dıaz-Cano & Jones 2008; Jones & Nuth 2011). Fig. 4gives the relative dust component contributions at each wave-length and shows that forλ ≈ 1− 60µm the emission is domi-nated by the small (power-law) a-C grains, forλ ≈ 60µm-1 mmby the a-SilFe/a-C grains and forλ & 1 mm by the large a-C:H/a-C grains. Fig. 3 indicates that the model gives an extremely goodfit to all of the major dust extinction and emission features ob-served in the diffuse ISM.
7 The required modifications to the IR bands, and theπ − π⋆ andσ − σ⋆ bands are minor and are explained in full detail in Appendix C.
8 This capability will be introduced into a future release of theDustEM code and documentation that integrates the optEC(s)(a) data.
9 The observational data are from Lillie & Witt (1976); Morganet al.(1976); Morgan (1980); Chlewicki & Laureijs (1988); Hurwitz et al.(1991); Witt et al. (1997)
Fig. 4: The dust component relative contributions to the SED:the line designations are as per Fig. 2. Note that the small a-C(:H) grain population contributes≈ 45% of the total emissionat 60µm and≈ 13% of the total emission at 100µm.
Note that the a-C:H to a-C dust mass ratio, an indicator ofthe sp3/sp2 C atom ratio, is≈ 1/4 for our model (≡ R =Xsp3/(Xsp3 + Xsp2) ≃ 0.2 andEg ≃ 0.9 eV)10, indicating thatin the diffuse ISM the grains are aromatic-rich in character,in agreement with the recent work by Li & Draine (2012) andChiar et al. (2013). In fact, for the a-C nano-particles (Eg ≃
0.1 eV), which are responsible for the IR emission bands in ourmodel,∼ 90% of the carbon atoms are insp2 aromatic clus-ters. This is consistent with the finding of Li & Draine (2012)that the emission band carriers contain< 15% of aliphatic car-bon. Chiar et al. (2013) interpret the observational evidence forthe diffuse ISM carbonaceous dust as resulting from grain pro-cessing leading to the a-C:H mantling of aromatic-rich stardustgrains.
We note that this dust model requires similar silicate-elementdepletion (321≡ 50, 22, 50, 199 ppm for Mg, Fe, Si and O,respectively) but more carbon depletion (233 ppm) than theCompiegne et al. (2011) model (315≡ 45, 45, 45 and 180 forMg, Fe, Si and O, respectively, and 200 ppm for C). Forbulk,crystallineolivine minerals the density ranges from 3.2 g cm−3
for forsterite (Mg2SiO4) to 4.4 g cm−3 for fayalite (Fe2SiO4).However, for sub-µm, amorphous materials that have been ion-irradiated through the effects of cosmic rays and shocks in theISM the material densities will be significantly lower. We there-fore adopt a density of 2.5 g cm−3 for our interstellar amorphousforsterite-type silicate, compared to the bulk, crystalline min-eral density of 3.2 g cm−3. For iron in the form of nano-particleswe assume a density of 7.87 g cm−3. Adopting Mg:Fe= 2.3:1for the silicate, the same quantity of iron, as was assumed tobe in Fe nano-particles (i.e., 22 ppm), can be incorporated intothe silicate structure.11 In this case all of the required silicate-forming elemental depletions (314 ppm) are similar to thoseof
10 N.B.This is an effective band gap for all of the a-C(:H) dust phasesand does not take into account that the a-C:H and a-C dust are segre-gated into core and mantle components, respectively, each characterisedby a different band gap,i.e., ≃ 2.5 eV for a-C:H and≃ 0.1 eV for a-C.
11 The optical properties for this silicate are very similar tothose ofa-SilFe (see Apendix A). Further, as shown by Chiar & Tielens (2006),a mix of amorphous olivine-type and pyroxene-type silicatematerialscan equally well explain the profiles of the interstellar silicate bands.Hence, the Planck extinction and polarisation data will be critical in
6

Please give a shorter version with:\authorrunning and/or \titilerunning prior to \maketitle
Fig. 3: The standard dust model forNH = 1020 H cm−2: NIR-UV extinction (top left), IR extinction (top right), albedo (bottom left)and the full dust SED (bottom right). The grain types are: a-SilFe/a-C core/mantle grains (triple dot-dashed), a-C:H/a-C core/mantlegrains (dotted) and small a-C grains (dash-dotted). In eachplot the totals are shown by the solid lines (red). The extinction datain the upper figures are taken from Mathis (1990). The observational data in the lower right plot are:∼ 5− 15µm ISOCAM/CVFISO spectrum,∼ 100−1000µm FIRAS/COBE spectrum, 3.3µm AROME narrow band measurement (triangle) and DIRBE/COBEphotometry (squares) (for details see Compiegne et al. 2011).
Table 2: The dust model parameters as input into DustEM.
composition size Eg ( eV ) ρ ( g cm−3 ) α amin / amax ac, at / a0 γ / σ Y fM−tot
core/mantle distribution core/mantle core/mantle ( nm ) ( nm ) (M/MH )
a-C:H / a-C p-law 2.5/ 0.1 1.3/ 1.6 5.0 0.4/ 4900 50, 10/ − 1.0 / − 1.6× 10⁻³ 18.6 %
a-C:H / a-C log-n 2.5/ 0.1 1.3/ 1.6 − 0.5 / 4900 −, − / 7.0 − / 1.0 0.6× 10⁻³ 7.0 %
a-SilFe / a-C log-n ∼ 8 / 0.1 2.5/ 1.6 1.0/ 4900 −, − / 8.0 − / 1.0 5.8× 10⁻³ 67.4 %
− / a-C mantle − / 0.1 − / 1.6 − d = 5 nm −, − / − − / − 0.6× 10⁻³ 7.0 %
TOTAL 8.6× 10⁻³
Notes:1. The elemental abundances for this model are, 233 ppm for C,and50-67, 22, 45-50 and 180-199ppm, for Mg, Fe, Si and O, respectively.The abundances in boldface type, for Mg and Fe, are for the standard model where the Fe is present in nano-particles, the other values indicatethe Mg and Fe abundances when all of the Fe is incorporated into the amorphous silicate phase.2. d is the a-C mantle depth on the amorphous silicates (5 nm).3. p-law indicates a power-law distribution,dn/da∝ a−α, with an exponential tail,D(a) = {exp(−[a− at]/ac)γ} for a > at elseD(a) = 1.4. log-n indicates a logarithmic normal distribution,dn/da∝ exp(−log[a/a0]2)/σ.
7

Please give a shorter version with:\authorrunning and/or \titilerunning prior to \maketitle
Fig. 5: The scaled dust model extinction in the 3.4µm region:small a-C:H/a-C (×λ1.5, dash-dotted), large a-C:H/a-C (×λ1.65 −
2.9× 10⁴, dotted) and large a-SilFe/a-C (×λ1.7 − 8.2× 10³, tripledot-dashed).
the Compiegne et al. (2011) model,i.e., 67, 22, 45, 180 ppm forMg, Fe, Si and O, respectively. Nevertheless, the nature of amor-phous silicates and the solid material into which iron is bound inthe ISM, i.e., silicate, oxide or metal, remains something of anopen question that awaits new laboratory and observationaldata.
In Fig. 5 we show a zoom into the extinction in the 3.4µmregion for each of the three dust components in our standardmodel. Note that the data have been scaled for comparison.Fig. 5 shows that the large a-C:H/a-C grains exhibit a pre-dominantly aliphatic 3.4µm band with a peak at≃ 3.42µm, ashoulder at≃ 3.5µm and weak absorption in the 3.28µm re-gion, which resemble the band profile seen towards the GalacticCentre (see Jones 2012a,c). Any small a-C:H/a-C grains, seen inabsorption, will exhibit a dominant 3.28µm aromatic CH bandwith sub-bands or shoulders at 3.37, 3.42 and 3.5µm but all ofthese are significantly weaker than the large a-C:H/a-C grain ab-sorption bands. Further, the large a-SilFe/a-C core/mantle grainsappear to show no spectroscopic evidence of their a-C mantlesin this wavelength region. The non-linear baseline seen in thea-SilFe/a-C extinction data is due to the narrow size range usedto derive theQext data. In our model the carbonaceous 3.4µmand the amorphous silicate 9.7µm bands are due to distinct dustpopulations and some variation in their relative band strengths istherefore to be expected (e.g., Gao et al. 2010).
From the predicted dust SED in Fig. 3 it is clear that theemission bands in the 3− 4µm region have the correct spec-tral signatures,i.e., a dominant 3.3µm with a side-band at≃3.4µm with a shoulder at≃ 3.5µm, but that they are too strong.However, we note that this model does not yet take into accountthe effects of grain charge, which (as in astronomical PAH mod-els) will reduce the band strengths of the predominantly aro-matic carriers that are the originators of the emission bands inthis wavelength region. In a follow-up paper we will look at thedetailed effects of grain charge and the anomalous microwaveemission from spinning a-C(:H) grains.
With our proposed model we expect little silicate grain frag-mentation, in shock waves and turbulent regions, for two rea-sons. Firstly, there are too few sufficiently-large grains (a ≃10 nm) for catastrophic collisions with silicate grains to be im-
constraining the optical and physical properties of the large interstellarsilicate and carbon dust populations.
Fig. 6: The dust model normalised extinction, E(λ-V)/E(B-V) forfixed dust mass and for varying band gap,Eg [eV]: 0.1 (darkgrey), 0.5 (pink), 1.0 (brown), 2.0 (blue) and 2.6 (violet).Thesolid (dotted) vertical grey lines mark the model (observed) UVbump positions. The yellow band indicates the observed extinc-tion and its range of variation (Fitzpatrick & Massa 2007).
portant (Jones et al. 1996) and, secondly, the silicate grains areprotected from erosion-type, cratering fragmentation by their en-casing a-C mantles. In contrast, the less resistant a-C(:H)grainswill experience some fragmentation (Serra Dıaz-Cano & Jones2008) and we propose that our small a-C grain size distributionis the product of fragmentation in the ISM. We will investigatethese fragmentation/cratering effects in detail in a follow-up pa-per. Further, we adopt log-normal size distributions for the largea-C:H/a-C and a-SilFe grains because, firstly, they are typicalof dust condensation from the vapour phase,e.g., in the dustshells around evolved stars. Secondly, they appear to be con-sistent with the sizes of the pre-solar amorphous and crystallinesilicate grains of evolved star origin that have been analysed inmeteorites (e.g., Nguyen et al. 2007). Also, a theoretical study ofcloud fragmentation and collapse prior to star formation showsthat a log-normal distribution is a characteristic productof mul-tiplicative processes acting on a size distribution (e.g., Larson1973). This would appear to be similar to the case for the mul-tiple processing of dust in turbulent and shocked interstellar re-gions.
6.2. The optEC(s)(a) model: diffuse ISM dust and beyond
Following on from papers I to III, we consider the usefulnessofthe optEC(s)(a) data as a tool to interpret interstellar dust obser-vations. In the following sub-sub-sections we compare the pre-dicted properties, derived using the modified optEC(s)(a) data(see Appendix C), with the major constraints imposed by in-terstellar dust observations. The model-observation comparisonsare presented in order of increasing wavelength.
6.2.1. The FUV extinction rise
In Fig. 6 we show the model extinction, for fixed dust componentmasses, normalised in the usualE(B− V) manner, as a functionof the ‘outer’ material band gap. These data are compared tothe observed diffuse ISM extinction variations from the work
8

Please give a shorter version with:\authorrunning and/or \titilerunning prior to \maketitle
of Fitzpatrick & Massa (2007). Here we vary the band gap ofthe outer 20 nm of all of the carbonaceous grains and, therefore,particles witha < 20 nm, which dominate the FUV extinction,are homogeneous. For particles witha > 20 nm the core materialgap is fixed at 2.5 eV (see Footnote 5) and only the gap of theouter 20 nm deep layer is varied.
Fig. 6 indicates that the observed FUV extinction (in nor-malised form) is only consistent with a-C:H dust with a bandgap. 2 eV. Nevertheless, care must be exercised in the use ofE(B−V)-normalised extinction data because of the strong lever-age by the V and B band data point anchors. Thus, in Fig. 7 weshow theun-normalisedFUV extinction for the model as a func-tion of Eg (upper plot),a− (middle plot) andα (lower plot), alongwith the Savage & Mathis (1979) and Mathis (1990) extinctiondata (arbitrarily-scaled for qualitative comparison). Plotting thedata in this way, we note that, for a fixed dust mass, the FUV ex-tinction is intrinsically invariant in the 6−8µm−1 region, as notedby Greenberg & Chlewicki (1983). Thus, for fixed dust mass andsize distributions, the shape and intensity of the FUV extinctionis independent of the band gap and hence the composition of thea-C(:H) dust component. This behaviour arises because the FUVoptical properties, which are dominated by theσ − σ⋆ band ofsmall a-C(:H) particles, are material independent. The FUVex-tinction shown in Fig. 7 is then qualitatively consistent with all ofthe plotted a-C(:H) band gap materials (Eg = 0.1−2.6eV). Thus,it appears that the FUV extinction could be a direct tracer ofthesmall particle dust mass. Parvathi et al. (2012) find a gradual de-crease in the FUV extinction with decreasing density, whichtheyinterpret as indicating the disruption of small grains in the dif-fuse ISM.
In the lower plot in Fig. 7 we show how the extinction isaffected by varying the power-law index,α, of the small a-Cparticles (see Fig. 8). Asα decreases the FUV extinction flat-tens because of the increasing loss of small particles from thesize distribution. The middle plot in Fig. 7 shows the effects ofvarying the minimum particle size,a−, which must be in therange 0.4 − 1 nm (forα = 5) in order to obtain a satisfactoryfit to the FUV extinction.12 We find that the form of 6− 8µm−1
(8 − 11µm−1) FUV extinction in the diffuse ISM predicted byour model does not vary as long asa− < 5 nm (a− . 3 nm) asindicated in Fig. 7 (middle). Fora− > 3 nm the FUV extinctionturns over forλ−1 > 8µm−1 and fora− > 5 nm it is flatter in theλ−1 = 6− 8µm−1 region.
The form of the FUV extinction and the observed“tight” FUV rise-intercept correlation (Fitzpatrick 2004;Fitzpatrick & Massa 2007) seems to imply a “lever effect” witha “pivot point” at FUV wavelengths. Consistent with this con-straint, we note that the optEC(s)(a) Qabs data, for particlessmaller than 10 nm and for all band gap materials, have a “pivotpoint” in the≈ 7.0− 7.5 eV region, for small a-C(:H) dust sizedistributions withα ≥ 3 (Fig. 7 here, and Figs. 7 and D.2 to D5in paper III).
We conclude that the variations in the FUV extinction, pre-dicted by our model, are consistent with the FUV extinctioncharacteristics determined by Greenberg & Chlewicki (1983)and the range of variations noted by Fitzpatrick & Massa (2009).
6.2.2. The 217 nm UV bump
The size dependence inherent in the optEC(s)(a) data naturallyleads to a UV bump for small (a . 1 nm), narrow band gap
12 However, as we show in Section 6.2.6, increasinga− leads to a pro-gressive loss, and eventual disappearance, of the IR emission bands.
(Eg = −0.1 to 0.5 eV), a-C particles, as can clearly be seen inFig. 3 and the extinction plots in Figs. 6 and 7. This occurs be-cause the UV bump in a-C is carried by a restricted-range ofaromatic (or PAH-like) clusters with 1-3 rings. In large parti-cles (a > 10 nm) the feature is very broad and peaks in theλ−1 < 4µm region. We emphasise that the aromatic clusters in-trinsic to a-C(:H) materials are not strictly PAHs because theyform a cohesive part of a much larger network structure, withinwhich they are bound to other clusters by aliphatic and olefinicbridging groups (Jones 2012c; Micelotta et al. 2012).
It is clear that the derived UV bump at≈ 4.7µm−1 isslightly too large with respect to the observed interstellar fea-ture (e.g., see Figs. 3, 6 and 7). For varying band gap, butfixed dust mass, the predicted UV bump position is prac-tically unvarying, which is in agreement with the immov-able position of the observed bump (e.g., Fitzpatrick 2004;Fitzpatrick & Massa 2007). However, it does shift to positionsas short as≈ 4µm−1, compared to the observed range of≃4.58 − 4.60µm−1 (Fitzpatrick & Massa 2007), but only in thecase of extreme size distributions,i.e., for largea− or small-αdistributions (see Fig. 7, middle and lower panels, and Section7). We have investigated the width and postion of the UV bumpextinction as a function ofa−, as predicted by our diffuse ISMdust model (Fig. 3), and find no significant variations as longasa− < 1 nm. Fora− > 1 nm the UV bump is broader and the peakshifts to longer wavelengths (see Fig 7, middle). We then notethat, in the absence of extreme size distribution variations, it isencouraging that the predicted variations in the UV bump posi-tion and width are rather small, in accordance with observations.
Fitzpatrick (2004) and Fitzpatrick & Massa (2007) have un-dertaken a detailed study of the UV extinction bump and itsvariations as seen in theE(B − V)-normalised extinction data.They find the UV bump peak positions and widths are uncorre-lated, broader bumps for greater FUV curvature, stronger bumpsfor intermediate levels of FUV extinction (i.e, weaker for highor low FUV extinction), stronger FUV extinction as the bumpweakens, and weaker bumps for low or high values ofRV. Usingthe optEC(s)(a) data to model the UV bump we find that thepeak position and width are not correlated. We also find broaderbumps for larger band gap materials that exhibit more curvaturein their FUV extinction and that the FUV extinction strength-ens and the bump weakens with increasingEg (see Fig. 6). Theweaker bump associated with low FUV extinction could be ex-plained by a ‘flatter’,i.e., highRV , size distribution, see Figs. 6and 7. Conversely, a weak UV bump for high FUV extinctionis consistent with large band gap a-C:H materials, which showbasically no UV bump (Fig. 6 and 7).
In the un-normalised extinction plots in Fig. 7 (upper andmiddle panels) we can see that the FUV extinction shows little orno variation withEg or a− but does depend, rather sensitively, onthe assumed power law,α, for the small a-C grains (Fig. 7, lowerpanel). Thus, the observed UV extinction variations seen intheE(λ − V)/E(B− V) plot (Fig. 6), can be explained by variationsin the visible extinction slope (Fig. 7, upper panel), whichbiasestheE(B−V)-normalised data. The visible extinction and the UVbump are determined by the a-C(:H) composition and, for fixeddust mass, both increase in strength asEg decreases, which leadsto an anti-correlation between the UV bump strength and theFUV continuum inE(B − V)-normalised data (e.g., Fitzpatrick2004). Further, the range of FUV extinction variations predictedby the model are in very good agreement with the observed FUVextinction dispersion seen in the diffuse ISM (Fitzpatrick 2004;Fitzpatrick & Massa 2007).
9
Please give a shorter version with:\authorrunning and/or \titilerunning prior to \maketitle
For our standard model parameter set (Table 2) the UV bumpand the FUV extinction rise are due to a-C particles with< 250C atoms (≡ a < 1 nm) and< 7× 10³ C atoms (≡ a < 3 nm), re-spectively. This could then explain why the UV bump and FUVextinction are partially de-coupled (e.g., Greenberg & Chlewicki1983; Fitzpatrick 2004; Fitzpatrick & Massa 2007). As shownin Sections 4, 6.2.1 and 6.2.2 the UV bump and FUV extinc-tion produced by our model depend on the adopted minimumsize for the a-C grains,a−, and their power law index,α (seeFig. 7 middle and lower panels). The upper panel of Fig. 7 showsthat the UV bump intensity is sensitive to the material band gap.However, given that the aromatisation time-scale in the diffuseISM seems to be short (e.g., ≃ 105/G0 yr, Jones 2012d) mostsmall a-C(:H) particles with radii. 20 nm will be a-C. The par-tial de-coupling of the UV bump and FUV extinction in the dif-fuse ISM would then be due to variations in the a-C dust mass fora 6 1 nm (UV bump carriers) with respect to somewhat largerparticles (a 6 3 nm, the FUV extinction carriers), as shown inFig. 7. In particular, we propose that the diffuse ISM FUVex-tinction is principally characterised by variations inα and thatthe IR-MIR SEDis determined by the minimum particle size, a−,and that both are a function of the local ISRF intensity and hard-ness (e.g., Jochims et al. 1994; Bocchio et al. 2012). This is inagreement with the conclusions of the astronomical PAH model,i.e., that the IR emission band profiles are sensitive to the numberof C atoms in the smallest PAHs (Verstraete et al. 2001).
In conclusion, it is evident that the UV extinction bump,which is reasonably well fit with 0− 0.22 eV band gap mate-rials, appears to provide a stronger constraint on the composi-tion of the small a-C dust particles than does the rather invariantFUV extinction rise. However, as noted by Parvathi et al. (2012)the intensity of the UV bump extinction appears to be essen-tially uncorrelated with the degree of carbon depletion into dust,(C/H)dust.
6.2.3. Visible-NIR extinction and variations
The extinction data shown in Fig. 7 indicate that, for fixed dustmass, this model predicts a significant dispersion in theB andVband extinction, which is due to variations in the dust composi-tion (i.e., decreasing (B − V) asEg increases) or its size distri-bution (i.e., increasing (B− V) asα decreases ora− increases).Unfortunately, it is exactly these interesting variationsthat are‘damped out’ by the normalisation of the observed extinction byE(B− V). Thus, based on the above it appears that normalisingthe interstellar extinction in the FUV at≃ 7µm−1 (≡ 143 nm)would render the data in much more diagnostically-useful man-ner.
Fitzpatrick (2004), Fitzpatrick & Massa (2009) andFritz et al. (2011) note that the IR extinction longward of 1µmgenerally has a power-law type of behaviour. As Fig. 9 demon-strates, the range of a-C(:H) grain material optical properties,with Eg ≃ 0.0 − 2.6 eV (≡ XH = 0.0 − 0.6), in combinationwith the adopted amorphous silicate, are consistent with thisimportant observational constraint.
The NIR extinction can be fit with a two-parameter model,where the free parameters are a power law,αNIR, andRV , i.e.,
k(λ − V) =
[
0.349+ 2.087RV
1+ (λ/0.507)αNIR
]
− RV , (1)
as determined by Fitzpatrick & Massa (2009). As they noted,and as we also find with our model, the good fits to the dataextend out to shorter and longer wavelengths than those usedby
Fitzpatrick & Massa (2009) in deriving their NIR extinctionlaw(Fig. 9). In fitting the observations Fitzpatrick & Massa (2009)show thatαNIR generally decreases asRV increases. However,for our dust model we find good fits withαNIR ≃ 2 for allRV . In Fig. 10 we showαNIR as a function ofRV , as perFitzpatrick & Massa (2009), and find that the lowerRV valuesderived for our model span the same range as those for theFitzpatrick & Massa (2009) fits to their data. Discrepanciesbe-tween the model and observational data are also apparent in Fig.3 where the model data show slight curvature that is not appar-ent in the observations. This indicates that the model does not yetinclude all of the elements necessary to explain the exact formof the NIR extinction. This could be related to an underestimateof the absorption in the 5− 10µm region compared to observa-tions (e.g., Lutz et al. 1996). The discrepancy could also be dueto grain charge effects, which we do not take into account here.For example, aromatic cation species show NIR absorption inthe∼ 0.8 to > 2µm region (Mattioda et al. 2008), which is notapparent in astronomical PAH models.
We also note that the tail, extending to highRV and lowαNIRin Fig. 10, cannot be explained by our model. This is probablybecause the dust along these lines of sight has undergone signif-icant evolution (accretion and coagulation) and thus the constantmass assumption that we adopt here is no longer valid.
The NIR-MIR optical properties of a-C(:H) materials canalso be fit with a two free-parameter Urbach tail model(see paper II). However, in the optEC(s)(a) data the ob-served wavelength-dependent behaviour arises naturally fromthe physics and no empirical wavelength-dependence is im-posed.
The IR extinction is generally rather invariant but we con-clude that variations will arise with compositional and size dis-tribution variations in the ISM, for example, due to the accretionof wide band gap a-C:H material, and also due to particle coagu-lation in dense regions and erosion in energetic regions. Wehaveyet to fully explore this aspect of our dust model and leave thisto targeted studies of particularly well-studied lines of sight.
6.2.4. The IR absorption bands
As discussed in detail in papers I to III, the optEC(s)(a) data isconsistent with the profile of the absorption bands observedto-wards the Galactic Centre in the 3− 4µm wavelength region.The predicted absorption band profiles (see Fig. 5) are similarto those calculated in emission, as shown in Fig. 11. Using theoptEC(s)(a) data it is possible to explain, in detail, all of the struc-ture in the observed absorption bands with rather wide band gap(Eg & 2.3 eV), a-C:H carbonaceous grains with radii& 20 nm.As pointed out in Section 5.1 in paper III, a-C nano-particles,with band gaps as low as 0.5 eV, also appear to have 3− 4µmIR absorption spectra which match the observed absorption fea-tures. However, such small particles are expected to be rapidlyUV-photolysed in the ISM and so the good match may simplybe fortuitous.
It is interesting to note that the nature of the bands in the3− 4µm region can be used to constrain the emission propertiesat FIR-mm wavelengths because of the strong optical propertycoupling at all wavelengths. For example, and as noted above,the absorption band profiles in the 3− 4µm region indicate thepresence of a significant H-rich, wide band gap (Eg & 2.3 eV),a-C:H dust mass, which ought to be apparent in the long wave-length emission behaviour but this is not the case (see the fol-lowing section for an explanation).
10
Please give a shorter version with:\authorrunning and/or \titilerunning prior to \maketitle
6.2.5. The IR emission bands
In Fig. 11 we show the IR emission band spectrum in the2.5− 14µm (upper panel) and 3.1− 3.7µm (lower panel) wave-length regions. It is clear, from the lower plot in Fig. 11, thata-C materials with band gaps in the range 0.1 − 0.5 eV exhibita 3.3µm aromatic emission band that is always accompaniedby a side-band at∼ 3.4µm with a shoulder at∼ 3.5µm. Aspointed out in Section 5.1 in paper III, this kind of band struc-ture, as predicted by the optEC(s)(a) data, is consistent withthe observed emission bands in many regions,e.g., across theOrion bar (Sloan et al. 1997; Verstraete et al. 2001), M17-SW,NGC 2023 (Verstraete et al. 2001) and in M 82 (Yamagishi et al.2012), wherebotharomaticandaliphatic CH bands appear in the3− 4µm spectral region, even in these energetic environments.
Our new dust modelling approach, using a-C(:H) opticalproperty data, therefore offers an alternative view to the ori-gin of observed IR emission bands, which are well-matchedby astronomical PAH, thermal emission profile models (e.g.,Verstraete et al. 2001; Pech et al. 2002). However, in our modelit is small (a . 0.5 nm), 3D, a-C particles that are the carri-ers of the observed IR emission bands. As proposed in paperIII, these 30− 40 C atom, aromatic/aliphatic, cage-like parti-cles (Micelotta et al. 2012), that we call “arophatics”, representthe “end of the road” for a-C(:H) grain evolution because theirdisintegration products,viz., small free-flying, PAH-like speciesand short hydrocarbon chains, will quickly be destroyed in thediffuse ISM (e.g., Jochims et al. 1994; Micelotta et al. 2010a,b,2011; Bocchio et al. 2012). The IR emission band-carrying a-Cparticles are also responsible for the UV bump and FUV extinc-tion, which is consistent with their limited range of variation andthe constancy of the IR emission band profiles. Thus, these “endof the road”-particles, with a narrow range of optical properties,could explain the noted “stability” of the FUV extinction carri-ers in the diffuse ISM (Greenberg & Chlewicki 1983). As shownabove, in Section 6.2.2, a partial de-correlation of the UV extinc-tion components (bump and FUV) and the IR emission bands ispredicted by our model.
The thermal emission from the wide band gap materials ob-served in absorption (see above) and the low band gap, UV pho-tolysed a-C material component observed in emission shouldboth be evident in the FIR-mm dust emission. However, we findthat the predicted dust emissivity at these wavelengths is dom-inated by the photolysed outer surfaces of the a-C:H/a-C parti-cles,i.e., the narrow band gap a-C material (Eg ≃ 0.1−0.25eV),that dominates the emission because its emissivity at mm wave-lengths is more than four orders of magnitude greater than thatfor wide band gap a-C(:H) materials (e.g., see Fig. 16 in paperII and Fig. 10 in paper III). Thus, and although there may be asignificant mass in a-C:H carbonaceous dust, these wide bandgap materials are apparently hard to detect and thus there signif-icance has probably been underestimated.
6.2.6. MIR-FIR-mm emission
In Fig. 12 we show the dust SED as a function of the band gap,Eg (upper), of the photo-processed dust components,i.e., thesmall a-C(:H) grains and the outer layer/mantle of the large a-C:H grains. Fig. 12 also shows the SEDs as a function of theminimum grain size,a− (middle), and the small a-C(:H) grainsize distribution power-law index,α (lower). As the band gapincreases we note a decrease in the emission at FIR-mm wave-lengths, a significant change in the MIR emission to a peak in the20− 30µm region and a decrease in the continuum underlying
the shortest wavelength emission bands. The decrease in thelongwavelength emission is due to the fact that wide band gap a-C:Hgrains are less emissive, and therefore hotter, and their emissionpeaks at MIR rather than FIR wavelengths, which explains thebroad 20− 30µm emission peak forEg = 1.0 eV.
As the small a-C grain size distributionα decreases theFIR-mm emission increases and the IR emission bands andMIR emission decrease substantially and eventually disappear.Decreasingα is equivalent to a ‘flattening’ and ‘narrowing’ ofthe size distribution, which is equivalent to a transfer of mass tothe larger particles. It is this that is responsible for the increasein the FIR-mm emission (see Figs. 8 and 12), while the loss ofthe IR emission bands and MIR continuum is simply due to thereduced abundance of their carriers,i.e., grains witha . 10 nm(see Fig. 8).
Fig. 13 shows a zoom into the FIR-cm wavelength region,where the model SEDs have been normalised to the peak of theemission to allow a direct comparison of the slopes of the emis-sivity. This figure shows that the emissivity falls into two well-separated band-gap groups, in effect a two-state system, one withEg & 0.5 eV andβ ≃ 2 that ‘switches’ to anEg ≃ 0 eV state withβ ≃ 1.3 as a result of EUV photo-processing.
We note that variations in the FIR-mm emissivity slope fora-C(:H) particles are reduced for particles smaller than 3 nm andthat the wavelength-dependence is dominated by the wings ofthe Drude profiles,i.e., β ≃ 2 for λ & 20µm (see Fig. 14).However, the emission at these wavelengths is a combinationofthat from amorphous silicate and carbon grains. Thus, in Fig. 14we show the summed emissivity slopes of all the dust compo-nents,βeff , which is derived directly from the optical propertiesand is therefore independent of any assumed dust temperature.Fig. 14 again reflects the two-state system mentioned above.Indetail this figure shows that the switch to the narrow band gapstate results in a wavelength-dependentβ behaviouri.e., β ≃ 1.9,1.8, 1.5 and 1.2 at 60−100µm, 250µm, 1 mm and 1 cm, respec-tively. The EUV processing-driven jump in the optical propertiesoccurs betweenEg = 0.1 and 0.5 eV and in Fig. 14 we show theresults for an intermediate case whereEg = 0.25 eV. We notethat the optical property jump is not related to the transition be-tween the eRCN and DG models, which occurs at a band gap of≃ 1 eV.
Fig. 14 shows that the effective emissivity slope,βeff , variessignificantly with wavelength over the FIR-cm range for EUVphoto-processed a-C(:H) materials. Thus, an interpretation ofthe observed interstellar dust emissivity as arising from asingle-emissivity-slope material would appear to be too simplistic be-cause it neglects the combination of materials that contributeto the emission at long wavelengths. As Fig. 4 shows, the FIRemission is dominated by silicates but at wavelengths longerthan a few mm the carbonaceous dust emission is dominant.Carbonaceous and silicate materials make about equal contri-butions to the emission in the mm region.
An important prediction of this model arising from thetwo-state system behaviour is that, at FIR wavelengths (e.g.,≈ 60− 100µm), βeff should be∼ 2 ± 0.1. However, at longerwavelengthsβeff must be either∼ 2 or. 1.8, with intermediatevalues unlikely. In the latter case,βeff decreases smoothly from∼ 1.8 at 250µm to∼ 1.2−1.3 at cm wavelengths. In general, low(high) values ofβeff indicate a ‘mature’ aromatic-rich (‘young’aliphatic-rich) carbonaceous dust component. We note thatformature materials theβeff at∼ 80− 500µm wavelengths is domi-nated by that of the silicate material optical properties, which arenot yet well-determined. Hence, observed values ofβeff signifi-cantly different from∼ 2 atλ ∼ 100µm (or different from∼ 1.8
11

Please give a shorter version with:\authorrunning and/or \titilerunning prior to \maketitle
at 250µm) could be an indication that the interstellar silicatesare not as we currently model them.
In a future paper we plan to explore the mm-cm dust emis-sion predicted by our model within the context of the latest re-sults from thePlanckmission.
6.2.7. Band gap evolution and the long wavelength emission
Fig. 14 shows the band gap and size-dependence of the slopeof the a-C(:H) dust emissivity,β, at λ = 100µm, 300µm and1 mm. The black line indicates the behaviour ofβ based on theband gap dependence ofγ, the long-wavelength slope of theimaginary part of the refractive index,k (see Eq. 22, paper II).An upturn in β, for Eg = −0.1 to 0.1 eV, is due to a power-law dependence ofn on wavelength and the peak at≈ 0.9 eVis due to a reduced IR band contribution. Fig. 14 shows thata-C(:H), whether in grains or mantles, could have a significanteffect on the FIR-mm dust emissivity and that this will be super-imposed any effects due to amorphous silicate variations (e.g.,Agladze et al. 1996; Mennella et al. 1998; Boudet et al. 2005;Meny et al. 2007; Coupeaud et al. 2011).
The data in Fig. 14 indicate that in the diffuse ISM large,homogeneous a-C particles (a > 10 nm, Eg = 0.1 − 0.2 eV)would have a rather flat emissivity slope,β ≃ 1.2 − 1.3 (seepaper II). However, particles with radii> 20 nm will exhibit acore material composition that can be different from that of aphoto-processed outer mantle (see Footnote 1). In contrast, smalla-C particles (a ≃ 1 nm, Eg(bulk) = 0.1 − 0.2 eV) will have asteeper emissivity slope,β ≃ 2.2−2.4. This is determined by theparticle size limitation on the aromatic cluster sizes, which ele-vates the effective band gap to& 0.7 eV and suppresses the longwavelength absorptivity (see paper III). Within molecularcloudssmall particle coagulation and a-C:H mantle accretion willleadto materials withβ ≃ 1.8−2.5 (for Eg = 0.5−2.6 eV). However,as discussed above (Section 6.2.5) a-C:H materials are so muchless emissive than a-C that their effects on the FIR-mm emissiv-ity may be hard to observe.
6.2.8. FIR-to-AV extinction ratio in the diffuse ISM
Here we consider the extinction in the diffuse ISM where thedust exhibits only limited variations in temperature and opacity.
Fig. 15 shows the model optical depths (opacity) forNH =
1021 H cm−2 at the V band (blue), 250µm (green) and 1 mm (red)wavelengths as a function of the photo-processed material bandgap,Eg (for grain radii< 20 nm or 20 nm thick mantles on largergrains, upper plot), and the small a-C grain power law,α (lowerplot). This figure shows that changes in the optical depth aresignificant for small band gap materials (Eg < 0.5 eV) and aremore apparent as the wavelength increases and as the power-lawindex,α, decreases.
Variations in the FIR opacity and in theE(B − V) extinc-tion must, at some level, be coupled because the dust opticalproperties at these disparate wavelengths vary in tandem (e.g.,see Fig. 16 in paper II and Figs. 10− 13 in paper III). Asshown above, variations inE(B − V) and in the FIR opacityappear to be significant, while the FUV is practically invariantfor fixed dust mass. In order to investigate the inter-dependencebetween the FIR emissivity andE(B − V) we take the stan-dard extinction-column density relationship from Bohlin et al.(1978),NH = 5.8×10²¹ E(B−V) cm−2 mag.−1, and combine thiswith the recent results from thePlanckmission. From a fittingof the FIR to sub-mm dust emissivity in the local diffuse inter-
stellar medium thePlanckdata yieldτ250 = 1.0± 0.3× 10⁻²⁵NH(Planck Collaboration et al. 2011b). We then find
τ250 = 5.8± 1.7× 10⁻⁴ E(B− V). (2)
This expression ofτ250, calculated using our model results forE(B−V) substituted into Eq. (2) and multiplied by104, is shownin Fig. 15, as a function ofEg (upper) andα (lower), by thecrosses with error bars. It is clear that the model and the recentPlanck observational results are in good agreement and thatvari-ations in the FIR-mm opacity are rather limited when normalisedin this way.
The major conclusion here is that, for a given dust composi-tion and size distribution, variations in the FIR opacity gohand-in-hand with variations inE(B − V) because of the in-tandemevolution of the dust optical properties at visible and FIR wave-lengths.
6.2.9. Some further points of note
As noted above, it appears that many of the distinct dust observ-ables are attributable to carbonaceous matter. Further, our use ofthe optEC(s)(a) data indicates that the carriers of the FUV extinc-tion, UV bump, NIR absorption and the IR emission bands areonly weakly coupled.
We also note that there appears to be some degeneracy inthe extinction, in that variations ina− andα often lead to simi-lar extinction curves. For example, our investigations show thatincreasinga− from 0.4 nm to 3 nm gives essentially the sameextinction curve as changingα from 5.0 to 4.0 (see Fig. 7).However, a look at the dust SEDs for the different size distri-butions show very different behaviour in the two cases, with acomplete lack of IR emission bands in the case of increasinga−to 3 nm (see Fig. 12). Thus, a combined analysis of the observedextinctionandemission, for a given line of sight, is required inorder to constrain the exact dust composition and size distribu-tion. In general, the dust SED is a more powerful constraint onthe nature of dust in the ISM than the extinction curve.
Table 3 summarises the consistency of the model results withthe observational constraints. Clearly the un-normalisedFUVextinction does not appear to be a strong constraint. However,this table clearly indicates that the IR extinction, and theasso-ciated absorption bands, arise from an a-C:H dust componentwhile the bulk of the dust extinction and emission features arisefrom a-C dust.
7. Interstellar dust evolution
Here we outline a scenario for dust evolution as it transitsfrom the dust-forming shells around evolved (asymptotic giantbranch, AGB) stars, into the diffuse ISM and then, via cloudcollapse, on into the dense star-forming regions of the ISMwhere dust accretion/(re-)formation is important. It is in star-forming, photon-dominated environments (e.g., HII regions andPDRs) that dust undergoes significant processing, which plays akey role in determining the course of its subsequent evolution.The constructive (destructive) processes inherent to dustevo-lution during its lifetime are accretion and coagulation (photo-processing and dis-aggregation/fragmentation).
A schematic view of the dust evolutionary sequence, asa function of environment, is given in Fig. 16. This figureintroduces the idea of interstellar dust evolutionary tracks,which are very different for a-C(:H) and a-SilFe grains becauseof their differing susceptibilities and reactions to processing.
12

Please give a shorter version with:\authorrunning and/or \titilerunning prior to \maketitle
Table 3: Observation-model coherency check:Eg characterisa-tion as a function of theλ-dependent extinction and emissionfeatures. The bullets indicate consistency between observationand model.
property↓ Eg [ eV ] = 0− 0.25 0.25− 0.5 0.5− 2.7
FUV extinction • • •
UV bump •
vis extinction • •
E(λ-V)E(B-V) • •
NIR extinction variations • • •
3.4µm abs. •
IR emission bands •
MIR emission •
FIR emission (1.6) •
mm emission (1.6) •
FIR emission (1.8) •
mm emission (1.8) •
WMAP emission •
Observational evidence indicates that the evolutionary processeshave a stronger effect on a-C(:H) dust than on amorphous sil-icate dust (e.g., Serra Dıaz-Cano & Jones 2008; Jones & Nuth2011; Parvathi et al. 2012). Nevertheless, the evolutionary tracksare coupled because of dust component mixing, as indicatedin Fig. 16 by the ‘parallel-processing’ and ‘cross-talk’ path-ways. Seemingly, the most important evolutionary tracks forISM dust are accretion and coagulation in an increasing den-sity ISM (diffuse→ dense molecular cloud phase change) andphoton-driven fragmentation/destruction and disaggregation inintense radiation field, star-forming environments (i.e., HII re-gions and PDRs).
Dust evolution evidently leads to observable variations inthedust composition, structure and size distribution. Here wedis-cuss the major a-C(:H) evolutionary processes in the ISM andhow these are consistent with, or can be constrained by, the ob-servational evidence.
In the following, and within the framework of the schematicdust life-cycle shown in Fig. 16, we explore dust evolution underthe assumption of constant dust mass within each dust compo-nent. Thus, coagulation and accretion affects are not rigorously-treated because they lead to a net dust mass increase and to masstransfer between the different components. Nevertheless, withinthe framework of a constant mass assumption and evolving sizedistributions, we can qualitatively explore the effects of evolu-tion on the dust observables.
7.1. a-C(:H) UV photo-processing and time-scale issues
The evolution of the a-C(:H) dust between the aliphatic-rich (a-C:H) and aromatic-rich (a-C) end members is accompanied bya narrowing of the band gap (Eg & 2.3 eV→ ≃ 0.1 eV) and byphoto-fragmentation. This process occurs when a-C:H, accretedin the molecular ISM or formed around evolved stars, is exposedto the ambient radiation field. EUV-UV photon-induced process-ing (aromatisation) in the diffuse ISM (G0 = 1), and particularlyin PDRs (G0 ≃ 10− 104), on time-scales& 106 yr/G0 leavesan imprint on the dust extinction and emission (Jones 2012c,e).The observable effects of photo-processing (top left and righthand side of Fig. 16) are to increase the bump strength and tosteepen the NIR-visible extinction (Fig. 7, upper plot), signifi-
cant modifications to the IR emission band profiles (Fig. 11) andto enhance the MIR-mm emission (Fig. 12, upper plot).
Here we do not re-visit the time-scale-dependent aspects ofphoto-processing and photo-fragmentation but leave this untilwe have a better understanding of how they operate on a-C(:H)nano-particles in intense radiation fields. For example, itis notyet clear whether the aromatisation of a-C:H particles is a directC−H bond photo-dissociation process or whether the transfor-mation is driven by stochastic heating, or a combination of thetwo.13 Dust models used in the interpretation of astronomical ob-servations therefore need to be time-dependent in order to char-acterise the UV photon-induced transformation of a-C(:H) andmust take into account its origin and prior history. This kind ofstudy is probably best undertaken on a case-by-case basis, whichcompares model predictions with the astronomical observations(e.g., Compiegne et al. 2008; Arab et al. 2012).
7.2. Accretion
Carbon accretion from the gas phase leads to the formation ofa-C(:H) mantles on all grains, with material composition depend-ing on the local density and extinction. For example, if the onsetof accretion is in the diffuse ISM, where most species are atomicor singly-ionised (e.g., Si+, S+, C+), the extinction is low and UVphoto-processing still a significant hazard, then a-C mantles willform. However, for intermediate levels of extinction,AV < 3,i.e., before ice mantle formation, the mantles will be of a-C:H.14
The onset of accretion is not restricted to C and H and otherabundant gas phase atomic species, such as O and N, are also ex-pected to accrete and to leave their observable signatures (Jones2013). In high extinction regions,i.e., AV > 3 (& 6), the accretedcarbon mantles will be submerged under H2O (H2O+CO) icelayers.
The observable effects of accretion (the ‘parallel-processing’tracks in the middle of Fig. 16) are to increase all grain sizes(Fig. 7, middle plot), to increase the total dust mass and tosteepen the small grain mass distribution (Fig. 7, lower plot).However, small particles (a < 10 nm) will undergo temperatureexcursions, resulting from stochastic photon absorption,whichis likely to inhibit accretion onto the smallest particles in lowextinction regions.
7.3. Coagulation
Accretion is a key process in dust evolution, however, it does notoccur in isolation but pre-dates and aids in coagulating grainsinto mixed-composition aggregates in low-velocity grain-graincollisions. The early stages of coagulation, in a quiescentcloudfilament in Taurus, were observed and modelled by Stepnik et al.(2003), where it was shown that the disappearance of small par-ticles is consistent with reduced dust temperatures, enhancedemissivity and their coagulation into and onto larger particles.More recently Kohler et al. (2011, 2012) found a factor of about
13 Particles witha . 10 nm, where the grain heating is predom-inantly stochastic, in the standard interstellar radiation field (e.g.,Draine & Anderson 1985), will undergo temperature excursions largeenough to drive the dehydrogenation of a-C:H materials but the rel-evant time-scales are not yet determined. However, we have under-taken a preliminary study of a-C:H dust evolution in planetary nebulæwithin the context of fullerene formation (Bernard-Salas et al. 2012;Micelotta et al. 2012).
14 It is perhaps this accreted carbonaceous matter that could help toexplain “coreshine” phenomena (Pagani et al. 2010; Steinacker et al.2010, see also paper II).
13
Please give a shorter version with:\authorrunning and/or \titilerunning prior to \maketitle
2.7 enhancement in the emissivity at FIR wavelengths, result-ing from grain coagulation. Further, this emissivity gain is ratherrapidly achieved,i.e., sticking only a few large grains togetheryields a doubling of the dust emissivity before saturation sets in;additional coagulation then only leads to incremental gains inemissivity.
The observable effects of coagulation (‘cross-talk’ tracks inthe middle of Fig. 16) are a mass re-distribution towards largergrains (smaller grains remain but decrease in abundance,i.e., a−is fixed, see Fig. 8). The effects of coagulation on the dust extinc-tion and emission can be mimicked by progressively decreasingthe power law index,α, of the small a-C(:H) grain populationfrom 5 to 2 as small grains are subsumed into the large grainpopulation (Figs. 7 and 12, lower plots). As can be seen the ex-tinction in the FUV flattens, the UV bump broadens and the NIR-visible extinction flattens. In emission these changes manifest asa diminution of the IR emission bands and the MIR continuumaccompanied by an increase in the FIR-mm emission.
These evolutionary changes agree well with observationsand their interpretation (e.g., Stepnik et al. 2003; Kohler et al.2011, 2012) and are in general agreement with the evolution ofthe extinction curve with increasingRV (e.g., Mathis 1990, andFig. 7 above).
7.4. Destructive processing — UV photo-fragmentation
A bottom-up coagulation process appears to be unlikely in thediffuse ISM given the local conditions. In the dust coagula-tion kernel,nH σ vrel, the dust cross-section,σ, is ‘fixed’ andthe grain-grain collision velocities are low (vrel < 1 km s−1).Thus, higher densities than those typical of the diffuse ISM arerequired for efficient coagulation in time-scales. 3 × 10⁷ yr,the typical star formation time-scale in molecular clouds (e.g.,McKee 1989).
Dust evolution in the diffuse ISM could be more straight-forwardly be explained by a “top-down” scenario, where the ma-jor dust growth processes (accretion and coagulation) onlyoccurin dense molecular clouds. The observed extinction and emissionvariations can then be explained by the de-construction of the ac-creted/coagulated particles, formed in the dense ISM, as they aresubsequently (photo-)processed in HII regions and PDRs.
Consistent with of a “top-down” dust evolution scenario isthe observation that largeRV sight-lines, usually taken to be anindicator of prior dust coagulation, are found in PDRs such as theOrion Trapezium region (e.g., Fitzpatrick & Massa 2007). Herewe are observing dense molecular cloud dust ablated from a par-ent cloud and exposed to the intense radiation field of a PDR.Dust evolution here is driven by EUV-UV photo-processing,which drives off low-volatile mantles, triggers disaggregationand aromatises and photo-fragments a-C(:H) grains and man-tles. The dust processing time-scale is generally longer than thelocal dynamical time-scale and so the dust will therefore not bein equilibrium with the local conditions.
Recent work by Parvathi et al. (2012) supports the idea thatcarbonaceous dust undergoes significant processing in the neu-tral ISM and shows that the intensity of the UV bump extinc-tion does not correlate with carbon depletion into dust, (C/H)dust.This lack of correlation can naturally be explained by our modelbecause (C/H)dust is determined by accretion in dense cloud in-teriors (i.e., by cloud volume), whereas the intensity of the bumpand the FUV extinction reflect the abundance of UV photo-processed small grains in the low density surface regions ofclouds. The UV bump and FUV extinction per unit dust massshould therefore decrease with cloud (line of sight) columnden-
sity. In Fig. 17 we show the UV bump intensity parameter, c3(diamonds), and FUV extinction parameter, c4 (squares), datafrom Parvathi et al. (2012), normalised by their derived car-bon depletion into dust, (C/H)dust, and plotted as a functionof NH. The indicated trends in the UV extinction observationsdo seem to be consistent with this kind of cloud geometry ef-fect.15 Parvathi et al. (2012) also note that the FUV extinctionappears to show a gradual decrease with decreasing gas den-sity, nH, which they interpret as due to the preferential frag-mentation of small grains in the diffuse ISM. This observationseemingly lends support to the idea that small carbonaceousdust mass variations are driven by photo-fragmentation in lownH regions. A study by Pilleri et al. (2012) finds that the photo-fragmentation of very small carbon grains into PAHs occursin relatively dense,nH = [100, 105] cm−3, and UV irradiatedPDRs,G0 = [100, 5 × 10⁴], where H2 rotational line emissionis observed,i.e., where 0.5 < G0/nH < 1.0. This could be ob-servational evidence for H2 formation via a-C(:H) grain photo-processing, as proposed by Jones (2012b).
In PDRs EUV/UV photo-processing (a-C:H→ a-C) progres-sively destroys the aliphatic component that binds the growingaromatic domains, eventually leading to photo-fragmentationand the release of daughter species (e.g., Pety et al. 2005, and asdiscussed in paper III).16 Thus, the observable effects of photo-processing in PDRs arise from dust dis-aggregation, a-C:H grainaromatisation and photo-fragmentation, which (re-)generates apower law distribution of small a-C(:H) particles (‘cross-talk’tracks on the right of Fig. 16), leading to a progressive ‘steep-ening’ of the UV extinction (Fig. 7, lower plot), increased MIRemission from nano-particles and decreased FIR-mm emission(Fig. 12, lower plots). This evolutionary scenario seems tobesupported by Spitzer and ISO data for the Horsehead Nebulaand NGC 2023 North (Compiegne et al. 2008) and Herschel ob-servations of the Orion Bar (Arab et al. 2012), which indicatelower relative abundances of the IR band emitters and the smallgrain MIR continuum carriers, by up to an order of magnitudecompared to the diffuse ISM.
In a future paper we plan to explore the effects of grain-graincollisional fragmentation and sputtering erosion on the SED insupernova-generated shocks.
8. Concluding summary
We propose a new two-material dust model, consisting of amor-phous silicate and hydrocarbon dust, a-C(:H), with the opticalproperties of the latter determined by the particle size andma-terial band gap. This dust model consists of three dust compo-nents: small (a ≃ 0.4 to ∼ 100 nm) and large a-C(:H) grains,modelled using the optEC(s)(a) optical property data, and largecarbon-coated, amorphous forsterite-type silicate grains withmetallic iron nano-particle inclusions (a-SilFe). The large grains
15 The high FUV extinction line of sight with a weak UV bump, thesquare at [0.68,0.04], is the HD 207198 line of sight with thehighest(C/H)dust value in the Parvathi et al. (2012) sample,i.e., (C/H)dust =
395±61 ppm. Strong FUV extinction associated with a weak UV bumpis a characteristic of the wide band gap a-C:H materials expected toaccrete in the denser regions of the diffuse ISM.
16 We note that carbon dust shattering in grain-grain collisionsin shock waves results in fragments with a power-law mass dis-tribution index of order ∼ 1.8 − 2.0 (e.g., Jones et al. 1996;Serra Dıaz-Cano & Jones 2008), which is similar to the aromatic clus-ter mass distribution assumed in paper III and similar to that derived forastronomical PAHs by Pech et al. (2002).
14
Please give a shorter version with:\authorrunning and/or \titilerunning prior to \maketitle
are assumed to have log-normal size distribution peaking atradii≃ 200 nm.
Using the DustEM tool, to calculate the extinction and emis-sion, we find that this model gives a good fit to astronomicalobservations of the diffuse ISM extinction, emission and albedo,with only a minimal “fine-tuning” of the laboratory-deriveddata.The fit to these observational data, without the use of “astronom-ical” silicates, graphite or PAHs, is rather remarkable andillus-trates the viability of the adopted optEC(s)(a) and a-SilFe data.
The most innovative aspect of this dust model is that mostof the observed extinction and emission, and their evolution,can quite naturally be explained by the size- and composition-dependent optical properties of a-C(:H) dust, with amorphoussilicate dust playing only a subordinate role. We propose thatthe aliphatic-to-aromatic transformation (i.e., wide band gapa-C:H → narrow band gap a-C) is accompanied by photo-fragmentation. The evolution of the large a-C(:H) grains formedaround evolved stars and the mantles formed by accretion in thedense ISM is then driven EUV-UV photo-processing and photo-fragmentation in HII regions and PDRs. These processes arelikely to be critical for understanding dust evolution in the ISM.
Our understanding in interstellar dust modelling is currentlylimited by a lack of suitable, wide-wavelength coverage (EUV-cm) laboratory data for analogues of amorphous silicate andhy-drocarbon dust. In particular, a major hindrance to the ‘holistic’dust modelling approach is the current lack of suitable opticalproperty data for analogues of interstellar amorphous silicates,and also the means to validate the optEC(s)(a) data. A definitivequantitative analysis of astronomical observations must awaitthese data and so some care should currently be exercised in or-der to avoid over-interpretation. Nevertheless, the fact that thismodel is able to explain so many FUV-mm dust observables,and their inter-correlations, is encouraging.
Acknowledgements.We thank the anonymous referee for a very careful read-ing of this manuscript and papers I-III, and for many useful and insightfulremarks. We would like to thank our colleagues at the IAS and elsewherefor many interesting discussions on cosmic dust. This research was, in part,made possible through the financial support of the Agence National de laRecherche (ANR) through the programs Cold Dust (ANR-07-BLAN-0364-01)and CIMMES (ANR-11-BS56-029-02).
Note added in proof
In section 4 we should also have made reference to the workof Viktor Zubko, Eli Dwek & Richard G. Arendt (2004, ApJ,152:211-249) who present a wide array of PAH, bare-grain andcomposite (but not core-mantle) dust models that are consis-tent with the extinction, emission and abundance constraints.In all of the dust models proposed by Zubko et al. (2004) thewavelength-dependenceof the FUV extinction is due to the com-bined effects of PAHs, carbonaceous/graphiteand/or silicate dustcomponents, which appears to be inconsistent with observations(Greenberg & Chlewicki 1983).
ReferencesAdamson, A. J., Whittet, D. C. B., Chrysostomou, A., et al. 1999, ApJ, 512, 224Agladze, N. I., Sievers, A. J., Jones, S. A., Burlitch, J. M.,& Beckwith, S. V. W.
1996, ApJ, 462, 1026Angus, J. C. & Hayman, C. C. 1988, Science, 241, 913Angus, J. C. & Jansen, F. 1988, Journal of Vacuum Science Technology, 6, 1778Arab, H., Abergel, A., Habart, E., et al. 2012, A&A, 541, A19Bernard-Salas, J., Cami, J., Peeters, E., et al. 2012, ApJ, 757, 41Bocchio, M., Micelotta, E. R., Gautier, A.-L., & Jones, A. P.2012, A&A, 545,
A124Bohlin, R. C., Savage, B. D., & Drake, J. F. 1978, ApJ, 224, 132Boudet, N., Mutschke, H., Nayral, C., et al. 2005, ApJ, 633, 272
Boulanger, F., Prevot, M. L., & Gry, C. 1994, A&A, 284, 956Brooke, T. Y., Sellgren, K., & Geballe, T. R. 1999, ApJ, 517, 883Chang, Y. K., Hsieh, H. H., Pong, W. F., et al. 1999, Physical Review Letters,
82, 5377Cheng, S. Z. D., ed. 2002, Handbook of Thermal Analysis and Calorimetry:
Applications to Polymers and Plastics; Series Editor: Patrick K. Gallagher,Editor: Stephen Z.D. Cheng (Elsevier Science BV)
Chiar, J. E., Adamson, A. J., Whittet, D. C. B., et al. 2006, ApJ, 651, 268Chiar, J. E. & Tielens, A. G. G. M. 2006, ApJ, 637, 774Chiar, J. E., Tielens, A. G. G. M., Adamson, A. J., & Ricca, A. 2013, ApJ, 770,
78Chiar, J. E., Tielens, A. G. G. M., Whittet, D. C. B., et al. 2000, ApJ, 537, 749Chlewicki, G. & Laureijs, R. J. 1988, A&A, 207, L11Compiegne, M., Abergel, A., Verstraete, L., & Habart, E. 2008, A&A, 491, 797Compiegne, M., Verstraete, L., Jones, A., et al. 2011, A&A,525, A103+Coupeaud, A., Demyk, K., Meny, C., et al. 2011, A&A, 535, A124Dalle Ore, C. M., Fulchignoni, M., Cruikshank, D. P., et al. 2011, A&A, 533,
A98+Dartois, E., Marco, O., Munoz-Caro, G. M., et al. 2004a, A&A, 423, 549Dartois, E., Munoz Caro, G. M., Deboffle, D., & d’Hendecourt, L. 2004b, A&A,
423, L33Dartois, E., Munoz Caro, G. M., Deboffle, D., Montagnac, G., & D’Hendecourt,
L. 2005, A&A, 432, 895Davoisne, C., Djouadi, Z., Leroux, H., et al. 2006, A&A, 448,L1Desert, F.-X., Boulanger, F., & Puget, J. L. 1990, A&A, 237, 215Dohler, G. H., Dandaloff, R., & Bilz, H. 1980, J. Noncryst. Solids, 42, 87Dorschner, J., Begemann, B., Henning, T., Jaeger, C., & Mutschke, H. 1995,
A&A, 300, 503Draine, B. T. & Anderson, N. 1985, ApJ, 292, 494Draine, B. T. & Lee, H. M. 1984, ApJ, 285, 89Draine, B. T. & Li, A. 2001, ApJ, 551, 807Draine, B. T. & Li, A. 2007, ApJ, 657, 810Duley, W. W. 1995, ApJ, 445, 240Duley, W. W., Seahra, S., & Williams, D. A. 1997, ApJ, 482, 866Ferrari, A. C. & Robertson, J. 2000, Phys. Rev. B, 61, 14095Ferrari, A. C. & Robertson, J. 2004, Phil. Trans. R. Soc. Lond. A, 362, 2477Fitzpatrick, E. L. 2004, in Astronomical Society of the Pacific Conference Series,
Vol. 309, Astrophysics of Dust, ed. A. N. Witt, G. C. Clayton,& B. T. Draine,33–+
Fitzpatrick, E. L. & Massa, D. 2007, ApJ, 663, 320Fitzpatrick, E. L. & Massa, D. 2009, ApJ, 699, 1209Foster, J. B. & Goodman, A. A. 2006, ApJ, 636, L105Fritz, T. K., Gillessen, S., Dodds-Eden, K., et al. 2011, ApJ, 737, 73Gadallah, K. A. K., Mutschke, H., & Jager, C. 2011, A&A, 528,A56+Gao, J., Jiang, B. W., & Li, A. 2010, Earth, Planets, and Space, 62, 63Godard, M. & Dartois, E. 2010, A&A, 519, A39+Godard, M., Feraud, G., Chabot, M., et al. 2011, A&A, 529, A146+Goto, M., Gaessler, W., Hayano, Y., et al. 2003, ApJ, 589, 419Greenberg, J. M. & Chlewicki, G. 1983, ApJ, 272, 563Greenberg, J. M. & Li, A. 1996, A&A, 309, 258Hurwitz, M., Bowyer, S., & Martin, C. 1991, ApJ, 372, 167Jochims, H. W., Ruhl, E., Baumgartel, H., Tobita, S., & Leach, S. 1994, ApJ,
420, 307Jones, A. 2001, in Astronomical Society of the Pacific Conference Series, Vol.
231, Tetons 4: Galactic Structure, Stars and the Interstellar Medium, ed.C. E. Woodward, M. D. Bicay, & J. M. Shull, 171–+
Jones, A. P. 2009, in Astronomical Society of the Pacific Conference Series, Vol.414, Cosmic Dust - Near and Far, ed. T. Henning, E. Grun, & J. Steinacker,473–+
Jones, A. P. 2012a, A&A, 540, A1 (paper I)Jones, A. P. 2012b, A&A, 540, A2 (paper II)Jones, A. P. 2012c, A&A, 542, A98 (paper III)Jones, A. P. 2012d, A&A, 545, C2 (Corrigendum paper II)Jones, A. P. 2012e, A&A, 545, C3 (Corrigendum paper III)Jones, A. P. 2013, A&A, 555, A39Jones, A. P., Duley, W. W., & Williams, D. A. 1990, QJRAS, 31, 567Jones, A. P. & Nuth, J. A. 2011, A&A, 530, A44Jones, A. P., Tielens, A. G. G. M., & Hollenbach, D. J. 1996, ApJ, 469, 740Kassavetis, S., Patsalas, P., Logothetidis, S., Robertson, J., & Kennou, S. 2007,
Diamond & Related Materials, 16, 1813Kohler, M., Guillet, V., & Jones, A. 2011, A&A, 528, A96Kohler, M., Stepnik, B., Jones, A. P., et al. 2012, A&A, 548,A61Kwok, S. & Zhang, Y. 2011, Nature, 479, 80Kwok, S. & Zhang, Y. 2013, ApJ, 771, 5Larson, R. B. 1973, MNRAS, 161, 133Li, A. & Draine, B. T. 2001, ApJ, 554, 778Li, A. & Draine, B. T. 2012, ApJ, 760, L35Li, A. & Greenberg, J. M. 1997, A&A, 323, 566
15
Please give a shorter version with:\authorrunning and/or \titilerunning prior to \maketitle
Li, A. & Greenberg, J. M. 2002, ApJ, 577, 789Lillie, C. F. & Witt, A. N. 1976, ApJ, 208, 64Llamas-Jansa, I., Jager, C., Mutschke, H., & Henning, T. 2007, Carbon, 45, 1542Lutz, D., Feuchtgruber, H., Genzel, R., et al. 1996, A&A, 315, L269Mathis, J. S. 1990, ARA&A, 28, 37Mathis, J. S., Rumpl, W., & Nordsieck, K. H. 1977, ApJ, 217, 425Mathis, J. S. & Whiffen, G. 1989, ApJ, 341, 808Mattioda, A. L., Hudgins, D. M., & Allamandola, L. J. 2005, ApJ, 629, 1188Mattioda, A. L., Rutter, L., Parkhill, J., et al. 2008, ApJ, 680, 1243McKee, C. 1989, in IAU Symposium, Vol. 135, Interstellar Dust, ed. L. J.
Allamandola & A. G. G. M. Tielens, 431Mennella, V. 2008, ApJ, 682, L101Mennella, V., Baratta, G. A., Esposito, A., Ferini, G., & Pendleton, Y. J. 2003,
ApJ, 587, 727Mennella, V., Brucato, J. R., Colangeli, L., et al. 1998, ApJ, 496, 1058Mennella, V., Colangeli, L., Bussoletti, E., et al. 1995, ApJS, 100, 149Mennella, V., Colangeli, L., Palumbo, P., et al. 1996, ApJ, 464, L191+Meny, C., Gromov, V., Boudet, N., et al. 2007, A&A, 468, 171Micelotta, E. R., Jones, A. P., Cami, J., et al. 2012, ApJ, 761, 35Micelotta, E. R., Jones, A. P., & Tielens, A. G. G. M. 2010a, A&A, 510, A36+Micelotta, E. R., Jones, A. P., & Tielens, A. G. G. M. 2010b, A&A, 510, A37+Micelotta, E. R., Jones, A. P., & Tielens, A. G. G. M. 2011, A&A, 526, A52+Morgan, D. H. 1980, MNRAS, 190, 825Morgan, D. H., Nandy, K., & Thompson, G. I. 1976, MNRAS, 177, 531Nguyen, A. N., Stadermann, F. J., Zinner, E., et al. 2007, ApJ, 656, 1223Ordal, M. A., Bell, R. J., Alexander, Jr., R. W., Long, L. L., &Querry, M. R.
1985, Appl. Opt., 24, 4493Ordal, M. A., Bell, R. J., Alexander, Jr., R. W., Newquist, L.A., & Querry, M. R.
1988, Appl. Opt., 27, 1203Ordal, M. A., Long, L. L., Bell, R. J., et al. 1983, Appl. Opt.,22, 1099Pagani, L., Steinacker, J., Bacmann, A., Stutz, A., & Henning, T. 2010, Science,
329, 1622Parvathi, V. S., Sofia, U. J., Murthy, J., & Babu, B. R. S. 2012,ApJ, 760, 36Pech, C., Joblin, C., & Boissel, P. 2002, A&A, 388, 639Pety, J., Teyssier, D., Fosse, D., et al. 2005, A&A, 435, 885Phillips, J. C. 1979, Physical Review Letters, 42, 1151Pilleri, P., Montillaud, J., Berne, O., & Joblin, C. 2012, A&A, 542, A69Pino, T., Dartois, E., Cao, A., et al. 2008, A&A, 490, 665Planck Collaboration, Abergel, A., Ade, P. A. R., et al. 2011a, A&A, 536, A25Planck Collaboration, Abergel, A., Ade, P. A. R., et al. 2011b, A&A, 536, A24Robertson, J. 1986, Advances in Physics, 35, 317Robertson, J. 1988, Philosophical Magazine Letters, 57, 143Robertson, J. 1991, Prog. Solid State Chem., 21, 199Robertson, J. 2001, Physica Status Solidi Applied Research, 186, 1521Robertson, J. 2002, Materials Science and Engineering, 37,129Robertson, J. & O’Reilly, E. P. 1987, Phys. Rev. B, 35, 2946Savage, B. D. & Mathis, J. S. 1979, ARA&A, 17, 73Scott, A. & Duley, W. W. 1996, ApJS, 105, 401Sellgren, K., Brooke, T. Y., Smith, R. G., & Geballe, T. R. 1995, ApJ, 449, L69Serra Dıaz-Cano, L. & Jones, A. P. 2008, A&A, 492, 127Sloan, G. C., Bregman, J. D., Geballe, T. R., Allamandola, L.J., & Woodward,
C. E. 1997, ApJ, 474, 735Sloan, G. C., Jura, M., Duley, W. W., et al. 2007, ApJ, 664, 1144Smith, R. G., Sellgren, K., & Tokunaga, A. T. 1989, ApJ, 344, 413Steinacker, J., Pagani, L., Bacmann, A., & Guieu, S. 2010, A&A, 511, A9+Stepnik, B., Abergel, A., Bernard, J.-P., et al. 2003, A&A, 398, 551Tamor, M. A. & Wu, C. H. 1990, Journal of Applied Physics, 67, 1007Tauc, J., Grigorovici, R., & Vancu, A. 1966, Physica Status Solidi B Basic
Research, 15, 627Thorpe, M. 1983, Journal of Non Crystalline Solids, 57, 355Verstraete, L., Pech, C., Moutou, C., et al. 2001, A&A, 372, 981Witt, A. N., Friedmann, B. C., & Sasseen, T. P. 1997, ApJ, 481,809Yamagishi, M., Kaneda, H., Ishihara, D., et al. 2012, A&A, 541, A10Zeidler, S., Posch, T., Mutschke, H., Richter, H., & Wehrhan, O. 2011, A&A,
526, A68
Appendix A: Interstellar silicates
The optical properties of interstellar silicates have beenmod-elled by empirical fits to observations (Draine & Lee 1984) andalso using laboratory-constrained organic-refractory and amor-phous silicate data for core-mantle particles (Greenberg &Li1996). Both approaches have been shown to give a good fit tothe observations. However, these models have a problem in that
they require essentially all of the available cosmic iron tobe in-corporated into the silicate but appear to add it for ‘free’.In that,they include its atomic fraction and mass but, apparently, ne-glect its important contribution to the imaginary part of the re-fractive index in the NIR region,e.g., see Fig. 3 in Draine & Lee(1984) and Fig. 1 in Greenberg & Li (1996). However, the in-clusion of the cosmic abundance of iron into a silicate is farfrom ‘free’ but leads to very significant absorption in the NIR(e.g., Zeidler et al. 2011) regardless of whether the iron is withinthe silicate structure or present as metallic nano-particles (e.g.,see Fig. A.1). If the effect of the neglected iron on the opticalconstants of Draine & Lee (1984) and Greenberg & Li (1996)were to be included then the predicted silicate dust tempera-tures would be hotter than indicated by observations because ofthe enhanced absorption in the NIR region, where the interstel-lar radiation field peaks. Thus, the amorphous astronomicalsil-icate data derived by Draine & Lee (1984) and Greenberg & Li(1996) are not without significant problems.
It is clear that, ideally, the recent laboratory data for amor-phous silicates by Coupeaud et al. (2011) should be used to con-strain the temperature-dependence of its long-wavelengthprop-erties. However, the currently-available data does not have awide enough wavelength coverage to be used in amorphous sili-cate dust extinction and emission models.
For amorphous interstellar silicates, and until such timeas suitable full wavelength-coverage optical property data areavailable for interstellar silicate analogue materials, we adoptan approach that allows for a range of silicate metal deple-tions. We first consider the available laboratory data for amor-phous olivine-type silicates with iron incorporated into the sil-icate structure (Mg:Fe= 1:1 or 1:1.5, Dorschner et al. 1995).Secondly, following the work of Davoisne et al. (2006) on an-nealed silicates, where the iron is reduced to metal in the pres-ence of carbon, we consider an amorphous forsterite-type sili-cate (Scott & Duley 1996) with∼ 70% of the cosmic iron17 is in-corporated in the form of metallic iron (Ordal et al. 1983, 1985,1988) nano-particle inclusions, equivalent to a metal ratio Mg:Fe= 2.3:1. The complex refractive index for the latter amorphoussilicate/Fe mix, a-SilFe, was calculated using the Maxwell-Garnett effective medium theory (EMT).18 In Fig. A.1 we showour derived amorphous, Fe nanoparticle-containing, forsterite-type silicate complex refractive index data in comparison withother available silicate data. In the NIR wavelength region(0.2−8.0µm) the a-SilFe data are close to those for the amorphousolivine-type silicate, (Mg,Fe)2SiO4, of Dorschner et al. (1995),as alluded to above, and allow for a range of silicate metal de-pletions.
We note that adding∼ 70% of the cosmic iron, as metallicnano-particles, into an amorphous silicate matrix has about thesame effect on the optical properties in the NIR as incorporatingthe iron into the silicate structure (Fig. A.1). Hence, the presenceof iron as metallic inclusions or as cations within the silicatestructure leads to significant NIR absorption in the 0.3 − 3µmregion where the ISRF peaks.
In conclusion, dust modelling is currently hampered by thelack of laboratory-measured optical constants for appropriate
17 Assuming a cosmic abundance of 32 ppm for Fe, of which 22 ppmis incorporated into a silicate matrix as metallic Fe nano-particles or intothe silicate as cations. For Mg we require an abundance of 50 ppm if theFe is in metal or 67 ppm if the Fe is present as cations in the silicate (seeSection 6.1).
18 These refractive index data are available from the authors upon re-quest.
16
Please give a shorter version with:\authorrunning and/or \titilerunning prior to \maketitle
amorphous interstellar silicate analogue materials over asuffi-ciently wide wavelength range (i.e., FUV to mm wavelengths).Further, our uncertain knowledge as to where, and in what solidform, the bulk of the cosmic iron is to be found in interstellardust is also a severe limitation.
Appendix B: a-C(:H) material heat capacities
As proposed in paper III we assume that the heat capacity of a-C(:H) materials is the linear sum of the abundance-weightedheatcapacities of the constituent atoms in the given bonding configu-rations. We therefore calculate the particle heat capacities usingEq. (A.3) from paper III,i.e.,
CV
NC=
1(1− XH)
×
X′HCV(CH) + Xsp3
[
CV(CC)sp2
R+CV(CC)sp3
]
, (B.1)
which includes the contributions from surface and interiorHatoms,X′H, sp2 aromatic/olefinic andsp3 aliphatic C atoms, theleft, centre and right terms in the lower line of Eq. (B.1), re-spectively. For the CH bond heat capacity,CV(CH), and for thearomatic/olefinic C atom heat capacity,CV(CC)sp2, we adopt theDraine & Li (2001) approach used to determine the heat capaci-ties of free-flying PAHs in the ISM. However, we are interestedin the aromatic domains within solid a-C(:H) and therefore usethe number of carbon atoms per aromatic domain rather than thetotal number of C atoms in the particle in our determination ofCV(CC)sp2. For thesp3 component heat capacity,CV(CC)sp3, weadopt the values for polyethylene (Cheng 2002, Fig. 10, p. 18).
Appendix C: “Astronomicalisation” of theoptEC (s)(a) data
C.1. IR band profiles and the emission bands
In order to better fit the observed astronomical IR emissionand absorption band profile intensities and widths we neededtomake only a few, rather minor, modifications to the previously-published optEC(s)(a) band profile data (Jones 2012a). Thesechanges are: the re-assignment of four aliphatic C-C bands toaromatic C≃C, and adjustments to the intensities (widths) ofnine (six) bands. The new band profile intensity and width val-ues are shown in boldface in Table C.1; otherwise the data arethe same as in Table 2 of paper I.
C.2. The π − π⋆ band and the UV extinction bump
We find that the optEC(s)(a) data gives a better fit to the observed217 nm UV bump when the single aromatic ring (NR = 1),benzene-like clusters are not included in the aromatic clusterdistribution summation (Section B.1.1 in paper III). This wasalready hinted at in the discussion of the C6 band in Appendix Bof paper III. There the abundance scaling factor forNR = 1 aro-matic species was taken to be 0.08 rather than 1 and the astro-nomical observation requirements seemingly justify that suppo-sition. Hence, and for particles witha ≤ 30 nm, the summationin the denominator of Eq. (B.5) in paper III should run fromNR = 2 (rather thanNR = 1) up to the largest aromatic clustersize,NR(max), which is equivalent to setting the relative abun-dance forNR = 1 to zero rather than the value of 0.08 asumed inpaper III.
As shown in paper III, theas-isuse of the optEC(s)(a) datapredicts a UV bump that is too large by about a factor of twoand it was concluded there that we do not yet have a completeunderstanding of the physics of the likely UV bump carriers.Here we attempt to, in part, fill this gap by adopting an empir-ical approach. We find that, for nanoparticles witha < 3 nm, anarrowing of the contributing aromatic bands is required togeta reasonable fit to the UV bump width and adopt the followingempirical relationship
σ = σ0 × exp
(
−0.3NR
)
for a 6 3 nm, (C.1)
whereσ0 = 0.650N0.08R , as per paper III, and the exponential
term gives the aromatic cluster size-dependence.
C.3. The σ − σ⋆ band and the FUV extinction
As suggested in paper III, theσ − σ⋆ band in a-C:H materialsshould exhibit size-dependent effect, as per theπ − π⋆ band (seepaper III for details and also Section C.2) but, to date and asfaras we are aware, no such effect has been measured for a-C(:H).
However, the observation of quantum-size effects that cansignificantly alter the electronic properties of semiconductor ma-terials when they exist as nano-crystals or nanoparticles wouldhave major implications for the optical properties of interstel-lar dust particles. For example, in diamond, the conductionbandand valence band energies (ECB andEVB) are, respectively, ob-served to shift to higher and lower energies as the particle sizedecreases. This leads to an increase in the band gap and a conse-quent shift in the absorption edge to shorter wavelengths astheparticle size decreases. This effect was well-demonstrated formicro- and nanodiamond particles by Chang et al. (1999). Theyshowed that for diamond particles with radii< 1.8 nm (with< 4300 C atoms)ECB does not remain bulk-like. From the re-sults of Chang et al. the shift in the conduction band energy,∆ECB, can be expressed as,
∆ECB =(π ~)2
2m∗ a2(C.2)
wherem∗ is the electron effective mass (0.10me, whereme is theelectron mass),~ = h/2π whereh is Planck’s constant anda isthe particle radius. Fig. C.1 plots∆ECB as a function of radius fornanodiamonds and indicates that the pre-solar, meteoriticnan-odiamonds (mean radii∼ 1.4 nm) will clearly have electronicproperties that differ markedly from those of bulk diamond. Infact, nanodiamonds may have band gap energies (ECB − EVB)shifted by about 1 eV from the bulk diamond value of 5.5 eV(226 nm, 4.4µm−1), to in excess of 6.4 eV (190 nm, 5.3µm−1).
Given that theσ − σ⋆ band in a-C(:H) materials is deter-mined by the carbon atom 2s electrons, exactly as in diamond,we use the above approach to determine the size-dependent shiftin the band gap. For a-C(:H) materials at nanoparticle sizeswefollow Chang et al. (1999) and shift the a-C(:H)σ − σ⋆ bandpeak energy by
Eσ−σ⋆ (a) = E0,σ−σ⋆ + ∆Ea−C(:H) = E0,σ−σ⋆ +(π ~)2
2m∗ a2, (C.3)
where we here set∆Ea−C(:H) = ∆ECB. Recalling that, from pa-per III, E0,σ−σ⋆ = 13.0 eV, we limit the band peak position to amaximum of 14 eV,i.e., a maximum band shift of 1 eV, coherentwith that measured in diamond (Chang et al. 1999).
In order to get a reasonable fit to the observed slope and in-tensity of the FUV extinction we also needed to increase the
17
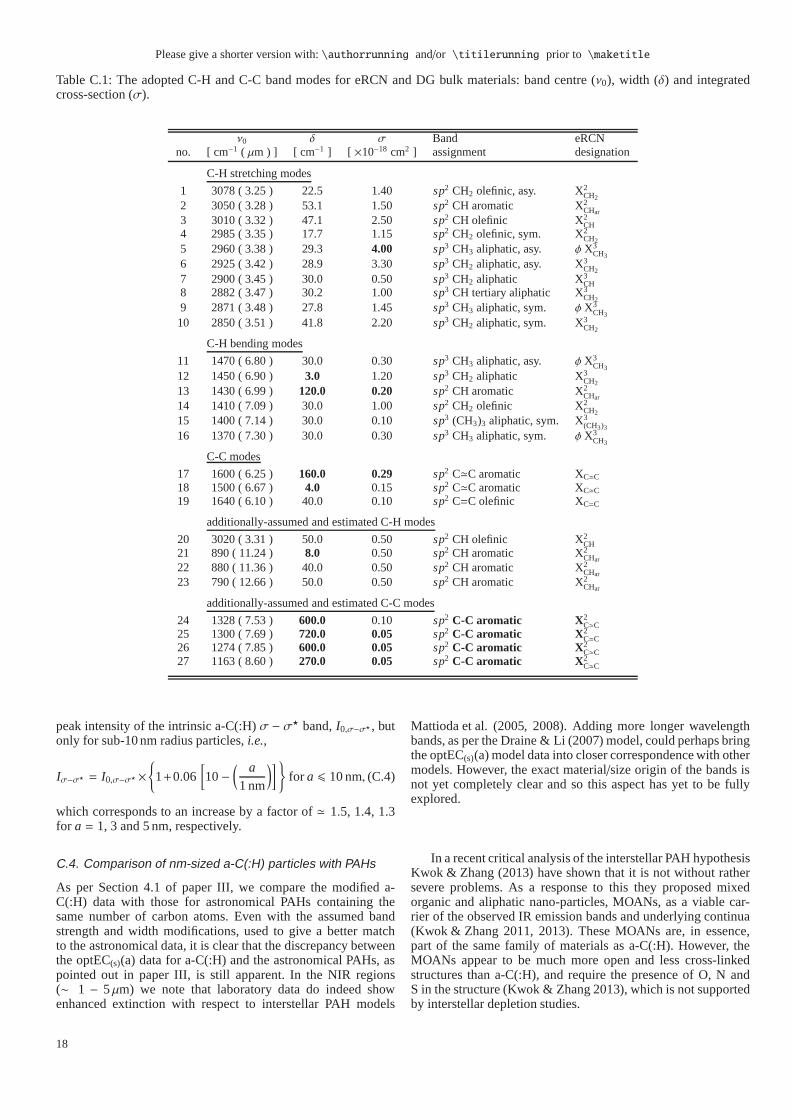
Please give a shorter version with:\authorrunning and/or \titilerunning prior to \maketitle
Table C.1: The adopted C-H and C-C band modes for eRCN and DG bulk materials: band centre (ν0), width (δ) and integratedcross-section (σ).
ν0 δ σ Band eRCNno. [ cm−1 ( µm ) ] [ cm−1 ] [ ×10−18 cm2 ] assignment designation
C-H stretching modes
1 3078 ( 3.25 ) 22.5 1.40 sp2 CH2 olefinic, asy. X2CH2
2 3050 ( 3.28 ) 53.1 1.50 sp2 CH aromatic X2CHar
3 3010 ( 3.32 ) 47.1 2.50 sp2 CH olefinic X2CH
4 2985 ( 3.35 ) 17.7 1.15 sp2 CH2 olefinic, sym. X2CH2
5 2960 ( 3.38 ) 29.3 4.00 sp3 CH3 aliphatic, asy. φ X3CH3
6 2925 ( 3.42 ) 28.9 3.30 sp3 CH2 aliphatic, asy. X3CH2
7 2900 ( 3.45 ) 30.0 0.50 sp3 CH2 aliphatic X3CH
8 2882 ( 3.47 ) 30.2 1.00 sp3 CH tertiary aliphatic X3CH2
9 2871 ( 3.48 ) 27.8 1.45 sp3 CH3 aliphatic, sym. φ X3CH3
10 2850 ( 3.51 ) 41.8 2.20 sp3 CH2 aliphatic, sym. X3CH2
C-H bending modes
11 1470 ( 6.80 ) 30.0 0.30 sp3 CH3 aliphatic, asy. φ X3CH3
12 1450 ( 6.90 ) 3.0 1.20 sp3 CH2 aliphatic X3CH2
13 1430 ( 6.99 ) 120.0 0.20 sp2 CH aromatic X2CHar
14 1410 ( 7.09 ) 30.0 1.00 sp2 CH2 olefinic X2CH2
15 1400 ( 7.14 ) 30.0 0.10 sp3 (CH3)3 aliphatic, sym. X3(CH3)316 1370 ( 7.30 ) 30.0 0.30 sp3 CH3 aliphatic, sym. φ X3
CH3
C-C modes
17 1600 ( 6.25 ) 160.0 0.29 sp2 C≃C aromatic XC≃C
18 1500 ( 6.67 ) 4.0 0.15 sp2 C≃C aromatic XC≃C
19 1640 ( 6.10 ) 40.0 0.10 sp2 C=C olefinic XC=C
additionally-assumed and estimated C-H modes
20 3020 ( 3.31 ) 50.0 0.50 sp2 CH olefinic X2CH
21 890 ( 11.24 ) 8.0 0.50 sp2 CH aromatic X2CHar
22 880 ( 11.36 ) 40.0 0.50 sp2 CH aromatic X2CHar
23 790 ( 12.66 ) 50.0 0.50 sp2 CH aromatic X2CHar
additionally-assumed and estimated C-C modes
24 1328 ( 7.53 ) 600.0 0.10 sp2 C-C aromatic X2C≃C
25 1300 ( 7.69 ) 720.0 0.05 sp2 C-C aromatic X2C≃C
26 1274 ( 7.85 ) 600.0 0.05 sp2 C-C aromatic X2C≃C
27 1163 ( 8.60 ) 270.0 0.05 sp2 C-C aromatic X2C≃C
peak intensity of the intrinsic a-C(:H)σ − σ⋆ band,I0,σ−σ⋆ , butonly for sub-10 nm radius particles,i.e.,
Iσ−σ⋆ = I0,σ−σ⋆ ×
{
1+0.06[
10−( a1 nm
)]
}
for a 6 10 nm, (C.4)
which corresponds to an increase by a factor of≃ 1.5, 1.4, 1.3for a = 1, 3 and 5 nm, respectively.
C.4. Comparison of nm-sized a-C(:H) particles with PAHs
As per Section 4.1 of paper III, we compare the modified a-C(:H) data with those for astronomical PAHs containing thesame number of carbon atoms. Even with the assumed bandstrength and width modifications, used to give a better matchto the astronomical data, it is clear that the discrepancy betweenthe optEC(s)(a) data for a-C(:H) and the astronomical PAHs, aspointed out in paper III, is still apparent. In the NIR regions(∼ 1 − 5µm) we note that laboratory data do indeed showenhanced extinction with respect to interstellar PAH models
Mattioda et al. (2005, 2008). Adding more longer wavelengthbands, as per the Draine & Li (2007) model, could perhaps bringthe optEC(s)(a) model data into closer correspondence with othermodels. However, the exact material/size origin of the bands isnot yet completely clear and so this aspect has yet to be fullyexplored.
In a recent critical analysis of the interstellar PAH hypothesisKwok & Zhang (2013) have shown that it is not without rathersevere problems. As a response to this they proposed mixedorganic and aliphatic nano-particles, MOANs, as a viable car-rier of the observed IR emission bands and underlying continua(Kwok & Zhang 2011, 2013). These MOANs are, in essence,part of the same family of materials as a-C(:H). However, theMOANs appear to be much more open and less cross-linkedstructures than a-C(:H), and require the presence of O, N andS in the structure (Kwok & Zhang 2013), which is not supportedby interstellar depletion studies.
18
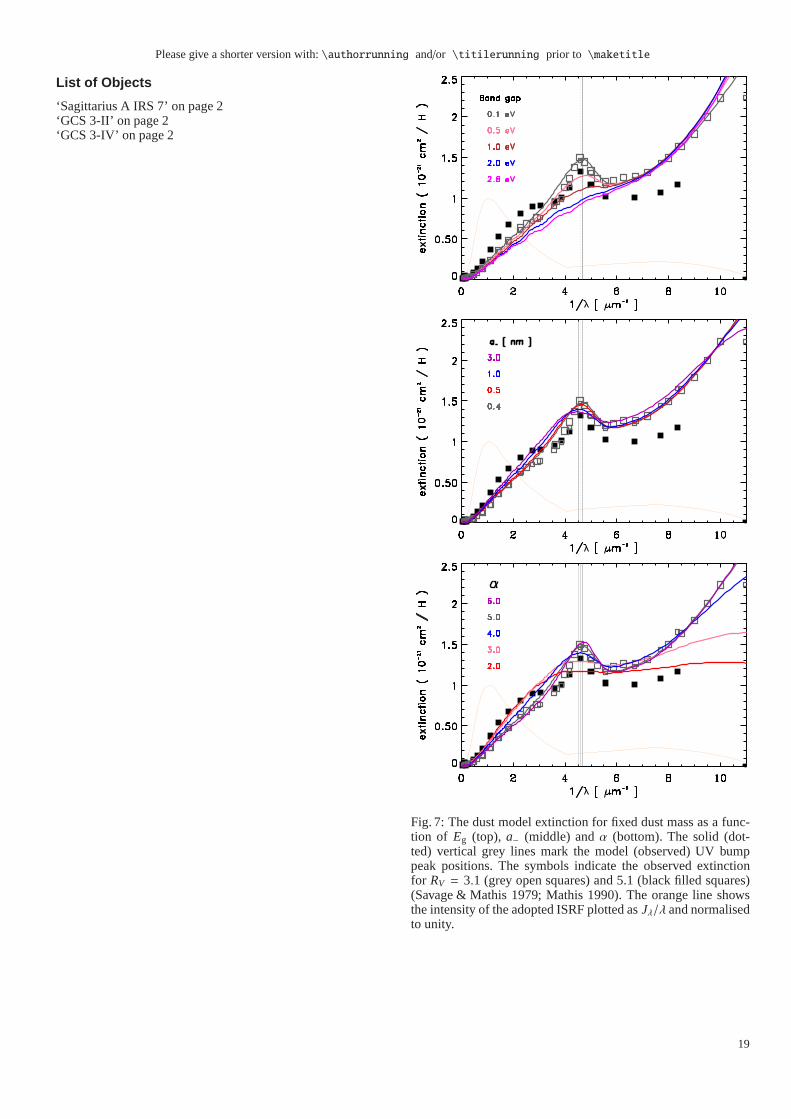
Please give a shorter version with:\authorrunning and/or \titilerunning prior to \maketitle
List of Objects
‘Sagittarius A IRS 7’ on page 2‘GCS 3-II’ on page 2‘GCS 3-IV’ on page 2
Fig. 7: The dust model extinction for fixed dust mass as a func-tion of Eg (top), a− (middle) andα (bottom). The solid (dot-ted) vertical grey lines mark the model (observed) UV bumppeak positions. The symbols indicate the observed extinctionfor RV = 3.1 (grey open squares) and 5.1 (black filled squares)(Savage & Mathis 1979; Mathis 1990). The orange line showsthe intensity of the adopted ISRF plotted asJλ/λ and normalisedto unity.
19

Please give a shorter version with:\authorrunning and/or \titilerunning prior to \maketitle
Fig. 8: Dust size distributions for fixed mass in each component:large a-C:H/a-C particles (black dotted), large a-SilFe/a-C parti-cles (black tripple-dot-dashed), for varying small a-C(:H) grainsize distribution power-law index,α.
Fig. 9: The NIR extinction predicted by the model (solid lines)and the parameterised fits (as per Fitzpatrick & Massa 2009) forvarying band gap,Eg [eV] (dashed lines), for a column densityNH = 5 × 1021 cm−2. The model data colour-coding is as perFig. 7. The sinusoidal structure is due to the adopted narrowsili-cate size range and will not be present in real, irregular andnon-spherical particles.
Fig. 10: The Fitzpatrick & Massa (2009) NIR extinction param-eterαNIR as a function ofRV (large black squares), see Eq. (1).The fit parameters for our model as a function ofEg (α) areshown by the coloured squares (crosses), the colour-codingasper Fig. 7. The thick squares use the modelRV and the thinsquares the best fitRV values from Eq. (1), shown as the dashedlines in Fig. 9. The vertical grey band shows the typical diffuseISM value ofRV.
Fig. 11: The dust model 3− 14µm and 3.1 − 3.7µm emissionband spectra as a function of the a-C(:H) material band gap,Eg[eV].
20

Please give a shorter version with:\authorrunning and/or \titilerunning prior to \maketitle
Fig. 12: The dust model SEDs, for fixed dust mass, as a functionof Eg (upper panel),a− (middle panel) andα (lower panel). Theline designations are as per Fig. 7.
Fig. 13: The normalised FIR-cm SEDs show that the emissivityslopes segregate into two band-gap groups, one withβ ∼ 1.3 forEg ∼ 0 eV and the other withβ ∼ 2 for Eg & 0.5 eV. The linedesignations are as per Fig. 7. The dashed blue lines indicateslopes of -1.0, -1.3, -1.5, -1.8 and -2.0, from top to bottom.
21

Please give a shorter version with:\authorrunning and/or \titilerunning prior to \maketitle
Fig. 14: Upper plot: βeff vs. λ, as a function ofEg, whereβeffis the effective emissivity slope resulting from a combination ofthe a-SilFe/a-C and a-C:H/a-C dust population optical properties.The green triple dot-dashed line shows the data for only the a-SilFe/a-C grains, which do not depend on the band gap of the thina-C(:H) coating. Theλ-dependence and variations are thereforeonly due to the a-C(:H) dust properties. The line colour-coding isas per Fig. 11. The horizontal grey lines and wide yellow bandsshowβeff = 1.80± 0.05 and 1.60± 0.05.Lower plot: The emissivity slope,β, for a-C(:H) dust, forλ = 100µm, 300µm, and 1 mm, as a function ofEg, fora = 100, 10 and 1 nm. The vertical grey dashed line shows theexperimentally-derived ‘block’ on band gap evolution (seepa-per II). The grey area indicates the range of a-C materials thatare consistent with many diffuse ISM dust properties (Section6). The coloured squares at the bottom indicate the band gapcolour coding scheme.
Fig. 15: The dust model extinction,τi , in the V band (blue) andat 250µm (green) and 1 mm (red) wavelengths for an assumedcolumn densityNH = 1021 H cm−2. The upper plot shows thevariations as a function of the a-C(:H) material band gap,Eg,and the lower plot as a function of the power-law,α, componentof the small a-C dust population. The filled data points indicatethe values for the best-fit DHGL dust model. The crosses witherror bars showτ250 = 5.8± 1.7× 10⁻⁴ E(B− V), from Eq. (2),multiplied by104.
22

Please give a shorter version with:\authorrunning and/or \titilerunning prior to \maketitle
See
Jones
et
al. (
A&
A, 5
58 A
62, 2
013)
Fig. 16: A schematic view of the life-cycle of interstellar dustin terms of evolutionary tracks: ‘parallel-processing’ tracks thatlead to a smooth evolution are horizontal (i.e., accretion andphoto-processing) and ‘cross-talk’ tracks that lead to significantmass-transfer between grains sizes (i.e., coagulation and disag-gregation) are diagonal and vertical. Qualitatively, the red shad-ing reflects the density,nH, and the violet shading, on the ex-treme right, represents highG0 radiation fields.
Fig. 17: The UV bump parameter, c3 (diamonds), and FUV ex-tinction parameter, c4 × 25 (squares), intensity data normalisedby the depletion into dust, (C/H)dust, as a function ofNH. Theyvalue uncertainties are only illustrative. The data are taken fromParvathi et al. (2012).
Fig. A.1: The black lines show the imaginary (solid) and real(dashed) parts of the complex refractive index of our newly-constructed amorphous silicate/Fe nano-particle material, a-SilFe. This is a composite constructed using the amorphousforsterite-type silicate data (green) from Scott & Duley (1996)and the metallic iron data (grey) from Ordal et al. (1983,1985, 1988), see text for details. For comparison we showthe experimental data for iron-containing amorphous olivine-type silicates, MgFeSiO4 (orange) and Mg0.8Fe1.2SiO4 (brown),from Dorschner et al. (1995) and the astronomical data ofDraine & Lee (1984) (cobalt blue).
23

Please give a shorter version with:\authorrunning and/or \titilerunning prior to \maketitle
Fig. C.1: Shift in the conduction band energy,ECB, as a func-tion of radius for nanodiamonds, calculated using Eq. C.2. Thethick, solid portion of the curve indicates the behaviour sup-ported by the experimental results of Chang et al. (1999) andthe dashed portion is the extrapolation to smaller sizes usingEq. C.2. For reference, the vertical solid line marks the meanradius of the meteoritic pre-solar nanodiamonds (∼ 1.4 nm). Thevertical dashed line marks the radius of the smallest diamond-type entity, the molecule adamantane, C10H16.
Fig. C.2:λ2Qabs/a for a-C(:H) particles withEg(bulk) = 0.1 eV(black lines) and of radii 0.33 nm (solid), 0.5 nm (dashed), 1nm(dotted) and 3 nm (dash-dotted). The data for neutral and cationPAHs, with the same number of C atoms (dark and light greysolid lines, respectively, Desert et al. 1990; Draine & Li 2001,2007; Compiegne et al. 2011) are shown for comparison. Thedashed, vertical, grey line shows the peak position of the UVbump and the solid, vertical, grey line shows the upper wave-length limit for the well-constrained a-C(:H) IR features.
24