the evolution of a developing country innovation system ... · the evolution of a developing...
TRANSCRIPT

The Evolution of a Developing Country Innovation System During
Economic Liberalization:The Case of India
Rishikesha T. KrishnanIndian Institute of Management Bangalore

The Questions• How has the innovation system evolved?• Has liberalization facilitated the transition
of technological capabilities into economic growth and competitiveness?
• Innovation system: More dynamic and strong or weak and dependent?
• Future challenges in strengthening the potential for innovation
• Can India become a knowledge society?
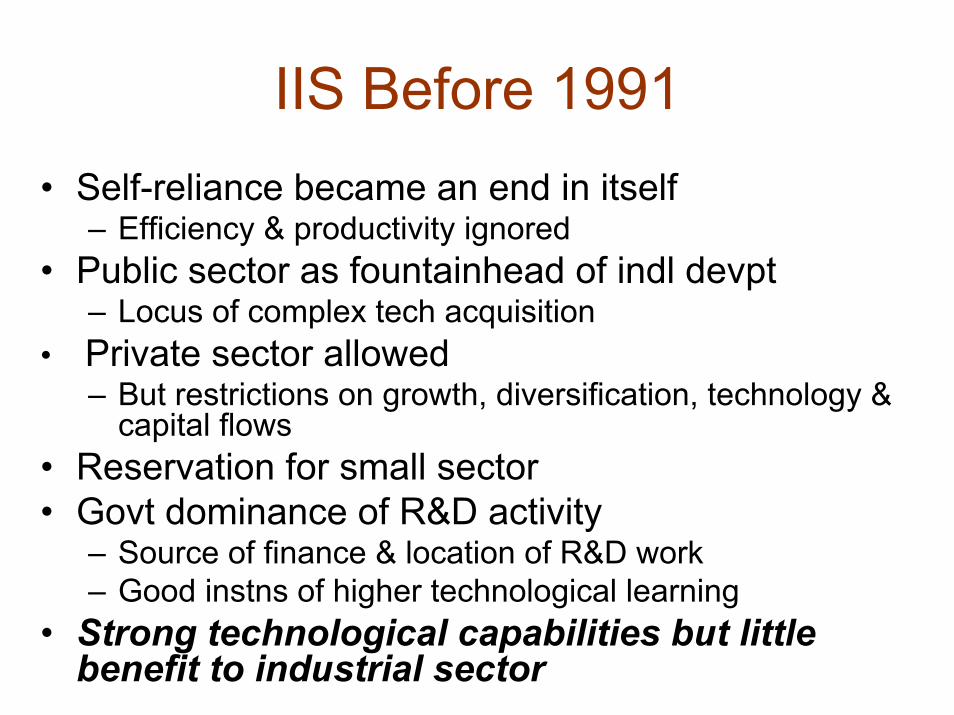
IIS Before 1991• Self-reliance became an end in itself
– Efficiency & productivity ignored• Public sector as fountainhead of indl devpt
– Locus of complex tech acquisition• Private sector allowed
– But restrictions on growth, diversification, technology & capital flows
• Reservation for small sector• Govt dominance of R&D activity
– Source of finance & location of R&D work– Good instns of higher technological learning
• Strong technological capabilities but little benefit to industrial sector

Economic Policy Reforms
• Response to crisis– But addressed some structural issues
• Deregulation of licensing, imports, exports, technology flows
• Specific desire to inject “the desired level of technological dynamism in Indian industry”
• Now “Second stage” reforms

IIS After 1991: Structure of the Indian Economy
4.35.67.3100100Total
-3.25.7-0.925.230.9Agri
6.03.311.621.825.4Industry
7.16.810.553.043.7Service
2002-032001-021995-962001-021990-91
Growth per annumShare in GDP (%)

Source: “Foreign Investment Approvals and Actuals: A Profile” Economic & Political Weekly, August 31, 2002, p. 3567.
2775.97Total
37.11029.28Services6.
3.493.57Consumer durables5.
10.1276.23Consumer Non-durables4.
1.849.93Intermediate Goods3.
9.0251.17Capital Goods2.
38.81075.76Basic Goods1.
Per centAmountRs. billion
Category of Industry
Table 1 Foreign Direct Investment in India Since Liberalization (Approvals) August 1991-March 2002.

IIS After 1991: Govt. Support for Tech Innovation
• Programmes to support industrial sector– Absorption of imported technology (PATSER)– Commercialization of indigenous technology (HGT)– Innovators → Technology-based entrepreneurs
(TePP)– New technology development (TDB, NMTLI)
• Tax benefits – Income tax, excise & customs duties
• National expenditure on R&D remains in range of 0.7-0.8% of GNP– But private sector contribution up from 13.8% to
21.6%– R&D intensity of Indian industry ~ 0.52% (1998-99)

Source: Research & Development Statistics 2000-01, Department of Science & Technology, Government of India, May 2002. (NR=not reported)
21.60.811998-9922.90.771997-9826.10.721996-9721.70.711995-9619.90.731994-9516.20.791993-94NR0.761992-93NR0.781991-9213.80.791990-91
% Share of private sector
industry in national R&D expenditure
National R&D
expenditure as % of GNP
Table 3 : Research & Development Expenditure in India

IIS After 1991: Strategies of Manufacturing Firms
Manufacturing Competitiveness• Several prominent companies improved
competitiveness• Tata Steel
– Future viability in doubt ca. 1991– By 2001, #1 in WSD survey– RM 4.81 T/T → 3.71 T/T– LP 79T/man-yr → 189 T/man-yr
• Reliance, Sundaram Clayton

IIS After 1991: Strategies of Manufacturing Firms
Product Development & Innovation• Automobile, 2-wheeler, pharma sectors• Production, investment & innovation
capabilities– Tata Motors Indica– TVS Motor Victor– Dr. Reddy’s Labs: 3 molecules licensed, 19
US patents granted

IIS After 1991: Strategies of Manufacturing Firms
Heterogeneity of Performance• TFP in both organized & unorganized sectors
declined in the first half of ’90s• MGI study shows that Indian labour productivity
in modern sectors is 15% of best• Level of 43% attainable through better work
practices, organizational changes• China, Malaysia, Thailand preferred as
manufacturing locations• Innovation concentrated in certain sectors• Family-owned businesses reluctant to invest in
technology, but may now have no option

IIS After 1991: Research Labs & Higher Education• Changes in labs governance structure &
incentives• CSIR
– 38 intl patents (1998-99)– External cash flows Rs. 2.04 billion– 18% from private industry– 7.3% from foreign sources– National Chemical Lab as trendsetter
• Sponsored research, consultancy ↑ at top engg schools

Source: Dean (R&D), Indian Institute of Technology Kanpur3.6 7625.6 1091993-19945.2 10046.3 721994-1995
16.7 10154.0 651995-19969.0 7461.5 941996-19979.1 71139.4 821997-1998
14.4 10782.9 831998-199927.7 11669.1 611999-200022.4 130161.7 992000-2001
3771.8 153176.7 592001-20021857.4 136302.5 1152002-2003
GrantedFiledRevenueRs. Million
NoRevenue Rs. Million
No
PatentsConsultancy Projects
Sponsored Projects
Year
Table 4: Revenue from Consultancy and Sponsored Research Projects at IIT Kanpur

IIS After 1991: The Services Sector: Software
Evolution of the Software Industry• More than 2% of GDP, 15% of exports• Exports up from Rs. 1.35 billion in 1990-91 to
Rs. 360 billion ($7.68 billion) in 2001-02• Employment > 500,000• Export of manpower → “offshore” devpt• Buoyed by global demand and trend towards
outsourcing of non-core activities• Cost arbitrage + organizational capabilities• Government support but not policy driven

IIS After 1991: The Services Sector: Software
Software Industry & the Innovation System• Early staff from research labs, public sector• People from education system, in-house training• Indirect positive benefits to wider innovation
system: – “Made in India” as +ve label: enabled growth of ITES
industry, R&D services– Global capital, acctg stds, governance, stock plans– Model for entrepreneurship– “Can do” feeling– Spurred growth of education sector
• Limited links with manufacturing sector

IIS After 1991: The Services Sector: Software
Role of MNCs• 27% of software exports from India• Helped build Indian brand (TI, HP)• Pioneered offshore model• Lead in quality movement (Motorola)• Exposure to advanced technologies, managerial
practices• Pushed up salaries• May have reduced brain drain but contributed to
decline in doctoral enrolments• Little significant interaction with local firms (e.g.
no joint development of products)

IIS After 1991: The Services Sector: Software
Innovation & Learning• Generally, low R&D spend (Infy 0.38%)• Every project a learning experience?• Quick at adopting new technologies and
diffusing them in organization• Some domain competence built• Quality management (CMM level 5)• “Process orientation” – conflict with
innovation?

IIS After 1991: The Services Sector: Software
The Future of the Software Industry• Limited success in ascending value curve into
consulting, product development• Absence of challenging customers in India,
limited domain expertise, easy revenues from services, brand image & reputation
• “Lock-in” to low-end work?• Capabilities transfer to other emerging service
industries

IIS After 1991: Other Dimensions
• Engg Education: Quantity w/o quality– 1990 339 instns 87,000 places– 2002 1208 instns 360,000 places– All 171 new instns surveyed deficient!
• Entrepreneurship– Higher status, at least in new economy
• Geographical Clustering– “Balanced devpt” → Urban concentration
• Labour Movement– Loss of bargaining power

IIS After 1991: Summing Up
• Liberalization opportunity for orgns to build on capabilities, find markets that value their outputs– Capabilities enhanced in select sectors– Demand growth, regulation, competition & role models
drivers of innovation– Increased focus on quality– More companies ↑ on the competitiveness continuum
• Services sector successful in leveraging resource base to exploit market opportunity– But difficult to break out of low value-addition
• Lack of synergies between manufacturing & services

Future of the IIS:Challenges Ahead
• Sustain growth in employment-intensive service businesses
• Maintain competitiveness through constant upgradation of capabilities
• Recover competitiveness in important traditional sectors
• Enter & succeed in select high technology industries

Future of the IIS:Key Issues
• Resource allocation– Choice of areas, magnitude of investment
• Improving the quality of education– Attractiveness of academic careers
• Flexibility in orgnl structures, processes– CDOT experience, learn from Chinese
• Promoting technological entrepreneurship– Networked entrepreneurs, Taiwan model
• Shaping societal values, attitudes– How to inculcate some key values that are absent

Implications for Other Countries & NIS Research
• Software industry experience: Develop generic infrastructure, wait for next wave?
• Importance of innovations in business models, orgnl design, functional strategies: need for more emphasis on “other”capabilities?
• NIS research more internally focused: how to link to markets?

Thank you