the innovation paradox -...
TRANSCRIPT

The Innovation Paradox
Developing-Country Capabilities and theUnrealized Promise of Technological Catch-Up
Xavier CireraWilliam F. Maloney
World Bank
Tokyo, March 2018
The Productivity Project: www.worldbank.org/productivity

The World Bank Productivity Project
• Productivity Growth and Innovation are critical• To raising growth and closing the gap between rich and poor countries• Raising wages, reducing inequality, increase inclusion and achieving the SDGs• To ensuring countries benefit from new waves of technologies.
• WBPP 4 volumes (so far) deal with distinct aspects.
Vol. 1: The Innovation ParadoxVol. 2: Pursuing Productivity: 2nd Generation Analysis and Policy (Fall 2018)Vol. 3: Agricultural Productivity for Poverty Alleviation (Spring 2019)Vol. 4: Space Shaping Productivity Policies (Fall 2019)
The Paradox: • Schumpeter: the adoption of existing technologies accelerates growth,
dwarfs impact of development aid…
• …yet most developing countries firms fail to reap these benefits and don’t seriously innovate and …
• ..most governments fail to develop innovation policies that effectively facilitate this process of technological catch up.
• Why and what can we do about it?
This report:
• Brings new sources of data and analysis and validates Schumpeter
• Describes and explores the roots of the Innovation Paradox• Implications for NIS and measurement
• Highlights the key role of firm capabilities
• Introduces the Innovation Policy Dilemma and offers guidance on dealing with it.

5
PART I: The Paradox
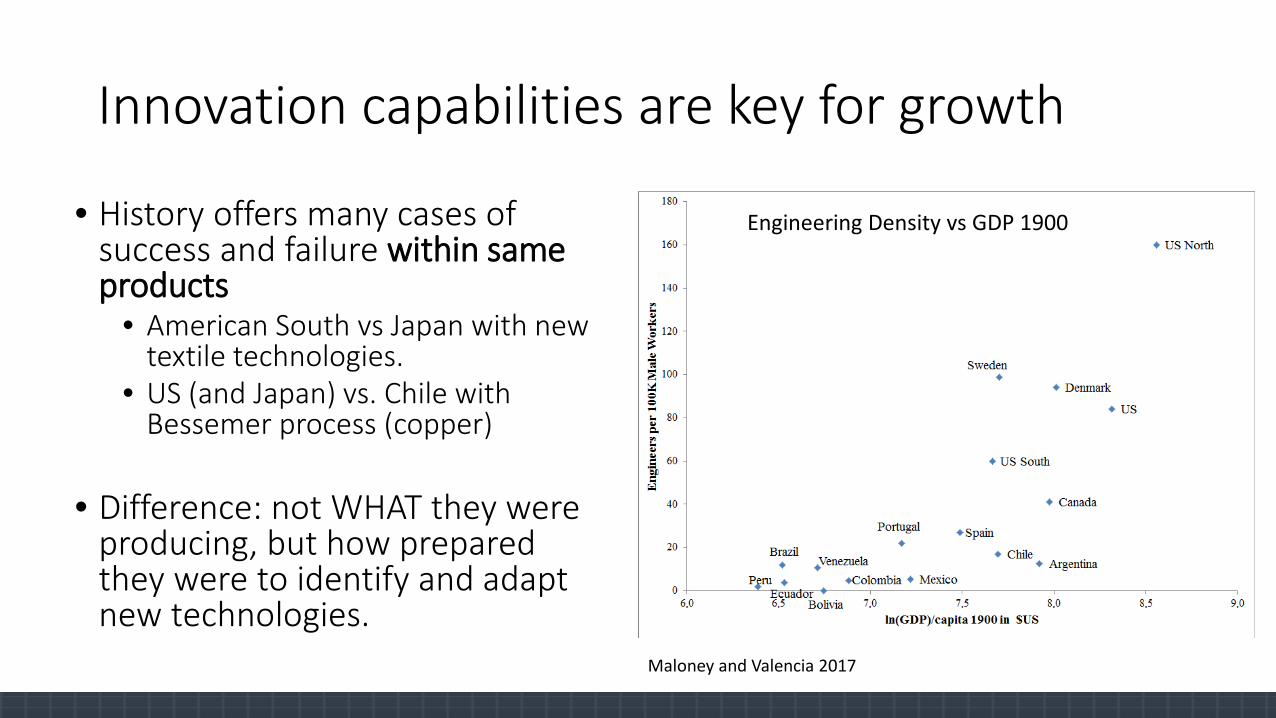
Innovation capabilities are key for growth
• History offers many cases of success and failure within same products
• American South vs Japan with new textile technologies.
• US (and Japan) vs. Chile with Bessemer process (copper)
• Difference: not WHAT they were producing, but how prepared they were to identify and adapt new technologies.
Engineering Density vs GDP 1900
Maloney and Valencia (2017)Maloney and Valencia 2017
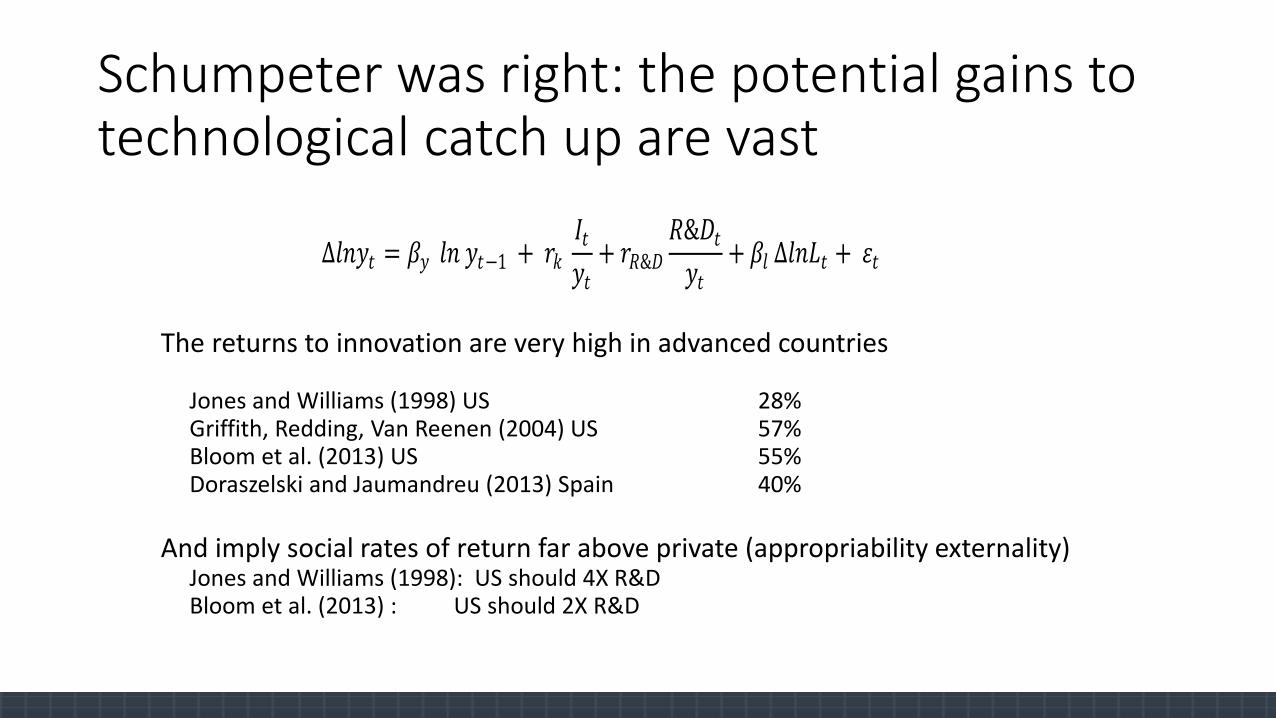
Schumpeter was right: the potential gains to technological catch up are vast
The returns to innovation are very high in advanced countries
Jones and Williams (1998) US 28%Griffith, Redding, Van Reenen (2004) US 57%Bloom et al. (2013) US 55%Doraszelski and Jaumandreu (2013) Spain 40%
And imply social rates of return far above private (appropriability externality)Jones and Williams (1998): US should 4X R&DBloom et al. (2013) : US should 2X R&D
∆𝑙𝑙𝑙𝑙𝑦𝑦𝑡𝑡 = 𝛽𝛽𝑦𝑦 𝑙𝑙𝑙𝑙 𝑦𝑦𝑡𝑡−1 + 𝑟𝑟𝑘𝑘 𝐼𝐼𝑡𝑡𝑦𝑦𝑡𝑡
+ 𝑟𝑟𝑅𝑅&𝐷𝐷𝑅𝑅&𝐷𝐷𝑡𝑡𝑦𝑦𝑡𝑡
+ 𝛽𝛽𝑙𝑙 ∆𝑙𝑙𝑙𝑙𝐿𝐿𝑡𝑡 + 𝜀𝜀𝑡𝑡
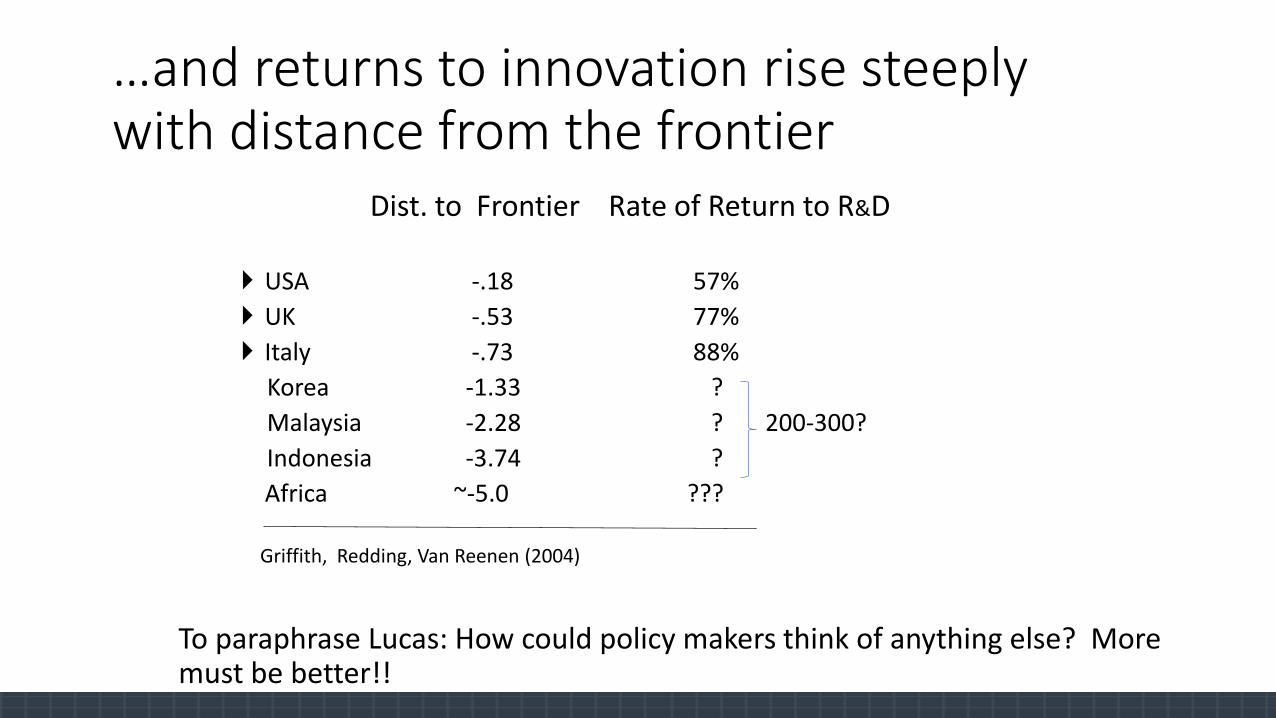
…and returns to innovation rise steeply with distance from the frontier
Dist. to Frontier Rate of Return to R&D
USA -.18 57% UK -.53 77% Italy -.73 88%
Korea -1.33 ?Malaysia -2.28 ? 200-300?Indonesia -3.74 ?Africa ~-5.0 ???
Griffith, Redding, Van Reenen (2004)
To paraphrase Lucas: How could policy makers think of anything else? More must be better!!
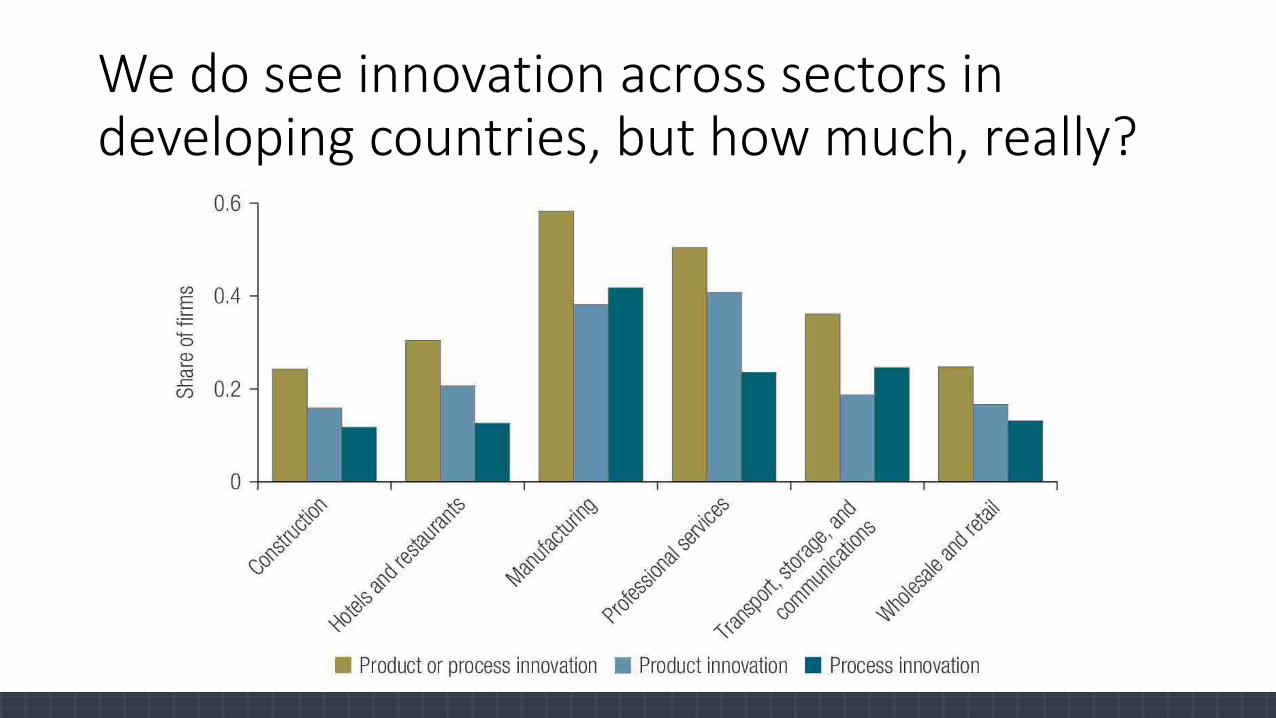
We do see innovation across sectors in developing countries, but how much, really?
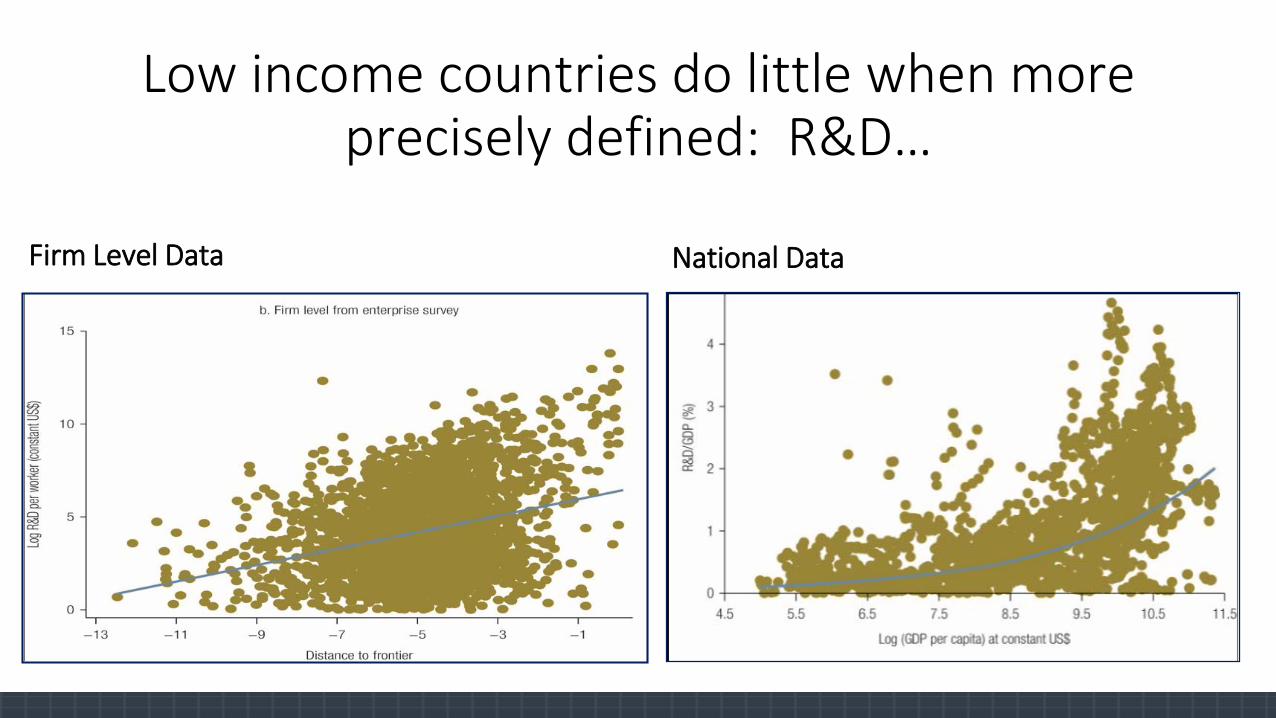
Low income countries do little when more precisely defined: R&D…
Firm Level Data National Data
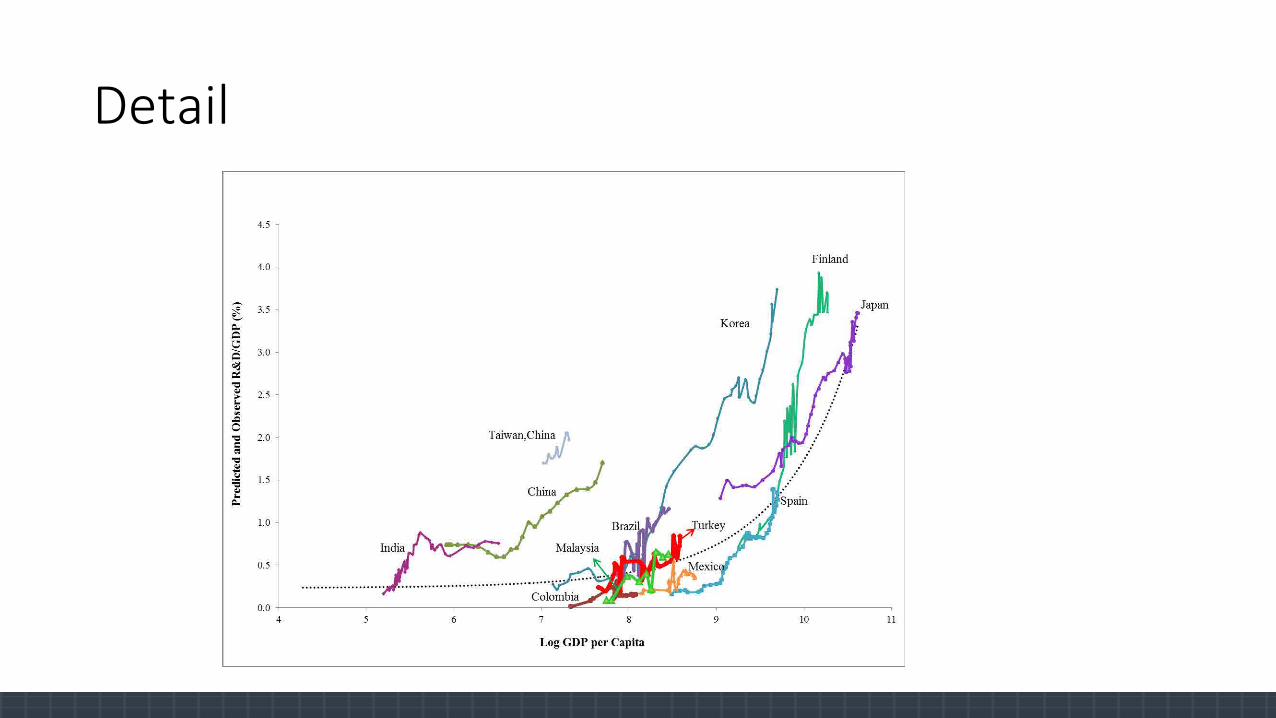
Detail
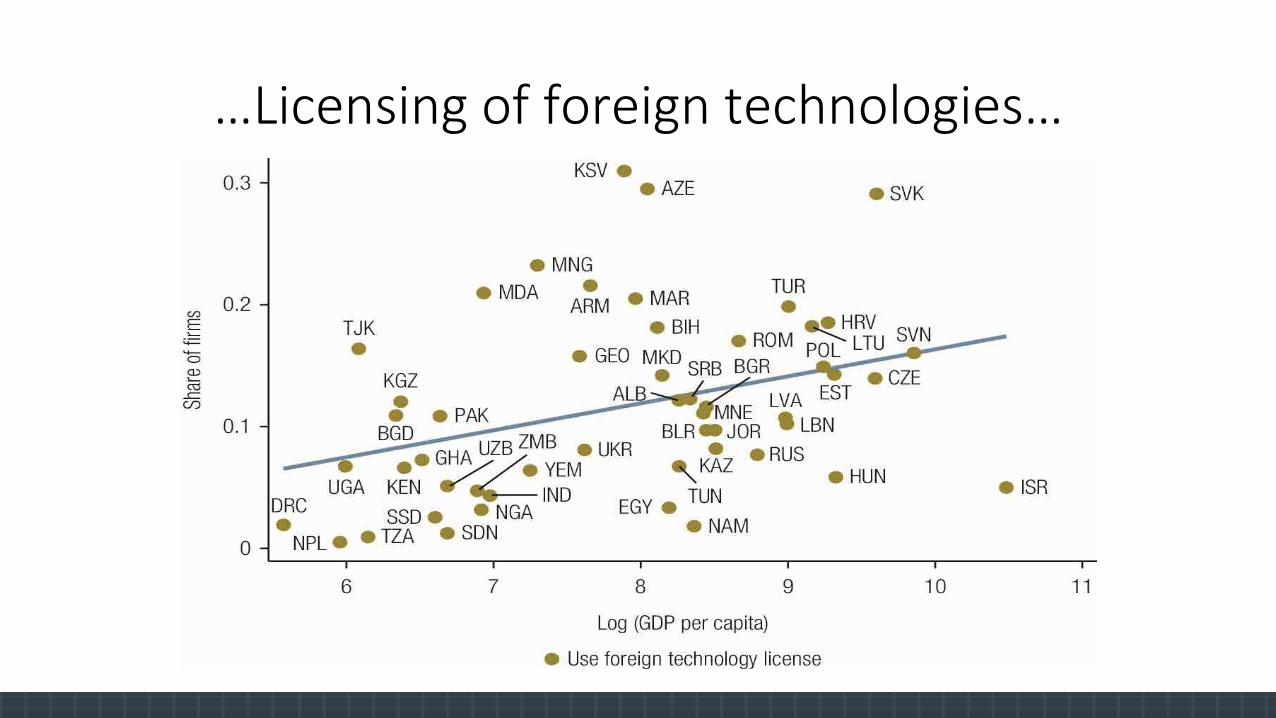
…Licensing of foreign technologies…
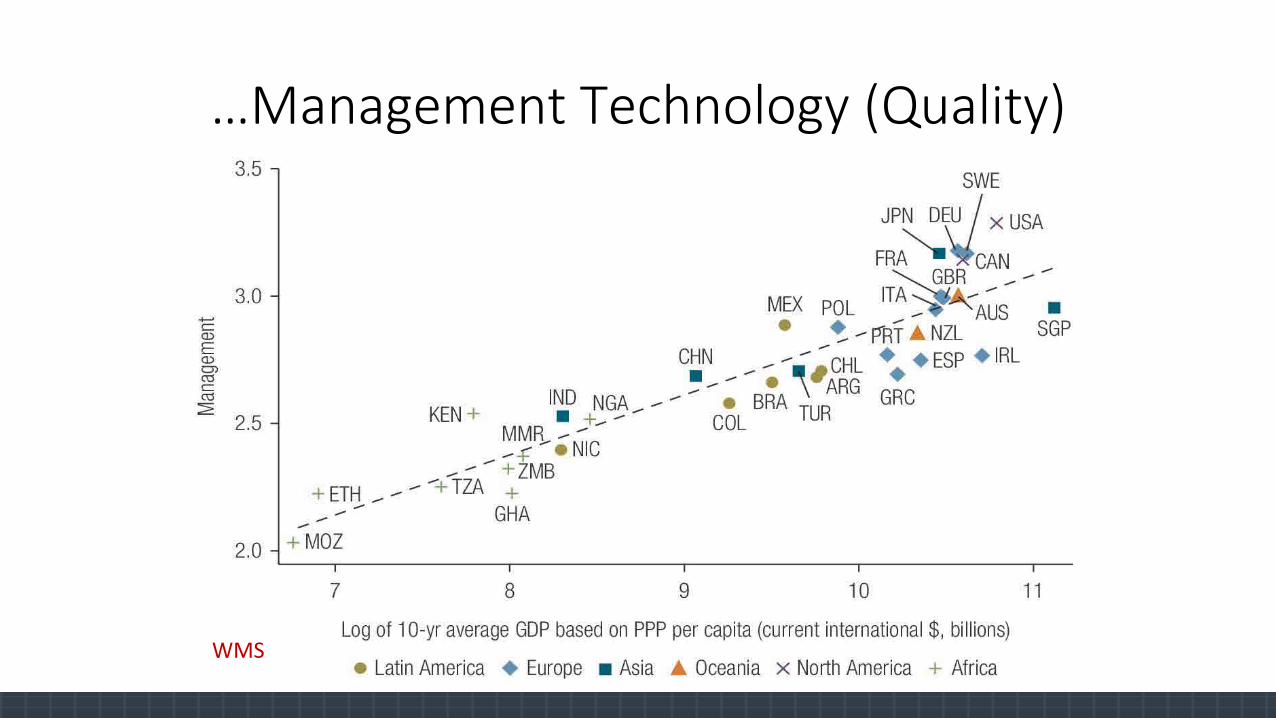
…Management Technology (Quality)
WMS

Why don’t firms and governments invest more in innovation?
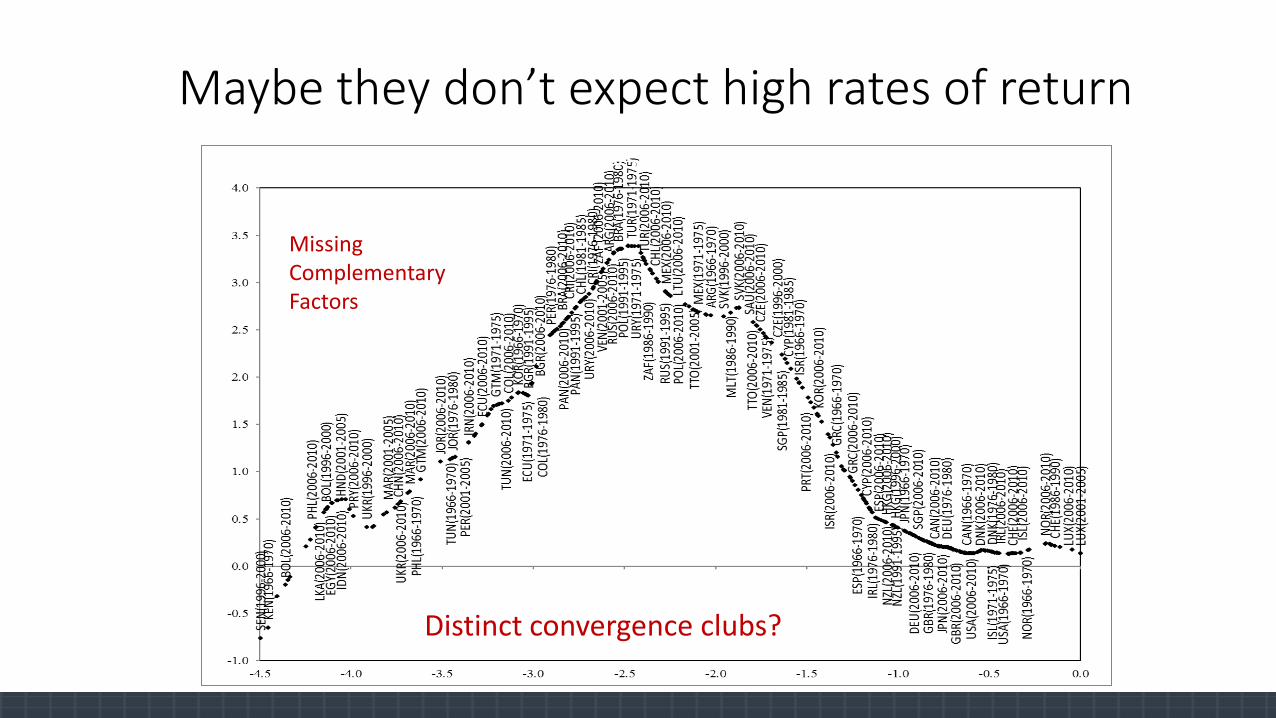
Maybe they don’t expect high rates of return
Missing Complementary Factors
Returns to R&D vs. Distance to Frontier
Distinct convergence clubs?
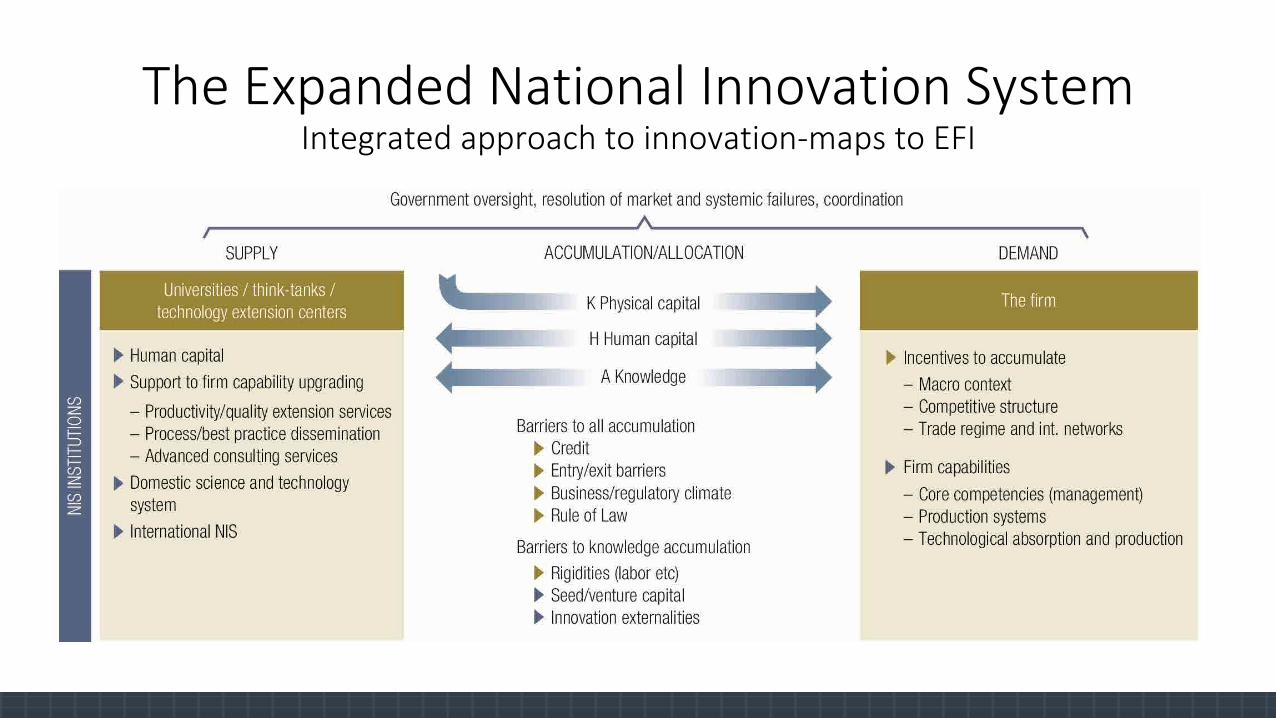
The Expanded National Innovation SystemIntegrated approach to innovation-maps to EFI
Implications
• Concept of NIS must be expanded: The range of missing complements and failed markets is much larger in developing countries
• Need to reconsider how we benchmark innovation• R&D/GDP should be relative to other complementary factors• More is not better
• Firm capabilities are critical complementary factors and we focus on them
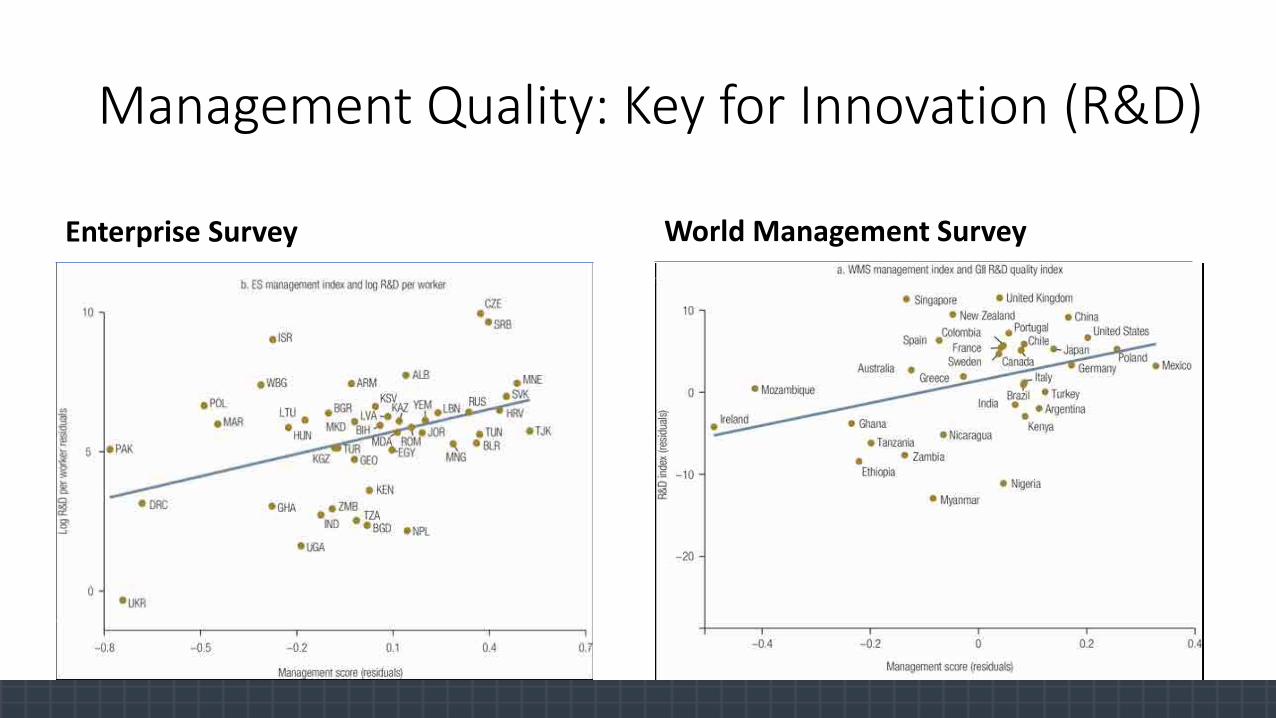
Management Quality: Key for Innovation (R&D)
Enterprise Survey World Management Survey
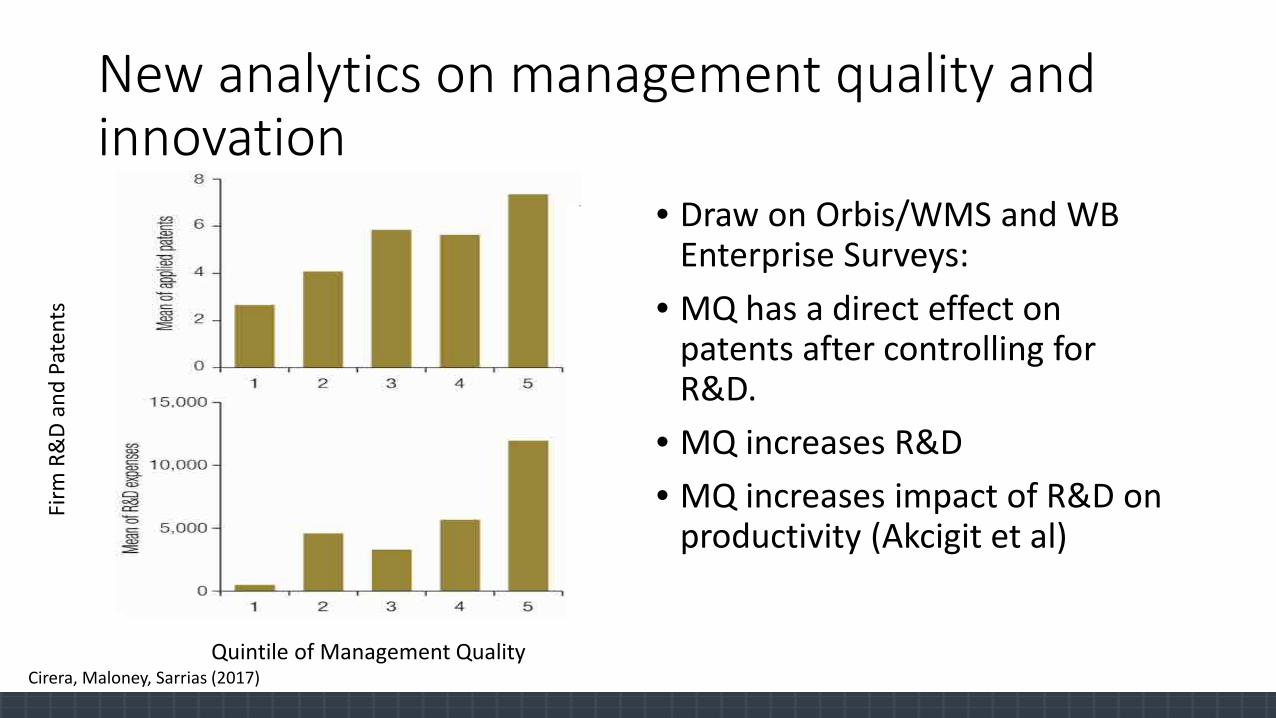
New analytics on management quality and innovation
• Draw on Orbis/WMS and WB Enterprise Surveys:
• MQ has a direct effect on patents after controlling for R&D.
• MQ increases R&D• MQ increases impact of R&D on
productivity (Akcigit et al)
Quintile of Management Quality
Firm
R&
D an
d Pa
tent
s
Cirera, Maloney, Sarrias (2017)
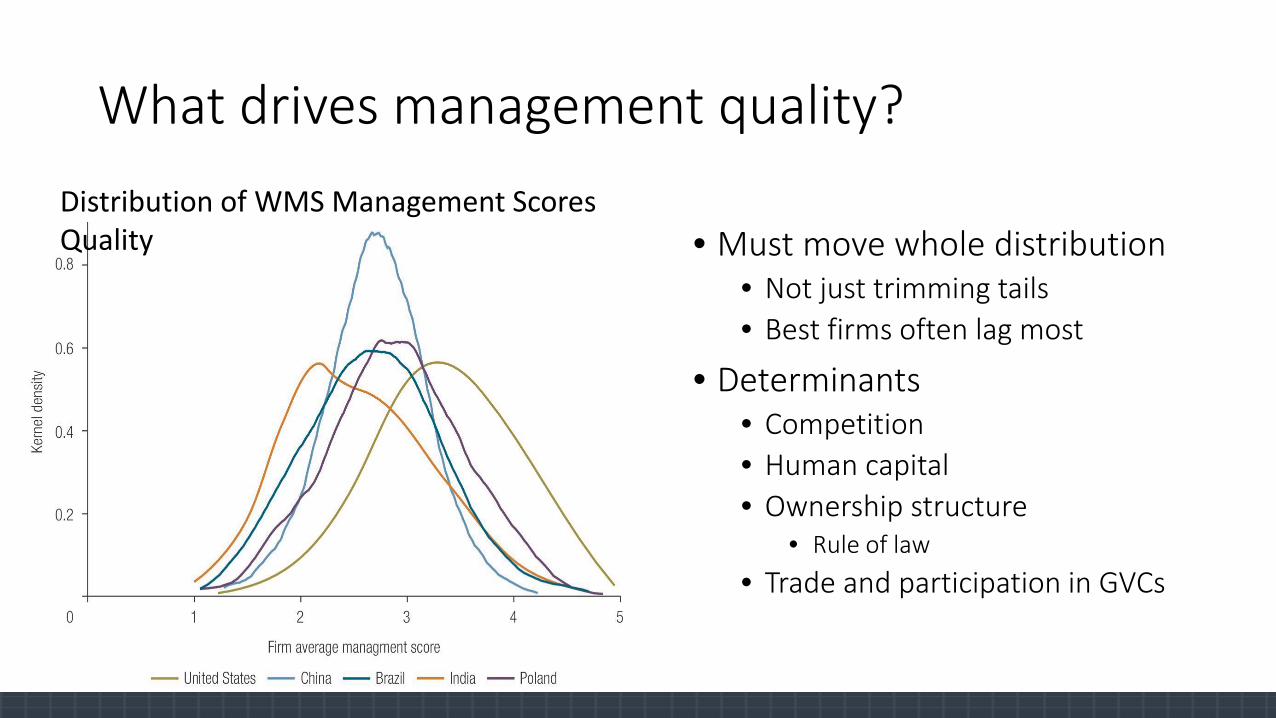
What drives management quality?
• Must move whole distribution• Not just trimming tails• Best firms often lag most
• Determinants• Competition• Human capital• Ownership structure
• Rule of law• Trade and participation in GVCs
Distribution of WMS Management Scores Quality

21
PART II GovernmentCapabilities and Policy
The innovation policy dilemma
22
For developing countries: • Multiplicity of market failures, missing complementary factors and institutions
increase policy complexity…. • ….However government capabilities to design, implement, and coordinate an
effective policy mix to manage these failures and gaps are weaker.
Approaching this dilemma:• Good practices and principles in design and implementation • The capabilities escalator - selecting of an appropriate mix of instruments for
stage of technological development

Satsuma/Chōshū Students: Rapid Capability Building in Education, Governance..
• Founder of Imperial Engineering School
• First Minister of Education• First Prime Minister (and later)• Minister of Foreign affairs• First Director of Railways• First Minster of Industry

…and Industry
• Godai Tomoatsu:• Father of Japanese industry-
Textiles• Founder of Osaka Chamber of
Commerce and Securities Exchange
• Murahashi Hisanari- Founder of Sapporo Brewery

Core Practices and Principles of Good Innovation Policy Making
25
1. Rationale and design of policy2. Efficacy of implementation3. Coherence of policies across the NIS4. Policy consistency and predictability over time
Governments require capabilities for policy making across 4 key dimensions:
1. Rationale and Design of Policy: Design Principles
• Discipline Policy by identifying likely market failure• and ensure it is the true market failure-absent complementary markets
• Avoid uncritical adoption of foreign NIS organogram
• Engage in an iterative process of consultation, experimentation and evaluation.
2. Efficacy of implementation
27
• Learning and adaptation – Need an appropriate learning system to verify efficacy of implementation and ensure policy learning.
• Implementation Tools – good targeting of beneficiaries and definition of goals, agile application processes, qualified external evaluations
• Quality of gov’t managerial practices – organizational practices, incentives, training
3. Coherence of policies across the NIS
28
• Policy solutions match the diagnosis of the problem
• Target populations and beneficiaries are clearly connected to the benefits that the policy is to address
• The focus and resources pertaining to the instruments match policy objectives – coherence in allocating funds to objectives
• The elements of the policy mix reinforce rather than duplicate or offset each other
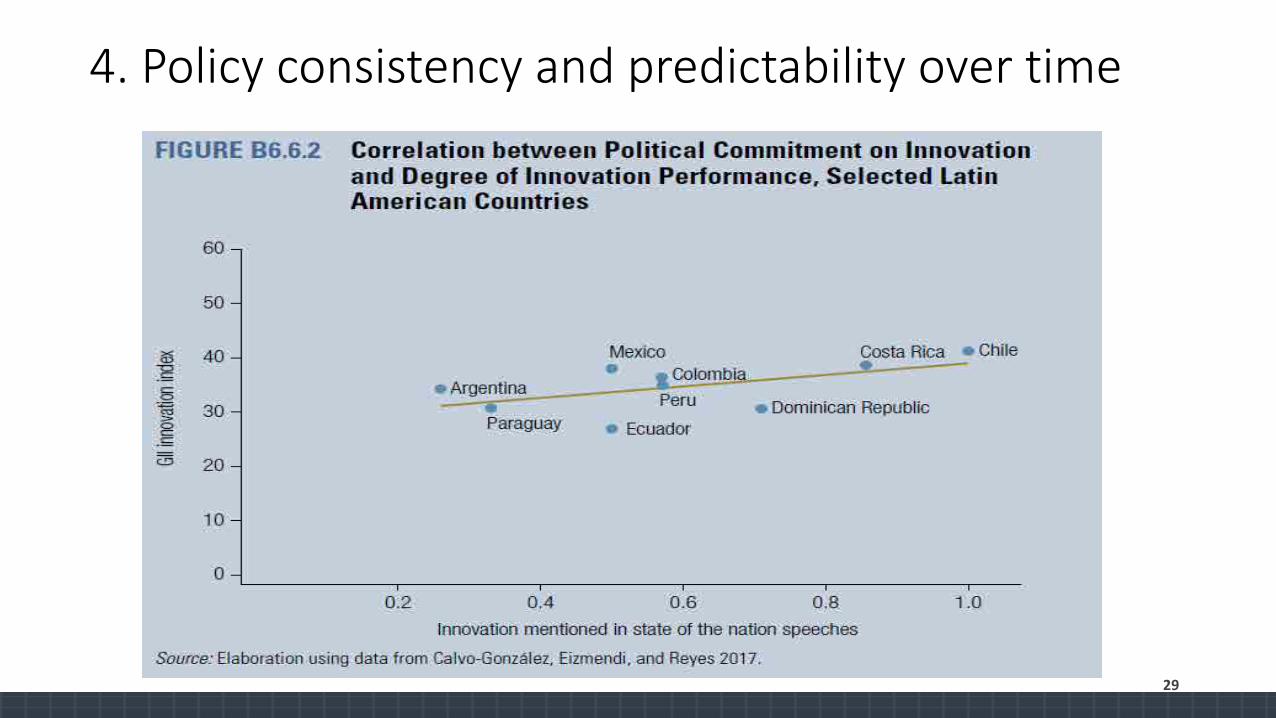
4. Policy consistency and predictability over time
29

Supporting Capabilities Accumulation
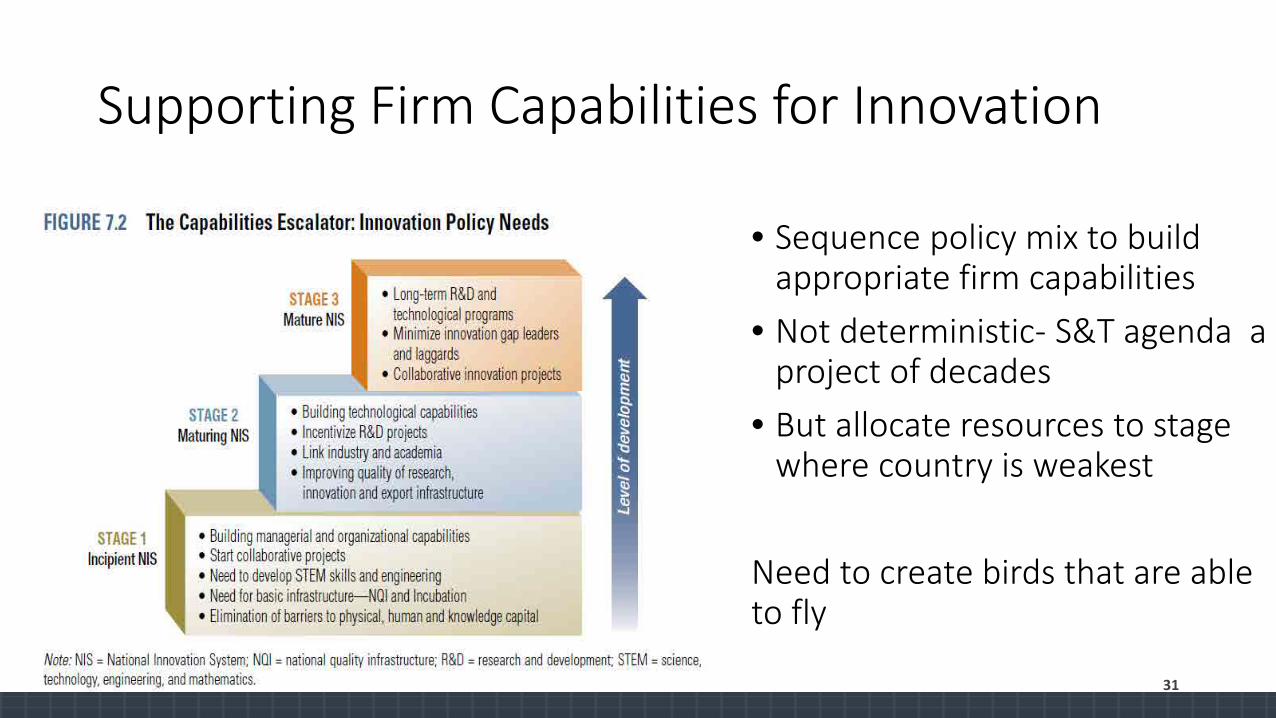
Supporting Firm Capabilities for Innovation
• Sequence policy mix to build appropriate firm capabilities
• Not deterministic- S&T agenda a project of decades
• But allocate resources to stage where country is weakest
Need to create birds that are able to fly
31
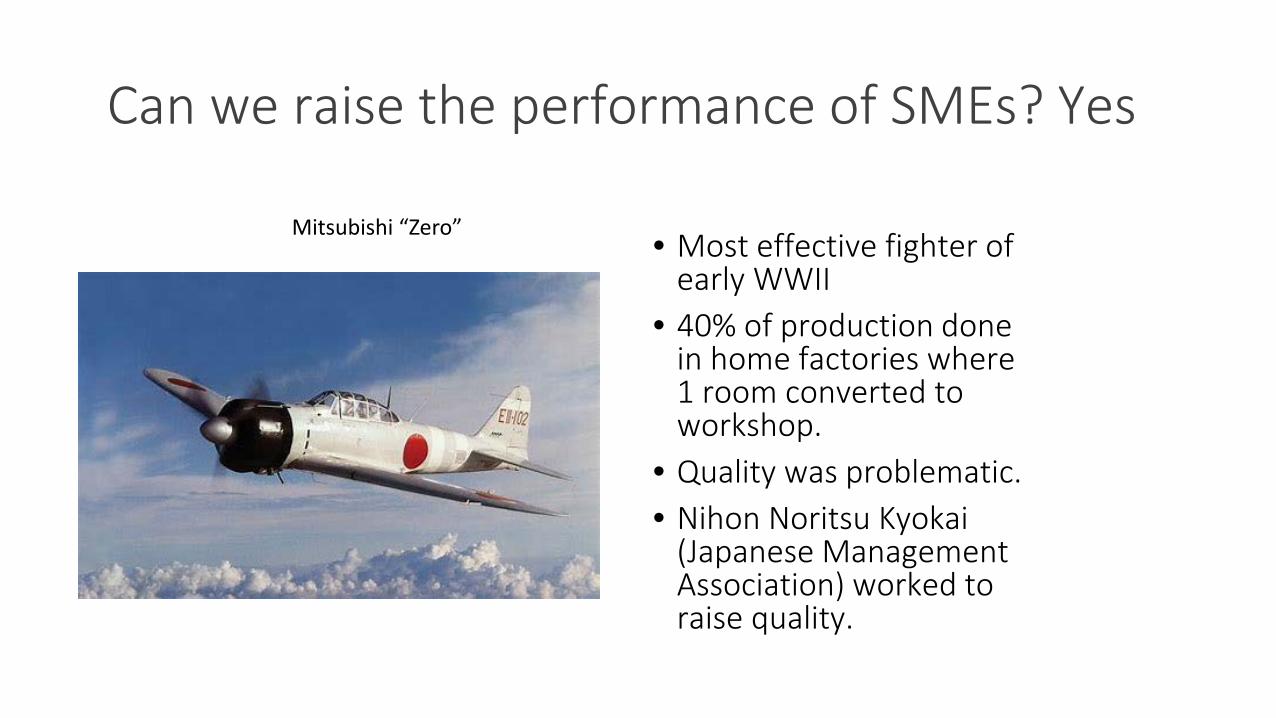
Can we raise the performance of SMEs? Yes
• Most effective fighter of early WWII
• 40% of production done in home factories where 1 room converted to workshop.
• Quality was problematic.• Nihon Noritsu Kyokai
(Japanese Management Association) worked to raise quality.
Mitsubishi “Zero”
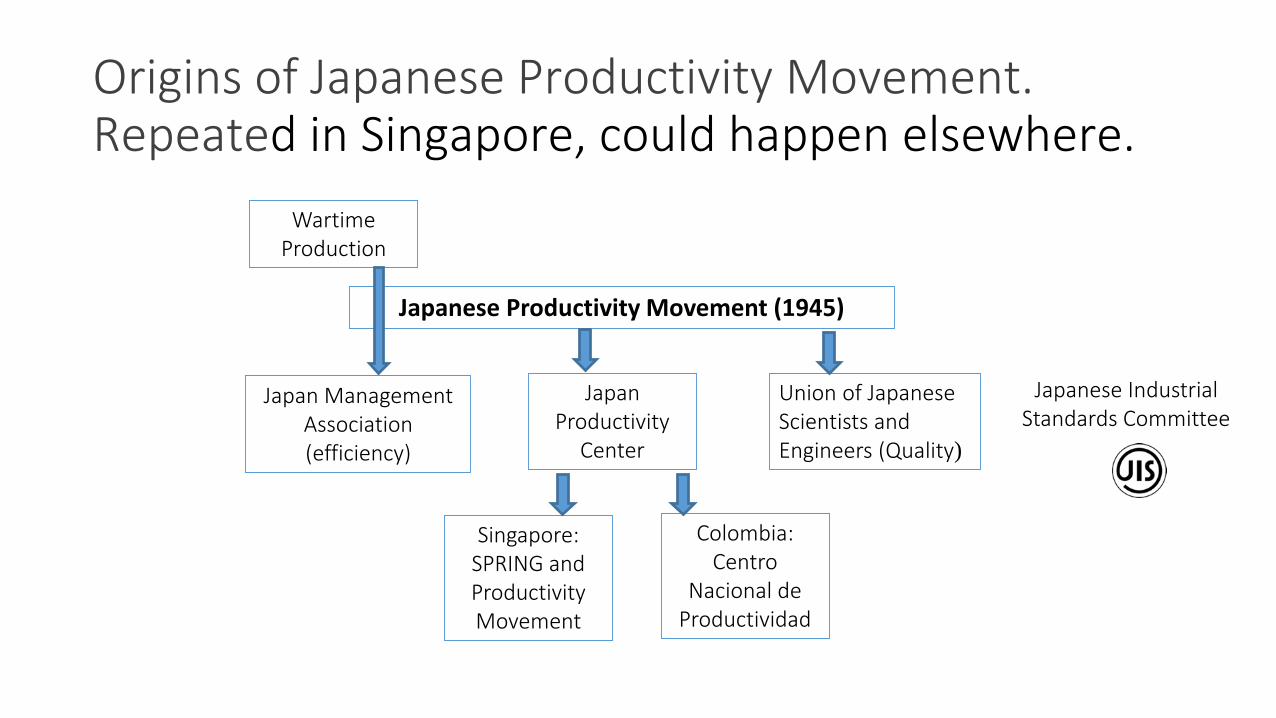
Origins of Japanese Productivity Movement. Repeated in Singapore, could happen elsewhere.
Japan Management Association (efficiency)
Japan Productivity
Center
Union of Japanese Scientists and Engineers (Quality)
Wartime Production
Singapore: SPRING and Productivity Movement
Colombia: Centro
Nacional de Productividad
Japanese Productivity Movement (1945)
Japanese Industrial Standards Committee
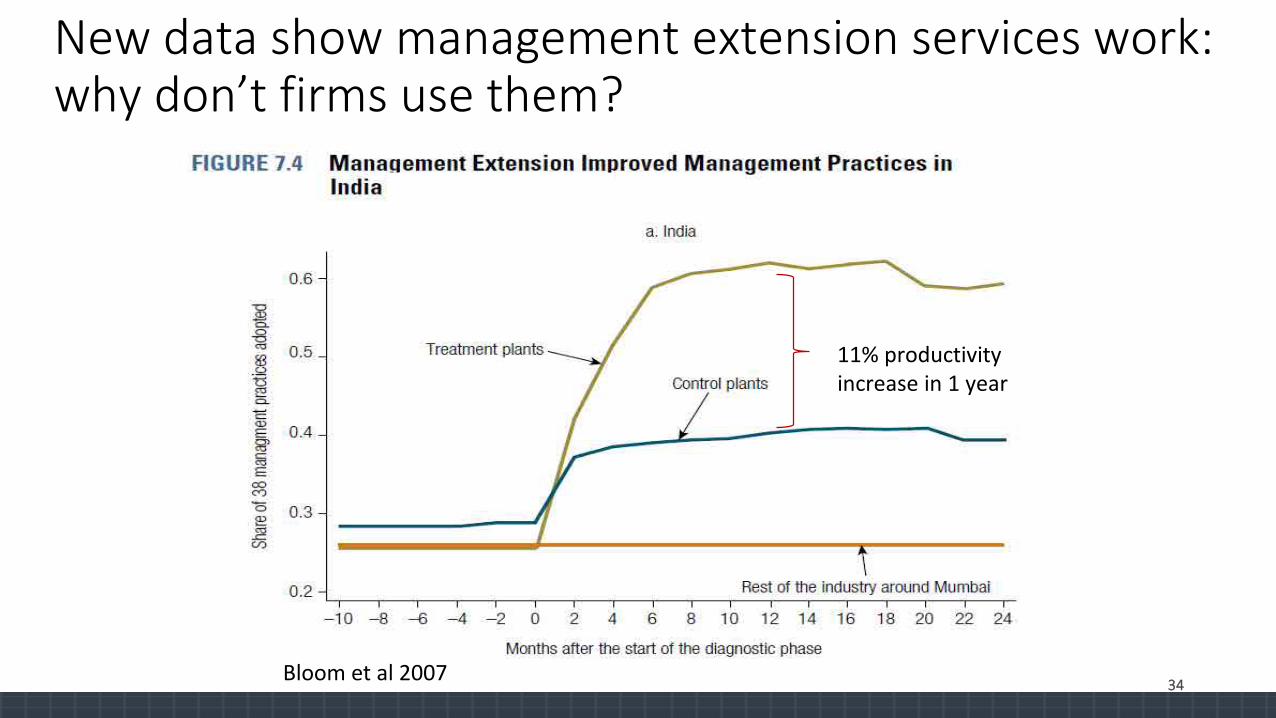
New data show management extension services work: why don’t firms use them?
34
11% productivity increase in 1 year
Bloom et al 2007
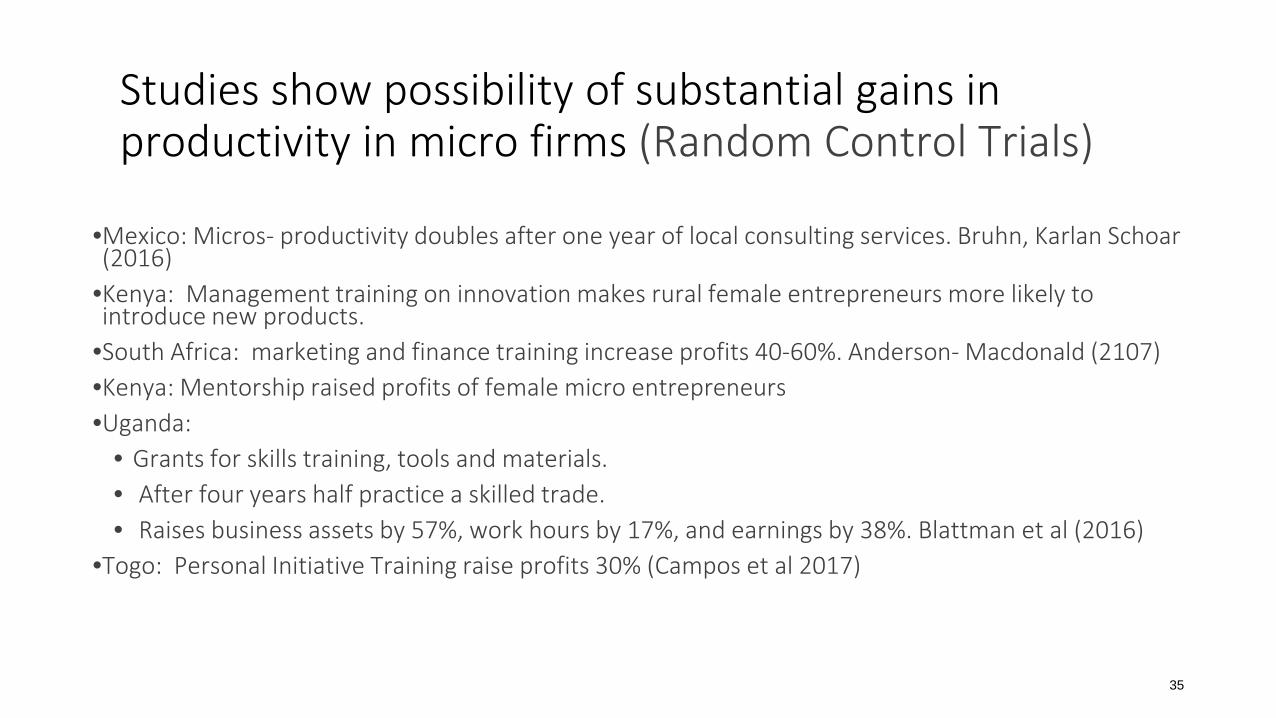
Studies show possibility of substantial gains in productivity in micro firms (Random Control Trials)
•Mexico: Micros- productivity doubles after one year of local consulting services. Bruhn, Karlan Schoar(2016)
•Kenya: Management training on innovation makes rural female entrepreneurs more likely to introduce new products.
•South Africa: marketing and finance training increase profits 40-60%. Anderson- Macdonald (2107)•Kenya: Mentorship raised profits of female micro entrepreneurs•Uganda:
• Grants for skills training, tools and materials.• After four years half practice a skilled trade. • Raises business assets by 57%, work hours by 17%, and earnings by 38%. Blattman et al (2016)
•Togo: Personal Initiative Training raise profits 30% (Campos et al 2017)
35
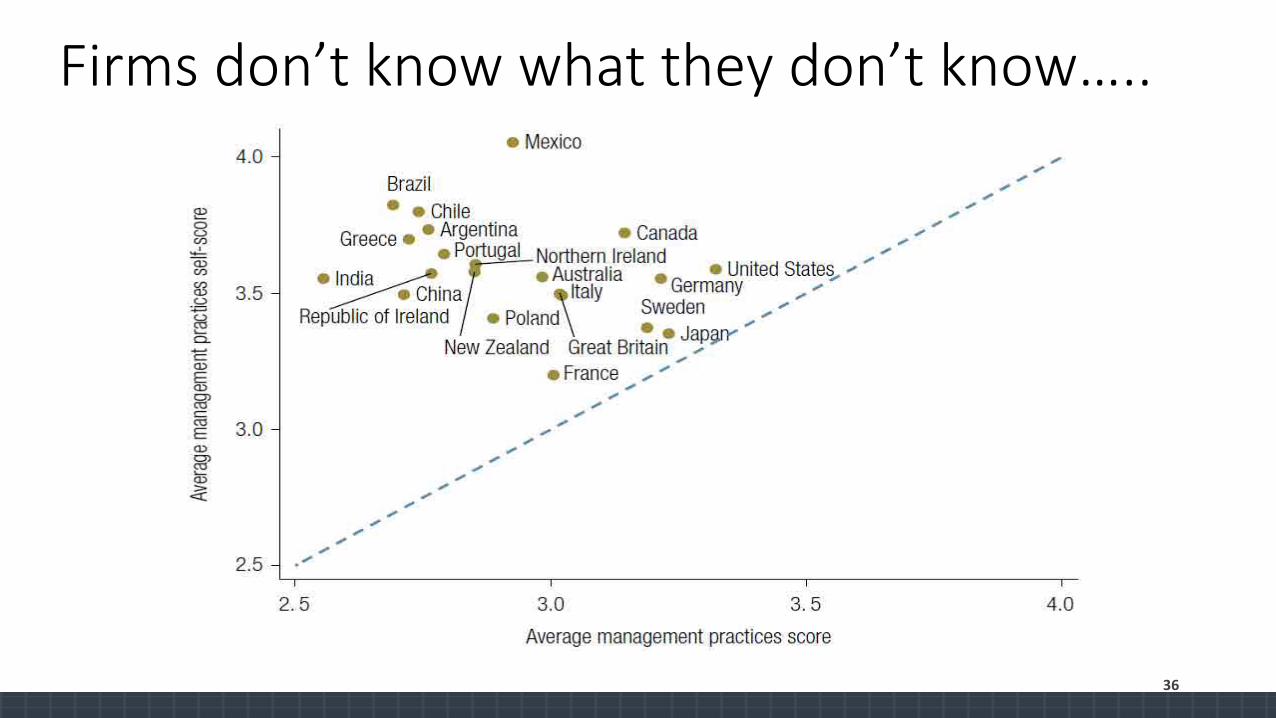
Firms don’t know what they don’t know…..
36

Pasteur: “Fortune favors the prepared mind” (and prepared countries))
The Productivity Project: www.worldbank.org/productivity