the european kitchen market channels and competition · the european kitchen market channels and...
TRANSCRIPT
1
The European kitchen marketChannels and competitionPresentation by Lennart Rappe, CFO18 September 2003

2
Contents
• The European kitchen market
• The UK market
• The Nordic market
• The German and Dutch markets
3
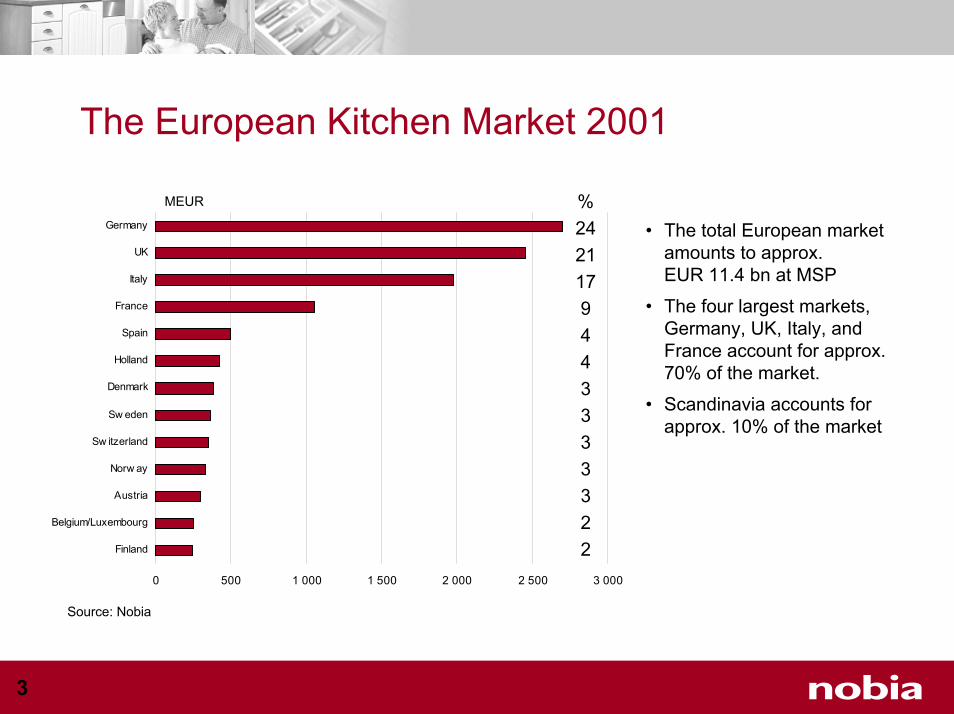
The European Kitchen Market 2001
MEUR
Source: Nobia
0 500 1 000 1 500 2 000 2 500 3 000
Finland
Belgium/Luxembourg
Austria
Norw ay
Sw itzerland
Sw eden
Denmark
Holland
Spain
France
Italy
UK
Germany • The total European market amounts to approx. EUR 11.4 bn at MSP
• The four largest markets, Germany, UK, Italy, and France account for approx. 70% of the market.
• Scandinavia accounts for approx. 10% of the market
%2421179443333322

4
Market shares 2001
Source: CSIL, Prognoscentret, and Nobia
%
0 1 2 3 4 5 6 7
Miele (D)
Bernstein Group (UK)
Veneta Cucine (I)
Schüller (D)
Bulthaup (D)
Leicht (D)
Bauformat+Bürger (D)
Siematic (D)
Scavolini (I)
Gow er (UK)
Groupe Fournier Frères + SSM (F)
Hacker Küchen (D)
SALM (F)
Kruse & Meinert (D)
Nolte Küchen (D)
MFI (UK)
Snaidero (I)
Nobilia (D)
Alno + Wellman (D)
Nobia (S)• The five largest
companies account for approx. 22% of the market
• No. 6-20 in size account for approx. 19% of the market

5
Kitchen Furniture Export and Import in Europe
Import/ConsumptionExport/Production
1,1
2,4
3,0
5,9
6,6
6,9
7,6
10,3
11,6
15,6
24,2
32,2
32,9
38,4
41,4
43,9
67,4
0 20 40 60 80
I
FIN
D
DK
E
S
UK
EUR
IRL
F
A
GR
NL
N
B
CH
P
%%
1,2
1,3
1,7
2,0
2,2
4,2
6,1
10,9
11,2
14,3
16,0
17,8
20,2
21,1
22,5
28,2
33,7
0 10 20 30 40
N
IRL
GR
FIN
CH
NL
UK
E
F
S
EUR
I
B
A
D
P
DK
Germany and Italy are the largest export countries.Together they account for approx. 70 % of the European Export trade.
France, Switzerland and the Netherlands are thelargest import countries. Together the account forapprox. 45% of the European import trade.
Source: CSIL
6
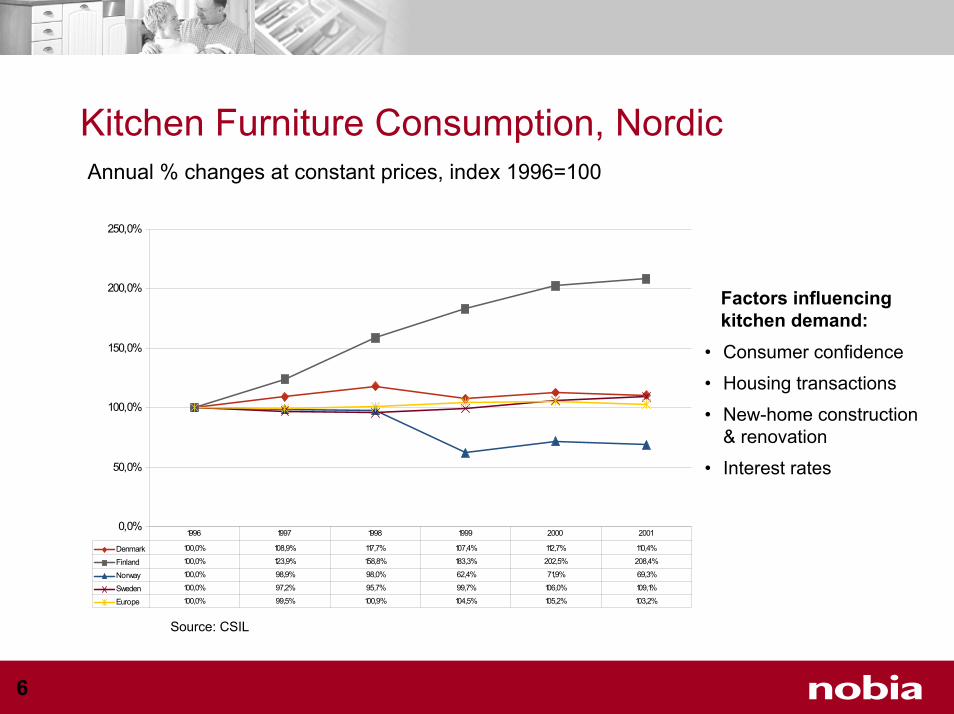
Kitchen Furniture Consumption, NordicAnnual % changes at constant prices, index 1996=100
Source: CSIL
0,0%
50,0%
100,0%
150,0%
200,0%
250,0%
Denmark 100,0% 108,9% 117,7% 107,4% 112,7% 110,4%
Finland 100,0% 123,9% 158,8% 183,3% 202,5% 208,4%
Norway 100,0% 98,9% 98,0% 62,4% 71,9% 69,3%
Sweden 100,0% 97,2% 95,7% 99,7% 106,0% 109,1%
Europe 100,0% 99,5% 100,9% 104,5% 105,2% 103,2%
1996 1997 1998 1999 2000 2001
• Consumer confidence
• Housing transactions
• New-home construction & renovation
• Interest rates
Factors influencing kitchen demand:

7
Kitchen Furniture Consumption, EuropeAnnual % changes at constant prices, index 1996=100
Source: CSIL
0,0%
50,0%
100,0%
150,0%
200,0%
France 100,0% 100,4% 105,9% 121,7% 123,5% 128,2%
Germany 100,0% 93,5% 92,1% 90,9% 83,9% 75,3%
Italy 100,0% 98,0% 102,2% 105,8% 108,4% 106,2%
Netherlands 100,0% 98,6% 100,3% 111,9% 111,1% 104,8%
UK 100,0% 121,6% 120,1% 141,3% 156,1% 164,2%
Europe 100,0% 99,5% 100,9% 104,5% 105,2% 103,2%
1996 1997 1998 1999 2000 2001
• Consumer confidence
• Housing transactions
• New-home construction & renovation
• Interest rates
Factors influencing kitchen demand

8
The UK Market

9
UK
UK Kitchen Market at RSP
Source: JKMR, Magnet
MGBP
0
500
1 000
1 500
2 000
2 500
3 000
1997 1998 1999 2000 2001 2002
Installation
Sinks & Taps
Worktops
Appliances
Furniture
43%
25%
9%
6%
17%
CAGR 97-02
+4.3%
+2.4%
+9.1%
+8.8%
+1.6%

10
UK
UK Kitchen Market Volumes and AOV (RSP)
CAGR 97-02
-0.2%
+4.5%
Source: JKMR, Magnet
820
840
860
880
900
920
1997 1998 1999 2000 2001 2002
Kitc
hens
000
s
1000
1500
2000
2500
3000
3500
4000
Ave
rage
ord
er v
alue
£
Volumes
AverageOrderValues

11
UK
Consumer Confidence Indicator UK-EU
-20
-15
-10
-5
0
5
10
1998:11998:2
1998:31998:4
1999:11999:2
1999:31999:4
2000:12000:2
2000:32000:4
2001:12001:2
2001:32001:4
2002:12002:2
2002:32002:4
2003:12003:2
UKEU
Source: European Commission

12
UK
Private consumption, annual growth rate UK
0,0%1,0%
2,0%3,0%
4,0%5,0%
6,0%
1996 1997 1998 1999 2000 2001 2002 2003 2004 2005
UK
Source: EUROCONSTRUCT
13
UK
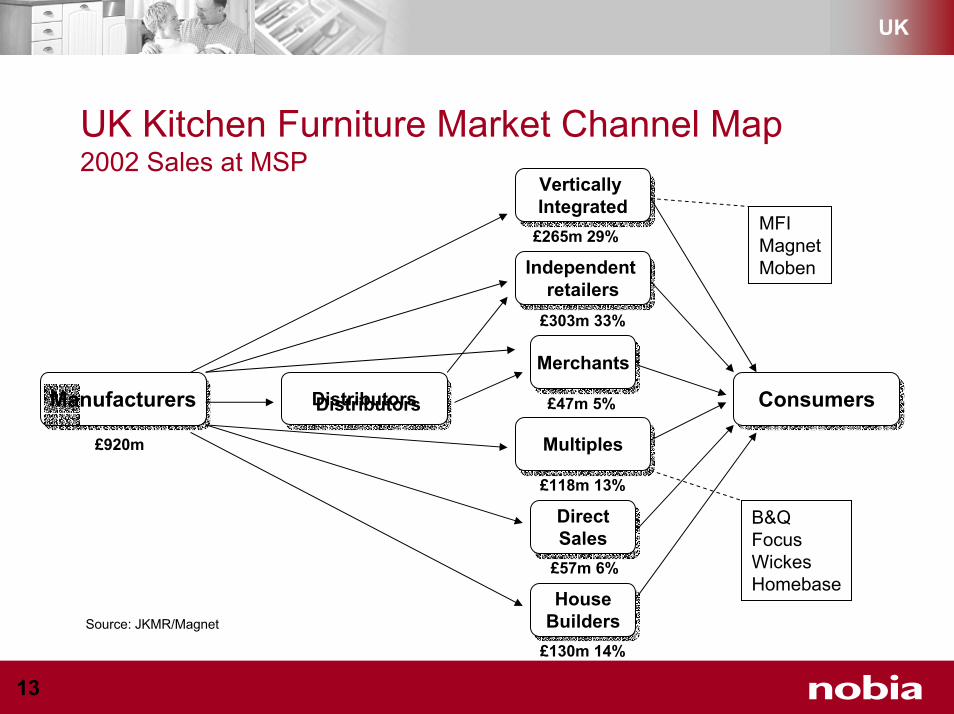
UK Kitchen Furniture Market Channel Map2002 Sales at MSP
Source: JKMR/Magnet
Manufacturers
£920m
Manufacturers DistributorsDistributors
Multiples
B&QFocus WickesHomebase
Multiples
Vertically Integrated
ConsumersConsumersMerchantsMerchants
Independent retailers
Independent retailers
DirectSales
DirectSales
HouseBuildersHouse
Builders
£265m 29%
£303m 33%
£118m 13%
£47m 5%
£57m 6%
£130m 14%
Vertically Integrated
MFIMagnetMoben

14
UK
Magnet/CP Hart7%
MFI/Howden25%
Moben4%
B&Q6%
Independents37%
Contract Market10% Merchants
4%
Homebase1%
Focus/Wickes4%
Premium Manufacturers
2%
Overall UK Market by Distribution Channel 2002 Sales at RSPThe UK Kitchen market is dominated by five companies accounting for over half of the retail market. MFI/Howden is the largest retailer in the UK.
Source: Magnet

15
UK
Magnet Retail10%
Independents69%
High End Manufacturers
5%
Moben7%
MFI Schreiber9%
The upper & upper-middle sector accounts for around half of the UK market and is dominated by the independent sector. Magnet is the leading retailer in this sector.
Upper & upper-middle Market2002 sales at RSP
Source: Magnet
16
UK
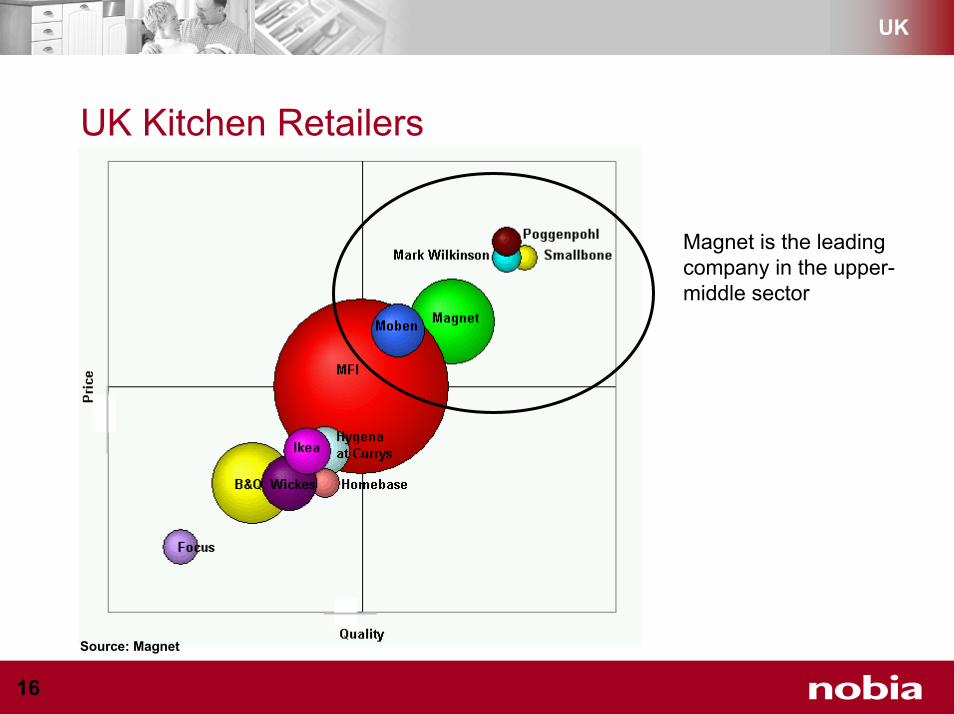
UK Kitchen Retailers
Source: Magnet
Magnet is the leading company in the upper-middle sector

17
UK
Main competitors in the UK upper-middle market
• MFI: – vertically integrated manufacturer with its own store network– Strategic priorities:
refurbishment of MFI out-of-town stores roll-out of Howden joinery stores extension of product offer to every room in the house
• Moben– limited role of store network– sales mainly through direct sales force
• Independent retailers– very fragmented structure– mainly local and small business supplied by a variety of local
manufacturers and import companies

18
UK
Main competitors in the UK flat-pack market• The flat-pack market is dominated by DIY-chains and builders’ merchants• B&Q
– 320 points of sale– supplied by a few manufacturers– part of the Kingfisher Group
• Focus Wickes– 440 points of sales– supplied by Gower– owned by financial investors and management
• Homebase– 270 points of sale– supplied by Magnet/Optifit– owned by the GUS Group
• Jewson/Graham– 650 points of sale– supplied by Gower– part of the StGobain Group
19
UK
Profile - UK Market• The UK market has achieved strong growth in the past five years,
particularly prior to the millennium
• Vertically integrated manufacturers and a few large DIY-multiples occupy 50% of the market
• The distribution structure at the upper & upper-middle sector remains fragmented
• Upper & upper-middle sector is dominated by independents. Magnet (retail) is the largest individual retailer in this market
• Vertically integrated manufacturers and DIY-multiples have grown the number of outlets and gained market share at the expense of the independent sector
• The manufacturing structure is well consolidated with six manufacturers holding more than 50% of the market
• Small import and export trade

20
The Nordic Market

21
Nordic
Consumer Confidence IndicatorNordic - EU
-20
-10
0
10
20
30
40
1998 :11998 :21998 :31998 :41999 :11999 :21999 :31999 :42000 :12000 :22000 :32000 :42001 :12001 :22001 :32001 :42002 :12002 :22002 :32002 :42003 :12003 :2
SENODKSFEU
Source: European Commission

22
Nordic
Housing Transactions, Nordic
0
2 000
4 000
6 000
8 000
10 000
12 000
14 000
16 000
18 000
1999
:119
99:2
1999
:319
99:4
2000
:120
00:2
2000
:320
00:4
2001
:120
01:2
2001
:320
01:4
2002
:120
02:2
2002
:320
02:4
2003
:1
SwedenNorwayDenmarkFinland
Number of housing transactions per quarter, 1+2 family homes.
Source: Prognoscentret

23
Nordic
Market Share, Nordic
21%
45%
3%
5%9%
17%
Nobia
IKEA
Ballingslöv
Vedum
Others
Kvänum
35%39%
4%
4%4%
14%
Nobia
IKEAHuseby
Strai Drömmekjökkenet
Others
29%
48%
8%7%
8%
Others
Nobia
Topi-Kalustaja
Harjavalta(Puustelli)
Isku
Sweden Norway
Denmark Finland
Nobia combined market share approx. 28% in 2002:
– Sweden 21%– Norway 35%– Denmark 28%– Finland 29%
28%
6%
41%
4%
7%
7%
7%
Nobia
Svane
KVIK
IKEATVIS
Others
JKE

24
Nordic
Main competitors in the Nordic market
• The Nordic countries each have approx. 5-10 local actors
• Ikea and HTH are brands that operate in all Nordic countries
• Nobia’s main competitors per country are:– Sweden: Ballingslöv, Kvänum, Vedum and Ikea– Denmark: JKE (Ballingslöv), Kvik, Tvis and Ikea – Norway: Drömmekjökken (Ballingslöv), Strai, Huseby and Ikea – Finland: Harjavalta (Puustelli), Isku and Topi-Kalustaja

25
19%
23%
1%
42%
15%
8%
8%
0%
42%
42%
27%
18%
5%
10%
40%
8%
8%
2%
67%
15%
Distribution Structure Overview - Nordic
Merchants
DIY
Others/Direct sales
Kitchen/Bathroom Specialists
Furniture Chains(IKEA)
Turnover shares in per centDenmark Sweden
Norway Finland
DIY
Merchants
DIY
Others/Direct sales
Kitchen/Bath-room Specialists
Furniture Chains(IKEA)
Source: KMC Research, Interviews
Nordic
Merchants
DIY
Others/Direct sales
Kitchen/Bathroom Specialists
Furniture Chains(IKEA)
Merchants
DIY
Others/Direct sales
Kitchen/Bath-room Specialists
Furniture Chains(IKEA+3)

26
Profile - Nordic Markets
• Stable overall YOY in total over the past years with variations between countries
• The Nordic market consists of four countries with different distribution structures– kitchen specialists leading channel in Denmark– Builders’ merchants leading channel in Sweden
• Nobia, Ikea and Ballingslöv are active in several Nordic countries
• Ikea and HTH are the only pan-Nordic brands
• Manufacturing structure reasonably well consolidated
• Import/export trade mainly from Denmark to Norway

27
The German and Dutch markets

28
DE & NL
Kitchen Furniture Consumption
Kitchen furniture, actual consumption. Annual % changes at constant prices.
%
-15
-10
-5
0
5
1996 1997 1998 1999 2000 2001 2002
GermanyEurope
Source: CSIL, Nobia

29
DE & NL
Disposable Income
Average monthly income per employee in Germany (EUR)
18301650
1910 1940 2010 2040 2040 2060 2090 2120 2160 2205 2255
140014351410137013401320130013201320131013101250
1150111011001100114011501160
11901120 1120 1120 1070
11901150
0
500
1000
1500
2000
2500
1991 1992 1993 1994 1995 1996 1997 1998 1999 2000 2001 2002 2003
GrossNetReal
Forecast
*
* Purchasing power from 1991 (after deducting price increases)
Source: GfK

30
DE & NL
-30
-20
-10
0
10
20
30
40
1998:11998:21998:31998:41999:11999:21999:31999:42000:12000:22000:32000:42001:12001:22001:32001:42002:12002:22002:32002:42003:12003:2
DENLEU
Consumer Confidence IndicatorGermany - Netherlands - EU
Source: European Commission

31
DE & NL
Private consumption, annual growth rateGermany – Netherlands
-1,0%0,0%1,0%2,0%3,0%4,0%5,0%6,0%
1996 1997 1998 1999 2000 2001 2002 2003 2004 2005
DE
NL
Source: EUROCONSTRUCT

32
DE & NL
Sales Channels in Germany
Kitchen % distribution per sales channel in Germany
Strong power is being exercised through co-ordinated purchasing by all channels
0
10
20
30
40
50
60
Furniture stores Kitchen Specialists DIY
%
Upper-middle, middle, and economysegment
Upper and Upper-middlesegment
Economysegment
Source: GfK
33
DE & NL
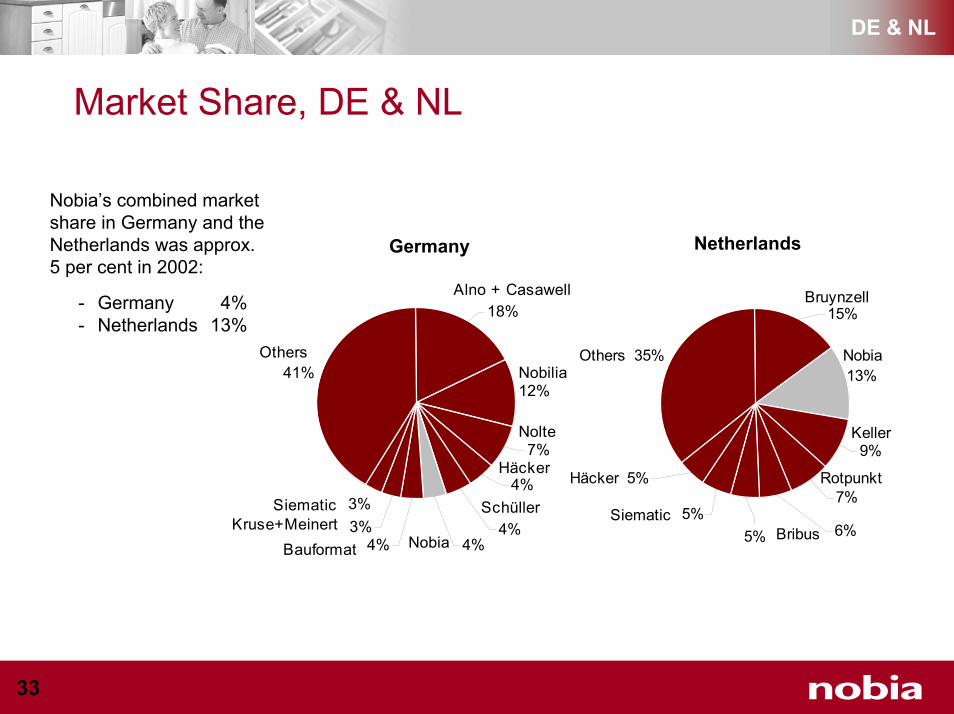
Market Share, DE & NL
12%
3%
41%
18%
4%
7%
4%
4%4%
3%
Nobilia
Alno + Casawell
Nolte
Häcker
Schüller
Nobia
Others
BauformatKruse+Meinert
Siematic
Germany Netherlands
Nobia’s combined market share in Germany and the Netherlands was approx. 5 per cent in 2002:
- Germany 4%- Netherlands 13%
35%
15%
5%
5%
5% 6%
7%
9%
13%Nobia
Bruynzell
Keller
Rotpunkt
Others
BribusSiematic
Häcker

34
DE & NL
Main competitors in the German and NL markets in the upper-middle segment
• The “Einkaufsverbände” is the dominating distribution channel for kitchens within the upper middle segment
• The largest “Einkaufsverbände” are MHK, Der Kreis and VKG who together operate 4000 stores in Germany
• Nobia’s main competitors are those manufacturers who supply these chains and the upper/middle segment of the market
• Main competitors are Häcker, Schüller, Leicht and Siematic
• The furniture chain is the overall dominating distribution, but it focuses on the middle and economic segment
• The largest manufacturers in Germany dominate the supply of furniture chains and the middle and economic segments of the market
• These manufacturers are Alno/Casawell, Nobilia, Nolte, K&M

35
Profile - German Market
• Market decline since 1995
• Distribution dominated by large purchasing associations for kitchen specialists and furniture stores
• Kitchens are re-branded by the retail chains
• Trend towards lower AOV in recent years
• Fragmented manufacturing structure (130 manufacturers)
• Consolidation among manufacturers and reduction of production capacity ongoing
• Large export trade and small import trade
• The Netherlands is by far the largest export market for German kitchen manufacturers

36
Thank you for listening!

37
Appendix

38
UK
GDP annual growth rate – UK
0,0%
0,5%
1,0%
1,5%
2,0%
2,5%
3,0%
3,5%
4,0%
1996 1997 1998 1999 2000 2001 2002 2003 2004 2005
UK
Source: EUROCONSTRUCT
39
UK
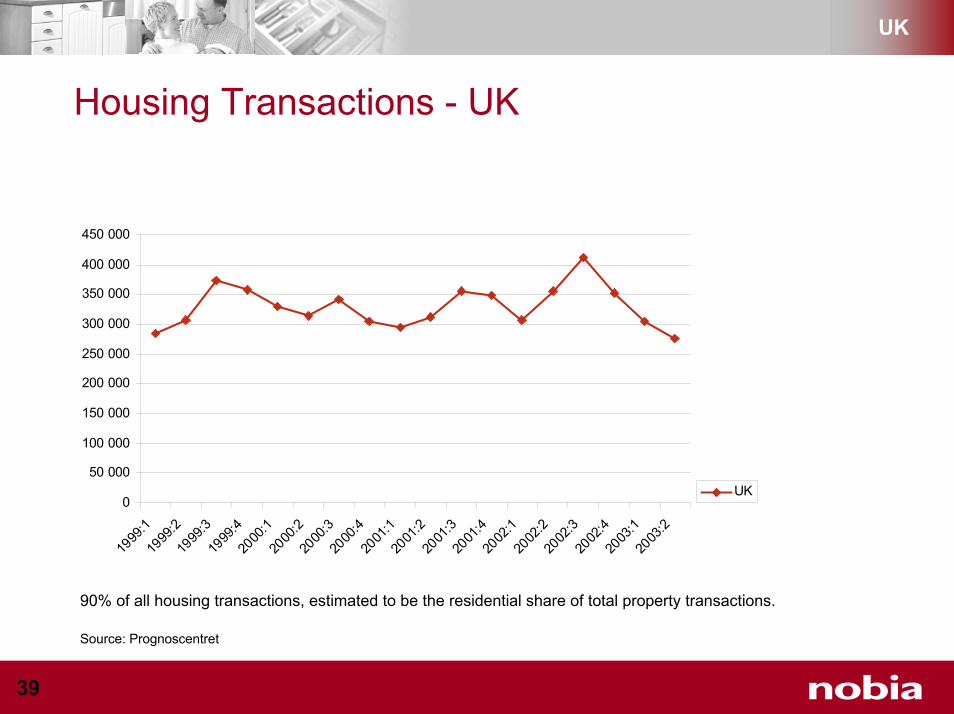
Housing Transactions - UK
0
50 000
100 000
150 000
200 000
250 000
300 000
350 000
400 000
450 000
1999
:119
99:2
1999
:319
99:4
2000
:120
00:2
2000
:320
00:4
2001
:120
01:2
2001
:320
01:4
2002
:120
02:2
2002
:320
02:4
2003
:120
03:2
UK
90% of all housing transactions, estimated to be the residential share of total property transactions.
Source: Prognoscentret

40
UK
R&M Residential Buildings – The UKBuilding Investments 1999 – 2005 (EUR bn in 2002 prices)
27,5
28,5
29,5
30,5
31,5
32,5
33,5
1999 2000 2001 2002 2003 2004 2005
UK
Source: Euroconstruct - CFR.
41
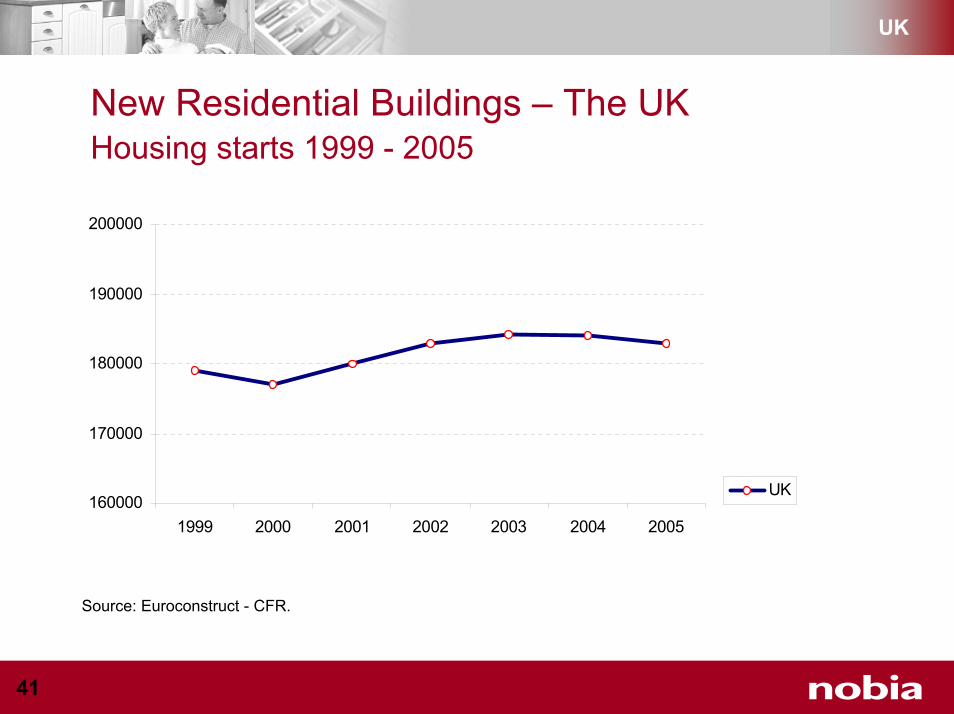
UK
New Residential Buildings – The UKHousing starts 1999 - 2005
160000
170000
180000
190000
200000
1999 2000 2001 2002 2003 2004 2005
UK
Source: Euroconstruct - CFR.

42
Nordic
R&M Residential Buildings – Nordic AreaBuilding Investments 1999 – 2005 (Bill. EUR in 2002 prices)
2,5
3,0
3,5
4,0
4,5
5,0
1999 2000 2001 2002 2003 2004 2005
SEDKNOSF
Sources: Euroconstruct – Prognosesenteret AS (NO), CIFS (DK), VTT (SF), Prognoscentret AB (SE).

43
Nordic
New Residential Buildings – Nordic AreaHousing starts 1999 - 2005
10000
15000
20000
25000
30000
35000
1999 2000 2001 2002 2003 2004 2005
SEDKNOSF
Source: Prognoscentret AB.

44
DE & NL
Housing Transactions
Number of housing transactions per quarter, 1+2 family homes.Figures for Germany not available.
0
10 000
20 000
30 000
40 000
50 000
60 000
70 000
1999
:119
99:2
1999
:319
99:4
2000
:120
00:2
2000
:320
00:4
2001
:120
01:2
2001
:320
01:4
2002
:120
02:2
2002
:320
02:4
2003
:120
03:2
NL
Source: Prognoscentret

45
DE & NL
R&M Residential Buildings – DE, NLBuilding Investments 1999 – 2005 (EUR bn in 2002 prices)
2,5
12,5
22,5
32,5
42,5
52,5
62,5
1999 2000 2001 2002 2003 2004 2005
NLDE
Sources: Euroconstruct – EIB (NL), ifo (DE).

46
DE & NL
New Residential Buildings – DE, NLHousing starts 1999 - 2005
50000
100000
150000
200000
250000
300000
350000
400000
450000
1999 2000 2001 2002 2003 2004 2005
NLDE
Sources: Euroconstruct – EIB (NL), ifo (DE).