the equator is a really important line in geography... but it’s an imaginary line! it’s not...
TRANSCRIPT

WHERE ISthe
equator???

The Equator is a really important line
in geography . . .
BUTit’s an imaginary line!
It’s not really drawnon the earth itself.
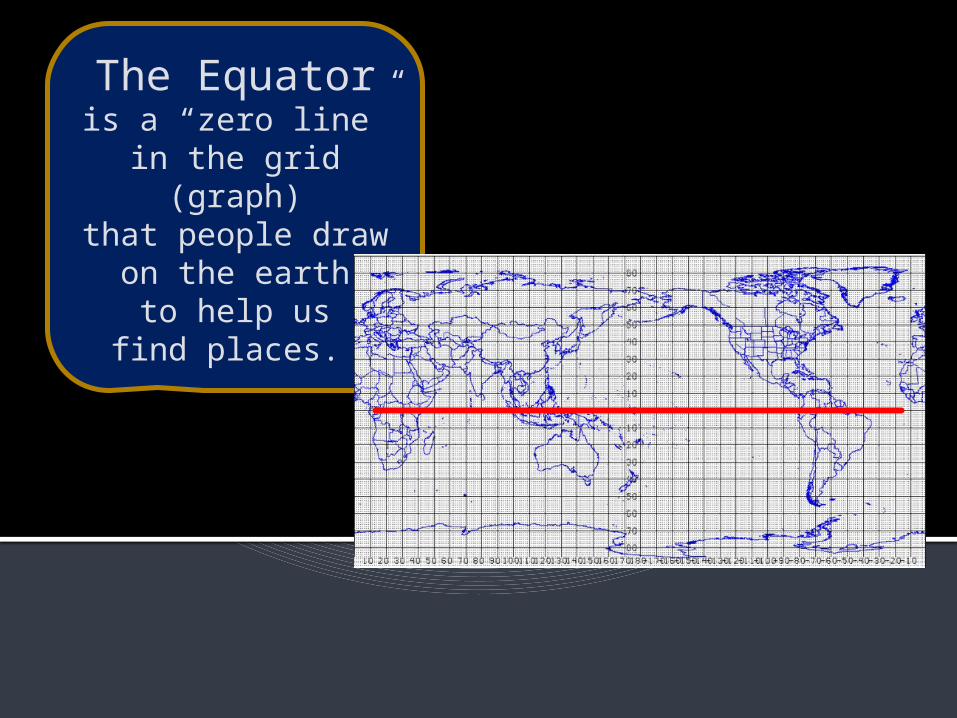
The Equatoris a “zero line”
in the grid (graph)that people draw
on the earthto help us
find places.

It’s the linethat goes exactlyhalfway betweenthe North Pole
and the South Pole.
North Pole
South Pole
Equator
It’s like a beltaround the middle
of the earth.

The Equatoris important
because many things
are arranged in“stripes” that runroughly parallelto the Equator.
These areocean-water
temperatures.
H O T
H O T
MEDIUM
MEDIUM
COLD
COLD
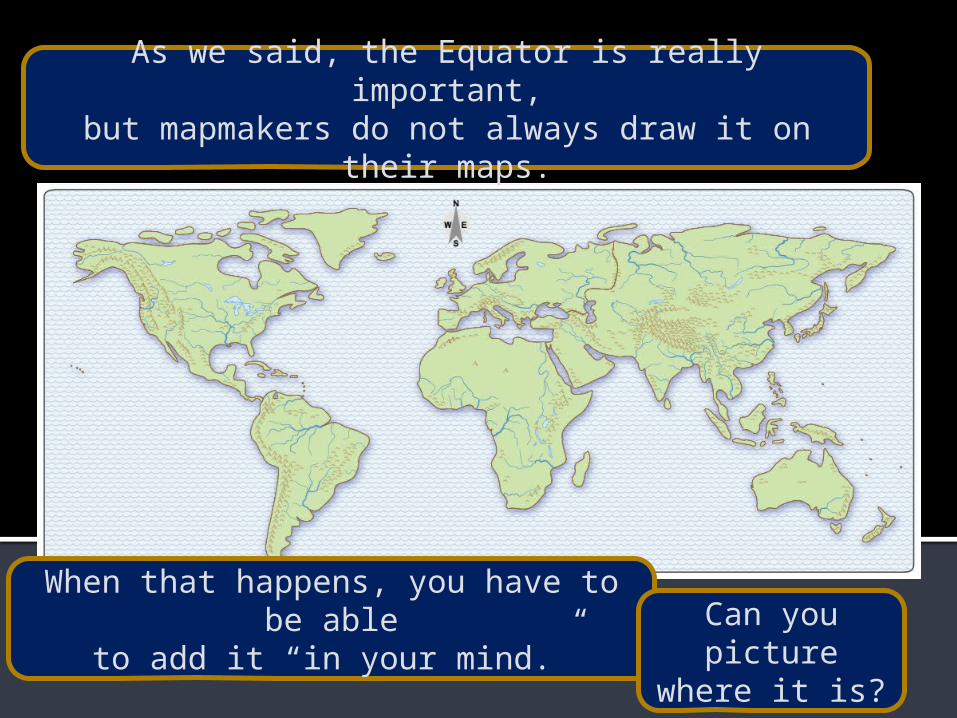
As we said, the Equator is really important,but mapmakers do not always draw it on their maps.
When that happens, you have to be ableto add it “in your mind.” Can you picture
where it is?

Here are some clues.
It goes through the “notch”where the Amazon River
flows into the Atlantic Ocean.
Science fact: It rains nearly every day near the Equator.As a result, the Amazon River is the biggest one on the planet.
PACIFIC OCEAN ATLANTIC
OCEAN
SouthAmerica
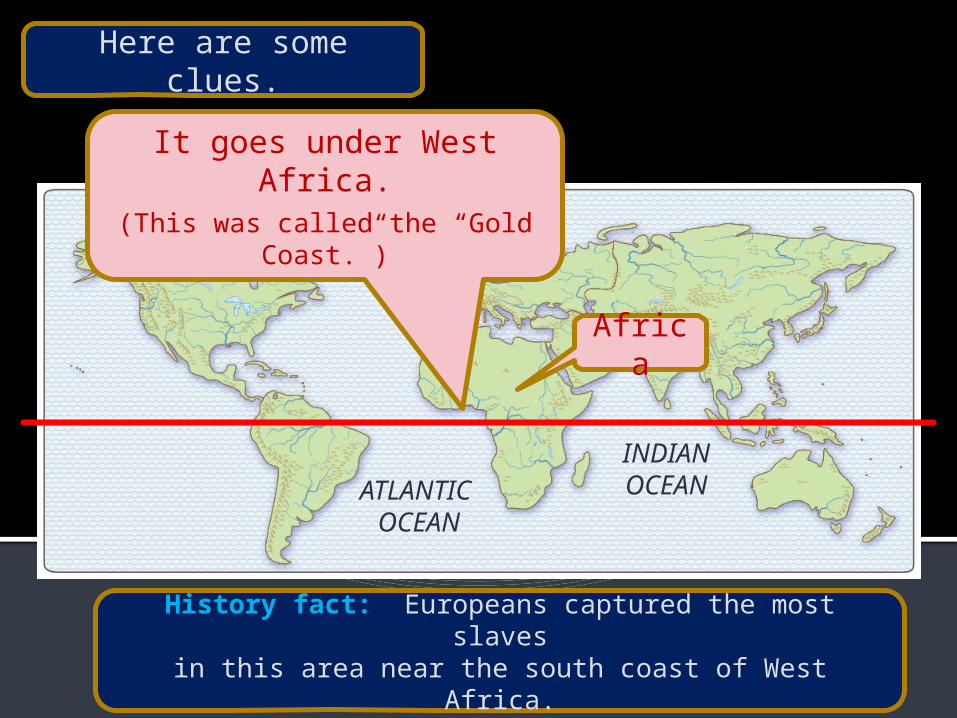
Here are some clues.
It goes under West Africa.(This was called the “Gold Coast.”)
History fact: Europeans captured the most slavesin this area near the south coast of West Africa.
INDIANOCEANATLANTIC
OCEAN
Africa
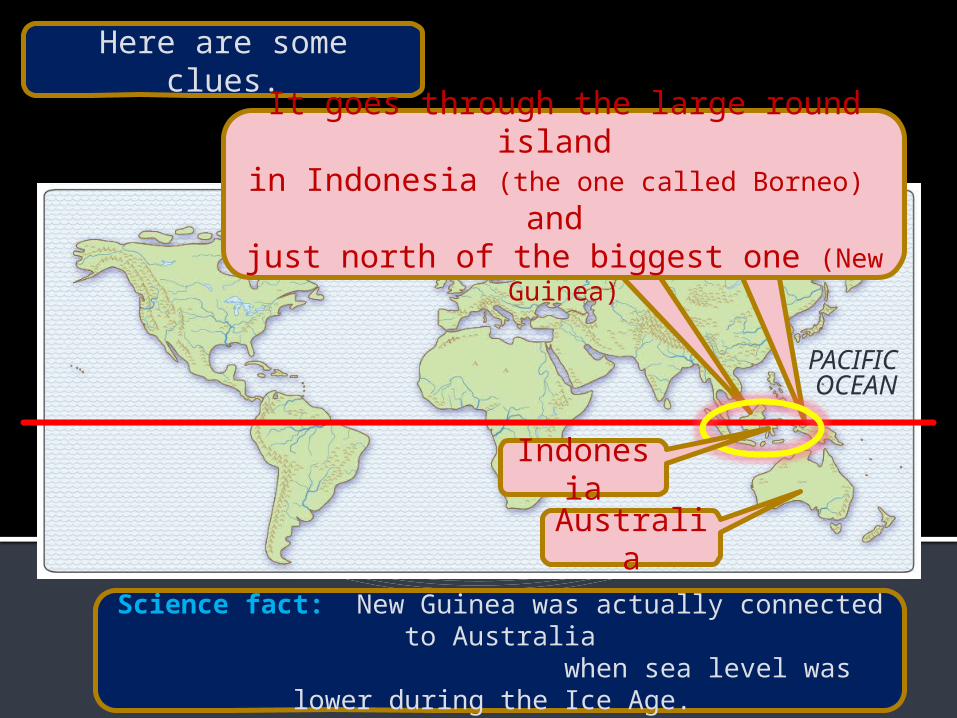
Here are some clues.
It goes through the large round island in Indonesia (the one called Borneo) and
just north of the biggest one (New Guinea)
Science fact: New Guinea was actually connected to Australia when sea level was lower during the Ice Age.
Indonesia
Australia
PACIFIC OCEAN

Here are some clues.
It goes through Singapore, an island country at the south tip
of a long, skinny peninsula of Asia.
History fact: Singapore is called a city-state. It is a tiny country, but the people make a lot of money.
INDIANOCEAN
PACIFIC OCEAN
Asia

It doesn’t hurt to remember the place-names,but you don’t need to in order to find the equator.
Mouth ofthe big river
Underthe bulge
Tip of thepeninsula
Through theround island
North of thelargest island
And you really haveto remember only oneof these three clues.
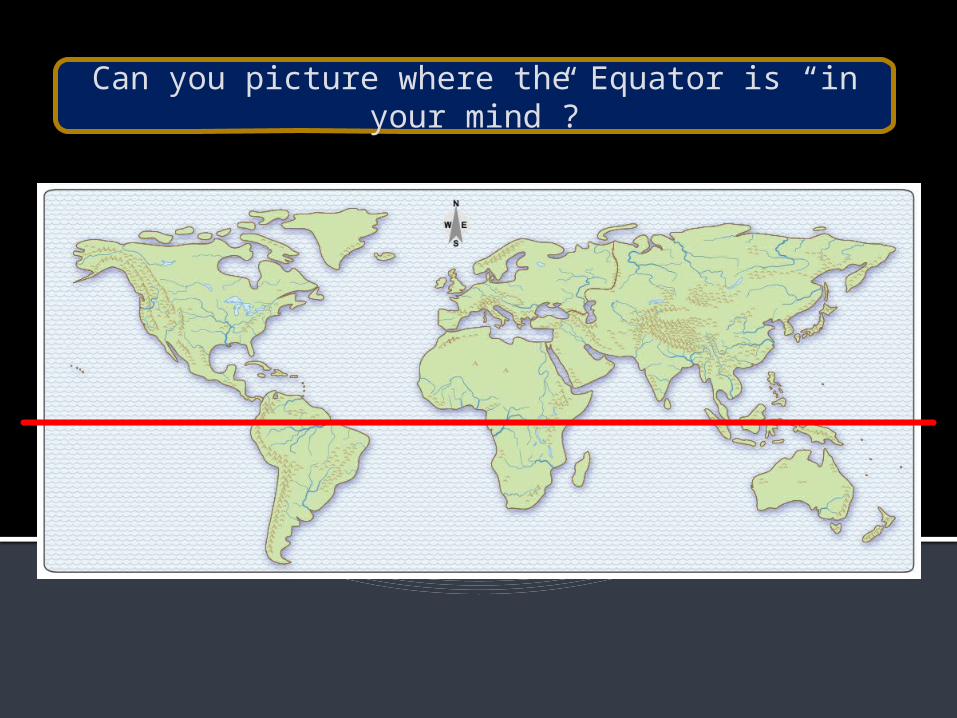
Can you picture where the Equator is “in your mind”?

Sea surface temperature animation:
http://sos.noaa.gov/Datasets/dataset.php?id=133#
Copyright 2015, Phil Gersmehl
Teachers who saw this presentation at a workshopor downloaded it from our internet site have permission
to make a copy on their own computers for these purposes: 1. to help them review the workshop, 2. to show to colleagues or administrators, 3. to show the presentation in their own classrooms or at sessions they lead at teacher conferences, 4. to use individual frames (with attribution) in their own class or conference presentations.
For permission for any other use, including posting frames on a personal blog
or uploading to any network or website, contact [email protected]