the envis team - jnuenvis.nic.injnuenvis.nic.in/newsletters/vol22no22016-17.pdf · saumitra...
TRANSCRIPT
The ENVIS Team:
ENVISCoordinatorProf.SaumitraMukherjee
Dean,SchoolofEnvironmentalSciences
ENVISCo-coordinatorsProf.P.S.Khillare
Prof.DineshMohanDr.J.K.TripathiDr.IloraGhosh
InformationOfficerSandhyaFarswan
ITAssistant
Mr.VijayKumar
Published By:
ENVISCenteronBiogeochemistrySchoolofEnvironmentalSciences
JawaharlalNehruUniversityNewDelhi-110067
Contact:011-26704315,26704302
Email:[email protected]:www.jnuenvis.nic.in
Sponsored By: MinistryofEnvironment,Forestand
ClimateChangeGovernmentofIndia
Biogeochemistry ENVIS Vol.22(2), 2016-17
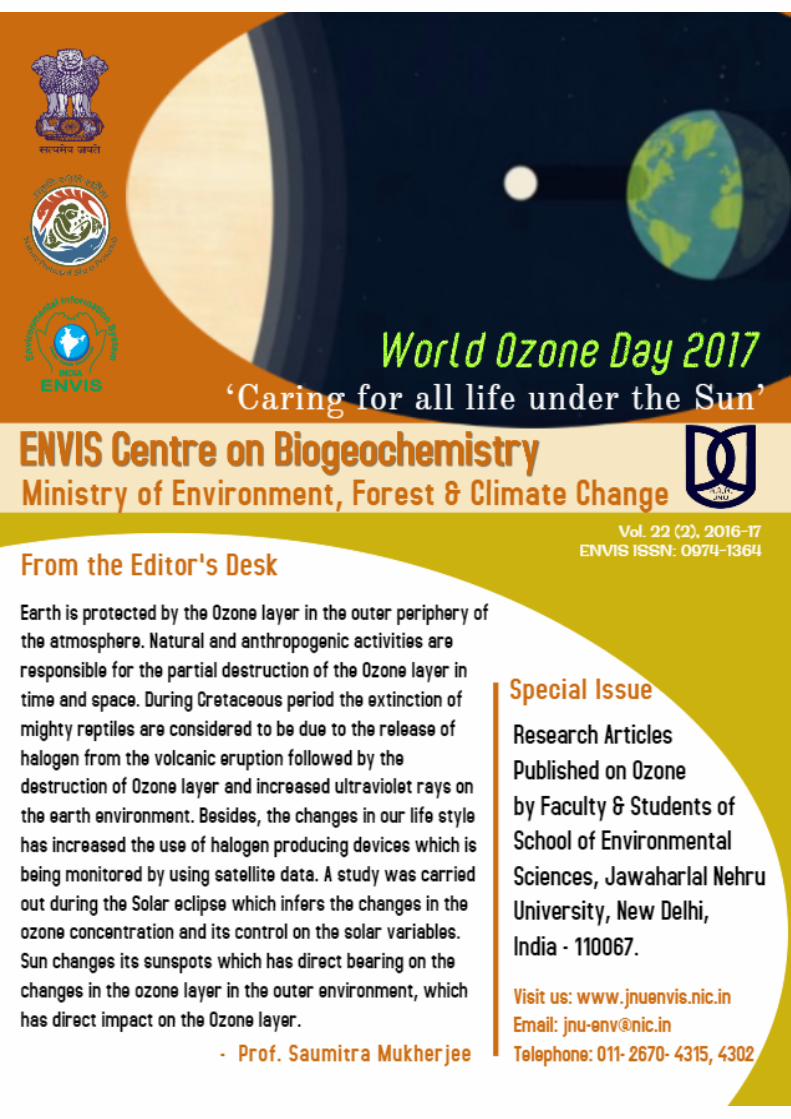
Special Issue on World Ozone Day (16th Sepetmber 2017) ‘Caring for all life under the Sun’
1
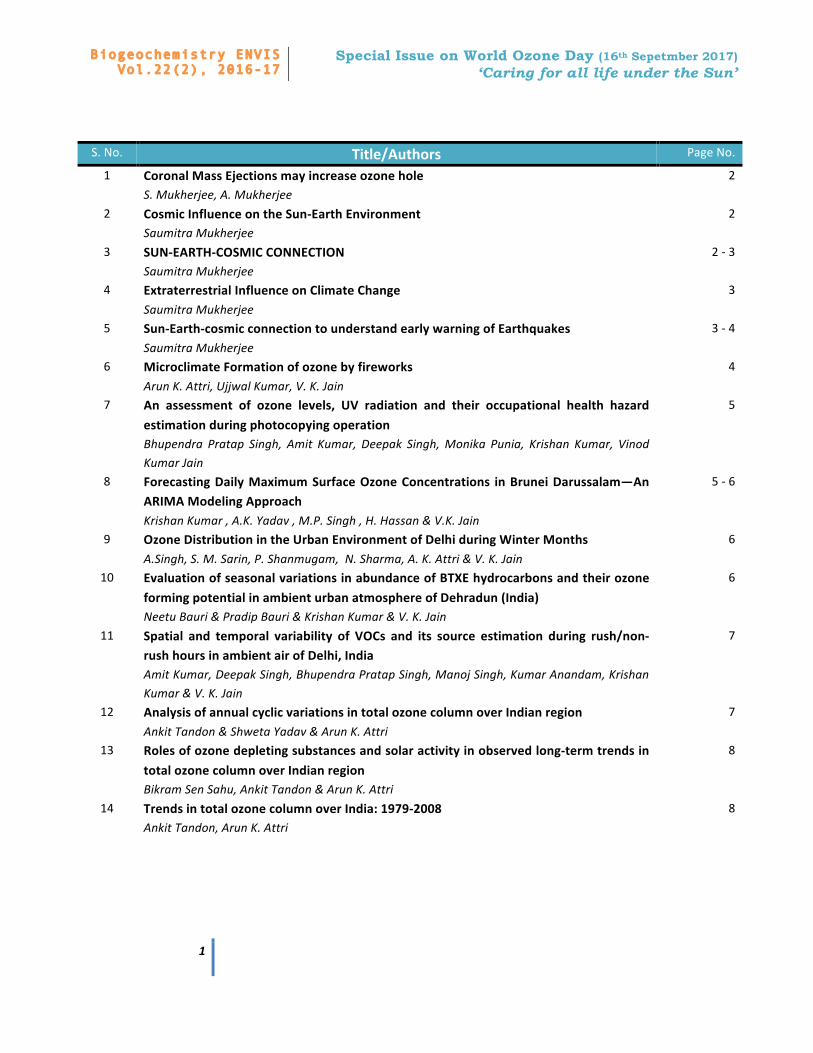
S.No. Title/Authors PageNo.
1 CoronalMassEjectionsmayincreaseozoneholeS.Mukherjee,A.Mukherjee
2
2 CosmicInfluenceontheSun-EarthEnvironmentSaumitraMukherjee
2
3 SUN-EARTH-COSMICCONNECTIONSaumitraMukherjee
2-3
4 ExtraterrestrialInfluenceonClimateChangeSaumitraMukherjee
3
5 Sun-Earth-cosmicconnectiontounderstandearlywarningofEarthquakesSaumitraMukherjee
3-4
6 MicroclimateFormationofozonebyfireworksArunK.Attri,UjjwalKumar,V.K.Jain
4
7 An assessment of ozone levels, UV radiation and their occupational health hazardestimationduringphotocopyingoperationBhupendra Pratap Singh, Amit Kumar, Deepak Singh,Monika Punia, Krishan Kumar, VinodKumarJain
5
8 ForecastingDailyMaximumSurfaceOzoneConcentrations inBruneiDarussalam—AnARIMAModelingApproachKrishanKumar,A.K.Yadav,M.P.Singh,H.Hassan&V.K.Jain
5-6
9 OzoneDistributionintheUrbanEnvironmentofDelhiduringWinterMonthsA.Singh,S.M.Sarin,P.Shanmugam,N.Sharma,A.K.Attri&V.K.Jain
6
10 EvaluationofseasonalvariationsinabundanceofBTXEhydrocarbonsandtheirozoneformingpotentialinambienturbanatmosphereofDehradun(India)NeetuBauri&PradipBauri&KrishanKumar&V.K.Jain
6
11 Spatial and temporal variability of VOCs and its source estimation during rush/non-rushhoursinambientairofDelhi,IndiaAmitKumar,DeepakSingh,BhupendraPratapSingh,ManojSingh,KumarAnandam,KrishanKumar&V.K.Jain
7
12 AnalysisofannualcyclicvariationsintotalozonecolumnoverIndianregionAnkitTandon&ShwetaYadav&ArunK.Attri
7
13 Rolesofozonedepletingsubstancesandsolaractivityinobservedlong-termtrendsintotalozonecolumnoverIndianregionBikramSenSahu,AnkitTandon&ArunK.Attri
8
14 TrendsintotalozonecolumnoverIndia:1979-2008AnkitTandon,ArunK.Attri
8
Biogeochemistry ENVIS Vol.22(2), 2016-17
Special Issue on World Ozone Day (16th Sepetmber 2017) ‘Caring for all life under the Sun’
2
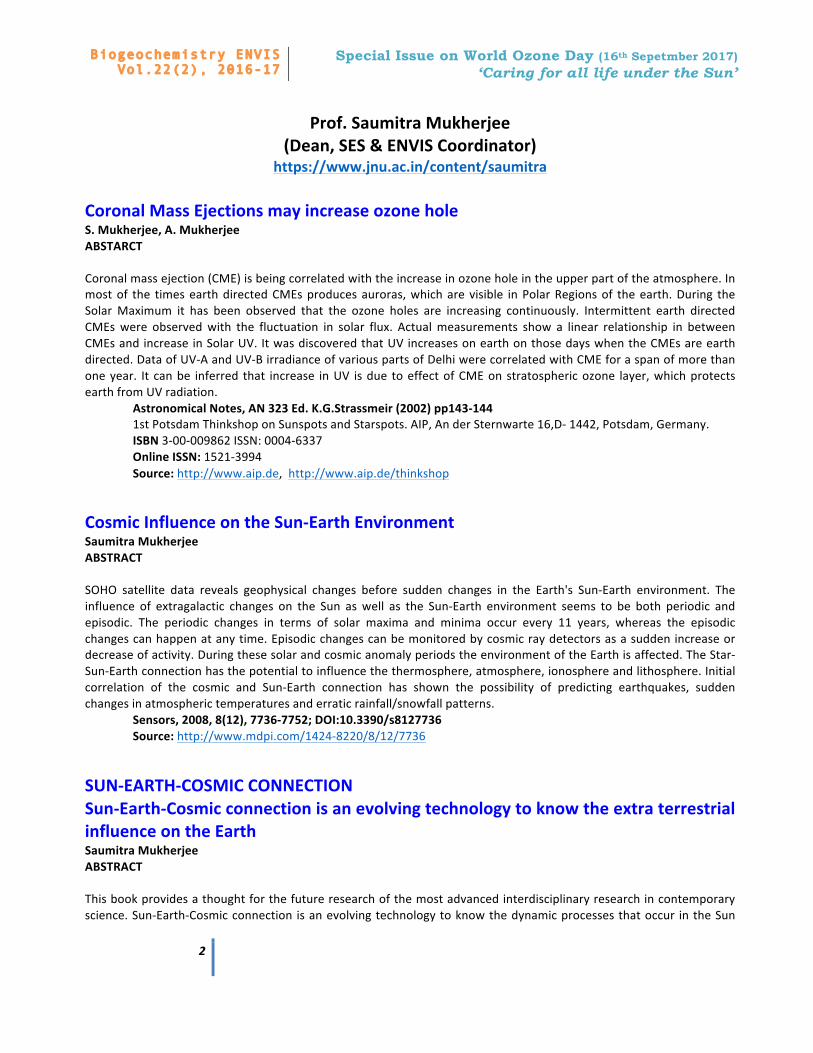
Prof.SaumitraMukherjee(Dean,SES&ENVISCoordinator)
https://www.jnu.ac.in/content/saumitraCoronalMassEjectionsmayincreaseozoneholeS.Mukherjee,A.MukherjeeABSTARCT
Coronalmassejection(CME)isbeingcorrelatedwiththeincreaseinozoneholeintheupperpartoftheatmosphere.Inmostof the timesearthdirectedCMEsproducesauroras,whichare visible inPolarRegionsof theearth.During theSolarMaximum it has been observed that the ozone holes are increasing continuously. Intermittent earth directedCMEswere observedwith the fluctuation in solar flux. Actualmeasurements show a linear relationship in betweenCMEsandincreaseinSolarUV.ItwasdiscoveredthatUVincreasesonearthonthosedayswhentheCMEsareearthdirected.DataofUV-AandUV-BirradianceofvariouspartsofDelhiwerecorrelatedwithCMEforaspanofmorethanoneyear. It canbe inferred that increase inUV isdue toeffectofCMEonstratosphericozone layer,whichprotectsearthfromUVradiation.
AstronomicalNotes,AN323Ed.K.G.Strassmeir(2002)pp143-1441stPotsdamThinkshoponSunspotsandStarspots.AIP,AnderSternwarte16,D-1442,Potsdam,Germany.ISBN3-00-009862ISSN:0004-6337OnlineISSN:1521-3994Source:http://www.aip.de,http://www.aip.de/thinkshop
CosmicInfluenceontheSun-EarthEnvironmentSaumitraMukherjeeABSTRACT
SOHO satellite data reveals geophysical changes before sudden changes in the Earth's Sun-Earth environment. Theinfluence of extragalactic changes on the Sun aswell as the Sun-Earth environment seems to be both periodic andepisodic. The periodic changes in terms of solar maxima and minima occur every 11 years, whereas the episodicchangescanhappenatanytime.Episodicchangescanbemonitoredbycosmicraydetectorsasasuddenincreaseordecreaseofactivity.DuringthesesolarandcosmicanomalyperiodstheenvironmentoftheEarthisaffected.TheStar-Sun-Earthconnectionhasthepotentialtoinfluencethethermosphere,atmosphere,ionosphereandlithosphere.Initialcorrelation of the cosmic and Sun-Earth connection has shown the possibility of predicting earthquakes, suddenchangesinatmospherictemperaturesanderraticrainfall/snowfallpatterns.
Sensors,2008,8(12),7736-7752;DOI:10.3390/s8127736Source:http://www.mdpi.com/1424-8220/8/12/7736
SUN-EARTH-COSMICCONNECTIONSun-Earth-CosmicconnectionisanevolvingtechnologytoknowtheextraterrestrialinfluenceontheEarthSaumitraMukherjeeABSTRACT
Thisbookprovidesathoughtforthefutureresearchofthemostadvancedinterdisciplinaryresearchincontemporaryscience.Sun-Earth-Cosmicconnection isanevolvingtechnologytoknowthedynamicprocessesthatoccur intheSun
Biogeochemistry ENVIS Vol.22(2), 2016-17
Special Issue on World Ozone Day (16th Sepetmber 2017) ‘Caring for all life under the Sun’
3
andinfluencethethermosphere-ionosphere-atmosphere-hydrosphere-biosphereandthewholegeosphere.Theauthorrelatesthattheextraterrestrialremotesensingobservationcoupledwithearthbasedsensorlikecosmicraydetectorhasthepotentialtopredictlifeofsatellitesinspace,earthquake,snowfall,rainfall,tornado,draughtandepidemicsofbiologicalsystem.Thetechnologyhaspotentialtoinferthestudiesofthehumandimensionsofglobalenvironmentalchangebycomprehensivestudyofhumanactionsandnaturalchanges.
LAPLambertAcademicPublishingGermany(2011)ISBN978-3-8443-0731-3Source:https://www.morebooks.de/store/us/book/sun-earth-cosmic-connection/isbn/978-3-8443-0731-3
ExtraterrestrialInfluenceonClimateChangeSaumitraMukherjeeABSTRACT
Climate change has been addressed since last decade based on the influence of human activities like production ofindustrialeffluents,landusechangesandotheractivitiesduetodevelopmentofthesociety.Theseareveryimportantissues no doubt but the activities due to the influence of extraterrestrial phenomena have not been given its dueimportance. An attempt is being made here to understand the influence of extraterrestrial activities as one of theimportant factors of climate change has been attempted here. The influence of Sun and distant stars on theenvironment of the earth has been studied during the cyclic changes in the Sun as well as episodic changes in theenvironmentduetotheeffectofothercelestialobjectsinbetweenSun-Earthenvironment.Thestudyhasbeencarriedout based on the changes within the Sun as well as changes during the solar eclipse. During these extraterrestrialchanges it has been observed that the earth changes in its atmosphere aswell as geosphere,whichmay have localeffectbuttheincreaseoftheselocaleffect inlargescalemaycontributetotheclimatechange.Solarradiationdrivesatmospheric circulation. Since solar radiation represents almost all the energy available to the Earth, accounting forsolarradiationandhowit interactswiththeatmosphereandtheEarth'ssurfaceisfundamentaltounderstandingtheEarth'senergybudget.
ISBN978-81-322-07290,eBookISBN978-81-322-0730-6DOI10.1007/978-81-322-0730-6©Springer(2013)Source:http://www.springer.com/earth+sciences+and+geography/earth+system+sciences/book/978-81-322-0729-0
Sun-Earth-cosmicconnectiontounderstandearlywarningofEarthquakesSaumitraMukherjeeABSTRACT
MuondetectorhasthepotentialtofunctionasNanoSensortoinferpossibleearthquakeinearthquakeproneareas.Ithasbeenobservedthat30to36hoursbeforetheoccurrenceoftheearthquakethemagneticfield(Kp)andelectronflux (E-flux) of the Sun-Earthenvironment changes.Using Sun-Observatory-HeliosphericObservatory (SOHO) satellitedataitispossibletomonitorthefluctuationevery15minutesinterval.Ithasbeenobservedthatbeforetheoccurrenceofearthquake,nanoparticle(muon)intensityreduces,whiletheatmospherictemperaturerisesalongwiththeincreaseinKpandE-fluxvalues.Aftertheearthquaketheatmospherictemperaturefallssuddenlywiththerise incosmicraysandfallinKpandE-fluxvalues.IthasbeenplannedbyIHY,NASAandUNBSS(UnitedNationsBasicSpaceSciences)todesign and install basic hybrid SEVAN (Space Environment Viewing andAnalysisNetwork) in 14 locations across theworld. Cosmic Ray Division laboratory of Armenia will supply photomultiplier of similar standards to all these 14locationsincludingJawaharlalNehruUniversity,NewDelhi,India.Thesedetectorswillrecordandcorrelatetheintensityof cosmic ray data to predict various environmental perturbations including earthquake. Based on this plan it wasattempted to correlate Kp, Eflux and chages in environment in different locations across theworldwith variationofcosmicrayscollectedfromexistingmuondetectors.
e-JournalEarthScienceIndiaVol.2(II),April,2009,pp.83–93
Biogeochemistry ENVIS Vol.22(2), 2016-17
Special Issue on World Ozone Day (16th Sepetmber 2017) ‘Caring for all life under the Sun’
4
Source:http://www.earthscienceindia.info/,file:///C:/Users/Jyot/Desktop/OZONE%20Publications%20JNU/S%20Mukherjee/tech_pdf-1278.pdf
♦ SaumitraMukherjee.TextBookofEnvironmentalRemoteSensing.PublishedbyMacmillanIndiaLimitedNewDelhiISBN:1403922357.INBK103842Source:http://www.macmillanindia.com
♦ SaumitraMukherjee.InfluenceofSolarandGalacticcosmicraysonEnvironmentoftheearth.InternationalStudyforEarth-AffectingSolarTransients(ISEST)MiniMax,México,October26–30,2015.Source:http://cintli.geofisica.unam.mx/congreso/
Prof.V.K.Jain
https://www.jnu.ac.in/content/vkj0400
MicroclimateFormationofozonebyfireworksArunK.Attri,UjjwalKumar,V.K.JainABSTRACT
Ozoneisasecondarypollutantandgreenhousegasthat isformedfrommolecularoxygeninthepresenceofsunlightandnitrogenoxides.Theextentofproductionalsodependsonthepresenceofvolatilehydrocarbons,carbonmonoxideandmethane1–6.Butwehavediscoveredasurprisingsourceofozonewhichisgeneratedinspontaneousburstsevenin theabsence of sunlight and nitrogen oxides—namely, the exuberantmass of colouremitting sparklers that are litduringtheDiwalifestivities,whichtakeplaceeveryyearduringOctoberandNovemberinDelhi,India.Theunderlyingprocessofozoneformationresemblesthatinducedbyultravioletradiationinthestratosphere.Weundertookaroutine,real-timemonitoringoftheconcentrationsofNox(NOandNO2),O3andothermicroclimaticfactors at a known pollutant-receptor site9 in Delhi in order to determine the effects of burning unprecedentednumbersoffireworksonthelocalenvironmentduringthefestiveperiodinNovember1999.Wefoundthatduringthefestivalperiodtheozoneconcentrationpeakedataroundnoonandfelltonegligiblelevelsaftersunset.OnDiwalinight(7November),asmallbuild-upofO3(951partsperbillionbyvolume)wasdetectedbetween20:40and02:30 hours (results not shown). During this period, no correlation was found between NOx concentration and O3formation, indicating that the ozone was unlikely to have been generated in reactions involving ambient NOx. Thisobservationwas surprisingly different from night-timeO3measurements obtained on the other dates,when noO3formationwasdetected.Furtherexperimentscarriedoutunderdifferentclimaticconditionsshowedthat there isa linear regressionbetweenthetotalamountofinflammablematerialpresentinsparklersandthecumulativeO3formed(correlation,0.993).TherewasnochangeinambientNOxconcentrationbefore,duringoraftertheseexperiments(Fig.1).Sparklers depend on a combination of differentmetal salts to generate their colour and sparkle10— these includepotassiumperchlorate,sulphur,strontiumnitrate,bariumnitrate,sodiumoxalate,calomel,aluminiumandmanganese.Whenburnt,asignificantproportionofthelightemittedbytheseconstituentshasawavelengthbelow240nm(ref.11).Theradiativeenergyoftheseemissionsissufficienttodissociateatmosphericmolecularoxygeninto atomic oxygen, enabling the reaction O2&OÕO3 to take place. This proposed mechanism could explain theformation of bursts of O3 without the participation of NOx, and is therefore similar to the process of ultraviolet-radiation-inducedformationofO3inthestratosphere.
Nature·June2001,Nature411,1015(28June2001)|doi:10.1038/35082634Source:http://www.nature.com/nature/journal/v411/n6841/abs/4111015a0.html
Biogeochemistry ENVIS Vol.22(2), 2016-17
Special Issue on World Ozone Day (16th Sepetmber 2017) ‘Caring for all life under the Sun’
5
Anassessmentofozonelevels,UVradiationandtheiroccupationalhealthhazardestimationduringphotocopyingoperationBhupendraPratapSingh,AmitKumar,DeepakSingh,MonikaPunia,KrishanKumar,VinodKumarJain
HIGHLIGHTS
• FirstquantitativereportofozonelevelandUVradiationemissionfromphotocopier.• Ozoneproductionisdirectlyproportionalwithintensityofphotocopyoperation.• Ozonelevelfromgroundfloorissignificantlyhigherthanbasementphotocopier.• OzoneproductionandUVradiationstudiedhaslesscorrelationduringphotocopy.• HealthhazardissuehasbeenevaluatedforeffectofUVradiationintermsofSED.
ABSTRACT
Thisstudyinvestigatesthelevelsofozoneconcentrationalongwithanultraviolet(UV)andvisiblespectralradiationateightphotocopycenters inanacademic institute,Delhi. Samplingwasdone in two typesof locations, i.e.,basementphotocopycenters(BPC)andgroundfloorphotocopycenters(GPC)for8h.Measurementsoflevelsofozone,UVandvisibleradiationweredonebyozoneanalyzer,UVradiometerandFieldspectrainstrument,respectively.Resultsshowthatthehourlymeanconcentrationofozonewasobservedtobeintherangeof1.8–10.0ppband5.3–45.8ppbforBPCandGPC, respectively. In termsUV radiations,energy liesbetween5.0×10−3and7.0×10−3mW/cm2forultravioletA(UVA),1.0×10−3and2.0×10−3mW/cm2forultravioletB (UVB)and6.0×10−3and8.0×10−3mW/cm2forultravioletC(UVC).Correlationbetween theUV radiationsandozoneproductionobservedwas statistically insignificant. Toknowthe health hazard occurred to theworkers, the standard erythema dose (SED) valuewas calculated for emittingUVradiation.TheSEDwasestimatedtobeintherangeof0.02–0.04and0.02–0.32fordirectandindirectmethodswhichisless than the guideline prescribed by Commission Internationale del’ Eclairage (CIE). In nutshell, person involved inphotocopyoperationfortheirlivelihoodmustbetrainedandshouldhaveknowledgeforthelongtermgradualbuilduphealthproblemsduetoozoneandUVproduction fromphotocopier.Themanufacturesshouldbeultimatedwiththesignificantozoneproduction,sothatphotocopiermachinecanberedesigned.
JournalofHazardousMaterials,Volume275,30June2014,Pages55-62,DOI:https://doi.org/10.1016/j.jhazmat.2014.04.049Source:http://www.sciencedirect.com/science/article/pii/S0304389414003112?via%3Dihub#
ForecastingDailyMaximumSurfaceOzoneConcentrationsinBruneiDarussalam—AnARIMAModelingApproachKrishanKumar,A.K.Yadav,M.P.Singh,H.Hassan&V.K.JainABSTRACTAtimeseriesapproachusingautoregressiveintegratedmovingaverage(ARIMA)modelinghasbeenusedinthisstudytoobtainmaximumdailysurfaceozone(O3)concentrationforecasts.TheorderofthefittedARIMAmodelisfoundtobe(1,0,1)forthesurfaceO3datacollectedattheairportinBruneiDarussalamduringtheperiodJuly1998–March1999.Themodel forecasts of one-day-aheadmaximumO3 concentrations have been found to be reasonably close to theobservedconcentrations.Themodelperformancehasbeenevaluatedonthebasisofcertaincommonlyusedstatisticalmeasures.TheoverallmodelperformanceisfoundtobequitesatisfactoryasindicatedbythevaluesofFractionalBias,NormalizedMeanSquareError,andMeanAbsolutePercentageErroras0.025,0.02,and13.14%respectively.IMPLICATIONS
Biogeochemistry ENVIS Vol.22(2), 2016-17
Special Issue on World Ozone Day (16th Sepetmber 2017) ‘Caring for all life under the Sun’
6
ThestudydemonstratesandreaffirmsthattheARIMAmodelingapproachcouldbeusedeffectivelyforobtainingshort-termforecastsofairquality.Particularlyinsituationswheredatalimitationsprohibittheuseofdeterministicmodelingapproaches, theARIMAmodelingapproachcouldserveasaneffective technique forobtainingO3 forecasts. Inothersituations,theoverallforecastofairqualitycouldpossiblybemoreaccurateandusefulwhenARIMAmodelingresultsare used in conjunction with the results of the deterministic models based on meteorological and other relevantvariables.
JournaloftheAir&WasteManagementAssociation,Volume54,2004-Issue7DOI:http://dx.doi.org/10.1080/10473289.2004.10470949Source:http://www.tandfonline.com/doi/abs/10.1080/10473289.2004.10470949
OzoneDistributionintheUrbanEnvironmentofDelhiduringWinterMonthsA.Singh,S.M.Sarin,P.Shanmugam,N.Sharma,A.K.Attri&V.K.JainABSTRACTMeasurementsofozone(03)andoxidesofnitrogen(NOx)werecarriedoutatsixsitesinDelhiduringthewintermonthsof 1993. Concentrations of ozone and NOx varied between 34 and 126 ppbv and 32 and 272 ppbv, respectively.Interestingly, ozone exhibited initial high levels during morning hours which subsequently declined to lower levelsaround noon. However, during evening hours a delayed build up of ozonewas observedwhich is a departure fromearlier studies. Themicro-meteorological parameters likemixing height and ventilation coefficientwere observed tofavour dispersion of the pollutants, predominantly between 1100 and 1800 hours, whereas stable atmosphericconditions between late evening to earlymorning hours seem to favour accumulation of the pollutants. The paperreportssomeunusualwinterdiurnalozonetrendsandspeculatesthepossiblereasons.
AtmosphericEnvironment[Atmos.Environ.],vol.31,no.20,pp.3421-3427,Oct1997.DOI:http://dx.doi.org/10.1016/S1352-2310(97)00138-6Source:https://www.sciencebase.gov/catalog/item/5053a3ffe4b097cd4fce9176
Evaluation of seasonal variations in abundance of BTXE hydrocarbons and theirozoneformingpotentialinambienturbanatmosphereofDehradun(India)NeetuBauri&PradipBauri&KrishanKumar&V.K.JainABSTRACTInDehradun,ambientvolatileorganiccompounds(VOC)sampleswerecollectedforthreeseasonsviz.summer,winterandmonsoon(duringperiod2012–2013)toinvestigateseasonalvariationsatfivedifferentsamplingsites.ThesampleswerequantifiedforaromaticVOCsbygaschromatography(GC-FID)tomonitorbenzene,toluene,m,p-xylene,oxyleneandethylbenzene.BTXEcomprisean importantgroupofVOCsmostlyprevalent inatypicalurbanenvironment.Theyweremonitoredbecausetheyareknowntocauseimpactsonclimate,healthandonvegetation.Toluenewasfoundtobe the most abundant VOC among the measured ones in the atmosphere of Dehradun. The maximum meanconcentration of VOCs was observed in winters and lowest during summers for BE species. Toluene ambientconcentrationwasratherfoundtoregisterhighestduringwintersandlowestinmonsoons.Kruskal–Wallistestshowedstatistically significant differences seasonally (p1) observed ratio indicates vehicular emission as their major source.BTEX were also evaluated for their ozoneforming potential (OFP). Toluene and xylenes were found as the highestcontributinghydrocarbonstowardsozoneformingpotentialamongBTXE.
AirQuality,Atmosphere,&Health;Dordrecht 9.1 (Feb2016):95-106.DOI:10.1007/s11869-015-0313-zSource:https://www.researchgate.net/publication/273338397_Evaluation_of_seasonal_variations_in_abundance_of_BTXE_hydrocarbons_and_their_ozone_forming_potential_in_ambient_urban_atmosphere_of_Dehradun_India
Biogeochemistry ENVIS Vol.22(2), 2016-17
Special Issue on World Ozone Day (16th Sepetmber 2017) ‘Caring for all life under the Sun’
7
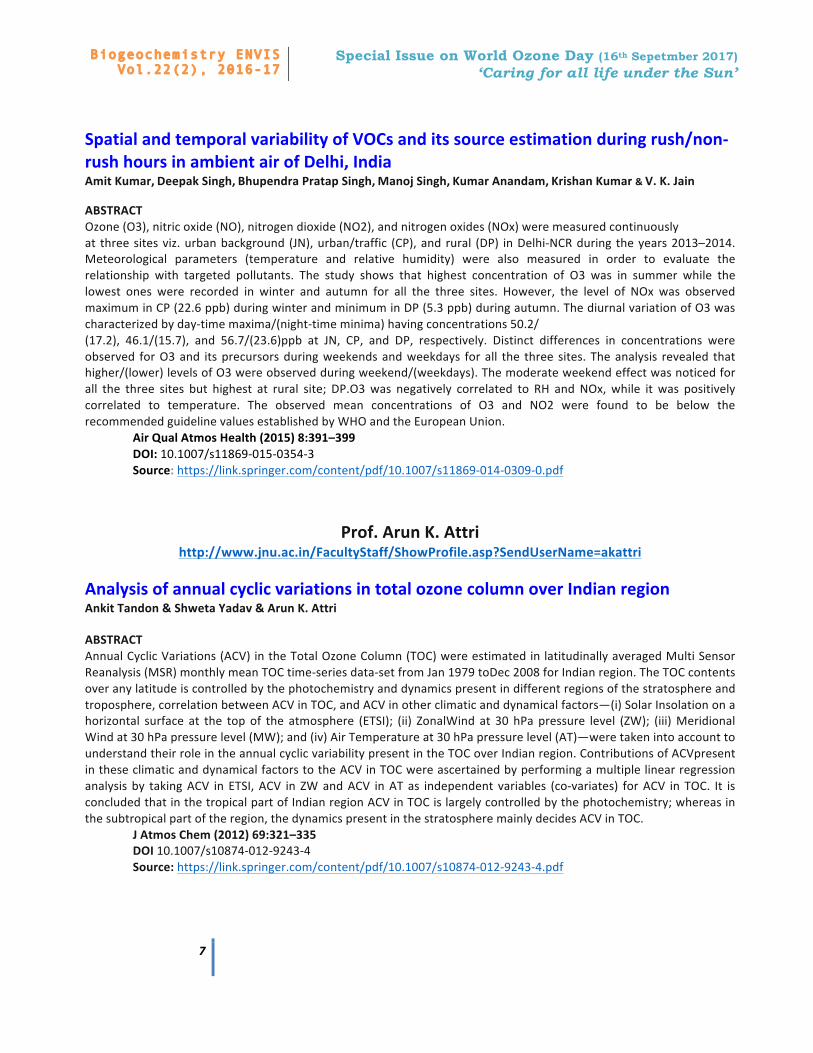
SpatialandtemporalvariabilityofVOCsanditssourceestimationduringrush/non-rushhoursinambientairofDelhi,IndiaAmitKumar,DeepakSingh,BhupendraPratapSingh,ManojSingh,KumarAnandam,KrishanKumar&V.K.JainABSTRACTOzone(O3),nitricoxide(NO),nitrogendioxide(NO2),andnitrogenoxides(NOx)weremeasuredcontinuouslyat threesitesviz.urbanbackground (JN),urban/traffic (CP),andrural (DP) inDelhi-NCRduring theyears2013–2014.Meteorological parameters (temperature and relative humidity) were also measured in order to evaluate therelationship with targeted pollutants. The study shows that highest concentration of O3 was in summer while thelowest ones were recorded in winter and autumn for all the three sites. However, the level of NOx was observedmaximuminCP(22.6ppb)duringwinterandminimuminDP(5.3ppb)duringautumn.ThediurnalvariationofO3wascharacterizedbyday-timemaxima/(night-timeminima)havingconcentrations50.2/(17.2), 46.1/(15.7), and 56.7/(23.6)ppb at JN, CP, and DP, respectively. Distinct differences in concentrations wereobserved forO3and itsprecursorsduringweekendsandweekdays forall the three sites. Theanalysis revealed thathigher/(lower)levelsofO3wereobservedduringweekend/(weekdays).Themoderateweekendeffectwasnoticedforall the three sites but highest at rural site; DP.O3was negatively correlated to RH and NOx, while it was positivelycorrelated to temperature. The observed mean concentrations of O3 and NO2 were found to be below therecommendedguidelinevaluesestablishedbyWHOandtheEuropeanUnion.
AirQualAtmosHealth(2015)8:391–399DOI:10.1007/s11869-015-0354-3Source:https://link.springer.com/content/pdf/10.1007/s11869-014-0309-0.pdf
Prof.ArunK.Attri
http://www.jnu.ac.in/FacultyStaff/ShowProfile.asp?SendUserName=akattri
AnalysisofannualcyclicvariationsintotalozonecolumnoverIndianregionAnkitTandon&ShwetaYadav&ArunK.AttriABSTRACTAnnualCyclicVariations(ACV)intheTotalOzoneColumn(TOC)wereestimatedinlatitudinallyaveragedMultiSensorReanalysis(MSR)monthlymeanTOCtime-seriesdata-setfromJan1979toDec2008forIndianregion.TheTOCcontentsoveranylatitudeiscontrolledbythephotochemistryanddynamicspresentindifferentregionsofthestratosphereandtroposphere,correlationbetweenACVinTOC,andACVinotherclimaticanddynamicalfactors—(i)SolarInsolationonahorizontal surface at the top of the atmosphere (ETSI); (ii) ZonalWind at 30 hPa pressure level (ZW); (iii)MeridionalWindat30hPapressurelevel(MW);and(iv)AirTemperatureat30hPapressurelevel(AT)—weretakenintoaccounttounderstandtheirroleintheannualcyclicvariabilitypresentintheTOCoverIndianregion.ContributionsofACVpresentintheseclimaticanddynamicalfactorstotheACVinTOCwereascertainedbyperformingamultiplelinearregressionanalysisby takingACV in ETSI,ACV in ZWandACV inATas independent variables (co-variates) forACV inTOC. It isconcludedthatinthetropicalpartofIndianregionACVinTOCislargelycontrolledbythephotochemistry;whereasinthesubtropicalpartoftheregion,thedynamicspresentinthestratospheremainlydecidesACVinTOC.
JAtmosChem(2012)69:321–335DOI10.1007/s10874-012-9243-4Source:https://link.springer.com/content/pdf/10.1007/s10874-012-9243-4.pdf
Biogeochemistry ENVIS Vol.22(2), 2016-17
Special Issue on World Ozone Day (16th Sepetmber 2017) ‘Caring for all life under the Sun’
8
Rolesofozonedepletingsubstancesandsolaractivityinobservedlong-termtrendsintotalozonecolumnoverIndianregionBikramSenSahu,AnkitTandon&ArunK.AttriABSTRACTAnadditivetime-seriesdecompositionanalysiswasperformedontheMultiSensorReanalysis-2(MSR-2)monthlymeantotalozonecolumn(TOC)time-seriesdatasetspanningover34years(January1979–December2012)forIndianregion(0.0–40.0 °N; 67.5–97.5° E). Statistically significant (p-value <0.05) long-term trends in TOC were estimated in thedeseasonalized TOC time series. The role of multiple natural and anthropogenic factors: quasi biennial oscillations(QBO),El-NinoSouthernOscillations(ENSO),cyclicvariationinsolaractivity(SA),andozonedepletingsubstances(ODS)was investigatedtoexplainthe long-termtrends inTOCover Indianregion.Oversub-tropical Indianregion(25.0°N–40.0° N), declining long-term linear trends were estimated, which varied from −0.30% to −1.10% per decade.Interestinglyapositive long-termlinear-trend(0.10–0.30%perdecade)wasobservedoverequatorial-tropicalpartofIndianregion.Nostatisticallysignificant longtermtrendwasobserved for30mbEquatorialZonalWindsandNino3.4index – indicators for QBO and ENSO; however, a positive long-term linear trend of magnitude 17.00 ± 1.18% perdecadewasobservedineffectiveequivalentstratosphericchlorine–aproxyforODS,andanegativelong-termlineartrendofmagnitude12.72±2.86%perdecadewasobservedin10.7cmSolarRadioFlux–arepresentativeforSF.Itisinferredthatover the Indianregionabovetropicofcancer,about85.00%of theestimatednegative long-term lineartrendinTOCcanbeexplainedbytheincreaseinthestratosphericconcentrationofODS;whereas,decreaseinthesolaractivityaccountedfor15.00%oftheestimatednegativelong-termlineartrendinTOCoversub-tropicalIndianregion.
InternationalJournalofRemoteSensing,38:18,5091-5105,DOI:10.1080/01431161.2017.1333654Source:http://www.tandfonline.com/doi/full/10.1080/01431161.2017.1333654
TrendsintotalozonecolumnoverIndia:1979-2008AnkitTandon,ArunK.AttriABSTRACTTime-series decomposition analysiswas performedon, (1)Multi Sensor Reanalysis (MSR) TotalOzoneColumn (TOC)monthly mean time-series data-set [1979e2008], and (2) Total Ozone Mapping Spectrometer (TOMS) Version 8Overpassmonthlymean time-seriesdata-set fromNimbus7 satellite, (TOMSN7) [1979e1993] toestimate long-termlineartrendsinthedatatoassessascaleofsurfaceUVchangesoverIndia.Long-termtrendestimation,subsequenttotheremovalofannualcyclicvariations,forMSRTOCdata-setwasdoneoverIndianregioncoveringlatitudespread0_Ne40_N, and Longitude spread67.5_E to97.5_E. Trendestimates for TOMSOverpassdata-sets, treatedon similarlines,wasdone for fifteen locationsover India (1_190N to34_040N). Statistically significantdeclining trends rangingfrom (_) 0.8 e (_) 1.5 percent/decade were seen over Indian region above 25_ N latitude in MSR TOC data-set(1979e2008). In caseof TOMSN7data-set (1979e1993), statistically significantdeclining trendswereestimatedoverNewDelhi(28_400N)andSrinagar(34_040N)withavalueof(_)2.5and(_)3.6percent/decaderespectively.ObservedTOCdeclinecovered40%oftotalgeographicalareaofIndianregion,howeverrestoftheIndianregion(peninsular)didnotshowstatisticallyanysignificanttrend.
AtmosphericEnvironment,Volume45,Issue9,March2011,Pages1648-1654DOI:10.1016/j.atmosenv.2011.01.008Source:http://www.sciencedirect.com/science/article/pii/S135223101100015X?via%3Dihub

BOOKPOSTT0
-----------------------------------------------------------------------
-----------------------------------------------------------------------Ifundeliveredpleasereturnto:TheCoordinator---------------------------------------------------------------------------------ENVISCenteronBiogeochemistrySchoolofEnvironmentalSciences---------------------------------------------------------------------------------JawaharlalNehruUniversityNewDelhi-110067Contact:011-26704315,26704302