the environmental impact of industrial bamboo products: lifecycle assessment and carbon...
TRANSCRIPT

1-12-2015
The Environmental Impact of
Industrial Bamboo ProductsLife-cycle Assessment and Carbon
Sequestration
Pablo van der Lugt - MSc Eng PhD
MOSO International / Delft University of Technology

1-12-2015
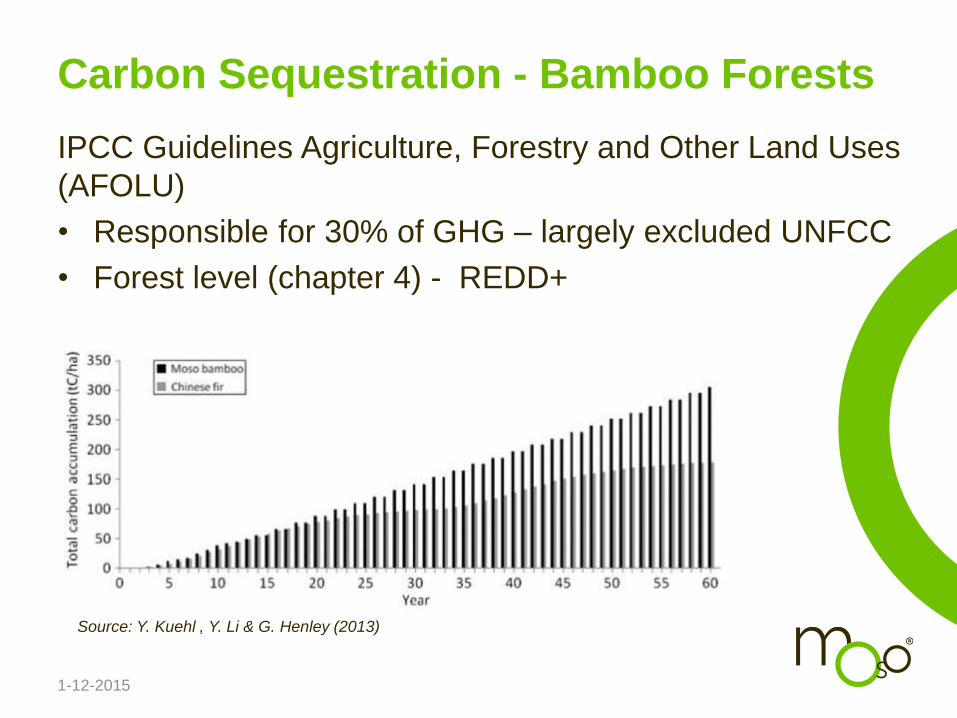
Carbon Sequestration - Bamboo Forests
IPCC Guidelines Agriculture, Forestry and Other Land Uses
(AFOLU)
• Responsible for 30% of GHG – largely excluded UNFCC
• Forest level (chapter 4) - REDD+
1-12-2015
Carbon Sequestration - Bamboo Forests
IPCC Guidelines Agriculture, Forestry and Other Land Uses
(AFOLU)
• Responsible for 30% of GHG – largely excluded UNFCC
• Forest level (chapter 4) - REDD+
Source: Y. Kuehl , Y. Li & G. Henley (2013)

1-12-2015
Carbon Sequestration - Durable Products
IPCC Guidelines Agriculture, Forestry and Other Land Uses
(AFOLU)
• Responsible for 30% of GHG – largely excluded UNFCC
• Forest level (chapter 4) - REDD+
• Durable Products Pool (chapter 12)
1-12-2015
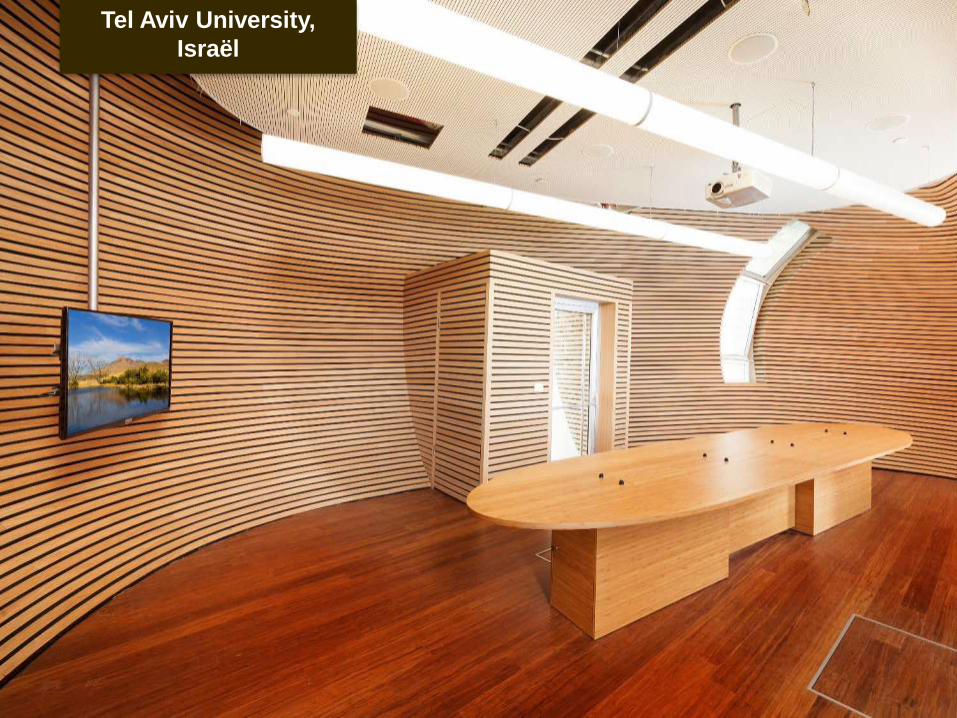
Tel Aviv University,
Israël

1-12-2015
ACG Glass Head Office,
Belgium

1-12-2015
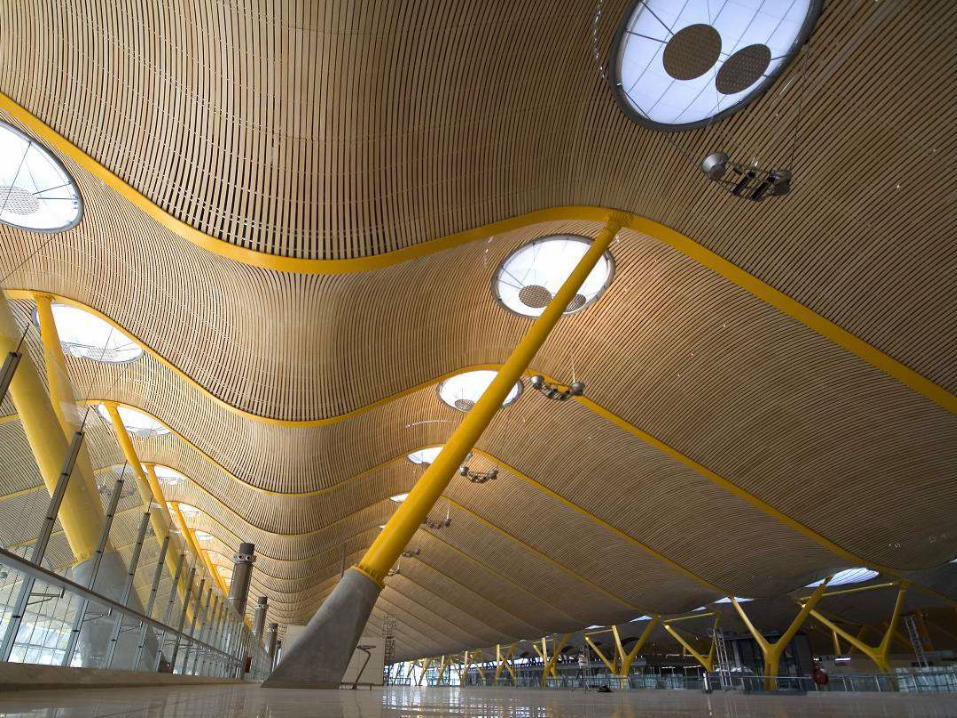
Madrid International
Airport, Spain
1-12-2015
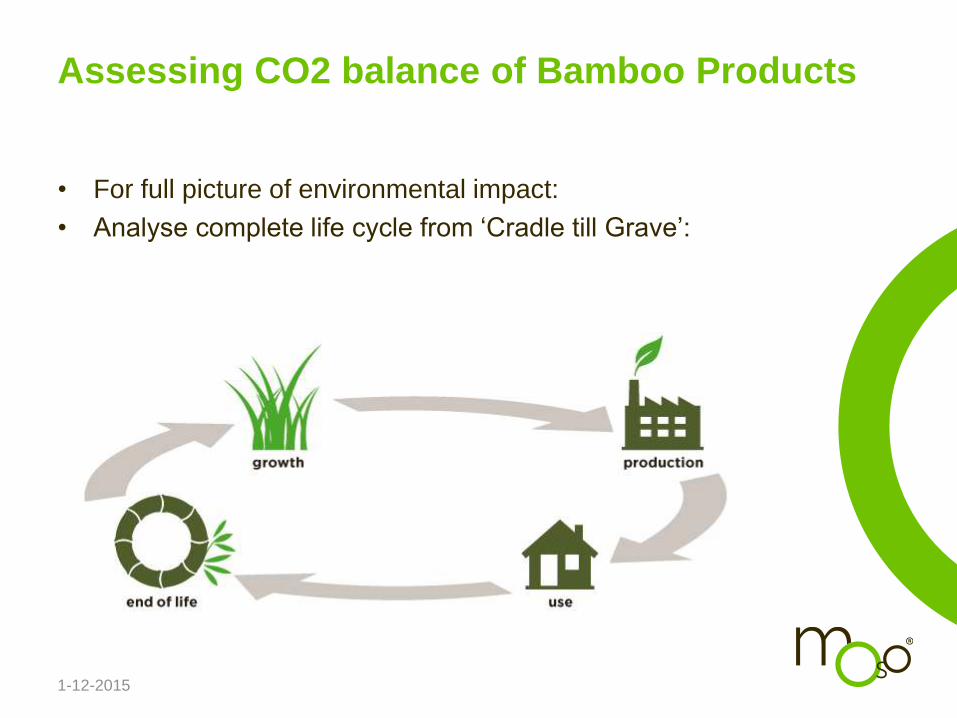
Assessing CO2 balance of Bamboo Products
• For full picture of environmental impact:
• Analyse complete life cycle from ‘Cradle till Grave’:

1-12-2015
Measuring environmental impact
• Based on MOSO production chain – best practice
• 2010: LCA & carbon footprint executed by TU Delft
• 2015: Update (new products, latest production figures)
• ISO 14040 & 14044 compliant

1-12-2015
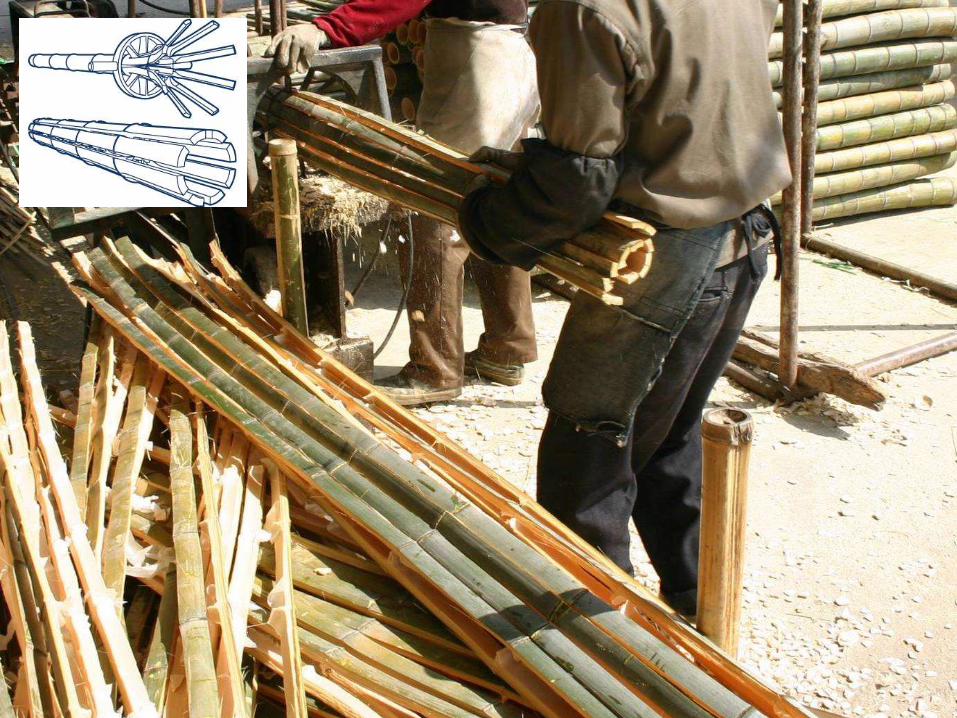

10. Pressing (1)

10. Pressing (2)


1-12-2015

1-12-2015
1-12-2015
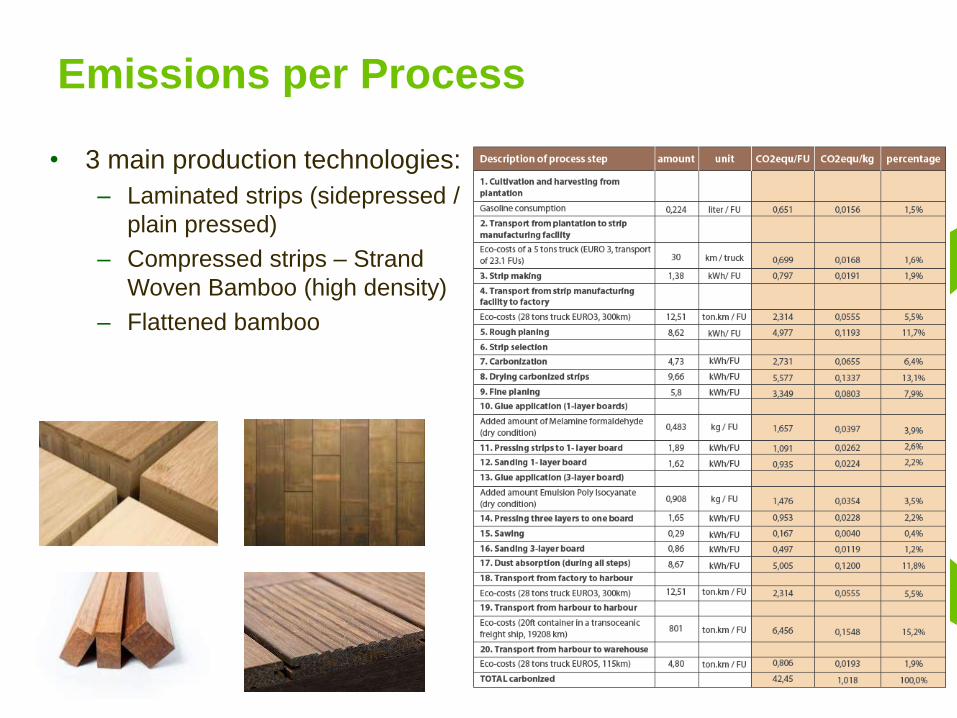
Emissions per Process
• 3 main production technologies:
– Laminated strips (sidepressed /
plain pressed)
– Compressed strips – Strand
Woven Bamboo (high density)
– Flattened bamboo

1-12-2015
production
bamboo
use
MOSO
CO2 CO2
Captured CO2
End of Lifebamboo
plantation
waste
electricity
Fossil fuels
(oil, gas, etc)electricity
Carbon Sequestration – Product level

1-12-2015
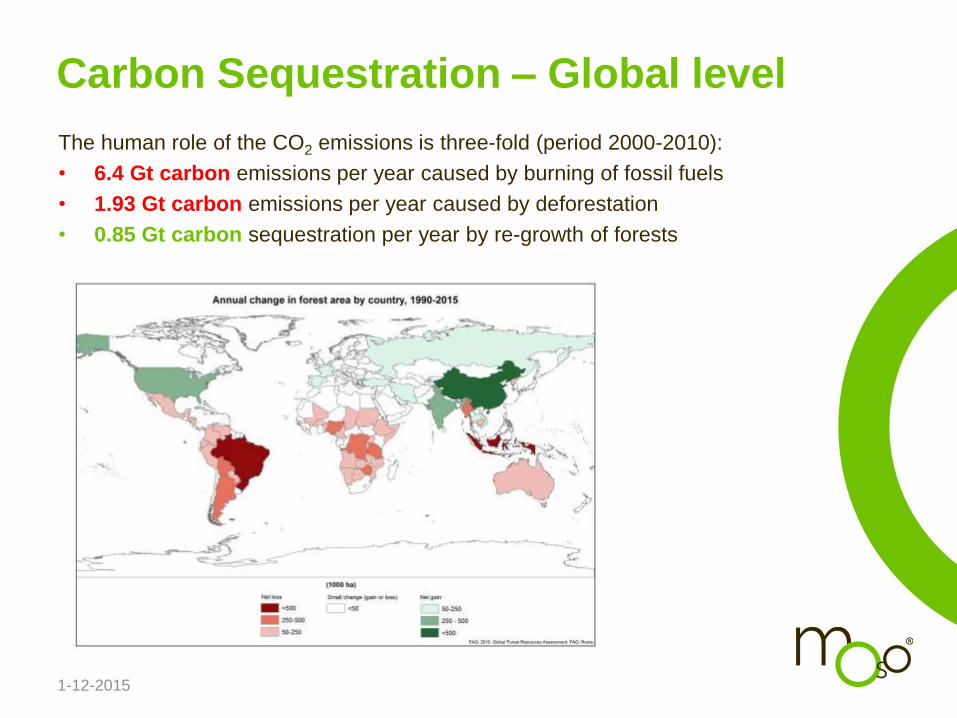
Carbon Sequestration – Global level
The human role of the CO2 emissions is three-fold (period 2000-2010):
• 6.4 Gt carbon emissions per year caused by burning of fossil fuels
• 1.93 Gt carbon emissions per year caused by deforestation
• 0.85 Gt carbon sequestration per year by re-growth of forests
1-12-2015
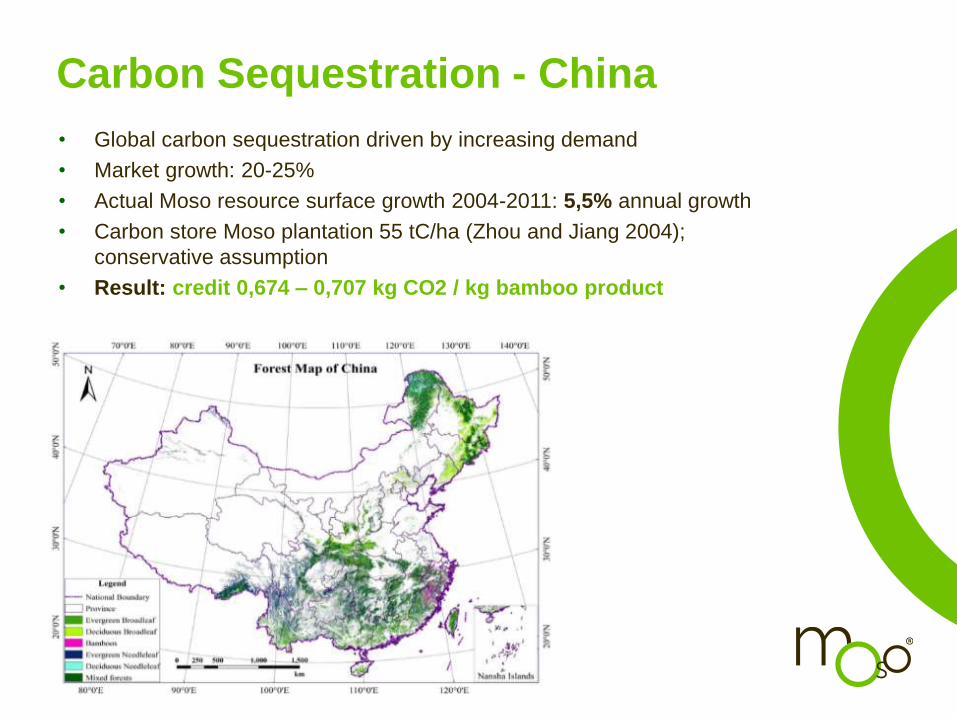
Carbon Sequestration - China
• Global carbon sequestration driven by increasing demand
• Market growth: 20-25%
• Actual Moso resource surface growth 2004-2011: 5,5% annual growth
• Carbon store Moso plantation 55 tC/ha (Zhou and Jiang 2004);
conservative assumption
• Result: credit 0,674 – 0,707 kg CO2 / kg bamboo product

1-12-2015
• CO2 neutral over full life cycle (all solid bamboo materials)
• Credits for carbon sequestration and green electricity production
compensate emissions by transport, energy and glue
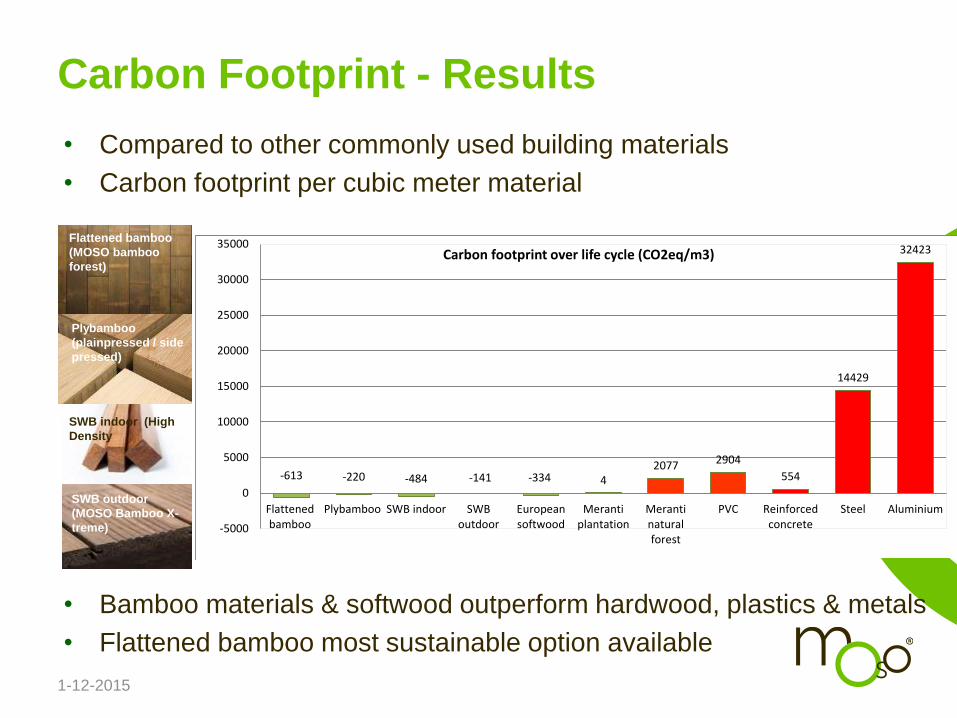
Carbon Footprint - Results
Flattened bamboo
(MOSO bamboo forest)
Plybamboo
(plainpressed / side
pressed)
SWB outdoor (MOSO
Bamboo X-treme)
SWB indoor (High
Density
-0,800
-0,600
-0,400
-0,200
0,000
0,200
0,400
0,600
0,800
Carbon footprint over life cycle (CO2eq / kg product)
Flattened bamboo (flooring)
Plybamboo (3ply panel, PP, C)
SWB indoor (beam, N)
SWB outdoor (decking)
1-12-2015
• Compared to other commonly used building materials
• Carbon footprint per cubic meter material
• Bamboo materials & softwood outperform hardwood, plastics & metals
• Flattened bamboo most sustainable option available
Carbon Footprint - Results
Flattened bamboo
(MOSO bamboo
forest)
Plybamboo
(plainpressed / side
pressed)
SWB outdoor
(MOSO Bamboo X-
treme)
SWB indoor (High
Density
-613 -220 -484 -141 -334 42077 2904
554
14429
32423
-5000
0
5000
10000
15000
20000
25000
30000
35000
Flattenedbamboo
Plybamboo SWB indoor SWBoutdoor
Europeansoftwood
Merantiplantation
Merantinaturalforest
PVC Reinforcedconcrete
Steel Aluminium
Carbon footprint over life cycle (CO2eq/m3)
1-12-2015
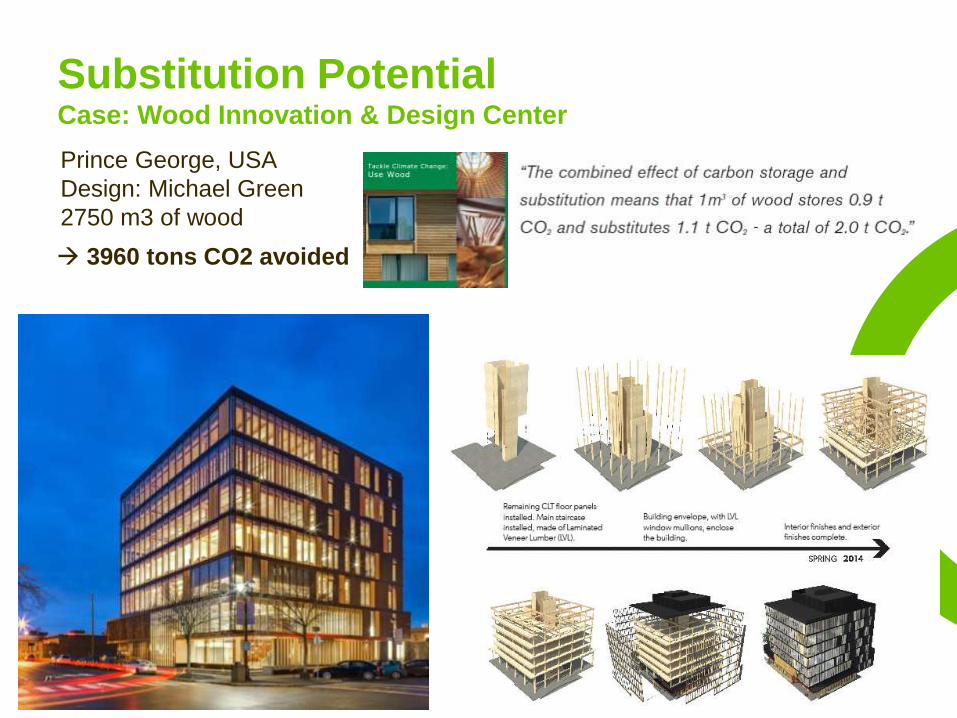
Substitution Potential Case: Wood Innovation & Design Center
Prince George, USA
Design: Michael Green
2750 m3 of wood
3960 tons CO2 avoided

1-12-2015
• Compared to other commonly used building materials
• Carbon footprint per cubic meter material
• Bamboo materials & softwood outperform hardwood, plastics & metals
• Flattened bamboo most sustainable option available
Carbon Footprint - Results
Flattened bamboo
(MOSO bamboo
forest)
Plybamboo
(plainpressed / side
pressed)
SWB outdoor
(MOSO Bamboo X-
treme)
SWB indoor (High
Density
-613 -220 -484 -141 -334 42077 2904
554
14429
32423
-5000
0
5000
10000
15000
20000
25000
30000
35000
Flattenedbamboo
Plybamboo SWB indoor SWBoutdoor
Europeansoftwood
Merantiplantation
Merantinaturalforest
PVC Reinforcedconcrete
Steel Aluminium
Carbon footprint over life cycle (CO2eq/m3)
1-12-2015
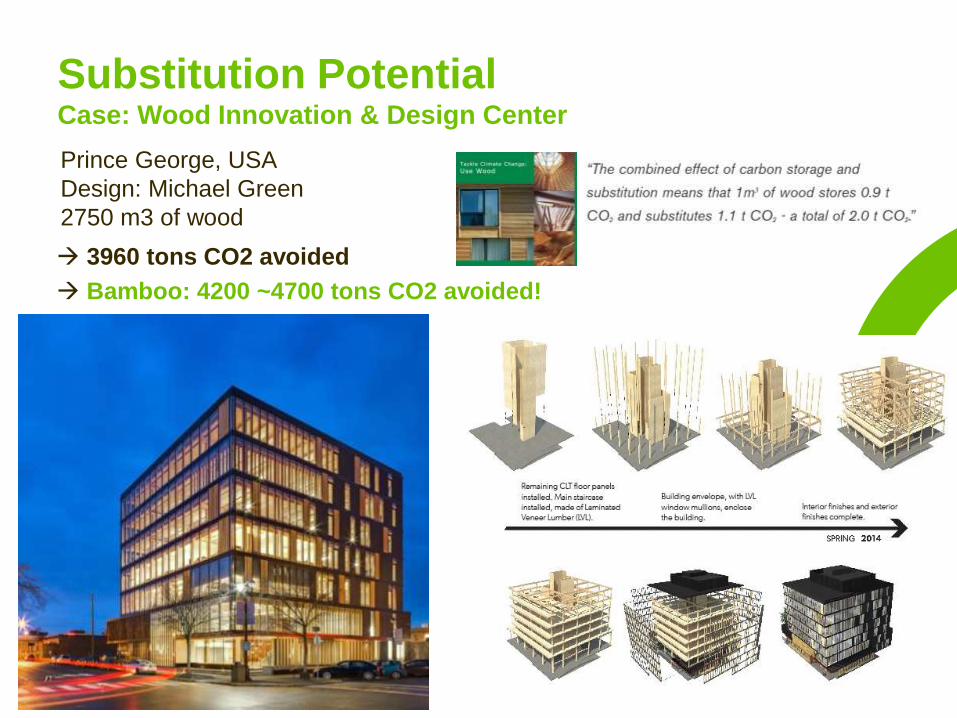
Substitution Potential Case: Wood Innovation & Design Center
Prince George, USA
Design: Michael Green
2750 m3 of wood
3960 tons CO2 avoided
Bamboo: 4200 ~4700 tons CO2 avoided!
1-12-2015
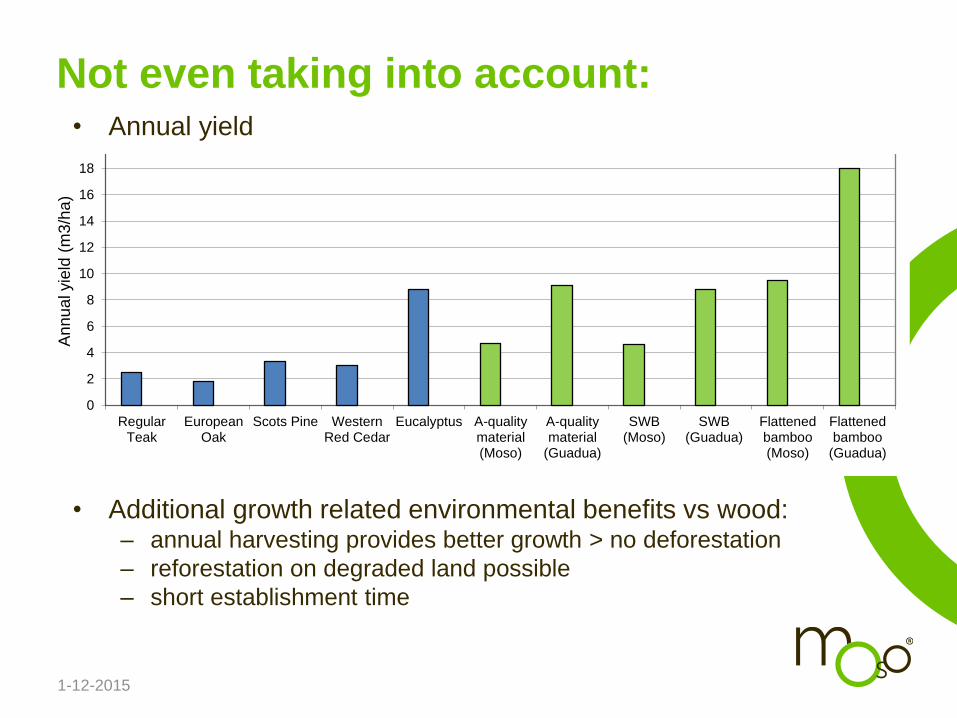
Not even taking into account:• Annual yield
• Additional growth related environmental benefits vs wood: – annual harvesting provides better growth > no deforestation
– reforestation on degraded land possible
– short establishment timeh
0
2
4
6
8
10
12
14
16
18
20
RegularTeak
EuropeanOak
Scots Pine WesternRed Cedar
Eucalyptus A-qualitymaterial(Moso)
A-qualitymaterial
(Guadua)
SWB(Moso)
SWB(Guadua)
Flattenedbamboo(Moso)
Flattenedbamboo
(Guadua)
An
nu
al yie
ld (
m3
/ha
)

1-12-2015
Bamboo Growing Area

1-12-2015
Bamboo’s Potential for Climate Change Mitigation
• Forest level reforestation degraded land
• Durable Products Pool rapidly renewable, carbon
negative substitute for carbon intensive materials

1-12-2015
Bamboo’s Potential for Climate Change Mitigation
Needs:
• Clear recognition bamboo within UNFCC framework
– Compliance market (e.g. via CDM, REDD+?)
– Voluntary market (e.g. VCS, Gold standard, etc)
• Explicit inclusion in national & international forestry
standards and definitions (often outside scope)

1-12-2015
More information?
• INBAR Technical Report no. 35
1-12-2015

1-12-2015
Points for improvement
• Energy (52-63%):
• Higher energy efficiency; e.g. co-generation electricity & heat
• Sustainable energy; e.g. PV panels on factory
• Transport
• International (15-25%): closer sourcing (e.g. Africa, Latin America)
• National (10%): larger and more efficient trucks (e.g. EURO 5)
• Resins (3-16%)
• More formaldehyde free resins (e.g. EPI)
• Use of fully biobased resins