the employee engagement in nursing industry: a …
TRANSCRIPT

Group number: 3
THE EMPLOYEE ENGAGEMENT IN NURSING INDUSTRY:
A STUDY ON HOSPITAL-BASED NURSES
BY
HEW HUI YING
KONG PEI SHIN
MOY XUE MIN
NG LAI YEN
NG SIEW SIEW
A research project submitted in partial fulfillment of the requirement
for the degree of
BACHELOR OF BUSINESS ADMINISTRATION (HONS)
UNIVERSITI TUNKU ABDUL RAHMAN
FACULTY OF BUSINESS AND FINANCE
DEPARTMENT OF BUSINESS
AUGUST 2013

ii
Copyright @ 2013
ALL RIGHTS RESERVED. No part of this paper may be reproduced, stored in a
retrieval system, or transmitted in any form or by any means, graphic, electronic,
mechanical, photocopying, recording, scanning, or otherwise, without the prior
consent of the authors.

iii
DECLARATION
We hereby declare that:
1) This undergraduate research project is the end result of our own work and that
due acknowledgement has been given in the references to ALL sources of
information be they printed, electronic, or personal.
2) No portion of this research project has been submitted in support of any
application for any other degree or qualification of this or any other university,
or other institutes of learning.
3) Equal contribution has been made by each group member in completing the
research project.
4) The word count of this research report is 22,825.
Name of Student: Student ID: Signature:
1. HEW HUI YING 11ABB00331
2. KONG PEI SHIN 11ABB00207
3. MOY XUE MIN 11ABB00129
4. NG LAI YEN 11ABB00274
5. NG SIEW SIEW 11ABB00208
Date: 15th
AUGUST 2013
iv
ACKNOWLEDGEMENT
This research project was made possible with the help and support of many people.
First of all, we would like to express our sincere gratitude and appreciation to our
supervisor, Ms. Azeyan bt Awee who guides, supports and assists us throughout the
entire research. She helped us a lot by providing usefulness comment and valuable
feedback. Without her supervision, we might not be able to complete our research
report on time.
Besides that, we would like to thank Universiti Tunku Abdul Rahman (UTAR) for
providing us with a good environment and facilities to complete this project. By
conducting this project, we are able to build up cohesiveness among team members
and able to do task collaborative. In addition, a very special thanks to our parents for
their continuous support and encouragement throughout the studies.
Other than that, we appreciate all respondents who spent their precious time and
patience in helping us in filling out the questionnaire. Without their honest
contribution, it would be impossible for us to complete this research project. Their
cooperation has made our work easier in the form of collecting and analyzing data.
Last but not least, gratefulness also paid to our group members since we have fully
cooperated with each other and willing to sacrifice our valuable time during the
whole journey in order to complete our research project. Once again, we would like to
dedicate a special thanks to all the people who assist us in our research project.

v
DEDICATION
Dedicated to:
Ms. Azeyan bt. Awee
Dear supervisor who is supportive and able to guide and lead us to the right path in
the process of this study.
Universiti Tunku Abdul Rahman (UTAR)
For giving us the opportunity to conduct this research project.
Hew, Kong, Moy, Ng L and Ng S‟s families.
Dear researchers‟ supportive families who are always there to support us mentally
and financially. Your supports give us strength and motivation to carry out this study.
Respondents
To 150 respondents who are willing to spend their precious time for helping us to
complete the questionnaires for this research study.
vi
TABLE OF CONTENTS
Page
Copyright……………………………………………………………...……………....ii
Declaration…………………………………………………………..………………..iii
Acknowledgement……………………………………………………..……………..iv
Dedication……………………………………………………………...……………...v
Table of Contents……………………………………………………..……………....vi
List of Tables………………………………………………………………………..xiv
List of Figures………………………………………………………………………xvii
List of Abbreviations………………………………………………………………xviii
List of Appendices…………………………………………………………………..xix
Preface…………………………………………………………………….………….xx
Abstract……………………………………………………………………………...xxi
CHAPTER 1: INTRODUCTION……………………………………….……………1
1.0 Introduction……………………………………….…………………...1
1.1 Research Background…………………………………………………1
1.2 Problem Statement………………………………………..….…....…..4
1.3 Research Objectives………………………………………..….………7
1.3.1 General Objective..……………………………….….………..7
1.3.2 Specific Objectives……………………………….….………..8

vii
1.4 Research Questions…………………………………..……….…….…9
1.5 Hypotheses of the Study…………………………………….…...…..10
1.6 Significance of the Study………………………………….……...….13
1.6.1 Organization Perspective……………………………….…....13
1.6.2 Nursing Perspective…………………………………….....…14
1.6.3 Researcher Perspective……………………………….……...14
1.6.4 Individual Perspective………………………………….…….15
1.7 Chapter Layout………………………………………………...…......16
1.8 Conclusion…………………………………………………….….….18
CHAPTER 2: LITERATURE REVIEW……………………………………….…...19
2.0 Introduction………………………………………….………..…...…19
2.1 Review of the Literature…………………………………….……….19
2.1.1 Employee Engagement…………………….………………...19
2.1.2 Perceived Supervisor Support………………………….…….27
2.1.3 Perceived Organization Support……………………..………30
2.1.4 Procedural Justice………………………………………...….32
2.1.5 Reward and Recognition………………………….…..……...35
2.1.6 Self-efficacy………………………………………….…..…..36
2.2 Review of Relevant Theoretical Models……………………...……...39
2.2.1 Saks, A.M. and Rotman, J.K. (2006)……………...….….......39
viii
2.2.2 Karatepe, O.M. and Olugbade, O.A. (2009)………..….….....41
2.2.3 Bakker, A.B. and Demerouti, E. (2008)……………….…….43
2.3 Proposed Theoretical / Conceptual Framework……………….…...45
2.4 Hypotheses Development……………………………………..…......46
2.4.1 Relationship between Perceived Supervisor Support
and Employee Engagement……………………….……..…...46
2.4.2 Relationship between Perceived Organization Support
and Employee Engagement…………………………..……....48
2.4.3 Relationship between Procedural Justice
and Employee Engagement…………………………..…........50
2.4.4 Relationship between Reward and Recognition
and Employee Engagement…………………………..………51
2.4.5 Relationship between Self-efficacy
and Employee Engagement…………………………..………53
2.5 Conclusion……………………………………………………….…..54
CHAPTER 3: RESEARCH METHODOLOGY………………………..……...…....55
3.0 Introduction……………………………………………...…….…......55
3.1 Research Design……………………………………………..…….....55
3.2 Data Collection Methods………………………………..…....…...…56
3.2.1 Primary Data………………………………….……...…..…..57
3.2.2 Secondary Data……………………………..….……..……...58
3.3 Sampling Design………………………………………………..……59

ix
3.3.1 Target Population……………………………………….........59
3.3.2 Sampling Frame and Sampling Location……….……......…..60
3.3.3 Sampling Elements…………………………………….…….60
3.3.4 Sampling Techniques………………………………….....…..61
3.3.5 Sampling Size…………………………………….………….61
3.4 Research Instrument………………………………...…….…….…....62
3.4.1 Questionnaire Survey………………………………..…....….62
3.4.2 Questionnaire Design……………………………..…….…....63
3.4.3 Distribution Method………………………………..…....…...64
3.4.4 Reason for Sampling……………………………..………..…65
3.4.5 Pilot Studies…………………………………….…...…….....65
3.5 Constructs Measurement……………………………………........…..70
3.5.1 Origins of Construct…………………………………..….…..70
3.5.1.1 Modified Operational Definition of Construct….…...71
3.5.2 Scale Measurement………………………………………......83
3.5.2.1 Nominal Scale………………………..…………....…84
3.5.2.2 Ordinal Scale…………………………..……......…....84
3.5.2.3 Interval Scale…………………………………….…..84
3.5.2.4 Ratio Scale………………………………….………..85
3.6 Data Processing…………………………………………………..…..85
3.6.1 Data Processing…………………………………………..…..86

x
3.6.1.1 Data Checking………………………………..………86
3.6.1.2 Data Editing……………………………………….…86
3.6.1.3 Data Coding………………………………………….87
3.6.1.4 Data Transcribing……………………………….……88
3.6.1.5 Data Transformation…………………………………88
3.7 Data Analysis…………………………………………..…………….89
3.7.1 Descriptive Analysis…………………………………..….….89
3.7.2 Scale Measurement………………………………….……….90
3.7.3 Inferential Analysis…………………………………....……..91
3.8 Conclusion………………………………………………….…..……91
CHAPTER 4: RESEARCH RESULTS………………………….………..………...93
4.0 Introduction…………………………………..…………….………...93
4.1 Descriptive Analysis………………………………………...…….…93
4.1.1 Respondent Demographic Profile…………………..……......93
4.1.1.1 Gender………………………………………….….…94
4.1.1.2 Age………………………………………………..….95
4.1.1.3 Nationality…………………………………….….......97
4.1.1.4 Race…………………………………………..…....…98
4.1.1.5 Monthly Income……………………………..…...…100
4.1.1.6 Education Level…………………………...………..102
xi
4.1.1.7 Experience…………………………………………..104
4.1.2 Central Tendencies Measurement of Constructs…………...106
4.1.2.1 Perceived Supervisor Support………………………106
4.1.2.2 Perceived Organization Support…………….......….108
4.1.2.3 Procedural Justice……………………………...…...110
4.1.2.4 Reward and Recognition……………………………113
4.1.2.5 Self-efficacy………………………………………...115
4.1.2.6 Employee Engagement………………………...…...117
4.2 Scale Measurement…………………………………………...…….120
4.3 Inferential Analyses…………………………………………...…....123
4.3.1 Pearson‟s Correlation Coefficient…………………..………124
4.3.1.1 Relationship between Perceived Supervisor
Support and Employee Engagement…......................125
4.3.1.2 Relationship between Perceived Organization
Support and Employee Engagement…….……..…...127
4.3.1.3 Relationship between Procedural Justice
and Employee Engagement………………………....129
4.3.1.4 Relationship between Reward and Recognition
and Employee Engagement……………………...….131
4.3.1.5 Relationship between Self-efficacy
and Employee Engagement……………………...….133
4.3.2 Multiple Linear Regression Analysis……………………….135
xii
4.3.2.1 Relationship between Perceived Supervisor
Support, Perceived Organization Support,
Procedural Justice, Reward and Recognition,
and Self-efficacy with Employee Engagement……..135
4.4 Conclusion…………………………………………………...….….141
CHAPTER 5: DISCUSSION AND CONCLUSION………………...……………142
5.0 Introduction…………………………………………….………..….142
5.1 Summary of Statistical Analyses………………………………..….142
5.1.1 Descriptive Analysis………………..………………………143
5.1.1.1 Respondent Demographic Profile…………….…….143
5.1.2 Central Tendencies Measurement of Constructs…………...144
5.1.3 Scale Measurement………………………………..………..146
5.1.3.1 Reliability Test…………………………..………….146
5.1.4 Inferential Analyses………………………………...………146
5.1.4.1 Pearson Correlation Coefficient………………....….147
5.1.4.2 Multiple Regression Analysis………………………147
5.2 Discussions of Major Findings………………………………...….149
5.2.1 Perceived Supervisor Support…………………………..…..150
5.2.2 Perceived Organization Support……………..……………..151
5.2.3 Procedural Justice…………………………………………..152
5.2.4 Reward and Recognition……………………………….…...153

xiii
5.2.5 Self-efficacy………………………………….………......…154
5.3 Implications of the Study………………………………….….…….156
5.3.1 Managerial Implications……………………………...….....156
5.4 Limitations of the Study………………………………..….…...…158
5.5 Recommendations for Future Research………………….…………159
5.6 Conclusion……………………………………...…………...…...…160
References……………………………………………………………………....…..161
Appendices…………………………………………………………………..….…..176

xiv
LIST OF TABLES
Page
Table 2.1: Definition of Employee Engagement……………………...………....23
Table 3.1: Internal Consistency (Cronbach‟s Alpha)………………………........66
Table 3.2: Reliability Analysis……………………………………………...…...66
Table 3.3: The Origins of Construct in the Research............................................70
Table 3.4: Modified Operational Definition of Construct forPerceived Supervisor
Support………………………………...……………………..………71
Table 3.5: Modified Operational Definition of Construct for Perceived
Organization Support…………………………………..……….…….72
Table 3.6: Modified Operational Definition of Construct for Procedural
Justice……………………………...………………………...……….74
Table 3.7: Modified Operational Definition of Construct for Reward and
Recognition……………………………………………………….….76
Table 3.8: Modified Operational Definition of Construct for Self-efficacy…….77
Table 3.9: Modified Operational Definition of Construct for Employee
Engagement…………………………………………………..………79
Table 3.10: Coefficient Alpha Ranges....................................................................90
Table 4.1: Gender………………………………………………………………..94
Table 4.2: Age…………………………………………………………………...95
Table 4.3 Nationality……………………………………………………………97
Table 4.4: Race…………………………………………………………………..98
Table 4.5: Income Level…………………………………………………….…100

xv
Table 4.6: Education Level………………………………………………….…102
Table 4.7: Experience………………………………………………….……….104
Table 4.8: Central Tendencies Measurement of Perceived Supervisor
Support…………………………………………………….………..106
Table 4.9: Central Tendencies Measurement of Perceived Organization
Support……………………………………………………….……..108
Table 4.10: Central Tendencies Measurement of Procedural Justice…………...110
Table 4.11: Central Tendencies Measurement of Reward and Recognition…….113
Table 4.12: Central Tendencies Measurement of Self-efficacy…………………115
Table 4.13: Central Tendencies Measurement of Employee Engagement……...117
Table 4.14: Cronbach‟s Coefficient Alpha (α)…………………………….…….121
Table 4.15: Summary of Reliability Analysis…………………………………...121
Table 4.16: Rules of Thumb about Pearson Correlation Coefficient size……….124
Table 4.17: Correlation between Perceived Supervisor Support (PSS) and
Employee Engagement (EE)………………………………………..125
Table 4.18: Correlation between Perceived Organization Support (POS) and
Employee Engagement (EE)………………………………………..127
Table 4.19: Correlation between Procedural Justice (PJ) and Employe e
Engagement (EE)…………………………………………………...129
Table 4.20: Correlation between Reward and Recognition (RR) and Employee
Engagement (EE)…………………………………………………...131
Table 4.21: Correlation between Self-efficacy (SE) and Employee Engagement
(EE)…………………………………………………………………133

xvi
Table 4.22: Analysis of Variance………………………………………………..136
Table 4.23: Model Summary of R-Square………………………………………137
Table 4.24: Parameter Estimates………………………………………………...138
Table 5.1: Summary of Central Tendencies Measurement…………………….144
Table 5.2: Summary of Hypotheses Testing Results………………………..…149

xvii
LIST OF FIGURE
Page
Figure 2.1: A Model of Antecedents and Consequences of Employee
Engagement……………………….…………………………….........39
Figure 2.2: Research model……………………………….……………………...41
Figure 2.3: The JD-R Model of Work Engagement........................................…...43
Figure 2.4: Model of Proposed Framework………………………………..…….45
Figure 4.1: Distribution of Gender……………………………….…………...….94
Figure 4.2: Distribution of Age………………………………………….…….…96
Figure 4.3: Distribution of Nationality…………………………………….…..…97
Figure 4.4: Distribution of Race………………………………………………...99
Figure 4.5: Distribution of Income Level…………………………………...…..101
Figure 4.6: Distribution of Education Level……………………………….……103
Figure 4.7: Distribution of Experience……………………………………….…105
xviii
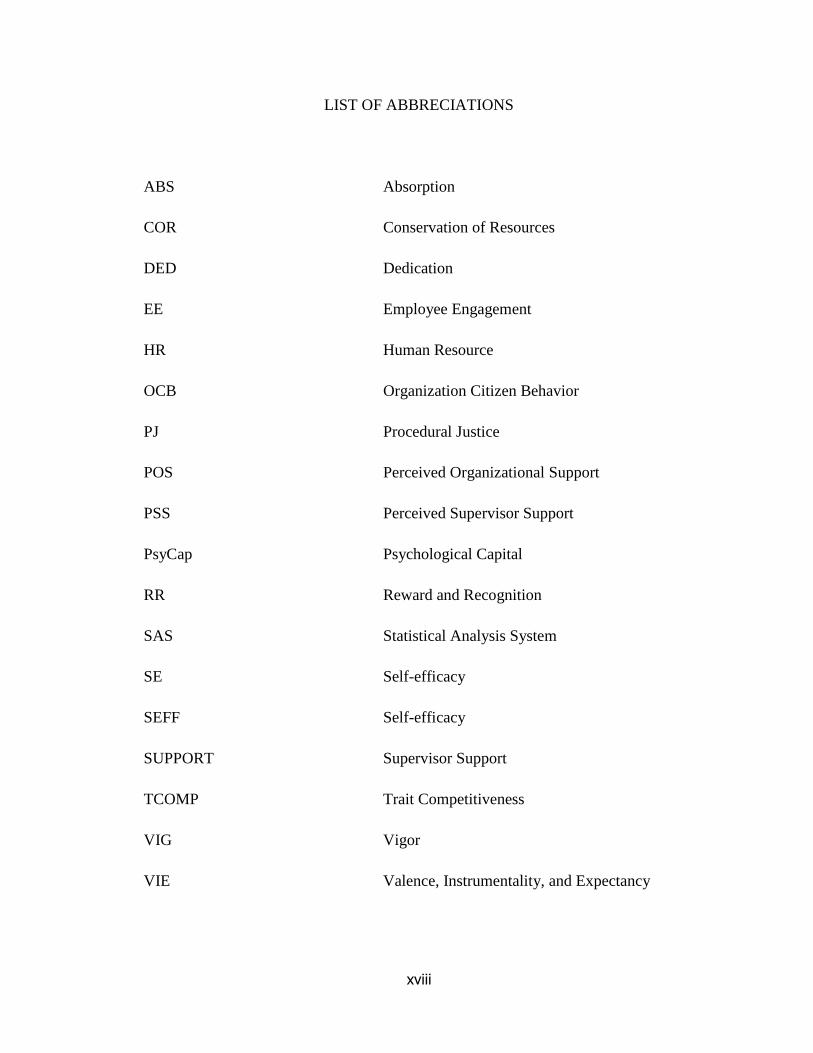
LIST OF ABBRECIATIONS
ABS Absorption
COR Conservation of Resources
DED Dedication
EE Employee Engagement
HR Human Resource
OCB Organization Citizen Behavior
PJ Procedural Justice
POS Perceived Organizational Support
PSS Perceived Supervisor Support
PsyCap Psychological Capital
RR Reward and Recognition
SAS Statistical Analysis System
SE Self-efficacy
SEFF Self-efficacy
SUPPORT Supervisor Support
TCOMP Trait Competitiveness
VIG Vigor
VIE Valence, Instrumentality, and Expectancy

xix
LIST OF APPENDICES
Page
Appendix 1.1: Nursing Population in Malaysia………………………………..…...176
Appendix 3.1: Questionnaire……………………………………………………….178
Appendix 3.2: Pilot Test……………………………………………………………186
Appendix 4.1: Descriptive Analysis………………………………………………..192
Appendix 4.2: Full Study Reliability Test………………………………………….199
Appendix 4.3: Pearson Correlation Analysis……………………………………….205
Appendix 4.4: Multiple Regression Analysis…………………...………………….206

xx
PERFACE
This report was written in completion of Bachelor of Business Administration
(HONS) Final Year Project (FYP) at Universiti Tunku Abdul Rahman (UTAR). This
report was a research project carried out by the students to determine the factors that
contribute to the employee engagement which have beneficial impacts on the
business outcomes. The research project aims to study on the relationship between
perceived supervisor support, perceived organization support, procedural justice,
reward and recognition, self-efficacy and employee engagement among hospital-
based nurses.
For the past few decades, researchers have been focused on the role of subjective
work issues and their impact on important worker-related outcomes. However, in
attempting to manage today‟s organization, management should not only focus on the
profit but need to consider more on the employee because employee is the most
valuable asset and plays an important role in the organization in order to survive in
the high competitive environment.
Upon completion of this study, the relationship between perceived supervisor support,
perceived organization support, procedural justice, reward and recognition, and self-
efficacy with the employee engagement among hospital-based nurses will be
identified and established. Hopefully this study can provide the management a better
understanding of the relationship of employee engagement and at the same time can
assists the future academicians or practitioners to gain a better understanding of
employee engagement and how it influences the employees to engage to the
organization in nursing industry.
In addition, this research is also committed to any organizations which faced the same
problem and aiming to offer some useful information to the management of
organization in formulating effective strategies to cope with the problem and boost up
its employee engagement level.

xxi
ABSTRACT
The study investigates the relationship between perceived supervisor support,
perceived organization support, procedural justice, reward and recognition, self-
efficacy and employee engagement among hospital-based nurses. The research
focuses on hospital nurses both from private and public hospital in Kedah, Penang
and Perak. Statistical Analysis System (SAS) version 5.1 had been used in order to
run the reliability analysis, frequency analysis, explaining the correlation coefficient
analysis and test of hypothesized relationships among the dependent variable and the
independent variables. The results of analysis confirmed that positive correlation
exists between the perceived supervisor support, perceived organization support,
procedural justice, reward and recognition, self-efficacy and employee engagement.
This study is believed to enhance the literature gap since not much research
emphasize on employee engagement of nurses on Malaysian context.
Keyword: perceived supervisor support, perceived organization support, procedural
justice, reward and recognition, self-efficacy, employee engagement, hospital-based
nurses.
Page 1 of 206
EMPLOYEE ENGAGEMENT
CHAPTER 1: INTRODUCTION
1.0 Introduction
This chapter provides an overview of the research which outlines the study based on
the background of the research, problem statement, objectives of the research,
research questions, hypotheses, significance, layout of the chapter and conclusion of
the study. The purpose of this study is to examine the relationship among the factors
that contribute to the degree of employee engagement which is vital to the business
outcomes. The most commonly studied outcomes of employee engagement included
the turnover intention, job satisfaction, organization commitment, and the
organizational productivity and profitability. Recently, there is increasingly focused
on the shortage of nurses which has become a significant issue around the world.
Thus, this study will be conducted to examine the factors that contribute employee
engagement among the hospital-based nurses which will have beneficial impact on
the nursing industry. Generally, the study of employee engagement in nursing is
gradually being concerned as a result of the increased in its importance to the well-
being and healthcare service quality of a society and country.
1.1 Research Background
Nursing is a unique profession that harmoniously blended of compassion, knowledge,
skill and critical thinking (Rao, 2012). Nurses are well known as dedicated

Page 2 of 206
EMPLOYEE ENGAGEMENT
professionals who work inexhaustibly for their patients. However, nursing is career
characterized by heavy workload and tend to experience significant stress and
reporting high level of burnout (Rao, 2012; Laschinger, Wilk, Cho & Greco, 2009;
Freeney & Tiernan, 2009; Willoughby, 2011; Maslach, Schaufeli & Leiter as cited in
Wilson, 2009). According to Teoh and Noraida (2006), nearly half of the nurses in
Malaysia plan to change their job within the next two years. This indicates the high
turnover rate among nurses (Castle, 2011). The reasons behind are understaffed of
their facilities, high stress level, compromised patient care, department overcrowding
and closing of beds (Teoh et al., 2006).
Since the year 1957, healthcare in Malaysia has seen vast improvements in which
from only seven health centers and now expanded to more than 4000 clinics and
hospitals under the Ministry of Health (Ministry of Health, 2001). Siew, Chitpakdee
& Chontawan (2011) and Mohamed and Mohamad (2012) had stated that the
shortage of nursing is a major problem that has been concerned in the healthcare
service throughout the world and it is the major symptom of high turnover rate in the
healthcare industry. This high nurse‟s turnover issue can negatively impact on the
organization‟s capacity to meet the patient‟s need. Bolton study (as cited in Chan,
McBey, Basset, O‟Donnell & Winter, 2004) apparent that nursing work has been
vastly affected by management and also by the government led initiatives to deliver
service to patients at low cost. Hunt study (as cited in Choong, Lau, Kuek & Lee,
2012) obvious that turnover intention will decreased quality of patient care, and
caused the increased contingent staffing costs, staff costs, absenteeism rates, nurse
turnover, and loss of patients.
The World Health Organization (WHO) recommend a nurse-to-patient ratio should of
1:200 however the statistic of Ministry of Health (2012) shows that Malaysian nurse–
ratio is 1:410 (Intan, Nurazree & Hanafiah, 2011; Mohamed et al., 2012; Choong,
Lau, Kuek & Lee, 2012). According to Willoughby (2011), nurses are the first

Page 3 of 206
EMPLOYEE ENGAGEMENT
employees to leave their workplace and it is extremely costly to the hospital where
the cost of replacing someone is approximately 150% of the employee‟s annual
compensation. Tang and Ghani (2012) found that nursing shortage in Malaysia was
clear cut through a recent report by the American Society of Registered Nurses
(2007). It pointed out Malaysia needs 20,000 registered nurses in all specialization
and approximately 1,000 of Malaysian nurses are leaving the nursing profession
annually.
Based on the study of Rao et al. (2012), employee engagement is the central issue for
21st century professionals and specifically for nurses in the health care industry. Saks
(2006) stated that employee engagement is related to employee‟s behaviors, attitudes
and intention. Employee engagement is a notion that generally viewed as managing
discretionary effort. This means that when employees are given options, they will
further their interests toward an organization (Bhattacharya & Mukherjee, 2009). In
the study of Schaufeli and Bakker (as cited in Bhatnagar, 2007; Mauno, Kinnunen &
Ruokolainen, 2007; Laschinger, Wilk, Cho & Greco, 2009; Mender & Stander, 2011;
Van Der Kleij, 2011; Karatepe, 2013) defined the engagement as “a positive,
fulfilling, work-related state of mind that characterized by vigor, dedication, and
absorption.”
Robinson, Perryman and Hayday (2004) stated that the employee engagement is
originally derived from, or contains of two concepts that have been subjected to the
empirical research- Commitment and Organizational Citizenship Behavior (OCB).
This employee engagement has been defined as “a positive attitude that held by
employee towards the organization and its values.” This means that an engaged
employee is highly aware and willing to work in group with colleagues for the benefit
of the organization in the business context. However, this requires a two-way
relationship whereby the employer must put in effort to maintain and build up the
level of engagement of its employee.”
Page 4 of 206
EMPLOYEE ENGAGEMENT
In proportion to Blessing White and Erickson; Macey and Schnieder studies (as cited
in Markos & Sridevi, 2010), the engagement is concerning the passion and
commitment (the willingness of the employees to spend and extend one‟s effort to
help the employer succeed), which is beyond the fundamental loyalty to the employer
or the simple satisfaction level with the employment arrangement. Bhattacharya et al.
(2009) also defined the employee engagement is the level of involvement and
commitment of an employee has towards their organization and also its value.
1.2 Problem Statement
Employee engagement has been defined by many researchers in many ways but there
is no single definition is generally accepted (Markos & Sridevi, 2010). Kahn‟ study
(as cited in Saks, 2006; Bhattacharya & Mukherjee, 2009; Stander & Rothmann, 2012;
Bhattacharya, Dey & Saha, 2012; Andrew & Sofian, 2012) state that employee
engagement is the status of being psychologically present when performing the role
and responsibility in the organization. According to Men (2012), employee
engagement is defined as how employees deal with themselves when performing their
role in organization. Therefore, employee engagement is referring to the level of
involvement and commitment of an employee has towards the organization (Andrew
et al., 2012). This is further explained by Saks (2006) that employee engagement
involves the behaviors, attitudes and intention (Wilson, 2009; Mendes & Stander,
2011; Men, 2012).
Rothbard (as cited in Saks, 2006) defines engagement as psychological presence but
is in depth of two dimensions which are attention and absorption. In the study of
Schaufeli and Bakker (as cited in Bhatnagar, 2007; Mauno et al., 2007; Laschinger et

Page 5 of 206
EMPLOYEE ENGAGEMENT
al., 2009; Mender et al., 2011; Van Der Kleij, 2011; Karatepe, 2013) engagement is
defined as “a positive, fulfilling, work-related state of mind that characterized by
vigor, dedication, and absorption.” It is advance stated that engagement is “a more
persistent and pervasive affective-cognitive state that is not focused on any particular
object, event, individual, or behavior”.
Employee engagement is employee communication‟s buzz word term and has
recently gain high attention from both academic field and industry and it is being
widely studied in different disciplines due to the positive effect on the work
experience and the positive effect it brings to the organization (Saks, 2006; Simon,
2011; Park & Gursoy, 2012). Engaged employees are aware of the business context,
stay focus and clear on the organizational goals and able to perform what is expected
by the organization on them (Bakker & Demerouti, 2008; Simon, 2011). Retention of
engaged employee is critical as highly engaged employees are the key factor for
business success. This was because they are more likely to perform better compared
to the disengaged employee who will cost an organization with higher cost such as
low productivity, high absenteeism and intention to leave the organization (Makhbul,
Rahid & Hasun, 2011; Simon, 2011; Andrew et al., 2012; Mohamed et al., 2012;
Choong et al., 2012; Karatepe, 2013).
However, the reality today is that, the engagement of employee is declining due to the
tendency of both organization and employee being more materialistic and there is a
trend of deepening disengagement among employees nowadays (Saks, 2006;
Bhattacharya et al., 2012). This leads to „engagement gap‟ in the workplace and it is a
drawback for the organization as disengaged employee will cost an organization more.
As what was being mentioned in the research background, nursing shortage has
become a critical problem in Malaysia‟s health care industry. The most important

Page 6 of 206
EMPLOYEE ENGAGEMENT
resource of an organization is employees. Organization can reduce all the costs but it
does not make a much difference if ignorance of its employee‟s aspect occurs (Simon,
2011). Deese (2009) says that, engagement is now becoming an important issue to be
studied in the area of healthcare profession. With the increase in national nursing
shortage, employee engagement is very important for the retention of nurses. This is
because employee engagement has a great impact on productivity of employee and
retention of talented employees of the organization (Bhatnagar, 2007). High turnover
rate among nurses can negatively impact the capacity of the hospitals to meet the
patient‟s need as the quality of nursing care received by patients will decrease (Omar,
Anuar, Majid & Johari, 2012; Choong et al., 2012). In order to deal with nurses‟
turnover rate, most of the health care institute focus in increasing the recruitment and
retain their nurses to maintain adequate staffing (Siew et al., 2011). However, the
causes of this problem can be identified by studying the relationship between
employee engagement and retention of employee.
In Malaysia, there are 79700 numbers of nursing personnel which makes up 75% of
the total healthcare workforce. However, the turnover rate of nurses had increased
more than 50% from the year 2005 to the year 2010 with the number of 400 to 1049
nurses leaving their present workplace in Malaysia. In addition, there are currently
about 25000 Malaysian nurses who are working in the overseas country such as
Middle East where the number of migration is at an attribution rate of 400 per year
(Amree, n.d.). Based on the situation, Malaysia is forecast will face a shortage of
nurses in future. Nevertheless, Malaysia is still facing a deficit of 7000 nurses per
year and it is estimated that a total of 70000 nurses will be required by the year 2020
(Siew et al., 2011; Mohamed et al., 2012). According to Tang and Ghani (2012),
20000 registered nurses in all specialization are needed by Malaysian and there is
approximately 1000 Malaysian nurses leaving the industry annually.

Page 7 of 206
EMPLOYEE ENGAGEMENT
High turnover rate among nurses is expected due to the nature of the job (Mauno,
Kinnunen & Ruokolainen, 2007). The understanding of nurse engagement is still
inadequate because there are only a few numbers of academic researches in nursing
engagement especially in Malaysia. Research in this area should be done in depth, so
that nurse leaders can be better informed about the impact of engagement on
outcomes for the institute (Simpson, 2008; Freeney et al., 2009). Therefore, this study
is undertaken in order to gain an in-depth understanding of employee engagement
among nurses in Malaysia.
1.3 Research Objectives
1.3.1 General Objective
To identify the relationship between perceived supervisor support, perceived
organization support, procedural justice, reward and recognition, and self-
efficacy as factors that will influence the employee engagement in nursing
industry.
Page 8 of 206
EMPLOYEE ENGAGEMENT
1.3.2 Specific Objectives
To determine whether there is a significant relationship between
perceived supervisor support and employee engagement in nursing
industry.
To determine whether there is a significant relationship between
perceived organization support and employee engagement in nursing
industry.
To determine whether there is a significant relationship between
procedural justice and employee engagement in nursing industry.
To determine whether there is a significant relationship between
reward and recognition and employee engagement in nursing industry.
To determine whether there is a significant relationship between self-
efficacy and employee engagement in nursing industry.
To determine whether there is a significant relationship between
perceived supervisor support, perceived organization support,
procedural justice, reward and recognition, self-efficacy and employee
engagement in nursing industry.

Page 9 of 206
EMPLOYEE ENGAGEMENT
1.4 Research Questions
Based on the research objectives, we have identified several research questions as
below:
1. Does perceived supervisor support influences employee engagement in
nursing industry?
2. Does perceived organization support influences employee engagement in
nursing industry?
3. Does procedural justice influences employee engagement in nursing
industry?
4. Does reward and recognition influences employee engagement in nursing
industry?
5. Does self-efficacy influences employee engagement in nursing industry?
6. Does perceived supervisor support, perceived organization support,
procedural justice, reward and recognition, and self-efficacy influences
employee engagement in nursing industry?

Page 10 of 206
EMPLOYEE ENGAGEMENT
1.5 Hypotheses of the Study
Hypothesis 1
H10: There is no significant relationship between perceived supervisor support and
employee engagement in nursing industry.
H11: There is a significant relationship between perceived supervisor support and
employee engagement in nursing industry.
Hypothesis 2
H20: There is no significant relationship between perceived organization
support and employee engagement in nursing industry.
H21: There is a significant relationship between perceived organization support and
employee engagement in nursing industry.
Page 11 of 206
EMPLOYEE ENGAGEMENT
Hypothesis 3
H30: There is no significant relationship between procedural justice and employee
engagement in nursing industry.
H31: There is a significant relationship between procedural justice and employee
engagement in nursing industry.
Hypothesis 4
H40: There is no significant relationship between reward and recognition and
employee engagement in nursing industry.
H41: There is a significant relationship between reward and recognition and
employee engagement in nursing industry.
Page 12 of 206
EMPLOYEE ENGAGEMENT
Hypothesis 5
H50: There is no significant relationship between self-efficacy and employee
engagement in nursing industry.
H51: There is a significant relationship between self-efficacy and employee
engagement in nursing industry.
Hypothesis 6
H60: The five independent variables (perceived supervisor support, perceived
organization support, procedural justice, reward and recognition, and
self-efficacy) are no significant explain the variance in employee
engagement in nursing industry.
H61: The five independent variables (perceived supervisor support, perceived
organization support, procedural justice, reward and recognition, and
self-efficacy) are significant explain the variance in employee engagement
in nursing industry.

Page 13 of 206
EMPLOYEE ENGAGEMENT
1.6 Significance of the Study
The purpose of this research is to examine the employee engagement in nursing
industry. This study is beneficial to several parties which are organization, industry,
researcher and individual.
1.6.1 Organization Perspective
Nowadays, most of the organization is trying to retain their employees.
Hospital administration recently have become increasingly focused on
retaining competent nurse staffs as to maintain the quality of healthcare
services (Chan, McBey, Basset, O‟Donnell & Winter, 2004). According to
Mitchell study as cited in Adi (2012), high performance and retention is
important to organization because without concerning these two elements, it is
definitely difficult to survive in the globalization era. Thus, the results of this
study will provide insight and information for leaders regard how critical is
the employee engagement impact on employee productivity and talent
retention in nursing industry as now nursing profession is experiencing
shortages (Spence Laschinger, Wilk, Cho & Greco, 2009).

Page 14 of 206
EMPLOYEE ENGAGEMENT
1.6.2 Nursing Perspective
According to previous studies, nurses contribute to the health and well-being
of the society in a country. Consequently, a nurse plays an important role in
organization competence in which their attitudes and behaviors toward a
patient would have significant impact on the patient‟s perceived service
quality and satisfaction. This support by the broaden-and-build theory that
positive emotions help individuals bring positive outcomes and it shows that
higher levels of engagement is because of frequent positive emotions (Gillet,
Fouquereau, Bonnaud-Antignac, Mokounkolo & Colombat, 2013). For that
reason, a comprehensive understanding of the factors that contribute to the
degree of engagement in the nursing industry will positively impact on the
healthcare institutes‟ performance and success. In nursing, by understanding
the factors that contribute to the positive attitudes and job performance is
crucial as it directly influences the quality and safety of the healthcare services
and most importantly, the health of the patient.
1.6.3 Researcher Perspective
It is important to know the ways of retaining nurses and now it is gradually
gaining importance among the practitioners and consultants around the world.
They may benefit from the feedback of this study and could implement
relevant strategies for particular industry‟s retention plans to guarantee their
organizational survival. This study will be helpful to the academy researchers
in a way to find out more with clearer definition and dimensions that will be
used for measuring employee engagement and vindicating importance concept

Page 15 of 206
EMPLOYEE ENGAGEMENT
(Markos et al., 2020). Rivera, Fitzpatrick and Boyle (2011) stated that with a
higher employee engagement, it actually helps organization to enjoy benefits
including better employee retention, improved customer satisfaction, and
overall business success. Therefore, this study may provide the worthiness for
future research in which the elements that identified may help researchers to
investigate more details about engagement and its positive consequences.
Researchers who their research interest is in the field of employee engagement
may find the information that we have found would contribute to the
knowledge base about employee engagement. Moreover, further research is
needed in order to identify the levels of employee engagement in order to
describe the benefits of engagement and the factors that affecting it.
1.6.4 Individual Perspective
The leaders may also benefit by understanding more in employee engagement
and thus reducing the risk of nurse burnout and turnover, where nurses are
working in a job which they can fully engage. In Kahn studies as cited in Saks
(2006) said that the engagement leads to both individual outcomes (quality
and experiences of one‟s work) and organizational outcomes (growth and
productivity of organizations). Therefore, an engaged employee is willing to
put extra efforts and commitment in their work in the form of time,
brainpower and energy with the desire of doing the best job. This eventually
will reduce the chances of the employee to jump ship to another healthcare
institutes. When the turnover rate is low, the cost to recruit and train the new
employees can be saved. With the increased in understanding towards the
employee‟s needs, this is actually helping the organization to boost its image
in attracting and retaining employee (Kanten & Sadullah, 2012). According to

Page 16 of 206
EMPLOYEE ENGAGEMENT
Kanten and Sadullah (2012), work engagement has positive impact in
dedication to an organization and will increase the work task performance,
initiative and innovative behavior.
1.7 Chapter Layout
This study will consist of five chapters.
Chapter 1: Introduction
Chapter one is the introductory chapter where research background will be outline
detailed and research problem will be discussed. In addition, research objectives will
be accomplished, research questions will be determined, hypotheses to be tested as
well as the importance and contribution of this research.
Chapter 2: Literature Review
Chapter two focuses on the literature review that has been studied previously.
Relevant literature will be reviewed and expressed clearly and understandably. We
would then propose our own theoretical or conceptual framework in this chapter.

Page 17 of 206
EMPLOYEE ENGAGEMENT
Besides, hypotheses development will be formulated and conclusion to conclude the
overall of the literature review.
Chapter 3: Research Methodology
Chapter three describes the overview of the research methodology which includes
research design, data collection methods, sampling design, research instrument,
constructs measurement, data processing and data analysis that will be applied in the
research.
Chapter 4: Research Results
The analysis of the results which are relevant to the research questions and
hypotheses in chapter four will be presented through descriptive analysis, scale
measurement and inferential analysis.
Chapter 5: Discussion and Conclusion
Eventually, constructive discussions and conclusion will be demonstrated in chapter
five. It covers the summary of statistical analysis, discussion of major findings,
implications of the study, the potential limitations of the study as well as
Page 18 of 206
EMPLOYEE ENGAGEMENT
recommendations for the future research. In this chapter, we will make an overall
summary for each of the research questions and research objectives.
1.8 Conclusion
Conclusively, the purpose of this study is to figure out the factors that are contributed
to the employee engagement in nursing industry. This however will be conducted in
the next chapter. Chapter 2 will be the literature review that builds a theoretical
foundation for the research by reviewing relevant journals and articles to determine
research issue.

Page 19 of 206
EMPLOYEE ENGAGEMENT
CHAPTER 2: LITERATURE REVIEW
2.0 Introduction
In Chapter 2, the literature review of the study will be covered. Literature review is
the secondary source of data obtained after the review of available work such as
thesis, journals, research paper and so on.
This chapter consists of five sections. Section 2.1 is the review of research done
previously by researchers. Section 2.2 reviews the relevant theoretical model. Section
2.3 is about the proposed conceptual/ theoretical framework of this study and section
2.4 shows the hypothesis development. The last section, section 2.5 concludes the
whole chapter 2.
2.1 Review of the Literature
2.1.1 Dependent Variable:
Employee Engagement
The concept of employee engagement is vast. In recent, managers‟ keep eye
on how to keep employees engaged in their work as they realized that by

Page 20 of 206
EMPLOYEE ENGAGEMENT
focusing on employee engagement, it is able to generate addition efficient and
dynamic workforce (Markos & Sridevi, 2010). Employee engagement is a
theory which being viewed as directing discretionary effort in general, which
is when employees have choices they will act in a way that furthers their
organization‟s interest. Thus, employee engagement is the extent of
participation and commitment which employees posses toward their
organization and its principles (Bhattacharya & Mukherjee, 2009). Simon
(n.d.) stated that when employees gain positive interpersonal support, personal
meaning, and work in an efficient working environment as well as attain
motivation in work, they will feel a sense of engagement.. This can also
justified by Social exchange theory (SET) where SET provides useful
guideline to explain the relationship- i.e. employee who received economic
and socio-emotional resources from the organization will be likely to pay back
the organization with higher work performance and work engagement in
return (Karatepe, 2013).
According to the studies of Kahn (as cited in Simon, n.d.), engagement was
conceptualized as the connection of the organizational employees to their job
responsibilities. This is further explained by May, Gilson and Harter study (as
cited in Stander & Rothmann, 2010) that meaningfulness, safety and
availability predicts employee engagement. Engaged employees are alert and
understand well on the business circumstances, then cooperate and work out
with their colleagues to enhance job performance for the benefits of the
organization and they will constantly perform beyond expectation. In order to
do so, the employer should create higher motivation for the commitment of
their employees toward the organization (Bhattacharya et al., 2009). Engaged
employees are entirely committed, and enthusiastic about their jobs (Falcone
studies as cited in Bhatnagar, 2007).
Page 21 of 206
EMPLOYEE ENGAGEMENT
Bakker and Demerouti and Othman and Nasurdin (2011) stated that, engaged
employees often: (1) have better health; (2) feel positive emotions, including
enthusiasm, happiness, and joy; (3) pass on their engagement to others; (4)
build their own career and individual resources; and (5) attain better job
performance. Results indicated that engaged employees are adapt to fulfill the
demands they encounter in a broad array of context. This consistent with
Bakker studies (as cited in Bakker & Demerouti, 2008) which also explained
that engaged employees are operating efficiently and effectively in addition
keen to go to further mile. Luthans and Peterson studies (as cited in Bhatnagar,
2007) and Markos et al. (2010), stated that Gallup has defined the employee
engagement as a major predictor of positive results such as profitability ,
productivity , employees retention and customer satisfaction. Recently studies
also showed that engagement is positively related to customer satisfaction
(Salanova, Agut & Peiro study as cited in Xanthopoulou et al., 2009), in-role
performance (Schaufeli, Taris & Bakker studies as cited in Xanthopoulou et
al., 2009), and monetary returns (Xanthopoulou et al., 2009).
Vance (as cited in Markos & Sridevi, 2010) define employee engagement as
the results of individual qualities (personality, skills, abilities, attitudes,
knowledge and temperament), and organizational perspectives (HR practices ,
physical and goal setting as well as leadership) which impact precisely on the
process, person, and context elements of job performance and research found
that, there are positive relationship between the employee engagement and
organizational performance outcomes such as profitability, productivity,
customer safety, employee retention, and loyalty (Markos et al., 2010). In
overall, engagement gains can serves as important predictors of organizational
successfulness in long term period as employee engagement is closely linked
with organizational outcomes in which an organization with engaged
employees maintain higher employee retention as a result in reduced intention

Page 22 of 206
EMPLOYEE ENGAGEMENT
to leave and lowered employee turnover rate, boosted up growth, customer
satisfaction, productivity, and profitability (Markos et al., 2010; Simon, n.d.).
There is a significant impact on talent retention and productivity shown by
implementing employee engagement (Bhatnagar, 2007). Martel (as cited in
Bhatnagar, 2007) further explained that “engaging employees- particularly by
providing them participation, freedom, and trust is the most comprehensive
response to the ascendant postindustrial values of self-realization and self-
actualization. Joo and Mclean studies (as cited in Bhatnagar, 2007), further
explained that engaged employees are strong and strategic assets for sustained
competitive advantage. These engaged employees are difficult to be imitated
by other organization and are unique to the organization respectively
(Bhatnagar et al., 2007). In addition, excellent performance, job satisfaction,
organizational commitment and lower turnover intentions are the positive
organizational outcomes lead by employee engagement (Karatepe &
Olugbade, 2009).
The studies of Macey and Schneider; May, Gilson and Harter (as cited in
Xanthopoulou et al., 2009) explained that, those who are enthusiastic, highly
energetic, and often completely immersed on their jobs are engaged
employees who feel the time flies when working. This is consistent with
Markos et al. (2010) finding as employees are more willing and desire to work
for the organization where they find means and values at job. Table 2.1
depicts some of the definition of employee engagement.

Page 23 of 206
EMPLOYEE ENGAGEMENT
Table 2.1: Definition of Employee Engagement

Page 24 of 206
EMPLOYEE ENGAGEMENT
Source: Kompaso, S. M., & Sridevi, M. S. (2010). Employee engagement:
The key to improving performance. International Journal of Business and
Management,5(12), p89.
Schaufeli study (as cited in Bhatnagar, 2007; Bakker & Demerouti, 2008;
Karatepe & Olugbade, 2009; Xanthopoulou, Bakker, Demerouti & Schaufeli,
2009; Othman & Nasurdin, 2011) implied engagement “as a positive,
fulfilling, job-associated emotional state that is characterized by vigor,
dedication, and absorption. The studies of Bakker and Schaufeli (as cited in
Karatepe & Olugbade, 2009) explained that it is critical in realizing the
positive characteristics of works in which organizations want people to feel
vigor, dedicated, and are absorbed by their jobs. In other words, engagement
is a work-related state of fulfillment and affective-motivational on employees
that is characterized by vigor, dedication and absorption. According to Law,
Dollard, Tuckey and Dormann (2011), engagement especially shows how
employees face their work. Employees may be able to encounter their work as
meaningful (dedication), motivating (absorption), and something to which
they wish to put effort (vigor).
Page 25 of 206
EMPLOYEE ENGAGEMENT
Based on the research we had done, three dimension of employee engagement
can be listed out: (1) vigor, (2) dedication and (3) absorption.
Vigor
Acorrding to Kahn study (as cited in Stander & Rothmann, 2010), vigor is a
physical dimension. In Schaufeli study (as cited in Bakker & Demerouti, 2008;
Heather et al., 2009; Karatepe & Olugbade, 2009; Nahrgang et al., 2010;
Stander & Rothmann, 2010; Othman & Nasurdin, 2011; Van Der Kleij, 2011;
Gillet et al., 2012; Park & Gursoy, 2012), vigor is defined as “the willingness
to devote efforts in one‟s work, a high level of mental resilience and energy
while working, and persistence even when facing difficulties”. In other words,
vigor is referring to a state in which people having a high level of energy and
strong work ethic, willing to put efforts in one‟s work, and capable to
persevere when deal with challenging tasks. In 2006, Mauno, Kinnunen and
Ruokolainen proposed that an employee who is highly motivated by his or her
job and most likely to preserve when facing difficulties or hassles at work,
feels a great sense of vigor Mauno et al. (2006) also take the dimension of
vigor into account as a motivational concept in consistent with Atkinson‟s
study (as cited in Mauno et al., 2006) stating that: “Motivation is the
contemporary or instantaneous effect on vigor, direction, and persistence of
action”.

Page 26 of 206
EMPLOYEE ENGAGEMENT
Dedication
According to Kahn study (as cited in Stander & Rothmann, 2010), dedication
is an emotional dimension. Bhatnagar et al. (2007) explained that emotionally
engaged is refer as to shape meaningful connection with others (friends and
colleagues) and to obtain or offer empathy and concern from or to them. In
Schaufeli study (as cited in Bakker & Demerouti, 2008; Heather et al., 2009;
Karatepe & Olugbade, 2009; Nahrgang et al., 2010; Stander & Rothmann,
2010; Othman & Nasurdin, 2011; Van Der Kleij, 2011; Gillet et al., 2012;
Park & Gursoy, 2012),dedication refer to “a sense of pride, significance,
challenge, enthusiasm and inspiration”. Dedication, in another word, refers to
being strongly committed in one‟s work and experiencing a sense of
enthusiasm, challenge and significance, individuals who feel dedication also
perceive their work to be critical and they express problems as challenges
rather than strains. According to Mauno et al. (2007), dedication shares
similarity with a more conventional concept- job involvement/ commitment
which defined as the level of an employee psychologically link his job and the
performance of the job. Mauno et al. also indicate that there are no actual
differences between dedication and job involvement as both of them are rather
stable phenomena.
Absorption
According to Kahn study (as cited in Stander & Rothmann, 2010), absorption
is a cognitive dimension. Cognitively engaged stand for those who are
intensely aware of their mission and responsibility in their work environment
(Luthans & Peterson study as cited in Bhatnagar, 2007). In Schaufeli study (as
Page 27 of 206
EMPLOYEE ENGAGEMENT
cited in Bakker & Demerouti, 2008; Heather et al., 2009; Karatepe &
Olugbade, 2009; Nahrgang et al., 2010; Stander & Rothmann, 2010; Othman
& Nasurdin, 2011; Van Der Kleij, 2011; Gillet et al., 2012; Park & Gursoy,
2012), absorption refers to “being fully concentrated and intensely engrossed
in one‟s work, in which time elapse rapidly and one has difficulties when
detaching oneself from work”. Schaufeli further explained that absorption is
characterized by being concentrated thoroughly and deeply immersed in one‟s
work, in which time passes speedily and one has difficulties while separating
oneself from work. Mauno et al. (2007) refers absorption to total
concentration on the job given. In other words, absorption is the state of mind
where people fully concentrate and involving themselves in an activity purely
for the sake of doing it even it is at a great cost and nothing else seems to be a
matter for them.
2.1.2 1st Independent Variable:
Perceived Supervisor Support
According to Eisenberger et al. (2002), perceived supervisor support defines
as to assess employees‟ perception that their supervisor valued their
contribution and cared about their well-being. Kotte and Sharafinski study (as
cited in Pazy & Ganzach, 2006) defined perceived supervisor support as the
belief that employees adopt concerning the degree to which supervisor values
their effort and care about their well-being. Eisenberger, Stinglhamber,
Vandenberghe, Sucharski, and Rhoades research (as cited in Cole, Bruch &
Vogel, 2006) have defined perceived supervisor support as the degree to
which employees form general impressions that their superiors appreciate

Page 28 of 206
EMPLOYEE ENGAGEMENT
their contributions, are supportive and care about their subordinates‟ well-
being.
Supervisor support is defined as the employees‟ perceived social support from
supervisors, including instrumental and emotional support (Law et al., 2011).
Social support from supervisors is a component of job resource that
consistently showed in the result of several researches that has conducted and
it was positively related with work engagement (Bakker & Demerouti;
Schaufeli & Salanova, as cited in Bakker & Demerouti, 2008). According to
the Bakker and Demerouti (as cited in Xanthopoulou et al., 2009) verify that
those employees who experience autonomy at work, have supportive
colleagues, receive proper coaching and high-quality feedback, and have
opportunities for professional development have the instrumental means and
are intrinsically motivated to achieve their work goals. The motivational
potential of job resources can generate the upshot of high work engagement
and increased work performance extrinsically and intrinsically (Law et al.,
2011).
Perceived supervisor support has been found to be related to employee
withdrawal behaviors such as absenteeism and turnover (Eisenberger et al.,
2002). The research also said that a supervisor‟s role is very important in the
organization because it may enhance fulfillment of socio-emotional needs of
the employees. Employees who believed that the supervisor valued their
contributions and cared will tend to decrease the turnover (Eisenberger et al,
2002). Shanock and Eisenberger (2006) said that perceived supervisor support
will be positively related to subordinates‟ in-role and extra-role performance.

Page 29 of 206
EMPLOYEE ENGAGEMENT
The direct effects of leadership, using a clear measure of engagement given
the wealth of proof that good leadership is positively related to follower
attitude and behavior concepts that overlap with engagement. In addition,
psychological safety proposes the most potential for leadership to influence
engagement especially leadership that provides a supportive, trusting
environment allows employees to fully invest their energies into their work
roles (Xu & Thomas, 2010).
According to McShane and Von Glinow study (as cited in Choong et al, 2012)
reveal that leadership style can be described as the process of leader ability to
influence, motive and enable others in an organizational culture in order to
assure the effectiveness of the organizations of which they are members.
Transactional leadership style is the leader that achieving current objective
more efficiency as they focus on day to day operation. The transactional
leaders are more active and utilize their transactions on an exchange of
rewards and benefits to employee‟s job performance and achievement. They
also will assure employees have necessary resources to finish their daily task
and reaching their target setting. However, transactional leadership fails to
capitalize on discretionary effort that comes from engaging an employee fully
even though the transactional leadership can be both an active and effective
form of leadership (Marquard, 2010).
Aside from these, transformational leadership style is a leader that includes
consideration intellectual stimulation and changing the organization to fit the
environment. The transformational leader can be recognized as change agent
of the company. They have the ability to change the employees‟ attitudes,
behaviors and values by showing favorable, influential and supportive
interactions (McShane & Von Glinow study as cited in Choong et al, 2012).
Based on the past study has demonstrated that transformational leadership is

Page 30 of 206
EMPLOYEE ENGAGEMENT
positively related with follower commitment (Lee study as cited in Xu &
Thomas, 2010), job satisfaction (Judge & Piccolo study as cited in Xu &
Thomas, 2010), and work motivation (Judge & Piccolo study as cited in Xu &
Thomas, 2010), and leader-member exchange is positively related with
organizational citizenship behaviors (Ilies et al. study as cited in Xu &
Thomas, 2010). Furthermore, distributed leadership is group dynamics formed
by inclusive management practices where leader are not always above
followers but frequently work together. Result of the Tower Perrin (as cited in
Marquard, 2010) in employee engagement survey proved that concepts of
distributed leadership are not yet main stream.
2.1.3 2nd
Independent Variable:
Perceived Organization Support
According to Aselage and Eisenberger; Rhoades and Eisenberger; Eisenberger,
Armeli, Rexwinkel, Lynch and Rhoades; Rhoades, Eisenberger and Armeli;
Shore and Shore research (as cited in Shanock & Eisenberger, 2006),
organizational support theory considers the development, nature, and results
of perceived organizational support. Eisenberger, Huntington, Hutchison, and
Sowa; Shore and Shore; Eisenberger, Cummings, Armeli and Lynch (as cited
in Lin & Chen, 2004; Rhoades & Eisenberger, 2002; Eisenberger,
Stinglhamber, Vandenberghe, Sucharski & Rhoades, 2002; Rhoades et al,
2001) indicated that employee perceptions of organization support are related
to their beliefs regarding the extent to which organizations value their
contributions and care about their not so important components, thus
increasing their attachment to the organization and the expectation that greater
effort to achieve organizational goals will be awarded. Based on Shore and

Page 31 of 206
EMPLOYEE ENGAGEMENT
Wayne study (as cited in Loi, Ngo & Foley, 2006), perceived organizational
support is enhanced by the positive and discretionary treatment by the
organization which gets the employees‟ perception of the organization‟s
commitment to them. According to Eisenberger et al. research (as cited in
Shanock & Eisenberger, 2006), based on the theory in organization support,
perceived organization support helps organization to achieve its goal in which
including extra-role behaviors like helping other employees.
Perceived organization support (POS) focuses on the exchange relationship
between the employee and the organization and this can be said that the
employer‟s commitment to the employee. It is picturing in one‟s mind that
employees‟ general perception of the level to where organization values their
contribution and cares about their well-being (Wayne, Shore, Bommer &
Tetrick, 2002; Gyekye & Salminen, 2007). According to Eisenberger, Fasolo
and Davis-LaMastro; Settoon, Bennett and Liden; Wayne et al. studies (as
cited in Loi et al., 2006), POS is related to variety of important outcomes such
as organizational commitment. Pazy and Ganzach (2006); Makanjee, Hartzer
and Uys (2006) indicated that POS is related to job satisfaction, to positive
mood, to attitudinal and behavioral indicators of commitment such as reduced
of turnover, absenteeism and withdrawal.
Other than that, social organizational values, norms, beliefs, practices and
structures also should be considered in the workplace (Gyekye & Salminen,
2007). POS is also valued as the aid to help the organization to deal with
stressful situations and it is definitely important to help to carry out one‟s job
effectively in such condition (Rhoades & Eisenberger, 2002; Makanjee et al.,
2006). Pazy and Ganzach (2006) also said that the POS refers to the
significant social exchange in employment relationships. Masterson‟s (2001)
analysis of social exchange in organizations focus on the ability of employees

Page 32 of 206
EMPLOYEE ENGAGEMENT
to repay favorable treatment they received (as cited in Shanock & Eisenberger,
2006). It is to be said that in order to meet socio-emotional needs to determine
the organization‟s readiness to reward, employees develop POS based on the
organizational support theory as mention above (Shanock & Eisenberger,
2006).
Pazy and Eisenberger (2006); Loi et al. (2006) said that high POS is expected
to have positive attitude and behavior from the employees and these outcomes
are benefiting the organization. Bell and Menguc (2002) indicated that the
employees in service industry with high POS were rates as more courteous,
attentive, and concerned more on the customers‟ interest compare with the
employees with low POS (as cited in Shanock & Eisenberger, 2006).
According to Gyekye and Salminen (2007), employees with support from
organization will come with loyalty, efficiency and increased productivity.
They actually have greater involvement and stronger feelings of allegiance
and faithfulness towards the organization. However, POS also is highly
relevant to the fixed pay contexts in term on performance. When
compensation is not contingent on performance, employees are not receiving
more pay although their performance is very good but improved performance
can definitely be a return for concern and support (Pazy & Eisenberger, 2006).
2.1.4 3rd
Independent Variable:
Procedural Justice
Justice or also known as fair treatment is always center of attention among
people. People have strong reaction to situations that they perceived as fair or

Page 33 of 206
EMPLOYEE ENGAGEMENT
unfair (van Prooijen, De Cremer, van Beest, Stahl, Dijke & Van Lange, 2008).
When people perceived they are being treated fairly, they tend to be more
appreciating and have greater satisfaction with their social relationship (Clay-
Warner, Hegtvedt & Roman, 2005; van Prooijen et al., 2008) but if they
believe they are being treated unfairly, negative emotions such as anger, fear
will be shown (van Prooijen et al., 2008).
Procedural justice has been defined by Greenberg (as cited in Naumann &
Bennett, 2002) as the perceived fairness of the procedures in making a
decision. ElAkremi, Vandenberghe and Camerman (2010) stated that
procedural justice refers to how employee judges the procedure that led to the
fairly made decision and procedural justice is mainly conceptualized at
individual level (Naumann et al., 2002). Leonardelli and Toh (2011) further
discuss procedural justice as the fair treatment given to each and every
individual especially in terms of authority as authority increases recognition
and gaining respect within the group. Konovsky (2000) and Clay-Warner et al.
(2005) demonstrates that employee behavior and work attitude, including job
satisfaction and the level of engagement of employee is predictable by
procedural justices. Tyler study (as cited in Konovsky, 2000) stated that
procedural justice can affect the emotion of an individual towards positive or
negative based on the fairness of the outcome and thus lead to the
consequences such as positive or negative employee behavior and attitude.
Lind, Kanfer and Earley (as cited in Konovsky, 2000) proposed that voice has
significant impact on the valuing of fairness of procedural justice even when
the voice does not related to the decision making and control process. Voice
opportunity increases the satisfaction level, view the social relationship of the
group as positive, increase willingness to accept the decision made and
improve their performance and sense of engagement with the organization and

Page 34 of 206
EMPLOYEE ENGAGEMENT
authorities (van Prooijen et al., 2008). Leonardelli and Toh (2011) also
suggest the authorities to communicate and allows group member to voice out
their opinion so that they will perceived the authorities as fair. Tyler and
Blader (2003) stated in their research that previous researchers proposed that
people evaluate procedural justice (voice or process control) based on
decisions making that will affect their interest. However, voice is no longer
the only factor to consider when looking into procedural justice. More
attention should be put on the interpersonal aspect such as team interaction,
market exchange and bargaining (Tyler & Blader, 2003).
Tyler and Blader (2003) and Blader and Tyler (2008) proposed that
procedural justice has linkage with the group engagement model as the
engagement of people is highly related with one‟s emotion. In 2003, Tyler and
Blader proposed that the key objective of group engagement model is to
understanding the factors that shapes and bond the relationship among group
members, this can be done by study the attitudes, behavior and values of the
members and these are highly influence by the judgment about the fairness of
procedure and decision made by authorities. The framework is further
discussed by Blader and Tyler (2008) that the employee‟s evaluation on the
outcomes and decision making process as well as the quality of treatment
received from group members has a strong influence on the employee‟s
behavior. Procedural justice is important in this context because it plays an
important role in determining whether an employee will link their social
identity with the organization (Blader & Tyler, 2008). Procedural justice can
increase the members‟ identification and commitment within the group as it
creates identity secure and respect (Leonardelli & Toh, 2011) and people will
feel stronger bonding in within the group (Clay-Warner et al., 2005).

Page 35 of 206
EMPLOYEE ENGAGEMENT
2.1.5 4th
Independent Variable:
Reward and Recognition
Among economical, human resources and financial aspects, human resources
which have highly motivated employees are more crucial and serve as
competitive advantage for a company as they can lead company to meet its
goals due to their well performance. Therefore, according to Lawler (2003),
the survival and prosperity of the organization is determined through the way
how human resources are being treated (Ali & Ahmed, 2009; Danish, 2010).
Kerr (2005) define rewards as any tangible present which employees receive
from organization as an award of their contribution on the organization. While
Bhattacharya and Mukherjee (2009) define rewards as simply something
which the individual who presents it deems to be desirable. Rewards can be
formal, informal or designed for a particular achievement. Besides,
recognition has been defined by Kerr (2005) as an acknowledgment to the
public about an employees‟ contribution to the organization.
Rewards can be characterized as intrinsic and extrinsic. Intrinsic rewards are
internal to the individual such as accomplishment or satisfaction. Whereas,
extrinsic rewards are external to the individual such as promotion, praise and
increase in pay (Bhattacharya & Mukherjee, 2009; Salie & Schlechter, 2012).
Therefore, according to Bhattacharya and Mukherjee (2009), reward can act
as the „catalyst‟ for performance improvement and higher productivity due to
a greater proportion of „engaged‟ employees.

Page 36 of 206
EMPLOYEE ENGAGEMENT
Reward and recognition are important to employee engagement as they
enhance motivation, morale and satisfaction in a research from Mone and
London (2009). Brun and Dugas (2008) research shows that there is a positive
relationship between recognition with the contribution of company success
and employee performance (Ali & Ahmed, 2009; Danish, 2010; Mone,
Eisinger, Guggenheim, Price, & Stine, 2011).
Maslach and Leiter‟s study (as cited in Willoughby, 2011) suggest that reward
and recognition are postulated to be crucial facilitators for engagement.
Individual‟s vulnerability to burnout caused from inadequate in reward
(whether institutional, financial, or social) (Chappell & Novak, 1992;
Maslanka, 1996; Siefert, Jayaratne & Chess, 1991). Lack of recognition from
managers, service recipients, external stakeholders and colleagues devalues
employees and is closely associated with feeling of inefficacy (Cordes &
Dougherty, 1993; Maslach et al., 1996).
2.1.6 5th
Independent Variable:
Self-efficacy
According to Wood and Bandura studies (as cited in Karatepe & Olugbade,
2009), self-efficacy is defined as “people‟s beliefs in their capabilities to
mobilize the motivation, cognitive resources, and courses of action needed to
exercise the control over events in their lives”. Consistently with Bandura
studies as cited in Deese (2009) stated that, perceived self-efficacy always
refers to the beliefs in one‟s capabilities to organize and execute the courses of
action required to produce given attainments. In Bandura, Gist and Mitchell

Page 37 of 206
EMPLOYEE ENGAGEMENT
studies (as cited in Moran & Gareis, 2004) defined that, self-efficacy has a
significant impact on goal-setting, level of aspiration, effort, adaptability, and
persistence. Also, as stated in the studies of Chen, Gully, and Eden (as cited in
Xanthopoulou, Bakker, Demerouti & Schaufeli, 2009), self-efficacy refer as
an individual‟s perceptions of their ability to meet demands in a broad array of
context. From the studies of Bandura (as cited in Deese, 2009), individuals
with high self-efficacy are more likely to attempt a task than those who
believe that they cannot succeed, in which this is similar to the expectancy
beliefs that the effort is leads to performance. Thus, when an employee
believes that his or her effort will lead to certain level of performance, this
will influence that particular employee behavioral choices (putting more effort
and staying on task). This can be seen in an engaged employees in those who
expect to perform successfully are more likely to work with vigor, dedication,
and absorption.
As stated by researchers among the studies, self-efficacy is one of the key
personal resources that lead to employee engagement. In the studies of
Hobfoll, Johnson, Ennis and Jackson (as cited in Deese, 2009) explained that,
personal resources are aspects of oneself that help to persist through
challenges and obstacles. According to Bakker and Demerouti (2008),
employees who possess personal resources including self-efficacy, optimism,
self-esteem, resilience and active coping style enables them to control their
work environment and achieve success in their career. This supported by the
studies of Hobfoll as cited in Karatepe and Olugbade (2009) which proposed
the Conservation of Resources (COR) theory, resources are defined as “those
objects, personal characteristics, conditions, or energies that are valued by the
individual or that serve as a means for attainment of these objects, personal
characteristic, conditions, or energies”. In relation to the COR theory in the
studies of Hobfoll (as cited in Deese, 2009), it refers to those who have stable
resources pool and likely to invest resources for the future gain. Thus,

Page 38 of 206
EMPLOYEE ENGAGEMENT
employees who have greater self-efficacy will be more likely to be engaged in
their work through maintained vigor (effort) and absorption (passion) that
constitutes engagement. Apparently, self-efficacy is serves as one of the key
personal resources in this COR theory. This is also consistent with the VIE
theory which stated in Pinder study as cited in Deese (2009) that employees
who believe their effort will lead to higher satisfactory performance will be
more likely to exert more effort to perform. Therefore, this personal resource
(self-efficacy) that supported by both COR and VIE theories indicate that
people who believe that they will succeed in their career will be more likely to
try (Deese et al., 2009) and generally will be more engaged in their work
(Bakker et al., 2008).
Followed the studies by Luthans, Youssef, and Avolio (as cited in Othman &
Nasurdin, 2011), in order to promote high work engagement in the nursing
staffs, nurses serve as boundary-spanner of healthcare organizations in which
it needs to have higher psychological capital (PsyCap). This PsyCap refers as
an individual‟s positive state of development and characterized by self-
efficacy, optimism, hope, and resilience which will lead to greater work
engagement and higher job performance in the organization. Consequently, it
may play an important role in predicting the employee engagement in
healthcare organizations. In Gist and Mitchell studies (as cited in Karatepe &
Olugbade, 2009), self-efficacy is derived from social cognitive theory, and it
is a positive psychological strength which stated in Luthan study as cited in
Karatepe and Olugbade (2009). According to Schaufeli studies (as cited in
Mendes & Stander, 2011), engaged employees see themselves as competent in
dealing with their job demands and have positive self-efficacy. Maslach,
Leiter and Maslach studies (as cited in Simpson, 2009) proposed that, high
energy, high involment, and high efficacy are characteristics of engagement.
As discussed in Karatepe and Olugbade (2009), there is an empirical evidence
demonstrated a linkage between self-efficacy and employee engagement and

Page 39 of 206
EMPLOYEE ENGAGEMENT
self-efficacy is one of the personal resources which will be positively and
strongly influence the three main dimensions (vigor, dedication, and
absorption) of employee engagement. This also specifically explained in the
Xanthopoulou study as cited in Karatepe and Olugbade (2009) that particular
personal resource (self-efficacy) enhanced employees‟ work engagement.
Lastly, Deese et al. (2009) also stated that, self-efficacy predicted both vigor
and dedication and this indicated that self-efficacy is one of the key players in
engagement prediction.
2.2 Review of Relevant Theoretical Models
2.2.1 Alan M. Saks and Joseph L. Rotman (2006)
Figure 2.1: A Model of Antecedents and Consequences of Employee Engagement.

Page 40 of 206
EMPLOYEE ENGAGEMENT
Adapted from: Saks, A.M. and Rotman, J.L. (2006). Antecedents and
Consequences of Employee Engagement: A model of antecedents and
consequences of employee engagement. Journal of Managerial Psychology,
21(7), 600-619.
A comprehensive framework of antecedents and consequences of employee
engagement was advanced by Kahn (1990) and Maslach et al. (2001) model.
Saks and Rotman (2006) had developed a theoretical conception which relies
on framework developed by Kahn (1990) and Maslach et al. (2001) and tries
to extend it in several ways.
At the core of the model are two important types of employee engagement:
job and organization engagements. This follows from the conceptualization of
engagement as role related. Therefore, the model explicitly acknowledges this
by including both job and organization engagements.
The model starts with the antecedents which includes job characteristics,
perceived organization support, perceived supervisor support, rewards and
recognition, procedural justice and lastly distributive justice. It shows that the
antecedent as mention in the framework is positively related to employee
engagement. Engagement has been found to be positively related to
organizational commitment and negatively related to intention to quit and it is
believed to be related to job performance and extra-role behavior.
Therefore, it is predicted that the job and organization engagement have
positively related to job satisfaction, organizational commitment and
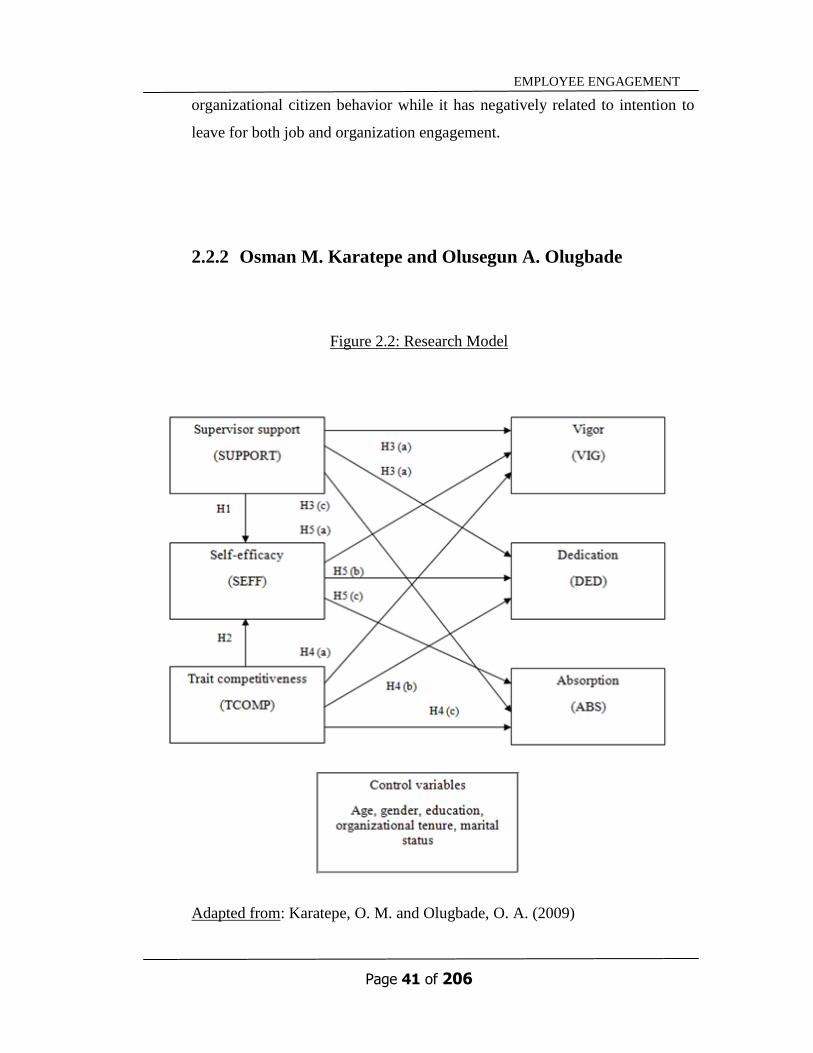
Page 41 of 206
EMPLOYEE ENGAGEMENT
organizational citizen behavior while it has negatively related to intention to
leave for both job and organization engagement.
2.2.2 Osman M. Karatepe and Olusegun A. Olugbade
Figure 2.2: Research Model
Adapted from: Karatepe, O. M. and Olugbade, O. A. (2009)

Page 42 of 206
EMPLOYEE ENGAGEMENT
Figure 2.2 is a proposed theoretical or conceptual framework which hasbeen
developed based on literature review. It illustrates and links all the variables
tested in the research. The relationships among all the independent variables
and dependents variables are being displayed in this conceptual framework.
In the conceptual framework, there are three independent variables indicated
from the detailed and vast reading on literature review which then to be used
in determining their relationship with dependent variables. As shown in the
framework, the independents variables are supervisor support (SUPPORT),
self-efficacy (SEFF) and trait competitiveness (TCOMP). On the other hand,
the dependent variables are vigor (VIG), dedication (DED) and absorption
(ABS).
According to the framework, self-efficacy is being enhanced by both
supervisor support and trait competitiveness. Furthermore, control variables
such as age, gender, education, organizational tenure, and marital status are
integrated into the framework.
This framework reveals that frontline employees‟ work engagement has been
enhanced by both job and personal resources. The framework implies that
support from supervisors in the workplace increases the feeling of vigor,
dedication and absorption for frontline employees. Besides, frontline
employees who are competitive and self-efficacious in workplace will have a
high level of vigor, dedication and absorption as well.

Page 43 of 206
EMPLOYEE ENGAGEMENT
2.2.3 Arnold B. Bakker and Evangelia Demerouti
Figure 2.3: The JD-R Model of Work Engagement
Adapted from: Bakker, A.B. and Demerouti, E. (2008) based on Bakker &
Demerouti (2007).

Page 44 of 206
EMPLOYEE ENGAGEMENT
According to Bakker (as cited in Bakker & Demerouti, 2008) and Demerouti
studies (as cited in Bakker & Demerouti, 2008), the overall model of the
employee engagement have demonstrated two assumptions in which draw
from the job resources demand-resources (JD-R) model. In the first
assumption stated that job resources including social support from colleagues
and supervisor, performance feedback, skill variety, and autonomy, start a
motivational process that leads to work engagement. The second assumption
explained that job resources become more salient and gain their motivational
potential when employees are confronted with high job demand (including
workload, emotional demands, and mental demands).
On the other hand, the Xanthopoulou study (as cited in Bakker & Demerouti,
2008) also expanded the work on JD-R model by indicating that job resources
and personal resources are mutually related and the personal resources can be
independent predictors of work engagement. Therefore, employees who score
high on optimism, self-efficacy, resilience, and self-esteem are able to
mobilize their job resources and more engaged to their work.
As result showed in Figure 2.3, job resources (autonomy, performance
feedback, social support, supervisory coaching, etc.) and personal resources
(optimism, self-efficacy, resiliency, self-esteem, etc.) independently or
combined predict work engagement. Both job and personal resources have a
positive impact on job performance. Thus, employees who engaged and
perform well are able to create their own resources, which then foster
engagement and create a positive gain spiral.

Page 45 of 206
EMPLOYEE ENGAGEMENT
2.3 Proposed Theoretical/ Conceptual Framework
Figure 2.4: Model of Proposed Framework
Independent Variable (IV) Dependent Variable (DV)
Source: Developed for the research

Page 46 of 206
EMPLOYEE ENGAGEMENT
A proposed theoretical or conceptual framework has been developed based on the
literature review. This is a diagram that visually displays and connects the variables in
which to be tested in this research. The conceptual framework demonstrates the
relationships among all the independent variable and dependent variables. It also
provides a general framework for data analysis and essential in preparing a research
for using descriptive and experimental methods. In this study, the independent
variables are consists of perceived supervisor support, perceived organization support,
procedural justice, reward and recognition, and self-efficacy.
The dependent variable will be examined in order to determine the influences of all
the independent variables toward employee engagement. Based on the past research
findings, researchers had viewed the framework and developed five hypotheses to
identify the relationship of the independent variables and the dependent variable is
shown above. Furthermore, research objectives, research questions, and research
hypotheses would assist in emphasizing the variables which included in this study.
2.4 Hypotheses Development
2.4.1 Relationship between Perceived Supervisor Support
and Employee Engagement
Based on the Corporate Leadership Council meta-analysis as stated in Rivera
et al. (2011) the role of an employee‟s direct manager was the key to influence
the level of employee engagement. Furthermore, the Nursing and Midwifery
Services Strategic Direction for 2011-2015 stated that emphasis the strong

Page 47 of 206
EMPLOYEE ENGAGEMENT
nursing leadership on addressing priority health issues by “ensuring the active
engagement and leadership of nurses and midwives at every level of health
policy/program development and decision-making” (Wilson & Fowler, 2012).
The perceived supervisor support is believable an important in predictor of
employee engagement because the lack of support from supervisors has been
found to be connected to burnout (Saks & Rotman, 2006). It was one of the
variables that are appropriate to capture the substance of social support, which
refers to “an interpersonal transaction that involves emotional concern,
instrumental aid, information, or appraisal” (Saks & Rotman; Carlson &
Perrewe studies as cited in Karatepe & Olugbade, 2009). According to the
Malslach et al. model (as cited in Saks & Rotman, 2006) stated that a lack
social support has also significantly found to be connected to burnout, and a
research done by Schaufeli and Bakker pointed out a measure of job resources
that includes support from co-workers prophesied engagement.
There have the several researches shown that a positive relationship between
job resource and work engagement. Job resources were significantly and
positively connect with work engagement (Llorens study as cited in Karatepe
& Olugbade, 2009; Hakanen, Bakker & Schaufeli; Saks; Xanthopoulou et al.
study as cited in Xanthopoulou, 2009; Bakker & Demerouti, 2008).
Demerouti et al. (as cited in Karatepe & Olugbade, 2009) indicated feedback,
rewards, job, control, participation, job security, and supervisor support are
job resources and it was significant predicted of engagement. Hence,
supervisor support is an important job resource affecting work engagement.
Furthermore, there is lack of study looking at the direct influences of
leadership, using a clear measure of engagement (Xu & Thomas, 2010). Those
Page 48 of 206
EMPLOYEE ENGAGEMENT
studies that had conducted frequently were on the relationship of leadership
dimensions with engagement, or antecedents of engagement rather than
engagement itself. Moreover, researchers mostly have certified both indirect
relations (Kahn; May et al.; Rich et al. study as cited in Xu & Thomas, 2010)
and moderating effects of leadership on engagement (Bakker & Demerouti
study as cited in Xu & Thomas, 2010).
Accordingly, researchers hypothesized that:
H10: There is no significant relationship between perceived supervisor
support and employee engagement.
H11: There is a significant relationship between perceived supervisor
support and employee engagement.
2.4.2 Relationship between Perceived Organization Support
and Employee Engagement
Based on the model of antecedents and consequences of employee
engagement (Saks & Rotman, 2006), it has found that the perceived
organization support is positively related to employee engagement. Rhoades et
at. (2001) study indicated that organization support is also positively related to
employee engagement. Saks (2006) study suggests that employees who
perceived higher organizational support will more likely connect with greater
Page 49 of 206
EMPLOYEE ENGAGEMENT
levels of engagement to their individual job roles. According to Pazy and
Ganzach (2006), it is expected to have positive attitudinal and behavioral
outcomes with high perceived organization support. It shows that perceived
organization support is related to good mood and most notably to attitudinal
and behavioral indicators of commitment such as withdrawal and tardiness
(Pazy & Ganzach, 2006).
However, Makanjee et al. (2006) research explained that POS should
strengthen the belief of the employees in which the organization recognizes
their performance by having favorable outcomes for both employees and
organization. These includes increase affective commitment and performance,
reduced turnover intention and increase job satisfaction. Loi et al. (2006) also
state that high perceived organization support obliged to respond favorably to
the organization in the form of positive job attitudes or organizational
behaviors. Perceived organization support is relatively important to
organizational commitment (Loi et al., 2006).
Accordingly, researchers hypothesized that:
H20: There is no significant relationship between perceived organization
support and employee engagement.
H21: There is a significant relationship between perceived organization
support and employee engagement.

Page 50 of 206
EMPLOYEE ENGAGEMENT
2.4.3 Relationship between Procedural Justice and
Employee Engagement
Based on the model of antecedents and consequences of employee
engagement (Saks & Rotman, 2006), the study found that the procedural
justice is positively related to employee engagement. Tyler and Blader (2003)
also argue that people who perceive fair procedure, authority and feel
respected by others in their groups are predicted to become highly engaged to
the group and voluntarily motivated to act in ways that make use of distinctive
qualities and abilities. It shows that people is using justice information to
determine the social identity in within the group.
Clay-Warner et al. (2005) indicates that procedural justice has positive
relationship to the level of engagement of the employee in an organization.
Blader and Tyler (2009) shows that procedural justice has a big impact on
employee engagement and the relationship is a positive relationship. This is
shown through the result of the research as employee who perceived the
procedure and decision making are fairly made will be more willing to engage
themselves in the group.
Inoue, Kawakami, Ishizaki, Shimazu, Tsuchiya, Tabata, Akiyama, Kitazume
and Kuroda study (as cited in Malinen et al., 2013) found a positive
relationship between procedural justice perceptions and work engagement.
Robinson study (as cited in Malinen et al., 2013) also indicates that
employee‟s perception on procedural justice drives engagement. This is
consistent with Malinen et al. (2013) study as the findings of the research
shows employee‟s perception of procedural justice influenced the level of
engagement in positive ways.

Page 51 of 206
EMPLOYEE ENGAGEMENT
Accordingly, researchers hypothesized that:
H30: There is no significant relationship between procedural justice and
employee engagement.
H31: There is a significant relationship between procedural justice and
employee engagement.
2.4.4 Relationship between Reward and Recognition and
Employee Engagement
In the research done by Maslach and Leiter (as cited in Willoughby, 2011),
indicates that reward and recognition are proposed to be crucial facilitators for
engagement. Besides, according to Bhattacharya and Mukherjee (2009),
reward plans play a vital role and function in energizing, motivating and
inspiring employees and hence, it serves as „engaging‟ employees.
Furthermore, reward acts as the „catalyst‟ in generating larger proportion of
„engaged‟ employees which helps in improving employees‟ performance and
increasing the productivity in the organization.
Apart from that, Mone and London (2009) suggests that reward and
recognition are significant to employee engagement and they helps in boosting
the morale, satisfaction, and motivation level of employees. In addition,
research from Brun and Dugas (2008) indicates that recognition links to

Page 52 of 206
EMPLOYEE ENGAGEMENT
performance of employees and successfulness of the company (Mone,
Eisinger, Guggenheim, Price, & Stine, 2011).
On the other hand, based on the recent studies, Chappell and Novak, 1992;
Maslanka, 1996; Siefert, Jayaratne, and Chess, 1991, the rises of individual‟s
vulnerability to burnout is due to insufficient reward whether in social,
financial or institutional aspects ( Willoughby, 2011). According to Mone et al.
(2011), employees could suffer from emotional and mental distress and
burnout as well if their efforts are not being recognized. As such, a significant
relationship between reward and recognition and employee engagement can
be shown based on the evidences and researches as shown above.
Accordingly, researchers hypothesized that:
H40: There is no significant relationship between reward and recognition
and employee engagement.
H41: There is a significant relationship between reward and recognition
and employee engagement.

Page 53 of 206
EMPLOYEE ENGAGEMENT
2.4.5 Relationship between Self-efficacy and Employee
Engagement
According to Bakker, Gieveld and Rijswijk study (as cited in Othman &
Nasurdin, 2011; Bakker & Demerouti, 2008) concluded the research among
female school principals those with high personal resources which include
self-efficacy, resilience, and optimism scored highest in work engagement.
Similarly with the studies by Xanthopoulou as cited in Karatepe and Olugbade
(2009) found that, the self-efficacy elevated work engagement among the
sample of flight attendants in the Netherlands. In further, Chemers, Hu and
Garcia studies (as cited in Deese, 2009) explained that self-efficacy has been
investigated in a variety of context, including stress in first year college
students. Results showed that students who score higher in academic self-
efficacy are more likely to view academic work as challenges (rather than as a
threat), more likely to expect academic success, and more likely to succeed.
Generally, self-efficacy has been showed that it has no influence in vigor and
dedication. However, se-efficacy enhances employees‟ feelings of absorption.
This finding recommends that employees have strong beliefs in their
capabilities become more immersed in the work. Followed by the study of
Schaufeli (as cited in Bakker & Demerouti, 2008) found that engaged
employees have high energy and self-efficacy. Consequently, this assists them
to exercise influence over events that affect their lives in which their positive
attitude and activity level enables them to create their own positive feedback
in terms of appreciation, recognition, and success. In Maslach, Schaufeli and
Leiter (as cited in Stander & Rothmann, 2010), stated that there is a strong
correlation between self-efficacy and employee engagement. Consequently in
Xanthopoulou study (as cited in Bakker & Demerouti, 2008), results also
found that engaged employees are highly self-efficacious and they believe

Page 54 of 206
EMPLOYEE ENGAGEMENT
they are able to meet the demands they face in broad array of contexts. From
the result, Deese et al., (2009) showed that nurses‟ self-efficacy are positively
related to their work engagement in which this indicated that nursing staffs
who are more efficacious are also more likely to work with high level of
energy (vigor) and find meaning in their work (dedication).
Accordingly, researchers hypothesized that:
H50: There is no significant relationship between self-efficacy and
employee engagement.
H51: There is a significant relationship between self-efficacy and
employee engagement.
2.5 Conclusion
This chapter talks on relevant literature in our proposed framework and discussed
about our hypotheses development. Research methodology of this study will be
discussed in detailed in the following chapter, Chapter 3.

Page 55 of 206
EMPLOYEE ENGAGEMENT
CHAPTER 3: METHODOLOGY
3.0 Introduction
In this chapter, the methodology of the research will be discussed. Chapter three has
undergone the steps of research design where it specifies whether qualitative or
quantitative research is used and justify whether it is exploratory, descriptive or
casual research. It also covers the data collection methods which primary data will be
collected from respondents are discussed and the collection of secondary date will be
shown. Next, the procedure of sampling design is being selected are discussed.
Research instrument such as pilot study and questionnaire development, constructs
measurement, methods of data processing and data analysis also will be included in
this chapter.
3.1 Research Design
Shank (2002) defines qualitative research as “a form of systematic empirical inquiry
into meaning” where systematic means planned, ordered and public (as cited in
Ospina, 2004). It is based on the rules agreed by the members in the qualitative
research community (as cited in Ospina et al., 2004). Quantitative research is
different with the qualitative research where it focuses on measurement and proof
(Hesketh & Laidlaw, n.d.). It is only considered as meaningful if it can be observed

Page 56 of 206
EMPLOYEE ENGAGEMENT
and counted because its key characteristics are numerical data that permits a range of
statistical analysis (Hesketh et al., n.d.).
There are three types of business research that used to classify on the basis of
technique or purpose: (1) descriptive research, (2) exploratory research and (3) causal
research. In this research, it consists of numerical measurements and statistical
analysis which falls to the quantitative research. Causal research is being chosen as
the research design in the research. It shows the effect of one variable on another and
it is created to identify a cause-and-effect relationship.
The causal research is used to determine the relationship between the independent
variable (perceived supervisor support, perceived organization support, procedural
justice, reward and recognition, and self-efficacy) and dependent variable (employee
engagement). When there is a cause-and-effect relationship between variables, causal
research was undertaken.
3.2 Data Collection Method
Data and information is very important for every research. There are two types of
data which are primary and secondary data. Data collection from both primary and
secondary data sources are essential for researchers to gather data and information
regarding this research which is used to test the hypotheses and answer research
questions as described earlier.

Page 57 of 206
EMPLOYEE ENGAGEMENT
3.2.1 Primary Data
The original or new data that is collected for a specific research purpose is
primary data. It is information that obtained from first-hand sources by using
techniques such as in-depth interview, participant observation, or focus group
(Hox & Boeiji, 2005). In this study, the method for collecting primary data
which is questionnaires has been conducted to answer the research questions
stated in Chapter 1.4. This set of questionnaires are extracted and adopted
from journals articles written by previous researchers in related area of study.
The questionnaires consist of all six parts that used to test the dependent
variable and the five independent variables.
A survey by using structured questionnaires is an important method in which
it involves collecting data from a large number and representative sample of
target respondents (Hox et al., 2005). According to Sekaran and Bougie
(2010), the main advantage through the uses of questionnaires is that the
researchers able to obtaining the data from respondents within a short period
of time. Besides, the questionnaires also help to develop hypotheses through
the responses and feedback of relevant respondents. This method providing
anonymity in which the answer of respondents are being kept strictly
confidential.
Page 58 of 206
EMPLOYEE ENGAGEMENT
3.2.2 Secondary Data
According to Sekaran et al. (2010), secondary data can be defined as
information gathered by someone other than the researcher conducting the
current study. Secondary data is the existing data that can be obtained through
various published information for different purposes and reused for another
research question (Hox et al., 2005). Data and information can be gathered
from existing sources such as academic and professional journals, articles,
published books and other online sources. In this study, most of the journals
are retrieved from online database such as ProQuest, ScienceDirect, Scopus,
Emerald, and others to conduct the research especially for the literature review
of studies. Moreover, this study also using the data collected from earlier
studies by other researchers such as the official statistics via Internet to
support the problem statement of research.
A secondary data is useful for assist researchers to seek for the sources
effectively and having a better understanding of research problem. Both
academic and professional journals are essential and reliable sources of
information in which it provide a detailed framework and description of the
study. It has become easier to retrieve data and information in a usable format
due to the widespread of email and the World Wide Web (Hox et al., 2005).
Besides, it will be less time consuming and less costly of obtaining data and
information by seeking for secondary data (Sekaran et al., 2010).

Page 59 of 206
EMPLOYEE ENGAGEMENT
3.3 Sampling Design
Sampling is a process of selecting a small number of units from the total population
of interest to represent the whole population in the study (Zikmund, Babin, Carr, &
Griffin, 2010). According to Zikmund et al. (2010), a sample is defined as a subset of
larger population in which the purpose serves to enable researchers to estimate some
of the unknown characteristic of the population. This is very important as researchers
are not able to conduct survey on the whole population due to the financial and time
constraint. The sampling methods are probability and non-probability sampling.
Probability sampling consists of simple random sampling, systematic sampling,
stratified sampling, cluster sampling and multistage area sampling while non-
probability sampling consists of convenience sampling, quota sampling, judgment
sampling and snowball sampling.
3.3.1 Target Population
The first step of the sampling process is to define target population. Target
population is the specific number of group or people that is the respondents of
the research conducted. The target population for this research is all hospital-
based nurses in the nursing industry in Malaysia. Both public and private
hospital-based nurses are the target population.
Page 60 of 206
EMPLOYEE ENGAGEMENT
3.3.2 Sampling Frame and Sampling Location
Choosing the sampling frame and sampling location is the second step in
sampling process. Since the method sampling used in this research is based on
non-probability techniques, all public and private hospital-based nurses in
Kedah, Penang, and Perak are targeted randomly based on convenience
sampling. Zikmund et al. (2010) says that sampling frame is also called the
working populations whereby it provides the list can be worked with as the
whole population might not be accessible. The whole research is based on the
location where the researchers are able to reach to.
3.3.3 Sampling Elements
Sampling elements are the respondent involved in the study. All public and
private hospital nurses in Kedah, Penang, and Perak are being targeted as the
respondents of this research. The questionnaires are being distributed to the
nurses who are being targeted randomly based on availability. Researchers
had been travelled to several public and private hospitals around the targeted
sampling location to distribute the questionnaires. Hospital-based nurses are
being selected as the sampling element as nursing is a career characterized by
heavy workload and nurses tend to experience significant stress and reporting
high level of burnout, therefore, the research is being conducted on studying
the relationship between perceived supervisor support, perceived organization
support, procedural justice, reward and recognition, and self-efficacy with the
variance in employee engagement in nursing industry.
Page 61 of 206
EMPLOYEE ENGAGEMENT
3.3.4 Sampling Techniques
Basically, sampling techniques are divided into two categories: probability
techniques and non-probability techniques. In this study, researchers select
non-probability sampling as the research method. Convenience sampling of
non-probability sampling is being chosen to be used in this research.
Convenience sampling is being defined as gathering information from
members of the population who are most conveniently available (Zikmund et
al., 2010). This is the best way of collecting information quickly as
researchers are able to obtain a large number of completed questionnaires
efficiently and economically. Due to the constraint of time and limited budget,
convenience sampling method is the most suitable sampling method to be
used. Moreover, nurses are well known for their heavy workload and a lot of
duty to be performed during their working hour and therefore, convenience
sampling will be the most suitable method to be used as the researchers can
distribute the questionnaire to the available nurses at that moment to let them
to fill up the questionnaire.
3.3.5 Sampling Size
Sampling size is the targeted number of respondent for the research conducted.
It is generally accepted that with a greater sample size, the outcome of the
result will be more accurate. The sample size of this study is relatively small
compare to the actual sample size requirement for the whole population.

Page 62 of 206
EMPLOYEE ENGAGEMENT
According to Sekaran and Bougie (2010), the sample size of the total
population of 79700 nurses should be more than 283 as 283 responses are
needed for 75000 number of population. However, taken into account the time
and other constraints, for undergraduate degree program, only 100-150 sample
size is required in order to fulfill the completion of final year project.
Therefore, 150 questionnaires are being distributed to the targeted respondents
in this research.
3.4 Research Instrument
3.4.1 Questionnaire Survey
According to Sekaran et al. 2010, questionnaire is a pre-formulated written set
of questions to which the respondent records the answers, usually within
rather closely delineated alternatives.
To conduct our research study, the research instrument which we chosen to
used is self-administered questionnaires. It was used as a tool to collect the
primary data. The questionnaire is being design by using fixed-alternative
questions. It has been split into four types which were (a) simple-dichotomy
(dichotomous), (b) determined-choice question, (c) frequency-determination
question, and (d) checklist question.

Page 63 of 206
EMPLOYEE ENGAGEMENT
Simple-dichotomy question is requires the respondent to choose one of two
alternatives (e.g. gender- male or female), determinant-choice question is
requires the respondent to choose one response from among multiple
alternatives (e.g. race, age), frequency-determination question is ask for an
answer about general frequency of occurrence (e.g. often, occasionally, or
never), and checklist question is allows the respondent to provide multiple
answers to a single question by checking off items. There was only simple-
dichotomy and determination question being used in our questionnaire. The
paper questionnaires will be print out and the in-person drop-off survey
method will be used.
There were 200 sets of questionnaires distributed to the respondents and each
questionnaire is collected back within 10 to 20 minutes and around 5 days is
being using to collect all of the questionnaires. The actual number of
questionnaire needed is 150 sets only. Those questionnaire that consist the
problem of illogical response (outline response-abnormal answer) and illegal
code (answer given is not provide in the question) will be taken out and, the
problem of omissions (missing data) will be key in as 99 (variable).
3.4.2 Questionnaire Design
The questionnaire divided into two sections: section A (demographic profile)
and section B. Section A consists of the data includes gender, age group,
nationality, race, monthly income, highest educational degree earned, and
prior clinic experience. Section B consists of the questions for the five
independent variables (perceived supervisor support, perceived organization
support, procedural justice, reward and recognition, and self-efficacy) and one

Page 64 of 206
EMPLOYEE ENGAGEMENT
dependent variable (employee engagement). There are seven to eight
questions each for independent variable and five to seven questions for each
dimension of dependent variable (vigor, dedication and absorption).
3.4.3 Distribution Method
Non-probability sampling design method has been used. It was a sampling
design in which the elements in the population do not have a known or
predetermined chance of being selected as sample subjects (Sekaran et al.,
2010). Non-probability sampling is cost saving but it requires all the
respondents to be homogenous and zero probability (not everyone have the
chance to be selected) of selection.
The convenience sampling from the non-probability sampling method is being
selected as the distribution method. Convenience sampling method is the way
whereby the researchers handed the questionnaires to the respondent (nurses)
randomly without choosing. It is the best way of getting some basic
information quickly and efficiently (Sekaran et al, 2010).

Page 65 of 206
EMPLOYEE ENGAGEMENT
3.4.4 Reason for Sampling
The reasons for using sample rather than collecting data from the entire
population are: (1) less cost and time, (2) less errors due to less fatigue, and (3)
destruction of elements avoided. Sampling is cost and time saving because in
real world, constraints will be faced and that is impossible to test on whole
population. Besides that, it also lessens errors due to less fatigue because the
size of data needed to key in is not so large. Lastly, due to the reason that
certain item is impossible to be tested as a whole, sampling is used to avoid
destruction of elements.
3.4.5 Pilot Studies
The main purpose to conduct the pilot test is to test the respondents‟
understanding toward the question. It also can check on the reliability of the
questionnaires to ensure the effectiveness of the questionnaire. It is pre-testing
process that conducted before the actual set of questionnaire is being
distributed and to make any adjustment such as the sequences of questions,
construction error of question and so on.
There are 12 sets of questionnaires being collected to run the pilot test via
online questionnaires. Online questionnaires also known as internet surveys, it
is a self-administration questionnaire posted on a Website. The SAS version
5.1 is being used to run the reliability result of the questionnaires in the pilot

Page 66 of 206
EMPLOYEE ENGAGEMENT
test. Table 3.1 shows the internal consistency of the variables while Table 3.2
shows the result of the reliability analysis.
Source: Sekaran, U., & Bougie, R. (2010). Research methods for business:
A skill building approach (5th ed.). Chichester, West Sussex: John Wiley &
Sons, Inc, (page325.)
Table 3.2: Reliability Analysis
Variables Dimensions Cronbach’s Alpha
Independent Variables
Perceived Supervisor
Support 0.754717
Perceived Organization
Support 0.746804
Procedural Justice 0.838865

Page 67 of 206
EMPLOYEE ENGAGEMENT
Reward and
Recognition 0.774217
Self-efficacy 0.762421
Dependent Variable Employee Engagement 0.816823
Source: Data generated by SAS version 5.1
Interpretation of Perceived Supervisor Support
The reliability test shows the alpha value is 0.754717. This value 0.754717
falls within the range 0.70 to 0.80 showing the 8 items measuring perceived
supervisor support have good reliability.
Interpretation of Perceived Organization Support
The reliability test shows the alpha value is 0.746804. This value 0.746804
falls within the range 0.70 to 0.80 showing the 7 items measuring perceived
organization support have good reliability.
Page 68 of 206
EMPLOYEE ENGAGEMENT
Interpretation of Procedural Justice
The reliability test shows the alpha value is 0.838865. This value 0.838865
falls within the range 0.80 to 0.95 showing the 8 items measuring procedural
justice have very good reliability.
Interpretation of Reward and Recognition
The reliability test shows the alpha value is 0.774217. This value 0.774217
falls within the range 0.70 to 0.80 showing the 7 items measuring reward and
recognition have good reliability.
Interpretation of Self-efficacy
The reliability test shows the alpha value is 0.762421. This value 0.762421
falls within the range 0.70 to 0.80 showing the 8 items measuring self-efficacy
have good reliability.

Page 69 of 206
EMPLOYEE ENGAGEMENT
Interpretation of Employee Engagement
The reliability test shows the alpha value is 0.816823. This value 0.816823
falls within the range 0.80 to 0.95 showing the 18 items measuring employee
engagement have very good reliability.
With reference to table 3.1, all of the variables must have an alpha value, α in
the range of 0.6 to 0.95. The overall results of the five independent variables
with the one dependent variable show a good reliability and indicate there is
an internal consistency of reliability in this study.
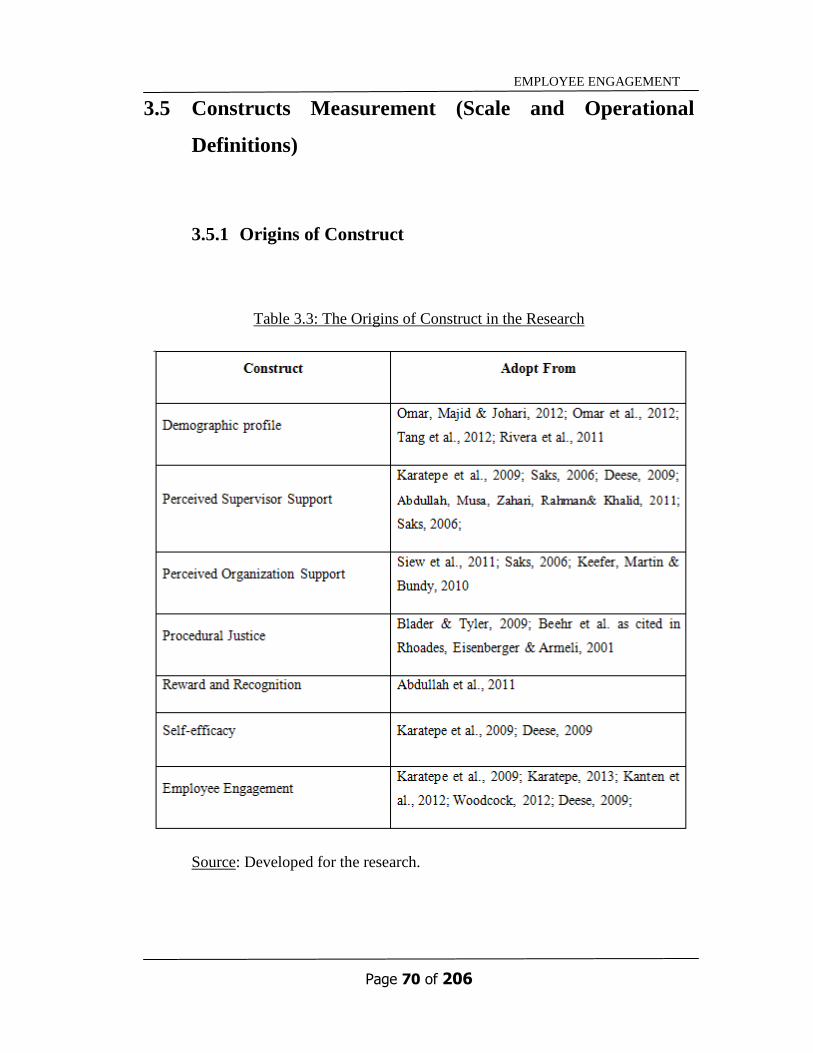
Page 70 of 206
EMPLOYEE ENGAGEMENT
3.5 Constructs Measurement (Scale and Operational
Definitions)
3.5.1 Origins of Construct
Table 3.3: The Origins of Construct in the Research
Source: Developed for the research.

Page 71 of 206
EMPLOYEE ENGAGEMENT
3.5.1.1 Modified Operational Definition of Construct
Table 3.4: Modified Operational Definition of Construct for
Perceived Supervisor Support

Page 72 of 206
EMPLOYEE ENGAGEMENT
Source: Developed for the research.
Table 3.5: Modified Operational Definition of Construct for Perceived Organization
Support

Page 73 of 206
EMPLOYEE ENGAGEMENT
Source: Developed for the research

Page 74 of 206
EMPLOYEE ENGAGEMENT
Table 3.6: Modified Operational Definition of Construct for
Procedural Justice

Page 75 of 206
EMPLOYEE ENGAGEMENT
Source: Developed for the research.

Page 76 of 206
EMPLOYEE ENGAGEMENT
Table 3.7: Modified Operational Definition of Construct for Reward and Recognition
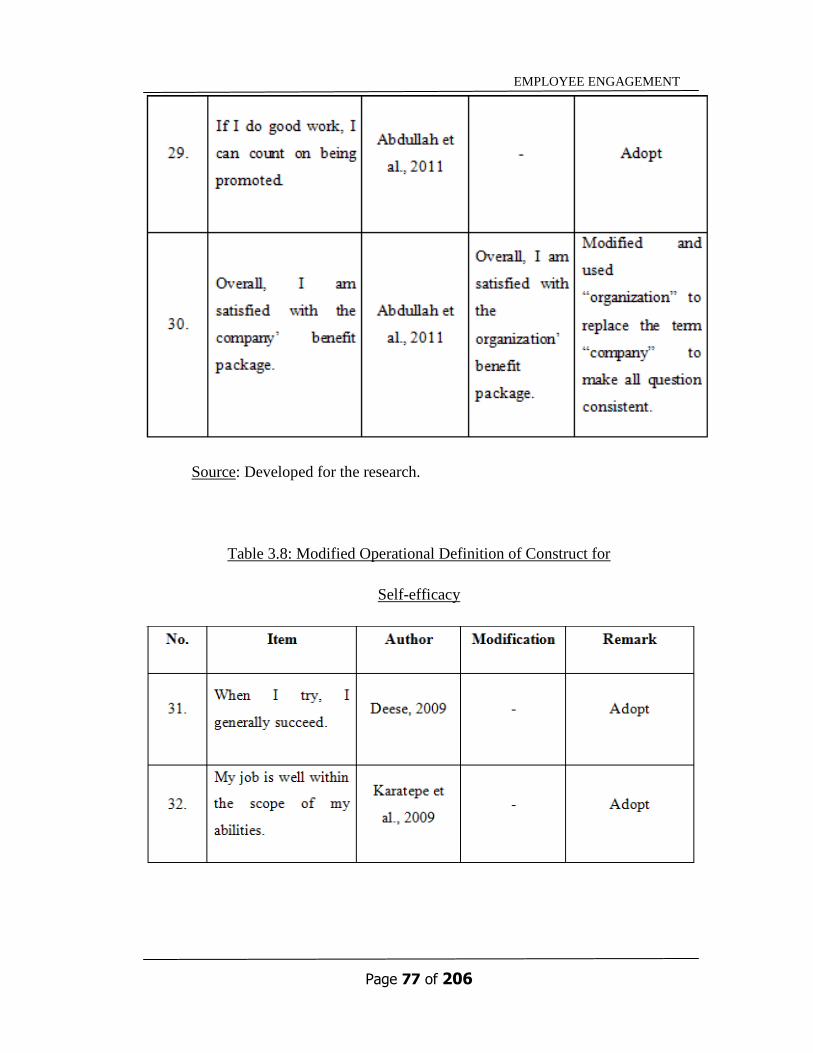
Page 77 of 206
EMPLOYEE ENGAGEMENT
Source: Developed for the research.
Table 3.8: Modified Operational Definition of Construct for
Self-efficacy

Page 78 of 206
EMPLOYEE ENGAGEMENT

Page 79 of 206
EMPLOYEE ENGAGEMENT
Source: Developed for the research.
Table 3.9: Modified Operational Definition of Construct for Employee Engagement

Page 80 of 206
EMPLOYEE ENGAGEMENT
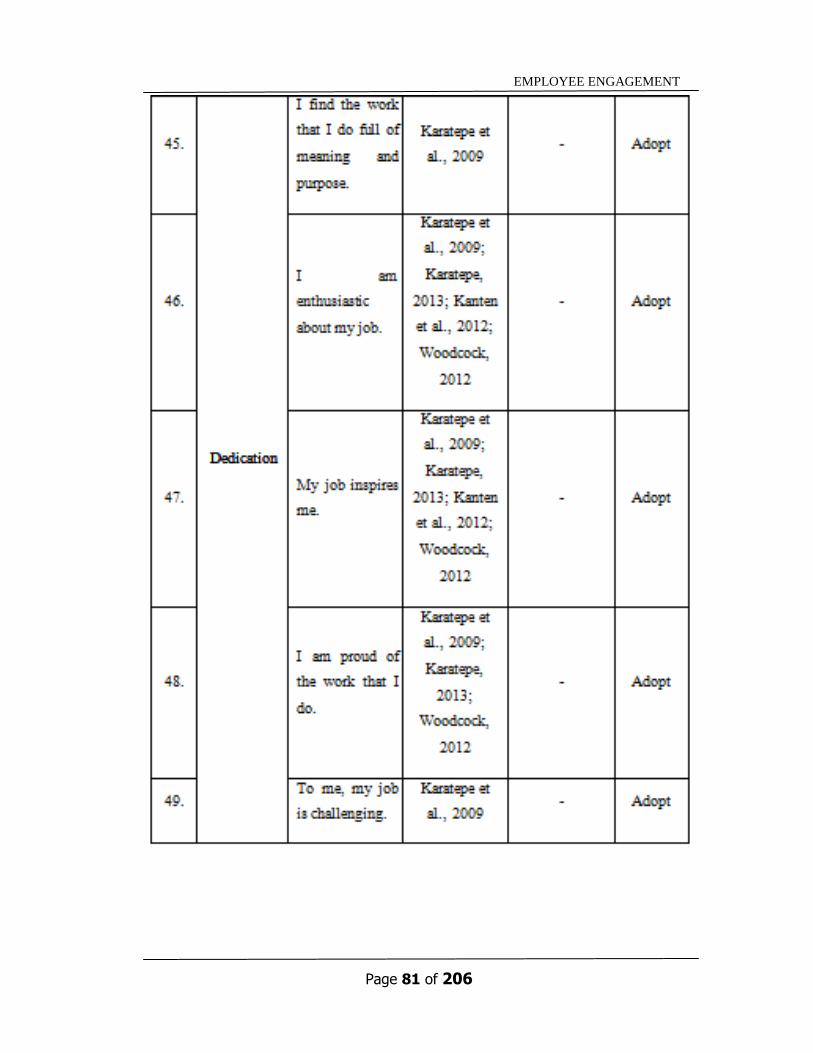
Page 81 of 206
EMPLOYEE ENGAGEMENT

Page 82 of 206
EMPLOYEE ENGAGEMENT

Page 83 of 206
EMPLOYEE ENGAGEMENT
Source: Developed for the research.
3.5.2 Scale Measurement
A scale is a tool or mechanism by which individuals, events, or objects are
distinguished on the variables of interest in some meaningful ways. There are
four basic types of scale (1) nominal; (2) ordinal; (3) interval; and (4) ratio
(Sekaran et al, 2010). Nominal scale and ordinal scale are categorized as non-
metric whereas interval scale and ratio scale are categorized as metric.

Page 84 of 206
EMPLOYEE ENGAGEMENT
3.5.2.1 Nominal Scale
Nominal scale is a scale that categorizes individuals or objects into mutually
exclusive and collectively exhaustive groups, and offers basic, categorical
information on the variable of interest (Sekaran et al, 2010). In section A,
demographic profile of the questionnaire, question 1 (gender), question 3
(nationality), and question 4 (race) are designed by using nominal scale.
3.5.2.2 Ordinal Scale
Ordinal scale is a scale that not only categorizes the qualitative differences in
the variable of interest, but also rank-ordering of these categories in a
meaningful way (Sekaran et al, 2010). In section A, demographic profile of
the questionnaire, there are only question 6 (highest educational degree earned)
is designed by using ordinal scale.
3.5.2.3 Interval Scale
Interval scale is a multipoint scale that taps the differences, the order, and the
equality of the magnitude of the differences in the responses (Sekaran et al,
2010). It shows the differences, order, and distance (arbitrary origin, where
0 °C means existence of temperature). All the questions in section B are
designed by using interval scale. The 5-Likert scale is adopted to allow the

Page 85 of 206
EMPLOYEE ENGAGEMENT
respondents to indicate how strongly they agree or disagree with the statement
of the questions. The range is from “strongly disagree, SD”, “disagree, D”,
“neutral, N”, “agree, A”, to “strongly agree, SA”.
3.5.2.4 Ratio Scale
Ratio scale is a scale that has an absolute zero origin, and hence indicates not
only the magnitude, but also the proportion, and the differences (Sekaran et al,
2010). It shows the difference, order, distance and it has a unique origin (e.g.
0 means absent of something). In section A, demographic profile of the
questionnaire, question 2 (age), question 5 (monthly income), and question 7
(prior clinic experience) are designed by using ratio scale.
3.6 Data Processing
According to Sekaran et al. (2010), after receiving data collected from the
respondents, the next step is to analyze the data to test the research hypotheses.
However, some preliminary steps are necessary to be done before analyzing the data
to test hypotheses. These preliminary steps are crucial to make sure that the data are
accurate, complete, and appropriate for further analysis.

Page 86 of 206
EMPLOYEE ENGAGEMENT
3.6.1 Data Processing
The preliminary steps are also known as data processing steps which involve
data checking, editing, coding, and transcribing. All the uncommon responses
are indentified at the same time as well.
Before proceed to data checking, each questionnaires are being numbered and
counted to ensure that questionnaires are being reverted back to us by the
respondents.
3.6.1.1 Data Checking
Data checking is the first step of data preparation. Each questionnaire is
checked carefully to ensure that is was being filled up properly and to avoid
any error such as illogical response, illegal codes, omissions and inconsistent
responses. Questionnaires with such errors are being removed.
3.6.1.2 Data Editing
Illogical response is an outlier response. An outlier is an observation that is
substantially different from other observations. Therefore, existence of

Page 87 of 206
EMPLOYEE ENGAGEMENT
outliers will impact on the research results. In order to make sure that the
outliers are correct, investigation is made on these responses.
Illegal codes are values that are not specified in the coding instructions. The
best way to check for illegal codes is by frequency distribution. Besides that,
not all respondents answered every question. Omissions may happen because
respondents do not fully understand the question, have no answer for that
question, or not willing to disclose the answer for that question. There are two
ways to handle this problem. First, ignore the blank response during analyzes.
Second, look at the participant‟s pattern of responses to other questions and
from these answers, deduce a logical answer for the question replacing the
missing response. In this case, we choose to ignore the blank response by
coding 99 as missing data to a maximum of two questions with incomplete
responses per questionnaire and take out any questionnaire with more than
two blank responses to solve the problem of omissions.
Finally, inconsistent responses are responses that are not in harmony with
other information. We edit and alter the data of this kind of response.
However, whenever possible, it is desirable to follow up with the respondent
to get the correct data, even though this is an expensive solution.
3.6.1.3 Data Coding
After data editing, we move forward to data coding. This process is assigning
a number to the participants‟ responses so they can be entered into the
database. For part A-Personal details, questions are designed in nominal and

Page 88 of 206
EMPLOYEE ENGAGEMENT
ordinal scale. Each alternative of the question will be code as 1, 2, 3, 4, and so
on accordingly and code 99 for missing data. For example, under detail for
gender, we assigned “1” to male, “2” to female whereas for alternatives under
age, we assigned “1” to “6” for all responses. While for part B and C, we code
the likert scale accordingly as well. For example, 1= strongly disagree (SD),
2=disagree (D), 3=neutral (N), 4=agree (A), 5= strongly agree (SA) and 99 =
missing data.
3.6.1.4 Data Transcribing
After responses have been coded, the data can be entered into a database. We
are using Statistical Analysis System (SAS) version 5.1 for this research. This
process is also known as data transcribing.
3.6.1.5 Data Transformation
Before running the reliability test on the next step, we need to carry out data
transformation which is a data coding variation by changing the initial
numerical interpretation of a quantitative value to another value (Sekaran et al,
2010).
Reverse scoring for negative questions is the data transformation which we
need to do in order to maintain consistency in the meaning of a response. For

Page 89 of 206
EMPLOYEE ENGAGEMENT
our questionnaire of this research, there are 6 negative questions (marked as
“(R)” in Table 3.4, 3.5, 3.6 and 3.8).
3.7 Data Analysis
Once we complete the data preparation process, we can launch data analysis. We use
the SAS version 5.1 to analyze the data collected. The major statistical techniques
applied and findings‟ summarize of the data analysis will be further explained as
follow.
3.7.1 Descriptive Analysis
Descriptive analysis is the process of transforming data into useful
information by interpreting the collected data. It is usually used in calculating
the average, frequency distribution, and distribution percentage of
demographic data given by respondents in Part A- Personal details (Sekaran et
al, 2010).

Page 90 of 206
EMPLOYEE ENGAGEMENT
3.7.2 Scale Measurement
In the scale measurement, we use reliability analysis to test whether we can
get a reliable result. Reliability is the degree to which the measures are free
from error and therefore have consistent and stable results. According to
Zikmund, Babin, Carr, and Griffin (2010), Cronbach‟s alpha (α) is the most
commonly applied estimate of a multiple item scale‟s reliability and it
represents the average of all possible split-half reliabilities for construct. It
ranges in value from 0 (no consistency) to 1 (complete consistency). The
higher the internal consistency reliability, the closer the Cronbach‟s alpha is to
1 (Sekaran et al, 2010).We use SAS version 5.1 to find out the Cronbach‟s
alpha value. Based on Zikmund et al. (2010), the standard coefficient alpha (α)
is stated as follow:
Table 3.10: Coefficient Alpha Ranges
Source: Sekaran, U., & Bougie, R. (2010). Research methods for business:
A skill building approach (5th ed.). Chichester, West Sussex: John Wiley &
Sons, Inc, (page325.)

Page 91 of 206
EMPLOYEE ENGAGEMENT
3.7.3 Inferential Analysis
In this study, there are five independent variables and one dependent variable.
Questions for both of the independent and dependent variables are designed
using interval scale (Likert scale) and under metric scale measurement.
Therefore, we choose Pearson Correlation Coefficient and Multiple
Regression Analysis for the inferential analysis to test all the hypotheses.
The relationship between each independent variable with dependent variable
is tested using Pearson Correlation Coefficient. Strength and direction of
linear relationship between two random variables is shown. Multiple
Regression Analysis is used to test on the impacts of more than one
independent variables towards one dependent variable (Sekaran et al, 2010).
From these analyses, we can determine and identify clearly on the most
influential factor (independent variable) that impact on employee engagement
(dependent variable).
3.8 Conclusion
This chapter is about the research methodology which explains how our proposal is
carried out based on research design, data collection methods, sampling design,
research instrument used to launch pilot study, operational definitions of constructs,
measurement scales as well as methods of data processing and analysis.

Page 92 of 206
EMPLOYEE ENGAGEMENT
Cronbach‟s alpha coefficient is used to test the internal reliability of the independent
variables and dependent variable. Besides, all the hypotheses are tested by using
Pearson Correlation Coefficient and Multiple Regression Analysis in indicating the
extent of the relationship between independent variables and dependent variable.
From this, we can determine whether there is a significant relationship between
perceived supervisor support, perceived organization support, procedural justice,
reward and recognition as well as self-efficacy with employee engagement on
hospital-based nurses.
Therefore, in conclusion, we have completed all the parts in chapter 3 and the next
chapter will be explained in detailed about systematic understanding by
demonstrating and interpreting the data gathered from the pilot test and actual survey.

Page 93 of 206
EMPLOYEE ENGAGEMENT
CHAPTER 4: RESEARCH RESULTS
4.0 Introduction
In this chapter, the results of questionnaire were being analyzed. The objective is to
investigate and interpret the data collected throughout the survey. The data collected
from respondents from Kedah, Penang and Perak will be analyzed using Statistical
Analysis System (SAS) version 5.1. The result will be analyzed and divided into
several parts such as demographic analysis, reliability test, Multiple Regression
Analysis and Pearson Correlation Analysis.
4.1 Descriptive Analysis
4.1.1 Respondent Demographic Profile
This section provides an analysis of the demographic characteristics of the
respondents which includes the gender, age, nationality, race, monthly income,
education level, and experience based on one-way frequencies analysis.

Page 94 of 206
EMPLOYEE ENGAGEMENT
4.1.1.1 Gender
Table 4.1: Gender
Gender, 1=Male, 2=Female, 99=Missing data
Gender Frequency Percent Cumulative
Frequency
Cumulative
Percent
1 13 8.67 13 8.67
2 137 91.33 150 100.00
Source: Data generated by the SAS system version 5.1
Figure 4.1: Distribution of Gender
Source: Data generated by the SAS system
0
20
40
60
80
100
120
140
160
1 2
Fre
qu
ency
Distribution of Gender
Gender, 1=Male, 2=Female, 99=Missing data
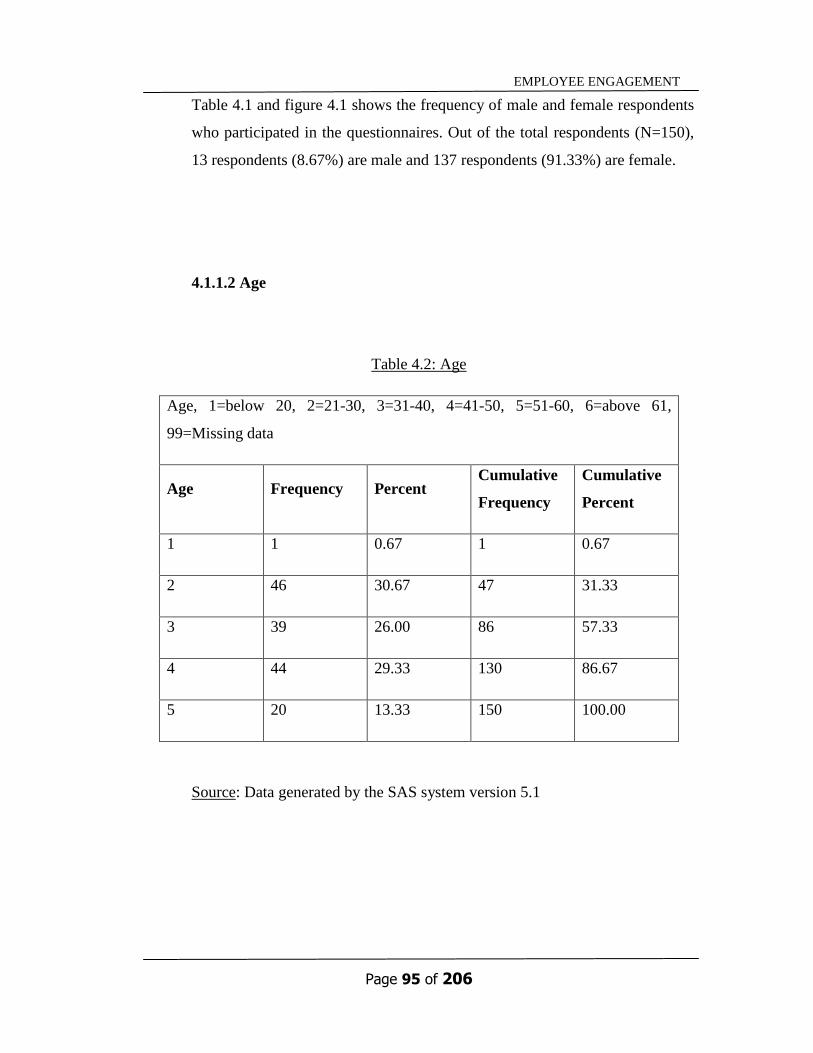
Page 95 of 206
EMPLOYEE ENGAGEMENT
Table 4.1 and figure 4.1 shows the frequency of male and female respondents
who participated in the questionnaires. Out of the total respondents (N=150),
13 respondents (8.67%) are male and 137 respondents (91.33%) are female.
4.1.1.2 Age
Table 4.2: Age
Age, 1=below 20, 2=21-30, 3=31-40, 4=41-50, 5=51-60, 6=above 61,
99=Missing data
Age Frequency Percent Cumulative
Frequency
Cumulative
Percent
1 1 0.67 1 0.67
2 46 30.67 47 31.33
3 39 26.00 86 57.33
4 44 29.33 130 86.67
5 20 13.33 150 100.00
Source: Data generated by the SAS system version 5.1

Page 96 of 206
EMPLOYEE ENGAGEMENT
Figure 4.2: Distribution of Age
Source: Data generated by the SAS system
Table 4.2 and figure 4.2 shows the frequency of different age range of
respondents who participated in the questionnaires. Out of the total
respondents (N=150), only 1 respondent (0.67%) is below 20 years old, 46
respondents (30.67%) are from 21-30 years old, 39 respondents (26.00%) are
from 31-40 years old, 44 respondents (29.33%) are from 41-50 years old and
20 respondents (13.33%) are from 51-60 year old. There is no respondent
above 60 years old.
0
10
20
30
40
50
1 2 3 4 5
Fre
qu
rncy
Distribution of Age
Age, 1=below 20, 2=21-30, 3=31-40, 4=41-50, 5=51-60, 6=above
61, 99=Missing data

Page 97 of 206
EMPLOYEE ENGAGEMENT
4.1.1.3 Nationality
Table 4.3: Nationality
Nationality, 1=Malaysian, 2=Other, 99=Missing
Nationality Frequency Percent Cumulative
Frequency
Cumulative
Percent
1 150 100.00 150 100.00
Source: Data generated by the SAS system version 5.1
Figure 4.3: Distribution of Nationality
Source: Data generated by the SAS system
0
20
40
60
80
100
120
140
160
1
Fre
qu
ency
Distribution of Nationality
Nationality, 1=Malaysian, 2=Other, 99=Missing

Page 98 of 206
EMPLOYEE ENGAGEMENT
Table 4.3 and figure 4.3 shows the frequency of nationality of the respondents
who participated in the questionnaires. Out of the total respondents (N=150),
100% of respondents are Malaysian.
4.1.1.4 Race
Table 4.4: Race
Race, 1=Malay, 2=Chinese, 3=Indian, 4=Other, 99=Missing data
Race Frequency Percent Cumulative
Frequency
Cumulative
Percent
1 63 42.00 63 42.00
2 27 18.00 90 60.00
3 57 38.00 147 98.00
4 3 2.00 150 100.00
Source: Data generated by the SAS system version 5.1

Page 99 of 206
EMPLOYEE ENGAGEMENT
Figure 4.4: Distribution of Race
Source: Data generated by the SAS system
Table 4.4 and figure 4.4 shows the frequency of different races of respondents
who participated in the questionnaires. Out of the total respondents (N=150),
63 respondents (42.00%) are Malay, 27 respondents (18.00%) are Chinese, 57
respondents (38.00%) are Indian, and only 3 respondents (2.00%) are other
races.
0
10
20
30
40
50
60
70
1 2 3 4
Fre
qu
ency
Distribution of Race
Race, 1=Malay, 2=Chinese, 3=Indian, 4=Other, 99=Missing data

Page 100 of 206
EMPLOYEE ENGAGEMENT
4.1.1.5 Monthly Income
Table 4.5: Income Level
Income, 1=below RM1500, 2=RM1501-2500, 3=RM2501-3500, 4=RM3501-
4500, 5=above RM4501, 99=Missing data
Income
Level Frequency Percent
Cumulative
Frequency
Cumulative
Percent
1 61 40.67 61 40.67
2 38 25.33 99 66.00
3 36 24.00 135 90.00
4 13 8.67 148 98.67
5 2 1.33 150 100.00
Source: Data generated by the SAS system version 5.1

Page 101 of 206
EMPLOYEE ENGAGEMENT
Figure 4.5: Distribution of Income Level
Source: Data generated by the SAS system
Table 4.5 and figure 4.5 shows the frequency of different income level of
respondents who participated in the questionnaires. Out of the total
respondents (N=150), there are 61 respondents (40.67%) with salary below
RM 1500, 38 respondents (25.33%) with RM 1501-RM 2500, 36 respondents
(24.00%) with RM 2501-RM 3500, 13 respondents (8.67%) with RM 3501-
RM 4500 and only 2 respondents‟ (1.33%) salary is above RM 4501.
0
10
20
30
40
50
60
70
1 2 3 4 5
Fre
qu
ency
Distribution of Income Level
Income, 1=below RM1500, 2=RM1501-2500, 3=RM2501-3500, 4=RM3501-
4500, 5=above RM4501, 99=Missing data

Page 102 of 206
EMPLOYEE ENGAGEMENT
4.1.1.6 Education Level
Table 4.6: Education Level
Education, 1=Advance diploma, 2=Diploma, 3=Bachelor degree, 4=Master
degree, 5=Doctorate degree, 6=Other, 99=Missing data
Education
Level Frequency Percent
Cumulative
Frequency
Cumulative
Percent
1 75 50.00 75 50.00
2 68 45.33 143 95.33
3 5 3.33 148 98.67
5 2 1.33 150 100.00
Source: Data generated by the SAS system version 5.1

Page 103 of 206
EMPLOYEE ENGAGEMENT
Figure 4.6: Distribution of Education level
Source: Data generated by the SAS system
Table 4.6 and figure 4.6 shows the frequency of highest education level
earned by respondents who participated in the questionnaires. Out of the total
respondents (N=150), 75 respondents (50.00%) holding Post-basic certificate/
advanced diploma, 68 respondents (45.33%) holding Diploma, 5 respondents
(3.33%) holding Bachelor degree, and 2 respondents (1.33%) holding
Doctorate degree. There is no respondent holding Master degree.
0
10
20
30
40
50
60
70
80
1 2 3 5
Fre
qu
ency
Distribution of Education Level
Education, 1=Advance diploma, 2=Diploma, 3=Bachelor degree, 4=Master
degree, 5=Doctorate degree, 6=Other, 99=Missing data

Page 104 of 206
EMPLOYEE ENGAGEMENT
4.1.1.7 Experience
Table 4.7: Experience
Experience, 1=1-5 years, 2=6-10 years, 3=11-15 years, 4=16 years and above,
99=Missing data
Experience Frequency Percent Cumulative
Frequency
Cumulative
Percent
1 49 32.67 49 32.67
2 21 14.00 70 46.67
3 22 14.67 92 61.33
4 58 38.67 150 100.00
Source: Data generated by the SAS system version 5.1
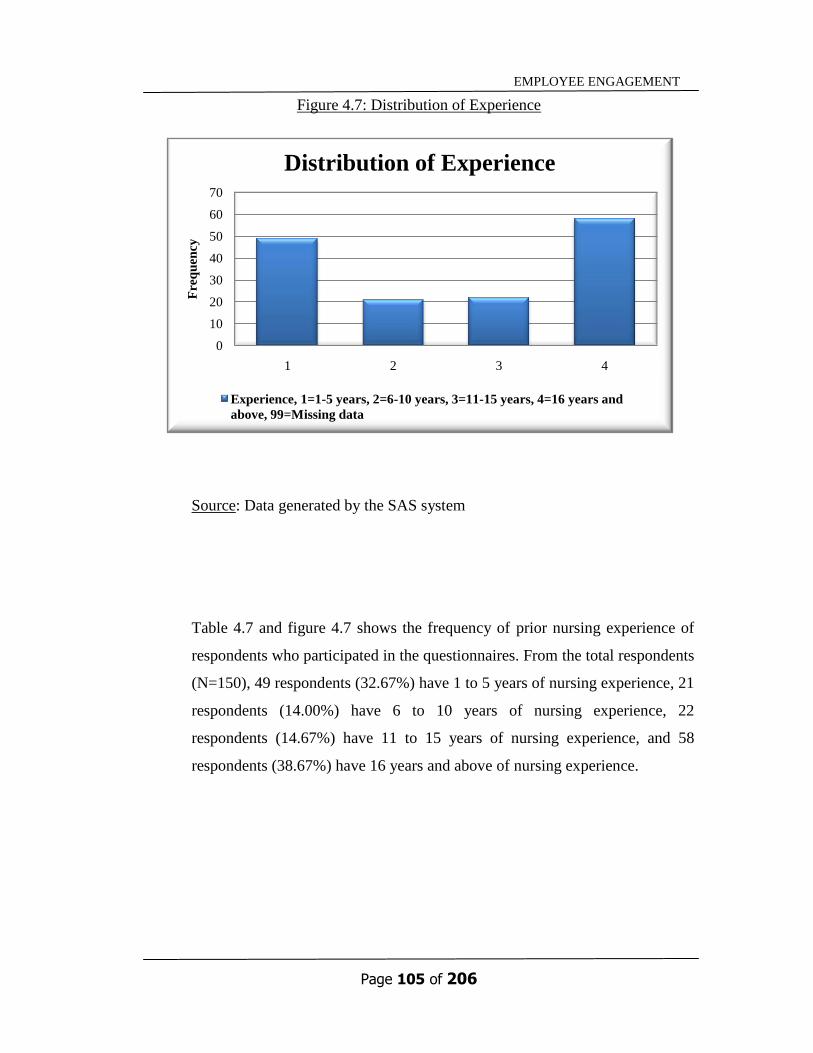
Page 105 of 206
EMPLOYEE ENGAGEMENT
Figure 4.7: Distribution of Experience
Source: Data generated by the SAS system
Table 4.7 and figure 4.7 shows the frequency of prior nursing experience of
respondents who participated in the questionnaires. From the total respondents
(N=150), 49 respondents (32.67%) have 1 to 5 years of nursing experience, 21
respondents (14.00%) have 6 to 10 years of nursing experience, 22
respondents (14.67%) have 11 to 15 years of nursing experience, and 58
respondents (38.67%) have 16 years and above of nursing experience.
0
10
20
30
40
50
60
70
1 2 3 4
Fre
qu
ency
Distribution of Experience
Experience, 1=1-5 years, 2=6-10 years, 3=11-15 years, 4=16 years and
above, 99=Missing data

Page 106 of 206
EMPLOYEE ENGAGEMENT
4.1.2 Central Tendencies Measurement of Constructs
Central tendencies will be used to show the value of mean and standard
deviation of 50 questions in the questionnaire. The SAS system version 5.1
will be used to identify the value of mean and standard deviation of each
question.
4.1.2.1 Perceived Supervisor Support
Table 4.8: Central Tendencies Measurement of Perceived Supervisor Support

Page 107 of 206
EMPLOYEE ENGAGEMENT
Source: Data generated for the research

Page 108 of 206
EMPLOYEE ENGAGEMENT
Based on the table 4.8, the ranking of the PSS is arranged in descending order.
Based on the data above, P1 has the highest value of mean
(3.90000).Although P7 has the lowest value of mean (3.40667), it has the
highest value of standard deviation (0.99729). P3 has the lowest value of
standard deviation (0.71781).
4.1.2.2 Perceived Organization Support
Table 4.9: Central Tendencies Measurement of Perceived Organization Support

Page 109 of 206
EMPLOYEE ENGAGEMENT
Source: Data generated for the research

Page 110 of 206
EMPLOYEE ENGAGEMENT
Based on the table 4.9 , the ranking of POS is arranged in descending order.
Based on the data above, O6 has the highest value of mean (4.08667) with the
lowest value of standard deviation (0.28229) whereas O1 has the lowest value
of mean (3.08000) with the highest value of the standard deviation (0.96600).
4.1.2.3 Procedural Justice
Table 4.10: Central Tendencies Measurement of Procedural Justice

Page 111 of 206
EMPLOYEE ENGAGEMENT

Page 112 of 206
EMPLOYEE ENGAGEMENT
Source: Data generated for the research
Based on the table 4.10, the ranking of PJ is arranged in descending order.
Based on the data above, J7 has the highest value of mean (3.55333). J6 has
lowest value of mean (3.14667) with the highest value of the standard
deviation (1.06429). J8 has the lowest standard deviation (0.74830).

Page 113 of 206
EMPLOYEE ENGAGEMENT
4.1.2.4 Reward and Recognition
Table 4.11: Central Tendencies Measurement of Reward and Recognition
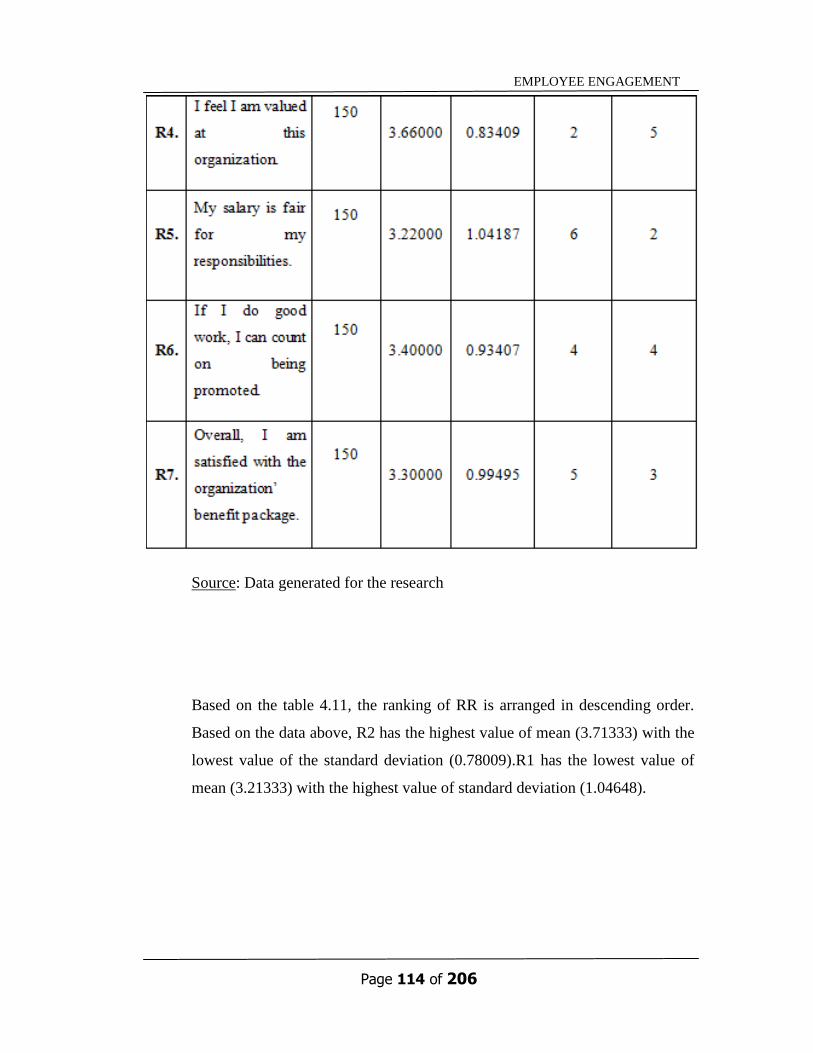
Page 114 of 206
EMPLOYEE ENGAGEMENT
Source: Data generated for the research
Based on the table 4.11, the ranking of RR is arranged in descending order.
Based on the data above, R2 has the highest value of mean (3.71333) with the
lowest value of the standard deviation (0.78009).R1 has the lowest value of
mean (3.21333) with the highest value of standard deviation (1.04648).

Page 115 of 206
EMPLOYEE ENGAGEMENT
4.1.2.5 Self-efficacy
Table 4.12: Central Tendencies Measurement of Self-efficacy

Page 116 of 206
EMPLOYEE ENGAGEMENT
Source: Data generated for the research
Based on the table 4.12, the ranking of SE is arranged in descending order.
Based on the data above, S4, S6, and S7 have the same highest value of mean
(3.83333). However, the value of standard deviation for S4 (0.63897), S6
(0.72738), and S7 (0.71809) are low. S4has the lowest value of standard
deviation. S8 has the lowest value of mean (2.97333) with the highest value of
standard deviation (1.01629).

Page 117 of 206
EMPLOYEE ENGAGEMENT
4.1.2.6 Employee Engagement
Table 4.13: Central Tendencies Measurement of Employee Engagement

Page 118 of 206
EMPLOYEE ENGAGEMENT

Page 119 of 206
EMPLOYEE ENGAGEMENT
Source: Data generated for the research
Based on the table 4.13, the ranking of EE is arranged in descending order.
Based on the data above, E10 has the highest value of mean (4.17333) with
standard deviation (0.69269). E5 has the lowest value of the mean (3.43333).
E4 has the highest value of standard deviation (1.02103) with low mean
(3.46667). E15 has the lowest value of standard deviation (0.62046).
Page 120 of 206
EMPLOYEE ENGAGEMENT
4.2 Scale Measurement
The scales of measurement which is employed in the questionnaires of this study are
nominal scale, ordinal scale, ratio scale, and five-point Likert scale. For the part of
Section A, the nominal scale is being used to question the gender, nationality, and
race, while the ordinal scale is used to measure the education level. Besides, the ratio
scale also being used to examine the age, monthly income, and prior clinic experience
in the Section A.
On the other hand, the questions under Section B are using the five-point Likert scale
to examine the influences of perceived supervisor support, perceived organization
support, procedural justice, reward and recognition, and self-efficacy on the employee
engagement among hospital-based nurses. The five-point Likert scale in Section B is
range from strong disagree (SD), disagree (D), neutral (N), agree (A) to strongly
agree (SA).
The measurement scales is carried out on a reliability test to determine the extent to
which the measures are free from error and therefore yield consistent results.
Reliability analysis is established by testing both internal consistency and stability.
Cronbach‟s alpha is a coefficient alpha (α) that indicates how well the internal
consistency and correlation of the items in the questionnaire. The higher the internal
consistency reliability, the closer the Cronbach‟s alpha is to 1 (Sekaran and Bougie,
2010). The description of the alpha value is showed below:

Page 121 of 206
EMPLOYEE ENGAGEMENT
Table 4.14: Cronbach‟s Coefficient Alpha (α)
Source: Sekaran, U., & Bougie, R. (2010). Research methods for business: A
skill building approach (5th ed.). Chichester, West Sussex: John Wiley &
Sons, Inc. (page325).
Table 4.15: Summary of Reliability Analysis
Variables No. of
Items
Cronbach’s Alpha
Pilot Study Full Study
Independent
Variable (IV)
Perceived Supervisor
Support 8 0.754717 0.847570
Perceived Organization
Support 7 0.746804 0.808505
Procedural Justice 8 0.838865 0.854246
Reward and Recognition 7 0.774217 0.931265

Page 122 of 206
EMPLOYEE ENGAGEMENT
Self-efficacy 8 0.762421 0.781927
Dependent
Variable (DV) Employee Engagement 18 0.816823 0.913023
Source: Data generated by SAS Enterprise Guide version 5.1
Table 4.15 shows the results for both pilot study and full study. The Cronbach‟s alpha
is used to analyze the internal consistency and reliability of multiple items. The closer
the Cronbach‟s alpha is to 1, the higher the internal consistency reliability of the
particular item.
The dependent variable, employee engagement which constructed with 18 items
shows the coefficient alpha at 0.816823 in pilot test and it has increased to 0.913023.
The increased in alpha values indicates a very good reliability. On the other hand, all
the five independent variables also show an increased in the internal consistency
respectively. First, the perceived supervisor support which measured by total 8 items
shows the Cronbach‟s alpha of 0.754717 in pilot test and increased to 0.847570 in the
overall study. This shows that coefficient alpha of perceived supervisor support has
improved from a good reliability to a very good reliability. Second, the perceived
organization support which constructed with total 7 items also shows an increased
from a good reliability alpha of 0.746804 in pilot test to very good reliability alpha
value of 0.808505 in overall study. Next, the Cronbach‟s alpha of the procedural
justice which measured by 8 items also slightly increased from 0.838865 in pilot test
to 0.854246 in the full study, maintaining a very good reliability. Besides, the
independent variable of reward and recognition which constructed with total 7 items

Page 123 of 206
EMPLOYEE ENGAGEMENT
also increased its coefficient alpha from 0.774217 in the pilot test to 0.931265 in
overall study. The increased Coefficient alpha indicates a very good reliability for
reward and recognition in the full study. Lastly, the self-efficacy which measured by
total of 8 items also slightly increased in the coefficient value from 0.762421 in pilot
study to 0.781927 in full study. This alpha value is still indicating a good reliability
and consistency.
In conclusion, the overall reliability of all the examined variables in the study is
acceptable in which the Cronbach‟s coefficient alpha of all the variables are above
0.60. Moreover, some of the variables showed a very good reliability and this
signifies the internal consistency and reliability in this study.
4.3 Inferential Analysis
According to Burns and Bush (2000), inferential analysis is used to provide the
generation of conclusion regarding the characteristics of the population based on the
sample data. The purpose of this analysis is aim to examine the individual variable
and its relationship with other variables. In this research, all hypotheses will be tested
using Pearson‟s Correlation Coefficient and Linear Regression Analysis. Pearson‟s
Correlation Coefficient shows the results of correlation while Linear Regression
Analysis shows the results of model summary and coefficient.
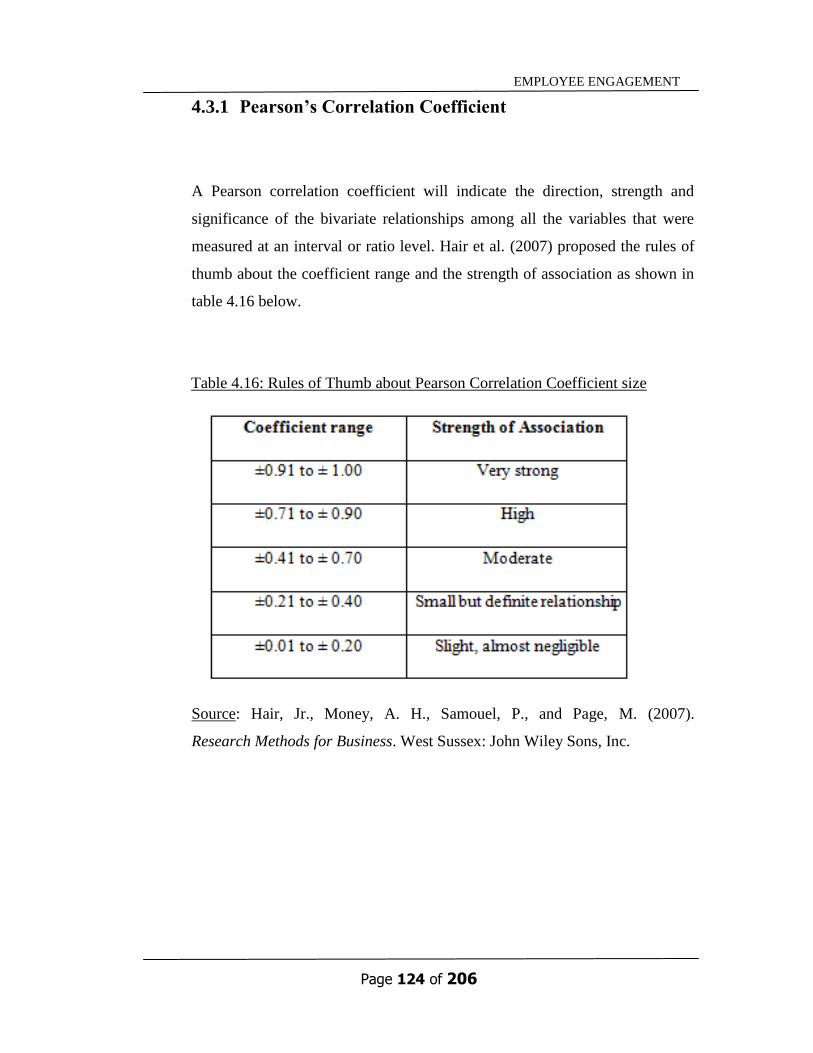
Page 124 of 206
EMPLOYEE ENGAGEMENT
4.3.1 Pearson’s Correlation Coefficient
A Pearson correlation coefficient will indicate the direction, strength and
significance of the bivariate relationships among all the variables that were
measured at an interval or ratio level. Hair et al. (2007) proposed the rules of
thumb about the coefficient range and the strength of association as shown in
table 4.16 below.
Table 4.16: Rules of Thumb about Pearson Correlation Coefficient size
Source: Hair, Jr., Money, A. H., Samouel, P., and Page, M. (2007).
Research Methods for Business. West Sussex: John Wiley Sons, Inc.

Page 125 of 206
EMPLOYEE ENGAGEMENT
4.3.1.1 Hypothesis 1: Relationship between Perceived Supervisor
Support (PSS) and Employee Engagement (EE)
H10: There is no significant relationship between perceived supervisor
support and employee engagement in nursing industry.
H11: There is a significant relationship between perceived supervisor
support and employee engagement in nursing industry.
Table 4.17: Correlation between Perceived Supervisor Support (PSS) and
Employee Engagement (EE)
PSS EE
PSS Pearson Correlation
p-Value
N
1
150
0.60045
<0.0001
150
EE Pearson Correlation
p-Value
N
0.60045
<0.0001
150
1
150
Source: Data generated by Statistical Analysis System (SAS) version 5.1

Page 126 of 206
EMPLOYEE ENGAGEMENT
Direction
Based on the results, the relationship between perceived supervisor support
and employee engagement is positive due to the positive value for correlation
coefficient. The perceived supervisor support has a 0.60045 correlation with
the employee engagement. Thus, when perceived supervisor support is high,
employee engagement is high.
Strength
The value of 0.60045 falls within the coefficient range of ±0.41 to ± 0.70.
Therefore, the relationship between perceived supervisor support and
employee engagement is moderate.
Significance
The relationship between perceived supervisor support and employee
engagement is significant because the p-value <0.0001 is less than alpha value
0.05. Therefore, null hypothesis (H10) is not accepted while the alternative
hypothesis (H11) is accepted.

Page 127 of 206
EMPLOYEE ENGAGEMENT
4.3.1.2 Hypothesis 2: Relationship between Perceived Organization
Support (POS) and Employee Engagement (EE)
H20: There is no significant relationship between perceived organization
support and employee engagement in nursing industry.
H21: There is a significant relationship between perceived organization
support and employee engagement in nursing industry.
Table 4.18: Correlation between Perceived Organization Support (POS) and
Employee Engagement (EE)
POS EE
POS Pearson Correlation
p-Value
N
1
150
0.56632
<0.0001
150
EE Pearson Correlation
p-Value
N
0.56632
<0.0001
150
1
150
Source: Data generated by Statistical Analysis System (SAS) version 5.1

Page 128 of 206
EMPLOYEE ENGAGEMENT
Direction
Based on the results, the relationship between perceived organization support
and employee engagement is positive due to the positive value for correlation
coefficient. The perceived organization support has a 0.56632 correlation with
the employee engagement. Thus, when perceived organization support is high,
employee engagement is high.
Strength
The value of 0.56632 falls within the coefficient range of ±0.41 to ± 0.70.
Therefore, the relationship between perceived organization support and
employee engagement is moderate.
Significance
The relationship between perceived organization support and employee
engagement is significant because the p-value <0.0001 is less than alpha value
0.05. Therefore, null hypothesis (H20) is not accepted while the alternative
hypothesis (H21) is accepted.

Page 129 of 206
EMPLOYEE ENGAGEMENT
4.3.1.3 Hypothesis 3: Relationship between Procedural Justice (PJ)
and Employee Engagement (EE)
H30: There is no significant relationship between procedural justice and
employee engagement in nursing industry.
H31: There is a significant relationship between procedural justice and
employee engagement in nursing industry.
Table 4.19: Correlation between Procedural Justice (PJ) and Employee
Engagement (EE)
PJ EE
PJ Pearson Correlation
p-Value
N
1
150
0.53951
<0.0001
150
EE Pearson Correlation
p-Value
N
0.53951
<0.0001
150
1
150
Source: Data generated by Statistical Analysis System (SAS) version 5.1

Page 130 of 206
EMPLOYEE ENGAGEMENT
Direction
Based on the results, the relationship between procedural justice and
employee engagement is positive due to the positive value for correlation
coefficient. The procedural justice has a 0.53951 correlation with the
employee engagement. Thus, when procedural justice is high, employee
engagement is high.
Strength
The value of 0.53951 falls within coefficient range of ±0.41 to ± 0.70.
Therefore, the relationship between procedural justice and employee
engagement is moderate.
Significance
The relationship between procedural justice and employee engagement is
significant because the p-value <0.0001 is less than alpha value 0.05.
Therefore, null hypothesis (H30) is not accepted while the alternative
hypothesis (H31) is accepted.

Page 131 of 206
EMPLOYEE ENGAGEMENT
4.3.1.4 Hypothesis 4: Relationship between Reward and Recognition
(RR) and Employee Engagement (EE)
H40: There is no significant relationship between reward and recognition
and employee engagement in nursing industry.
H41: There is a significant relationship between reward and recognition
and employee engagement in nursing industry.
Table 4.20: Correlation between Reward and Recognition (RR) and Employee
Engagement (EE)
RR EE
RR Pearson Correlation
p-Value
N
1
150
0.39214
<0.0001
150
EE Pearson Correlation
p-Value
N
0.39214
<0.0001
150
1
150
Source: Data generated by Statistical Analysis System (SAS) version 5.1

Page 132 of 206
EMPLOYEE ENGAGEMENT
Direction
Based on the results, the relationship between reward and recognition and
employee engagement is positive due to the positive value for correlation
coefficient. The reward and recognition has a 0.39214 correlation with the
employee engagement. Thus, when reward and recognition is high, employee
engagement is high.
Strength
The value of 0.39214 falls within coefficient range of ±0.21 to ± 0.40.
Therefore, the relationship between reward and recognition and employee
engagement is small but definite relationship.
Significance
The relationship between reward and recognition and employee engagement is
significant because the p-value <0.0001 is less than alpha value 0.05.
Therefore, null hypothesis (H40) is not accepted while the alternative
hypothesis (H41) is accepted.

Page 133 of 206
EMPLOYEE ENGAGEMENT
4.3.1.5 Hypothesis 5: Relationship between Self-efficacy (SE) and
Employee Engagement (EE)
H50: There is no significant relationship between self-efficacy and
employee engagement in nursing industry.
H51: There is a significant relationship between self-efficacy and
employee engagement in nursing industry.
Table 4.21: Correlation between Self-efficacy (SE) and Employee
Engagement (EE)
SE EE
SE Pearson Correlation
p-Value
N
1
150
0.73157
<0.0001
150
EE Pearson Correlation
p-Value
N
0.73157
<0.0001
150
1
150
Source: Data generated by Statistical Analysis System (SAS) version 5.1

Page 134 of 206
EMPLOYEE ENGAGEMENT
Direction
Based on the results, the relationship between self-efficacy and employee
engagement is positive due to the positive value for correlation coefficient.
The self-efficacy has a 0.73157 correlation with the employee engagement.
Thus, when self-efficacy is high, employee engagement is high.
Strength
The value of 0.73157 falls within coefficient range of ±0.71 to ± 0.90.
Therefore, the relationship between self-efficacy and employee engagement is
high.
Significance
The relationship between self-efficacy and employee engagement is
significant because the p-value <0.0001 is less than alpha value 0.05.
Therefore, null hypothesis (H50) is not accepted while the alternative
hypothesis (H51) is accepted.

Page 135 of 206
EMPLOYEE ENGAGEMENT
4.3.2 Multiple Linear Regression Analysis
Multiple regression analysis is used when there are more than one
independent variable is used to explain variance in a dependent variable.
4.3.2.1 Hypothesis 6: Relationship between Perceived Supervisor
Support (PSS), Perceived Organization Support (POS),
Procedural Justice (PJ), Reward and Recognition (RR) and
Self-efficacy (SE) with Employee Engagement (EE)
H60: The five independent variables (perceived supervisor support,
perceived organization support, procedural justice, reward and
recognition, and self-efficacy) are no significant explain the
variance in employee engagement in nursing industry.
H61: The five independent variables (perceived supervisor support,
perceived organization support, procedural justice, reward and
recognition, and self-efficacy) are significant explain the variance
in employee engagement in nursing industry.

Page 136 of 206
EMPLOYEE ENGAGEMENT
Table 4.22: Analysis of Variance
Analysis of Variance
Source DF Sum of
Squares Mean Square F value Pr> F
Model 5 7144.9988778 1428.99956 49.34 <0.0001
Error 143 4141.84877 28.96398
Corrected Total 148 11287
Source: Data generated by Statistical Analysis System (SAS) version 5.1
From the Table 4.22, the p-value (<0.0001) is less than the alpha value 0.05.
Hence, the F-statistic is significant. The model for this study is a good
descriptor of the relation between the dependent and predictor variables.
Therefore, the independent variables (perceived supervisor support, perceived
organization support, procedural justice, reward and recognition, and self-
efficacy) are significant explain the variance in employee engagement. The
alternate hypothesis (H61) is supported by the data.

Page 137 of 206
EMPLOYEE ENGAGEMENT
Table 4.23: Model Summary of R-Square
Root MSE
Dependent
Mean
Coefficient
Variance
R-Square
Adjusted
R-Square
5.38182 63.71626 8.44654 0.6330 0.6202
Source: Data generated by Statistical Analysis System (SAS) version 5.1
R square
The R square indicates the extent or percentage the independent variables can
explain the variations in the dependent variable. In this research, independent
variables (perceived supervisor support, perceived organization support,
procedural justice, reward and recognition, and self-efficacy) can explain
63.30% of the variations in dependent variable (employee engagement).
However, it is still leaves 36.70% (100% - 63.30%) unexplained in this
research. In other words, there are other additional variables that are important
in explaining employee engagement that have not been considered in this
research.
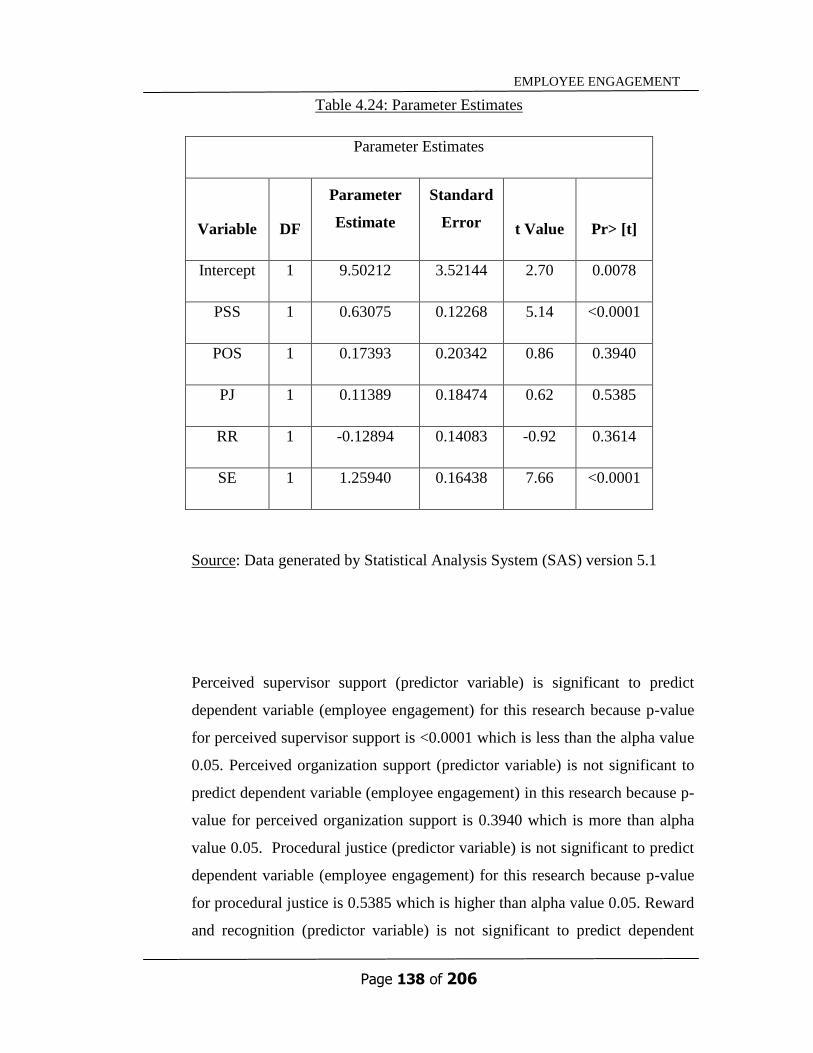
Page 138 of 206
EMPLOYEE ENGAGEMENT
Table 4.24: Parameter Estimates
Parameter Estimates
Variable
DF
Parameter
Estimate
Standard
Error
t Value
Pr> [t]
Intercept 1 9.50212 3.52144 2.70 0.0078
PSS 1 0.63075 0.12268 5.14 <0.0001
POS 1 0.17393 0.20342 0.86 0.3940
PJ 1 0.11389 0.18474 0.62 0.5385
RR 1 -0.12894 0.14083 -0.92 0.3614
SE 1 1.25940 0.16438 7.66 <0.0001
Source: Data generated by Statistical Analysis System (SAS) version 5.1
Perceived supervisor support (predictor variable) is significant to predict
dependent variable (employee engagement) for this research because p-value
for perceived supervisor support is <0.0001 which is less than the alpha value
0.05. Perceived organization support (predictor variable) is not significant to
predict dependent variable (employee engagement) in this research because p-
value for perceived organization support is 0.3940 which is more than alpha
value 0.05. Procedural justice (predictor variable) is not significant to predict
dependent variable (employee engagement) for this research because p-value
for procedural justice is 0.5385 which is higher than alpha value 0.05. Reward
and recognition (predictor variable) is not significant to predict dependent

Page 139 of 206
EMPLOYEE ENGAGEMENT
variable (employee engagement) for this research because p-value for reward
and recognition is 0.3614 which is higher than alpha value 0.05. Self-efficacy
(predictor variable) is significant to predict dependent variable (employee
engagement) for this research because p-value for self-efficacy is <0.0001
which is lower than the alpha value 0.05.
From the Table 4.24, the equation that used to determine the statistical
significance of each independent variable on the dependent variable can be
formed through substituting the values.
Regression Equation:
𝑦 = 9.50212 + 0.63075 𝑥1 + 0.17393 𝑥2 + 0.11389 𝑥3 −
0.12894 𝑥4 + 1.25940(𝑥5)
Where,
y = Employee Engagement
𝑥1 =Perceived Supervisor Support
𝑥2= Perceived Organization Support
𝑥3= Procedural Justice
𝑥4= Reward and Recognition
𝑥5= Self-efficacy
Self-efficacy is the predictor variables that contribute the highest to the
variation of the dependent variable (employee engagement) because the value

Page 140 of 206
EMPLOYEE ENGAGEMENT
of “Parameter Estimate” (under Table 4.24) for this predictor variable is the
largest (1.25940) if compare to other predictor variables (perceived supervisor
support, perceived organization support, procedural justice, and reward and
recognition). This explains self-efficacy make the strongest contribution to
explain the variation in dependent variable (employee engagement) as
compared to other variables in this model.
Perceived supervisor support is the predictor variables that contribute the
second highest to the variation of the dependent variable (employee
engagement) because the value of “Parameter Estimate” (under Table 4.24)
for this predictor variable is the second largest (0.63075) if compare to other
predictor variables (perceived organization support, procedural justice, reward
and recognition, and self-efficacy). This explains perceived supervisor support
make the second strongest contribution to explain the variation in dependent
variable (employee engagement) as compared to other variables in this model.
Perceived organization support is the predictor variables that contribute the
third highest to the variation of the dependent variable (employee engagement)
because the value of “Parameter Estimate” (under Table 4.24) for this
predictor variable is the third largest (0.17393) if compare to other predictor
variables (perceived supervisor support, procedural justice, reward and
recognition, and self-efficacy). This explains perceived organization support
make the third strongest contribution to explain the variation in dependent
variable (employee engagement) as compared to other variables in this model.
Reward and recognition is the predictor variables that contribute the fourth
highest to the variation of the dependent variable (employee engagement)
because the value of “Parameter Estimate” (under Table 4.24) for this

Page 141 of 206
EMPLOYEE ENGAGEMENT
predictor variable is the fourth largest (-0.12894) if compare to other predictor
variables (perceived supervisor support, perceived organization support,
procedural justice, and self-efficacy). This explains reward and recognition
make the fourth strongest contribution to explain the variation in dependent
variable (employee engagement) as compared to other variables in this model.
Procedural justice is the predictor variables that contribute the lowest to the
variation of the dependent variable (employee engagement) because the value
of “Parameter Estimate” (under Table 4.24) for this predictor variable is the
smallest (0.11389) if compared to other predictor variables (perceived
supervisor support, perceived organization support, reward and recognition,
and self-efficacy). This explains procedural justice make the least contribution
to explain the variation in dependent variable (employee engagement) as
compared to other variables in this model.
4.4 Conclusion
All the hypotheses are tested in this chapter. The results obtained from this chapter
enable a smooth transition into the final chapter whereby the major findings will be
presented. The implications and limitations of the study will also be discussed in the
next chapter followed by a few recommendations that relevant to this study.

Page 142 of 206
EMPLOYEE ENGAGEMENT
CHAPTER 5: DISCUSSION AND CONCLUSION
5.0 Introduction
In this chapter, the statistical analysis will be further discussed followed by the
discussion of major implications and findings of the study. This includes descriptive
and inferential analysis which has been discussed in Chapter 4. Apart from that,
limitations of the study and the recommendations for future research are also
highlighted. Lastly, the overall conclusion of the whole research project is developed
to project the clear picture and ideas of the study.
5.1 Summary of Statistical Analyses
The summary description of the statistical analyses consists of the entire descriptive
and inferential analyses introduced and discussed in Chapter 4 which are the
descriptive analyses, scale measurement (reliability analysis), and inferential analyses.

Page 143 of 206
EMPLOYEE ENGAGEMENT
5.1.1 Descriptive Analysis
5.1.1.1 Respondent Demographic Profile
Overall, there are 150 respondents contribute in our survey and research
project. Our research primarily focuses on all public and private hospital-
based nurses in three states of location which are in Kedah, Penang and Perak.
From the results generated in chapter 4, there are more than half of our total
respondents are female nurses which comprise 137 respondents (91.33%)
while the rest of 13 respondents (8.67%) are male nurses.
Most of the respondents are between 21-30 years old, which made up of 46
respondents out of total 150 respondents (30.67%). Whereas, respondents
from age range of 20 years old and below is the least which only 1 respondent
(0.67%) belongs to this group. All of our 150 respondents are Malaysian. Next,
for ethic group, majority of our respondents are Malay which are 63
respondents (42.00%) while only 3 respondents (2.00%) are from other ethnic
groups such as Punjabis, Bangladesh and Nepalese.
Furthermore, 61 respondents (40.67%)have income level that is below
RM1500 and only 2 respondents (1.33%) are having high income level of
RM4501 and above. Half of our respondents which made up of 75
respondents (50.00%) out of 150 respondents contribute the biggest portion
are holding Post-basic certificate/advanced diploma while only 2 respondents
(1.33%) are holding Doctorate degree. Lastly, 38.67% or 58 respondents are

Page 144 of 206
EMPLOYEE ENGAGEMENT
having 16 years and above of nursing experience which is the greatest
portion and 21 respondents or 14.00% are having 6-10 years of nursing
experience made up the least portion on prior clinic experience aspects.
5.1.2 Central Tendencies Measurement of Constructs
According to the results on the analysis conducted, majority of the
respondents are having the same opinion and agree with the 50 questions that
constructed in our questionnaire regarding the five variables (perceived
supervisor support, perceived organization support, procedural justice, reward
and recognition as well as self-efficacy) are having significant relationship
with employee engagement in nursing industry.
Table 5.1: Summary of Central Tendencies Measurement
Variables
Mean Standard deviation
Lowest Highest Lowest Highest
1) Perceived Supervisor
Support
(Refer table 4.8)
3.40667
P7.
3.90000
P1.
0.71781
P3.
0.99729
P7.
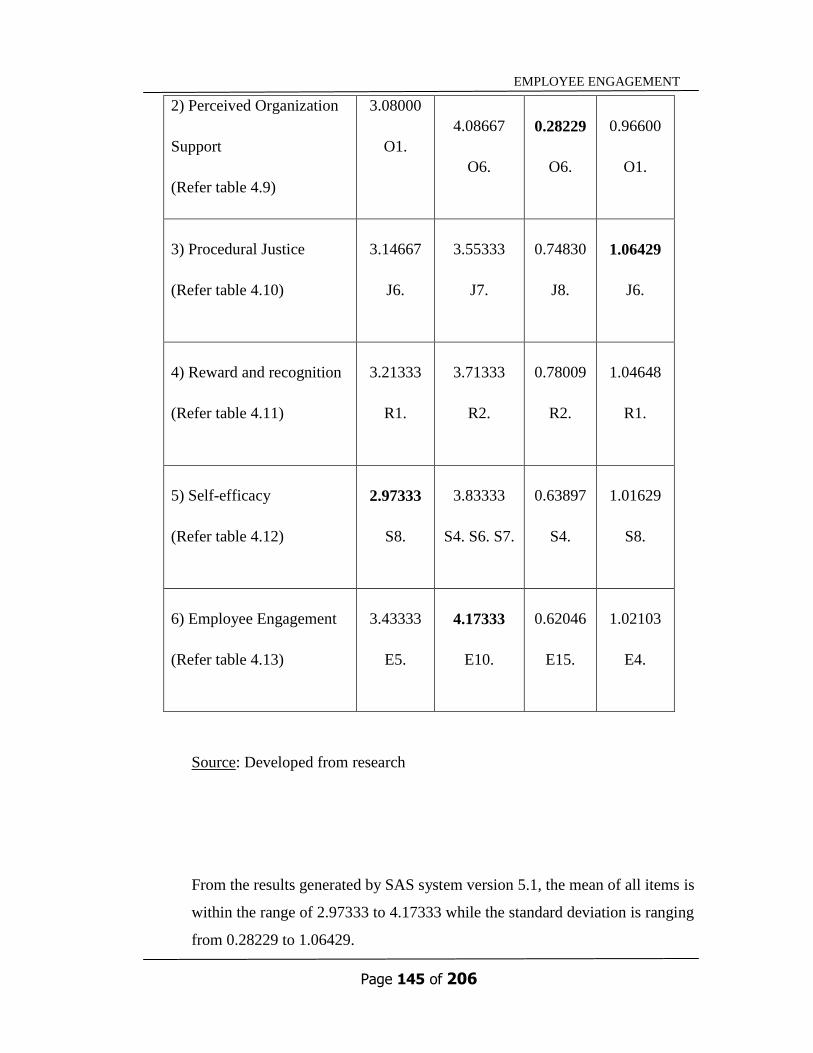
Page 145 of 206
EMPLOYEE ENGAGEMENT
2) Perceived Organization
Support
(Refer table 4.9)
3.08000
O1.
4.08667
O6.
0.28229
O6.
0.96600
O1.
3) Procedural Justice
(Refer table 4.10)
3.14667
J6.
3.55333
J7.
0.74830
J8.
1.06429
J6.
4) Reward and recognition
(Refer table 4.11)
3.21333
R1.
3.71333
R2.
0.78009
R2.
1.04648
R1.
5) Self-efficacy
(Refer table 4.12)
2.97333
S8.
3.83333
S4. S6. S7.
0.63897
S4.
1.01629
S8.
6) Employee Engagement
(Refer table 4.13)
3.43333
E5.
4.17333
E10.
0.62046
E15.
1.02103
E4.
Source: Developed from research
From the results generated by SAS system version 5.1, the mean of all items is
within the range of 2.97333 to 4.17333 while the standard deviation is ranging
from 0.28229 to 1.06429.

Page 146 of 206
EMPLOYEE ENGAGEMENT
5.1.3 Scale Measurement
5.1.3.1 Reliability Test
Based on results for the full study as shown in table 4.15, the variable of
perceived supervisor support (8 items) has the alpha value of 0.847570,
perceived organization support (7 items) has the alpha value of 0.808505,
procedural justice (8 items) has the alpha value of 0.854246, reward and
recognition (7 items) has the alpha value of 0.931265, self-efficacy (8 items)
has the alpha value of 0.781927 and lastly the employee engagement (18
items) has the alpha value of 0.913023.
From Table 4.14, coefficient alpha that ranges within 0.80 to 0.95 indicates
very good reliability. Therefore, other than self-efficacy, all variables are
considered as very good reliability. Meanwhile, self-efficacy with alpha value
of 0.781927 falls under scale within 0.70 to 0.80 is considered as good
reliability. In conclusion, all variables in our study have achieved excellent
internal consistency and reliable as all variables obtain coefficient alpha above
0.60.
5.1.4 Inferential Analyses
Under inferential analyses, we summarized the results tested by using
Multiple Linear Regression Analysis and Pearson‟s Correlation Coefficient.

Page 147 of 206
EMPLOYEE ENGAGEMENT
5.1.4.1 Pearson Correlation Coefficient
The value between perceived supervisor support and employee engagement is
0.60045, perceived organization support and employee engagement is 0.56632
whereas procedural justice and employee engagement is 0.53951; all fall
under coefficient range from ± 0.41 to ± 0.70 signifies their relationships are
moderate in strength. While, the value of correlation coefficient between
reward and recognition and employee engagement is 0.39214, which falls
under coefficient range from ± 0.21 to ± 0.40 indicates there is small but
definite relationship. In addition, value of correlation coefficient between self-
efficacy and employee engagement is 0.73157 that falls under coefficient
range from ± 0.71 to ± 0.90 implies the strength of relationship is high.
Therefore, the results shown that there is positive relationship between each of
the all five variables and employee engagement respectively due to the
positive value of correlation coefficient acquire. Furthermore, all five
variables has p-value <0.0001 which is lower than alpha value 0.05 indicates
that the relationship is significant. In short, there is positive and significant
relationship between each of all variables and employee engagement.
5.1.4.2 Multiple Regression Analysis
As refer to the results generated from table 4.24, self-efficacy (SE) contributes
the highest to the variation of dependent variable (employee engagement),
indicates the strongest beta coefficient with employee engagement, which is
1.25940. Next, is followed by perceived supervisor support (PSS), 0.63075,

Page 148 of 206
EMPLOYEE ENGAGEMENT
perceived organization support (POS) is the third with moderate beta
correlation 0.17393 as compared to other variables, fourth is reward and
recognition (RR) with -0.12894 and lastly, procedural justice (PJ) is the
predictor variables that has the lowest beta correlation with employee
engagement, which is only 0.11389.
While based on the p-value, we found out that, only two predictor variables
which are perceived supervisor support (PSS) and self-efficacy (SE) have p-
value <0.0001 which is less than the alpha value 0.05 signified that, they are
significant to predict dependent variable (employee engagement) on this
research. Whereas, the rest three predictor variables (perceived organization
support (POS), procedural justice (PJ) as well as reward and recognition (RR)
are having the p- value of 0.3940, 0.5385 and 0.3614 respectively, which all
p-values are more than alpha value 0.05 indicated these variables are not
significant to predict dependent variable (employee engagement).
However, Table 4.22 revealed that, the result is significant as shown in the
model that it is a good descriptor of the relation between the dependent and
predictor variables (independent variables). Hence, in overall, the independent
variables (perceived supervisor support, perceived organization support,
procedural justice, reward and recognition, and self-efficacy) are significant in
explaining the variances in employee engagement.
In addition, as shown in table 4.23, the coefficient of determination (R square)
is 0.6330 which means 63.30% of the variances in dependent variable
(employee engagement) have been significantly demonstrated and explained
by the five independent variables ( perceived supervisor support, perceived

Page 149 of 206
EMPLOYEE ENGAGEMENT
organization support, procedural justice, reward and recognition, and self-
efficacy).
5.2 Discussions of Major Findings
Table 5.2: Summary of Hypotheses Testing Results

Page 150 of 206
EMPLOYEE ENGAGEMENT
Source: Developed from research
5.2.1 Hypothesis 1: Perceived Supervisor Support (PSS)
According to table 5.2, H11 is accepted as it has positive correlation
coefficient value of 0.60045 which indicates moderate correlation in strength
and its p-value is <0.0001 which less than alpha value 0.05. Hence, this shown

Page 151 of 206
EMPLOYEE ENGAGEMENT
that, there is a positive and significant relationship between perceived
supervisor support and employee engagement. This hypothesis is proved and
supported by various previous researches and studies.
According to Law et al., 2011, definition of supervisor support is the
perceived social support valued by the employees from supervisors, involving
emotional and instrumental support. One of the element of job resource which
consistently proved in several researches that has being conducted with result
that, social support from supervisor was positively related with work
engagement (Bakker & Demerouti; Schaufeli & Salanova, as cited in Bakker
& Demerouti, 2008).
Based on the saying by Bakker and Demerouti (as cited in Xanthopoulou et al.,
2009) confirmed that those employees who obtain autonomy at work, proper
coaching and high-quality, receive feedback, have opportunities for
professional development as well as have supportive colleagues, are
intrinsically motivated to accomplish their work objectives. Motivational job
resources are potentially in creating the outcome of high work engagement
and boosted up work performance extrinsically and intrinsically (Law et al.,
2011). Therefore, this proved that, perceived supervisor support and employee
engagement is positively related significantly.
5.2.2 Hypothesis 2: Perceived Organization Support (POS)
According to table 5.2, H21 is accepted as it has positive correlation
coefficient value of 0.56632 which indicates moderate correlation in strength
Page 152 of 206
EMPLOYEE ENGAGEMENT
and its p-value is <0.0001 which less than alpha value 0.05. Hence, this shown
that, there is a positive and significant relationship between perceived
organization support and employee engagement. This hypothesis is proved
and supported by various previous researches and studies.
The exchange relationship between the employee and the organization is
focused on perceived organization support (POS). In another, it can be said
that, employer is committed to employee (Wayne, Shore, Bommer & Tetrick,
2002; Gyekye & Salminen, 2007).
As shown by Gyekye and Salminen (2007), employees who gain
organizational support will express themselves in high level of efficiency,
enhanced productivity and with sense of loyalty towards the organization.
They will have more involvement and stronger feelings of faithfulness and
allegiance towards the organization. Hence, this lead to employee engagement
and proved that there is a positive and significant relationship between
perceived organization support and employee engagement.
5.2.3 Hypothesis 3: Procedural Justice (PJ)
According to table 5.2, H31 is accepted as it has positive correlation
coefficient value of 0.53951 which indicates moderate correlation in strength
and its p-value is <0.0001 which less than alpha value 0.05. Hence, this shown
that, there is a positive and significant relationship between procedural justice
and employee engagement. This hypothesis is proved and supported by
various previous researches and studies.

Page 153 of 206
EMPLOYEE ENGAGEMENT
Greenberg define procedural justice as the procedures‟ perceived fairness in
making decision (as cited in Naumann & Bennett, 2002). According to
Konovsky (2000) and Clay-Warner et al. (2005), procedural justice is able to
foreseen the employees‟ working attitude and behavior, involving the level of
engagement and job satisfaction.
Furthermore, there is a linkage found between procedural justice with group
engagement suggested by Tyler and Blader (2003) and Blader and Tyler
(2008). The researches has shown that, procedural justice is able to raise
identification of members and bring commitment within the group because it
forms identity respect and secure (Leonardelli & Toh, 2011) and employees
will have a sense of strong bonding within the group (Clay-Warner et al.,
2005). Therefore, employees with great senses of belonging and bonding in
their work groups will have a relatively high level of engagement and this
proved that, procedural justice and employee engagement has positive and
significant relationship.
5.2.4 Hypothesis 4: Reward and Recognition (RR)
According to table 5.2, H41 is accepted as it has positive correlation
coefficient value of 0.39214 which indicates small but definite relationship
and its p-value is <0.0001 which less than alpha value 0.05. Hence, this shown
that, there is a positive and significant relationship between reward and
recognition and employee engagement. This hypothesis is proved and
supported by various previous researches and studies.

Page 154 of 206
EMPLOYEE ENGAGEMENT
According to Bhattacharya and Mukherjee (2009); Salie and Schlechter,
(2012), there are two categories of rewards namely intrinsic and extrinsic.
Accomplishment or satisfaction which more towards an individual internal
feeling are intrinsic rewards. While, rewards such as increase in pay, praise
and promotion are extrinsically and more towards an individual external
experience. Meanwhile, recognition defined by Kerr (2005) about contribution
of an employee to the organization has been viewed as an acknowledgement
in the public.
Reward can serve as a „catalyst‟ in increasing performance and creating
greater productivity based on the larger population of „engaged‟ employees
(Bhattacharya & Mukherjee, 2009). In addition, Maslach and Leiter‟s study
(as cited in Willoughby, 2011) proposed that reward and recognition are
postulated to be important facilitators for engagement. Hence, this shown that
there is a positive and significant relationship between reward and recognition
and employee engagement.
5.2.5 Hypothesis 5: Self -efficacy (SE)
According to table 5.2, H51 is accepted as it has positive correlation
coefficient value of 0.73157 which indicates high correlation in strength and
its p-value is <0.0001 which less than alpha value 0.05. Hence, this shown
that, there is a positive and significant relationship between self-efficacy and
employee engagement. This hypothesis is proved and supported by various
previous researches and studies.

Page 155 of 206
EMPLOYEE ENGAGEMENT
Perceived self-efficacy always refers to the faith of an individual that, one‟s
abilities in performing and coordinating the courses of action needed to create
given attainments as cites in Deese from Bandura study. Among the studies of
several researchers, self-efficacy has been stated as one of the major
individual resources which bring about employee engagement. In the studies
of Hobfoll (as cited in Deese, 2009) related to the COR theory, self-efficacy
indicates to those who have established resources pool and probably invest
those resources for the future return. Therefore, employees with high self-
efficacy are more possible to be engaged in work via keep on giving their
level of vigor (effort) and absorption (passion) which form engagement.
Furthermore, both COR and VIE theories that support individual resource
(self-efficacy) shown that, individuals who believe in themselves that they are
able to achieve successfulness in their career have possibility to try on new
and challenging work tasks (Deese et al., 2009) and eventually will be further
engaged in their work (Bakker et al., 2008). According to Schaufeli studies (as
cited in Mendes & Stander, 2011), engaged employees have positive self-
efficacy and believe themselves have competency to deal with and accomplish
their job demands. In addition, Maslach, Leiter and Maslach studies (as cited
in Simpson, 2009) suggested that, high efficacy, high involvement and high
energy are traits of engagement.
On the other hand, as discussed in Karatepea and Olugbade (2009), there is a
practical evidence revealed a linkage between self-efficacy and employee
engagement and self-efficacy is one of the individual resources which will be
positively and give great impact to the three main dimensions (vigor,
dedication, and absorption) of employee engagement. This also specially
justified in the Xanthopoulou study as cited in Karatepe and Olugbade (2009)
that distinct individual resource (self-efficacy) improved employees‟ work

Page 156 of 206
EMPLOYEE ENGAGEMENT
engagement. Lastly, Deese et al., (2009) also declared that, self-efficacy
forecasted both vigor and dedication and this pointed out that self-efficacy is
one of the vital players in engagement prophecy.
Therefore, this proved that self-efficacy and employee engagement has a
positive and significant relationship. From our research, we also found out
that self-efficacy is the most important variable that lead to employee
engagement as we indicates the highest correlation in strength between self-
efficacy and employee engagement as compared to other four independent
variables (perceived supervisor support, perceived organization support,
procedural justice as well as reward and recognition).
5.3 Implications of the Study
5.3.1 Managerial Implications
From the results we obtained in our research, we found out that, employee
engagement relates positively with all five variables which are perceived
supervisor support, perceived organization support, procedural justice, reward
and recognition and self-efficacy significantly. Therefore, in order to increase
and enhance the level of employee engagement level in the organization,
manager should focus on fulfill and giving these five variables to employees
in order to retain them and boost up the employee loyalty in the organization.

Page 157 of 206
EMPLOYEE ENGAGEMENT
It is crucial for manager to be able to bring up engagement in their employees.
Our research offers further and detail information and understanding about the
factors or variables which lead to employee engagement enables manager of
the organization to be aware and take note on these areas and use it as a
method to increase employee engagement and reduce the turnover rate in the
organization.
To build up good relationship between supervisor support and employee
dedication, it is beneficial and useful in giving training which shown
supportive behaviors to nurse managers. Next, organizational resources may
be a crucial component for employee blooming. It is definitely important for
the manager in providing sufficient resources to employees to attain and
maintain employees‟ engagement.
Meanwhile, individual are highly engaged to the work group and organization
when they perceived fair authority, procedure and able to feel a senses of
respectful by others in the organization. Hence, manager should ensure all the
procedures and decision made are fair to all employees. On the other hand,
employees feel themselves are being valued and appreciated when given
certain rewards and recognition according to their contributions to the
organization. Reward and recognition is able to make them fell satisfy and be
loyalty to the organization. Hence, organization should always provide
appropriate rewards and recognition to their employees whether in intrinsic
way such as benefits and appraisal as well as in extrinsic way such as increase
their salary and giving bonus to maintain their engagement level towards the
organization.

Page 158 of 206
EMPLOYEE ENGAGEMENT
Lastly, manager in the organization should encourage coworker support as
coworker support could be helpful in increasing employee self-efficacy. As
the supervisor support and coworker support are highly correlated, supervisors
should play as a role model in encouraging and bringing a supportive
environment in the organization. It is clearly indicated that a supportive
environment is favorable and good for employee well-being as well as
enhance engagement.
5.4 Limitation of the study
With the hard work and effort that contributed to this study, there are a number of
limitations from this study that needed to be highlighted. First, limited journal
databases access that deemed to be important for this study is one of the limitations.
Due to the financial constraint, we are not able to access most of the journal that are
important and related to this study as most of the journal required us to purchase in
order to get access.
Secondly, the time constraint issue limits this study for a small sample size collection
which is in total of 150 respondents. As this research was only carried out in Kedah,
Penang and Perak, this small sample size might not be able to represent the whole
population accurately.
Thirdly, the Likert scale measurement is applied in conducting the questionnaire
survey whereby the respondents are required to choose from the suggested answer
with a scale from 1 to 5. Therefore, the accuracy and reliability of the data and precise

Page 159 of 206
EMPLOYEE ENGAGEMENT
result are difficult to collect as the measures are subjective and bias. Respondents will
also randomly select the answer due to the difficult terms that used in the
questionnaire. Thus, it leads to the misinterpretation of the result. As far as it may
concern, there are the tendency for respondents to misrepresent their answer on some
sensitive questions as they did not want to disclose to others.
Finally, the target respondent is hospital-based nurses. As far as it may concern,
nurses are dealing with heavy workload. This might reduce their ability to analyze the
questionnaire and might simply answer the questionnaire due to their heavy workload
and insufficient time to interpret the questionnaire slowly.
5.5 Recommendations for Future Research
To have a better future research, future researchers are encouraged to conduct further
studies throughout the whole Malaysia which includes Peninsular Malaysia and East
Malaysia as our data collected are only done in Penang, Kedah and Perak. Wider area
coverage is encouraged as it will be best representing the overall population and will
give better and clearer implication and thus able to clarify the factors affecting
employee engagement in Malaysia particularly in nursing industry.
Besides that, future researchers should not limit a time frame or take a longer period
of time to conduct the research as it will reduce the constraint of getting a more
accurate result. There should be no limit of time on completion of the study as the
details of the data analysis could be affected by the time taken to conduct the research.
Future researchers are also advised to have an in depth knowledge on the topic in

Page 160 of 206
EMPLOYEE ENGAGEMENT
order to narrow down the scope of research to provide higher reliability and in depth
research in the future.
5.6 Conclusion
In a nutshell, this research has disclosed a research framework of perceived
supervisor support, perceived organizational support, procedural justice, reward and
recognition, self-efficacy and employee engagement among hospital-based nurses.
Future empirical studies should focus more on other factors affecting employee
engagement so that future users are able to gain the benefits from it.
Page 161 of 206
EMPLOYEE ENGAGEMENT
REFERENCES
Abdullah, R. B., Musa, M., Zahari, H., Rahman, R., & Khalid, K. (2011). The study
of employee satisfaction and its effects towards loyalty in hotel industry in
Klang Valley, Malaysia. International Journal of Business and Social Science,
2(3), 147-155.
Adi, A. N. (2012). Driving Performance And Retention To Employee Engagement: A
Case Study In University Of Brawijaya. Journal of Basic and Applied
Scientific Research, 2(1), 338-350.
Ali, R., & Ahmed, M. S. (2009). The impact of reward and recognition programs on
employee‟s motivation and satisfaction: an empirical study. International
Review of Business Research Papers, 5(4), 270-279.
Andrew, O. C., & Sofian, S. (2012). Individual Factors and Work Outcomes of
Employee Engagement. Procedia-Social and Behavioral Sciences, 40, 498-
508.
Aselage, J., & Eisenberger, R. (2003). Perceived organizational support and
psychological contracts: A theoretical integration. Journal of Organizational
Behavior, 24(5), 491-509.
Bakker, A. B., & Demerouti, E. (2008). Towards a model of work engagement.
Career development international, 13(3), 209-223. Behavior, 78(1), 100-109.

Page 162 of 206
EMPLOYEE ENGAGEMENT
Bhatnagar, J. (2007). Talent management strategy of employee engagement in Indian
ITES employees: key to retention. Employee relations, 29(6), 640-663.
Bhattacharya, D., Dey, S., & Saha, D. Linking Commitment and Job Satisfaction of
Health Care Management Employees: Insights from the Job Characteristics
Model.
Bhattacharya, S., & Mukherjee, P. (2009). Rewards as a key to employee
engagement : A comparative study on I.T. professionals. ASBM Journal of
Management, 2(1), 160-175.
Blader, S. L., & Tyler, T. R. (2009). Testing and extending the group engagement
model: linkages between social identity, procedural justice, economic
outcomes, and extra role behavior. Journal of Applied Psychology, 94(2), 445.
Castle, N. G. (2013). Consistent Assignment of Nurse Aides: Association with
Turnover and Absenteeism. Journal of aging & social policy, 25(1), 48-64.
Chan, C. C., McBey, K., Basset, M., O‟ Donnell, M., & Winter, R. (2004). Nursing
crisis: retention strategies for hospital administrators. Research and Practice in
Human Resource Management, 12(2), 31-56.
Danish, R. Q., & Usman, A. (2010). Impact of reward and recognition on job
satisfaction and motivation: An empirical study from Pakistan. International
Journal of Business and Management, 5(2), P159.

Page 163 of 206
EMPLOYEE ENGAGEMENT
De Gieter, S., Hofmans, J., & Pepermans, R. (2011). Revisiting the impact of job
satisfaction and organizational commitment on nurse turnover intention: An
individual differences analysis. International Journal of Nursing Studies, 48,
1562-1569.
Deese, M. N. (2009). Testing an extension of the job demands-resources model: The
addition of personal resources as mediators to the resources-engagement
relationship. (Order No. 1467805, Clemson University). ProQuest
Dissertations and Theses , 1-95.
Eisenberger, R., Armeli, S., Rexwinkel, B., Lynch, P. D., & Rhoades, L. (2001).
Reciprocation of Perceived Organizational Support. Journal of Applied
Psychology, 86(1), 42-51.
Eisenberger, R., Sucharski, I. L., Rhoades, L., Stinglhamber, F., & Vandenberghe, C.
(2002). Perceived Supervisor Support: Contributions to Perceived
Organizational Support and Employee Retention. Journal of Applied
Psychology, 87(3), 565?573.
El Akremi, A., Vandenberghe, C., & Camerman, J. (2010). The role of justice and
social exchange relationships in workplace deviance: Test of a mediated
model. human relations, 63(11), 1687-1717.

Page 164 of 206
EMPLOYEE ENGAGEMENT
Gillet, N., Fouquereau, E., Antignac, A. B., Mokounkolo, R., & Colombat, P. (2013).
The mediating role of organizational justice in the relationship between
transformational leadership and nurses? quality of work life: A cross-sectional
questionnaire survey. International Journal of Nursing Studies.
Gyekye, S. A., & Salminen, S. (2007). Workplace Safety Perceptions and Perceived
Organizational Support: Do Supportive Perceptions Influence Safety
Perceptions? International Journal of Occupational Safety and Ergonomics,
13(2), 189-200.
Hao, L., & Yusoff, Y. M. (2013). A longitudinal study of turnover satisfaction: The
Sabah, Malaysia case. The Macrotheme Review, 2(1), 43-55.
Henryhand, C. J. (2009). The effect of employee recognition and employee
engagement on job satisfaction and intent to leave in the public sector. Capella
University). ProQuest Dissertations and Theses , 1-120.
Hox, J. J., & Boeije, H. R. (2005). Data collection, primary versus secondary.
In Evidence-based HRM: a Global Forum for Empirical Scholarship (Vol. 1, No. 1,
pp. 96-108). Emerald Group Publishing Limited.
Kanten, S., & Sadullah, O. (2012). An Empirical Research on Relationship Quality of
Work Life and Work Engagement. Procedia-Social and Behavioral Sciences,
62, 360-366.

Page 165 of 206
EMPLOYEE ENGAGEMENT
Karatepe, O. M. (2013). High-performance work practices and hotel employee
performance: The mediation of work engagement. International Journal of
Hospitality Management, 32, 132-140.
Karatepe, O. M., & Olugbade, O. A. (2009). The effects of job and personal resources
on hotel employees‟ work engagement. International Journal of Hospitality
Management, 28(4), 504-512.
Kerr, S. Reward & Recognition.
Kleu, J. M. (2011). Engaging Leadership In Healthcare Organizations: The Mediating
Role Of Work Engagement. Master Thesis, Msc Human Resource
Management.
Kompaso, S. M., & Sridevi, M. S. (2010). Employee engagement: The key to
improving performance. International Journal of Business and
Management,5(12), p89.
Konovsky, M. A. (2000). Understanding procedural justice and its impact on business
organizations. Journal of management, 26(3), 489-511.
Laschinger, H. K., Wilk, P., Cho, J., & Greco, P. (2009). Empowerment, engagement
and perceived effectiveness in nursing work environments: does experience
matter? Journal of Nursing Management, 17, 636-646.
Page 166 of 206
EMPLOYEE ENGAGEMENT
Law, R., Dollard, M. F., Tuckey, M. R., & Dormann, C. (2011). Psychosocial safety
climate as a lead indicator of workplace bullying and harassment, job
resources, psychological health and employee engagement. Accident Analysis
& Prevention, 43(5), 1782-1793.
Lawrence, L. A. (2011, October). Work engagement, moral distress, education level,
and critical reflective practice in intensive care nurses. In Nursing Forum (Vol.
46, No. 4, pp. 256-268). Blackwell Publishing Inc.
Lee, S. P., Bunpitcha, C., & Ratanawadee, C. (2011). Factors predicting
organizational commitment among nurses in state hospitals, Malaysia.
International Medical Journal Malaysia, 10(2), 21-28.
Leonardelli, G. J., & Toh, S. M. (2011). Perceiving Expatriate Coworkers as
Foreigners Encourages Aid Social Categorization and Procedural Justice
Together Improve Intergroup Cooperation and Dual Identity. Psychological
science, 22(1), 110-117.
Lin, C. P., & Chen, M. F. (2004). Career Commitment as a Moderator of the
Relationships among Procedural Justice, Perceived Organizational Support,
Organizational Commitment, and Turnover Intentions. Asia Pacific
Management Review, 9(3), 519-538.

Page 167 of 206
EMPLOYEE ENGAGEMENT
Loi, R., Yue, N. H., & Foley, S. (2006). Linking employees? justice perceptions to
organizational commitment and intention to leave: The mediating role of
perceived organizational support. Journal of Occupational and Organizational
Psychology, 79, 101?120. doi:10.1348/096317905X39657
Lu, C. Q., Siu, O. L., Chen, W. Q., & Wang, H. J. (2011). Family mastery enhances
work engagement in Chinese nurses: A cross-lagged analysis. Journal of
Vocational Behavior, 78(1), 100-109.
Maben, J. (2008). Employee engagement and retention in the nursing workforce: A
case study of an inner-London acute trust Final Report.
Makanjee, C. R., Hartzer, Y. F., & Uys, I. L. (2006). The effect of perceived
organizational support on organizational commitment of diagnostic imaging
radiographers.
Makhbul, Z. M., Rahid, M. R., & Hasun, F. M. (2011). What Made They Go? Journal
of Global Management, 1(1), 13-22.
Malinen, S., Wright, S., & Cammock, P. (2013, April). What drives organizational
engagement?: A case study on trust, justice perceptions and withdrawal
attitudes.
Page 168 of 206
EMPLOYEE ENGAGEMENT
Maningo-Salinas, M. (2010). Relationship between moral distress, perceived
organizational support and intent to turnover among oncology nurses. (Order
No.3433164, Capella University). ProQuest Dissertations and Theses , 1-132.
Manojlovich, M., & Laschinger, H. (2007). The Nursing Worklife Model: Extending
and Refining a New Theory. Journal of Nursing Management, 15, 256-263.
Markos, S., & Sridevi, M. S. (2010). Employee Engagement: The Key to Improving
performance. International Journal of Business and Management, 5(12).
Marquard , M. J. (2010). Leadership behavior impact on employee engagement.
Retrieved from
http://pepperdine.contentdm.oclc.org/cdm/ref/collection/p15093coll2//id/56.
Mauno, S., Kinnunen, U., & Ruokolainen, M. (2007). Job demands and resources as
antecedents of work engagement: A longitudinal study. Journal of Vocational
Behavior, 70(1), 149-171.
Men, L. R. (2012). CEO credibility, perceived organizational reputation, and
employee engagement. Public Relations Review, 38(1), 171-173.
Mendes, F., & Stander, M. W. (2011). Positive organisation: The role of leader
behavior in work engagement and retention. SA Journal of Industrial
Psychology, 37(1), 1-13.

Page 169 of 206
EMPLOYEE ENGAGEMENT
Mone, E., Eisinger, C., Guggenheim, K., Price, B., & Stine, C. (2011). Performance
management at the wheel: Driving employee engagement in organizations.
Journal of Business and Psychology, 26(2), 205-212.
Nahrgang, J. D., Hofmann, D. A., & Morgeson, F. P. (2010). Safety at Work: A
Meta-Analytic Investigation of the Link Between Job Demands, Job
Resources, Burnout, Engagement, and Safety Outcomes. Journal of Applied
Psychology. doi:10.1037/a0021484
Naumann, S. E., & Bennett, N. (2002). The effects of procedural justice climate on
work group performance. Small Group Research, 33(3), 361-377.
Ologbo, A. C., & Sofian, S. Individual and Organizational Factors of Employee
Engagement on Employee Work Outcomes.
Omar, K., Anuar, M. M., Majid, A. H. A., & Johari, H. Organizational Commitment
and Intention to Leave among Nurses in Malaysia Public Hospitals.
Omar, K., Majid, A. H. A., & Johari, H. (2011). JOB SATISFACTION AND
TURNOVER INTENTION AMONG NURSES: THE MEDIATING ROLE
OF MORAL OBLIGATION. JOURNAL OF GLOBAL MANAGEMENT.
Othman, N., & Nasurdin, A. M. Work Engagement of Malaysian Nurses: Exploring
the Impact of Hope and Resilience.

Page 170 of 206
EMPLOYEE ENGAGEMENT
Park, J., & Gursoy, D. (2012). Generation effects on work engagement among US
hotel employees. International Journal of Hospitality Management, 31(4),
1195-1202.
Parker, S. L., Jimmieson, N. L., & Amiot, C. E. (2010). Self-determination as a
moderator of demands and control: Implications for employee strain and
engagement. Journal of Vocational Behavior, 76, 52-67.
doi:10.1016/j.jvb.2009.06.010
Pazy, A., & Ganzach, Y. (2006). Pay Contingency And The Effects Of Perceived
Organization And Supervisor Support On Performance And Commitment.
Journal of Management.
Rao, D. V. (2012). Nurse Engagement In Indian Health Care Industry. Asian Journal
Of Research In Social Science & Humanities, 2(6), 139-145.
Rhoades, L., & Eisenberger, R. (2002). Perceived Organizational Support: A Review
of the Literature. Journal of Applied Psychology, 87(4), 698-714.
Rhoades, L., Eisenberger, R., & Armeli, S. (2001). Affective Commitment to the
Organization: The Contribution of Perceived Organizational Support. Journal
of Applied Psychology, 86(5), 825-836.

Page 171 of 206
EMPLOYEE ENGAGEMENT
Rivera, R.R., Fitzpatrick, J.J., & Boyle, S.M. (2011). Closing the RN engagement gap:
which drivers of engagement matter?. Journal of Nursing Administration,
41(6), 265-272.
Robinson, D., Perryman, S., & Hayday, S. (2004). The Drivers of Employee
Engagement(408). Retrieved from IES website:
http://www.wellbeing4business.co.uk/docs/Article%20-
%20Engagement%20research.pdf
Saks, A.M. (2006). Antecedents and consequences of employee engagement. Journal
of Managerial Psychology, 21(7), 600-619.
Salie, S., & Schlechter, A. (2012). A formative evaluation of a staff reward and
recognition programme. SA Journal of Human Resource Management, 10(3),
1-11.
Sekaran, U., & Bougie, R (2010). Research methods for business: A skill building
approach. (5th ed.). Chichester, West Sussex: John Wiley & Sons, Inc.
Shanock, L. R., & Eisenberger, R. (2006). When Supervisors Feel Supported:
Relationships With Subordinates? Perceived Supervisor Support, Perceived
Organizational Support, and Performance. Journal of Applied Psychology,
91(3), 689-695.

Page 172 of 206
EMPLOYEE ENGAGEMENT
Siew, C. T. S., & Ghani, N. A. An Overview of Nurses Workload Measurement
Systems and Workload Balance.
Simpson, M. R. (2007). THE RELATIONSHIP BETWEEN REGISTERED
NURSES' TURNOVER COGNITIONS, JOB SATISFACTION, JOB
SEARCH BEHAVIOR, SELECTED NURSE CHARACTERISTICS
AND WORK ENGAGEMENT. ProQuest Dissertations and Theses.
Simpson, M. R. (2009). Engagement at work: A review of the literature. International
Journal of Nursing Studies, 46(7), 1012-1024.
Stander, M. W., & Rothmann, S. (2010). Psychological empowerment, job insecurity,
and employee engagement. SA Journal of Industrial Psychology, 36(1), 1-8.
Stander, M. W., & Rothmann, S. (2010). Psychological empowerment, job insecurity,
and employee engagement. SA Journal of Industrial Psychology,36(1), 1-8.
Suhaime, I. L., Mahmud, N., & Hasin, H. RELATIONSHIP ANALYSIS OF JOB
SATISFACTION, JOB-RELATED STRESS AND INTENTION TO LEAVE
AMONG NURSES.
Tang, W. M., & Ghani, M. F. A. (2012). Job Satisfaction among the Nurse Educators
in the Klang Valley, Malaysia. International Journal of Nursing Science,2(4),
29-33.
Page 173 of 206
EMPLOYEE ENGAGEMENT
Tyler, T. R., & Blader, S. L. (2003). The group engagement model: Procedural justice,
social identity, and cooperative behavior. Personality and social psychology
review, 7(4), 349-361.
VAN DER KLEIJ, J. F. M. (2011). Engaging leadership in healthcare organizations:
the mediating role of work engagement. Unpublished Mastersthesis, MSc
Human Recourse Management University of Groningen, Faculty of
Economics and Business. September.
van Prooijen, J. W., De Cremer, D., van Beest, I., Ståhl, T., Dijke, M. V., & Van
Lange, P. A. (2008). The egocentric nature of procedural justice: Social value
orientation as moderator of reactions to decision-making procedures. Journal
of Experimental Social Psychology, 44(5), 1303-1315.
Wayne, S. J., Tetrick, L. E., Shore, L. M., & Bommer, W. H. (2002). The Role of Fair
Treatment and Rewards in Perceptions of Organizational Support and
Leader?Member Exchange. Journal of Applied Psychology, 87(3), 590?598.
Willoughby, C. M. (2011). A critical literature review exploring work engagement in
the nursing profession. (Order No. 3480027, Azusa Pacific University).
ProQuest Dissertations and Theses , 1-127.
Wilson, K. (2009). A Survey Of Employee Engagement.
Page 174 of 206
EMPLOYEE ENGAGEMENT
Wilson, L., & Fowler, M. (2012). Leadership needed to address the global nursing
and midwifery workforce shortage. Nursing Outlook, 60(1), 51-53.
Woodcock, C. (2012). Transformational leadership and employee engagement.
(Order No. 3513158, Northern Illinois University). ProQuest Dissertations
and Theses , 1-114.
Xanthopoulou, D., Bakker, A. B., Demerouti, E., & Schaufeli, W. B. (2009).
Reciprocal relationships between job resources, personal resources, and work
engagement. Journal of Vocational Behavior, 74(3), 235-244.
Xu, J., & Thomas, H. C. (2011). How can leaders achieve high employee
engagement?. Leadership & Organization Development Journal, 32(4), 399-
416.
Y. M., & Tiernan, J. (2009). Exploration of the facilitators of and barriers to work
engagement in nursing. International Journal of Nursing Studies, 46(12),
1557-1565.
Yuen-OnnChoong, T. C. L., Kuek, T. Y., & Lee, E. K. (2012). Job Satisfaction of
Malaysian Nurses: A Causal Model. International Foundation for Research
and Development (IFRD).
Zikmund, W. G., Babin, B. J., Carr, J. C., & Griffin, M. (2010). Business research
methods (8th ed.). New York: South-Western/Cengage Learning.

Page 175 of 206
EMPLOYEE ENGAGEMENT
Zilembo, M., & Monterosso, L. (2008). Towards a conceptual framework for
preceptorship in the clinical education of undergraduate nursing students.
Contemporary Nurse: A Journal for the Australian Nursing Profession, 30(1),
89-94.

Page 176 of 206
EMPLOYEE ENGAGEMENT
APPENDIX 1.1
NURSING POPULATION IN MALAYSIA

Page 177 of 206
EMPLOYEE ENGAGEMENT

Page 178 of 206
EMPLOYEE ENGAGEMENT
APPENDIX 3.1
QUESTIONNAIRE
Universiti Tunku Abdul Rahman
The employee engagement in nursing industry: A study on hospital-based nurses.
Dear Respondents:
We are students of Bachelor of Business Administration (Hons) from Universiti
Tunku Abdul Rahman (UTAR). We are currently doing our final year project with the
title “The employee engagement in nursing industry: A study on hospital-based
nurses.” in order to complete our honours degree program.
The purpose of this research is to identify the significant relationship between the
variables (perceived supervisor support, perceived organization support, procedural
justice, reward and recognition, and self-efficacy) and employee engagement. This
research will assist to know more about the reasons in which affect the nurses to be
engaging in their job and workplace.
This questionnaire consists of 3 parts. Part A is about the personal details of the
respondents, Part B is related to the factors that influence the employee engagement,
and Part C is the general information on employee engagement.
Finally, please read the instructions carefully before answering the questions. Thank
you for your cooperation and willingness to answer the questionnaire. Your response
will be kept confidential and be used solely for academic purpose.
Hew Hui Ying 11ABB00331
Kong Pei Shin 11ABB00207
Moy Xue Min 11ABB00129
Ng Lai Yen 11ABB00274
Ng Siew Siew 11ABB00208
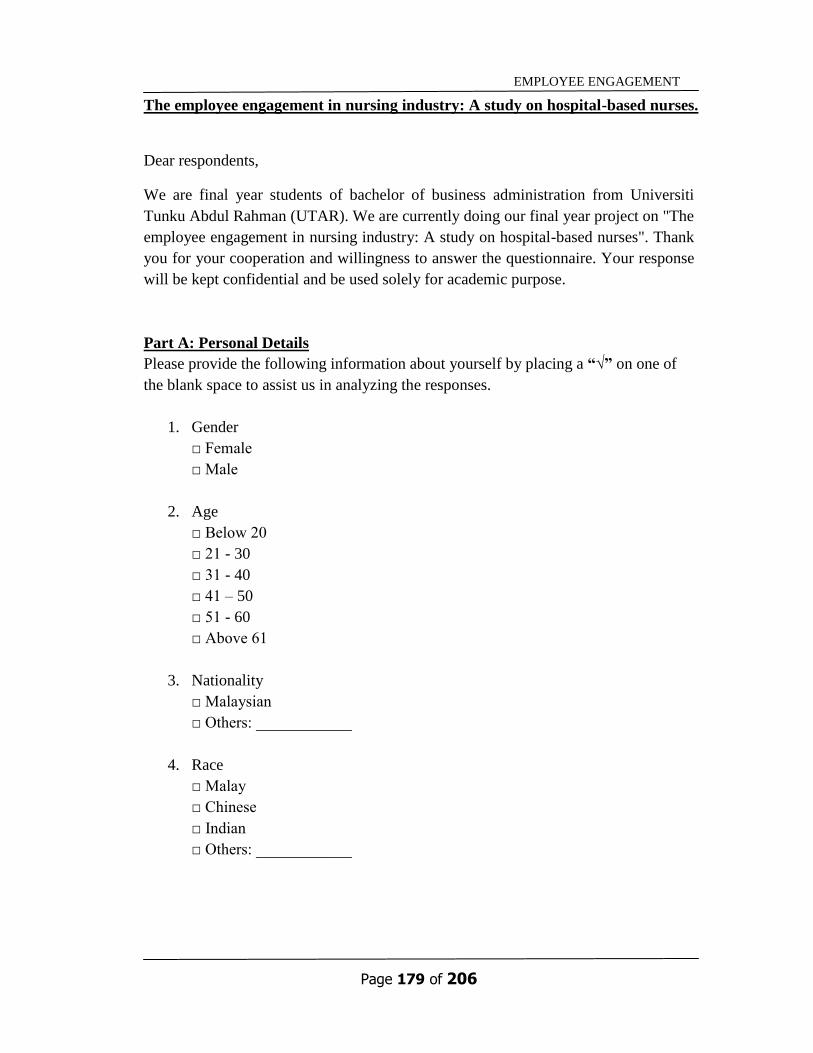
Page 179 of 206
EMPLOYEE ENGAGEMENT
The employee engagement in nursing industry: A study on hospital-based nurses.
Dear respondents,
We are final year students of bachelor of business administration from Universiti
Tunku Abdul Rahman (UTAR). We are currently doing our final year project on "The
employee engagement in nursing industry: A study on hospital-based nurses". Thank
you for your cooperation and willingness to answer the questionnaire. Your response
will be kept confidential and be used solely for academic purpose.
Part A: Personal Details
Please provide the following information about yourself by placing a “√” on one of
the blank space to assist us in analyzing the responses.
1. Gender
□ Female
□ Male
2. Age
□ Below 20
□ 21 - 30
□ 31 - 40
□ 41 – 50
□ 51 - 60
□ Above 61
3. Nationality
□ Malaysian
□ Others: ____________
4. Race
□ Malay
□ Chinese
□ Indian
□ Others: ____________

Page 180 of 206
EMPLOYEE ENGAGEMENT
5. Monthly income:
□ Below RM1500.00
□ RM1501.00 - RM2500.00
□ RM2501.00 - RM3500.00
□ RM3501.00 – RM4500.00
□ Above RM4501.00
6. Highest educational degree earned
□ Post-basic ccertificate/ advanced diploma
□ Diploma
□ Bachelor degree
□ Master degree
□ Doctorate degree
7. Prior clinic experience
□ 1-5 year
□ 6-10 year
□ 11-15 years
□ 16 years and above

Page 181 of 206
EMPLOYEE ENGAGEMENT
Part B: Factors influences employee engagement
The following set of statement related to the factors influencing employee‟s
engagement. The Likert scale of measurement is being used. According to your
experience as employee, please read and answer according to what best reflect your
opinion.
Strongly
Disagree Disagree Neutral Agree Strongly Agree
1 2 3 4 5
SD D N A SA
1. I can depend on my supervisor for help when
things get tough at work. 1 2 3 4 5
2. My supervisor treats me with respect. 1 2 3 4 5
3. My supervisor cares about my opinions. 1 2 3 4 5
4. My work supervisor really cares about my well-
being. 1 2 3 4 5
5. My supervisor strongly considers my goals and
values. 1 2 3 4 5
6. My supervisor is willing to listen to my personal
problems. 1 2 3 4 5
7. My supervisor shows very little concern for me. 1 2 3 4 5
8. My manager would ignore any complaint from
me. 1 2 3 4 5
9. The organization I work for provides me little
opportunity to move up the ranks. 1 2 3 4 5
10. My organization really cares about my well-
being. 1 2 3 4 5
11. My organization strongly considers my goals
and values. 1 2 3 4 5
12. I find that my values and the organization's
values are very similar. 1 2 3 4 5
13. Help is available from my organization when I
have a problem. 1 2 3 4 5

Page 182 of 206
EMPLOYEE ENGAGEMENT
14. My organization shows little concern for me. 1 2 3 4 5
15. I talk up this organization to my friends as a
great organization to work for. 1 2 3 4 5
16. Decisions are usually made in fair ways at my
work organization. 1 2 3 4 5
17. The procedures used to make decisions about
pay and promotions are fair. 1 2 3 4 5
18. Decisions that affect me are usually made in
fair ways at my work organization. 1 2 3 4 5
19. The procedures used to decide how much I am
paid are fair. 1 2 3 4 5
20. Most of the issues involving me are handled in
fair ways where I work. 1 2 3 4 5
21. I am usually not told about important things
that are happening in this work organization. 1 2 3 4 5
22. Overall, people are treated fairly where I work. 1 2 3 4 5
23. Overall, I am fairly treated where I work. 1 2 3 4 5
24. I‟m satisfied with the amount of health care
paid for. 1 2 3 4 5
25. I have the opportunities to learn & grow. 1 2 3 4 5
26. This organization gives enough recognition for
work that is well done. 1 2 3 4 5
27. I feel I am valued at this organization. 1 2 3 4 5
28. My salary is fair for my responsibilities. 1 2 3 4 5
29. If I do good work, I can count on being
promoted. 1 2 3 4 5
30. Overall, I am satisfied with the organization‟
benefit package. 1 2 3 4 5
31. When I try, I generally succeed. 1 2 3 4 5
32. My job is well within the scope of my abilities. 1 2 3 4 5
33. I have all the technical knowledge I need to
deal with my job, all I need now is practical
experience.
1 2 3 4 5
34. I feel confident that my skills and abilities
equal or exceed those of my colleagues. 1 2 3 4 5

Page 183 of 206
EMPLOYEE ENGAGEMENT
35. I could have handled a more challenging job
than the one I am doing. 1 2 3 4 5
36. Professionally speaking, my job exactly
satisfies my expectations of myself. 1 2 3 4 5
37. I complete tasks successfully. 1 2 3 4 5
38. I am filled with doubts about my competence. 1 2 3 4 5

Page 184 of 206
EMPLOYEE ENGAGEMENT
Part C: General information on employee engagement
According to your experience as employee, please read and answer according to what
best reflect your opinion.
Strongly
Disagree Disagree Neutral Agree Strongly Agree
1 2 3 4 5
SD D N A SA
1. At my work, I feel bursting with energy. 1 2 3 4 5
2. At my job I feel strong and vigorous. 1 2 3 4 5
3. When I get up in the morning, I feel like going
to work. 1 2 3 4 5
4. I can continue working for very long periods at
a time. 1 2 3 4 5
5. At my job, I am very resilient, mentally. 1 2 3 4 5
6. At my work I always persevere, even when
things do not go well. 1 2 3 4 5
7. I find the work that I do full of meaning and
purpose. 1 2 3 4 5
8. I am enthusiastic about my job. 1 2 3 4 5
9. My job inspires me. 1 2 3 4 5
10. I am proud of the work that I do. 1 2 3 4 5
11. To me, my job is challenging. 1 2 3 4 5
12. Time flies when I am working. 1 2 3 4 5
13. When I am working, I forget everything else
around me. 1 2 3 4 5
14. I feel happy when I am working intensely. 1 2 3 4 5
15. I am immersed in my work. 1 2 3 4 5
16. I get carried away when I am working. 1 2 3 4 5

Page 185 of 206
EMPLOYEE ENGAGEMENT
17. It is difficult to detach myself from my job. 1 2 3 4 5
18. I was absorbed in my work. 1 2 3 4 5

Page 186 of 206
EMPLOYEE ENGAGEMENT
APPENDIX 3.2
PILOT TEST
PSS

Page 187 of 206
EMPLOYEE ENGAGEMENT
POS
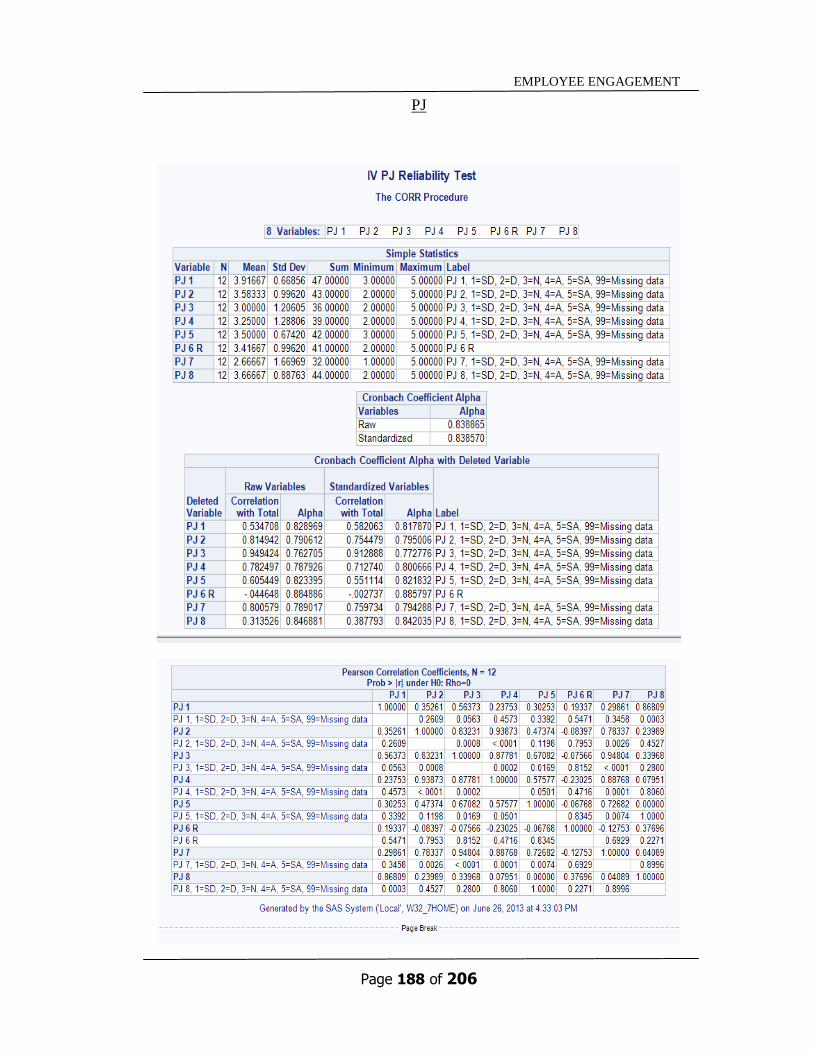
Page 188 of 206
EMPLOYEE ENGAGEMENT
PJ

Page 189 of 206
EMPLOYEE ENGAGEMENT
RR

Page 190 of 206
EMPLOYEE ENGAGEMENT
SE

Page 191 of 206
EMPLOYEE ENGAGEMENT
EE

Page 192 of 206
EMPLOYEE ENGAGEMENT
APPENDIX 4.1
DESCRIPTIVE ANALYSIS
GENDER
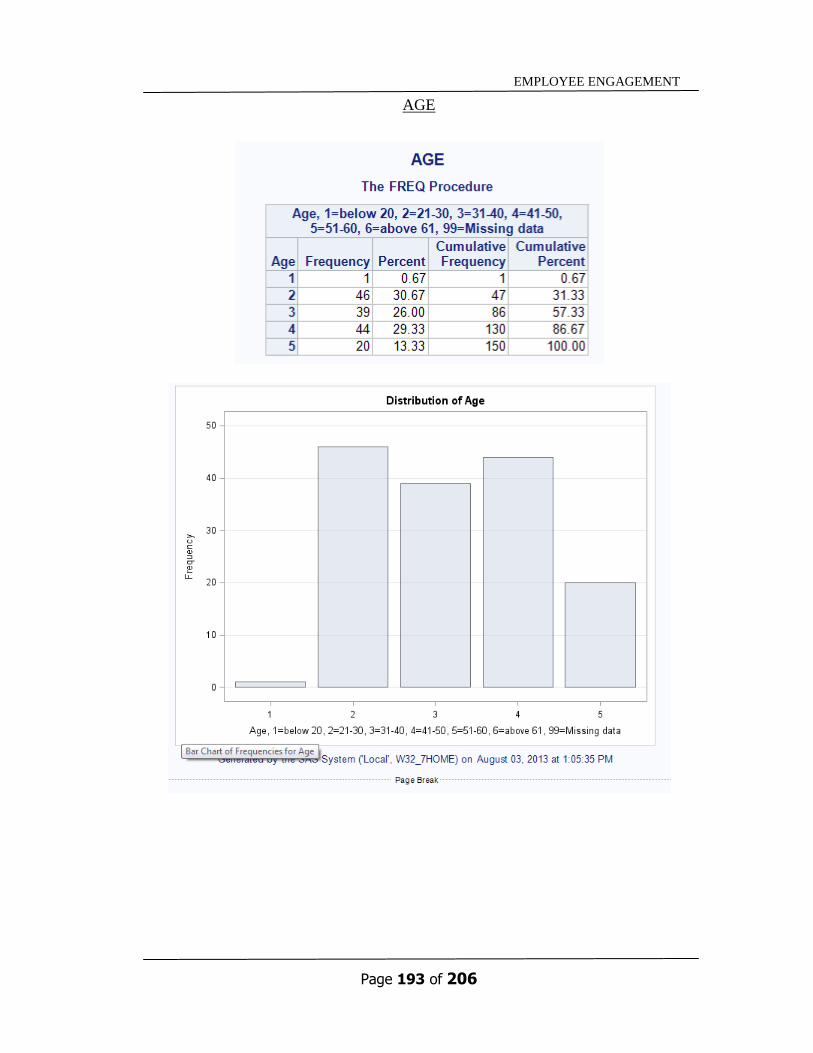
Page 193 of 206
EMPLOYEE ENGAGEMENT
AGE

Page 194 of 206
EMPLOYEE ENGAGEMENT
NATIONALITY

Page 195 of 206
EMPLOYEE ENGAGEMENT
RACE

Page 196 of 206
EMPLOYEE ENGAGEMENT
INCOME LEVEL

Page 197 of 206
EMPLOYEE ENGAGEMENT
EDUCATION LEVEL

Page 198 of 206
EMPLOYEE ENGAGEMENT
EXPERIENCE

Page 199 of 206
EMPLOYEE ENGAGEMENT
APPENDIX 4.2
FULL STUDY RELIABILITY TEST
PSS

Page 200 of 206
EMPLOYEE ENGAGEMENT
POS

Page 201 of 206
EMPLOYEE ENGAGEMENT
PJ

Page 202 of 206
EMPLOYEE ENGAGEMENT
RR

Page 203 of 206
EMPLOYEE ENGAGEMENT
SE

Page 204 of 206
EMPLOYEE ENGAGEMENT
EE
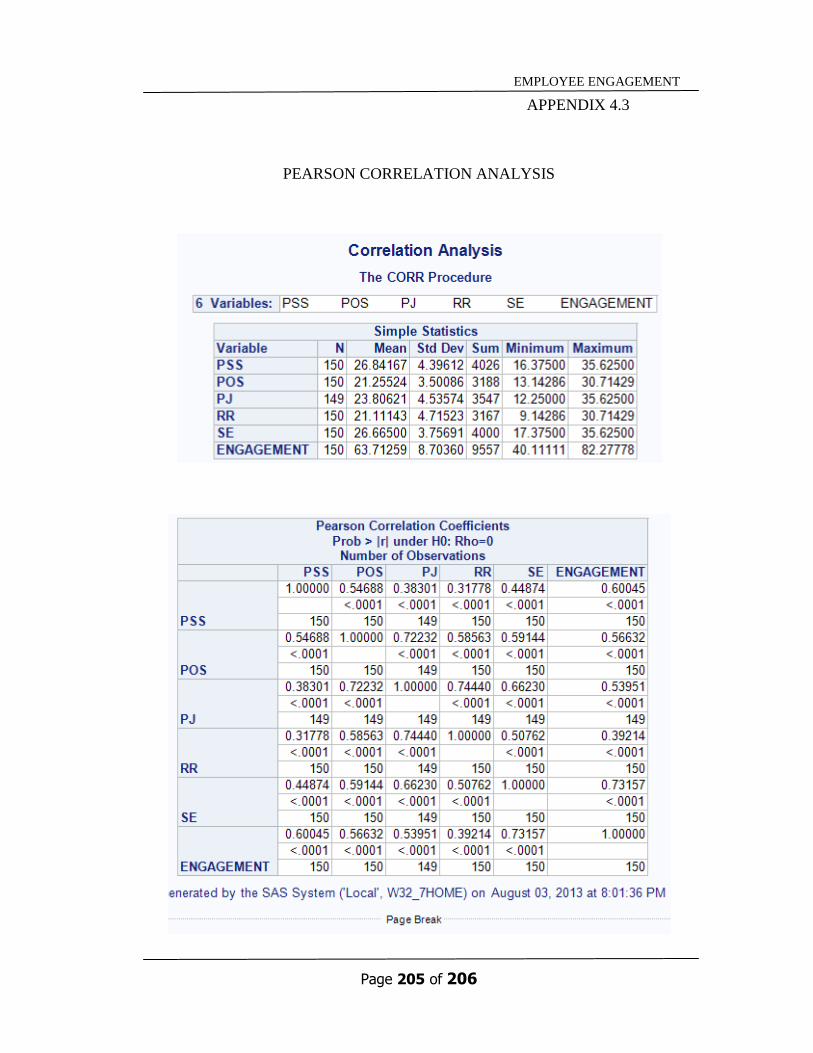
Page 205 of 206
EMPLOYEE ENGAGEMENT
APPENDIX 4.3
PEARSON CORRELATION ANALYSIS
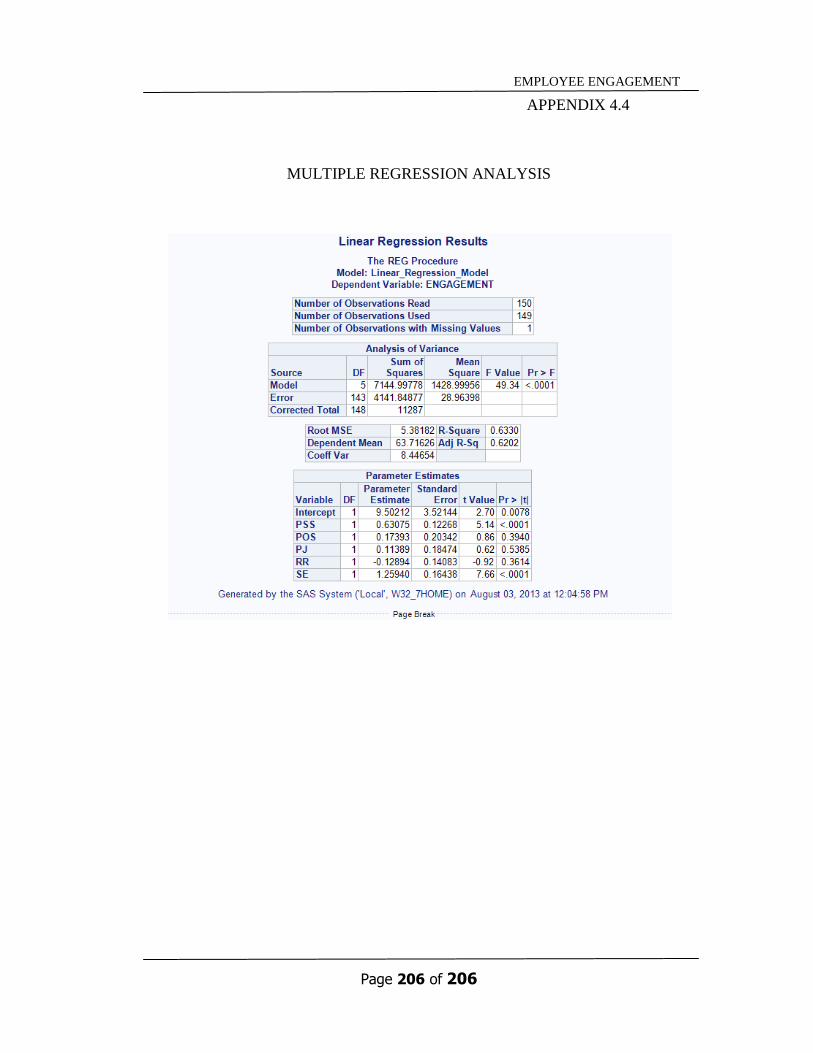
Page 206 of 206
EMPLOYEE ENGAGEMENT
APPENDIX 4.4
MULTIPLE REGRESSION ANALYSIS