the egress of fluid from the brain via arachnoid transport
TRANSCRIPT

i
The Egress of Fluid from the Brain via Arachnoid
Transport: Foundational Work for the Tissue Engineering of
the Arachnoid Granulation
A DISSERTATION
SUBMITTED TO THE FACULTY OF THE GRADUATE SCHOOL
OF THE UNIVERSITY OF MINNESOTA
BY
Cornelius Hoktsim Lam
IN PARTIAL FULFILLMENT OF THE REQUIREMENTS
FOR THE DEGREE OF
DOCTOR OF PHILOSOPHY
Allison Hubel Ph.D., advisor
December 2011
ii
Cornelius Hoktsim Lam
©2011

i
Acknowledgements
The instillation of the work ethic began early and I am most grateful to my father Dr. Chi-hung
Lam and my late mother Yuen-chau Wong Lam for the upbringing that I had. In the last sixteen
years, my wife Dr. Robin K. Solomon played a central role in my life and together with my boys
help me complete what would otherwise be a very incomplete person.
The production of this thesis is a culmination of decades of influences and experiences. While it
may be argued that scientific inquiry begins very early in childhood, the formalization and
education toward that goal require mentors who are understanding and compassionate toward
the pupil continuously throughout his life. My mentors included Robert D. Coombe, PhD,
current Chancellor of the University of Denver, Howard W. Blume, MD, PhD, Harvard University,
and Abbas F. Sadikot, MD, PhD, McGill University. I have made mistakes, spent money, wasted
time, and most importantly learned in their laboratories.
Many factors must have entered into the decision for choosing a career in neurosurgery, and
then years later for choosing neurotransport as a focus to study. Those who have guided me
along this path are many. Department heads to fellow students and residents were all
important to me. I would like to particularly thank the residents in the Department of
Neurosurgery at the University of Minnesota from whom I derive much intellectual stimulation.
I must thank my two chairmen under whom I have the privilege to work: Dr. Robert E. Maxwell,
who understood what a slow learner is, and Dr. Stephen J. Haines, who although never explicitly
encouraged me (he’s being practical), at every turn opened doors for me in the pursuit of this
PhD. This dissertation would not be possible without Dr. Roderick A. Barke, Chief of Surgery at
the Minneapolis VA Medical Center, who inspired and encouraged me, lobbied on my behalf,
contributed to the laboratory equipment, and kept me on an even keel. I did not trim my
practice in this pursuit and took great lengths to maintain the status quo, but I am certain that
there was invariably some impact on my fellow colleagues in the Department of Neurosurgery
at the University of Minnesota. I wish to thank all of them.

ii
How this PhD began six years ago would be an interesting story, but not relevant in this section
of the thesis. Suffice to say that Dr. Robert T. Tranquillo, Chairman of the Department of
Biomedical Engineering, and Dr. Allison Hubel, my advisor, played important roles in this regard.
They offered me an opportunity that not many people in my situation would have. At the same
time, I wish to thank my PhD committee who guided me through these years.
This work would not be possible without Eric A. Hansen, PhD, who essentially runs the
Neurotransport laboratory. A Level ten Jedi in world of freshwater fishing, he educated me and
my family in more ways than one.
I would like to acknowledge the Augustine Foundation, the Institute of Engineering and
Medicine, and the Regent Scholarship program for the financial and administrative support of
this work.

iii
Dedication
To my dearest boys,
Zeke and Nate…
I hope you never stop learning.
iv
Abstract The arachnoid tissue is a critical component for the removal of cerebrospinal fluid (CSF) and
other substances. Failure results in hydrocephalus, increased intracranial pressure, and buildup
of toxic materials in the brain. The purpose of this thesis is to establish a foundation for a
biomimetic arachnoid construct. First, we characterized arachnoid cell transport in culture and
on three-dimensional collagen scaffolds. Arachnoid cells were harvested from rat brainstems
and cultured onto bilayered bovine collagen scaffolds. Cells exhibited arachnoid cell phenotype
(positive for vimentin, desmoplakin, and cytokeratin), readily penetrated the collagen scaffold,
and doubled approximately every 2–3 days. The transepithelial electrical resistance for a
monolayer of cells was 160 Ω∙cm2, and permeability of indigo carmine was 6.7+1.1X10- 6 cm/s.
Hydraulic conductivity of the collagen construct was 6.39 mL/min/mmHg/cm2. Because of
practical limitations of primary culture which include slow growth, early senescence, and poor
reproducibility, we created two immortalized rat arachnoid cell lines using retroviral gene
transfer of SV40 large T antigen (SV40 LTAg) either with or without human telomerase (hTERT).
They stably expressed either SV40 LTAg alone, or SV40 LTAg and hTERT, and demonstrated high
proliferative rate, contact inhibition at confluence, and stable expression of protein markers
characteristic of native arachnoid cells for more than 160 passages. We subsequently used
them to determine arachnoidal barrier properties and paracellular transport. Permeabilities of
urea, mannitol, and inulin were 2.9+1.1X10⁻⁶, 0.8+.18x10-6, and 1.0+.29x10-6 cm/s respectively.
Size differential permeability testing with dextran clarified the arachnoidal blood-CSF-barrier
limit and established a rate of intracellular transport to be two orders of magnitude slower than
paracellular transport in a polyester membrane diffusion chamber. The theoretical pore size for
paracellular space was 11Å and the occupancy to length ratios were 0.8 and 0.72 cm-1 for urea
and mannitol respectively. The monolayer permeability was not significantly different from an
apical to basal direction or vice versa. Gap junction may have a role in barrier formation.
Although up-regulation of claudin by dexamethasone did not significantly alter paracellular
transport, increasing intracellular cAMP decreased mannitol permeability. Calcium modulated
paracellular transport, but only selectively with the ion chelator, EDTA, and with disruption of
intracellular stores. Without the neurovascular unit of the blood-brain-barrier, the blood-CSF-
barrier at the arachnoid tissue is anatomically and physiologically different from the vascular
based blood-brain-barrier. These studies provide a three dimensional architecture, a stable

v
cellular substrate, and baseline blood-CSF-barrier properties for the establishment of a viable
bioartificial arachnoid shunt.

vi
Table of Contents
Acknowledgements........................................................................................................................... i
Dedication ....................................................................................................................................... iii
Abstract ........................................................................................................................................... iv
Table of Contents ............................................................................................................................ vi
List of Tables ................................................................................................................................... xi
List of Figures ................................................................................................................................. xii
List of Papers .................................................................................................................................. xiv
Chapter 1: Background and Introduction ........................................................................................ 1
The arachnoid .............................................................................................................................. 2
History of arachnoid physiology research ............................................................................... 2
Embryology of arachnoid ......................................................................................................... 7
Anatomy of Arachnoid Tissue .................................................................................................. 8
Figure 1.1: Arachnoid granulation . ......................................................................................... 9
Table 1.1: Constituents in CSF of an adult (adapted from Greenberg[42]) ........................... 11
Figure 1.2: CSF flow ................................................................................................................ 12
Figure 1.3: The direction of movement of blood and debris from the intracranial cavity to
the vascular system................................................................................................................ 13
Clinical Significance ................................................................................................................ 13
Figure 1.4: Blood washed into the CSF after trauma. ............................................................ 15
Barriers of the Brain and Neurotransport with Emphasis on the Arachnoid ............................ 16
Background ............................................................................................................................ 16
The arachnoid cell .................................................................................................................. 22
The arachnoid barrier ............................................................................................................ 23
Tissue Engineering of CNS for Transport ................................................................................... 24
Background neural tissue engineering .................................................................................. 24
Neural tissue engineering for CSF transport .......................................................................... 25
vii
Chapter 2: Arachnoid Cells on Culture Plates and Collagen Scaffolds: Phenotype and Transport
Properties ....................................................................................................................................... 28
Development of a Viable Three Dimensional Arachnoid Construct .......................................... 28
Introduction ............................................................................................................................... 29
Materials and Methods .............................................................................................................. 30
Cell isolation ........................................................................................................................... 30
Collagen matrix preparation .................................................................................................. 31
Figure 2.1: Arachnoid cells grown on microporous collagen ................................................. 32
Construct seeding and culture ............................................................................................... 32
Histology and immunohistochemistry ................................................................................... 32
Scanning electron microscopy ............................................................................................... 33
Western immunoblotting ...................................................................................................... 33
DNA content assay, cell number, and morphometrics .......................................................... 34
Permeability ........................................................................................................................... 35
Statistics ................................................................................................................................. 36
Results ........................................................................................................................................ 36
Arachnoid cell isolation .......................................................................................................... 36
Figure 2.2: Scanning electron microscopy of native rat pia-arachnoid tissue ....................... 37
Figure 2.3. Western blot for cytokeratin isolated from rat arachnoid cells on tissue culture
surface .................................................................................................................................... 37
Figure 2.4: Western blotting of cells from 2D culture plates for identifying markers ........... 38
Cell culture on tissue culture plastic ...................................................................................... 38
Figure 2.5. Morphology and staining patterns of rat arachnoid cells on tissue culture plastic
............................................................................................................................................... 39
Figure 2.6: Growth curve for arachnoid cells cultured on tissue culture plastic and collagen
scaffold ................................................................................................................................... 40
Figure 2.7: Connexin staining changing over time ................................................................. 41
Physiological behavior of arachnoid cell monolayers ............................................................ 41
Figure 2.8: Permeation of Indigo Carmine through a monolayer of arachnoid cells ............ 42
Arachnoid culture in a collagen scaffold ................................................................................ 42

viii
Figure 2.9: Arachnoid cells grown on porous collagen scaffolds with pore size of
approximately 100 µm ........................................................................................................... 43
Morphometric analysis of cells grown on 2D and 3D surfaces .............................................. 44
Figure 2.10: Morphometric analysis of arachnoid cells ......................................................... 45
Figure 2.11: Scanning electron microscopy of arachnoid cell on culture plate ..................... 46
Table 2.1: Average number of processes per cell (n =50) on 2d culture plates compared to
3d collagen sponges on day 6, 12, and 18. ............................................................................ 47
Physiological behavior of arachnoid construct ...................................................................... 47
Discussion .................................................................................................................................. 47
Cell culture on tissue culture plastic ...................................................................................... 47
Arachnoid culture in a collagen scaffold ................................................................................ 48
Chapter 3: Immortalization and Functional Characterization of Rat Arachnoid Cell lines ............ 52
Creation of a stable cellular substrate for the study of arachnoidal transport and tissue
engineering ................................................................................................................................ 52
Introduction ............................................................................................................................... 53
Experimental procedures ........................................................................................................... 56
Primary culture of rat arachnoid cells .................................................................................... 56
Production of retrovirus containing SV40 LgTAg and hTERT ................................................. 56
Retroviral transduction of arachnoid cells ............................................................................. 57
Immunostaining ..................................................................................................................... 57
Western blotting .................................................................................................................... 58
Telomerase assay ................................................................................................................... 58
TEER and transport of radiolabeled substrate ....................................................................... 59
Three-dimensional culture system and scanning electron microscopy (SEM) ...................... 60
Karyotyping ............................................................................................................................ 60
Results ........................................................................................................................................ 60
Rat arachnoid cells were stably transduced with SV40 LTAg and hTERT .............................. 61
Figure 3.1. Expression of SV40 LTAg and hTERT in immortalized arachnoid rat cells ........... 62
Immortalized cells maintained morphology and expression of epithelial markers .............. 63
Figure 3.2. Morphology of native and immortalized rat arachnoid cells .............................. 64
Figure 3.3. Immortalized rat arachnoid cells express characteristic epithelial markers ....... 65

ix
Expression of LTAg and hTERT significantly increases telomerase activity in immortalized rat
arachnoid cells ....................................................................................................................... 66
Figure 3.4. Expression of LTAg and hTERT increases telomerase activity in rat arachnoid cells
............................................................................................................................................... 67
Growth of immortalized arachnoid cells is superior to native cells ...................................... 68
Figure 3.5. ST and DT immortalized arachnoid cells show enhanced replicative capacity .... 69
Figure 3.6. Immortalized cells exhibit enhanced capacity for growing on three-dimensional
support ................................................................................................................................... 71
Membrane properties indicate an intact epithelial monolayer ............................................ 72
Figure 3.7. Radiolabeled transport study............................................................................... 74
Karyotype analysis of immortalized arachnoid cells .............................................................. 75
Figure 3.8: Karyotype analysis ............................................................................................... 76
Discussion .................................................................................................................................. 77
Chapter 4: The Characterization of Arachnoid Cell Transport: Paracellular transport and Blood
CSF Barrier Formation of Arachnoid Cells ...................................................................................... 79
Defining barriers: the Paracellular Transport of Arachnoid Cells .............................................. 79
Introduction ............................................................................................................................... 80
Methods ..................................................................................................................................... 81
Production of retrovirus containing SV40 LgTAg and hTERT and retroviral transduction .... 81
Functional transport assay: TEER, marker, and size differential transport study ................. 82
Perturbation methods ........................................................................................................... 83
Results ........................................................................................................................................ 85
Figure 4.1: Junctional protein immunohistochemistry and actin staining ............................ 87
Figure 4.2: Paracellular marker and size differential studies ................................................ 89
Table 4.1: Transport parameters in arachnoid cell line ......................................................... 91
Figure 4.3: Calcium modulation of arachnoid ........................................................................ 93
Figure 4.4: cAMP modulation of arachnoid permeability ...................................................... 95
Figure 4.5: Perturbation of junctional proteins on arachnoid paracellular transport ........... 97
Discussion .................................................................................................................................. 97
Conclusion ................................................................................................................................ 101
Chapter 5: Summary and Future Studies ..................................................................................... 103

x
References ................................................................................................................................... 108

xi
List of Tables
Table 1.1: CSF content
11
Table 2.1: Average number of process outgrowth per cell
47
Table 4.1: Transport parameters in arachnoid cell line 92

xii
List of Figures
Chapter 1
Figure 1.1: Arachnoid granulation 9
Figure 1.2: CSF flow 12
Figure 1.3: CSF absorption 13
Figure 1.4: Blood washed into the CSF after trauma 15
Chapter 2
Figure 2.1: Arachnoid cells grown on microporous collagen 32
Figure 2.2: Scanning electron microscopy of native rat pia-arachnoid tissue 37
Figure 2.3: Western blot for cytokeratin isolated from rat arachnoid cells 37
Figure 2.4: Western blotting of cells from 2D culture plates for identifying markers 38
Figure 2.5: Morphology and staining patterns of rat arachnoid cells 39
Figure 2.6: Growth curve for arachnoid cells 40
Figure 2.7: Connexin staining changing over time 41
Figure 2.8: Pereation of indigo carmine through a monolayer of arachnoid cells 42
Figure 2.9: Arachnoid cells grown on porous collagen scaffolds with pore size of ~100 mm 43
Figure 2.10: Morphometric analysis of arachnoid cells 45
Figure 2.11: Scanning electron microscopy of arachnoid cell on culture plate 46
Chapter 3
Figure 3.1: Expression of SV40 LTAg and hTERT in immortalized arachnoid rat cells 62
Figure 3.2: Morphology of native and immortalized rat arachnoid cells 64
Figure 3.3: Immortalized rat arachnoid cells express characteristic epithelial markers 65
Figure 3.4: Expression of LTAg and hTERT increases telomerase activity in rat arachnoid
cells 67
xiii
Figure 3.5: ST and DT immortalized arachnoid cells show enhanced replicative capacity 69
Figure 3.6: Immortalized cells exhibit enhanced capacity for growing on three-dimensional
support
71
Figure 3.7: Radiolabeled transport study 74
Figure 3.8: Karyotype analysis 76
Chapter 4
Figure 4.1: Junctional protein immunohistochemistry and actin staining 88
Figure 4.2: Paracellular marker and size differential studies 90
Figure 4.3: Calcium modulation of arachnoid 94
Figure 4.4: cAMP modulation of arachnoid permeability 96
Figure 4.5: Perturbation of junctional proteins on arachnoid paracellular transport 98

xiv
List of Papers
Chapters 2 and 3 have been previously published in Tissue Engineering Journal A, and
Neuroscience respectively. Chapter 4 is under review.
C. H. Lam, E. A. Hansen, and A. Hubel, “Arachnoid cells on culture plates and collagen
scaffolds: phenotype and transport properties,” Tissue Engineering. Part A, vol. 17, no. 13-14,
pp. 1759-1766, Jul. 2011.
C. Janson, L. Romanova, E. Hansen, A. Hubel, and C. Lam, “Immortalization and functional
characterization of rat arachnoid cell lines,” Neuroscience, vol. 177, pp. 23-34, Mar. 2011.
C.H. Lam, E.A. Hansen, C. Janson, A. Bryan, A. Hubel, “The Characterization of Arachnoid Cell
Transport: Paracellular transport and Blood CSF Barrier Formation of Arachnoid Cells,” in
review.

Chapter 1
1
Chapter 1: Background and Introduction

Chapter 1
2
The arachnoid
History of arachnoid physiology research
The recognition of the arachnoid granulation as an anatomic entity occurred during the
Renaissance period in the 1500’s and 1600’s. While noted by Vesalius and Willis during this era,
the granulation was not studied in detail until Pacchioni in 1705.[1] Its location adjacent to the
sagittal sinus indicated to him an interfacial role for this structure. For his contribution, the
granulation is sometimes referred to as a Pacchonian granulation.[2] Luschka in the 1800’s
correctly pointed out that the sagittal sinus has along its banks lacunes in which cerebral veins
drain and which form outpockets with flat surfaces within the leaflets of the dura for arachnoid
to protrude.[3] He was the first to recognize that granulations are the expanded versions of
arachnoid villi, the former existing in the scale of millimeters and the latter, one tenth of that. In
truth, the description villi and granulations are definitions along a continuum in terms of the size
of these structures. This was expanded upon by Weed in 1914.[4] Weed also injected
potassium ferrocyanide at low pressures into the CSF, and found that it collected in the
granulations. It also collected to a lesser degree in the cord and lymphatics thereby discovering
other important routes for cerebrospinal fluid (CSF) egress. He confirmed earlier works by
Quincke who, using cinnabar postulated that the granulations may be important for the material
removal.[5] He, Weed, Key, and Retzius were some of the earliest workers in the study of
arachnoid transport.[6]
Harvey Cushing in 1901 realized that the pressure gradient variations within the vascular system
demand a means for regulation of flow between it and the intracranial/intraspinal cavity.[7] One
mechanism would be a valve, which would prevent extravasation of blood into the CSF space.
Weed however has considered the granulations not as valves but blind diverticulum that were
semi-permeable to fluid and dissolved substances; he could not explain the egress of particulate
matters through the granulation as pointed out by Davson.[8] Not until 1961 did Welch and
Friedman demonstrate that granulations indeed behaved much like valves. By using
granulations from the African green monkey (Cercopithecus aethiops sabaeus), they showed
that the villus is made of a series of interconnected tubes 4-12 micrometers in diameter at

Chapter 1
3
normal pressures. When the pressure is higher on the vascular side, these tubules collapse
thereby shutting down flow.[9]
Quantitative measurements of material transport out of the brain began in the 1950’s. Courtice
and Simmonds in 1951 used labeled plasma protein injected into the cistern magna to trace CSF
circulation in the cat. They found that about 4 hours later, 11-19% was in the bloodstream.[10]
Simmonds used radioactive phosphate tagged to erythrocytes in the cisterna magna, which
again appeared into the systemic circulation at a rate of 1% of injected dose per hour. He found
that lymphatic ligation did not change the rate surmising that the arachnoid may play a
dominant role [11]. Confirming Weed’s ferrocyanide work, Key and Retzius found that some
trypan blue injected into the CSF circulation ended in cervical lymph nodes in human
specimens.[6] Sweet and Locksley placed lumbar subarachnoid, and bilateral lateral ventricular
catheters in patients and found that radioactive potassium and chloride exchanged throughout
the ventricular system, but albumin was lost primarily from the subarachnoid space
hypothesizing that ions transferred differently than higher molecular weight material. [12]
When Ishibashi in 1959 administered electrolytes and albumin into dogs, he found that the
cerebrosubarachnoid route of egress was faster than the cerebroventricular or spinal
subarachnoid route, presumably because this was closer downstream to the absorptive site.[13]
The demonstration of molecular transport in the 1950’s was paralleled by particulate transport
using similar experimental paradigms. In 1951, Adams and Pravirohardjo injected radioactive
chromium-labeled RBC into the cistern magna of dogs. 48 hours later, 24% of intact RBC’s were
seen in the systemic circulation. The remainder was in the CSF, brain or predominantly, the
arachnoid.[14] Welch and Pollay in 1961 utilized in vitro monkey villi and tested monkey
erythrocytes (7.5 microns), goat erythrocyte (4 microns), yeast (3-6 microns), polystyrene
microspheres (1.17-1.8 microns), and colloidal gold (.2-.3 microns) finding that these substances
can traverse the arachnoid, but larger polystyrene microsphere in the range of 6.4-12.8 microns
did not pass.[15]
Barrier studies classically involve the use of small molecular weight sugars, which presumably
were transported mainly paracellularly. In the 1960’s, Porckop, Schanker and Brodie placed
microliter amounts of tracers (inulin, sucrose, dextran 40K, and mannitol) in the lateral ventricle

Chapter 1
4
and cisterns of the rabbit and found that 8.1 to 11.4% was left behind 6 hours later.[16] This
suggested that bulk flow had a larger role than diffusion in the movement of these substances.
Heisey et al. in 1962 measured inulin absorption and found that with increased pressure, bulk
removal increased linearly.[17] When variable dextran weight was used by Davson in 1970, he
found that changing the colloid osmotic pressure ten-fold did not result in any decrease in the
flow rate. However, he determined that the more viscous the solution, the slower the flow rate.
Furthermore, when he obstructed the villi with particulates such as kaolin, blood, or colloidal
graphite, pressure increased with constant ventricular infusion experiments.[18]
The demonstration of particulate matter crossing the arachnoid granulation poses an apparent
contradiction to the concept of blood CSF barrier. How does a barrier that permits only
substances under a hundred kilodalton in size to enter, allow macroscopic debris to be
removed? Up to the 1960’s, the concept of the blood brain barrier (BBB) was simplistic, that it
was formed from tight junctions between endothelial cells, and that substances either go
through the cell or through the paracellular pathway. The latter is size limited depending on the
how wide is the paracellular space.[19] The arachnoid granulation at the BCB also possesses
endothelial cells. Alksne using EM found the endothelial layer overlying the granulation to be
continuous.[20] The endothelial cell was therefore thought to be responsible for the barrier
properties at the granulation. Furthermore, in 1965, Alksne and White found that the villi cells
thinned with increased pressure and that vesicular numbers increased.[21] Alksne and Lovings
(1972) therefore suggested that transport was energy consuming and therefore
intracellular.[20] This could explain the apparent contradiction in which large particles may be
admitted via vacuolization while an apparent size differentiated barrier still exists paracellularly.
The study was the first cellular study with a semi-dynamic paradigm demonstrating morphologic
changes of the arachnoid at varying pressure. Further evidence came about from Tripathi, who
showed that at low pressure, the cells contracted with folds in the cell membrane manifested as
microvilli, and with high pressure, vacuolization within the cells occurred.[22] High pressure
morphologic change was addressed in 1973 and 1974 when Gomez, Potts, and others showed
the cells and fibers in the arachnoid to be farther apart with widening of intercellular space at
increased pressure in monkeys and sheep.[23] Cellular overlap decreased as pressure gradients
increased. This suggested, for the first time, variation in the paracellular transport dependent

Chapter 1
5
on pressure. With increases in intracranial pressure, the arachnoid granulation expands, losing
its lobules and becoming tense. Overlaps of neighboring endothelial cells become shorter, and
the intercellular spaces, originally irregular and closely approximated, widen. Endothelial-lined
tubules became visible. As the endothelium-lined tubules that extend into the granulation
become distended, the endothelial cells show increased pinocytosis, and the stromal cellular
and extracellular components become more separated. The microvilli covering the endothelial
cells decrease in number and size, and the areas of apposition of adjacent endothelial cells were
more irregular and sparse.[24]
More physiologic data began to appear in the 1970’s. Labeled proteins injected into the CSF
were found to be linearly secreted with respect to pressure into the blood. Resistance of flow is
unaffected by colloid osmotic pressure of CSF.[25] Absorptive pathways of recently sacrificed
dog approximate the normal living rate of CSF formation as measured as a pressure gradient
between cisterna magna and sagittal sinus.[26] Both pieces of data suggest an important
passive component to transport. Also, resistance of CSF outflow is relatively stable with changes
in intracranial pressure in man, suggesting passive conduct of CSF similar to an electrical
resistance model.[27] Based on clinical data using a constant-pressure, constant-infusion-rate
test and reviewing data from other investigators, Albeck et al. calculated the overall outflow
conductance of CSF to be from 0.08 to 0.13 cc/min∙mmHg.[28]
The vesicular data indicates an intracellular as well as an extracellular component to material
transport. It is likely that both mechanisms are utilized. Intracellular transport is complex,
where molecular engines, transporters, and channels may all have roles. It has also been
suggested that ingestion may take place in the arachnoid, blurring the boundary between
transcellular transport and phagocytosis. Shabo in 1968 and 1969 showed that arachnoid cells
in the villus core phagocytose both homogenized brain and peroxidase injected into the
cisternal space complementing the plasma cells also seen in the arachnoid core. [29] More
recently, Xin found that arachnoid cells themselves may present antigen and express basic HLA-
DR.[30] Interspecies differences may compound the determinations of dominance of the
various intracellular routes. Upton and Weller suggest that pinocytosis may be important in
lower animals, but vacuoles may be more important in primates. Most however would agree

Chapter 1
6
that a combination of routes is at play in normal and pathologic states.[31] It therefore is clear
that the role of arachnoid and the various egress pathways for CSF and substances it carries are
complex.
Until cells could be separated in isolation, the exact roles of intra and extracellular pathways
could not be studied in much detail. Frank was the first to establish primary arachnoid cultures
(1983).[32] In 1985, Rutka et al. compared them to their tumoral counterparts. He also
delineated the components of the extracellular matrix. [33] The matrix is complex and may
contribute to barrier formation. In 2005, Holman et al. characterized the junctional proteins of
cells ex vivo.[34] While cells have been cultured from arachnoid since the 1980’s, this was the
first study to determine the molecular components necessary for paracellular transport.
Holman demonstrated the presence of connexin 43, desmoplakin 1 and 2, E-cadherin, and
zonula occludin-1 in arachnoid. In 2006, Grzybowski used arachnoid cells on semipermeable
membranes to determine the hydraulic conductivity on a monolayer.[35] She found the
hydraulic conductivity in the B to A direction to be 4.52+ 0.43 µl/min per mmHg/cm2, and 0.29
+0.16 microl/min per mm Hg/cm2 from the A to B direction at an average transcellular pressure
gradient of 3.33 +0.16 mm Hg. While the direct relevance to the pressure gradient behavior
physiologically on a membrane is questionable, it indicates that transport behavior of arachnoid
cell may be directionally dependent. She also determined that the hydraulic conductivity is
dependent on the pressure gradient. Holman found that when cells were perfused in the B to A
direction, they manifested vacuoles, micropinocytotic vesicles, and extracellular cisternal
spaces.[36] When perfused A to B, no large vacuoles were seen, and few extracellular spaces
between cells were noted. Glimcher in 2008 [37] then perfused whole arachnoid granulation ex
vivo to demonstrate what Welch et al. has done previously [15] using FITC polystyrenes spheres
0.1 to 2 micrometer in size. He showed tracers in all portions of the arachnoid granulation
including the stem, core, and apex. The tracers grossly gravitate toward the arachnoid cap
indicating a directional component to granulation mediated flow. However, the calculation of
hydraulic conductivity is complicated by measurements of arachnoid granulation surface area
(average area of perfused visible arachnoid granulation was 0.02082 cm2 while the area of
perfusion chamber was two order larger).

Chapter 1
7
Embryology of arachnoid
The behavior of the arachnoidal BCB cannot be explained completely by its ontogeny. The origin
of its blood brain barrier counterpart, the vascular endothelial cell, is well established and its
development is well characterized. The arachnoid’s origin is more diverse and unknown.[38] It
is likely the cells originate from endodermal, mesodermal, and ectodermal tissue despite its
similar appearance in the cranial and spinal areas. Depending on the location, spinal and
cranial, the contribution of the different primordia may be different. In humans, at stages 7-11,
pre-arachnoid mesenchyme begins to form from the primitive streak, neural crest, prechordal
plate, and neural tube. At stages 11 and 12, the mesenchyme begins to organize around the
brain and spinal cord, first laterally in the brain, then in the basal and roof area. At stage 14,
blood vessels enter the brain. When a cellular sheet intervenes between the cerebrum and the
pial blood vessels, it is considered the pia mater, or the arachnoid that is directly adherent to
the brain. Presumably, barrier formation commence at this stage. The leptomeningeal
meshwork differentiates at stages 17 and 18 to be filled with liquid, which originates through
the thin area membranacea of the fourth ventricular roof. This is the beginning of the
cerebrospinal fluid (CSF) circulatory space and the future subarachnoid space. This primitive
subarachnoid space spread caudally around the spinal cord and rostrally to the forebrain. In
general, it tends to spread from ventral to dorsal. By stages 21-23, the process is complete with
the space around the whole neural tube. At the external boundary of the leptomeningeal
meshwork, a dural limiting layer begins to form. The dural limiting layer develops into a thin
two dimensional sheet that later is recognized as the arachnoid membrane. Beyond this layer is
the peripheral mesenchyme that forms the future dura mater. The transverse and sigmoid
sinuses develop into the dura mater (stage 19), with the arachnoidal layer lies just under. The
sinuses contain the vascular component of the arachnoidal BCB. One stage later, stage 20, the
choroid plexus of the lateral ventricle is visible, which contribute to the CSF formation in the
newly formed subarachnoid space. By 26 weeks, depressions form in the venous dural wall,
which contain clusters of arachnoidal cells between the dural fibers. By 35 weeks, these
become protrusions through the dura. From 39 weeks, the number of arachnoid villi increases.
As an individual age, the size of the villi also increases to a visible size at which time it becomes a
granulation. This evolution is likely pressure related rather than genetically governed. When
Chapter 1
8
subjected to insult, the villi degenerate and occlude. The description of granulation
development and maturation underlines the changing physiology of this organ. Its site
specificity, variable configuration, alteration with age, and diverse embryologic origin no doubt
impact on the transport properties of the organ.
Anatomy of Arachnoid Tissue
Gross description
As noted into the embryology section, the layers making up the pachymeninges and
leptomeninges occur late compared to the remainder of the neural structures. Yet all three
layers are important for the support and encasement of the brain and spinal cord. These three
layers are the dura mater, pia mater, and the arachnoid. The most clearly identified and most
external is the dura mater, also known as the pachymeninges. It is situated adjacent to the
bone, and is made of dense connective tissue. This layer forms the support on which the
arachnoid granulations subside. The leptomeninges are made up of the pia mater and the
arachnoid membranes, both of which are composed of identical cells. These two layers are
thought to be of the same origin, the pia being closely adherent to the surface of the brain and
spinal cord, and the arachnoid membrane, a paper thin structure with reticular fibers, extending
to the pia in a web like (hence its namesake) fashion. Within the strands of the arachnoid lies
the subarachnoid space, which is where the CSF circulates to be ultimately absorbed by various
outflow pathways. At specific locations along the venous sinuses are granulations which allow
the subarachnoid space to be in contact with the vascular system.
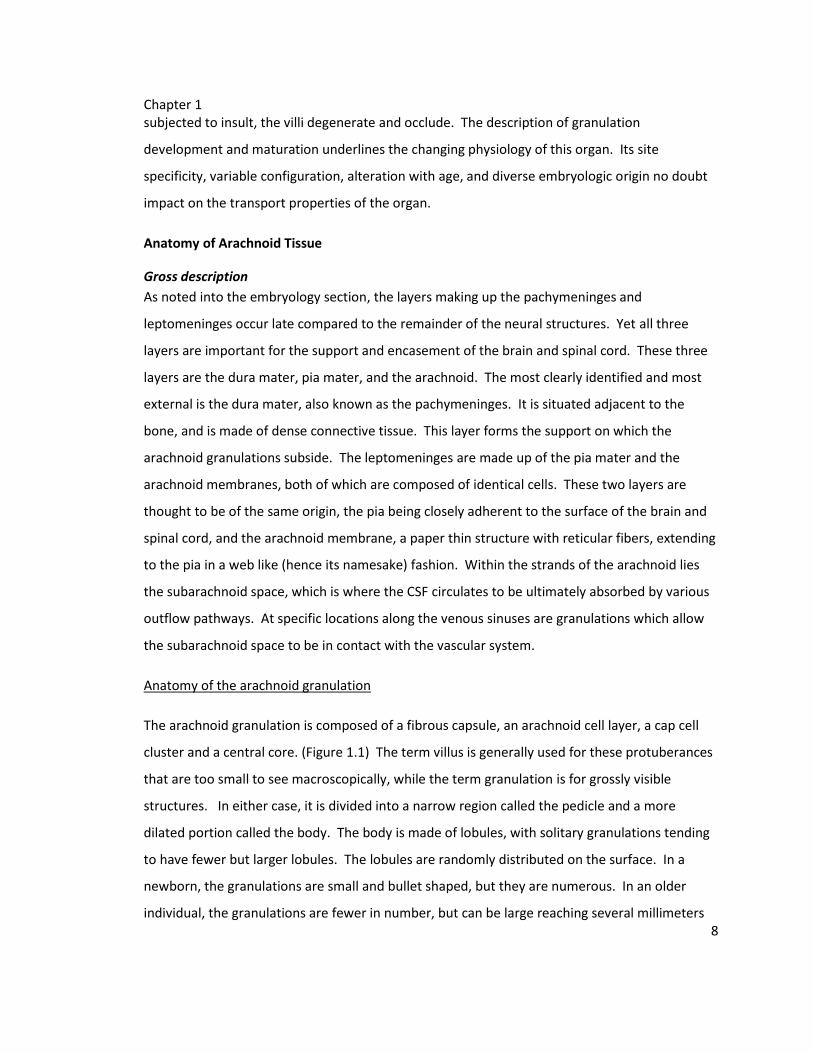
Anatomy of the arachnoid granulation
The arachnoid granulation is composed of a fibrous capsule, an arachnoid cell layer, a cap cell
cluster and a central core. (Figure 1.1) The term villus is generally used for these protuberances
that are too small to see macroscopically, while the term granulation is for grossly visible
structures. In either case, it is divided into a narrow region called the pedicle and a more
dilated portion called the body. The body is made of lobules, with solitary granulations tending
to have fewer but larger lobules. The lobules are randomly distributed on the surface. In a
newborn, the granulations are small and bullet shaped, but they are numerous. In an older
individual, the granulations are fewer in number, but can be large reaching several millimeters
Chapter 1
9
in size. The fibrous capsule is often absent at the apical portion of the villus, leaving the
arachnoid cell layer touching the endothelium-lined lumen of the lacuna or sinus directly. The
cap cell cluster is a thickened layer of arachnoid cells, which can consist of an outer and inner
zone, but also can be only one cell layer thick. The central core consists of arachnoid cells mixed
with connective tissue fibers, and is in continuity with the subarachnoid space. Collagen fibers
are of varied thickness, the largest and thickest being on the outside framework of the
granulation while the thinnest are distributed internally similar to spider webs. The arachnoid
cells contain larger number of intermediate filaments in the inner zone than the outer zone.
Vimentin stain is positive for these cells, and on electron microscopy, intermediate filaments
and desmosomal plaques are found to localize internally. The arachnoid cells have a variety of
cell forms, intermediate filaments, and desmosome numbers depending on location.[39]
Figure 1.1: Arachnoid granulation . Drawing of a pedunculated arachnoid granulation
showing the subarachnoid space, central core, and cap (from Kida et al. 1988). We have been
able to tissue engineer the different components of the granulation and replicate its transport
abilities.
The arachnoid tissue at the granulation structurally is well adapted for its role as the gateway for
bulk flow from the intracranial cavity to the venous vascular system. Situated on the venous
sinus, a constant flow of blood rushes by carrying substances passed onto its surface. It is
pedunculated with a narrow waist, which serves as a valve preventing sudden breech in the vein
leading to hemorrhage intracranially. Within the granulation, arachnoid exists in three forms: a
flat two dimensional sheet that encase the granulation, a spider-like structure in the arachnoid

Chapter 1
10
core giving it form and at the same time porosity for material passage, and a densely packed
arachnoid “cap” that may hold progenitor cells for future arachnoid cells.
The granulations exist in a number of locations, but most are along the superior sagittal sinus
near the apex of the head. This has the greatest pressure gradient and therefore the fastest
transport. Along the transverse sinus near the torcula and even around the sella tursica are
some granulations as well. Sometimes, granulations are absent, in which case, lymphatics may
play a substantial role in CSF transport.
Arachnoid granulations are ideal candidates for tissue engineering in many ways. The size of the
granulations is in the order of millimeters. The individual cellular layers that make up a
granulation are simple and not always present.[40] This suggests an extremely forgiving system.
For some of these layers, i.e. endothelium, cell culture technology has been developed in the
laboratory already. Finally, the rheology of CSF is similar to water, without the complicating
contents of the blood. CSF is a fluid suitable for transport analysis with a body of literature on
the bulk transport of CSF in the human already in existence.[41] This allows for benchmarks to
compare natural constructs to the bioartificial product.
CSF pathway
Perhaps the most important substance transported by arachnoid tissue is CSF. The CSF is
created from the parenchyma of the brain and from the secretion from the choroid plexus. The
embryo likely first made CSF from the fluid generated metabolically, but as the neural structures
become more complicated, the formation sites of CSF also becomes more diverse. Traditionally,
the choroid plexus is thought to be an important source of CSF. Its rich blood supply and
dedicated epithelial-like layer that intervenes between vasculature and the CSF is known to have
not only a variety of transporters but also mechanisms for paracellular transport. The choroid
plexus however is not the only source as early surgical ablation of the plexus only slowed CSF
creation. The ependymal lining that covers the inner surface of the brain and the dural sleeves
within the spine also are known to secrete CSF. The actual amount may vary depending on the
degree of scarring and composition of the individual components, but about 80% is thought to
originate from the choroid plexuses with approximately 90% of choroid plexus production is in

Chapter 1
11
the lateral ventricles. The actual output of CSF is not clearly defined, but estimated to be about
500cc/d in an adult.[42]
CSF
The composition of fluid that constitutes bulk flow varies slightly depending on where it is
sampled. Grossly, CSF is clear harboring very few cells (0-5 lymphocytes or mononuclear cells
per mm3, and no erythrocytes nor polymorphonuclear leukocytes (PMN)). With infections, this
of course changes, and CSF may become viscous due to debris and PMNs becoming the
consistency of pus. For the most part, the constituents are fairly uniform day to day with some
variations depending on the age of the patient. Protein content varies from 20 -160 mg/dl, and
glucose, 20-120 mg/dl. The remainder of the important CSF solutes is listed in Table 1.1. Some
has regarded CSF to be similar to an ultrafiltrate of plasma except for a diminution in protein
(6500 mg/100g to 25 mg/100g). In general, Na+, Cl-, Mg++ content is higher and K+, Ca++ and
glucose is lower.
CSF
Osm
ola
rity
H2
O
con
ten
t So
diu
m
Po
tass
ium
Ch
lori
de
Cal
ciu
m
pC
O2
pH
pO
2
Glu
cose
Lact
ate
Pyr
uva
te
Lact
:pyr
uva
te
Tota
l
pro
tein
A
lbu
min
IgG
Un
its
mO
sm/L
mEq
/L
mEq
/L
mEq
/L
mEq
/L
mm
Hg
mm
Hg
Mg/
dl
mEq
/L
mEq
/L
Mg/
dl
Mg/
L
Mg/
L
295
99
%
138
2.8
119
2.1
47
7.3
3
43
60
1.6
0.0
8
26
35
155
12.
3
Table 1.1: Constituents in CSF of an adult (adapted from Greenberg[42])
Outflow
The CSF flows from the ventricles, first the lateral ventricles to the third, then via the Aqueduct
of Sylvius into the fourth ventricle. There, it leaves via the Foramina of Luschka and Magendie
to circulate around the spinal cord and the brain. The spinal cord and brain therefore are

Chapter 1
12
completely surrounded by CSF, which buffers, supports and cushions the CNS. The semisolid
brain maintains its shape despite its 1500g weight because of its buoyancy, weighing only 50g
when immersed. This reduces the acceleration and momentum the brain suffers during trauma.
The CSF integrates the brain’s various components geographically by transporting hormone and
hormone-releasing factor. It removes waste from metabolism, breakdown products from
trauma, and drug metabolites to be carried out of the nervous system. Neuro-endocrine
substances, electrolytes, cellular waste, and protein pass into the fluid, diffusing in the subdural
space, to be ultimately removed by arachnoid granulations and other points of egress (Figure
1.2).[43],[44] The CSF is then absorbed in various locations. The dominant location is thought to
be the arachnoid granulations, but other sites include the root sleeves in the spine, the
lymphatics along the paranasal region, and along the perivascular channels. (Figure 1.3) The
contribution from each is variable, depending on the age and the specie. In macrosmic animals
such as rats and sheep, the lymphatics have a substantial role.
Figure 1.2: CSF flow
The brain is surrounded by CSF (purple) which cushions and facilitates transfer of material to
and from the brain. It circulates from inside the ventricles to be absorbed into the arachnoid
granulations.

Chapter 1
13
Figure 1.3: The direction of movement of blood and debris from the intracranial
cavity to the vascular system.
Clinical Significance
Hydrocephalus
Among the most basic substances that the arachnoid transport is water. Cerebrospinal fluid is
important for the function and maintenance of the brain, but, when there is a buildup of the
fluid within the cranium, the clinical condition of hydrocephalus results. It can result from many
neurologic conditions such as congenital anomalies, infections, neoplasms, trauma, and vascular
disorders, and has an estimated prevalence of 1-1.5%. The incidence of congenital
hydrocephalus alone is ~0.9-3/1000, making it one of the most common illnesses in a newborn.
Approximately 60% of all hydrocephalus cases are in children. Currently, the vast majority of
hydrocephalus is treated by a diversionary device consisting of a silicone tube with a valve that
passes from the ventricle of the brain to the heart or the peritoneal cavity. Materials used in the
valves are artificial, and typically are metal or corundum balls on springs, or silicone rubber in
duckbill, slit, or miter configurations. Subjected to corrosion, infection, occasionally
immunologic attack, the shunts have a high failure rate. An estimated 80,000 to 100,000 shunts
are implanted each year in developed countries, leaving many more patients in undeveloped
country without the benefit of shunting devices. [41] With the technology of shunting
unchanged for over five decades, the complications rates and morbidity of having a shunt placed
remains fairly constant and high, with a failure rate of around 50% over two years.[45] In the

Chapter 1
14
last fifteen years, development in biological materials and tissue engineering technologies has
offered hope for regeneration of new physiologically active, absorptive tissue.[46]
Bioengineered shunts have not been developed yet, although there has been one attempt of
using cultured cartilage to form a tube to mimic the current shunt technology; it however, has
not been successful with rapid collapse of the tube after implantation.[47] Developing valve
equivalents that drain into the venous system at the level of the arachnoid granulation would be
the most anatomic and physiologic approach to the treatment of hydrocephalus.
Traumatic Brain injury (TBI) and the arachnoid
Cerebrospinal fluid is a central element for the physical support and chemical homeostasis of
the entire central nervous system (CNS). Within the confines of the skull and spine, the soft
brain and the cord would not be able to assume its natural conformation if not suspended in this
fluid. As such, it buffers the brain from mechanical insults by dissipating the inertial forces
delivered to the head, such as from blast injuries.[48],[49] Blast-related injuries numbers from
the most recent conflicts in Iraq and Afghanistan may be as high as 320,000.[50] Because CSF
surrounds the brain, it is also an important medium by which small molecules as well as
particulate matter circulate along the neuraxis. With trauma, blood, blood products, and neural
debris are washed into the CSF as well, which then is cleared from the CNS. Radiolabeled RBC
studies determined that up to 76% of erythrocytes are trapped within arachnoid
membranes.[51] The material load could be enormous. Lacerations of major blood vessels due
to penetrating injury deposit massive quantities of blood into a skull of fixed volume (Figure
1.4).[41] Intracranial pressure (ICP) is then increased leading to decreased perfusion of the
brain, distortion and herniation of the neural structures, and secondary injuries such as
apoptosis and inflammation. The resultant enlargement of the fluid compartment due to
blockage of the CSF pathway by mass effect of damaged brain or blood causes hydrocephalus, a
medical condition that may result in severe brain damage and even death.[52] Therefore,
diversion or clearance of the blood and debris becomes a major priority in the management of
traumatic brain injury.
Chapter 1
15
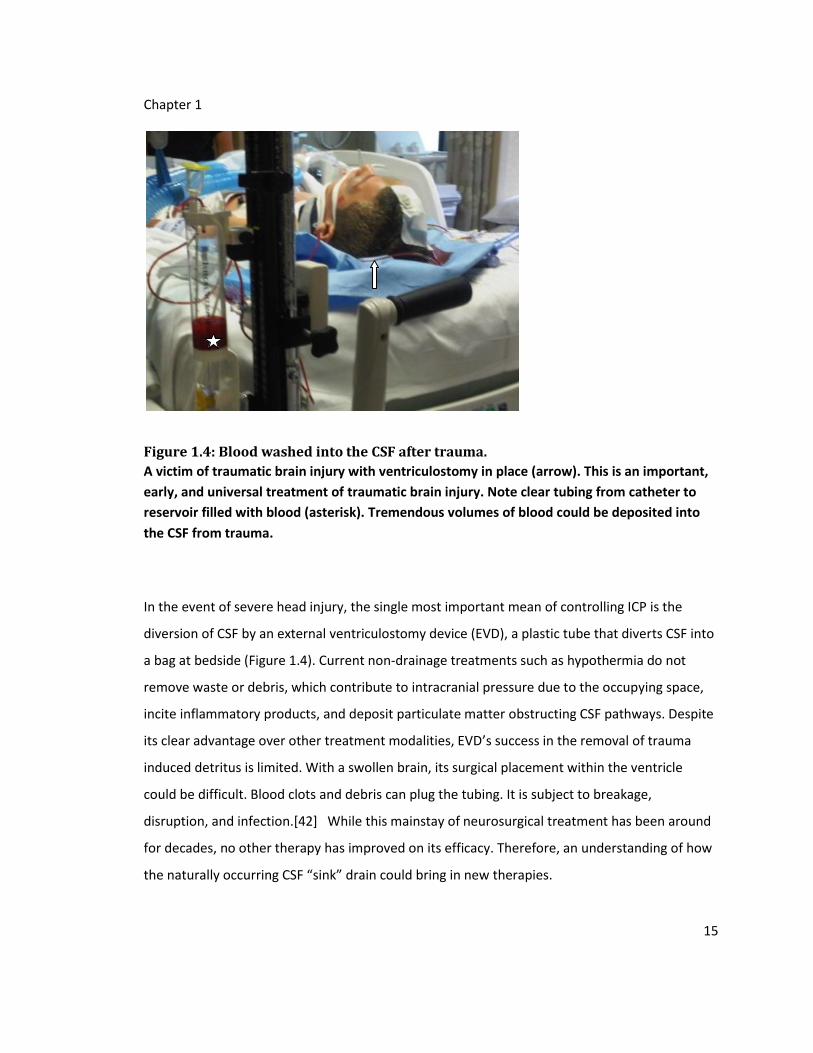
Figure 1.4: Blood washed into the CSF after trauma.
A victim of traumatic brain injury with ventriculostomy in place (arrow). This is an important,
early, and universal treatment of traumatic brain injury. Note clear tubing from catheter to
reservoir filled with blood (asterisk). Tremendous volumes of blood could be deposited into
the CSF from trauma.
In the event of severe head injury, the single most important mean of controlling ICP is the
diversion of CSF by an external ventriculostomy device (EVD), a plastic tube that diverts CSF into
a bag at bedside (Figure 1.4). Current non-drainage treatments such as hypothermia do not
remove waste or debris, which contribute to intracranial pressure due to the occupying space,
incite inflammatory products, and deposit particulate matter obstructing CSF pathways. Despite
its clear advantage over other treatment modalities, EVD’s success in the removal of trauma
induced detritus is limited. With a swollen brain, its surgical placement within the ventricle
could be difficult. Blood clots and debris can plug the tubing. It is subject to breakage,
disruption, and infection.[42] While this mainstay of neurosurgical treatment has been around
for decades, no other therapy has improved on its efficacy. Therefore, an understanding of how
the naturally occurring CSF “sink” drain could bring in new therapies.

Chapter 1
16
Traumatic brain injury releases of blood into the brain that results in a host of pathologic
pathways, especially redox mechanisms (see review, Belcher et al., 2009).[53],[54] Our previous
study and others have demonstrated the exquisite and selective sensitivity of the brain to redox
factors that result from brain damage.[52],[52] Blood elimination therefore is a priority in the
healing process. The marked ability for blood removal from the CSF has been known for almost
80 years.[55] Even when 8cc were injected into dogs, only 4% of injected blood remains in the
CSF at 24 hours.[51] EM studies shows the lattice work of the arachnoid core to contain whole
RBCs at 4 hours, and by day 3-5, RBCs have been seen within arachnoid cells by EM, in various
stages of invagination.[51] Whether this is an indication of transcytosis or whether this is
phagocytosis by the arachnoid is unclear. Argument for transcytosis is the demonstration of bulk
material transfer in numerous vesicles, giant vesicles, and intracellular conduits in the
arachnoid. Supportive evidence is also present on scanning EM which shows pores on the
surface of arachnoid cells.[56],[57] Alksne et al. however argues that the arachnoid must serve
the role of RBC break down instead. He finds that the endothelial layer on top of the arachnoid
tissue to be yet another barrier that trauma debris must navigate before being transferred to
the vascular system.[51] Others counter this argument stating that the endothelial layer is not
always contiguous over the arachnoid.[58] Recently, Xin has shown that arachnoidal cells have
some ability for antigen presentation and that basic HLA-DR is expressed in the cells.[30] The
cells may play a role in the activation of T cells in the process of debris clearance[30], but
suppurative findings in trauma is rare short of infection in the brain. Chopard has found that in
the presence of blood, the paracellular space become wider.[59] Whether this is sufficient for
macroscopic matter transfer is uncertain and will need to be investigated in the future. Clearly,
the arachnoid’s role in the trauma material removal is complex.
Barriers of the Brain and Neurotransport with Emphasis on the Arachnoid
Background
Historical Background: Molecular transport was discovered to be different in the brain
compared to the other organs first by Paul Ehrlich in the 1880’s.[60] He found that the Prussian
blue injected the systemic circulation did not stain the brain while the other organs did. His
original thought was that the brain does not have the same affinity for the dye compared to the
Chapter 1
17
rest of the body. However, when his pupil, Edwin Goldman injected Trypan blue into the CSF,
the remainder of the body was not stained, suggesting that more likely there exists a barrier
between the brain and the rest of the body.[61] This was further validated when Lewandowsky
injected neurotoxic agents either in the vascular system or the brain, and found that only when
directly injected into the brain did the agents have an effect. Lewandowsky first coined the
term “blood brain barrier” to describe this phenomenon.[62] In the 1940’s, this barrier was
found to be tunable by means of osmotic disruption.[63] The complexity of the blood brain
barrier became more apparent in the 1960’s, when Crone et al. discovered that transport into
the CNS involves multiple pathways including active transport in addition to passive
diffusion.[64] In 1967, Reese and Karnovsky using high definition electron microscopy, studied
the movement of horseradish peroxidase and found that the endothelial cells of the brain is
marked different than the heart and muscle in that its tight junctions were much more closely
knit and were the main barrier to molecular transport.[65] This is however not the case of all
species. In elastomobranch fish and some invertebrates, the astrocytic foot processes is
responsible for the separation of the brain from the remainder of the body.[66] In fact, in the
1960’s, it became apparent that at least four different kinds of cells in humans may be
responsible for the differential transport behavior.
Architecture of the BBB and BCB: The three dominant cells existing at the barrier junction are
the pericytes, astrocytes, and endothelial cells in the vasculature. Perivascular macrophages
and nerve terminals are involved as well although to a lesser degree. The ratio of pericyte to
endothelial cells is about 1 to 3. [67] Approximately 99% of the abluminal surface of the
endothelial cells is invested by astrocytic foot process. Only about 20nm exists between the
foot processes and the endothelial cell.[68] Perivascular macrophages however have been
found within this space and expanding this space. The role of nerve endings most likely has to
do with modulation of the barrier rather than being a part of the physical barrier. [67]
In contrast to the BBB, the BCB at the arachnoid granulation is rather simple. The vascular
endothelial layer covers the granulation, albeit at times incompletely. Below is the subdural
space. Abutting the endothelial layer is the arachnoid cap made up of a single cell type.[39]
This construct has two barriers: the first at the endothelial layer and the second at the arachnoid

Chapter 1
18
layer. Dye injected either from below or above the endothelial layer could be restricted.[40]
The contributions of both layers are probably important for barrier formation. However, during
the early period of arachnoidal research, this was not clear. Alksne and colleagues used TEM
and SEM did not demonstrate discontinuity of endothelium at the granulation [51], although,
others have shown areas bare of endothelium along the lining [69]. Others have not only
demonstrated breakages besides the endothelial cells, but within the cell were interendothelial
clefts.[5] These were likely large vesicles having fusing together into a conduit. In the early
1970’s it became clear that the endothelial layer is dynamic; Gomez demonstrated intercellular
clefts to open with increased fluid pressures in sheep.[70]
Areas of the brain without endothelial cell barriers include the circumventricular organ, choroid
plexus, and the retina. At the circumventricular organ, fenestrated capillaries have closely
opposed to special ependymal cells with a network of loose tight junctions.[71] In the choroid
plexus, cuboidal epithelium lines the surface also with contain special tight junctions.[44] In the
retina, the blood vessels are fenestrated at the choroidea, and the barrier is made up of the
retinal pigment epithelium.[67] These specialized areas do not have the same barrier capacity
as the brain vasculature.
Microscopic architecture: The explanation for the selective isolation of the central nervous
system originally was thought to be due to the small extracellular spaces resulting in tightly
packed cells in the brain. This however cannot explain the rapid transport that occurs between
the CSF and the rest of the CNS. Later when the tight junction in endothelial cells were found
using freeze fracture techniques, its complexity and woven appearance underlie their
importance in prevention of rapid transport. Freeze fracture demonstrated not only the
strands, but also particles within the inner (P-face ) and outer (E-face) lipid leaflet of bilayer
membranes in the tight junction that fasten the strands together. From the P-face, a network of
stands emerge leaving grooves in the E face. The number of strands in tight junctions is related
to transcellular electrical resistance logarithmically.[72] Tight junctions have integral membrane
proteins occludin and the more recently discovered family, claudin. Ig-superfamily junction-
adhesion molecules of the JAM group and ESAM (endothelial cell-selective adhesion molecules)
are also located at tight junctions. First-order adaptor proteins are those that are directly

Chapter 1
19
associated with integral tight junction proteins via PDZ domains. These include ZO-1, ZO-2, and
ZO-3. Second-order adaptors are indirectly associated with the integral proteins. These include
cingulin and cingulin-related protein. The control of tight junction is under various cascades
including G-proteins, regulators of G-protein signaling and small GTPases.[73]
Paracellular machinery – tight junctions and other junctional structures
Among the earliest of the tight junctional transmembrane molecules discovered is occludin.
Occludin was first found in chicken liver[74], and it shows wide interspecies variability except for
the carboxy terminal. This ZO-1 binding domain is the most conserved region and links occludin
to the cytoskeleton via its alpha-helical coiled structure.[75] Transepithelial resistance in large
and small intestines is not altered in occludin-deficient mice, but the animals are more prone to
chronic inflammation and hyperplasia of the gastric epithelium, calcifications in the brain and
brain vessels, among other deficits.[76] Occludin is not needed for the formation of junctional
strands, and posttranslational modifications such as phosphorylation of its cytoplasmic domains
or ubiquitin-ligase binding may be important for junctional regulation.[76] Occludin in aortic
endothelium is reduced by shear stress (100 µN∙cm-2) and phosphorylation could be attenuated
by dibutyryl cAMP.[77]
Claudins are similar to occludin in that it has four transmembrane domains, but it does not share
any sequence homology to occludin. Again first identified in chicken, the family at present
contains more than 20 members.[78],[79] Claudin is most likely responsible for the regulation
of paracellular permeability by formation of a variety of homotypic and heterotypic pairing of
strands. Ion selectivity is achieved through selective combination of distinct claudins and is
organ specific. Claudin-5 and claudin-16 for example is in endothelial cells, stomach and
intestinal surface cells while claudin-16 is in the thick ascending limb of Henle.[80],[81],[82]
Occludin is associated with formation of short strands, but claudin is associated with long
branched strands in the tight junction seen on EM.[83] Transfection of MDCK cells with claudin-
1 increased TEER about 4 times with resultant decreased paracellular flux. Transfecting MDCKI
cells (normally high TEER expressing claudin-1 and -4) with claudin-2 resulted in reduced
resistance similarly to MDCKII cells.[84] Claudin-4 was formerly known as Clostridium
Chapter 1
20
perfringens enterotoxin receptor (CPE-R).[85] Brain endothelial cells contain claudin-1, -3, -5,
and -12.[67]
Immunoglobulin-like proteins at the tight junctions are called junctional adhesion molecules
(JAM). They have homotypic cell-cell contacts and appear to be involved in calcium mediated
modulation of tight junction function.[86] They may also have a role in regulating leukocyte-
endothelial cell interaction, although leukocyte diapedesis may follow a transcellular route
called emperipolesis instead.[87] Other Ig superfamily members at tight junction include the
cossackie and adenovirus receptor (ECAR) endothelial cell-selective adhesion molecule (ESAM),
JAM-4, and adenovirus receptor-like membrane protein (CLMP). They share with JAM-A, -B, and
–C, two Ig-like domains.[67] These associate with other tight junctional components to make up
cytoplasmic “plaque”. ZO-1, a 220-kDa phosphoprotein was the first to be identified at the tight
junction. Others include adaptors, proteins with multiple protein-protein interaction domains
such as Sh-3 domains, guanylate kinase (GUK) domains, and PDZ domains. These adaptor
proteins include members of the membrane-associated guanylate kinase (MAGUK), membrane-
associated guanylate kinase with an inverted orientation of protein-protein interaction domains
(MAGI), and proteins with one or several PDZ domains families (ZO-1,-2,-3, MAGI-1,-2,-3, PAR-
3,-6, MUPP1). By juxtaposing plaque proteins, these adaptor proteins organize the regulatory
and signaling protein important for the tight junctions such as GTPase, their regulators, and the
transcriptional regulator ZP-1 associated nucleic acid binding protein (ZONAB). [67]
Located at the apical end of the cell, tight junctions are capable of forming a continuous band
around cells thereby preventing easy passage.[88] Located nearer the base are the adherens
junctions and the gap junctions. Previously thought of as spot attachments, adherens junctions
may also encircle cells (zonula adherens). Spots of attachments are known as adhesion
plaques.[89] Adherens junctions are protein complexes which are linked to the actin
cytoskeleton via its cytoplasmic face. Composed of cadherins, p120, beta-catenin and alpha-
catenin, adherens junctions may mediate actin polymerization and maintain the actin
contractile ring.[90] Gap junctions also join adjacent cells but have the additional role of
forming intercellular channels that allow various molecules and ions to pass between them.
Made of two connexin hemichannels, gap junctions permit electrical coupling to occur as well.

Chapter 1
21
In vertebrates the hemichannels are primarily homo- or hetero-hexamers of connexin. Each
connexin protein has four transmembrane domains, and six connexins make up one
hemichannel (connexin). Hundreds of gap junction channels make up the gap junction
macromolecular complex.[91] The intercellular space at the gap junction is 4 nm, not only
connecting and aligning the cells, but also tack welding the cells together and narrowing the
intercellular space.[92]
Intracellular mechanisms - Vesicles and Vacuoles
As previously mentioned, the paracellular spaces in arachnoid open with increasing pressure,
but Tripathi also demonstrated that pinocytosis increases with increased pressure.[5] More
recently, Holman showed that pinocytosis occurred with vesicular size of about 1 micron in ex
vivo cultures.[36] Tripathi in the late 1960’s also showed large intracellular vacuoles, which
could account for an additional pathway for particulate removal from the CSF.[1] The vacuoles
have been seen on EM to convert to large pores on the apical surface of cells.
Intracellular mechanisms - Molecular machinery
The physiology of intracellular transport is not addressed in the thesis. However, it is important
in the overall description of movement in and out of the brain. Part of the definition of the BBB
is reduced ability of lipophobic material into pass thru the barrier. This is in part no different
that epithelial layers in many other locations in the body. Lipid solubility may be characterized
by octanol/water partition coefficient, charge and molecular size.[93] The importance of
transmembrane channels that facilitate and bypass the lipid barrier continues to evolve.
Transport proteins for specific molecules such as ions, glucose, and amino acids have been
known for decades. Knowledge concerning other specific receptors such as the ABC proteins for
the transport of medications (antiepileptics and chemotherapeutics) into the brain continues to
evolve.[94] Receptors also mediate transport for critical molecular endocytosis. Materials
transferred by this route include insulin and transferrin. For water, multiple members in the
aquaporin family mediate the movement of water through the lipid layer.
Transcellular transport is mediated by two main systems: caveolae [95] and clathrin-coated pits
[96]. Caveolae may be importance in signal transduction and docking sites for glycolipids and
glycosylphosphatidylinositol-linked proteins. Insulin, albumin, ceruloplasmin, interleukin-1, and
Chapter 1
22
high density lipids (HDL) have caveolae receptors. Clathrin is important for the formation of
coated vesicles. First isolated in 1975, it has a triskelion shape that interacts forming a
polydhedral lattice surrounding the vesicle. Vesicles may transfer nutrients, import receptors
and clean up debris. Chains of vesicles can form to become channels transgressing the entire
cell. These transcellular tubules permit direct connections between the two sides of a cell.
The arachnoid cell
Leptomeningeal cultures
A large body of literature exists for dural cultures because of interest in meningeal
tumorigenesis, but relatively few reports exist for leptomeningeal cultures.[97] There has been
some interest in these cells’ ability to secrete insulin-like growth factors, IGF binding protein and
other extracellular proteins because of their role in meningioma formation.[98] While
organotypic cultures of leptomeninges have been possible since 1975,[99] the initial description
of pure leptomeningeal cell culture was not until 1983.[32] Frank demonstrated that these cells
are robust, and could be even harvested from autopsy specimens. The cells grew readily from
tissue fragments forming colonies within a few days. By using an enriched medium of Eagle’s
minimum essential medium containing nonessential amino acids, glutamine, gentamicin, and
10% fibronectin-free fetal calf serum, colonies were obtained from incubation at 37 degrees in a
humidified atmosphere (95% air and 5% CO2). Confluence is reached by 14-21 days. During the
exponential phase of growth (subconfluence), the cells swirl broadly, and are bipolar with
relatively large, rounded central nuclei with generous cytoplasm. The cytoplasmic edges tended
to be curvilinear. Coarse streaming of cells into gentle arcs from colonies was seen. At
confluence the cells no longer are bipolar and became homogeneously flat and polygonal. The
terminal cell density in early passages was 3-5 X 10⁴ cells/cm2. There was no crowding
compared with fibroblast cultures (density 1-2 X 10⁵ cells/cm2). Doubling time in early passage
was rapid (<24 hours). Trypsinization did not alter morphological features, but by passages five
to seven, signs of senescence were apparent (increased cytoplasmic:nuclear ratio, cytoplasmic
vesiculations, giant and often multinucleated cells). No cell cultures were viable after 15
passages, but by increasing intervals between passages, culture time is prolonged.

Chapter 1
23
Detection of the cells could be done morphologically and immunohistochemically. Clinical
arachnoid specimen is identified by epithelial membrane antigen (EMA), which is positive also in
arachnoid cyst, meningiomas and arachnoid rests.[100] Extracellular matrix from these cells
stained positively for fibronectin, laminin, collagen type IV, and procollagen type III. Fibronectin
and procollagen type II are particularly present in dense, granular focal plaques, with long thick
fibrils forming a loose meshwork while laminin and collagen type IV deposited as much finer
focal plaques. Electron microscopy of leptomeningeal cultures shows interdigitation of cell
membranes and invagination of cytoplasm into nucleus. Specialized intercellular junctions such
as gap junctions and desmosomes were also seen.[33] Cytoskeleton is formed by intermediate
filaments (tonofilaments and monofilaments), and fine granular and filamentous basement
membrane-like material is found in the extracellular spaces between cells. Probably the most
important marker is cytokeratin positivity because of the similarity of arachnoid cells
morphologically to fibroblast (cytokeratin negative).
The arachnoid barrier
Until recently, almost all knowledge gleaned from the blood CSF barrier (BCB) is derived from
study of the choroid plexus, ependyma and circumventricular organs.[101] Paracellular
diffusion, while restricted by tight junctions, is less tight than the BBB, and
pinocytosis/exocytosis have been seen as a low-capacity means of transport at that location.
While important as part of the CSF circulatory pathway though, these areas are the “source” of
the CSF. Knowledge gained from this substrate does not shed light on the downstream border
cells, the predominant form of which is the arachnoid. Clearance of the brain/CSF occurs at the
“sink”, and only in the last several years have some its characteristics been discovered.[102]
Paracellular and Intracellular transport at the arachnoid station
The arachnoid “sink”, similar to most boundary cells has two main routes for egress, the
paracellular and intracellular routes. It is uncertain as to the method by which arachnoid cells
remove substances, but likely includes both depending on the molecular or particulate
characteristics. Paracellular transport classically has defined the barrier property characteristic
of brain barriers. Paracellular pathways for transport are influenced by the presence of tight
junctions, zonula adherens, desmosomes and gap junctions. Tight junctions located near the

Chapter 1
24
apical portions of the cellular apposition play perhaps the most important role as it forms a
continuous belt around the cell and are subject to a variety of mechanisms for control.[73]
Arachnoid cells stain positively for ZO-1 and occludin particularly around the periphery.
Desmosomal junctions are seen on electron micrographs of cultured cells, and the resistance to
pressure relationship in a primary cell monolayer model appears linear. Lucifer yellow, a
paracellular pathway marker, has a permeability of 7.19X10⁻⁶cm∙s-1.[36] In our laboratory, we
have developed monolayers of arachnoid cells with transepithelial electrical resistances (TEER)
similar to MDCK type II cells, which is an established model of BBB. We show molecular weight
disparity in arachnoid transport using FITC-dextran, which is similar to the BBB as well. These
findings are indicative of a substantive role of paracellular transport in our model.
Intracellular transport has been studied in arachnoid cells primarily using electron microscopy
(EM). Increased numbers of vesicles, giant vesicles and even transcellular tubular structures
have been seen especially in conditions when pressure gradients such as during trauma are high
across the tissue.[70] Crude ingestion experiments indicate that vesicles 1 μm in diameter form
when cells are subjected to perfusate containing ruthenium red.[36] Penetration however was
limited to inside the cell without further transport. Permeability values for MRI based computer
modeling and in vitro monolayer models were similar, which confounds the finding given that
the three dimensional complex architecture of arachnoid granulations is markedly dissimilar to a
monolayer of cell.[103] A potential explanation is that the arachnoid functions in a phagocytic
role rather than transcytotic transport role, which may be the case in the setting of traumatic
brain injury.[30] Therefore, it is crucial detailed information concerning the intracellular
transport for the arachnoid cell be obtained.
Tissue Engineering of CNS for Transport
Background neural tissue engineering
Neural tissue engineering in many ways has paralleled tissue engineering in other parts of the
body. Scaffolds and cells native to the central nervous system are amenable to manipulation
and duplication from the genetic to organ level. Gene therapy, immortalized cell lines, collagen
and biopolymer scaffolds are areas of intense study in both the central and the peripheral
nervous system. A central difficulty arising from the central nervous system is the exquisite
Chapter 1
25
dependency of function to localization. Unlike other organs where one area may be similar to
another, in the brain and spinal cord, even micrometer geographic differences may subserve a
totally different function. This thesis attempts to sidestep this issue by applying tissue
engineering techniques to other tissues in the brain in which this focal localization specialization
is not present. One of these areas is the arachnoidal tissue, which despite its embryologic
diversity as seen in Chapter 1 is relatively uniform in appearance and function throughout the
central nervous system.
Neural tissue engineering for CSF transport
While the study of arachnoidal cells and their extracellular matrix has been ongoing for several
decades, application of tissue engineering techniques to arachnoid tissue is limited. Only one
previous attempt has been used to culture arachnoid cells onto scaffold. This recent work used
primary cells on a non-woven poly(ethylene terephthalate)(PET) scaffold.[104] The results were
encouraging in that cells remained metabolically active and multiplied. Physiologic studies
however difficult to interpret as Lucifer Yellow permeability and hydraulic conductivity of the
constructs were similar between 2D and 3D architectures. Furthermore, the felt-like material
does not recapitulate the native architecture of the arachnoid. It was clear though that these
cells formed junctional proteins responsible for barrier capability and paracellular transport.
Another tissue engineering endeavor for CSF diversion was undertaken to treat hydrocephalus.
Hydrocephalus is a major medical condition resulting from CSF drainage blockage. Lee et al.
attempted to mimic not a natural product but a manmade device, the ventricular shunt, using
tissue engineering techniques.[47] This attempt was to create a conduit similar to current
silastic tubing that serves as an extraneous alternative detour for CSF to escape from the brain.
The location of the device is between the ventricular and subarachnoid space, which is typically
how CSF flows (via a series of ventricles and aqueducts). Because of the natural tendency for
conduits to collapse, chondrocytes-seeded polyglycolic acid tubes coated with polylactic glycolic
acid (PGLA) implants were used. The survival of the device was short lived and silastic tubing
had to be temporarily substituted at the time of shunt insertion dues to premature device
collapse.
Chapter 1
26
As evident from the previous attempt, the scaffold for support of arachnoid cells is critical for
the creation of a bioartificial arachnoid shunt. It has to be physically strong enough to provide
for cell attachment as well as tolerate hydrodynamic forces until the cells can lay down their
own extracellular matrix. Intracranial pressures typically are 8 to 12 cm of H20, but can exceed
100 torrs with Valsalva maneuver transiently. While venous side pressure reflects roughly right-
sided atrial cardiac pressures maximally, superior sagittal sinus pressure typically is close to
atmospheric in the upright position. The shape of the granulation tissue equivalent therefore
has to be designed to accommodate these conditions. Collagen was chosen as the structural
element because it is a well-known contributor to the tri-dimensional architecture of the
arachnoid granulation.[105] The fibers have been found as thick bundles in the capsular
extension of the meninges, and as thin "spider webs" (sic. arachnoid) in the inner frameworks of
the granulation. Arachnoid cell cultures are known to lay down extracellular matrix in one
week; therefore the scaffold must last at least this length of time. Current techniques of
strengthening collagen scaffolds include increasing crosslinking of the collagen fibers.
Aldehydes have been used, but they have a tendency to be poisonous to cells in culture.
Ultraviolet light exposure has been successfully done on scaffold built with collagen solution
concentration under 1%.[46] This is the technique we utilize. Ultimately, the scaffold should
promote cell survival, enable signaling, and be conducive to extracellular matrix formation.
The scaffold in the intracranial environment should have other characteristics for optimum
function. It must be thin so that migration of the cell need not to be extensive, and the
cerebrospinal fluid should be able to enter the granulation without much impedance (target
hydraulic conductance of 0.8-0.13 cc/min∙torr). The scaffold should have one membranous
surface such that the arachnoid cell migration is delimited. This skin of collagen allows the cells
to be confluent such that the cerebrospinal fluid blood barrier can develop. At the same time,
an open porous surface on the opposite side is needed for the cells to migrate in. Our porous
bilayered scaffold is not unique. Glowacki et al. have been able to create this geometry in her
laboratory as a method for delivering bone marrow proteins to cell cultures.[106] Similar to us,
their pore structure in the collagen mimics the size and geometry to that of the inner core of a
granulation. To extend this work, molds would be needed to contour the scaffold in a shape
similar to a granulation macroscopically before seeding with arachnoid cells. The scaffold must
Chapter 1
27
be conducive for lamination to meninges such that eventually, the shunt could be integrated
into the body. Finally, the outer layer of the scaffold also has to be permissive for covering by
endothelial cells so that full integration into the venous sinus may occur.
The ideal tissue engineered arachnoid granulation should mimic the natural tissue as much as
possible. Its biomechanical and physiologic properties, shape, and size, especially within the
intracranial cavity with its limited space, are important factors in its design. This thesis will
attempt to lay the foundation for the creation of optimal scaffolds and cellular substrate with
characteristics moving toward those goals.
Chapter 2
28
Chapter 2: Arachnoid Cells on Culture Plates and Collagen Scaffolds:
Phenotype and Transport Properties
Development of a Viable Three Dimensional Arachnoid Construct
The behavior of arachnoidal cells ex vivo has been studied since the 1980’s. Outgrowth from
primary cell cultures has been characterized as well as basic tabulations of extracellular matrix
composition. More recently, the transport of selected tracers have also been the cells as a
monolayer has been reported. Among the biologic architecture besides the two dimensional
monolayer of the arachnoid tissue is a porous reticulated central core within the arachnoid
granulation. With pore size around 100 microns, the core filters macroscopic particles and
buttresses the cap and endothelial lining. It distends in response to intracranial pressure.
Previously, one other attempt at mimicking this structure has succeeded in maintaining the cells
in a three dimensional culture condition. However, the nonweaved matrix was artificial and did
not duplicate the collagenous supportive structure underlying the cells. That paper however
demonstrated hydraulic permeabilities within reasonable ranges may be arrived at using tissue
engineering techniques. The following paper describes how primary rat arachnoid cells may
populate a collagen scaffold, duplicate biologic equivalents in terms of three dimensional
architecture, and maintain physiologic characteristics that in the future lead to the development
of a tissue engineered arachnoidal shunt.
The work is carried out by Cornelius Lam and Eric Hansen under the guidance of Allison Hubel.
The paper is written by Cornelius Lam.

Chapter 2
29
Introduction
Hydrocephalus is a medical condition that results from blockage of cerebrospinal fluid (CSF) flow
from the brain to the vascular system. The estimated prevalence of this condition is 1%–1.5%,
with the incidence of congenital hydrocephalus at 0.02%–0.35%.[42] This is variable depending
on geography and the underlying disease. If left untreated, this condition may result in severe
brain damage and even death. Conventional methods of treating hydrocephalus involve the
surgical insertion of bypass tubes to facilitate draining of CSF.[41] Unfortunately, complications
and failure rates are high for this type of approach. The complication rate for the first year in the
pediatric population is about 17%, and by 2 years, almost 50% of all shunts fail.[45] The
arachnoid granulation is traditionally thought to be the primary route for CSF drainage.[31]
Abutting the major draining veins of the brain and integrating into the walls of the superior
sagittal sinus, the arachnoid granulation resides at the interface between the intradural space
and the venous vasculature. Therefore, short of a mechanical blockage of CSF in the intradural
space, failure of the arachnoid granulation is thought to be one of the primary causes of
hydrocephalus.
The arachnoid granulation consists primarily of arachnoid cells with an endothelial cell layer.
Within the granulation, the arachnoid cells are organized in two distinct layers.[39] The first is an
arachnoid cap made up of tightly packed arachnoid cells several cell layers thick. Below is a
porous core several millimeters thick that is mainly collagen extracellular matrix with a sparse
population of arachnoid cells. These two layers are contiguous with the arachnoidal membrane
that covers the central nervous system. Another arachnoidal layer, the pia, is tightly adherent to
the brain.[39] Because they are anatomically more accessible and surgically more easily
manipulated, cells here serve as a ready source for harvesting. Between the pia and the
arachnoid membrane are sparse strands also made up of arachnoid tissue. The strands
connecting the more superficial arachnoid membrane to the pia form a three-dimensional (3D)
web-like network (hence the name arachnoid). This space between the two arachnoidal layers is
the subarachnoid space in which the CSF circulates. The arachnoid granulation inhibits large
molecules from entering into the CSF space while allowing small molecules such as water to
pass.[107] The complete role of the arachnoid cells in the flow of CSF is unknown despite over

Chapter 2
30
100 years of study,[107] and only recently has the transport of arachnoid granulation in isolation
been explored.[37]
Previous studies attempting to understand the function/ dysfunction of the arachnoid
granulation have been limited.[104],[36] These studies used arachnoid cells obtained from
human donors and characterized phenotype and permeability of cells cultured on synthetic
matrices (nonwoven poly[ethylene terephthalate] [PET] and cell culture inserts). These studies
demonstrated that arachnoid cells from humans can be cultured outside the body and that
arachnoid cells cultured ex vivo exhibit a directionality of water flow (i.e., hydraulic permeability
differs based on the direction of flow). These studies are important in establishing the ability to
culture arachnoid cells in vitro and the basic transport characteristics of cell monolayers. The
previous studies do little to recapitulate the native arachnoid granulation. The objective
therefore of this investigation is to culture arachnoid cells in a 3D collagen matrix, characterize
their behavior, and compare it to that observed in two-dimensional (2D) culture. The
development of an appropriate in vitro culture model for the arachnoid granulation can be used
to elucidate the function of the granulation and its role in hydrocephalus, to evaluate new
therapies to treat the disorder, and ultimately to aid in the development of a fully tissue-
engineered arachnoid granulation.
Materials and Methods
Cell isolation
Arachnoid cells were isolated from 19-day-old rats (Rattus norvegicus) with approval from the
Minneapolis Veterans Administration Medical Center and University of Minnesota animal care
committees. Animals were anesthetized before sacrifice and the pia-arachnoid tissue was
harvested from the anterior portion of the brainstem using microsurgical techniques. The tissue
was washed three times in phosphate buffered saline (PBS), cleared of extraneous tissue, and
chopped into 1X1mm2 pieces.
Tissue fragments were incubated at 37°C in humidified atmosphere of 95% air and 5% carbon
dioxide in a culture media containing Eagle’s essential medium with 10% fetal bovine serum
(Remel Inc.), nonessential amino acids (Sigma Aldrich), glutamine (BioWhittaker Inc.),

Chapter 2
31
streptomycin, and penicillin (Gibco Invitrogen Corp.) at 10mL/cc each; the medium was changed
twice per week. Cyclic AMP (cAMP) (2%; Sigma Aldrich) was added to the culture media for a
limited number of cultures. Within 2–3 days cells were seen growing out of the dissected tissue,
and after 7–10 days the cells became confluent. They were passaged following trypsinization
with a 1:2 dilution of 0.05% trypsin-0.02% EDTA (Gibco Invitrogen Corp.) mixed with PBS. Cells
were grown on Nunclon 6-well plastic plates (Thermo Scientific, Inc., 9.34 cm2 well surface
area). Cells could not be passaged beyond passage 9–10, and most experiments used cells from
passage 3 or 4.
The phenotype of the cells isolated from the tissue was confirmed using immunohistology. The
cells stained positively for cytokeratin and colocalized for desmoplakin and vimentin; these
markers are consistent with the arachnoid cell phenotype.[97] The cells also stained negatively
for myosin, S100, GFAP, CD31, SMA, and NeuN, indicating that they were not smooth muscle,
glial, endothelial, fibroblast, or neuronal cells, respectively. As reported in other
studies,[108],[109],[110] the cells appear similar to those in tissue fragments.
Collagen matrix preparation
Bovine Type I collagen was used to make porous sponges as per the protocol of Doillon et
al.[108] A collagen dispersion (0.5% wt/volume) was made by slowly blending lyophilized
insoluble collagen into a mixture with H2O+ HCl solution (pH 3.0) at 4°C for 1 minute. After
deaeration, the dispersion was poured into a pan, lyophilized at - 30°C, and dehydrothermally
crosslinked in a vacuum oven at 110°C and 2.5 torrs for 5 days. Gamma irradiation (17,500 rads)
was used to sterilize the sponges. The microstructure of the scaffold has two distinct regions
that result from the freeze-drying process. The upper surface of the matrix has low porosity with
cells seeded on this surface typically unable to penetrate deeply (Fig. 2.1). The bottom surface of
the scaffold has high porosity with an average pore size of ~100 mm in diameter facilitating cell
ingrowth. The scaffold was ~2–3mm thick and has a 3D architecture similar to the porous
central core of an arachnoid granulation. This type of matrix has been used in previous
investigations as a dermal replacement or a template for dermal regeneration,[109],[110],[111]
and been used clinically for the treatment of dermal wounds.[112]

Chapter 2
32
Figure 2.1: Arachnoid cells grown on microporous collagen
Arachnoid cells on a representative microporous side of bovine collagen scaffold by SEM.
Panel A shows a cell (indicated with arrow) with a process that sends out smaller daughter
processes. Panel B shows sparse growth of cells (two indicated with arrows) on substrate,
which is similar to the natural state of the cells in an arachnoidal membrane.
Construct seeding and culture
Sterile sponges ~20mm in diameter were pre-equilibrated with culture media before seeding
with rat cells. Approximately 50,000 arachnoid cells at passage 1–2 were used to seed the
collagen sponges. Preliminary studies suggested that this seeding density was optimal for
ensuring uniform and rapid population of the sponge. Constructs were cultured up to 21 days.
Histology and immunohistochemistry
Cells were permeabilized in 0.25% Triton X-100, blocked in 2% bovine serum albumin, and
incubated with primary antibodies in PBS overnight at room temperature. After rinsing with PBS,
cells were incubated with appropriate secondary antibody and counterstained with 4’,6-
diamidino-2-phenylindole (DAPI). Images were analyzed using a Biorad MRC-1024 single photon
confocal microscope 1024 (Biorad Cell Science). For establishing arachnoid cell phenotype, cells
Chapter 2
33
were stained with cytokeratin 18 antibody (C-04, Abcam Inc.), vimentin (Prod #080552;
Invitrogen), and desmoplakin I + II (Abcam, Inc.). Double labeling of vimentin and desmoplakin
was done to help verify cell identification.
To verify purity of the arachnoid cell isolations, cells were also stained for the presence of
potential contaminating cells: muscle, fibroblasts, endothelial cells, glial cells, and neuronal cells.
Myosin (MA1-35718; Fisher Sci.) was used to identify muscle cells; S100 (13E2E2; BioGenex) and
glial fibrillary acidic protein (GFAP, G-A-5; Cell Marque) were used to identify glial cells; CD31
(1A10; Cell Marque) was used to identify endothelial cells; smooth muscle actin (SMA asm-1;
Novacastra) was used to identify fibroblasts; neuronal nuclei (NeuN, MAB377; Millipore) was
used to identify neuronal cells. Staining levels for the cells were compared to positive controls
(uterus, melanoma, brain, bladder cancer, uterus, and brain for myosin, S100, GFAP, CD31, SMA,
and NeuN, respectively) or negative controls (brain for myosin, S100, CD31, and SMA, uterus for
GFAP, and muscle for NeuN). The presence of gap junctions in cultures was determined by
staining with connexin45 antibody (Prod #MAB3100; Millipore).
Scanning electron microscopy
Samples were fixed using 2.5% glutaraldehyde and 2.5% formaldehyde buffered to pH 7.4 with
phosphate, followed by a serial dehydration in alcohol. Samples were dried using a critical point
dryer (SPI # 13200-AB), sputter coated (SPI# 11429-AB), and imaged using a Hitachi HS 7S
electron microscope.
Western immunoblotting
Confirmation of protein content to immunohistochemical staining was performed using Western
blot. Positive controls were human A432cell line (Abcam) and melanoma (Abcam) for
desmoplakin and vimentin, respectively. Normoxia (a cell line donated by Dr. Roderick Barke,
Minneapolis VA Medical Center: PC-12 [TCC # CRL-1721] adrenal gland from rat) was used as the
negative control for both desmoplakin and vimentin. Approximately 1.0 · 107 cells were
centrifuged at low speed for 5 min. Pellets were washed with PBS (prod # 17-512F;
BioWhittaker) at room temperature and again centrifuged at low speed. PBS was carefully
poured out and ice-cold RIPA buffer (product #89900; Pierce) with inhibitors (Sigma Protease
Chapter 2
34
Inhibitor Prod # P-8340; Sigma Aldrich and Aprotinin Prod # A6279; Sigma Aldrich) added and
incubated on ice for 30 min. Proteins were denatured by boiling in water for 2–3 min and loaded
into an 18 well Precast XT gel cassette (prod #345-0136; BioRad Hercules). Chemiluminescent
Blue Ranger marker (prod # 26651; Pierce) and low range Rainbow marker (prod # RPN 755 E;
Amersham) were used to reference molecular weights. Electrophoresis was performed using a
Power Pac Universal (BioRad). Proteins in the gel were transferred to Hybond ECL nitrocellulose
(prod # RPN 2020 D; Amersham) by sandwiching between thick Blot paper (prod # 1703967;
Criterion BioRad) and run for 45 min at 10 volts using a Trans-blot SD (prod # 170-3940; BioRad).
Nitrocellulose membranes were incubated with Startingblock (TBS) Blocking Buffer (prod #
3754; Pierce) for 60min on a rocker (Red Rocker Hoefer Scientific Instruments) at room
temperature. The primary antibodies (Vimentin, Cytokeratin, and Desmoplakin) were diluted in
TBST containing Startingblock at 1:1000 and were incubated overnight in the refrigerator on a
rocker. On the following morning the nitrocellulose was rinsed twice with ~30 mL of TBST,
incubated with Donkey Serum Block (prod # D9663; Sigma Aldrich) for 60 minutes, and washed
twice with TBST for 5 min each. A 1:10,000 dilution of the secondary antibody (donkey anti-
Rabbit IgG-Horseradish peroxidase conjugate; Amersham # NA934V) was then used to cover
nitrocellulose for 60 minutes at room temperature. The sample was washed with TBST. Proteins
were detected with SuperSignal West Pico (Pierce #34080). Autoradiography films (prod # RPN
2103; Amersham) were developed using a CP1000 (AGFA Mortsel).
DNA content assay, cell number, and morphometrics
DNA content was quantified with the DNeasy Blood and Tissue Kit (Qiagen Sciences).
Absorbance was measured, as per the manufacturer’s instructions, at the 260nm wavelength.
Cell counts were performed using a hemocytometer (Hausser Scientific). cAMP was used to
determine if it altered cell growth (1mg/mL of media).
Cell morphometrics was performed using ImageJ software from the NIH website. High-
resolution digital images of the cells were obtained and maximal cell length and width
measured. Width was determined perpendicular to the maximal length. Area was determined
from image analysis of cell boundary traces. Process counting was done manually. Between 50
and 100 cells were used for process number analysis and morphometric measurements.

Chapter 2
35
Permeability
Transepithelial (arachnoid) electrical resistance. Transepithelial electrical resistance (TEER) was
used as a measure of barrier function for cells grown on a monolayer.[113] Chopstick electrodes
connected to an epithelial volt-ohmmeter resistance meter (World Precision Instruments, Inc.)
were placed on the basal side and apical side of the membrane. Electrical resistance
measurements were performed from day 5 to day 21 in culture and the resistance per unit area
was determined by dividing values obtained by the surface area of the construct (~2 cm2). The
TEER value of a blank membrane (pore size 3.0 µm; CoStar Transwell) was subtracted from the
apparent TEER values of membranes with cells to obtain the effective TEER value. The
membrane allows diffusion of small molecules such as ions.
Hydraulic permeability and dye transport. The permeability of indigo carmine (prod #55928,
Sigma Aldrich) was quantified. The arachnoid cell construct was placed in a diffusion chamber
(PermeGear Side-Bi-Side Cells) and maintained at 37°C. Each chamber was mixed using a
magnetic stirring bar to minimize diffusion boundary layers at the interface of the construct. At
10 min intervals, 20 mL samples were taken from the receiver chamber and the concentration of
the dye was determined using a Packard SpectraCount photometric microplate reader
(measured at 520 nm)(Packard Instrument Co.).
The apparent permeability, Papp, of the cells to the dye can be estimated based on the
following equation:
AxC
dt
dC
Papp
(1)
where dC/dt is the slope of the change in concentration in the chamber as a function of time
obtained directly from measurements, Co is the initial concentration of dye on the inlet side of
the diffusion chamber, and A is the area through which the dye permeates.[114]
The actual permeability (P) of the cell monolayer to dye is derived after correcting for the
resistance to dye permeation from the membrane
mapp PPP
111
(2)
where Pm is the permeability across the membrane without cells.
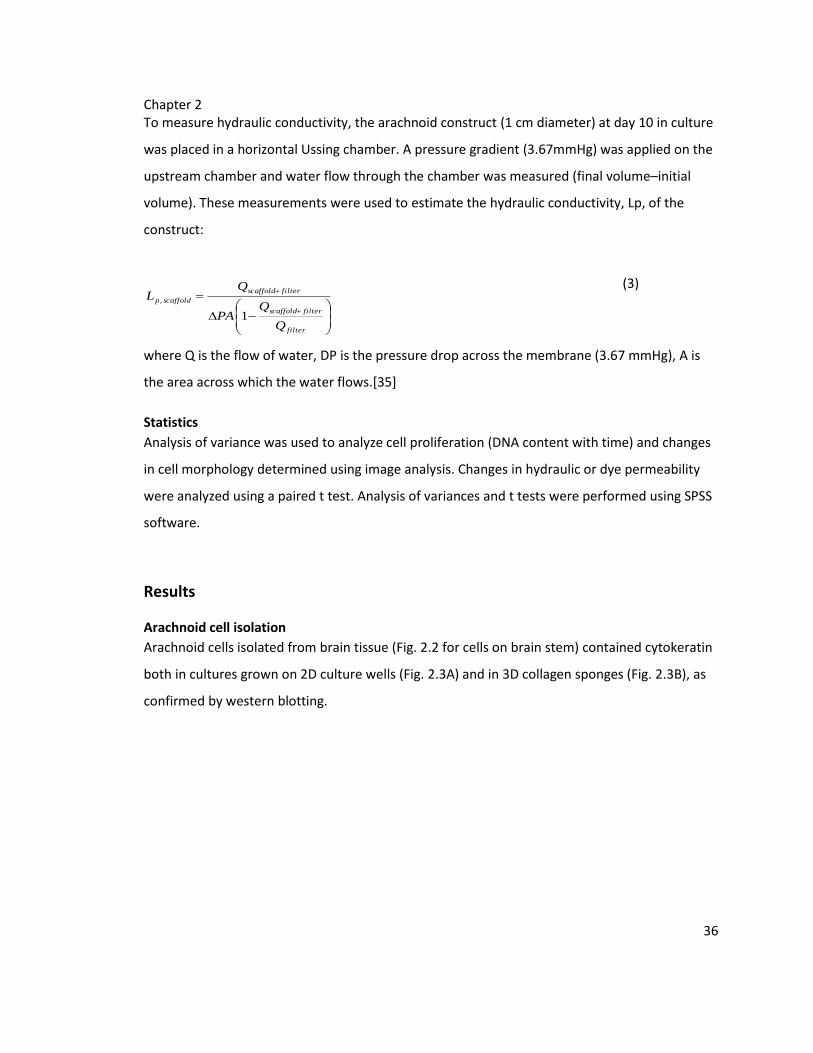
Chapter 2
36
To measure hydraulic conductivity, the arachnoid construct (1 cm diameter) at day 10 in culture
was placed in a horizontal Ussing chamber. A pressure gradient (3.67mmHg) was applied on the
upstream chamber and water flow through the chamber was measured (final volume–initial
volume). These measurements were used to estimate the hydraulic conductivity, Lp, of the
construct:
filter
filterscaffold
filterscaffold
scaffoldp
Q
QPA
QL
1
,
(3)
where Q is the flow of water, DP is the pressure drop across the membrane (3.67 mmHg), A is
the area across which the water flows.[35]
Statistics
Analysis of variance was used to analyze cell proliferation (DNA content with time) and changes
in cell morphology determined using image analysis. Changes in hydraulic or dye permeability
were analyzed using a paired t test. Analysis of variances and t tests were performed using SPSS
software.
Results
Arachnoid cell isolation
Arachnoid cells isolated from brain tissue (Fig. 2.2 for cells on brain stem) contained cytokeratin
both in cultures grown on 2D culture wells (Fig. 2.3A) and in 3D collagen sponges (Fig. 2.3B), as
confirmed by western blotting.
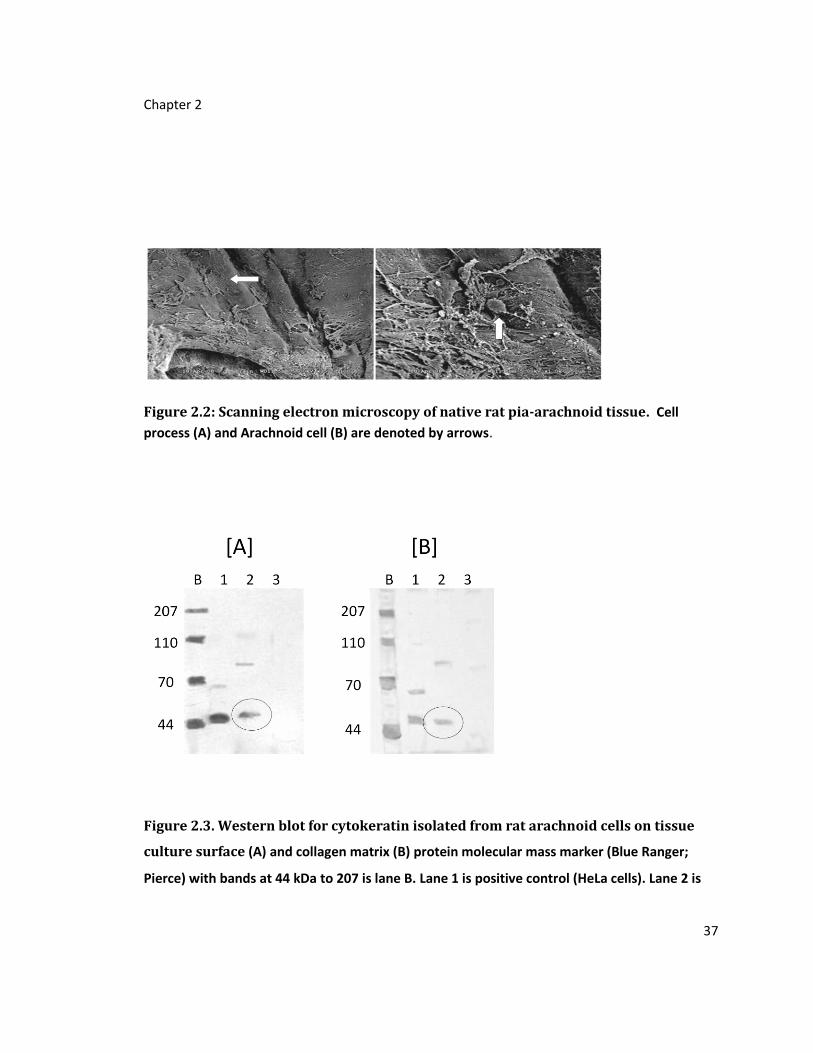
Chapter 2
37
Figure 2.2: Scanning electron microscopy of native rat pia-arachnoid tissue. Cell
process (A) and Arachnoid cell (B) are denoted by arrows.
Figure 2.3. Western blot for cytokeratin isolated from rat arachnoid cells on tissue
culture surface (A) and collagen matrix (B) protein molecular mass marker (Blue Ranger;
Pierce) with bands at 44 kDa to 207 is lane B. Lane 1 is positive control (HeLa cells). Lane 2 is

Chapter 2
38
rat arachnoid cells showing positive cytokeratin band at 45 kDa (circle). Lane 3 is negative
control (adrenal).
Expression levels of desmoplakin and vimentin for the cultures were also confirmed through
western blots (Fig. 2.4), and demonstrated colocalization of desmoplakin with vimentin
consistent with the arachnoid phenotype.[33] To differentiate arachnoid cells from other cell
types found in the intracranial cavity, the cells were stained for the presence of myosin, S100,
GFAP, SMA, and CD31. The cells stained negatively for these markers, indicating that the cells
isolated were not endothelia, neurons, glia, myocytes, or fibroblasts.
Figure 2.4: Western blotting of cells from 2D culture plates for identifying markers,
vimentin [A]and desmoplakin [B]. The circled bands show vimentin [A] positivity at 57 kDA
and desmoplakin [B] positivity at 331 kDA in arachnoid cells. Lane R, mass marker (Rainbow),
shows marks at 50 kDA and 250 kDA. Lane B (Blue Ranger) shows mark at 44 and 70 kDa.
Lanes 2 (HeLa cells) are positive controls. Lanes 3 (adrenal) are negative controls.
Cell culture on tissue culture plastic

Chapter 2
39
Arachnoid cells on 2D culture plates were predominantly bipolar (Fig. 2.5A), and stained
positively for vimentin (Fig. 2.5B) and cytokeratin (Fig. 2.5C). Hematoxylin and eosin staining
demonstrated the presence of large nuclei and long spindly processes in greater detail than the
immunostaining (Fig. 2.5D).
Figure 2.5. Morphology and staining patterns of rat arachnoid cells on tissue culture
plastic: (A) Phase-contrast light micrograph of arachnoid cells after 3 days in culture. (B)
Fluorescent micrograph of cultures stained for vimentin. (C) Fluorescent micrograph of
cultures stained for cytokeratin. (D) Hematoxylin and eosin staining of arachnoid cells 3 days
in culture.

Chapter 2
40
The cells proliferated with a doubling time of ~3 days (Fig. 2.6A) and cell doubling times were
consistent (as determined using cell counts and DNA content) (Fig 2.6B).
Figure 2.6: Growth curve for arachnoid cells cultured on tissue culture plastic and
collagen scaffold: (A) Cell counts as a function of time in culture for arachnoid cells cultured
on culture wells; (B) DNA content of arachnoid cells grown on culture wells as a function of
time in culture; and (C) DNA content of arachnoid cells grown in a collagen matrix as a
function of time in culture. Error bars indicate standard error (n=4).
The addition of cAMP to the culture medium did not alter the growth rate of the cells (p = 0.14
by paired t test). Cultures were stained for the presence of gap junction proteins (connexin) at
days 5, 10, and 15. Initially, areas of punctuate fluorescence indicative of gap junction formation
were seen over the cell layer. By ~3 weeks, connexin staining exhibits two different staining
patterns (1) punctate (which was more intense) and (2) diffuse (less intense) (Fig. 2.7).

Chapter 2
41
Figure 2.7: Connexin staining changing over time
Arachnoid cells increasingly expressed connexin as culture matures. At day 5 (panel A),
punctate immunoflorescence is seen as is expected from junctional proteins. By day 10 (panel
B), the spots are more numerous and gravitates toward the edges of the cells. By day 15
(panel C), expression becomes more fine and diffuse over the cells similarly to other published
results.
Physiological behavior of arachnoid cell monolayers
In the native tissue, the arachnoid granulation forms a functional barrier to the flow of CSF. To
quantify the barrier function of arachnoid cell monolayers, we measured (1) TEER[115] and (2)
permeability to indigo carmine.[116] TEER values increased with time in culture and achieved
the maximum value of 160 Ω∙cm2 after 15 days in culture and no further increases were
observed. Permeability of cell monolayers to indigo carmine was also quantified. The dye was
introduced into one side of the diffusion chamber and the concentration of dye in the other
chamber was monitored as a function of time (Fig. 2.8). These data were analyzed using the
equation above (Equation 2) to obtain an estimate for the permeability of the cell monolayer.
The dye permeability of the arachnoid cells was 6.7 · 10 - 6 + 1.1 · 10 - 6 cm/s.

Chapter 2
42
Figure 2.8: Permeation of Indigo Carmine through a monolayer of arachnoid cells:
Transwell without cells (black circles, n=6) and a Transwell cultured with monolayer of
arachnoid cells (open circles, n=6).
Arachnoid culture in a collagen scaffold
The arachnoid cells attached to the collagen scaffold readily (Fig. 2.9). Preliminary seeding
studies were performed to determine the minimum seeding density to achieve population of
the matrix. Seeding densities of 10,000, 20,000, and 100,000 cells per well or ~5,000 to 50,000
cells/cm2 were tried. A seeding density of 50,000 cells/cm2 resulted in the most rapid
repopulation of the matrix. Increasing seeding levels to higher values did not increase the rate at
which the matrix was repopulated. DNA content in the matrix reached steady state within 7
days (Fig. 2.6C). Confocal microscopy was used to determine the spatial distribution of cells
throughout the matrix (Fig. 2.9A, B) and the phenotype of the cells (e.g., expressing desmoplakin
and vimentin as shown in Western blotting) (Fig. 2.9C, D). Cells populated the collagen sponge

Chapter 2
43
uniformly (see supplementary 3D video) and electron microscopy revealed that cell morphology
was consistent with that observed in native tissue (Fig. 2.9B). Even though cells penetrated well
into the scaffold, cell distribution remained sparse throughout the scaffold, which is consistent
with the cell distribution observed in the arachnoid core.[40]
Figure 2.9: Arachnoid cells grown on porous collagen scaffolds with pore size of
approximately 100 µm: (A) Scanning confocal micrograph of arachnoid cells cultured on a
collagen matrix stained with desmoplakin (R-Phycoerythrin; emission 575 nm) and vimentin
(Fluorescein; wavelength emission 528 nm). DAPI was used for nuclear staining. Yellow

Chapter 2
44
represents additive summation of the primary colors red and green indicating co-localization
(B) Scanning electron micrograph (SEM) of arachnoid cells cultured on a collagen matrix,
arrows Indicate individual cells (C) Protein expression for vimentin in scaffold (57 kDA, Lane 1,
circled). With 50 kDA mass marker is Rainbow in Lane R. Lanes 2 and 3 are positive (HeLa) and
negative controls (adrenal) respectively. (D) Protein expression for desmoplakin (331 kDA,
Lane 1, circled). Protein mass marker (Blue Ranger) is lane B, with lanes 2 and 3, positive
(HeLa) and negative (adrenal) controls respectively.
Morphometric analysis of cells grown on 2D and 3D surfaces
Arachnoid cell body geometry on 2D cultures was determined quantitatively at 6, 12, and 18
days after seeding (Fig. 2.10). Specifically, length, width, and area of the cells were quantified.
The cell area did not change with time in culture, but cells became significantly shorter over
time (day 6–18) (p = 0.02). The number of cell processes did not differ over that same period
and the variation of length appears to occur both with cells of low and high passages (passage >
8). Likewise, the process formation was not different between the 2D cultures compared to the
collagen scaffold preparations (Fig. 2.11 compared to Fig. 2.9B). The morphology of the cells
cultured in the construct was also determined using scanning electron microscopy. Most cells
exhibited extensive bipolar process formation, which appeared to penetrate into the scaffold
(Fig. 2.9B). Arachnoid cells of similar shape were also found on the apical (nonseeded
microporous) side (Fig. 1.1). The number of processes was not significantly different between
cells grown on 2D culture plates compared to that of cells grown in a 3D collagen sponge (Table
2.1).

Chapter 2
45
Figure 2.10: Morphometric analysis of arachnoid cells. Length, width and area of
arachnoid cells grown on tissue culture. Error bars indicate standard error.

Chapter 2
46
Figure 2.11: Scanning electron microscopy of arachnoid cell on culture plate.
Processes may be seen emanating from the cells. They appear similar to the cells on a
collagen scaffold.
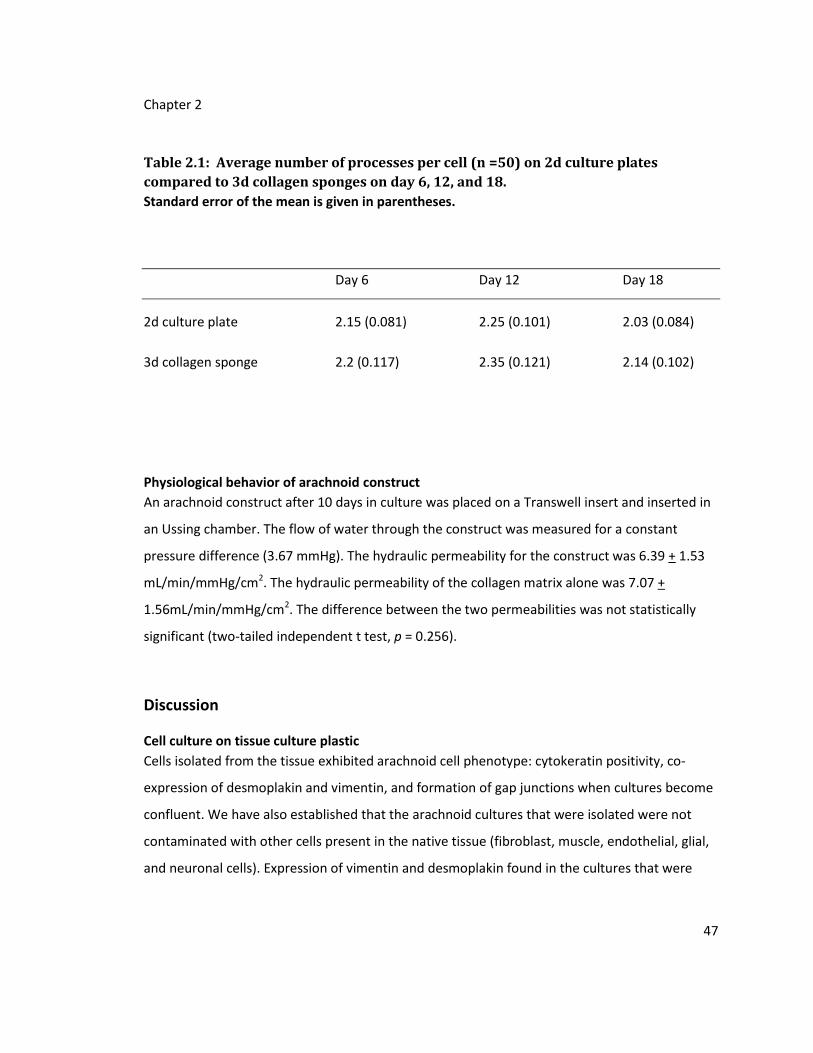
Chapter 2
47
Table 2.1: Average number of processes per cell (n =50) on 2d culture plates
compared to 3d collagen sponges on day 6, 12, and 18.
Standard error of the mean is given in parentheses.
Day 6 Day 12 Day 18
2d culture plate 2.15 (0.081) 2.25 (0.101) 2.03 (0.084)
3d collagen sponge 2.2 (0.117) 2.35 (0.121) 2.14 (0.102)
Physiological behavior of arachnoid construct
An arachnoid construct after 10 days in culture was placed on a Transwell insert and inserted in
an Ussing chamber. The flow of water through the construct was measured for a constant
pressure difference (3.67 mmHg). The hydraulic permeability for the construct was 6.39 + 1.53
mL/min/mmHg/cm2. The hydraulic permeability of the collagen matrix alone was 7.07 +
1.56mL/min/mmHg/cm2. The difference between the two permeabilities was not statistically
significant (two-tailed independent t test, p = 0.256).
Discussion
Cell culture on tissue culture plastic
Cells isolated from the tissue exhibited arachnoid cell phenotype: cytokeratin positivity, co-
expression of desmoplakin and vimentin, and formation of gap junctions when cultures become
confluent. We have also established that the arachnoid cultures that were isolated were not
contaminated with other cells present in the native tissue (fibroblast, muscle, endothelial, glial,
and neuronal cells). Expression of vimentin and desmoplakin found in the cultures that were

Chapter 2
48
isolated in this investigation exhibited similar phenotype to arachnoid cells isolated from human
granulation,[34] spinal,[32] fetal[115] tissue, and other locations in the brain.[98]
A unique aspect of native arachnoid cells is their ability to form the CSF–blood barrier. Previous
investigations have demonstrated that human granulations exhibit tight junction formation,
which has also been associated with barrier formation.[109] Zonula Occludens-1 (a component
of tight junctions) and E-cadherin (a calcium dependent cell adhesion molecule) have been
found in previous studies of arachnoid cell culture.[34] Also, desmosomes, which are made up of
multiple proteins, including desmoplakin, have been observed in arachnoid cultures using
transmission electron microscopy.[117] The role of calcium is uncertain. In vivo manifestations
of calcium in granulations typically are in isolated concretions that are not within the pathways
of water movement. In this study, we have shown that gap junctions (as determined by
connexin staining) develop in culture and become more numerous with time in culture.
The barrier capability of cell monolayers cultured in vitro has been studied using a variety of
methods, including TEER. TEER values for monolayer cultures of Madin–Darby Canine Kidney
Cells (MDCK II) and human colonic adenocarcinoma cells (caco-2) range between 100 and 500
Ω∙cm2, respectively.[73] In this investigation, TEER values of 160 Ω∙cm2 are well within the range
of values measured for other models of blood–brain barrier. It is noteworthy that the ECV304
and HCMEC/D3 cell lines have been used as an in vitro model of the blood-brain-barrier[118],
and TEER values for these cells have been measured at ~110 Ω∙cm2. With TEER of 160 Ω∙cm2, we
demonstrate the first CSF–blood barrier formation capability in an in vitro model. Transport
function of the arachnoid monolayer also has been quantified via the permeation of dyes. By
way of comparison, the permeability of Lucifer Yellow for caco-2 cells was 2.5–5.0 · 10 - 6 cm/s
and MDR-MDCK cells was 6.0–8.0 · 10 - 6 cm/s.[114] A recent study demonstrated permeability
of Lucifer Yellow for human arachnoid cells in cell culture inserts to be 7–14 · 10 - 6 cm/s.[36] The
permeability of indigo carmine in arachnoidal cells measured in this investigation was well
within the range of these previously measured permeabilities (6.7 · 10- 6 cm/s).
Arachnoid culture in a collagen scaffold
Arachnoid cells that were seeded into the matrix rapidly repopulated the matrix (~7 days). Cells
grown on a collagen sponge (diameter of 16mm) contained slightly more DNA content on
Chapter 2
49
average than cells grown on tissue culture plastic (36mm in diameter) after the same time
period (7 days). This suggests that cell densities from collagen sponges are growing at a rate
similar to or slightly higher than cells grown on tissue culture plastic. Overall, the density of cells
on the surface of collagen sponges (viewed by scanning electron microscopy) appear to be
consistent with the sparse density of arachnoid cells in the native tissue.[44] As with arachnoid
cells cultured on tissue culture plastic, arachnoid cells cultured in the collagen matrix exhibited
the expected phenotype (expression of desmoplakin and vimentin). Cells cultured in the
construct were principally bipolar. This cell shape is consistent with that observed in certain
native tissues,[119] and there was little difference in morphometry between cells cultured on
tissue culture plastic and in the collagen matrix. The hydraulic permeability measured in this
investigation (~6 · 10 - 6 cm/s) was slightly higher than that measured in another study with
human arachnoid cells (~3 · 10 - 6 cm/s).[36] It is currently unclear as to the reason for the
decrease in hydraulic permeability measured in this investigation although they are within the
same range. Because the PET is a nonwoven fibrous mat, a direct comparison is difficult.[104]
PET is a synthetic matrix that replicates neither the biological signaling of collagen nor the
spongy architecture of the native arachnoid granulation. In contrast to previous studies, we
were able to recapitulate the two distinct layers in the arachnoid tissue, the core (collagen
sponge studies) and the cap (monolayer studies), and demonstrated function of the cells in
these two contexts. The use of a biocompatible and degradable material such as collagen is also
important for any potential future uses (or implantation). Minute contaminants on nonbiologic
substances in the brain are extremely difficult to treat; therefore, infections of artificial
ventriculoperitoneal shunts almost always require removal. This complication is one of the most
common complications of shunting.[45] Therefore, the utilization of collagen would be an
important step in the creation of a bioartificial construct as a means for diverting CSF.
The density of cells in the construct is much less than that in cell monolayers but mirrors more
closely the density of arachnoid cells in the core region of the native granulation. Additional
studies are currently being pursued to stratify cell density in the construct to mirror that in the
native tissue. In summary, the results of this study demonstrate that arachnoid cells can be
isolated from native rat brain tissue and successfully cultured ex vivo in monolayers and
collagen scaffolds. The cells express arachnoid cell phenotype and demonstrate aspects of

Chapter 2
50
normal arachnoid granulation function (barrier to the flow of water and larger molecules). This
in vitro model of the arachnoid granulation has the potential to help us both understand the
causes/development of hydrocephalus and develop tissue engineered alternatives to
conventional methods of treatment.

Chapter 2
51
Supplement Movie: Three D movie demonstrating cell penetration into scaffold: Three
dimensional view of the collagen scaffold populated by the arachnoid cells. The movie rotates
the scaffold on edge so that penetration by the cell is visualized. Scaffold thickness is
approximately 2mm. Available at: www.liebertonline.com/tea.

Chapter 3
52
Chapter 3: Immortalization and Functional Characterization of Rat
Arachnoid Cell lines
Creation of a stable cellular substrate for the study of arachnoidal
transport and tissue engineering The availability of primary arachnoid cells is limited. Harvesting the tissue from rodents is
difficult and requires multiple animals for the assembly of sufficient cells for physiologic work.
The cells are fickle and older animals not only do not grow well, but also vary in its transport
abilities. This therefore serves as the impetus for the development of an immortalized cell line
of rat arachnoid. One previous attempt, while able to maintain cells for a longer period than
primary cells ultimately failed when multiple passages were carried out. We therefore set out
to on the same task, but applied newer techniques of immortalization. To this aim, we
developed two lines of stable cell lines, one using a tried technique of LgTAg adenovirus
transduction, the second using a double immortalization technique of LgTAg plus human TERT
transduction. These two cell lines function identically. This paper describes these cell lines and
gives preliminary physiologic data particularly of transport.
The work is carried out by Christopher Janson, Liudmila Romanova, Eric Hansen, and Cornelius
Lam. The paper is written by Christropher Janson, Liudmila Romanova, and Cornelius Lam.
Abbreviations: CSF, cerebrospinal fluid; DT, double-transduced; FBS, fetal bovine serum; hTERT,
human telomerase; LTAg, large T antigen; PBS, phosphate buffered saline; rTERT, rat
telomerase; SEM, scanning electron microscopy; ST, single-transduced; TEER, transmembrane
electrical epithelial resistance; TPG, total product generated; TRAP, telomerase repeat
amplification protocol.
Chapter 3
53
Introduction The arachnoid mater, which along with pia mater forms the leptomeninges, exists between the
CNS and the dura mater. Embryologically it is derived from neuroectoderm and extends from
the most caudal extent of the filum terminale to the external surface of the cerebrum. Because
of the different local environments where arachnoid cells may exist, such as at the nerve root
sleeve or within the dural venous sinus, cellular phenotypes are variable, though typically
consist of elongated, spindle-shaped epithelial cells. Similar to choroid plexus, arachnoid cells
maintain apical-basal polarity and form tight junctions which create a barrier to solute and
water flow (i.e. CSF-blood barrier).
Arachnoid cells comprise the core of the arachnoid granulation, a major site of egress for
cerebrospinal fluid (CSF) to the venous system, which is affected in communicating
hydrocephalus and other brain disorders involving abnormal flow of CSF. The production and
bulk resorption of CSF has been studied in vivo with mammalian models, but molecular
mechanisms involved in solute and water transport at the level of the arachnoid villi remain
poorly understood. Use of primary arachnoid cells [120],[34],[104] for in vitro studies has
numerous practical limitations due to their low proliferative rate and early senescence, which
typically occurs after 4–8 passages. Our preliminary work with rat primary cultures indicated
that arachnoid cells did not approach confluence when seeded into a three-dimensional
collagen framework, and two-dimensional systems were likewise constrained by poor growth
properties of source material after very early passage. Primary cultures required repeated
collection of tissue due to rapid senescence and underscored the need for generation of stable
cell lines. The purpose of this study, therefore, was to generate stable cell lines derived from
normal mammalian arachnoid villi or dissociated arachnoid cells, similar to native cells in their
morphology and physiology, to be used in studies of CSF flow.
In general, primary explanted cells in culture grow for only a limited number of population
doublings until they reach the first replicative barrier, known as M1 or senescence, which is
defined as irreversible proliferative arrest in the presence of ongoing metabolic activity [121].
Human cells have a further barrier, which is known as M2 or crisis, which is defined as
widespread cell death despite ongoing cell division [122]. M1 arrest is primarily related to
Chapter 3
54
expression of tumor suppressor genes such as p53 and Rb, while M2 arrest is primarily related
to telomere shortening with repeated cell divisions [123]. This progressive telomeric shortening
with repeated DNA replication cycles may be partially offset by telomerase reverse
transcriptase, which maintains telomere length in germline and stem cells. Immortalized cells
are those which have bypassed both M1 and M2.
In human cells, addition of viral oncogenes such as SV40 large T-antigen (LTAg) or adenovirus
E1A typically leads to extension of life without true immortalization. The mechanism for LTAg
effects on the cell cycle is primarily through binding to and inactivating p53 and Rb tumor
suppressors [124]. In mouse or hamster cells, which have a limited life span of 20–30
generations in culture, LTAg transduction alone is usually sufficient for immortalization with
efficiency approaching 100% [125]. The additional step of telomerase activation is required for
human cell immortalization, and ectopic expression of human telomerase (hTERT) in human
cells permits telomerase-negative cells transformed with LTAg to bypass senescence [126]. In
addition to species-specific constraints, cells of different lineages or tissues of origin may have
slightly different requirements for immortalization [127]. For example, single transduction with
hTERT in human fibroblasts, endothelial cells, and mesothelial cells may be sufficient to bypass
senescence [128] while other cells such as keratinocytes or mammary epithelial cells may
require co-expression of other factors [129].
There is a prior report of an “immortal” cell line created from normal human arachnoid cells
with LTAg transduction [97], but this cell line is no longer available and actually was a senescent
cell line at P50 which changed its immunohistochemical and functional characteristics over time,
gradually losing cytokeratin markers after P30. Several other groups have reported
transformation of human meningioma cells and formation of cell lines either using hTERT alone
[130] or hTERT with SV40 LTAg [131]. In one cell line derived from low-grade human
meningioma, expression of hTERT alone allowed passaging through P20 but the cells eventually
became senescent and required treatment with other viral oncogenes to become immortal
[132], which serves to emphasize cell-type specific mechanisms of senescence that depend on a
number of complex factors working in concert to overcome M1 and M2.

Chapter 3
55
A major advantage of rat arachnoid cells is that they represent a readily available and
homogenous source compared to human material from different donors, and may be
transplanted into various rat models of inherited or induced hydrocephalus [133],[134]. Because
the replicative potential of rat arachnoid cells was largely unknown and the cells appeared to
become senescent after a very limited number of passages, we began by transforming cells with
SV40 LTAg and then double-transformed a subset of cells with SV40 LTAg and hTERT. A variety
of immortalization strategies have been described in the literature, including use of adenoviral
E1a, human papilloma virus16 E6/7, and other physical or chemical approaches [135], but the
most widely used and reliable methods utilize SV40 LTAg and/or telomerase.
While in human cells telomerase activity is highly regulated and repressed, mouse and hamster
cells promiscuously express telomerase in most somatic cells, which (in addition to longer
telomere length of 20–100 kb compared to 0.5–15 kb in human cells) may contribute to their
tendency to be readily immortalized. Interestingly, mouse telomerase (mTERT) is expressed in
the adult mouse testis and liver but is not detected in brain [136] outside of putative stem cells.
Rat telomerase (rTERT) was recently cloned [137] but constructs are not readily available and
considerably less is known about its activity, though it appears to be upregulated in adult rat
testis, liver and brain compared to other tissues and has activity similar to hTERT and mTERT.
Telomerase expression in normal human arachnoid cells remains unknown, but is often found in
meningioma tissue and directly correlates with tumor malignancy [138].
There is known to be crosstalk between telomerase and various cell cycle pathways; for
example, hTERT inactivates the tumor suppressors p16 and Rb [139] and is itself suppressed by
Rb and p21 but stimulated by c-myc, which suggests that inhibition of Rb through SV40 LTAg
transduction could have indirect effects on telomerase [140]. In the past, rat astrocytes [141] or
neurons [142],[143],[144] have been immortalized with a single-step SV40 LTAg strategy, which
is predicted to upregulate endogenous telomerase, though this had never been directly tested.
Rat cells are not as commonly used or as well defined as mouse cells, and in the case of
arachnoid cells, it was unknown if cells would show synergistic growth and viability with
additional telomerase.
Chapter 3
56
In summary, we expected that LTAg would suffice for immortalization, but given the limited
growth of primary cells, it was predicted that transduction with hTERT would confer benefits in
doubling time and long-term viability. Surprisingly, we found that significant upregulation of
telomerase in double-transduced (DT) cells did not augment the growth profile or otherwise
alter the phenotype of cells at over 160 passages, compared to single-transduced (ST) cells.
Thus, minimal SV40 immortalization appears sufficient in rat arachnoid cells. We also
demonstrated that, specifically within arachnoid cells, rat telomerase is active at baseline and
addition of LTAg did upregulate native rat telomerase. We observed a stable immortalized
phenotype in both ST and DT cell lines, with superior functional properties for physiological
studies compared to primary cells.
Experimental procedures
Primary culture of rat arachnoid cells
Arachnoid cells were harvested from 21 to 23 day old female Sprague–Dawley rats. The animals
were euthanized with CO2 according to an approved VA Medical Center animal protocol.
Carcasses were thoroughly cleaned with 70% ethanol. The cranium and cervical spine were
exposed and the brain and upper spinal cord was removed en bloc. The leptomeninges were
removed by gentle dissection from the brainstem and finely minced with a #15 scalpel, then
placed in Dulbecco’s modified Eagle’s medium (DMEM, Invitrogen) with 10% heat-inactivated
fetal bovine serum (FBS) containing 1% penicillin/streptomycin (Gibco) in a six-well poly-L-lysine
coated plate (BD Biosciences) in a humidified incubator at 37 °C with 5% CO2 atmosphere. The
next day culture media was replaced without disturbing the cells. After the cells became
adherent, they were split at a 1:2 to 1:6 ratio every 7 days. At passage 3 or 4, arachnoid cells
were replated into a Biocoat six-well poly-D-lysine coated plate (BD Biosciences). Viral
transduction was performed when the cells reached 60–80% confluence.
Production of retrovirus containing SV40 LgTAg and hTERT
Retroviral constructs pBABE-neo-hTERT and pBABE-puro- SV40LT, containing hTERT or SV40
LTAg along with the G418 or puromycin resistance genes, were manufactured by Dr. Robert
Weinberg, MIT-Whitehead Institute, and obtained through a nonprofit plasmid repository
(Addgene). The plasmids were expanded from transformed bacterial cultures, column purified,

Chapter 3
57
and verified for fidelity with restriction digests. Plasmids were then used to transfect EcoPack2
cells (Clontech), which are 293HEK ecotropic feeder cells containing retroviral packaging genes.
EcoPack2 cells were seeded 12–18 h prior to use at 5X10⁵ cells/25 cm2 flask. Then 5 µg of
pBABE-puro-SV40LT was combined with Fugene reagent (Roche) and OptiMem (Invitrogen)
serum-free media in 250µl total reaction volume with 3:1 ratio of Fugene:DNA. This was
incubated for 30 min and added to each flask of 293HEK ecotropic feeder cells, with 3 ml of
serum-containing media per flask. After exactly 48 h, the retroviral supernatant was collected,
pooled from each flask into a 50 ml tube, and clarified with Millipore PVDF 0.45 µm Steri-Flip
vacuum membrane to remove cellular debris. From six flasks, 18 ml total supernatant was
collected. Quantitative RT-PCR was then used to obtain viral particle titers, using primers from
the Retro-X qRT-PCR titration kit (Clontech), and RNA genomic titers were confirmed to be
>2X10⁹/ml.
Retroviral transduction of arachnoid cells
Clarified viral supernatant containing pBABE-puro-SV40LT was applied to the arachnoid cell
primary culture. Target cells were initially at a density of 4X10⁴ cells/well of a six-well plate.
Media was aspirated and 3 ml virus-containing media was added per well. Polybrene (Millipore)
was added to a final concentration of 4 µg/ml. After 12–18 h of incubation, virus-containing
media was aspirated and replaced with fresh media, to avoid polybrene toxicity and possible
adverse effects from conditioned media. Cells transduced with pBABE-puro-SV40LT were
selected over 14 days with puromycin (Sigma). Selection was started with 0.5 µg/ml puromycin,
then increased to 0.75 µg/ml. A subset of these cells was stored and additional cells were then
double-transduced with the pBABE-neo-hTERT construct and selected with G-418 (Calbiochem)
at 200–400 µg/ml. The single- and double-transduced cells were expanded in 75 cm2 flasks and
aliquots were frozen in liquid nitrogen in RecoveryTM cryopreservation media (Invitrogen) for
future use. Banked cells were verified free of mycoplasma contamination using MycoAlert assay
(Lonza).
Immunostaining
Cells were grown on four-well poly-D-lysine culture slides (BD Biocoat) and fixed with 4%
formaldehyde in phosphate buffered saline (PBS). The cells were permeabilized with 0.5% Triton
X-100 in PBS for 5–7 min and washed 3X with a washing solution containing 10% FBS and 0.2%

Chapter 3
58
Tween-20 in PBS before application of primary antibodies. Double-staining was carried out
sequentially as needed with species-specific primary antibodies. In general, cells were incubated
with primary antibodies for 1 h, washed with the washing solution and incubated with
secondary antibodies for 1 h. Finally, cells were washed with washing solution and nuclei were
stained with Hoechst dye (Sigma) for 15 min. Slides were air-dried and water-soluble
fluorescence mounting solution (Dako) and cover slips were applied. Fluorescence images were
captured with a Nikon Eclipse E600 microscope with Diagnostic Instruments Spot Insight CCD
camera. Images were post-processed with Adobe Photoshop CS3. The following antibodies and
dilutions were used for immunostaining: rabbit monoclonal anti-hTERT (Abcam, Cat. #32020) at
1:20, mouse monoclonal anti-SV40 LTAg (Abcam, Cat. #16879) at 1:50, rabbit antivimentin
antisera (Abcam, Cat. #8545) at 1:1, rabbit polyclonal anti-cytokeratin (Dako, Cat. #Z0622) at
1:100, mouse monoclonal anti-cytokeratin18 (Abcam, Cat. #668) at 1:20, mouse monoclonal
anti-desmoplakin (Abcam, Cat. #16434) at 1:10. The following secondary antibodies were used,
all at 1:500 dilution: Alexa Fluor 488-conjugated anti-rabbit or anti-mouse IgG (Invitrogen), Alexa
Fluor 555-conjugated anti-rabbit.
Western blotting
Cell extracts were prepared from 5X10⁵ cells as described previously [145]. Extracted proteins
were resolved in a 10% or 12% SDS PAGE gel and transferred onto immobilon-P membrane
(Millipore) for immuno-detection. The membrane was treated with blocking solution containing
5% skim milk and 0.2% Tween-20 in PBS for 1 h. The primary antibodies were used as cited
above, at concentrations according to the manufacturer. The incubation time with primary or
secondary antibody was 1 h. Signal was detected by using SuperSignal West Dura (Pierce
Biotechnology) as a substrate for peroxidase. The primary antibodies were used as cited above,
at concentrations according to the manufacturer. GAPDH was used for loading controls, in
addition to cell counting. The secondary antibody was HRP-conjugated anti-IgG of the
appropriate species (Jackson ImmunoResearch Laboratories) at 1:1000 dilution.
Telomerase assay
Telomerase activity of the primary cells and the immortalized cells was measured with TRAP
(telomere repeat amplification protocol) assay using the TRAPEZE XL Telomerase Detection Kit
(Millipore) according to the manufacturer’s instructions. The values for total products generated
Chapter 3
59
(TPG), which represents telomerase activity, were obtained from three independent
experiments and expressed as a mean+SEM.
TEER and transport of radiolabeled substrate
Transepithelial electrical resistance (TEER) was first used to assess the adequacy of the epithelial
monolayer in the Transwell culture system, and then radiolabeled carboxyl 14C-inulin (MP
Biomedicals) was used to measure paracellular transport properties of immortalized rat
arachnoid cells, as an indirect measure of tight junction formation and presumed blood-CSF
barrier properties. Because arachnoid primary culture cells did not readily grow to confluence, it
was not possible to compare directly with the immortalized cells. Caco-2 epithelial cells were
used as an internal control, since reference values are available. Caco-2 cells were obtained
from American Type Culture Collection (Rockville, MD, USA) at passage 18. DMEM with FBS as
described above was applied to apical and basal portions of the Transwell system for arachnoid
cells and allowed to equilbrate for 2 h in a CO2 incubator before fresh media was added and cells
were seeded. Immortalized DT rat arachnoid cells at P70 and Caco-2 cells at P24 were plated in
media at density 1X10⁵ cells/cm2 in 12-well plates with collagen-coated PTFE Transwell inserts
(Corning Cat. #3494). Transwells without cells (blank) were used as a control, and naive rat cells
were also plated at density 1X10⁶ cells/cm2 for comparison. After growth to confluence, the
transepithelial membrane resistance (TEER) was measured with an epithelial voltmeter (World
Precision Instruments) according to the manufacturer’s recommendations. For radiolabeled
transport studies, we used 14C-inulin in the range of 10 nM–6 µM for linear non-concentration
dependent transport [146]. 14C-inulin stock solution at specific activity of 2.38 mCi/g was
prepared as 1 µl radiolabeled solution per 1000 µl assay buffer, for inulin concentration 21
µg/ml and specific activity 0.05 µCi/ml. Buffer was removed from the apical compartments and
1 ml of pre-warmed radioactive solution was added to each apical chamber, being careful not to
spill into the basolateral chamber. The plate was put onto a gentle shaker at 37 °C and 100 µl
samples were taken from both compartments in each well at 0, 15, 30, 60, 90, 120 min and
replaced with equal volumes of respective buffer. Counts were measured in a scintillation
counter and transport was expressed as the apparent permeability coefficient Papp using the
standard transport formula Papp=dQ/dt [1/(AC0)] where dQ/dt is the steady state flux, A is the

Chapter 3
60
surface area of the Transwell in cm2, and C0 is the initial concentration in the apical portion of
the Transwell [147],[148].
Three-dimensional culture system and scanning electron microscopy (SEM)
For SEM, arachnoid cells at P76 at an optimal density of 75,000 cells/cm2 were seeded onto a
collagen matrix consisting of bovine type I collagen (Devro, Somerville, NJ, USA) which was
manufactured according to a standard protocol [108], in DMEM media with 10% FBS as
described above. We utilized a range from 25,000 to 175,000 cells/cm2 for immortalized cells
until this optimal seeding density was determined. After growth for 10–12 days, the media was
aspirated and the collagen support was washed with PBS and the samples were then fixed en
bloc in 2.5% glutaraldehyde, passed through a standard series of ethanol–water mixtures to
absolute ethanol, and dried using an EMS 850 critical point dryer. A sputter coater was used to
coat dried sponges with a 10 nm gold layer and a Hitachi S3500N variable pressure SEM was
used to capture images of the samples. For better visualization of cells, false color was applied
to selected images.
Karyotyping
Karyotype analysis was performed in order to determine the extent of structural changes after
viral transduction. We predicted that the karyotype would show changes from normal diploid
state following immortalization, but the extent of karyotypic change after viral transduction was
unknown. After a 3.5 h colcemid treatment, cells were harvested according to standard
cytogenetic protocol (University of Minnesota Cytogenetics Core Laboratory). The resulting
metaphase cells were evaluated by G-banding and more than 15 metaphases were completely
analyzed in ST and DT cells.
Results
The aim of this study was developing and partially characterizing immortal arachnoid cell lines
which could be utilized for physiological studies in modeling normal CSF flow, and which could
be modified or treated with various substances to study pathological conditions such as
hydrocephalus, arachnoid cysts, or other disorders. As a starting point, the following basic facts
needed to be established: (1) that the cells had been stably transduced with the intended gene
constructs; (2) that the cells retained normal immunohistochemical and morphological

Chapter 3
61
phenotypes of arachnoid cells, including the ability to form an intact epithelial monolayer with
essentially normal physiology; (3) that the cells displayed the expected behavior of immortalized
cells, such as rapid and sustained cell division through many passages. As described below, our
results support an immortalized arachnoid phenotype which is nevertheless identical to normal
arachnoid cell morphology, immunohistochemical profile, and key growth properties including
contact inhibition and basic epithelial barrier formation. Immortalized cells have not exhibited
evidence of whorls, calcification, or typical histopathology seen in meningiomas.
Rat arachnoid cells were stably transduced with SV40 LTAg and hTERT
After treatment of the primary rat arachnoid cells with retroviral vectors, the resultant
immortalized cells were subjected to antibiotic and growth-dependent selection. Efficiency of
viral transduction with pBABE-puro-SV40LT and pBABE-neo-hTERT was confirmed by
immunofluorescence and Western blotting using antibodies against SV40 LTAg and hTERT. Both
ST and DT cells at early and intermediate passages showed stable expression of SV40 LTAg that
localized in the nucleoli of immortalized cells, and a 82 kDa band corresponding to SV40 LTAg
was detected by Western blotting in cell extracts (Fig. 3.1A). hTERT protein was visualized in
nucleoli of DT cells, as well as in the cytoplasm due to very high expression levels, and a 122 kDa
band corresponding to hTERT was detected by Western blotting in nuclear extracts. HeLa
nuclear extract was used as control for hTERT expression (Fig. 3.1B).

Chapter 3
62
Figure 3.1. Expression of SV40 LTAg and hTERT in immortalized arachnoid rat cells.
After transformation with SV40 LTAg or SV40 LTAg+hTERT, arachnoid cells were cultured and
seeded for immunostaining in situ. Total protein extracts were also prepared from the same
cultures for Western blot analysis. Commercial primary antibodies against SV40 LTAg and
hTERT where used for detection. (A) Double-transduced, immortalized cells at early passage,
showing immunofluorescence staining for SV40 LTAg, with confirmation of a 82 kDa specific
band for LTAg in ST and DT cells by Western blot. As expected, SV40 LTAg protein is localized
in the nuclei. (B) Double-transduced, immortalized cells at early passage, showing
immunofluorescence staining for hTERT, with confirmation of 122 kDa specific band for hTERT
in DT cells. HeLa cells represent a positive control for expression of hTERT and native cells
represent a negative control.
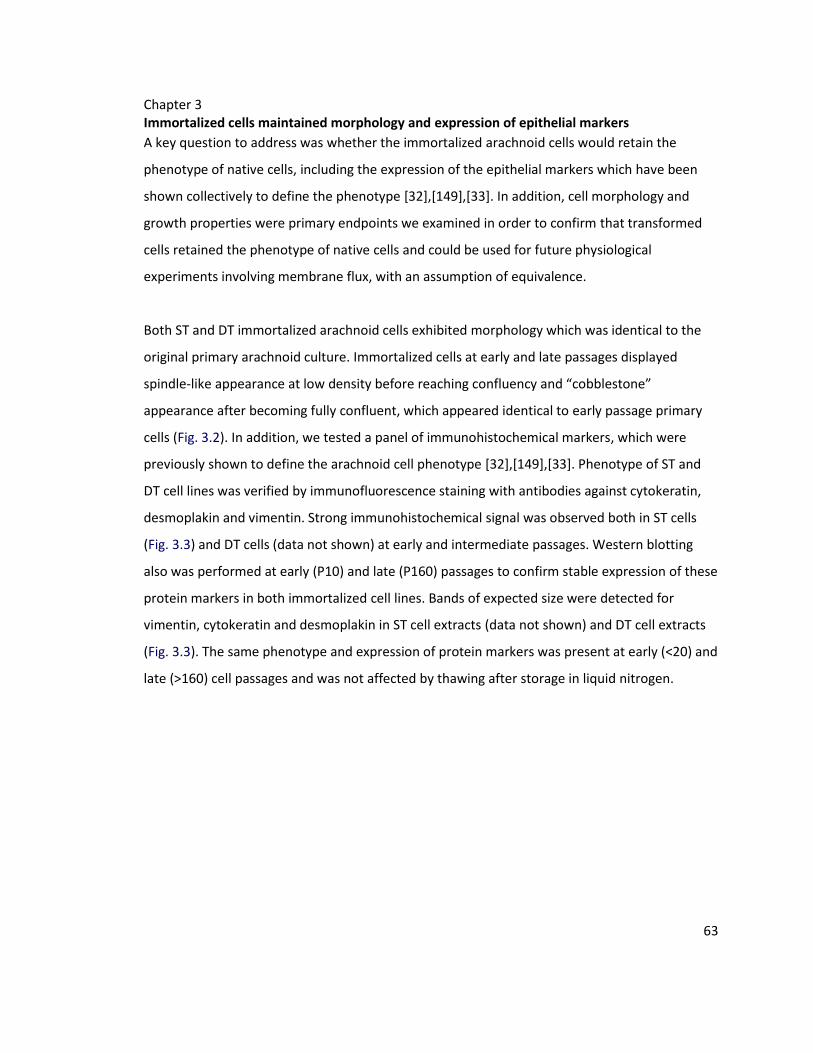
Chapter 3
63
Immortalized cells maintained morphology and expression of epithelial markers
A key question to address was whether the immortalized arachnoid cells would retain the
phenotype of native cells, including the expression of the epithelial markers which have been
shown collectively to define the phenotype [32],[149],[33]. In addition, cell morphology and
growth properties were primary endpoints we examined in order to confirm that transformed
cells retained the phenotype of native cells and could be used for future physiological
experiments involving membrane flux, with an assumption of equivalence.
Both ST and DT immortalized arachnoid cells exhibited morphology which was identical to the
original primary arachnoid culture. Immortalized cells at early and late passages displayed
spindle-like appearance at low density before reaching confluency and “cobblestone”
appearance after becoming fully confluent, which appeared identical to early passage primary
cells (Fig. 3.2). In addition, we tested a panel of immunohistochemical markers, which were
previously shown to define the arachnoid cell phenotype [32],[149],[33]. Phenotype of ST and
DT cell lines was verified by immunofluorescence staining with antibodies against cytokeratin,
desmoplakin and vimentin. Strong immunohistochemical signal was observed both in ST cells
(Fig. 3.3) and DT cells (data not shown) at early and intermediate passages. Western blotting
also was performed at early (P10) and late (P160) passages to confirm stable expression of these
protein markers in both immortalized cell lines. Bands of expected size were detected for
vimentin, cytokeratin and desmoplakin in ST cell extracts (data not shown) and DT cell extracts
(Fig. 3.3). The same phenotype and expression of protein markers was present at early (<20) and
late (>160) cell passages and was not affected by thawing after storage in liquid nitrogen.
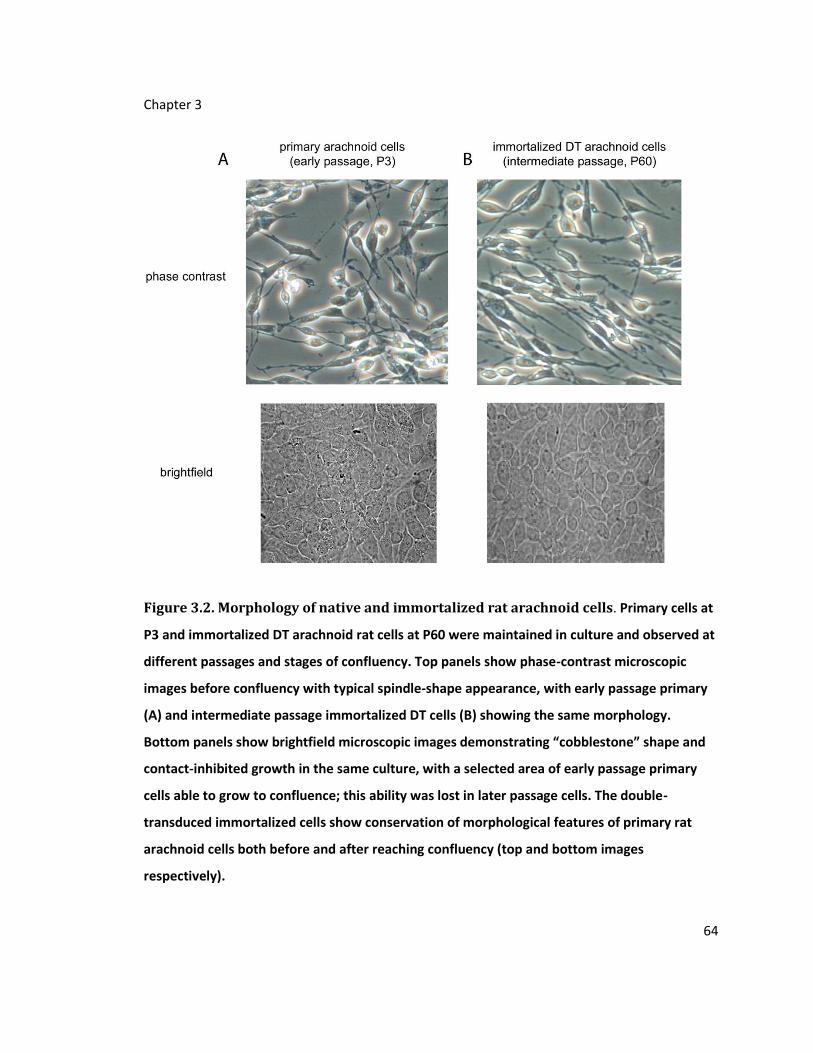
Chapter 3
64
Figure 3.2. Morphology of native and immortalized rat arachnoid cells. Primary cells at
P3 and immortalized DT arachnoid rat cells at P60 were maintained in culture and observed at
different passages and stages of confluency. Top panels show phase-contrast microscopic
images before confluency with typical spindle-shape appearance, with early passage primary
(A) and intermediate passage immortalized DT cells (B) showing the same morphology.
Bottom panels show brightfield microscopic images demonstrating “cobblestone” shape and
contact-inhibited growth in the same culture, with a selected area of early passage primary
cells able to grow to confluence; this ability was lost in later passage cells. The double-
transduced immortalized cells show conservation of morphological features of primary rat
arachnoid cells both before and after reaching confluency (top and bottom images
respectively).
Chapter 3
65
Figure 3.3. Immortalized rat arachnoid cells express characteristic epithelial
markers. Stability of expression of protein epithelial markers vimentin, cytokeratin and
desmoplakin in immortalized ST and DT cells was confirmed by immunostaining in situ and
Western blots. (A) Immunofluorescence staining of P20 single-transduced (ST) immortalized
cells, with specific antibodies against vimentin, cytokeratin, and desmoplakin. Similar staining
patterns were seen with intermediate and late-passage ST and DT cells. (B) Expression of
vimentin, cytokeratin and desmoplakin detected by Western blot in native arachnoid cells,
double-transduced early passage, and double-transduced late passage. GAPDH staining was
used as a loading control. Estimated molecular weights for each protein are indicated.

Chapter 3
66
Expression of LTAg and hTERT significantly increases telomerase activity in immortalized rat
arachnoid cells
Because the level of native rTERT was formerly unknown in primary arachnoid cells, we sought
to quantify the level of native rTERT and also to determine whether the level of native
telomerase activity was significantly affected by SV40 LTAg. We began by confirming the
immunohistochemical presence of telomerase and then quantified enzymatically active
telomerase with a standard TRAP assay, which was performed on naive, ST, or DT cells.
Telomerase activity is expressed in units of TPG where one unit corresponds to the number of
“TS primers” extended with at least three telomeric repeats in extract in 30 min at 30 °C during
the assay. We found that telomerase activity was 7.1+0.6 for primary cells, 12.1+0.3 for ST and
16.9+0.4 for DT cells (Fig. 3.4). These results indicate that primary rat arachnoid cells have a low
baseline level of rat telomerase activity, which was significantly increased by expression of SV40
LTAg and/or hTERT. Of note, the SV40 LTAg alone was sufficient to increase native rat
telomerase significantly, in this case 1.7-fold over endogenous rat telomerase activity.
Additional transduction with human telomerase further increased total telomerase activity to
2.4-fold. Although wild-type cells already had some endogenous rat telomerase activity, it is
important to note that they grew senescent over five doubling times.
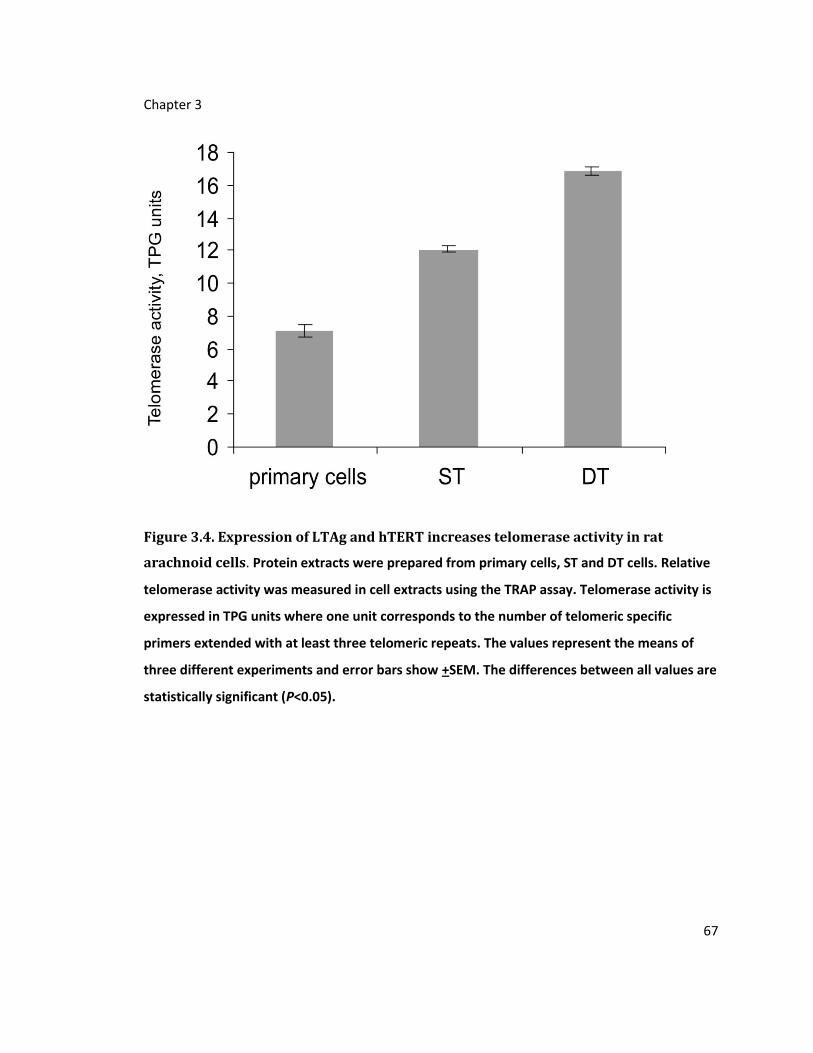
Chapter 3
67
Figure 3.4. Expression of LTAg and hTERT increases telomerase activity in rat
arachnoid cells. Protein extracts were prepared from primary cells, ST and DT cells. Relative
telomerase activity was measured in cell extracts using the TRAP assay. Telomerase activity is
expressed in TPG units where one unit corresponds to the number of telomeric specific
primers extended with at least three telomeric repeats. The values represent the means of
three different experiments and error bars show +SEM. The differences between all values are
statistically significant (P<0.05).
Chapter 3
68
Growth of immortalized arachnoid cells is superior to native cells
Despite the DT cells having significantly higher telomerase than ST cells, we found that the DT
cells were nearly equivalent in their growth profile. Because the defining feature of
immortalized cells is continued, stable growth under culture conditions, we characterized the
growth properties of ST and DT cells by doubling time measurements at early and late passages.
In the past, arachnoid cell lines which were initially presumed to be immortal were found to
undergo senescence or other phenotypic changes at P50 or earlier [97].
Fitting the data to a standard exponential growth model, we found that the doubling time in
two-dimensional culture plates was significantly decreased in ST or DT arachnoid cells compared
to native cells at both early and late passages (P<0.001), and there was also a small but
statistically significant difference in doubling time between ST and DT cells at both early and late
passages (P<0.001), with the ST cells growing slightly faster (Fig. 3.5). We found that this small
difference in doubling time between ST and DT made no practical difference in culture
technique, however, and ST and DT cells behaved equivalently at the early, intermediate and
late passages out to P160. There was a non-statistically significant difference between doubling
time in early vs. late passage ST and in early vs. late passage DT cells, but there was a highly
significant difference (P<0.001) between early and late passage native cells, which is consistent
with their known senescence after approximately P8.

Chapter 3
69
Figure 3.5. ST and DT immortalized arachnoid cells show enhanced replicative
capacity. Population doubling time of ST and DT cells were compared to primary rat
arachnoid culture at early and late passages. The growth rate of each cell culture was
determined as an increase in cell number over the course of 72 h. All counting experiments for
each cell line were done in triplicate. The error bars are not visible on the scale of the graph
due to small size. As noted in the text, there was no significant difference between ST cells at
early vs. late passage and no difference between DT cells at early vs. late passage. As
expected, however, the difference in doubling time between native cells at early vs. late
passage were highly significant, as was the difference in doubling time between the native
cells and immortalized cell lines.

Chapter 3
70
Seeding capability in three-dimensional collagen matrices was also measured qualitatively with
wild-type primary cells and immortalized cells. Using scanning electron microscopy (SEM), we
found that ST or DT cells at early (P10) and intermediate (P50) passages densely populated the
collagen matrix at an initial seeding density of 7.5X10³ cells/ml (Fig. 3.6) compared to wild type
cells which were senescent prior to even approaching confluence and were therefore unsuitable
for seeding collagen sponges. The initial density of seeding of native cells did not appear to
affect this obvious deficiency of non-immortalized cells; even when seeded at an increased
density of up to 2.5X10⁵ cells/ml the non-immortalized cells did not demonstrate any growth
approaching confluence on the three dimensional matrix.

Chapter 3
71
Figure 3.6. Immortalized cells exhibit enhanced capacity for growing on three-
dimensional support. Immortal ST arachnoid cells were seeded onto a collagen matrix
sponge and grown in vitro. (A) Scanning electron micrograph of immortalized rat arachnoid
culture on sponge with green false coloration. (B) Control blank sponge for comparison,
without cells seeded. Primary cells seeded onto sponges showed very sparse growth and
Chapter 3
72
qualitatively did not approach confluence (data not shown), with an appearance similar to a
blank sponge, irrespective of seeding density. Bar=500µm.
Membrane properties indicate an intact epithelial monolayer
In order to verify the structural integrity of our epithelial monolayer and provide supportive
evidence for tight junctions or desmosomes, TEER was directly measured in arachnoid cells and
in Caco-2 cells, a widely used model of paracellular epithelial transport which reliably forms tight
junctions [146]. In both cases, TEER was consistent with an intact epithelial barrier. For Caco-2
cells the TEER depends on the cell line and culture model but is typically 150–600 Ω∙cm2 [150],
with one recent source reporting a typical TEER value of 260+65 Ω∙cm2 [148] for early passage
cells. For type II MDCK cells, another cell line commonly used in studies of tight junctions and
epithelial transport, reference values for TEER are 200–300 Ω∙cm2 [146]. Because TEER is
dependent upon a closed epithelial barrier of confluent cells, our non-transformed primary
arachnoid cells did not grow adequately on Transwell membranes in order to assess TEER, and
those values were indistinguishable from a Transwell membrane without cells, 110+3.5 SEM
Ω∙cm2. TEER values of confluent immortalized arachnoid cells, adjusted for membrane
resistance, was 193+10 SEM Ω∙cm2 and 206+14 SEM Ω∙cm2 for Caco-2 cells plated under the
same conditions at density 1X10⁵/ml, which is within the published reference range.
After assessing the basic integrity of the monolayer, we proceeded to assess paracellular or
transcellular transport properties in the two-dimensional Transwell culture system using a
radiolabeled 14C inulin assay. In an experiment directly comparing arachnoid cells to Caco-2
cells, the intermediate passage immortalized DT arachnoid cell Papp was 8.6X10⁻⁶ with 95% CI +
3.6X10⁻⁶ and the Caco-2 cell Papp was 8.8X10⁻⁶ with 95% CI+3.7X10⁻⁶, suggesting paracellular
transport is blocked by confluent arachnoid cells or Caco-2 cells, and barrier properties were not
significantly different under identical conditions at confluence. These values are in accord with
reference values of similarly transported substances for Caco-2 cells. For example, the typical
Papp for mannitol or inulin solution for Caco-2 cells is in the 10-6 cm/s range [150],[148]. The
plot of dpm vs. time (Fig. 3.7) expressed as a concentration ratio [Cbasal]/[Capical] for arachnoid vs.
Caco-2 cells shows clear divergence in slopes with respect to control and a non-significant

Chapter 3
73
difference in slopes between arachnoid and Caco-2 cells (P<0.13), which suggests that the
transport behavior of the cell monolayer is very similar. While electron microscopic evidence of
tight junctions and further examination of transport properties for other substances will be
necessary for further characterization, these data strongly support the presence of an intact
epithelial monolayer.

Chapter 3
74
Figure 3.7. Radiolabeled transport study.
14C inulin was used to test paracellular transport in immortalized arachnoid cells compared to
Caco-2 cells. Due to poor growth on the Transwell supports, primary arachnoid cells were
indistinguishable from blank wells on preliminary TEER studies and are not included in this
analysis. We found equivalent slopes for confluent arachnoid and Caco-2 cells, which together
with TEER data suggest that the membrane has limited permeability to paracellular transport.

Chapter 3
75
Karyotype analysis of immortalized arachnoid cells
To assess the genomic stability of the single and double transduced cells, especially given the
high multiplicity of infection, we performed karyotyping analysis. We expected some
chromosomal rearrangements from the normal 21 pairs of rat chromosomes, as well as
potential differences between ST and DT cells. Karyotyping indicated a single, near-tetraploid
clone in ST cells, consisting of 75–78 chromosomes. The karyotype is 75–78,XX,-
1,del(1)(p11),add(2)(p11)x2,-3,-7,-9,-10,der(11)t(2;11)(q11;q23),-14,-15,-16,-17,+3-4mar.
Relative to a pure tetraploid complement, with four copies of chromosomes one through 20,
there was loss of one copy each of chromosomes #3, 7, 9, 10, 14, 15, 16 and 17. Structural
abnormalities included a deletion of the short arm of one chromosome #1, additional material
of unknown origin added to the short arms of two #2 chromosomes, an extra copy of the long
arm of chromosome #2 translocated to the distal long arm of a chromosome #11, and three
small marker chromosomes of unknown origin. In DT cells two related clones were present.
Clone 1, corresponding to the ST clone above, comprised 67% of metaphase cells tested (Fig.
3.8A). Clone 2, comprising the remaining 33% of metaphases, had the same abnormalities as
Clone 1, and in addition, a dicentric chromosome joining together the proximal short arms,
centromere, and long arms on one X and chromosome #2 in place of one X chromosome and
one chromosome #2, and deletion of part of the long arm of one chromosome #5 (Fig. 3.8B).
Additionally, in place of one normal chromosome #1 was a chromosome #1 with an apparent
large homogeneously staining region (HSR). Such HSR typically represent a region of gene
amplification. Clone 1 is the same as that detected in the ST line, but Clone 2 demonstrates
cytogenetic evolution.
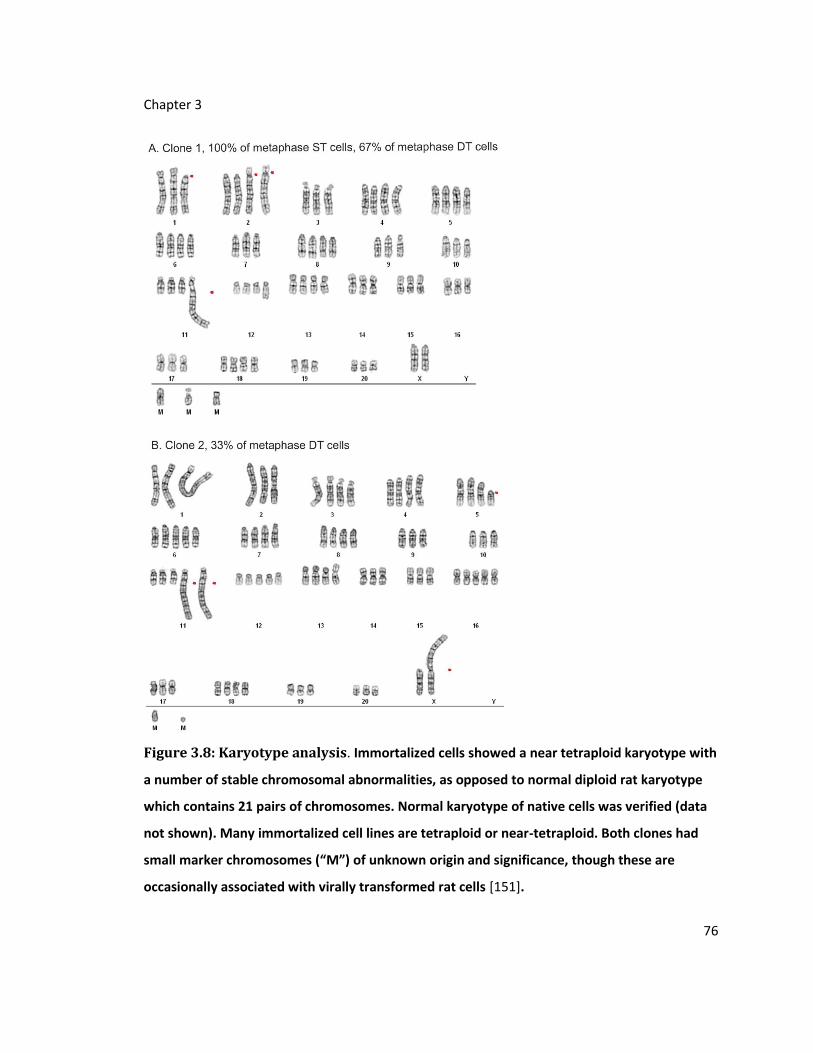
Chapter 3
76
Figure 3.8: Karyotype analysis. Immortalized cells showed a near tetraploid karyotype with
a number of stable chromosomal abnormalities, as opposed to normal diploid rat karyotype
which contains 21 pairs of chromosomes. Normal karyotype of native cells was verified (data
not shown). Many immortalized cell lines are tetraploid or near-tetraploid. Both clones had
small marker chromosomes (“M”) of unknown origin and significance, though these are
occasionally associated with virally transformed rat cells [151].

Chapter 3
77
Discussion
In this study, we report the first immortalization of primary arachnoid cells, as an initial step
toward manufacture of arachnoid cell bioscaffolds for modeling cellular transport properties.
We utilized both a one-step and a two-step retroviral transduction with LTAg and hTERT. If
desired, the two-step approach can be adapted to human source material with amphotropic
MMLV-based viral packaging. Irrespective of approach, we observed similar functional
properties of the ST and DT cells, which were clearly superior to native arachnoid cells in
doubling time and their ability to establish a confluent monolayer while maintaining a normal
phenotype.
Native rat arachnoid cells have a baseline level of rat telomerase activity which was significantly
increased by transduction with LTAg, and additional human telomerase did not change the
phenotype or augment the growth rate from the changes induced by LTAg, and in fact may have
lengthened it slightly. These results confirm prior reports that telomerase expression is
permissive in rodents [122], including the rat, and also suggest that telomerase is important for
immortalization in rat cells but it is not necessary to achieve the highest possible levels of
telomerase, perhaps only a threshold amount, in order to bypass senescence. Other
investigators [131] reported that double-transduced cells (SV40 LTAg+hTERT) had a shorter
doubling time than single-transduced cells (hTERT) in human meningioma cells. Our doubling
time for both ST and DT cell lines (<36 h) was considerably shorter than immortalized DT human
cells, which in the best case were 96 h [131], which could be a species specific feature or
alternatively, could be a result of extremely high levels of expression of the LTAg transgene.
Both ST and DT arachnoid cell lines stably express a combination of epithelial markers specific to
arachnoid cells, are capable of forming monolayers with restricted epithelial membrane
transport, and were able to grow on collagen sponges as well as two-dimensional membranes.
As a neural ectoderm derived tissue, the cells showed a high-level of cytokeratin and vimentin
intermediate filament expression at both early and late passages, and also demonstrated
expression of desmoplakin, an essential component of desmosomes. The immortalized cell lines
both showed extensive karyotypic changes post-transduction, including a near-tetraploid

Chapter 3
78
karyotype which is not unusual in transformed or cancer cells. In functional terms, there is no
obvious link between the observed aneuploidy and any specific gene loci, such as homologs of
NF2 on rat chromosome 14 and Rb on rat chromosome 15, and we have not performed any
more detailed characterization at the individual gene level.
Membrane transport properties of arachnoid cells are not currently well-known, but it is
thought that transcellular and paracellular transport occurs through these cells with an intact
CSF-blood barrier. We found indirect evidence of epithelial tight junctions with TEER and
radiochemical data, with a cellular membrane resistance similar to Caco-2 cells, as well as an
immunohistochemical pattern suggesting desmosomes, but further work will be needed to
characterize the cell membranes with transmission electron microscopy. Modeling of
microscopic arachnoid villi in vitro will provide a unique system for studying transport properties
of arachnoid cells and understanding molecular mechanisms of water flux and solutes along
with related clinical problems. Planned techniques for studying arachnoid transport include
Raman spectroscopy and vesicular labeling with radiolabeled substrates in two-dimensional
Ussing chambers. It is hypothesized that our three-dimensional system also will provide a more
physiologically relevant model of water and ion flux than standard two dimensional models.
Although other models currently exist or studying arachnoid pathophysiology, including
meningioma tissue and cell lines, stable arachnoid cell lines permit study not only of the normal
arachnoid physiology but also (by chemical treatment or adaptation of our immortalization
methods to genetically engineered animals) provide a potentially more physiologic method to
study hydrocephalus and other abnormal processes. Aside from understanding details of water
and solute transport in arachnoid granulations, our ultimate goal is to create a bioartificial shunt
using immortalized cells on a collagen scaffold, which could replicate properties of normal
arachnoid cells and might obviate the need for CSF shunting in hydrocephalus.

Chapter 4
79
Chapter 4: The Characterization of Arachnoid Cell Transport: Paracellular
transport and Blood CSF Barrier Formation of Arachnoid Cells
Defining barriers: the Paracellular Transport of Arachnoid Cells Perhaps the most two most important role for arachnoid cells are the formation of the blood
CSF barrier isolating the brain from the remainder of the body, and the removal of CSF and
other substances out of the brain. These two tasks are related in that any barrier demands that
certain substances are selectively transported. For almost all substances, barrier transport
implies passage through either transcellularly, paracellularly, or in sparsely populated tissue,
through extracellular matrix. Barriers may be defined in a number of ways: the hydrophobicity,
the size, the origin, or a number of other characteristics of the substance being moved. The
blood brain barrier traditionally has been defined by size, but within the scheme of cellular
mechanisms of transport, its stratification does not shed light on how substance transport
except in the context of sieves with measurable pore size. This is particularly true in light of
current concepts of the blood brain barrier where multiple layers and multiple cell types may
play a role in admittance of substances into the brain. The blood CSF barrier however is simpler,
with the cell types more uniform. Yet their geometry indicates a variety of mechanisms may be
at play. We therefore broke down the various mechanisms of transport and focused on
paracellular movement in this chapter. Not only is it likely the dominant means by which CSF
transfer to the vascular compartment, it most likely is responsible for the classical size
differential character in barriers.
The work is carried out by Eric Hansen, Christopher Janson, Alexander Bryan, and Cornelius Lam.
The manuscript is written by Cornelius Lam

Chapter 4
80
Introduction
Cerebrospinal fluid (CSF) is important for the central nervous system’s support and
maintenance. It buffers the nervous tissues mechanically and chemically, serves as a vehicle for
the transport of important substances, and removes waste and debris.[152] Arachnoidal CSF
egress is considered one of the major routes of CSF removal. [31] How this occurs is unknown,
but given the aqueous nature of CSF, the primary mean is thought to be paracellular. As a major
component of the blood-CSF-barrier (BCB) and sink to the CSF, the arachnoid stands at the
junction between the vascular system and the intracranial space. This gateway is similar to the
blood brain barrier in that polar substances are restricted in their movement [153]. Arachnoidal
tissue exists in multiple forms including membranes, dense granulation caps, and porous central
cores. The degree of intracellular or extracellular matriceal pathway involvement is probably
dependent on this local structure of the arachnoid tissue, but preliminary tracer studies have
shown that permeabilities of low molecular weight substances in monolayers parallel that of the
blood brain barrier.[36] [154] Tight junctions crucial to the integrity of the BCB and regulation of
paracellular transport have been seen in arachnoid cell-cell contacts with transmission electron
microscopy.[155] Holman recently demonstrated these junctional complexes on cultured
arachnoid monolayers as well. These complexes maintain pathway integrity in conditions of
osmotic and pressure gradient challenges. The geometric path in the paracellular space could
be altered during these conditions, regulating the outflow of fluid out of the brain and
intracranial cavity probably by a combination of complex feedback systems involving second
messengers and physical alterations in the cells.
Because of the similarities in permeabilities of ionic substances in arachnoid cell mediated blood
CSF barrier and blood brain barrier (BBB), the demonstration of regulated flow in arachnoid cell,
and the importance of arachnoid cells in the removal of cerebrospinal fluid from the brain, we
characterize the paracellular transport in an immortalized cell line of arachnoid cells developed
in our laboratory (see [156] for cell line description) and investigate the physiologic mechanisms
that alter this transport in this paper. Two important mechanisms in tight junction regulation
are the calcium and cAMP second messenger pathways.[157][158] They regulate the various
intercellular junctional proteins, such as claudin, as well as intracellular systems important for

Chapter 4
81
transport. Given the cell’s barrier capabilities, we expect the molecular dynamics to be similar
to the blood brain barrier. However, an overarching element of contrast however between
arachnoid cells and brain endothelial cells is that the “neurovascular unit” is absent (see [159]
for review). Lacking the astrocytic, neuronal, and pericytic influences in the BBB junctional
complex, we believe the mechanisms of the BCB maintenance to be under different control and
regulation. To that end, we believe the control mechanisms to be simpler and to be less finely
controlled.
Methods
Production of retrovirus containing SV40 LgTAg and hTERT and retroviral transduction
The generation of immortalized arachnoid cells has been previously presented.[156] Briefly,
retroviral constructs pBABE-neo-hTERT and pBABE-puro-SV40LT, containing hTERT and SV40
LTAg along with the G418 and puromycin resistance genes, were obtained. The purified
plasmids were then used to transfect EcoPack2 cells (Clontech), which are 293HEK ecotropic
feeder cells containing retroviral packaging genes. Cells were seeded 12-18 hrs prior to use at 5
x 105 cells in 25 cm2 flasks. Then 5mg of pBABE-puro-SV40LT was combined with Fugene
reagent (Roche) and OptiMem (Invitrogen) serum-free media in 250 ml total reaction volume
with 3:1 ratio of Fugene:DNA. This was incubated for 30 min and added to each flask of 293HEK
ecotropic feeder cells, with 3ml of serum-containing media per flask.
Arachnoid cells were harvested from 21-23 day old male Sprague-Dawley rats. At passage 3 or 4,
the arachnoid cells were replated into a Biocoat six-well plate (BD Biosciences). Viral
transduction was performed when the cells reached 60-80% confluence. Clarified viral
supernatant containing BABE-puro-SV40LT was applied sequentially to the arachnoid cell
primary culture. Target cells were initially at a density of 4 x 10⁴ cells per well of a six-well plate.
The media was aspirated and 3 ml virus-containing media was added per well. Polybrene
(Millipore) was then added to a final concentration of 4 mg/ml. Cells transduced with pBABE-
puro-SV40LT were selected over 14 days with puromycin (Sigma).

Chapter 4
82
Functional transport assay: TEER, marker, and size differential transport study
4 x 10⁵ immortalized rat arachnoid cells were plated in each of the 3 top wells of a 6-well
Transwell plate (Corning Inc. Corning, NY; Cat no. 3450) (4.67cm2 per well and 0.4 µm pore
size), and incubated for 3-5 days depending on when the cells became confluent. The 3 bottom
(blank) Transwells were used as a negative control. A separate 24-well plate Transwell (Corning
Inc. Corning, NY; Cat no. 3470) (0.3 cm2 per well and 0.4 µm pore size) was used for TEER
studies. Cells were plated at 3 x 10⁴ cells per well and grown to confluency. Culture media in
Transwell plates was removed and pre-warmed media was added into wells (apical 2 ml,
basolateral 3 ml). The 3H-mannitol stock solution was prepared as 1ml radiolabeled mannitol
per 1000 ml of assay buffer [LR1], for a final mannitol concentration of 82nM and specific
activity 1 mCi/ml. Buffer was removed from the proximal (apical) compartments and pre-
warmed radioactive solution was added to apical chambers, with 2 ml to each chamber. The
plate was put on gentle shaker at 37°C and 200 µl samples were taken from both compartments
in each well at 15, 30, 60, 90, 120 minutes and replaced with an equal volume of respective
buffer. Inulin-[Carboxyl-14C] (50 mCi/mmol, Fisher Scientific Inc. Cat #1108650) and [14C] Urea
(54 mCi/mmol, Amersham, Piscataway NJ) were prepared as 1 ml of radiolabeled inulin per 1000
ml assay buffer. For the FITC labeled Dextran (10, 40, and 70 kilodaltons) (Cat no. 129K5304,
83797PJ, 069K5316. Sigma-Aldrich Co., St. Louis, MO) experiment, 1 x 10⁵ immortalized rat
arachnoid cells were seeded and tested in a similar manner. All signals were measured using a
Packard SpectraCount photometric microplate reader (measured at 520 nm)(Packard
Instrument Co., Meriden, CT) with control plates subtracted out. TEER studies were performed
using a transepithelial voltmeter (World Precision Instruments) according to the manufacturer’s
recommendations.
The amount of tracer crossing the monolayer was reported as arachnoid permeability (Parachnoid,
cm/s). The cleared volume was calculated by dividing the concentration in the receiver
compartment by the product concentration in the donor compartment at each time point.
Average cumulative volume cleared was plotted versus time and the slope was estimated by
linear regression analysis to give the mean and the standard deviation of the estimate. The P
value for the arachnoid monolayer alone was obtained as follows: 1/Parachnoid overall= 1/P(recorded) -
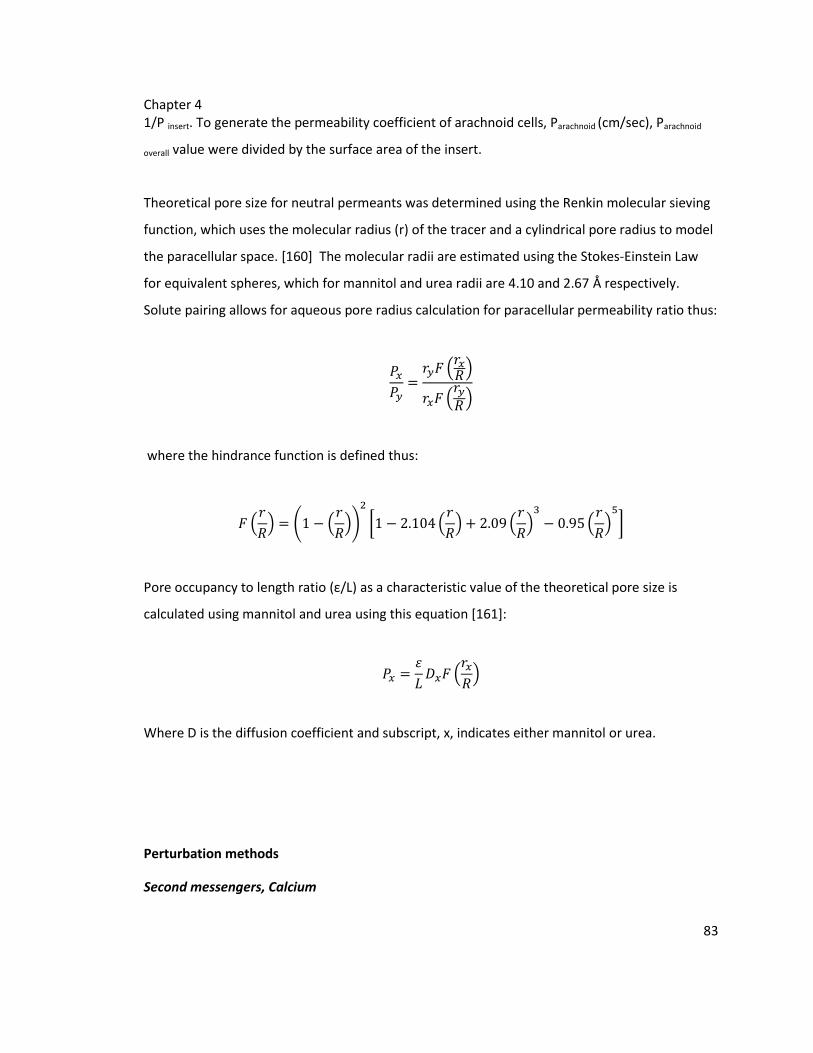
Chapter 4
83
1/P insert. To generate the permeability coefficient of arachnoid cells, Parachnoid (cm/sec), Parachnoid
overall value were divided by the surface area of the insert.
Theoretical pore size for neutral permeants was determined using the Renkin molecular sieving
function, which uses the molecular radius (r) of the tracer and a cylindrical pore radius to model
the paracellular space. [160] The molecular radii are estimated using the Stokes-Einstein Law
for equivalent spheres, which for mannitol and urea radii are 4.10 and 2.67 Å respectively.
Solute pairing allows for aqueous pore radius calculation for paracellular permeability ratio thus:
where the hindrance function is defined thus:
Pore occupancy to length ratio (ε/L) as a characteristic value of the theoretical pore size is
calculated using mannitol and urea using this equation [161]:
Where D is the diffusion coefficient and subscript, x, indicates either mannitol or urea.
Perturbation methods
Second messengers, Calcium

Chapter 4
84
Extracellular calcium was investigated using ethylenediaminetetraacetic acid, EDTA (MP
Biomedicals, Solon, OH), as a chelator at 20mM concentration. Permeability studies were
performed at maximal effective dose as determined by dose response curve for the arachnoid
cells at 15 minutes after treatment initiation. Dosing and timing for transport studies was
determined from temporal data gathered from serial TEER values measured at 5 minute
intervals for 90 minutes at concentrations of 1, 5, 10, 20, and 40 mM EDTA. Calcium was also
increased in culture media to a concentration of 4mM from 1.8 mM. Intracellular calcium was
perturbed in two ways. Intracellular calcium was decreased by using the calcium channel
blocker, verapamil (MP Biomedicals, Solon, OH), at a concentration of 5 µM.[162] Intracellular
calcium was also increased by using a calcium ionophore, ionomycin at concentration of 10
µM(Calbiochem, La Jolla, CA) (0.0015%w/v).
Second messengers, cAMP
cAMP (Sigma Aldrich, ST. Louis MO) was added directly into the culture media at a
concentration of 10 µM. Intracellular cAMP was perturbed using three different mechanisms.
Adenylyl cyclase was augmented directly by Forskolin (MP Biomedicals, Solon OH), (50
µM)[163], and indirectly through G protein induction with isoproterenol (Sigma-Aldrich, St.
Louis, MO) (10µM)[164]. cAMP breakdown was also inhibited by using Rolipram (MP
Biomedicals, Solon, OH)(10 µM), a phosphodiesterase type 4 inhibitor.[165] Synergistic and
cAMP ceiling effects of the drugs were studied using forskolin/isoproterenol,
rolipram/isoproterenol, and rolipram/forskolin in combination.
Junctional complex disruption (tight junctions), Protamine
Protamine (MP Biomedicals, Solon, OH) diluted in PBS (BioWhittaker, Walkersville, MD) and
buffered in Krebs-Ringer (27.4 mM NaCl, 1 mM KCl, 0.2 mM MgSO4·7H2O, 0.06 mM KH2PO4, 0.06
mM NaH2PO4·H2O, 2.8 mM Trizma base, 0.56 mM CaCl2·2H2O, and 1.8 mM glucose) was added
to the culture media to a final concentration of 10 mg/ml (pH 7.4, adjusted with HCl after
protamine addition).[166] The culture media bathing the monolayers were gently withdrawn

Chapter 4
85
and replaced by the buffered protamine to both the apical and basolateral compartments. The
control buffer solution not containing the polycation was delivered in the same volume.
Junctional complex disruption (tight junctions), Serum free conditions
Cells were passaged onto wells containing serum free media for at least 3 days. Cell viability in
serum-free conditions was first verified with qualitative assessments of growth and cell
morphometry. When cells in both serum-free and serum-containing media were in confluency,
TEER values were recorded and permeability measurements performed.
Junctional complex disruption (tight junctions), Dexamethasone studies
Cells were treated with dexamethasone (Sigma Aldrich, St. Louis, MO) at a concentration of
10µM. After 24 hrs, the permeability of cells was performed by taking measurements every
hour for 8 hrs. Cells receiving the control buffer solution were measured during the same time
periods. Given the potential mechanism of steroids on protein induction, the experiments were
repeated 3 days after being subjected to dexamethasone. TEER was measured over 10 days at
concentrations of 1, 5, and 10µM of dexamethasone.
Junctional complex disruption (gap junctions) 18β-glycyrrhetinic acid studies
To determine whether gap junctions contribute to the paracellular pathway, TEER and mannitol
measurements were performed on cells treated with connexin disruptor, 18β-glycyrrhetinic acid
(18β-GA)(Fisher Scientific, Fair Lawn, NJ). Confluent cells were treated for 30 minutes of 20 mM
18b-GA or vehicle. Exposure time and concentration was determined from dose and time
response curves. Timing of transport studies was determined from temporal data gathered from
serial TEER values measured at 5 minute intervals for 90 minutes at concentrations of 1, 5, 10,
20, and 40 mM 18- β-GA.
Results
Junctional Protein expression: Previously we have demonstrated the arachnoid phenotype in
these cells. We now examined the proteins most important in the barrier development in the
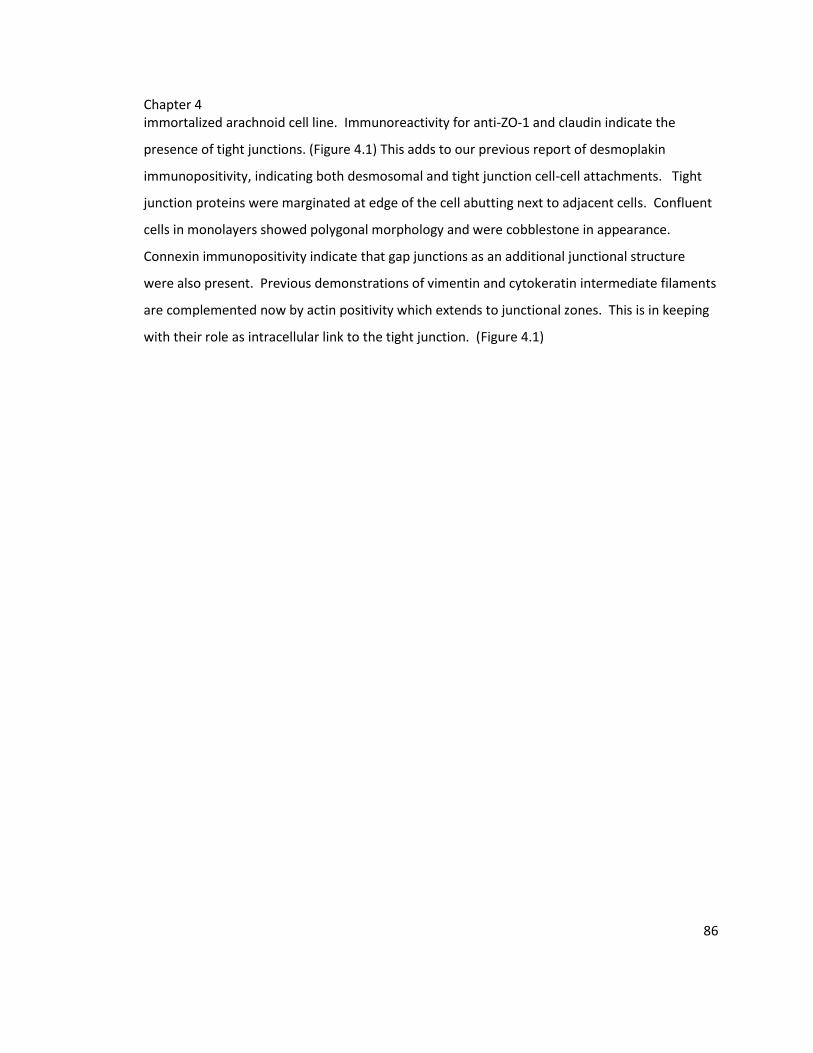
Chapter 4
86
immortalized arachnoid cell line. Immunoreactivity for anti-ZO-1 and claudin indicate the
presence of tight junctions. (Figure 4.1) This adds to our previous report of desmoplakin
immunopositivity, indicating both desmosomal and tight junction cell-cell attachments. Tight
junction proteins were marginated at edge of the cell abutting next to adjacent cells. Confluent
cells in monolayers showed polygonal morphology and were cobblestone in appearance.
Connexin immunopositivity indicate that gap junctions as an additional junctional structure
were also present. Previous demonstrations of vimentin and cytokeratin intermediate filaments
are complemented now by actin positivity which extends to junctional zones. This is in keeping
with their role as intracellular link to the tight junction. (Figure 4.1)
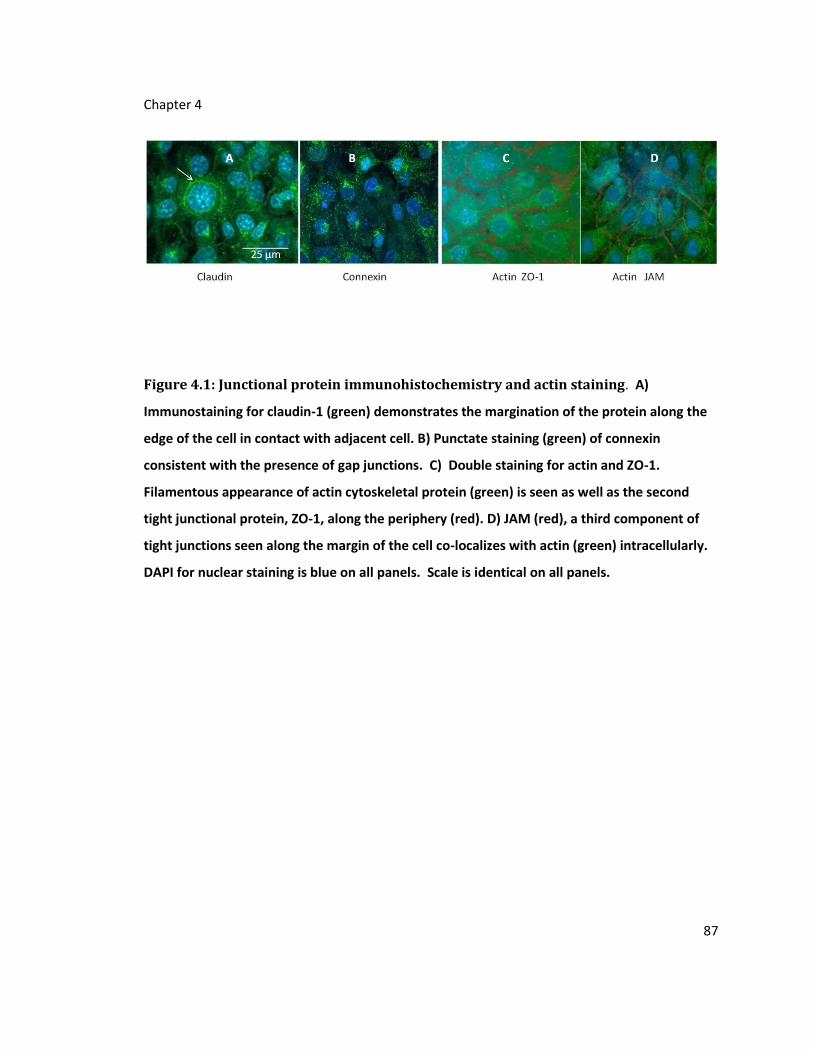
Chapter 4
87
Figure 4.1: Junctional protein immunohistochemistry and actin staining. A)
Immunostaining for claudin-1 (green) demonstrates the margination of the protein along the
edge of the cell in contact with adjacent cell. B) Punctate staining (green) of connexin
consistent with the presence of gap junctions. C) Double staining for actin and ZO-1.
Filamentous appearance of actin cytoskeletal protein (green) is seen as well as the second
tight junctional protein, ZO-1, along the periphery (red). D) JAM (red), a third component of
tight junctions seen along the margin of the cell co-localizes with actin (green) intracellularly.
DAPI for nuclear staining is blue on all panels. Scale is identical on all panels.
Chapter 4
88
Marker and size differential studies, A to B B to A: Mannitol, urea, and inulin were used as
benchmark for paracellular transport in this arachnoid cell line.(Figure 4.2A-C) Using uncoated
polyester filter with confluent monolayers, we determined first stable TEER values and
consistent permeability coefficients and compared them to primary cell coefficients as well as
CACO2 as control model. Monolayers of the immortalized cell lines show differential
permeability to classic markers of barrier; inulin, mannitol, and urea permeabilities are
1.0+.29x10-6, 0.8+.18x10-6, 2.9+1.1x10⁻⁶ cm/s (+ indicates s.e.) respectively, which were similar
to primary cell cultures. (Table 4.1) In addition, cells demonstrated size delimited differences in
barrier separation when using 10-, 40-, and 70-kDa FITC-dextran as tracers. The monolayers
were studied with tracers placed in the basolateral (B) side and apical (A) side. (Figure 4.2D-E)
Directionality was not statistically different suggesting a non-intracellular mechanism of
transport (Figure 4.2F) and is consistent with paracellular movement.
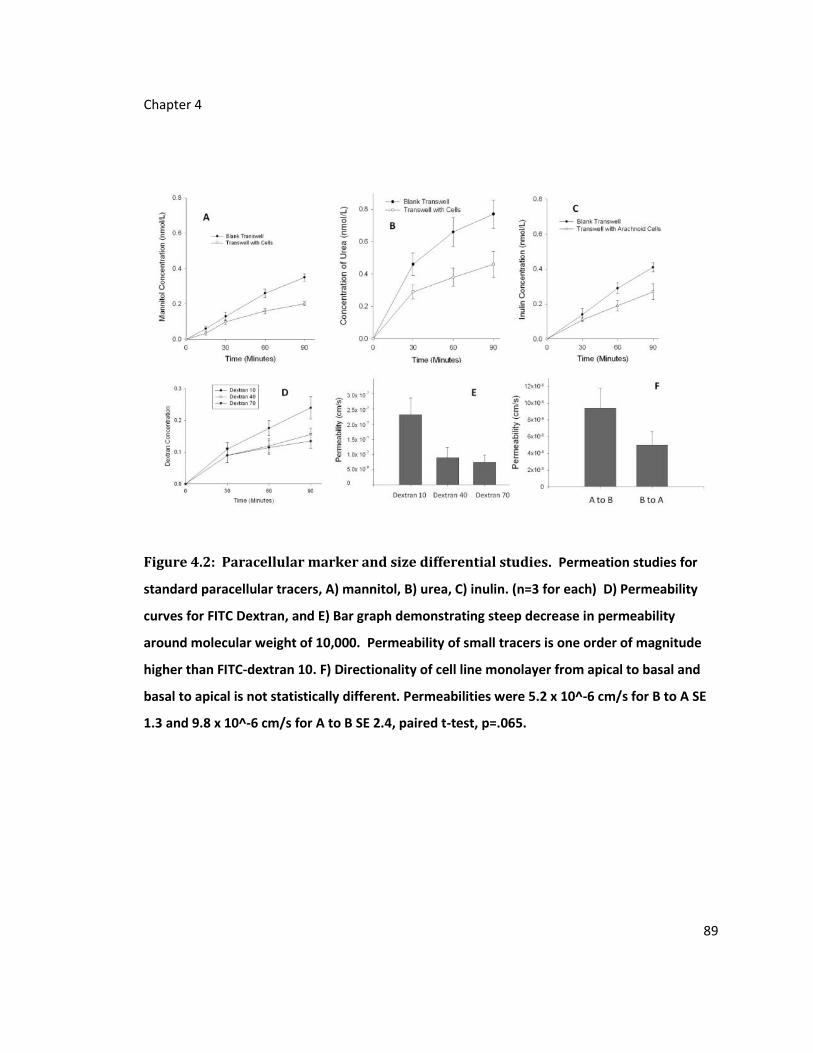
Chapter 4
89
Figure 4.2: Paracellular marker and size differential studies. Permeation studies for
standard paracellular tracers, A) mannitol, B) urea, C) inulin. (n=3 for each) D) Permeability
curves for FITC Dextran, and E) Bar graph demonstrating steep decrease in permeability
around molecular weight of 10,000. Permeability of small tracers is one order of magnitude
higher than FITC-dextran 10. F) Directionality of cell line monolayer from apical to basal and
basal to apical is not statistically different. Permeabilities were 5.2 x 10^-6 cm/s for B to A SE
1.3 and 9.8 x 10^-6 cm/s for A to B SE 2.4, paired t-test, p=.065.

Chapter 4
90
Pore size and pore occupancy:
Using the Renkin hindrance function for mannitol and urea, the theoretical pore size is
calculated to be 11Å and the occupancy to pore length ratio to be 0.7 to 0.8 cm-1. (Table 4.1)
Others have shown that anionic forms of tracers tend to have lower permeabilities than those of
equivalent molecular weight in caco2 cells.[160] When using inulin, pKa of 6, permeability
plateaued to the same level as mannitol. This could be due to wider paracellular space of
arachnoid and the mild acidity of inulin.

Chapter 4
91
Table 4.1: Transport parameters in arachnoid cell line
m.w. F(r/R) P (cm/s) ε/L
(cm-1
)
D (cm2/s) R(Å) pKa
urea 60 .297 2.9+1.1x10⁻⁶
.80 1.22X10⁻⁵
(S-E
eqn*)
2.67 [167] Neutral
mannitol 182 .125 0.8+.18x10-6
.72 8.9X10⁻⁶
(S-E
eqn,[168]
4.10 [167] Neutral
inulin 5000-
5500
1.0+.29x10-6
2.9X10⁻⁶
(S-E
eqn, [168]
15 [169]
11[168]
6.33
FITC-
Dextran 10
10,000 2.3+.56X10-7
1.2x10⁻⁶
[170] 23 [169]
17.8[170]
9-10
FITC-
Dextran 40
40,000 8.9+3.3X10⁻⁸
.47x10-6
[170] 46[170] 9.1
FITC-
Dextran 70
70,000 7.4+2.3X10⁻⁸
.37x10-6
[170] 58 [170]
6.7
*S-E eqn = Stokes Einstein equation

Chapter 4
92
Perturbation Studies
Calcium
Calcium is known to be important in the regulation of adherens junctions and tight
junctions.[171] Increasing extracellular calcium up to 10mM did not increase TEER nor
permeability of mannitol. However, extracellular chelation with EDTA resulted in an increase in
permeability consistent with other junctional models such as MDCK.[172](Figure 3A) Chelation
effects occurred within 15 minutes of drug addition, and were dose dependent.(Figure 4.3B-C)
Effects were persistent until reversal by washing the cells with normal media. Tight junction
also depends on intracellular calcium as a second messenger for modulation. We used a calcium
channel blocker, verapamil, which did not alter permeability of mannitol significantly. When we
raise intracellular calcium stores via ionomycin, permeability increased. (Figure 4.3D) This is
consistent with data that suggest tight junction formation is disrupted only by certain
intracellular compartments.[173]
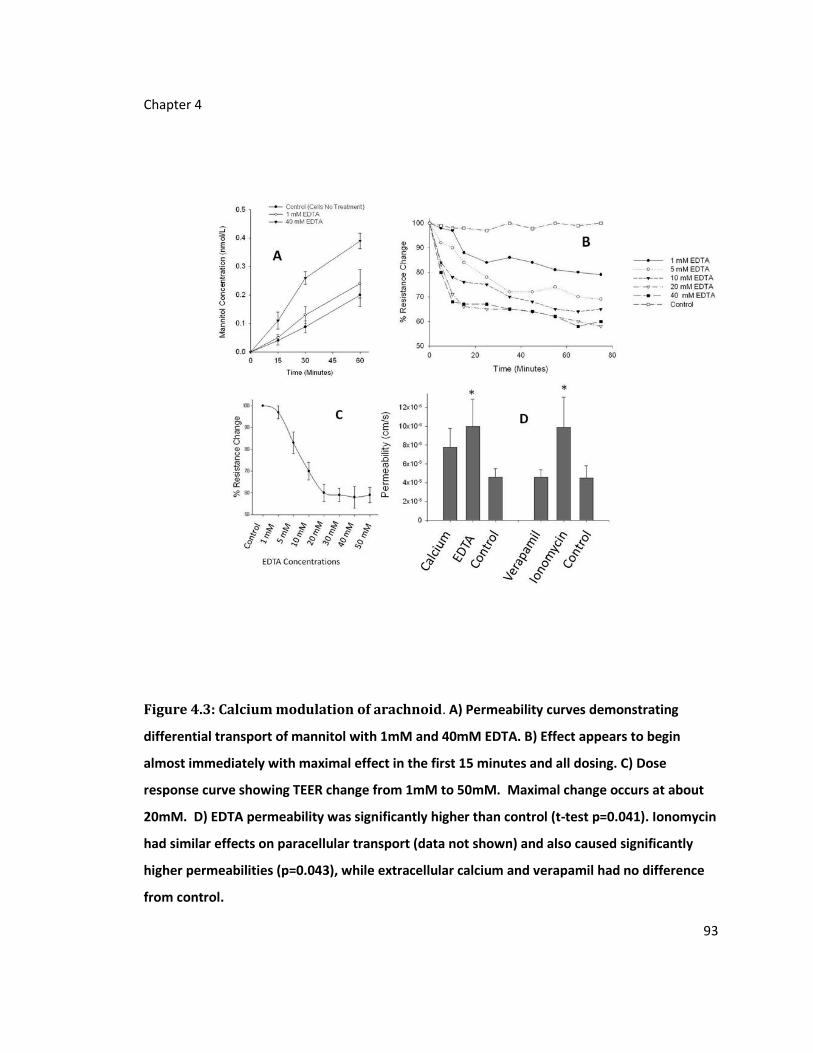
Chapter 4
93
Figure 4.3: Calcium modulation of arachnoid. A) Permeability curves demonstrating
differential transport of mannitol with 1mM and 40mM EDTA. B) Effect appears to begin
almost immediately with maximal effect in the first 15 minutes and all dosing. C) Dose
response curve showing TEER change from 1mM to 50mM. Maximal change occurs at about
20mM. D) EDTA permeability was significantly higher than control (t-test p=0.041). Ionomycin
had similar effects on paracellular transport (data not shown) and also caused significantly
higher permeabilities (p=0.043), while extracellular calcium and verapamil had no difference
from control.

Chapter 4
94
cAMP
cAMP is known as a second messenger that prevents increased endothelial permeability under
the influence of permeability augmenters.[174][175]. We looked at the role of cAMP alone on
the effects on paracellular transport and did not find a change in TEER nor mannitol
permeability. Rolipram, a PDE4 inhibitor, increased intracellular cAMP and caused a significant
decrease in permeability. Likewise, the beta 1,2 agonist, isoproterenol decreased
permeability.(Figure 4.4A) When used in combination, isoproterenol and rolipram did not cause
a more marked effect nor isoproterenol and forskolin, a direct adenylyl cyclase agonist. Also,
the TEER did not change. (Figure 4.4B) This may indicate a ceiling effect in the cAMP pathway.
Forskolin alone and forskolin and rolipram did not induce much change in the paracellular
permeability. (Figure 4.4C) Application of cAMP modifiers did not alter actin nor tight junction
protein expression. (Figure 4.4D-E)
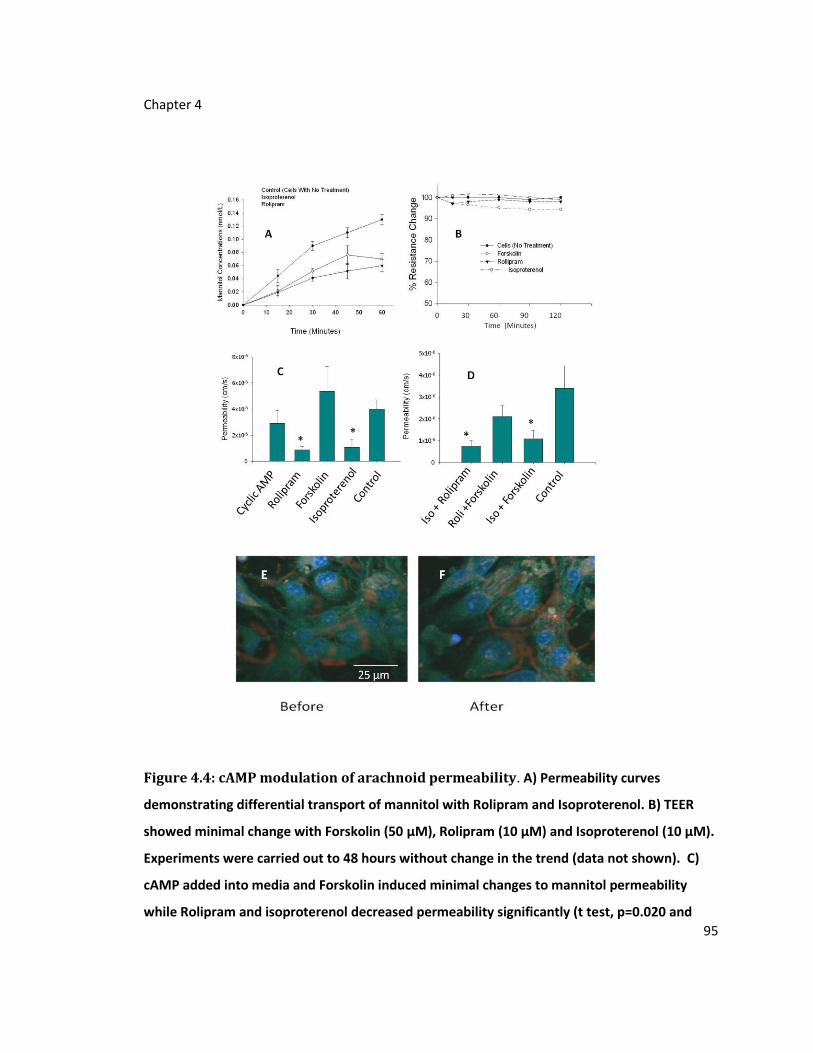
Chapter 4
95
Figure 4.4: cAMP modulation of arachnoid permeability. A) Permeability curves
demonstrating differential transport of mannitol with Rolipram and Isoproterenol. B) TEER
showed minimal change with Forskolin (50 µM), Rolipram (10 µM) and Isoproterenol (10 µM).
Experiments were carried out to 48 hours without change in the trend (data not shown). C)
cAMP added into media and Forskolin induced minimal changes to mannitol permeability
while Rolipram and isoproterenol decreased permeability significantly (t test, p=0.020 and

Chapter 4
96
0.024 respectively). D) When drugs were used in combination, permeability did not decrease
further. E) Before and F) After addition of Isoproterenol and Rolipram, cells showed similar
appearance in ZO-1 (red) and actin (green) staining.
Junctional proteins
We studied the tight junctions directly using three means and gap junctions by one. Gap
junction was disrupted by 18β-GA rapidly as well in a dose dependent manner. (Figure 4.5A-C)
Effect was seen within 10 minutes of drug application resulting in an approximately 3 fold
increase in mannitol permeability. Serum free conditions should disrupt paracellular barrier by
delocalizing the tight junction nonspecifically, while protamine affects the tight junctions by
disrupting cytoskeletal attachment to the tight junctions and downregulation of claudin.
Dexamethazone up-regulates claudin potentially tightening the tight junction decreasing
permeability. Serum free conditions did not alter mannitol permeability despite several days of
culture, nor did prolonged (days) exposure to dexamethazone. (Figure 4.5D) Protamine
however significantly increases permeability within several minutes of drug application.

Chapter 4
97
Figure 4.5: Perturbation of junctional proteins on arachnoid paracellular transport.
A) 18-β-GA disrupted barrier properties of the arachnoid (t-test, p=.045). Permeability curves
of paracellular tracer, mannitol, altered by variable concentrations of 18-β-GA.B) Effect of 18-
β-GA began almost immediately and plateaued at about 30 minutes. C) 18-β-GA appears to
alter permeability in a dose response manner as manifested by TEER D) Dexamethazone,
serum free conditions have minimal effect on mannitol permeability while protamine
disrupted barrier formation significantly (t-test p=0.042).
Discussion
The barriers that surround the central nervous system are critical for its homeostasis and its
protection. While the blood brain barrier has been investigated intensively, only recently has
Chapter 4
98
much attention been paid to the blood CSF barrier. Even so, the focus has been on the
production side of cerebrospinal fluid, namely at the choroid plexus, but the gateway to the
egress of CSF and the interface of blood to the CSF at the arachnoid granulations and membrane
has largely been ignored. We have previously developed an immortalized cell line of arachnoid
cell [156] and demonstrated that it forms barriers similar to monolayer models of the BBB.[154]
Because of the importance of paracellular transport to the blood CSF barrier, we focus on
characterizing this extracellular component of the arachnoid CSF sink. Paracellular transport is
governed by a variety of mechanisms and components: cell height, paracellular space tortuosity,
tight junctions, and gap junctions. Tight junctions are made up of several proteins including
claudin, which is under the regulation of calcium-dependent PKC activators. The PKA pathway
is important as well; cAMP activates PKA which impacts on cell-cell adhesion via RhoA inhibition.
Therefore, not only are calcium and cAMP critical for routine cellular functions, but also the
regulation of paracellular transport.
Paracellular Transport Studies
Dextran
Previous studies have indicated paracellular junction does not permit free passage of
macromolecules of 3 nm through the interendothelial junctions[176]. If this is the case, then
passage of higher molecular weight dextran should not occur. Others have demonstrated
transvesicular transfer in arachnoid cells before.[36] This may compound an accurate recording
of paracellular rate. In caco2 cells, macromolecules may pass through albeit with permeability
coefficients two orders of magnitude smaller than standard paracellular tracers.[169] This may
be due to either creation of transcellular transport or widening of the paracellular space. In
order to insure that vesicular transport does not interfere with our paracellular transfer
determination in the immortalized arachnoid system, the dextran was carried out over a wide
geometric range and molecular weights. At approximately 10,000 daltons, the permeability
began changing over an order of magnitude which clarified the mark at which the blood CSF
barrier lies.
Equivalent pore size calculation

Chapter 4
99
Determination for theoretical pore size is useful in characterizing paracellular transport. It
incorporates features of the paracellular space including tortuosity, gap width, cell height,
lateral spaces and various junctional protein hindrances. While of limited anatomic accuracy,
pore size can use charge, molecular radius, and other rate-determining physicochemical
properties to help predict permeability of various substances. We first determined the validity
of using this calculation by determining size limitations of the paracellular space. The Renkin
hindrance equation is valid for r/R under 0.4. r/R ratio in the Renkin sieving function can
exaggerate the diffusional resistance and underestimate pore radius otherwise. Using
paracellular markers of neutral pKa for experimental determination would decrease solute to
pore wall interactions. Our calculation of approximately 11Å indicates pore size to be larger than
caco-2 cells (~5.2Å)[160].
Calcium
Calcium is a second messenger for PKC, but PKC effect on paracellular permeability is
variable.[177][178] PKC activation helps assemble tight junctions but can impair established
junctional integrity. [179] The PKCα isoform mediates disassembly via actin mediated cell
contraction and is calcium and DAG-dependent.[180][181][182] PKCβ, also calcium and DAG-
dependent, increases endothelial permeability [183] as indicated by PKC beta 1 gene transfer in
a microvascular endothelial cell line. [184] Intracellular calcium is considered a key regulator in
cell contraction and junctional disassembly [185][186] and is increased with release from
endoplasmic reticulum stores.[187] Tight junction modulation by intracellular calcium may also
proceed via alterations in the subcellular localization of occludin[188]. We found that the
addition of calcium to the extracellular solution did not change arachnoid cell permeability.
Furthermore, blocking calcium from entering the cell also did not change cell behavior. This
supports the claim that some other compartment such as endoplasmic reticulum stores may be
the key to permeability regulation. By disrupting the extracellular/intracellular calcium
homeostasis via calcium ion channel drug, we demonstrated that calcium plays an active role in
paracellular transport.

Chapter 4
100
EDTA was added as a chelator of extracellular calcium. This does not alter ZO-1/actin
interactions unlike intracellular calcium, but may affect the cadherin-cadherin linkage via their
extracellular domain.[189] Adherens junctions composed of cadherin join homotypically to
adjacent cells and are calcium dependent.[176] Via p120-catenin, cadherin furthermore links
the adherens junction to the actin cytoskeleton. In the arachnoid cells, the TEER values were
decreased by EDTA but not by intracellular calcium manipulations, suggesting that adherens
junctions may have an important role in the arachnoid barrier formation.
cAMP
cAMP prevents permeability increases by several mediators [175][174] By itself we did not see
any change in TEER nor paracellular transport. When we inhibited its breakdown and directly
affect adenylyl cyclase activity, we increased the barrier capability of the arachnoid. cAMP
induces protein kinase A which inhibits RhoA activation and cellular contraction.[190] It may
have a direct effect on actin rearrangement thereby affect intercellular space formation.[190] In
addition, it can directly activate Epac, a Rap1GEF which enhances VE-cadherin junctional
integrity and actin reorganization [191]. When we examined the immunohistologic staining of
the arachnoid cell for actin and ZO-1 before and after the application of cAMP modulators, we
did not see any gross changes in intensity or variation in staining pattern (Figure 4.4E and F). It
is possible that the effect is too subtle to be detected in this manner. Other investigators have
noted that cAMP’s effect is most marked when the drugs were used in combination with other
agents in the case for human and bovine brain endothelial cells.[192] When Rubin et al. used
combination of astrocyte cultured media and cAMP, the cAMP permeability response was the
greatest. The reason is not completely clear, but we intend to use astrocytic and neuronally
derived soluble factors in combination with cAMP agonist as the next step in this second
messenger system analysis. Even without direct contact by these supporting cells in the BCB, it
is possible that they may still influence barrier behavior at the arachnoidal level.
TEER is often viewed as a marker for monolayer integrity or barrier tightness. However, its
relation to paracellular permeability did not correlate in the cAMP studies (Figure 4.4). This
phenomenon has been seen in other monolayer models such as the caco-2 cell line.[193][194]
Chapter 4
101
The physiology is not clear; however, it may be that that the paracellular space may widen
without change in the junctional protein complex structure allowing for this disparity.
cAMP and Ca second messenger systems may not be separate in their control of extracellular
transport. Schmidt et al. showed a new calcium signaling pathway that is triggered by cAMP.
This pathway is PKA independent and is mediated by a Rap family GTPase.[174] The receptor
studied by that group was the adenylyl cyclase-coupled beta2-adrenoceptor; we used
isoproterenol, a beta1,2 agonist which showed a modest effect on permeability.
Tight junction importance
Our attempt at direct alterations of the tight junction resulted in variable changes in paracellular
tracer permeabilities. Steroid, an upregulator of claudin in other barrier models caused
marginal effects on paracellular permeability. It is possible that we are seeing a ceiling effect
due to limitations of other components in tight junction that prevent increases in barrier
properties. When we used serum free conditions, very little change in permeability resulted as
well. When serum is withdrawn from culture media, TEER in cerebral capillary endothelial cells
increases, probably due to nonspecific re-organization of the tight junctions.[195] We found
that protamine, which disrupt cytoskeletal actin distribution and decrease claudin, occludin, and
potentially ZO-1 expression, to exert the most effect on paracellular barrier. Because of the poly
cationic nature of protamine, its action on the tight junction is nonspecific.[196] Together,
evidence suggests that tight junctions by themselves in arachnoid may not be the only
important component to the barrier formation. 18β-glycyrrhetinic acid, which binds on
connexin at the gap junction had a profound effect on the paracellular permeability in
arachnoid. Whether the cause is a mechanical disruption due to separation of the gap junction,
or whether there is a loss of cell-cell communication, i.e. calcium transfer, is unknown.
Conclusion
We show that arachnoid cells have the molecular hardware and the capability to support
paracellular transport. Presence of occludin, claudin-1, JAM, and actin cytoskeletal protein are
Chapter 4
102
present in these cells and play a variable role in transport. The theoretical pore size
representing the paracellular space indicates that the gap is wider than vascular endothelial cells
of the brain. Permeabilities for urea, mannitol and inulin are similar to other models of brain
barriers and the size differentiated transport of dextran clarified the previously known blockade
for soluble dye in the blood CSF barrier at the arachnoid sink. Furthermore, the dextran study
indicates that in a standard membrane delimited diffusion system, the efficiency of intracellular
transport is approximately two orders of magnitude less efficient than paracellular means. We
also show that paracellular transport may be under the influence of both gap junction and tight
junctions, and the calcium and cAMP second messenger systems influence this system.
Intracellular and extracellular calcium appear to have differential roles in increasing paracellular
permeability, and cAMP, likely by a variety of mechanisms, is able to decrease paracellular
permeability. We therefore propose that the arachnoid transport of cerebrospinal fluid is
served by the paracellular route and is influenced by a complex system of control.

Chapter 5
103
Chapter 5: Summary and Future Studies

Chapter 5
104
This thesis presents some of the foundational work for the tissue engineering of arachnoidal
tissue. It illustrates the ability for three dimensional construction of a bioengineered arachnoid
product, presents two cell lines as research substrates for future work, and characterizes the
major characteristic of the blood CSF barrier at the arachnoid, namely paracellular transport.
Compared to the literature in endothelial cells or tissue engineering endeavors in blood vessel
replacement, very little has been published in arachnoid cells and granulations. Only in the past
five to ten years have suitable ex vivo models been developed. The arachnoid is
morphologically and ontogenetically variable. It has to serve a variety of roles, and its end form
must be adapted for these roles. Therefore, we have to be flexible in constructing a variety of
bioimetic products with divergent geometries and properties.
Among the three dimensional architectures that exist for arachnoid, the most complex is likely
the central core. Abutting the arachnoid cap and merging into the arachnoid membrane, it
forms the first barrier in the granulation to substances before they proceed to the cap and pass
to the vascular system. Its reticulated structure is similar to collagen scaffolds created using
lyophilization methods, and thus chapter 2 is devoted to this technique. With pore size and
overall dimensions similar to the core, these scaffolds were seeded with arachnoid cells and
cultured. The results were compared with two dimensional cultures morphometrically and
immunohistochemically. The cell’s growth characteristics were also documented. Findings
were that the cells retained their arachnoid phenotype and geometrically appeared similar to
native tissue. The cells populated the scaffold sparsely, which was similar to the native state as
well. This was in contrast to cells grown two dimensionally ex vivo.
A lack of suitable substrate for investigation has slowed the advancement in studying arachnoid
physiology. To address this issue, two new cell lines of arachnoid cells were developed in
chapter 3. Using singly and doubly transducted cells with SV40LgT and hTERT, the cells were
immortalized and preserved. Colonies chosen showed clear integration of the gene. Only one
other attempt at transformation has been made. In the early 1990’s this attempt has resulted in
cells that senesced after fifty passages. The two new cell lines we created remain robust much
long and are the only cell lines of arachnoid currently in existence. Not only were the growth
characteristics of the cells exceptional, the immunohistochemical phenotype imitated the native

Chapter 5
105
tissue. The chapter briefly discussed the physiologic properties of the cells, preliminarily
demonstrating its transport properties similarity to another border cell, the caco-2 model, to be
later described in greater detail in chapter 4.
In chapter 4, the paracellular mechanisms of the immortalized arachnoid cell line was outlined
using paracellular and size differentiated tracers. Classic permeability studies delineate passage
of small sugars and variable size dextran through membrane supported monolayers for
paracellular transport studies. The latter clarifies the size differentiated set point for the barrier
limit. Theoretical pore size and occupancy to length ratio allow comparison of arachnoid to
other models of blood brain barriers. Fundamental work for second messenger involvement in
barrier regulation was performed, particularly for calcium and cAMP, with the goal that in the
future, specific intracellular stations at the various modulatory pathways could be leveraged for
transport alterations.
In total, the data gathered in chapters 2, 3, and 4 demonstrates the feasibility of the tissue
engineering of an arachnoid granulation and set the stage for future study for arachnoid
physiology. At the same time, large knowledge gaps become obvious and provide direction for
future work. These areas include the imitation of the arachnoid cap, intracellular transport
mechanisms of the arachnoid cell, carrier mediated transport in arachnoid, application of
arachnoid physiology to pathologic conditions, and extension of arachnoid models to humans
and other animal for better fidelity of cellular behavior. For example, the bioengineered
arachnoid cap for example is distinct from the core; a dense cellular construct is needed, with
minimal extracellular space. We have been able to generate such an architecture using collagen
gel as a medium for cell growth but continued characterization must be preformed. Once
created, the arachnoid cap must be able to integrate with the arachnoid core and blend into the
arachnoid membrane. This interfacial integration may be an engineering challenge.
Furthermore, it is likely the transport characteristics of the arachnoid cap would be very
different from the arachnoid core. Given the higher density of cells, intracellular transport and
stacked geometries of the cells may become important.
Chapter 4 defines some of the limits of paracellular transport, but intracellular transport could
be important as well. For example, the passage of anti-epileptic medication through the BBB is

Chapter 5
106
dependent of transporter systems along the vascular endothelium. Likewise, cancer
pharmaceutics leverage the ABC transporter family to overcome the low brain drug
concentrations. No transporter literature exists for arachnoid. Furthermore, very limited is
known about aquaporins in the arachnoid. Given the importance of water removal by arachnoid
in vivo, the role of these channels needs to be defined.
Hydrocephalus is a disease that could directly benefit from the analysis of water movement
from the brain. In this condition, the removal of cerebrospinal fluid is slowed so that pressure
building up within the intracranial cavity adversely affects the brain. Tissue engineering of the
arachnoid granulation would be a natural substitute for the current treatment of artificial shunts
that is prone to infection, breakage, and failure. Tissue engineering CSF gateways is still at its
infancy. For example, can the cells lay a strong enough extracellular matrix to withstand the
wide swings of intracranial pressure? How can we make the scaffolds stronger? The surgical
implantation of such a device may be one of the biggest forthcoming hurdles. As the device
must rest at the vascular interface directly connecting the intracranial cavity filled with the
delicate neural structures to blood vessels, any small breeches in continuity would result in
potentially severe bleeding complications.
Different diseases pose other challenging problems. Neurotrauma results in a host of pathologic
conditions and complications. Debris from the brain, chemicals resulting from residuals of
foreign material, and blood itself incite a variety of pathways that could be detrimental to the
nervous system. The breakdown products of blood for example result in a plethora of oxidative
pathways that could incite brain damage and prevent healing. Understanding the clearing
mechanisms of the brain may lead to more rapid recovery and restoration of neural function.
Clearance occurs by many mechanisms among which are the transcytosis of blood byproducts,
engulfment by leukocytes, and paracellular transport of smaller molecules. Transient
breakdown of the blood brain barrier and the role of indigenous phagocytic cells such as
microglia contribute to the complicated routes of debris removal, but the blood CSF barrier is
the one currently most leveraged by neurosurgeons. Studying the mechanisms of debris
removal in neurotrauma would be a productive avenue for research in neurotransport, as
potential therapeutic intervention may directly result from knowledge gained.

Chapter 5
107
In summary, this dissertation lays some of the foundational work for arachnoidal engineering.
Much still needs to be done. Disease directed research may lead to rapid therapeutic
intervention, and basic science work may lead to a more complete understanding of material
egress from the brain.
108
References
[1] M. Pollay, “The Function and Structure of the CSF Outflow System,” Cerebrospinal Fluid Research, vol. 7, no. 1, p. 9, Jun. 2010.
[2] J. H. Lee, Meningiomas: Diagnosis, Treatment, and Outcome. Springer, 2009. [3] A. Brunori, R. Vagnozzi, and R. Giuffrè, “Antonio Pacchioni (1665-1726): early studies of
the dura mater,” Journal of Neurosurgery, vol. 78, no. 3, pp. 515-518, Mar. 1993. [4] L. H. Weed, “Studies on Cerebro-Spinal Fluid. No. II : The Theories of Drainage of Cerebro-
Spinal Fluid with an Analysis of the Methods of Investigation,” The Journal of Medical Research, vol. 31, no. 1, pp. 21-49, Sep. 1914.
[5] H. Davson and M. B. Segal, Physiology of the CSF and Blood-Brain Barriers, 1st ed. CRC Press, 1996.
[6] G. Key and A. Retzius, Anatomie des Nervensystems und des Bindegewebes. Stockholm , 1875.
[7] H. Cushing, “Studies on the Cerebro-Spinal Fluid : I. Introduction,” The Journal of Medical Research, vol. 31, no. 1, pp. 1-19, Sep. 1914.
[8] H. Davson, Physiology of the ocular and cerebrospinal fluids. London: Churchill, 1956. [9] K. Welch and V. Friedman, “The cerebrospinal fluid valves,” Brain: A Journal of Neurology,
vol. 83, pp. 454-469, Sep. 1960. [10] F. C. Courtice and W. J. Simmonds, “The removal of protein from the subarachnoid space,”
The Australian Journal of Experimental Biology and Medical Science, vol. 29, no. 4, pp. 255-263, Jul. 1951.
[11] W. J. Simmonds, “The absorption of labelled erythrocytes from the subarachnoid space in rabbits,” The Australian Journal of Experimental Biology and Medical Science, vol. 31, no. 1, pp. 77-83, Feb. 1953.
[12] W. H. Sweet and H. B. Locksley, “Formation, flow, and reabsorption of cerebrospinal fluid in man,” Proceedings of the Society for Experimental Biology and Medicine. Society for Experimental Biology and Medicine (New York, N.Y.), vol. 84, no. 2, pp. 397-402, Nov. 1953.
[13] T. Ishibashi, “Studies on the dynamics of the cerebrospinal fluid using radioactive isotopes. I. The formation and the absorption of cerebrospinal fluid,” The Tohoku Journal of Experimental Medicine, vol. 70, pp. 49-57, Jun. 1959.
[14] J. Adams and S. Prawirohardjo, “Fate of red blood cells injected into cerebrospinal fluid pathways,” Neurology (Minneapolis), vol. 9, pp. 561-4, 1959.
[15] K. Welch and M. Pollay, “Perfusion of particles through arachnoid villi of the monkey,” The American Journal of Physiology, vol. 201, pp. 651-654, Oct. 1961.
[16] L. D. Prockop, L. S. Schanker, and B. B. Brodie, “Passage of lipid-insoluble substances from cerebrospinal fluid to blood,” The Journal of Pharmacology and Experimental Therapeutics, vol. 135, pp. 266-270, Mar. 1962.
[17] S. R. Heisey, D. Held, and J. R. Pappenheimer, “Bulk flow and diffusion in the cerebrospinal fluid system of the goat,” The American Journal of Physiology, vol. 203, pp. 775-781, Nov. 1962.
[18] H. Davson, G. Hollingsworth, and M. B. Segal, “The mechanism of drainage of the cerebrospinal fluid,” Brain: A Journal of Neurology, vol. 93, no. 4, pp. 665-678, 1970.
[19] T. S. Reese and M. J. Karnovsky, “Fine structural localization of a blood-brain barrier to exogenous peroxidase,” The Journal of Cell Biology, vol. 34, no. 1, pp. 207-217, Jul. 1967.

109
[20] J. F. Alksne and E. T. Lovings, “Functional ultrastructure of the arachnoid villus,” Archives of neurology, vol. 27, no. 5, pp. 371-7, Nov. 1972.
[21] J. F. Alksne and L. E. White Jr, “Electron-microscope study of the effect of increased intracranial pressure on the arachnoid villus,” Journal of Neurosurgery, vol. 22, no. 5, pp. 481-488, May 1965.
[22] R. Tripathi, “Tracing the bulk outflow route of cerebrospinal fluid by transmission and scanning electron microscopy,” Brain Research, vol. 80, no. 3, pp. 503-506, Nov. 1974.
[23] D. G. Gomez, G. Potts, V. Deonarine, and K. F. Reilly, “Effects of pressure gradient changes on the morphology of arachnoid villi and granulations of the monkey,” Laboratory Investigation; a Journal of Technical Methods and Pathology, vol. 28, no. 6, pp. 648-657, Jun. 1973.
[24] D. G. Gomez and D. G. Potts, “Effects of pressure on the arachnoid villus,” Experimental Eye Research, vol. 25, pp. 117-125, 1977.
[25] H. Davson, G. Hollingsworth, and M. B. Segal, “The mechanism of drainage of the cerebrospinal fluid,” Brain: A Journal of Neurology, vol. 93, no. 4, pp. 665-678, 1970.
[26] D. G. Potts, V. Deonarine, and W. Welton, “Perfusion studies of the cerebrospinal fluid absorptive pathways in the dog,” Radiology, vol. 104, no. 2, pp. 321-325, Aug. 1972.
[27] J. D. Mann, A. B. Butler, J. E. Rosenthal, C. J. Maffeo, R. N. Johnson, and N. H. Bass, “Regulation of intracranial pressure in rat, dog, and man,” Annals of neurology, vol. 3, no. 2, pp. 156-65, Feb. 1978.
[28] M. J. Albeck, S. E. Børgesen, F. Gjerris, J. F. Schmidt, and P. S. Sørensen, “Intracranial pressure and cerebrospinal fluid outflow conductance in healthy subjects,” Journal of Neurosurgery, vol. 74, no. 4, pp. 597-600, Apr. 1991.
[29] A. L. Shabo, M. M. Abbott, and D. S. Maxwell, “The response of the arachnoid villus to an intracisternal injection of autogenous brain tissue. An electron microscopic study in the macaque monkey,” Neurology, vol. 19, no. 8, pp. 724-734, Aug. 1969.
[30] Z.-liang Xin, X.-kang Wu, J.-rong Xu, and X. Li, “Arachnoid cell involvement in the mechanism of coagulation-initiated inflammation in the subarachnoid space after subarachnoid hemorrhage,” Journal of Zhejiang University. Science. B, vol. 11, no. 7, pp. 516-523, Jul. 2010.
[31] M. L. Upton and R. O. Weller, “The morphology of cerebrospinal fluid drainage pathways in human arachnoid granulations,” Journal of Neurosurgery, vol. 63, no. 6, pp. 867-875, Dec. 1985.
[32] E. H. Frank et al., “Cytokeratin provides a specific marker for human arachnoid cells grown in vitro,” Experimental Cell Research, vol. 146, no. 2, pp. 371-376, Jul. 1983.
[33] J. T. Rutka, J. Giblin, D. V. Dougherty, J. R. McCulloch, S. J. DeArmond, and M. L. Rosenblum, “An ultrastructural and immunocytochemical analysis of leptomeningeal and meningioma cultures,” Journal of Neuropathology and Experimental Neurology, vol. 45, no. 3, pp. 285-303, May 1986.
[34] D. W. Holman, D. M. Grzybowski, B. C. Mehta, S. E. Katz, and M. Lubow, “Characterization of cytoskeletal and junctional proteins expressed by cells cultured from human arachnoid granulation tissue,” Cerebrospinal Fluid Research, vol. 2, p. 9, Oct. 2005.
[35] D. M. Grzybowski, D. W. Holman, S. E. Katz, and M. Lubow, “In vitro model of cerebrospinal fluid outflow through human arachnoid granulations,” Investigative ophthalmology & visual science, vol. 47, no. 8, pp. 3664-72, Aug. 2006.

110
[36] D. W. Holman, V. Kurtcuoglu, and D. M. Grzybowski, “Cerebrospinal fluid dynamics in the human cranial subarachnoid space: an overlooked mediator of cerebral disease. II. In vitro arachnoid outflow model,” Journal of the Royal Society, Interface / the Royal Society, Mar. 2010.
[37] S. A. Glimcher, D. W. Holman, M. Lubow, and D. M. Grzybowski, “Ex vivo model of cerebrospinal fluid outflow across human arachnoid granulations,” Investigative Ophthalmology & Visual Science, vol. 49, no. 11, pp. 4721-4728, Nov. 2008.
[38] R. O’Rahilly and F. Müller, “The meninges in human development,” Journal of Neuropathology and Experimental Neurology, vol. 45, no. 5, pp. 588-608, Sep. 1986.
[39] S. Kida, T. Yamashima, T. Kubota, H. Ito, and S. Yamamoto, “A light and electron microscopic and immunohistochemical study of human arachnoid villi,” Journal of Neurosurgery, vol. 69, no. 3, pp. 429-435, Sep. 1988.
[40] E. R. Wolpow and H. H. Schaumburg, “Structure of the human arachnoid granulation,” Journal of Neurosurgery, vol. 37, no. 6, pp. 724-727, Dec. 1972.
[41] J. R. Youmans, Youmans Neurological Surgery. SIX VOLUMES. 3rd Edition. By Julian R. Youmans. 1990 Edition. Saunders, 1990.
[42] M. S. Greenberg, Handbook of Neurosurgery, 5th ed. Thieme Medical Publishers, 2000. [43] J. D. McQueen, B. E. Northrup, and L. G. Leibrock, “Arachnoid clearance of red blood
cells,” Journal of Neurology, Neurosurgery, and Psychiatry, vol. 37, no. 12, pp. 1316-1321, Dec. 1974.
[44] M. B. Carpenter, Core Text of Neuroanatomy, 4th ed. Williams & Wilkins, 1991. [45] J. Kestle et al., “Long-term follow-up data from the Shunt Design Trial,” Pediatric
Neurosurgery, vol. 33, no. 5, pp. 230-236, Nov. 2000. [46] R. Lanza, R. Langer, and J. P. Vacanti, Principles of Tissue Engineering, Second Edition, 2nd
ed. Academic Press, 2000. [47] I. W. Lee, J. P. Vacanti, G. A. Taylor, and J. R. Madsen, “The living shunt: a tissue
engineering approach in the treatment of hydrocephalus,” Neurological Research, vol. 22, no. 1, pp. 105-110, Jan. 2000.
[48] D. C. Hodgson, J. M. Shippen, and R. Sunderland, “Protective role of cerebrospinal fluid in brain injuries,” Archives of Disease in Childhood, vol. 84, no. 2, p. 187, Feb. 2001.
[49] J. S. Ruan, T. Khalil, and A. I. King, “Dynamic response of the human head to impact by three-dimensional finite element analysis,” Journal of Biomechanical Engineering, vol. 116, no. 1, pp. 44-50, Feb. 1994.
[50] C. L. Mac Donald et al., “Detection of blast-related traumatic brain injury in U.S. military personnel,” The New England Journal of Medicine, vol. 364, no. 22, pp. 2091-2100, Jun. 2011.
[51] J. F. Alksne and E. T. Lovings, “The role of the arachnoid villus in the removal of red blood cells from the subarachnoid space. An electron microscope study in the dog,” Journal of Neurosurgery, vol. 36, no. 2, pp. 192-200, Feb. 1972.
[52] M. W. Greve and B. J. Zink, “Pathophysiology of traumatic brain injury,” The Mount Sinai Journal of Medicine, New York, vol. 76, no. 2, pp. 97-104, Apr. 2009.
[53] G. T. Vatassery, C. Lam, W. E. Smith, and H. T. Quach, “Apolipoprotein E exerts selective and differential control over vitamin E concentrations in different areas of mammalian brain,” Journal of Neuroscience Research, vol. 84, no. 6, pp. 1335-1342, Nov. 2006.
111
[54] J. D. Belcher, J. D. Beckman, G. Balla, J. Balla, and G. Vercellotti, “Heme degradation and vascular injury,” Antioxidants & Redox Signaling, vol. 12, no. 2, pp. 233-248, Feb. 2010.
[55] W. Sprong, “The disappearance of blood from the cerebrospinal fluid in traumatic subarachnoid hemorrhage and the ineffectiveness of repeated lumbar punctures,” Surg Gyn Obstet, vol. 58, pp. 705-710, 1934.
[56] Y. Takahashi et al., “Scanning electron microscopic observations of the arachnoid granulations in monkeys with cerebrospinal fluid hypotension,” The Kurume Medical Journal, vol. 40, no. 4, pp. 201-211, 1993.
[57] T. Brinker, W. Lüdemann, D. B. von Rautenfeld, F. Brassel, H. Becker, and M. Samii, “Breakdown of the meningeal barrier surrounding the intraorbital optic nerve after experimental subarachnoid hemorrhage,” American Journal of Ophthalmology, vol. 124, no. 3, pp. 373-380, Sep. 1997.
[58] D. d’ Avella, R. Cicciarello, F. Albiero, and G. Andrioli, “Scanning electron microscope study of human arachnoid villi,” Journal of Neurosurgery, vol. 59, no. 4, pp. 620-626, Oct. 1983.
[59] R. P. Chopard, R. C. Brancalhão, M. H. Miranda-Neto, and W. Biazotto, “Arachnoid granulation affected by subarachnoid hemorrhage,” Arquivos De Neuro-Psiquiatria, vol. 51, no. 4, pp. 452-456, Dec. 1993.
[60] P. Ehrlich, Das Sauerstoffbedurfnis des Organismus. Eine farbanalytische Studie. Berlin: Hirschwald, 1885.
[61] E. Goldmann, “Vitalfarbung am Zentralnervensystem,” Abh. K. Preuss. Akad. Wiss. Phys. Med., vol. 1, pp. 1-60.
[62] M. Lewandowsky, “Zur Lehre der Zerebrospinalflussigkeit,” Z. Klin. Med., vol. 40, pp. 480-494, 1890.
[63] T. Broman and A. Lindberg-Broman, “An experimental study of disorders in the permeability of the cerebral vessels (‘the blood-brain barrier’) produced by chemical and physico-chemical agents.,” Acta Physiol Scand, vol. 10, pp. 102-125, 1945.
[64] C. Crone, “Facilitated transfer of glucose from blood into brain tissue,” The Journal of Physiology, vol. 181, no. 1, pp. 103-113, Nov. 1965.
[65] T. S. Reese and M. J. Karnovsky, “Fine structural localization of a blood-brain barrier to exogenous peroxidase,” The Journal of Cell Biology, vol. 34, no. 1, pp. 207-217, Jul. 1967.
[66] N. J. Abbott, “Permeability and transport of glial blood-brain barriers,” Annals of the New York Academy of Sciences, vol. 633, pp. 378-394, 1991.
[67] R. Dermietzel, D. C. Spray, and M. Nedergaard, Blood-Brain Barriers: From Ontogeny to Artificial Interface, 1st ed. Wiley-VCH, 2006.
[68] C. E. Johanson, “Permeability and vascularity of the developing brain: cerebellum vs cerebral cortex,” Brain Research, vol. 190, no. 1, pp. 3-16, May 1980.
[69] T. Yamashima, “Functional ultrastructure of cerebrospinal fluid drainage channels in human arachnoid villi,” Neurosurgery, vol. 22, no. 4, pp. 633-41, Apr. 1988.
[70] D. G. Gomez, D. G. Potts, and V. Deonarine, “Arachnoid granulations of the sheep. Structural and ultrastructural changes with varying pressure differences,” Archives of Neurology, vol. 30, no. 2, pp. 169-175, Feb. 1974.
[71] A Oksche and L. Vollrath, Handbuch der midroskopischen Anatomie des Menschen. Berlin: Springer, 1980.
[72] P. Claude and D. A. Goodenough, “Fracture faces of zonulae occludentes from ‘tight’ and ‘leaky’ epithelia,” The Journal of Cell Biology, vol. 58, no. 2, pp. 390-400, Aug. 1973.

112
[73] E. E. Schneeberger and R. D. Lynch, “The tight junction: a multifunctional complex,” American Journal of Physiology. Cell Physiology, vol. 286, no. 6, pp. C1213-1228, Jun. 2004.
[74] M. Furuse et al., “Occludin: a novel integral membrane protein localizing at tight junctions,” The Journal of Cell Biology, vol. 123, no. 6 Pt 2, pp. 1777-1788, Dec. 1993.
[75] Y. Ando-Akatsuka et al., “Interspecies diversity of the occludin sequence: cDNA cloning of human, mouse, dog, and rat-kangaroo homologues,” The Journal of Cell Biology, vol. 133, no. 1, pp. 43-47, Apr. 1996.
[76] M. Saitou et al., “Complex phenotype of mice lacking occludin, a component of tight junction strands,” Molecular Biology of the Cell, vol. 11, no. 12, pp. 4131-4142, Dec. 2000.
[77] L. DeMaio, Y. S. Chang, T. W. Gardner, J. M. Tarbell, and D. A. Antonetti, “Shear stress regulates occludin content and phosphorylation,” American Journal of Physiology. Heart and Circulatory Physiology, vol. 281, no. 1, pp. H105-113, Jul. 2001.
[78] M. Furuse, K. Fujita, T. Hiiragi, K. Fujimoto, and S. Tsukita, “Claudin-1 and -2: novel integral membrane proteins localizing at tight junctions with no sequence similarity to occludin,” The Journal of Cell Biology, vol. 141, no. 7, pp. 1539-1550, Jun. 1998.
[79] L. L. Mitic, C. M. Van Itallie, and J. M. Anderson, “Molecular physiology and pathophysiology of tight junctions I. Tight junction structure and function: lessons from mutant animals and proteins,” American Journal of Physiology. Gastrointestinal and Liver Physiology, vol. 279, no. 2, pp. G250-254, Aug. 2000.
[80] K. Morita, H. Sasaki, K. Fujimoto, M. Furuse, and S. Tsukita, “Claudin-11/OSP-based tight junctions of myelin sheaths in brain and Sertoli cells in testis,” The Journal of Cell Biology, vol. 145, no. 3, pp. 579-588, May 1999.
[81] C. Rahner, L. L. Mitic, and J. M. Anderson, “Heterogeneity in expression and subcellular localization of claudins 2, 3, 4, and 5 in the rat liver, pancreas, and gut,” Gastroenterology, vol. 120, no. 2, pp. 411-422, Feb. 2001.
[82] D. B. Simon et al., “Paracellin-1, a renal tight junction protein required for paracellular Mg2+ resorption,” Science (New York, N.Y.), vol. 285, no. 5424, pp. 103-106, Jul. 1999.
[83] M. Furuse, H. Sasaki, and S. Tsukita, “Manner of interaction of heterogeneous claudin species within and between tight junction strands,” The Journal of Cell Biology, vol. 147, no. 4, pp. 891-903, Nov. 1999.
[84] M. Furuse, K. Furuse, H. Sasaki, and S. Tsukita, “Conversion of zonulae occludentes from tight to leaky strand type by introducing claudin-2 into Madin-Darby canine kidney I cells,” The Journal of Cell Biology, vol. 153, no. 2, pp. 263-272, Apr. 2001.
[85] N. Sonoda et al., “Clostridium perfringens enterotoxin fragment removes specific claudins from tight junction strands: Evidence for direct involvement of claudins in tight junction barrier,” The Journal of Cell Biology, vol. 147, no. 1, pp. 195-204, Oct. 1999.
[86] O. M. Martinez-Estrada, A. Villa, F. Breviario, F. Orsenigo, E. Dejana, and G. Bazzoni, “Association of junctional adhesion molecule with calcium/calmodulin-dependent serine protein kinase (CASK/LIN-2) in human epithelial caco-2 cells,” The Journal of Biological Chemistry, vol. 276, no. 12, pp. 9291-9296, Mar. 2001.
[87] B. Engelhardt and H. Wolburg, “Mini-review: Transendothelial migration of leukocytes: through the front door or around the side of the house?,” European Journal of Immunology, vol. 34, no. 11, pp. 2955-2963, Nov. 2004.
[88] M. G. Farquhar and G. E. Palade, “Junctional complexes in various epithelia,” The Journal of Cell Biology, vol. 17, pp. 375-412, May 1963.
113
[89] “Adherens junction - Wikipedia, the free encyclopedia.” *Online+. Available: http://en.wikipedia.org/wiki/Adherens_junction. [Accessed: 07-Nov-2011].
[90] F. Drees, S. Pokutta, S. Yamada, W. J. Nelson, and W. I. Weis, “Alpha-catenin is a molecular switch that binds E-cadherin-beta-catenin and regulates actin-filament assembly,” Cell, vol. 123, no. 5, pp. 903-915, Dec. 2005.
[91] “Gap junction - Wikipedia, the free encyclopedia.” *Online+. Available: http://en.wikipedia.org/wiki/Gap_junction. [Accessed: 07-Nov-2011].
[92] S. Maeda et al., “Structure of the connexin 26 gap junction channel at 3.5 A resolution,” Nature, vol. 458, no. 7238, pp. 597-602, Apr. 2009.
[93] R. A. Kroll and E. A. Neuwelt, “Outwitting the blood-brain barrier for therapeutic purposes: osmotic opening and other means,” Neurosurgery, vol. 42, no. 5, pp. 1083-1099; discussion 1099-1100, May 1998.
[94] Z. Redzic, “Molecular biology of the blood-brain and the blood-cerebrospinal fluid barriers: similarities and differences,” Fluids and Barriers of the CNS, vol. 8, no. 1, p. 3, 2011.
[95] R. G. Anderson, “The caveolae membrane system,” Annual Review of Biochemistry, vol. 67, pp. 199-225, 1998.
[96] B. M. Pearse, “Clathrin: a unique protein associated with intracellular transfer of membrane by coated vesicles,” Proceedings of the National Academy of Sciences of the United States of America, vol. 73, no. 4, pp. 1255-1259, Apr. 1976.
[97] M. Murphy, J. N. Chen, and D. L. George, “Establishment and characterization of a human leptomeningeal cell line,” Journal of Neuroscience Research, vol. 30, no. 3, pp. 475-483, Nov. 1991.
[98] K. Ishikawa, Y. Ohe, and K. Tatemoto, “Synthesis and secretion of insulin-like growth factor (IGF)-II and IGF binding protein-2 by cultivated brain meningeal cells,” Brain Research, vol. 697, no. 1-2, pp. 122-129, Oct. 1995.
[99] M. Spatz, K. Renkawek, M. R. Murray, and I. Klatzo, “Uptake of radiolabeled glucose analogues by organotypic pia arachnoid cultures,” Brain research, vol. 100, no. 3, pp. 710-5, Dec. 1975.
[100] H. K. Ng, C. C. Tse, and S. T. Lo, “Meningiomas and arachnoid cells: an immunohistochemical study of epithelial markers,” Pathology, vol. 19, no. 3, pp. 253-257, Jul. 1987.
[101] B. Engelhardt and L. Sorokin, “The blood-brain and the blood-cerebrospinal fluid barriers: function and dysfunction,” Seminars in Immunopathology, vol. 31, no. 4, pp. 497-511, Nov. 2009.
[102] C. E. Johanson, E. G. Stopa, and P. N. McMillan, “The blood-cerebrospinal fluid barrier: structure and functional significance,” Methods in Molecular Biology (Clifton, N.J.), vol. 686, pp. 101-131, 2011.
[103] S. Gupta et al., “Cerebrospinal fluid dynamics in the human cranial subarachnoid space: an overlooked mediator of cerebral disease. I. Computational model,” Journal of the Royal Society, Interface / the Royal Society, vol. 7, no. 49, pp. 1195-1204, Aug. 2010.
[104] B. C. Mehta, D. W. Holman, D. M. Grzybowski, and J. J. Chalmers, “Characterization of arachnoidal cells cultured on three-dimensional nonwoven PET matrix,” Tissue Engineering, vol. 13, no. 6, pp. 1269-1279, Jun. 2007.

114
[105] C. I. Conegero and R. P. Chopard, “Tridimensional architecture of the collagen element in the arachnoid granulations in humans: a study on scanning electron microscopy,” Arquivos De Neuro-Psiquiatria, vol. 61, no. 3, pp. 561-565, Sep. 2003.
[106] S. Mizuno and J. Glowacki, “Chondroinduction of human dermal fibroblasts by demineralized bone in three-dimensional culture,” Experimental Cell Research, vol. 227, no. 1, pp. 89-97, Aug. 1996.
[107] M. Boulton, M. Flessner, D. Armstrong, R. Mohamed, J. Hay, and M. Johnston, “Contribution of extracranial lymphatics and arachnoid villi to the clearance of a CSF tracer in the rat,” The American journal of physiology, vol. 276, no. 3 Pt 2, pp. R818-23, Mar. 1999.
[108] C. J. Doillon et al., “A collagen-based scaffold for a tissue engineered human cornea: physical and physiological properties,” The International Journal of Artificial Organs, vol. 26, no. 8, pp. 764-773, Aug. 2003.
[109] M. Chvapil, “Collagen sponge: theory and practice of medical applications,” Journal of Biomedical Materials Research, vol. 11, no. 5, pp. 721-741, Sep. 1977.
[110] C. J. Doillon and F. H. Silver, “Collagen-based wound dressing: effects of hyaluronic acid and fibronectin on wound healing,” Biomaterials, vol. 7, no. 1, pp. 3-8, Jan. 1986.
[111] C. J. Doillon, C. F. Whyne, S. Brandwein, and F. H. Silver, “Collagen-based wound dressings: control of the pore structure and morphology,” Journal of Biomedical Materials Research, vol. 20, no. 8, pp. 1219-1228, Oct. 1986.
[112] D. M. Heimbach et al., “Multicenter postapproval clinical trial of Integra dermal regeneration template for burn treatment,” The Journal of Burn Care & Rehabilitation, vol. 24, no. 1, pp. 42-48, Feb. 2003.
[113] C. Schwerk et al., “TNFalpha induces choroid plexus epithelial cell barrier alterations by apoptotic and nonapoptotic mechanisms,” Journal of Biomedicine & Biotechnology, vol. 2010, p. 307231, 2010.
[114] V. L. Madgula, B. Avula, N. Reddy V L, I. A. Khan, and S. I. Khan, “Transport of decursin and decursinol angelate across Caco-2 and MDR-MDCK cell monolayers: in vitro models for intestinal and blood-brain barrier permeability,” Planta Medica, vol. 73, no. 4, pp. 330-335, Apr. 2007.
[115] D. J. Feurer and R. O. Weller, “Barrier functions of the leptomeninges: a study of normal meninges and meningiomas in tissue culture,” Neuropathology and Applied Neurobiology, vol. 17, no. 5, pp. 391-405, Oct. 1991.
[116] S. Yamada et al., “MRI tracer study of the cerebrospinal fluid drainage pathway in normal and hydrocephalic guinea pig brain,” The Tokai Journal of Experimental and Clinical Medicine, vol. 30, no. 1, pp. 21-29, Apr. 2005.
[117] W. W. Franke et al., “Immunocytochemical identification of epithelium-derived human tumors with antibodies to desmosomal plaque proteins,” Proceedings of the National Academy of Sciences of the United States of America, vol. 80, no. 2, pp. 543-547, Jan. 1983.
[118] J. Barar, M. Gumbleton, M. Asadi, and Y. Omidi, “Barrier functionality and transport machineries of human ECV304 cells,” Medical Science Monitor: International Medical Journal of Experimental and Clinical Research, vol. 16, no. 1, pp. BR52-60, Jan. 2010.
[119] R. S. Tubbs et al., “Human spinal arachnoid villi revisited: immunohistological study and review of the literature,” Journal of Neurosurgery. Spine, vol. 7, no. 3, pp. 328-331, Sep. 2007.

115
[120] D. M. Grzybowski, D. W. Holman, S. E. Katz, and M. Lubow, “In vitro model of cerebrospinal fluid outflow through human arachnoid granulations,” Investigative Ophthalmology & Visual Science, vol. 47, no. 8, pp. 3664-3672, Aug. 2006.
[121] L. Hayflick, “The limited in vitro lifetime of human diploid cell strains,” Experimental Cell Research, vol. 37, pp. 614-636, Mar. 1965.
[122] J. M. Sedivy, “Can ends justify the means?: telomeres and the mechanisms of replicative senescence and immortalization in mammalian cells,” Proceedings of the National Academy of Sciences of the United States of America, vol. 95, no. 16, pp. 9078-9081, Aug. 1998.
[123] C. M. Counter et al., “Dissociation among in vitro telomerase activity, telomere maintenance, and cellular immortalization,” Proceedings of the National Academy of Sciences of the United States of America, vol. 95, no. 25, pp. 14723-14728, Dec. 1998.
[124] A. C. Schinzel and W. C. Hahn, “Oncogenic transformation and experimental models of human cancer,” Frontiers in Bioscience: A Journal and Virtual Library, vol. 13, pp. 71-84, 2008.
[125] M. J. Tevethia and H. L. Ozer, “SV40-mediated immortalization,” Methods in Molecular Biology (Clifton, N.J.), vol. 165, pp. 185-199, 2001.
[126] W. C. Hahn, C. M. Counter, A. S. Lundberg, R. L. Beijersbergen, M. W. Brooks, and R. A. Weinberg, “Creation of human tumour cells with defined genetic elements,” Nature, vol. 400, no. 6743, pp. 464-468, Jul. 1999.
[127] A. S. Lundberg et al., “Immortalization and transformation of primary human airway epithelial cells by gene transfer,” Oncogene, vol. 21, no. 29, pp. 4577-4586, Jul. 2002.
[128] A. G. Bodnar et al., “Extension of life-span by introduction of telomerase into normal human cells,” Science (New York, N.Y.), vol. 279, no. 5349, pp. 349-352, Jan. 1998.
[129] W. C. Hahn, “Immortalization and transformation of human cells,” Molecules and Cells, vol. 13, no. 3, pp. 351-361, Jun. 2002.
[130] S. Püttmann et al., “Establishment of a benign meningioma cell line by hTERT-mediated immortalization,” Laboratory Investigation; a Journal of Technical Methods and Pathology, vol. 85, no. 9, pp. 1163-1171, Sep. 2005.
[131] T. G. Cargioli, H. C. Ugur, N. Ramakrishna, J. Chan, P. M. Black, and R. S. Carroll, “Establishment of an in vivo meningioma model with human telomerase reverse transcriptase,” Neurosurgery, vol. 60, no. 4, pp. 750-759; discussion 759-760, Apr. 2007.
[132] G. S. Baia et al., “A genetic strategy to overcome the senescence of primary meningioma cell cultures,” Journal of Neuro-Oncology, vol. 78, no. 2, pp. 113-121, Jun. 2006.
[133] D. F. Kohn, N. Chinookoswong, and S. M. Chou, “A new model of congenital hydrocephalus in the rat,” Acta Neuropathologica, vol. 54, no. 3, pp. 211-218, 1981.
[134] J. Li et al., “Communicating hydrocephalus in adult rats with kaolin obstruction of the basal cisterns or the cortical subarachnoid space,” Experimental Neurology, vol. 211, no. 2, pp. 351-361, Jun. 2008.
[135] R. I. Freshney, Culture of Animal Cells: A Manual of Basic Technique, 4th Edition, 4th ed. Wiley-Liss, 2000.
[136] K. R. Prowse and C. W. Greider, “Developmental and tissue-specific regulation of mouse telomerase and telomere length,” Proceedings of the National Academy of Sciences of the United States of America, vol. 92, no. 11, pp. 4818-4822, May 1995.

116
[137] M. H. Kim and C. Choi, “The Identification and Characterization of Rat Telomerase Catalytic Subunit rTERT mRNA from Rat Genomic Sequence,” Chonnam Medical Journal, vol. 41, no. 1, pp. 1-13, Apr. 2005.
[138] A. L. Albright, I. Pollack, and P. Adelson, Principles and Practice of Pediatric Neurosurgery, 2nd ed. Thieme, 2007.
[139] N. Veitonmäki, J. Fuxe, M. Hultdin, G. Roos, R. F. Pettersson, and Y. Cao, “Immortalization of bovine capillary endothelial cells by hTERT alone involves inactivation of endogenous p16INK4A/pRb,” The FASEB Journal: Official Publication of the Federation of American Societies for Experimental Biology, vol. 17, no. 6, pp. 764-766, Apr. 2003.
[140] G. Aubert and P. M. Lansdorp, “Telomeres and aging,” Physiological Reviews, vol. 88, no. 2, pp. 557-579, Apr. 2008.
[141] M. Morikawa et al., “Isolation and characterization of a new immortal rat astrocyte with a high expression of NGF mRNA,” Neuroscience Research, vol. 39, no. 2, pp. 205-212, Feb. 2001.
[142] E. M. Eves, M. S. Tucker, J. D. Roback, M. Downen, M. R. Rosner, and B. H. Wainer, “Immortal rat hippocampal cell lines exhibit neuronal and glial lineages and neurotrophin gene expression,” Proceedings of the National Academy of Sciences of the United States of America, vol. 89, no. 10, pp. 4373-4377, May 1992.
[143] W. J. Freed et al., “Truncated N-terminal mutants of SV40 large T antigen as minimal immortalizing agents for CNS cells,” Experimental Neurology, vol. 191 Suppl 1, pp. S45-59, Feb. 2005.
[144] M. E. Truckenmiller et al., “AF5, a CNS cell line immortalized with an N-terminal fragment of SV40 large T: growth, differentiation, genetic stability, and gene expression,” Experimental Neurology, vol. 175, no. 2, pp. 318-337, Jun. 2002.
[145] K. Gonda et al., “Requirement of the protein B23 for nucleolar disassembly induced by the FRGY2a family proteins,” The Journal of Biological Chemistry, vol. 281, no. 12, pp. 8153-8160, Mar. 2006.
[146] A. Braun et al., “Cell cultures as tools in biopharmacy,” European Journal of Pharmaceutical Sciences: Official Journal of the European Federation for Pharmaceutical Sciences, vol. 11 Suppl 2, pp. S51-60, Oct. 2000.
[147] G. Pan, N. Giri, and W. F. Elmquist, “Abcg2/Bcrp1 mediates the polarized transport of antiretroviral nucleosides abacavir and zidovudine,” Drug Metabolism and Disposition: The Biological Fate of Chemicals, vol. 35, no. 7, pp. 1165-1173, Jul. 2007.
[148] I. Hubatsch, E. G. E. Ragnarsson, and P. Artursson, “Determination of drug permeability and prediction of drug absorption in Caco-2 monolayers,” Nature Protocols, vol. 2, no. 9, pp. 2111-2119, 2007.
[149] J. Kartenbeck, K. Schwechheimer, R. Moll, and W. W. Franke, “Attachment of vimentin filaments to desmosomal plaques in human meningiomal cells and arachnoidal tissue,” The Journal of Cell Biology, vol. 98, no. 3, pp. 1072-1081, Mar. 1984.
[150] H. Bohets et al., “Strategies for absorption screening in drug discovery and development,” Current Topics in Medicinal Chemistry, vol. 1, no. 5, pp. 367-383, Nov. 2001.
[151] M. Nachtigal, S. Nachtigal, A. Lungeanu, and J. C. Macnab, “Chromosome changes in rat embryo cell lines transformed by temperature-sensitive mutants and sheared DNA of herpes simplex virus,” Cancer Genetics and Cytogenetics, vol. 7, no. 4, pp. 313-326, Dec. 1982.

117
[152] M. B. Carpenter, Core Text of Neuroanatomy, 4th ed. Williams & Wilkins, 1991. [153] B. C. Lee, D. G. Gomez, D. G. Potts, and A. M. Pavese, “Passage of Amipaque (metrizamide)
through the arachnoid granulations,” Neuroradiology, vol. 17, no. 4, pp. 185-190, Apr. 1979.
[154] C. H. Lam, E. A. Hansen, and A. Hubel, “Arachnoid cells on culture plates and collagen scaffolds: phenotype and transport properties,” Tissue Engineering. Part A, vol. 17, no. 13-14, pp. 1759-1766, Jul. 2011.
[155] M. Hasegawa, T. Yamashima, S. Kida, and J. Yamashita, “Membranous ultrastructure of human arachnoid cells,” Journal of Neuropathology and Experimental Neurology, vol. 56, no. 11, pp. 1217-1227, Nov. 1997.
[156] C. Janson, L. Romanova, E. Hansen, A. Hubel, and C. Lam, “Immortalization and functional characterization of rat arachnoid cell lines,” Neuroscience, vol. 177, pp. 23-34, Mar. 2011.
[157] M. A. Deli, “Potential use of tight junction modulators to reversibly open membranous barriers and improve drug delivery,” Biochimica Et Biophysica Acta, vol. 1788, no. 4, pp. 892-910, Apr. 2009.
[158] J. Karczewski and J. Groot, “Molecular physiology and pathophysiology of tight junctions III. Tight junction regulation by intracellular messengers: differences in response within and between epithelia,” American Journal of Physiology. Gastrointestinal and Liver Physiology, vol. 279, no. 4, pp. G660-665, Oct. 2000.
[159] B. T. Hawkins and T. P. Davis, “The blood-brain barrier/neurovascular unit in health and disease,” Pharmacological Reviews, vol. 57, no. 2, pp. 173-185, Jun. 2005.
[160] G. T. Knipp, N. F. Ho, C. L. Barsuhn, and R. T. Borchardt, “Paracellular diffusion in Caco-2 cell monolayers: effect of perturbation on the transport of hydrophilic compounds that vary in charge and size,” Journal of Pharmaceutical Sciences, vol. 86, no. 10, pp. 1105-1110, Oct. 1997.
[161] T. Seki, H. Kanbayashi, T. Nagao, S. Chono, Y. Tabata, and K. Morimoto, “Effect of cationized gelatins on the paracellular transport of drugs through caco-2 cell monolayers,” Journal of Pharmaceutical Sciences, vol. 95, no. 6, pp. 1393-1401, Jun. 2006.
[162] M. Sakai, A. B. Noach, M. C. Blom-Roosemalen, A. G. de Boer, and D. D. Breimer, “Absorption enhancement of hydrophilic compounds by verapamil in Caco-2 cell monolayers,” Biochemical Pharmacology, vol. 48, no. 6, pp. 1199-1210, Sep. 1994.
[163] F. Liu, M. J. Soares, and K. L. Audus, “Permeability properties of monolayers of the human trophoblast cell line BeWo,” The American Journal of Physiology, vol. 273, no. 5 Pt 1, pp. C1596-1604, Nov. 1997.
[164] E. B. Izevbigie, J. S. Gutkind, and P. E. Ray, “Isoproterenol inhibits fibroblast growth factor-2-induced growth of renal epithelial cells,” Pediatric Nephrology (Berlin, Germany), vol. 14, no. 8-9, pp. 726-734, Aug. 2000.
[165] C. G. Wigham, H. C. Turner, J. Swan, and S. A. Hodson, “Modulation of corneal endothelial hydration control mechanisms by Rolipram,” Pflügers Archiv: European Journal of Physiology, vol. 440, no. 6, pp. 866-870, Oct. 2000.
[166] R. A. Skinner, R. M. Gibson, N. J. Rothwell, E. Pinteaux, and J. I. Penny, “Transport of interleukin-1 across cerebromicrovascular endothelial cells,” British Journal of Pharmacology, vol. 156, no. 7, pp. 1115-1123, Apr. 2009.

118
[167] A. Adson et al., “Quantitative approaches to delineate paracellular diffusion in cultured epithelial cell monolayers,” Journal of Pharmaceutical Sciences, vol. 83, no. 11, pp. 1529-1536, Nov. 1994.
[168] R. C. Lanman, J. A. Burton, and L. S. Schanker, “Diffusion coefficients of some 14 C-labeled saccharides of biological interest,” Life Sciences. Pt. 2: Biochemistry, General and Molecular Biology, vol. 10, no. 14, pp. 803-811, Jul. 1971.
[169] R. Al-Sadi, K. Khatib, S. Guo, D. Ye, M. Youssef, and T. Y. Ma, “Occludin Regulates Macromolecule Flux across the Intestinal Epithelial Tight Junction Barrier,” American Journal of Physiology. Gastrointestinal and Liver Physiology, vol. 300, no. 6, pp. G1054-64,Mar. 2011.
[170] Z. Zhang, E. Nadezhina, and K. J. Wilkinson, “Quantifying diffusion in a biofilm of Streptococcus mutans,” Antimicrobial Agents and Chemotherapy, vol. 55, no. 3, pp. 1075-1081, Mar. 2011.
[171] R. C. Brown and T. P. Davis, “Calcium modulation of adherens and tight junction function: a potential mechanism for blood-brain barrier disruption after stroke,” Stroke; a Journal of Cerebral Circulation, vol. 33, no. 6, pp. 1706-1711, Jun. 2002.
[172] K. Grebenkämper and H. J. Galla, “Translational diffusion measurements of a fluorescent phospholipid between MDCK-I cells support the lipid model of the tight junctions,” Chemistry and Physics of Lipids, vol. 71, no. 2, pp. 133-143, May 1994.
[173] R. O. Stuart, A. Sun, K. T. Bush, and S. K. Nigam, “Dependence of epithelial intercellular junction biogenesis on thapsigargin-sensitive intracellular calcium stores,” The Journal of Biological Chemistry, vol. 271, no. 23, pp. 13636-13641, Jun. 1996.
[174] M. Schmidt et al., “A new phospholipase-C-calcium signalling pathway mediated by cyclic AMP and a Rap GTPase,” Nature Cell Biology, vol. 3, no. 11, pp. 1020-1024, Nov. 2001.
[175] E. O. Harrington, J. L. Brunelle, C. J. Shannon, E. S. Kim, K. Mennella, and S. Rounds, “Role of protein kinase C isoforms in rat epididymal microvascular endothelial barrier function,” American Journal of Respiratory Cell and Molecular Biology, vol. 28, no. 5, pp. 626-636, May 2003.
[176] E. Vandenbroucke, D. Mehta, R. Minshall, and A. B. Malik, “Regulation of endothelial junctional permeability,” Annals of the New York Academy of Sciences, vol. 1123, pp. 134-145, Mar. 2008.
[177] G. Bazzoni and E. Dejana, “Endothelial cell-to-cell junctions: molecular organization and role in vascular homeostasis,” Physiological Reviews, vol. 84, no. 3, pp. 869-901, Jul. 2004.
[178] M. S. Balda, L. Gonzalez-Mariscal, K. Matter, M. Cereijido, and J. M. Anderson, “Assembly of the tight junction: the role of diacylglycerol,” The Journal of Cell Biology, vol. 123, no. 2, pp. 293-302, Oct. 1993.
[179] G. Bazzoni, “Endothelial tight junctions: permeable barriers of the vessel wall,” Thrombosis and Haemostasis, vol. 95, no. 1, pp. 36-42, Jan. 2006.
[180] C. Tiruppathi, R. D. Minshall, B. C. Paria, S. M. Vogel, and A. B. Malik, “Role of Ca2+ signaling in the regulation of endothelial permeability,” Vascular Pharmacology, vol. 39, no. 4-5, pp. 173-185, Nov. 2002.
[181] R. Sandoval, A. B. Malik, R. D. Minshall, P. Kouklis, C. A. Ellis, and C. Tiruppathi, “Ca(2+) signalling and PKCalpha activate increased endothelial permeability by disassembly of VE-cadherin junctions,” The Journal of Physiology, vol. 533, no. 2, pp. 433-445, Jun. 2001.

119
[182] M. Holinstat, N. Knezevic, M. Broman, A. M. Samarel, A. B. Malik, and D. Mehta, “Suppression of RhoA activity by focal adhesion kinase-induced activation of p190RhoGAP: role in regulation of endothelial permeability,” The Journal of Biological Chemistry, vol. 281, no. 4, pp. 2296-2305, Jan. 2006.
[183] S. Y. Yuan, “Protein kinase signaling in the modulation of microvascular permeability,” Vascular Pharmacology, vol. 39, no. 4-5, pp. 213-223, Nov. 2002.
[184] P. G. Nagpala, A. B. Malik, P. T. Vuong, and H. Lum, “Protein kinase C beta 1 overexpression augments phorbol ester-induced increase in endothelial permeability,” Journal of Cellular Physiology, vol. 166, no. 2, pp. 249-255, Feb. 1996.
[185] Z. M. Goeckeler and R. B. Wysolmerski, “Myosin light chain kinase-regulated endothelial cell contraction: the relationship between isometric tension, actin polymerization, and myosin phosphorylation,” The Journal of Cell Biology, vol. 130, no. 3, pp. 613-627, Aug. 1995.
[186] A. B. Moy et al., “Histamine and thrombin modulate endothelial focal adhesion through centripetal and centrifugal forces,” The Journal of Clinical Investigation, vol. 97, no. 4, pp. 1020-1027, Feb. 1996.
[187] D. Mehta and A. B. Malik, “Signaling mechanisms regulating endothelial permeability,” Physiological Reviews, vol. 86, no. 1, pp. 279-367, Jan. 2006.
[188] J. Ye, T. Tsukamoto, A. Sun, and S. K. Nigam, “A role for intracellular calcium in tight junction reassembly after ATP depletion-repletion,” The American Journal of Physiology, vol. 277, no. 4 Pt 2, pp. F524-532, Oct. 1999.
[189] S. Pokutta, K. Herrenknecht, R. Kemler, and J. Engel, “Conformational changes of the recombinant extracellular domain of E-cadherin upon calcium binding,” European Journal of Biochemistry / FEBS, vol. 223, no. 3, pp. 1019-1026, Aug. 1994.
[190] J. Qiao, F. Huang, and H. Lum, “PKA inhibits RhoA activation: a protection mechanism against endothelial barrier dysfunction,” American Journal of Physiology. Lung Cellular and Molecular Physiology, vol. 284, no. 6, pp. L972-980, Jun. 2003.
[191] M. R. H. Kooistra, M. Corada, E. Dejana, and J. L. Bos, “Epac1 regulates integrity of endothelial cell junctions through VE-cadherin,” FEBS Letters, vol. 579, no. 22, pp. 4966-4972, Sep. 2005.
[192] L. L. Rubin et al., “A cell culture model of the blood-brain barrier,” The Journal of Cell Biology, vol. 115, no. 6, pp. 1725-1735, Dec. 1991.
[193] T. Kimoto, M. Takanashi, H. Mukai, K.-ichi Ogawara, T. Kimura, and K. Higaki, “Effect of adrenergic stimulation on drug absorption via passive diffusion in Caco-2 cells,” International Journal of Pharmaceutics, vol. 368, no. 1-2, pp. 31-36, Feb. 2009.
[194] Y. Takahashi, H. Kondo, T. Yasuda, T. Watanabe, S.-I. Kobayashi, and S. Yokohama, “Common solubilizers to estimate the Caco-2 transport of poorly water-soluble drugs,” International Journal of Pharmaceutics, vol. 246, no. 1-2, pp. 85-94, Oct. 2002.
[195] D. Hoheisel et al., “Hydrocortisone reinforces the blood-brain properties in a serum free cell culture system,” Biochemical and Biophysical Research Communications, vol. 247, no. 2, pp. 312-315, Jun. 1998.
[196] E. B. M. I. Peixoto and C. B. Collares-Buzato, “Protamine-induced epithelial barrier disruption involves rearrangement of cytoskeleton and decreased tight junction-associated protein expression in cultured MDCK strains,” Cell Structure and Function, vol. 29, no. 5-6, pp. 165-178, Feb. 2005.