the effects of vertical wind shear on the distribution of convection
TRANSCRIPT

2110 VOLUME 130M O N T H L Y W E A T H E R R E V I E W
q 2002 American Meteorological Society
The Effects of Vertical Wind Shear on the Distribution of Convection inTropical Cyclones
KRISTEN L. CORBOSIERO AND JOHN MOLINARI
Department of Earth and Atmospheric Sciences, University at Albany, State University of New York, Albany, New York
(Manuscript received 30 April 2001, in final form 6 March 2002)
ABSTRACT
The influence of vertical wind shear on the azimuthal distribution of cloud-to-ground lightning in tropical cycloneswas examined using flash locations from the National Lightning Detection Network. The study covers 35 Atlanticbasin tropical cyclones from 1985–99 while they were over land and within 400 km of the coast over water. A strongcorrelation was found between the azimuthal distribution of flashes and the direction of the vertical wind shear in theenvironment. When the magnitude of the vertical shear exceeded 5 m s21, more than 90% of flashes occurred downshearin both the storm core (defined as the inner 100 km) and the outer band region (r 5 100–300 km). A slight preferencefor downshear left occurred in the storm core, and a strong preference for downshear right in the outer rainbands.The results were valid both over land and water, and for depression, storm, and hurricane stages. It is argued that inconvectively active tropical cyclones, deep divergent circulations oppose the vertical wind shear and act to minimizethe tilt. This allows the convection maximum to remain downshear rather than rotating with time.
The downshear left preference in the core is stronger for hurricanes than for weaker tropical cyclones. Thissuggests that the helical nature of updrafts in the core, which is most likely for the small orbital periods ofhurricanes, plays a role in shifting the maximum lightning counterclockwise from updraft initiation downshear.The downshear right maximum outside the core resembles the stationary band complex of Willoughby et al.and the rain shield of Senn and Hiser. The existence and azimuthal position of this feature appears to be controlledby the magnitude and direction of the vertical wind shear.
1. Introduction
Vertical wind shear is known to have a negative cor-relation with intensity change in tropical cyclones at allstages of their life cycle (Gray 1968; DeMaria and Kap-lan 1994; Hanley et al. 2001). Despite the importanceof this parameter, the nature of its action remains un-certain. Many authors have noted the role of verticalwind shear in creating azimuthal asymmetries of con-vection in idealized numerical models of tropical cy-clones (e.g., DeMaria 1996; Wang and Holland 1996;Frank and Ritchie 1999, 2001). Yet few observationalstudies have been done, and these typically cover onlyshort periods in one or two storms, owing to the diffi-culty of observing tropical cyclones in nature.
The National Lightning Detection Network (NLDN)provides continuous coverage of cloud-to-ground light-ning in space and time for all tropical cyclones overland and within roughly 400 km of the coastline. As aresult, it is possible to determine the azimuthal lightningdistribution as a function of the vertical wind shear forall tropical cyclones that have moved within range of
Corresponding author address: Kristen L. Corbosiero, Departmentof Earth and Atmospheric Sciences, SUNY Albany, 1400 WashingtonAve., Albany, NY 12222.E-mail: [email protected]
the network since its origin in 1985. Molinari et al.(1994, 1999) and Samsury and Orville (1994) haveshown that NLDN-determined lightning locations aresufficiently accurate to obtain insight into the structureand evolution of convection in tropical cyclones. TheNLDN thus allows a considerable expansion of avail-able case studies.
In the current paper, the effects of vertical wind shearon convective asymmetries in tropical cyclones, as mea-sured by lightning frequency and distribution, will be eval-uated. All named storms in the Atlantic basin that movedwithin range of the NLDN will be studied, both over oceanand over land, as long as they remained classified as trop-ical systems by the National Hurricane Center (NHC). Theresults will be compared to those predicted by theory andnumerical modeling, and to previous observations usingradar reflectivity, precipitation, and vertical motion. Thedata will also provide some insight into how tropical cy-clones respond to vertical shear.
2. Review of vertical wind shear effects on tropicalcyclones
a. Numerical studies
Reasor et al. (2000) have provided a review of verticalshear influences on vortices, including a formal quasi-
AUGUST 2002 2111C O R B O S I E R O A N D M O L I N A R I
geostrophic framework for interpreting the various pro-cesses. Tropical cyclones represent strong vortices inrelatively weak shear, in which vortex temperature gra-dients are much larger than those of the environment.The influence of vertical wind shear has been investi-gated using dry adiabatic dynamics by Raymond (1992),Jones (1995, 2000), DeMaria (1996), and Frank andRitchie (1999). Four general influences on asymmetricvertical motion have been hypothesized (Jones 2000).First, because vertical shear in balanced flow is accom-panied by horizontal temperature gradients, vortex flowalong environmental isentropes will produce downshearupward motion [and upshear downward motion; Ray-mond (1992); Jones (1995)]. Second, as the verticalwind shear begins to tilt the vortex, a compensatingsecondary vertical circulation develops in an attempt tomaintain balanced flow. This circulation, which alsoproduces upward motion downshear and downward mo-tion upshear (Raymond 1992; Jones 1995; DeMaria1996), acts to move the vortex back toward a verticalorientation. In the adiabatic framework, this vertical cir-culation will create potential temperature anomalies inthe vortex, with a cold anomaly downshear and a warmanomaly upshear of the storm center. The third influenceon vortex asymmetries is vortex flow along these dis-torted vortex isentropes. This produces upward motionto the right of the vertical tilt vector, which is initiallydownshear (Raymond 1992). As time progressed, how-ever, Jones (1995, 2000) found that vortex interactionsin the vertical produced a rotation of the tilt vector awayfrom downshear. Because upward motion is favoredright of the tilt vector, the favored quadrant for upwardmotion also rotated in time. Finally, the fourth mech-anism involves the relative flow (the environmental flowminus the motion of the vortex) along the vortex is-entropes associated with the warm core. The pattern ofvertical motion from the fourth effect depends on thevertical profiles of wind and potential vorticity in thevortex. Jones (2000) suggests that this last mechanismis secondary to the second and third mechanisms dis-cussed above.
The previous mechanisms involve dry adiabatic dy-namics only. In a ‘‘full-physics’’ numerical simulationof mature tropical cyclones, Frank and Ritchie (1999,2001) argued that the temperature anomalies in the adi-abatic simulations are no longer present in the saturated,precipitating storm core. They found the maximum up-ward motion lies persistently in the downshear left quad-rant. A key result of Frank and Ritchie (2001) was that,even 48 h after the imposition of a 5 m s21 shear, thevortex was virtually upright, but with a strongly asym-metric, quasi-steady vertical motion pattern, with max-imum upward motion downshear left of the center.
Frank and Ritchie’s (1999, 2001) integrations wereon an f plane. Bender (1997) carried out similar inte-grations on a beta plane. The accompanying beta gyresproduced flow across the vortex from the southeast that,like the vortex itself, weakened with height. A local
shear from the northwest developed across the centeras a result of the beta gyres, in the absence of anyenvironmental shear. This shear reached a magnitude ofnearly 5 m s21 between 850 and 200 hPa. It produced,as would be expected, upward motion downshear(southeast of the center) in a quiescent environment.The evidence suggests that, with regard to convectiveasymmetries in the tropical cyclone core, the beta effectcan be treated simply as an additional vertical sheareffect.
None of the idealized numerical modeling studies pre-viously discussed produced significant outer rainbands.Using the definition of Molinari et al. (1994, 1999),these are bands that initiate (or possibly first becomeelectrified) outside the central dense overcast of the trop-ical cyclone. They reach their maximum intensity, mea-sured by average lightning flash density over severalstorms, about 250 km from the storm center (Molinariet al. 1999). More lightning occurs in outer rainbandsthan in any other part of tropical cyclones (Lyons andKeen 1994; Molinari et al. 1994; Samsury and Orville1994; Cecil and Zipser 1999). Lightning activity willthus be useful for examining asymmetries in such bandsthat cannot be seen using current numerical modelingstudies.
b. Observational studies
As noted earlier, only a few observational studieshave examined the influence of vertical wind shear onconvective asymmetries in tropical cyclones. In the coreof strong tropical cyclones, the updrafts rise helically(Franklin et al. 1993). The latter relates to (i) the smallconvective instability (Bogner et al. 2000) and thus rel-atively small vertical motions (Black et al. 1996) in thecore, and (ii) the large tangential velocity and thus smallorbital period in the core of strong storms. The helicalupdraft arises because the time required for a parcel torise from the surface to the tropopause and the orbitaltime period are of the same magnitude. As a result, anazimuthal separation develops between updraft initia-tion, maximum updraft velocity, and maximum precip-itation. In the presence of moderate or strong verticalshear, the maximum eyewall reflectivity can be as muchas 1808 of azimuth counterclockwise from the azimuthof updraft initiation, literally upshear (Franklin et al.1993). Frank and Ritchie (2001) simulated this struc-ture; their maximum rainfall extended from 908 left ofthe shear vector around to upshear in the eyewall, evenwhile maximum upward motion remained about 458 leftof the shear vector.
Observational studies show a relatively consistent in-fluence of vertical wind shear in the storm core (Franklinet al. 1993; Gamache et al. 1997; Reasor et al. 2000).In general, updrafts initiate downshear, maximum ver-tical motion in the core is downshear left, and maximumprecipitation is further displaced counterclockwise. Thisstructure was present for vertical wind shear magnitudes
2112 VOLUME 130M O N T H L Y W E A T H E R R E V I E W
of 7–15 m s21. When vertical shear was 3 m s21, re-flectivity patterns were much closer to axisymmetric(Gamache et al. 1997; Reasor et al. 2000). None of thesepapers considered convective asymmetries outside thecore region.
Willoughby et al. (1984) produced a schematic dia-gram of radar reflectivity in tropical cyclones that in-cluded convective structure outside the core. In Wil-loughby et al.’s diagram, high reflectivity in the eyewallextended in a counterclockwise direction from directlydownshear to directly upshear, similar to the structuredescribed earlier. Outside the tropical cyclone core theydescribed a ‘‘stationary band complex’’ (SBC) that oc-curred downshear at radii of approximately 80–120 km.The SBC contained a dominant band (the ‘‘principalband’’) plus a number of typically nonconvective sec-ondary bands closer to the center. The schematic ofWilloughby et al. (1984) does not extend beyond the150-km radius because reconnaissance aircraft do notroutinely sample larger radii. The SBC resembles the‘‘rain shield’’ described in tropical cyclones by Sennand Hiser (1959) using radar data. The rain shield wasa quasi-stationary region (with respect to the movingcenter) they described as a ‘‘graveyard for rainbands’’that had earlier propagated outward from inner radii.
The current study will examine the problem usingcloud-to-ground lightning. The results will provide ameasure of asymmetries in active convection over alarge number of storms of varying intensity, over waterand over land, for three ranges of vertical wind shearmagnitude.
3. Data
a. NLDN
Lightning data were obtained from archived obser-vations of the NLDN, which was originally developedat the University at Albany, and is currently operatedand maintained by Global Atmospherics, Inc. (GAI) ofTucson, Arizona. Full descriptions of the operation andequipment of the NLDN can be found in Krider et al.(1976), Orville et al. (1987), Orville (1991) and Cum-mins et al. (1992, 1998).
As with all remotely sensed data, caution must beused when interpreting the results. As long as the stormsare within 400 km of at least one sensor, the decreasein detection efficiency with increasing distance from theNLDN seems not to be as important as the physical anddynamical processes within the hurricane itself in de-termining the spatial distribution of flashes (Molinari etal. 1999). Over the continental United States detectionefficiency was noted to be in the range of 50%–80%from 1985–94 (Orville et al. 1987; Cummins et al. 1992;Orville 1994). According to Cummins et al. (1992), 50%of flashes detected inside the original network are ac-curate within 8 km, except for the region between thesouth tip of Florida and Cuba where errors associated
with the geometry of the sensors affect the location offlashes. This number is in agreement with Orville (1994)who cites a network accuracy between 4–8 km in theyears 1989–91.
After the major upgrade and reconfiguration of thenetwork in 1994, Cummins et al. (1998) found that,according to their idealized model, the upgraded net-work should have a detection efficiency of 80%–90%and a mean accuracy of 0.5–1.0 km over much of thecontinental United States for flashes over 5 kA (theirFig. 7). The exception is again the area south of KeyWest, Florida, where the projected detection drops to40% and the location errors may be as great as 8–10km. Idone et al. (1998a,b) carried out tests in Albany,New York, during the summers of 1994–96 using videocameras to record lightning flashes. They found groundflash detection efficiencies of 67% before the upgradein 1994, and 72% in 1996 after the completion of theupgrade. Location accuracy was 2.61 km in 1994 and0.435 km in 1995, representing a substantial improve-ment in upstate New York from the previous configu-ration of the network.
Based on the results of these earlier studies, it is ex-pected that the updated network will sense a larger frac-tion of existing flashes, with greater location accuracy,in storms occurring during and after 1994, versus the1985–93 period. In this study, the spatial distribution offlashes is of primary interest. This distribution shouldnot be influenced by changes in detection efficiency aslong as a sufficient sample of flashes is present (seesection 4b). As a result, no further delineation of theold and new NLDN configurations will be made.
b. ECMWF analyses
Vertical wind shear calculations were made usinggridded analyses from the European Centre for Medium-Range Weather Forecasts (ECMWF). The grids contain12 (13 after 1992) vertical pressure levels and 1.1258latitude–longitude horizontal resolution. The grids areinterpolated bilinearly in the horizontal (Molinari andVollaro 1989) to yield cylindrical grids, centered on theNHC best track storm position, with dr 5 100 km anddl 5 58.
Following Hanley et al. (2001), a cylindrical area-weighted average of the Cartesian components of themean wind were computed over a radius of 500 kmfrom the storm center. This averaging removes a sym-metric vortex so that the resulting winds are a measureof the cross-storm flow at each level. The vertical windshear is then calculated from these mean winds between850 and 200 hPa every 12 h.
Because the cylindrical grids are centered on the ob-served positions from NHC, the difference in centerposition between the NHC best track dataset and theECMWF analyses is a potentially important issue. Mol-inari et al. (1992) found the average position error ofthe gridded analyses for Hurricane Elena (1985) was

AUGUST 2002 2113C O R B O S I E R O A N D M O L I N A R I
about 120 km. Because of this discrepancy between thecenters, the area-average calculation for mean windcomponents was done over 500 km even though thisstudy focuses on lightning over only the 300 km sur-rounding the storm. The larger radius was chosen inorder to maximize the overlap between the areas sur-rounding the ECMWF and NHC centers.
Molinari and Vollaro (1990) objectively analyzed aspecial set of satellite-derived cloud drift winds at 200hPa for Hurricane Elena (1985). The vector differencein that study between the mean objectively analyzedwind averaged over a 500-km radius from the stormcenter and the mean wind over the same region fromthe ECMWF gridded analyses has since been calculated(D. Vollaro 2001, personal communication). The medianvalue of this vector difference over 12 analysis timeswas found to be 1.4 m s21. This provides a measure ofuncertainty in the mean wind from the ECWMF anal-yses at the 200-hPa level for storms near the UnitedStates coast. Because the vector errors could either addor cancel between 850 and 200 hPa, it is estimated thatmedian errors in calculated 850–200-hPa vertical windshear in this paper will be 1–2 m s21.
The vertical wind shear categories that will be usedin this study are 0–5, 5–10 and .10 m s21. As a result,although errors in the estimated shear will shift sometime periods into an adjacent category, we do not an-ticipate a significant bias will be introduced by the errorsin the estimates of vertical shear. In addition, Molinariet al. (1995) noted the accuracy of ECMWF analysesof storms relatively close to the rawinsonde networkover the United States mainland. Because this study isrestricted to storm centers within 400 km of the coast-line, the vertical wind shear estimates from the ECMWFanalyses are likely to be sufficiently accurate.
It was noted earlier that the beta effect can be con-sidered simply an additional influence of vertical shear,in that it induces a northwesterly vertical wind shear ofup to 5 m s21 added to the environmental shear. In theECMWF analyses, a beta effect must be present, be-cause the ECMWF model contains a simulated vortexin the presence of a variable Coriolis parameter. Thesimulated tropical cyclone vortex in the global modelwill most likely be larger and weaker than that in nature.An unrealistically large vortex would have stronger betagyres, and a weaker vortex would have weaker betagyres, compared to their actual structure in nature. It isthus likely that errors partially offset in the simulatedbeta gyres, and the vertical wind shear associated withbeta gyres is likely represented to some degree by thegridded analyses. As a result, no adjustments of thecalculated shear were made to account for the beta ef-fect.
c. NHC Best Track
Tropical cyclone latitude, longitude, and intensitywere obtained at 6-h intervals from the NHC best track
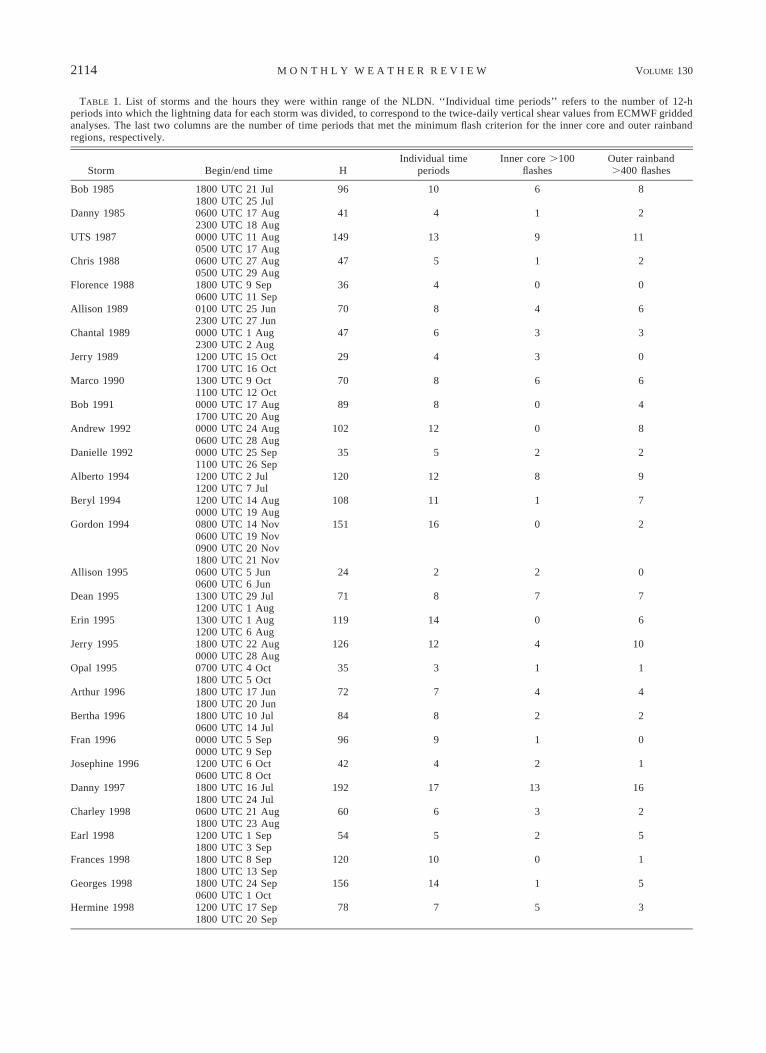
dataset. Between the available center position times, thedata were linearly interpolated to estimate the hourlycenter positions of the storms. Table 1 lists the 35 At-lantic basin tropical cyclones examined in this studyand the times their centers were in range of the NLDN(i.e., within 400 km of at least one magnetic fieldsensor). For each of the hours listed, flashes were totaledand plotted with respect to the interpolated hourly centerposition. Because the ECMWF analyses were takentwice daily, the hourly periods were grouped togetherinto two 12-h periods each day centered on the analysistimes (i.e., 0600–1800 UTC and 1800–0600 UTC). Fur-thermore, if a storm made landfall within a given 12-hperiod, the period was subdivided into separate pre- andpostlandfall periods. This grouping of the data yields atotal of 303 individual (mostly 12-h) time periods, thebreakdown of which, by storm, is shown in Table 1.The results of this study will not be grouped by storm.Rather, each of the 303 time periods will be treated asan individual data point with its own unique verticalwind shear vector and lightning distribution.
4. Methodology
a. Choice of radial ranges
A common radial distribution of lightning was firstobserved by Molinari et al. (1994, 1999) in Atlanticbasin hurricanes: a weak eyewall maximum 20–60 kmfrom the center, a clear minimum in flash density some-where between the 60- and 140-km radii, and a strongmaximum in the outer rainbands, 200 to 300 km fromthe storm center. Summed over nine hurricanes, the flashminimum occurred in the radial bin between 100 and120 km (Molinari et al. 1999, their Fig. 4). Thus forhurricane-strength disturbances, a radius of 100 km rep-resents a good choice for a dividing line between innerand outer regions for this study. Molinari et al. (1994)proposed that formation of an eyewall creates the dis-tribution described above, because debris from the eye-wall creates a mesoscale anvil region of falling hydro-meteors outside the eyewall that suppresses deep con-vection. In tropical cyclones of less than hurricanestrength, which are unlikely to have well-developed eye-walls, the radii of flash maxima and minima are morevariable (Molinari et al. 1999, their Fig. 6). In principlean optimum radius of division between inner and outerregions could be defined storm by storm, but becausethe data in this study will be divided into individual 12-h periods, this procedure is potentially arbitrary andmisleading. The 100-km radius will be chosen as thedividing line for all time periods. The region inside 100km will be referred to as the inner core, and the 100–300-km radii will be referred to as the outer band region.
b. Minimum flash criteria
On average per 12-h time period over all storms, 162flashes occurred within the inner core and 1475 flashes
2114 VOLUME 130M O N T H L Y W E A T H E R R E V I E W
TABLE 1. List of storms and the hours they were within range of the NLDN. ‘‘Individual time periods’’ refers to the number of 12-hperiods into which the lightning data for each storm was divided, to correspond to the twice-daily vertical shear values from ECMWF griddedanalyses. The last two columns are the number of time periods that met the minimum flash criterion for the inner core and outer rainbandregions, respectively.
Storm Begin/end time HIndividual time
periodsInner core .100
flashesOuter rainband.400 flashes
Bob 1985 1800 UTC 21 Jul1800 UTC 25 Jul
96 10 6 8
Danny 1985 0600 UTC 17 Aug2300 UTC 18 Aug
41 4 1 2
UTS 1987 0000 UTC 11 Aug0500 UTC 17 Aug
149 13 9 11
Chris 1988 0600 UTC 27 Aug0500 UTC 29 Aug
47 5 1 2
Florence 1988 1800 UTC 9 Sep0600 UTC 11 Sep
36 4 0 0
Allison 1989 0100 UTC 25 Jun2300 UTC 27 Jun
70 8 4 6
Chantal 1989 0000 UTC 1 Aug2300 UTC 2 Aug
47 6 3 3
Jerry 1989 1200 UTC 15 Oct1700 UTC 16 Oct
29 4 3 0
Marco 1990 1300 UTC 9 Oct1100 UTC 12 Oct
70 8 6 6
Bob 1991 0000 UTC 17 Aug1700 UTC 20 Aug
89 8 0 4
Andrew 1992 0000 UTC 24 Aug0600 UTC 28 Aug
102 12 0 8
Danielle 1992 0000 UTC 25 Sep1100 UTC 26 Sep
35 5 2 2
Alberto 1994 1200 UTC 2 Jul1200 UTC 7 Jul
120 12 8 9
Beryl 1994 1200 UTC 14 Aug0000 UTC 19 Aug
108 11 1 7
Gordon 1994 0800 UTC 14 Nov0600 UTC 19 Nov0900 UTC 20 Nov1800 UTC 21 Nov
151 16 0 2
Allison 1995 0600 UTC 5 Jun0600 UTC 6 Jun
24 2 2 0
Dean 1995 1300 UTC 29 Jul1200 UTC 1 Aug
71 8 7 7
Erin 1995 1300 UTC 1 Aug1200 UTC 6 Aug
119 14 0 6
Jerry 1995 1800 UTC 22 Aug0000 UTC 28 Aug
126 12 4 10
Opal 1995 0700 UTC 4 Oct1800 UTC 5 Oct
35 3 1 1
Arthur 1996 1800 UTC 17 Jun1800 UTC 20 Jun
72 7 4 4
Bertha 1996 1800 UTC 10 Jul0600 UTC 14 Jul
84 8 2 2
Fran 1996 0000 UTC 5 Sep0000 UTC 9 Sep
96 9 1 0
Josephine 1996 1200 UTC 6 Oct0600 UTC 8 Oct
42 4 2 1
Danny 1997 1800 UTC 16 Jul1800 UTC 24 Jul
192 17 13 16
Charley 1998 0600 UTC 21 Aug1800 UTC 23 Aug
60 6 3 2
Earl 1998 1200 UTC 1 Sep1800 UTC 3 Sep
54 5 2 5
Frances 1998 1800 UTC 8 Sep1800 UTC 13 Sep
120 10 0 1
Georges 1998 1800 UTC 24 Sep0600 UTC 1 Oct
156 14 1 5
Hermine 1998 1200 UTC 17 Sep1800 UTC 20 Sep
78 7 5 3

AUGUST 2002 2115C O R B O S I E R O A N D M O L I N A R I
TABLE 1. (Continued)
Storm Begin/end time HIndividual time
periodsInner core .100
flashesOuter rainband.400 flashes
Bret 1999 1800 UTC 8 Aug0000 UTC 25 Aug
78 8 2 8
Dennis 1999 1800 UTC 28 Aug1800 UTC 7 Sep
120 21 4 5
Floyd 1999 1800 UTC 13 Sep1200 UTC 17 Sep
90 8 0 0
Harvey 1999 0600 UTC 20 Sep0000 UTC 22 Sep
42 5 4 5
Irene 1999 0600 UTC 15 Oct0000 UTC 19 Oct
90 9 5 3
TABLE 2. Two ways of quantifying the azimuthal distribution of lightning: 1) The total number of flashes that occurred in each quadrant,and 2) the number of 12-h periods the flash count was highest in each quadrant.
Region Method Northwest Northeast Southeast Southwest
Inner core FlashesHighest flash count
819624
13 49328
27 21342
498712
Outer band FlashesHighest flash count
41 42216
77 02445
128 13163
117 95530
within the outer band region. When these values arenormalized by area, the two regions have almost equalflash densities of 52 and 58 flashes per (100 km)2 per12 h, respectively. A huge range of flash counts occurredover 12-h periods, from zero to several thousand. Be-cause the azimuthal distribution of flashes is not mean-ingful for low-flash counts, a lower limit flash criterionwas formulated to restrict the number of cases exam-ined. Minimum counts of 50 and 400 flashes per timeperiod were chosen for the inner core and outer bandregions, respectively. When the area of each region istaken into account, the flash density criteria are equalfor the two regions, at approximately 16 flashes per (100km)2 per 12 h. This value was chosen to maximize thenumber of time periods while excluding those periodsin which flashes were too few for a meaningful estimateof the quadrant of maximum lightning activity.
With these flash count criteria applied, 106 inner coreand 154 outer rainband region time periods remainedof the original 303. The number of times that met theflash criteria, by storm, are listed in the last two columnsof Table 1.
The elimination of 12-h periods with low flash countspreferentially removes storms with certain characteris-tics. Specifically, the percentage of hurricane-strengthdisturbances was reduced in both the inner core andouter band regions, and the percentage of high-shear(.10 m s21) time periods was reduced in the outerrainband region. Further details of these results can befound in the appendix.
c. Quantification of the azimuthal distribution
Compared to the radial distribution of lightning, theazimuthal distribution of flashes has received far less
attention. Samsury and Orville (1994) noted in theirstudy of Hurricanes Hugo (1989) and Jerry (1989) thatthe majority of flashes in both storms occurred to theeast of the centers. A similar pattern was found by Mol-inari et al. (1994) in Hurricane Andrew, where 40% ofthe recorded flashes out to 300 km occurred in the north-east quadrant of the storm. Molinari et al. (1999) plottedall flashes occurring within 300 km of the centers ofnine Atlantic tropical cyclones during the hurricanestage only. The majority of flashes in the outer rainbandsoccurred to the south and southeast of the storm centerswith a minimum in flash count to the northwest of thecenter.
Table 2 contains the flash counts per storm-centeredquadrant for the 106 inner core and 154 outer rainbandregion time periods meeting the minimum flash crite-rion. In the inner core, three-quarters of the flashes oc-curred in the eastern half of the storms, with a maximumin the southeast quadrant, consistent with previous stud-ies. The majority of outer rainband flashes (68%) oc-curred to the south of the center, with a maximum inthe southeast quadrant and a minimum in the northwestquadrant, comparable to the results of Molinari et al.(1999).
The straight flash counts per quadrant are skewed bystorms that contained large amounts of lightning. Forexample, 21% of the 54 000 inner core flashes noted inTable 2 were from 11 Tropical Storm/Hurricane Danny(1997) time periods (Table 1), and another 12% fromsix Hurricane Bob (1985) time periods. Thus 33% ofthe flashes were from only 16% of the time periods.
In order to avoid having a few extreme events dom-inate the distribution, the preferred quadrant for light-ning in each 12-h period will be defined simply by thequadrant with the most flashes. The number of times

2116 VOLUME 130M O N T H L Y W E A T H E R R E V I E W
each quadrant was the one with the highest flash countover all time periods appears in Table 2. This lattermeasure will be used to compare the lightning distri-bution across multiple time periods.
d. Rotation of flash locations
In order to evaluate the effect of the vertical windshear on the distribution of lightning, the flashes in eachtime period were rotated around the storm center so thatthe shear vector for the period was pointing due north.The quadrant with the highest number of flashes afterthis rotation was then determined. Data will be exam-ined in this shear-rotated coordinate system in the re-mainder of this paper.
5. Vertical wind shear influences
a. Inner core region
Figures 1a–c show all ground flashes occurring withinthe inner core region for the weak-, medium-, andstrong-shear time periods, respectively, rotated so thatthe shear vector in each case is pointing due north. Theweak-shear plot has the most symmetric distribution ofthe three, but still has the majority (69%) of flashesdownshear. The medium-shear distribution contains thelargest number of flashes and also shows a clear down-shear signal (90% of flashes). Almost all of the flashesduring strong-shear time periods occur in the downshearquadrants (93%) with a slight downshear left preference.Thus, as the strength of the vertical shear increases sodoes the strength of the downshear relationship.
Figure 2 provides similar information to Fig. 1, butin terms of the number of time periods in the inner corefor which the flash count was highest in each of theshear-rotated quadrants. The upper two squares in eachbox represent the downshear quadrants.
The lower-right box of the figure gives the sum overall magnitudes of shear. It shows that 86% (91 of 106)of time periods appear in the downshear quadrants ofthe storms in the inner core. The strength of this rela-tionship increases with the strength of the shear: highestflash counts appear downshear in 65% of time periodsfor weak shear, 91% for medium shear, and 93% forstrong shear. Weak- and medium-shear time periods ex-hibit no downshear left or right preference, while thestrong-shear time periods show a definite downshear leftsignal that carries over to the overall distribution for theinner 100 km and produces a downshear left preferencefor core lightning strikes. These numbers are similar tothe absolute flash count percentages given previously,except that Fig. 2 shows a different quadrant of maxi-mum activity than Fig. 1 for medium shear. As notedearlier, this reflects the artificially large influence of afew storms with very high flash counts. The quadrantplots of Fig. 2 give a more representative measure ofthe behavior over a large number of tropical cyclones.
It is apparent from Fig. 2 that vertical wind shear hasan enormous influence on the organization of convectioncontaining cloud-to-ground lightning in the inner coreof tropical cyclones. For values of shear greater than 5m s21, the direction of the shear appears to be the majorfactor in the observed convective asymmetries in thetropical cyclone core.
b. Outer rainband region
Figure 3 shows all of the shear-rotated flashes oc-curring in the outer rainbands for the 45 time periodswith strong vertical shear. Eighty-five percent of the80 844 flashes occurred downshear of the center. Astrong preference for the downshear right quadrant wasseen, with 63% of flashes in this quadrant. This maxi-mum in flash count is located approximately 908 clock-wise from the downshear left maximum in the innercore seen in Fig. 1c.
Figure 4 shows the same quadrant plots as Fig. 2, butfor the outer rainband region. A strong correlation be-tween the direction of the vertical wind shear vector andthe azimuthal distribution of lightning is evident, witha greater percentage of time periods having their highestflash frequency downshear as the magnitude of the shearincreases. Sixty-one of the 70 (87%) medium-shear and39 of 45 (87%) strong-shear time periods have maxi-mum lightning in the downshear quadrants. Weak-sheartime periods have a neither a downshear left nor rightpreference, while medium- and strong-shear time pe-riods show a strong downshear right signal. The quad-rant plot of the sum over all strengths of shear (lower-right box of Fig. 4) shows that 84% of the quadrantshaving the highest flash frequency lie downshear and54% downshear right.
Overall, as the strength of the shear increases, a largerpercentage of time periods in the outer rainband regionhave their highest flash counts downshear and, more-over, downshear right. Thus it appears that the azimuthaldistribution of cloud-to-ground flashes in the outer rain-bands, like that of the inner core, is dictated to a largedegree by the direction and magnitude of the verticalwind shear.
c. Influences of storm intensity and underlyingsurface
In the above distributions, storm time periods werebroken down into categories based upon the strength ofthe vertical wind shear, with no consideration given tostorm intensity or the surface over which the storm wasmoving during the time period. These two effects willbe addressed in this section. To facilitate comparison,the tables in this section will show the percentage of12-h periods that each quadrant contained the flash max-imum, rather than the number of such periods as pre-viously shown. Table 3 shows the percentage of timeperiods the flash count was highest per shear-rotated

AUGUST 2002 2117C O R B O S I E R O A N D M O L I N A R I
FIG. 1. Locations of all flashes occurring within 100 km of the storm centers in the (a) 23 weak-shear, (b) 43 medium-shear, and (c) 40strong-shear time periods that met the minimum flash criterion. The flashes have been rotated around the center so that the vertical windshear vector for each time period is pointing due north.
quadrant for the inner core and outer rainband regions,broken into the three standard intensity categories. Inboth regions, the strongest downshear signal is seen inthe tropical storm time periods (;90% downshear), fol-lowed by the tropical depression and the hurricane timeperiods (;80% downshear). In the core, the downshearleft signal discussed in the previous section is seen toincrease with increasing average intensity. In the outerband region, the strong downshear right signal notedabove decreases slightly with increasing storm intensity.
Table 4 shows the percentage of times the flash countwas highest per shear-rotated quadrant for time periodswhen the storm center was over land versus over water.The most striking aspect of Table 4 is the large degreeof agreement between the two underlying surfaces.There is no significant difference between land and wa-ter in the outer rainband region, while the left of shearsignal is slightly more prominent in the inner core overland. Overall, the results of this section show that thestrong influence of vertical wind shear on the azimuthal

2118 VOLUME 130M O N T H L Y W E A T H E R R E V I E W
FIG. 2. Quadrant plots showing the number of times the flash countwas highest per shear-rotated quadrant for weak-, medium-, andstrong-shear time periods. The center of each box represents the stormcenter, and flash locations were rotated such that the vertical windshear vector points due north. The upper two quadrants of each boxrepresent the downshear direction.
FIG. 3. Locations of all flashes occurring in the outer band regionof the 45 individual time periods with strong shear that met theminimum flash criterion. The flashes have been rotated around thecenter so that the vertical wind shear vector for each individual timeperiod is pointing due north.
FIG. 4. Same as in Fig. 2, except for the outer rainband timeperiods meeting the minimum flash criterion.
distribution of active convection holds regardless ofstorm intensity or underlying surface.
d. Composite structure of two tropical cyclones
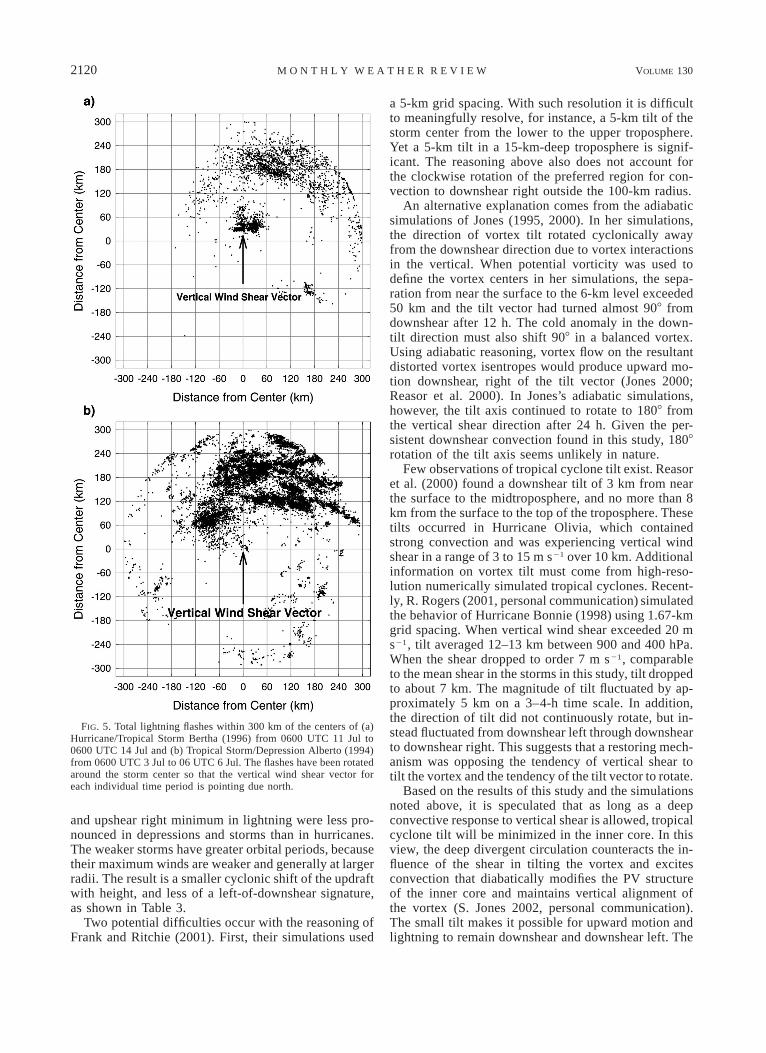
In this section, composite lightning plots of twostorms, Hurricane Bertha (1996) and Tropical Storm/Depression Alberto (1994), will be presented. Thesestorms have been chosen because they contain all of thefeatures discussed in the above sections. It is importantto note that all storms do not behave in this manner.For example, many individual time periods contain onlyan outer rainband maximum in lightning, with very fewcore flashes, while some time periods contain explosivecore outbreaks in lightning and relatively inactive outerrainbands.
Figure 5a shows the total cloud-to-ground lightningflashes within 300 km of the center of Hurricane Bertha(1996) from 0600 UTC 11 July to 0600 UTC 14 July.The flashes have been rotated around the center to alignthe vertical wind shear vector with due north for each12-h period. Bertha (1996) was a category 1 or 2 hur-ricane throughout the time periods shown in Fig. 5a asit moved towards the north embedded in an environmentof strong westerly vertical shear. Bertha made landfallon the North Carolina coastline at 2000 UTC 12 July,so that of the seven time periods in Fig. 5a, five are
over water. Many features of the typical radial distri-bution of lightning in hurricanes presented by Molinariet al. (1999) are seen. An eyewall peak in flashes isobserved between 30 and 60 km from the center. This

AUGUST 2002 2119C O R B O S I E R O A N D M O L I N A R I
TABLE 3. Percent of 12-h time periods that the flash count was highest per shear-rotated quadrant, broken down as a function of stormintensity.
Region CategoryDownshear
leftDownshear
rightUpshear
rightUpshear
left
Inner core Tropical depressionTropical stormHurricane
474956
354325
760
112
19Outer rainband Tropical depression
Tropical stormHurricane
233929
575447
115
18
926
TABLE 4. Percent of 12-h time periods that the flash count washighest per shear-rotated quadrant, for inner core and outer rainbandregions, at times the tropical cyclone centers were over land vs overwater.
RegionDownshear
leftDownshear
rightUpshear
leftUpshear
right
Land inner core 54 32 6 8Water inner core 45 41 9 5Land outer rainband 30 53 11 6Water outer rainband 33 52 10 5
outbreak exists directly downshear of the center withno left or right preference. A distinct minimum in flashdensity is noted 100–180 km from the center in theweakly electrified inner band region described by Mol-inari et al. (1994, 1999). Outward of 180 km, bands offlashes curve around the center from directly downshearof the storm to the right of shear.
Figure 5b shows the vertical wind shear–rotated flash-es occurring within 300 km of the center of TropicalStorm/Depression Alberto (1994) from 0600 UTC 3July to 0600 UTC 6 July. The six time periods plottedare all after Alberto made landfall on the Florida pan-handle. During this time the storm weakened and driftedslowly toward the northeast in an environment of mod-erate north-northwesterly wind shear. Several differenc-es between the distributions in Figs. 5a and 5b can beseen. The most obvious is the larger number of flashes(15 989 vs 2996) in Alberto (1994). This difference isconsistent with the greater electrification expected ofweaker tropical cyclones (Molinari et al. 1999). It isalso consistent with the results presented in the appen-dix, in that the magnitude of the shear in HurricaneBertha (1996) was almost twice that of Tropical StormAlberto (1994); larger shear tended to be associated withfewer flashes in the outer rainbands.
The distinct radial distribution of flashes seen in Hur-ricane Bertha (1996) (eyewall maximum, inner rainbandminimum, outer rainband maximum) is not observed inTropical Storm/Depression Alberto (1994). Instead, thelatter has no clear-cut minimum between the storm coreand outer bands. Molinari et al. (1999) argued that trop-ical storm or weaker disturbances lack a well-definedeyewall, and thus lack the convective suppression as-sociated with the melting and evaporation of hydro-meteors ejected from the eyewall. The inner peak of
flashes in Alberto (1994) is more diffuse and locatedfarther from the center, 60–100 km, than in Bertha(1996). This is consistent with the results of Heller(1999), who found weaker hurricanes and tropicalstorms had inner peaks that were located at larger radiiand covered a larger area than strong hurricanes.
The point to note from Figs. 5a and 5b is the strikinglysimilar azimuthal distribution of convection with respectto vertical wind shear. The large majority of flasheswithin 100 km of the center appear downshear, whileflashes in outer rainbands are most frequent downshearright. The inner flash maxima tend to be quasi-circular,while the flashes in the outer region tend to be elongatedinto banded structures. This distinct distribution is seenfor two storms with different intensities, different mag-nitudes of shear, and different underlying surfaces.
6. Discussion
The clearest signature in the lightning distribution isthe strong preference for maxima in the downshearquadrants in both the inner core (r , 100 km) and outerrainband region (r 5 100–300 km) of tropical cyclones.This basic result held equally well over land and overwater, and for tropical cyclones of all intensities. Thesimplest explanation for this behavior comes from thework of Frank and Ritchie (2001). They showed thatfor vertical shear of up to 10 m s21 over the depth ofthe troposphere, a simulated hurricane-strength vortexremained upright, but with strong asymmetric verticalcirculations, for 24–30 h after the shear was imposed.Essentially a balance occurred between the tendency ofthe vertical shear to tilt the vortex and the action ofdeep, convectively driven circulations to force it backtoward a vertical orientation. To the extent that such abalance occurs, the favored region for upward motionwould remain downshear, as was observed in this study.
Frank and Ritchie (2001) also found that maximumvertical motion occurred in the downshear left quadrantin their moist simulations. They argued that updraftsinitiate downshear and rise helically. The helical updraftdevelops because orbital periods are so small in the coreof hurricanes. Based upon this reasoning, the maximumlightning frequency should be shifted counterclockwisefrom downshear. This is supported by the results of thispaper shown in Table 3: the downshear left maximum
2120 VOLUME 130M O N T H L Y W E A T H E R R E V I E W
FIG. 5. Total lightning flashes within 300 km of the centers of (a)Hurricane/Tropical Storm Bertha (1996) from 0600 UTC 11 Jul to0600 UTC 14 Jul and (b) Tropical Storm/Depression Alberto (1994)from 0600 UTC 3 Jul to 06 UTC 6 Jul. The flashes have been rotatedaround the storm center so that the vertical wind shear vector foreach individual time period is pointing due north.
and upshear right minimum in lightning were less pro-nounced in depressions and storms than in hurricanes.The weaker storms have greater orbital periods, becausetheir maximum winds are weaker and generally at largerradii. The result is a smaller cyclonic shift of the updraftwith height, and less of a left-of-downshear signature,as shown in Table 3.
Two potential difficulties occur with the reasoning ofFrank and Ritchie (2001). First, their simulations used
a 5-km grid spacing. With such resolution it is difficultto meaningfully resolve, for instance, a 5-km tilt of thestorm center from the lower to the upper troposphere.Yet a 5-km tilt in a 15-km-deep troposphere is signif-icant. The reasoning above also does not account forthe clockwise rotation of the preferred region for con-vection to downshear right outside the 100-km radius.
An alternative explanation comes from the adiabaticsimulations of Jones (1995, 2000). In her simulations,the direction of vortex tilt rotated cyclonically awayfrom the downshear direction due to vortex interactionsin the vertical. When potential vorticity was used todefine the vortex centers in her simulations, the sepa-ration from near the surface to the 6-km level exceeded50 km and the tilt vector had turned almost 908 fromdownshear after 12 h. The cold anomaly in the down-tilt direction must also shift 908 in a balanced vortex.Using adiabatic reasoning, vortex flow on the resultantdistorted vortex isentropes would produce upward mo-tion downshear, right of the tilt vector (Jones 2000;Reasor et al. 2000). In Jones’s adiabatic simulations,however, the tilt axis continued to rotate to 1808 fromthe vertical shear direction after 24 h. Given the per-sistent downshear convection found in this study, 1808rotation of the tilt axis seems unlikely in nature.
Few observations of tropical cyclone tilt exist. Reasoret al. (2000) found a downshear tilt of 3 km from nearthe surface to the midtroposphere, and no more than 8km from the surface to the top of the troposphere. Thesetilts occurred in Hurricane Olivia, which containedstrong convection and was experiencing vertical windshear in a range of 3 to 15 m s21 over 10 km. Additionalinformation on vortex tilt must come from high-reso-lution numerically simulated tropical cyclones. Recent-ly, R. Rogers (2001, personal communication) simulatedthe behavior of Hurricane Bonnie (1998) using 1.67-kmgrid spacing. When vertical wind shear exceeded 20 ms21, tilt averaged 12–13 km between 900 and 400 hPa.When the shear dropped to order 7 m s21, comparableto the mean shear in the storms in this study, tilt droppedto about 7 km. The magnitude of tilt fluctuated by ap-proximately 5 km on a 3–4-h time scale. In addition,the direction of tilt did not continuously rotate, but in-stead fluctuated from downshear left through downshearto downshear right. This suggests that a restoring mech-anism was opposing the tendency of vertical shear totilt the vortex and the tendency of the tilt vector to rotate.
Based on the results of this study and the simulationsnoted above, it is speculated that as long as a deepconvective response to vertical shear is allowed, tropicalcyclone tilt will be minimized in the inner core. In thisview, the deep divergent circulation counteracts the in-fluence of the shear in tilting the vortex and excitesconvection that diabatically modifies the PV structureof the inner core and maintains vertical alignment ofthe vortex (S. Jones 2002, personal communication).The small tilt makes it possible for upward motion andlightning to remain downshear and downshear left. The
AUGUST 2002 2121C O R B O S I E R O A N D M O L I N A R I
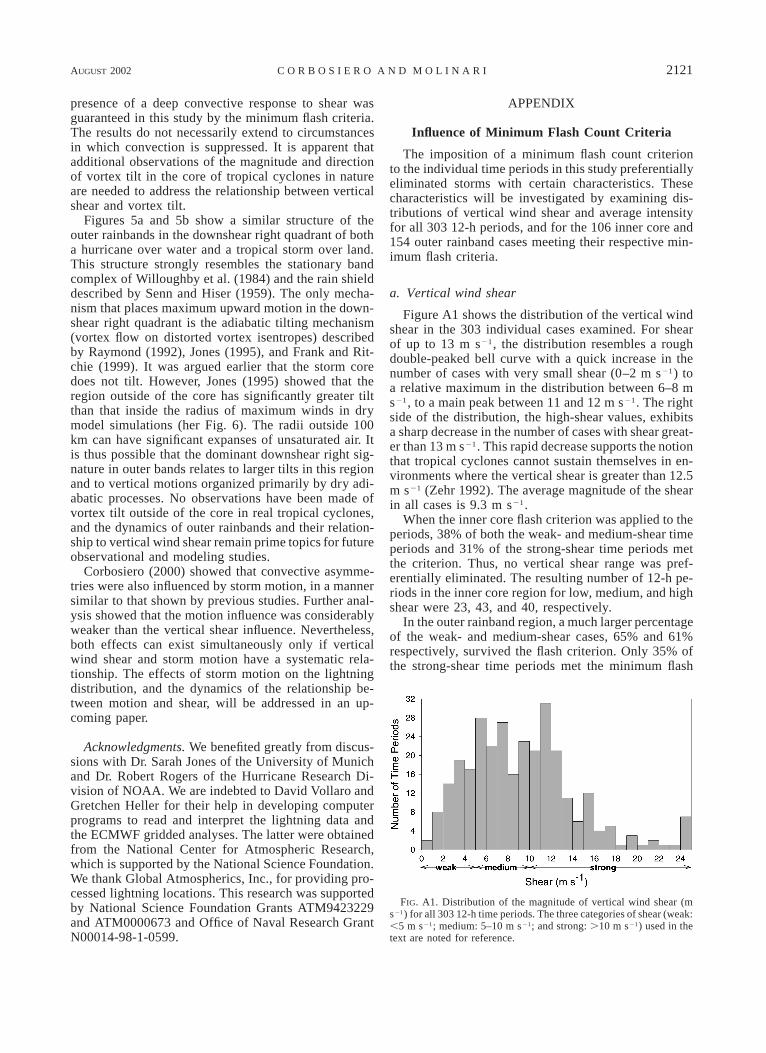
FIG. A1. Distribution of the magnitude of vertical wind shear (ms21) for all 303 12-h time periods. The three categories of shear (weak:,5 m s21; medium: 5–10 m s21; and strong: .10 m s21) used in thetext are noted for reference.
presence of a deep convective response to shear wasguaranteed in this study by the minimum flash criteria.The results do not necessarily extend to circumstancesin which convection is suppressed. It is apparent thatadditional observations of the magnitude and directionof vortex tilt in the core of tropical cyclones in natureare needed to address the relationship between verticalshear and vortex tilt.
Figures 5a and 5b show a similar structure of theouter rainbands in the downshear right quadrant of botha hurricane over water and a tropical storm over land.This structure strongly resembles the stationary bandcomplex of Willoughby et al. (1984) and the rain shielddescribed by Senn and Hiser (1959). The only mecha-nism that places maximum upward motion in the down-shear right quadrant is the adiabatic tilting mechanism(vortex flow on distorted vortex isentropes) describedby Raymond (1992), Jones (1995), and Frank and Rit-chie (1999). It was argued earlier that the storm coredoes not tilt. However, Jones (1995) showed that theregion outside of the core has significantly greater tiltthan that inside the radius of maximum winds in drymodel simulations (her Fig. 6). The radii outside 100km can have significant expanses of unsaturated air. Itis thus possible that the dominant downshear right sig-nature in outer bands relates to larger tilts in this regionand to vertical motions organized primarily by dry adi-abatic processes. No observations have been made ofvortex tilt outside of the core in real tropical cyclones,and the dynamics of outer rainbands and their relation-ship to vertical wind shear remain prime topics for futureobservational and modeling studies.
Corbosiero (2000) showed that convective asymme-tries were also influenced by storm motion, in a mannersimilar to that shown by previous studies. Further anal-ysis showed that the motion influence was considerablyweaker than the vertical shear influence. Nevertheless,both effects can exist simultaneously only if verticalwind shear and storm motion have a systematic rela-tionship. The effects of storm motion on the lightningdistribution, and the dynamics of the relationship be-tween motion and shear, will be addressed in an up-coming paper.
Acknowledgments. We benefited greatly from discus-sions with Dr. Sarah Jones of the University of Munichand Dr. Robert Rogers of the Hurricane Research Di-vision of NOAA. We are indebted to David Vollaro andGretchen Heller for their help in developing computerprograms to read and interpret the lightning data andthe ECMWF gridded analyses. The latter were obtainedfrom the National Center for Atmospheric Research,which is supported by the National Science Foundation.We thank Global Atmospherics, Inc., for providing pro-cessed lightning locations. This research was supportedby National Science Foundation Grants ATM9423229and ATM0000673 and Office of Naval Research GrantN00014-98-1-0599.
APPENDIX
Influence of Minimum Flash Count Criteria
The imposition of a minimum flash count criterionto the individual time periods in this study preferentiallyeliminated storms with certain characteristics. Thesecharacteristics will be investigated by examining dis-tributions of vertical wind shear and average intensityfor all 303 12-h periods, and for the 106 inner core and154 outer rainband cases meeting their respective min-imum flash criteria.
a. Vertical wind shear
Figure A1 shows the distribution of the vertical windshear in the 303 individual cases examined. For shearof up to 13 m s21, the distribution resembles a roughdouble-peaked bell curve with a quick increase in thenumber of cases with very small shear (0–2 m s21) toa relative maximum in the distribution between 6–8 ms21, to a main peak between 11 and 12 m s21. The rightside of the distribution, the high-shear values, exhibitsa sharp decrease in the number of cases with shear great-er than 13 m s21. This rapid decrease supports the notionthat tropical cyclones cannot sustain themselves in en-vironments where the vertical shear is greater than 12.5m s21 (Zehr 1992). The average magnitude of the shearin all cases is 9.3 m s21.
When the inner core flash criterion was applied to theperiods, 38% of both the weak- and medium-shear timeperiods and 31% of the strong-shear time periods metthe criterion. Thus, no vertical shear range was pref-erentially eliminated. The resulting number of 12-h pe-riods in the inner core region for low, medium, and highshear were 23, 43, and 40, respectively.
In the outer rainband region, a much larger percentageof the weak- and medium-shear cases, 65% and 61%respectively, survived the flash criterion. Only 35% ofthe strong-shear time periods met the minimum flash

2122 VOLUME 130M O N T H L Y W E A T H E R R E V I E W
FIG. A2. Distribution of average intensity (defined by the maximumsurface wind speed in m s21) for all 303 12-h time periods. Theconventional classes of tropical cyclone strength are noted for ref-erence.
count. Overall, 39 weak-, 70 medium-, and 45 strong-shear time periods were present in the outer band region.The reason for the relative lack of lightning in the outerrainbands in the presence of strong vertical shear isuncertain.
b. Storm intensity
Storm intensity, defined by the maximum surfacewind speed, is available in the best track dataset every6 h. Because we are dealing with 12-h time periods inthis study an average intensity per 12-h period was cal-culated using a 1–2–1 weighting.
This study is restricted to the times when the stormswere over land (145 time periods) or within 400 km ofthe coastline over water (158 time periods). The sig-nificant percentage of over-land time periods results intropical depressions being most often represented (Fig.A2). Overall, 40% of the time periods studied here aretropical depressions, 34% tropical storms, and 26% hur-ricanes.
When just the time periods meeting the inner coreflash criterion are considered, a significant change inthe distribution of intensity occurs. For maximum windspeeds less than 33 m s21 (the dividing line betweentropical storms and hurricanes), the shape of the distri-bution looks much the same as when all time periodsare examined, with 40% of the time periods meeting thecriterion. For hurricane-strength time periods, however,only 16 of the original 79 (20%) meet the criterion, with11 of those 16 being minimal (category 1) hurricaneswith wind speeds less than 43 m s21. This distributionis consistent with the previous studies of Molinari et al.(1999) and Heller (1999), who found that the averageground flash density in the core was generally larger intropical storms and marginal hurricanes than in stronghurricanes.
The outer rainband minimum flash criterion was metby 54% of the tropical depression and tropical storm
time periods, and 43% of hurricane time periods. Thelatter are equally divided between marginal and stronghurricanes, and thus more strong hurricanes remain inthe dataset for outer rainband regions than inner coreregions.
REFERENCES
Bender, M. A., 1997: The effect of relative flow on the asymmetricstructure of the interior of hurricanes. J. Atmos. Sci., 54, 703–724.
Black, M. L., R. W. Burpee, and F. D. Marks Jr., 1996: Vertical motioncharacteristics of tropical cyclones determined with airborneDoppler radial velocities. J. Atmos. Sci., 53, 802–822.
Bogner, P. B., G. M. Barnes, and J. L. Franklin, 2000: Conditionalinstability and shear for six hurricanes over the Atlantic Ocean.Wea. Forecasting, 15, 192–207.
Cecil, D. J., and E. J. Zipser, 1999: Relationships between tropicalcyclone intensity and satellite-based indicators of inner core con-vection: 85-GHz ice-scattering signature and lightning. Mon.Wea. Rev., 127, 103–123.
Corbosiero, K. L., 2000: The effects of vertical wind shear and stormmotion on the distribution of lightning in tropical cyclones. M.S.thesis, Dept. of Earth and Atmospheric Sciences, University atAlbany, State University of New York, 105 pp.
Cummins, K. L., W. L. Hiscox, A. E. Pifer, and M. W. Maier, 1992:Performance analysis of the U.S. National Lightning DetectionNetwork. Ninth Int. Conf. on Atmospheric Electricity, St. Pe-tersburg, Russia, Amer. Meteor. Soc., 914–919.
——, M. J. Murphy, E. A. Bardo, W. L. Hiscox, R. B. Pyle, and A.E. Pifer, 1998: A combined TOA/MDF technology upgrade ofthe U.S. National Lightning Detection Network. J. Geophys.Res., 103, 9035–9044.
DeMaria, M., 1996: The effect of vertical shear on tropical cycloneintensity change. J. Atmos. Sci., 53, 2076–2087.
——, and J. Kaplan, 1994: A statistical hurricane intensity predictionscheme (SHIPS) for the Atlantic Basin. Wea. Forecasting, 9,209–220.
Frank, W. M., and E. A. Ritchie, 1999: Effects of environmental flowupon tropical cyclone structure. Mon. Wea. Rev., 127, 2044–2061.
——, and ——, 2001: Effects of vertical wind shear on hurricaneintensity and structure. Mon. Wea. Rev., 129, 2249–2269.
Franklin, J. L., S. J. Ford, S. E. Feuer, and F. D. Marks Jr., 1993:The kinematic structure of Hurricane Gloria (1985) determinedfrom nested analyses of dropwindsonde and Doppler radar data.Mon. Wea. Rev., 121, 2433–2451.
Gamache, J. F., H. E. Willoughby, M. L. Black, and C. E. Samsury,1997: Wind shear, sea surface temperature and convection inhurricanes observed by airborne Doppler radar. 22nd Conf. onHurricanes and Tropical Meteorology. Fort Collins, CO, Amer.Meteor. Soc., 121–122.
Gray, W. M., 1968: Global view of the origin of tropical disturbancesand storms. Mon. Wea. Rev., 96, 669–700.
Hanley, D. E., J. Molinari, and D. Keyser, 2001: A composite studyof the interactions between tropical cyclones and upper tropo-spheric troughs. Mon. Wea. Rev., 129, 2570–2584.
Heller, G., 1999: Lightning variations in landfalling tropical cyclones.M.S. thesis, Dept. of Earth and Atmospheric Sciences, StateUniversity of New York at Albany, 138 pp.
Idone, V. P., D. A. Davis, P. K. Moore, Y. Wang, R. W. Henderson,M. Ries, and P. F. Jamason, 1998a: Performance evaluation ofthe National Lightning Detection Network in eastern New York.Part I: Detection efficiency. J. Geophys. Res., 103, 9045–9055.
——, ——, ——, ——, ——, ——, and ——, 1998b: Performanceevaluation of the National Lightning Detection Network in east-ern New York. Part II: Location accuracy. J. Geophys. Res., 103,9057–9069.
Jones, S. C., 1995: The evolution of vortices in vertical shear: I:

AUGUST 2002 2123C O R B O S I E R O A N D M O L I N A R I
Initially barotropic vortices. Quart. J. Roy. Meteor. Soc., 121,821–851.
——, 2000: The evolution of vortices in vertical shear: III: Baroclinicvortices. Quart. J. Roy. Meteor. Soc., 126, 3161–3185.
Krider, E. P., R. C. Noggle, and M. A. Uman, 1976: A gated, widebandmagnetic direction finder for lightning return strokes. J. AppliedMeteor., 15, 301–306.
Lyons, W. A., and C. S. Keen, 1994: Observations of lightning inconvective supercells within tropical storms and hurricanes.Mon. Wea. Rev., 122, 1897–1916.
Molinari, J., and D. Vollaro, 1989: External influences on hurricaneintensity. Part I: Outflow layer eddy momentum fluxes. J. Atmos.Sci., 46, 1093–1105.
——, and ——, 1990: External influences on hurricane intensity. PartII: Vertical structure and response of the hurricane vortex. J.Atmos. Sci., 47, 1902–1918.
——, ——, and F. Robasky, 1992: Use of ECMWF operational anal-yses for studies of the tropical cyclone environment. Meteor.Atmos. Phys., 47, 127–144.
——, P. K. Moore, V. P. Idone, R. W. Henderson, and A. B. Saljoughy,1994: Cloud-to-ground lightning in Hurricane Andrew. J. Geo-phys. Res., 99, 16 665–16 676.
——, S. Skubis, and D. Vollaro, 1995: External influences on hur-ricane intensity. Part III: Potential vorticity evolution. J. Atmos.Sci., 52, 3593–3606.
——, P. Moore, and V. Idone, 1999: Convective structure of hurri-canes as revealed by lightning locations. Mon. Wea. Rev., 127,520–534.
Orville, R. E., 1991: Calibration of a magnetic direction finding net-work using measured triggered lighting return stroke peak cur-rents. J. Geophys. Res., 96, 17 135–17 142.
——, 1994: Cloud-to-ground lightning flash characteristics in thecontiguous United States: 1989–1991. J. Geophys. Res., 99,10 833–10 841.
——, R. A. Weisman, R. B. Pyle, R. W. Henderson, and R. E. OrvilleJr., 1987: Cloud-to-ground lighting flash characteristics fromJune 1984 through May 1985. J. Geophys. Res., 92, 5640–5644.
Raymond, D. J., 1992: Nonlinear balance and potential vorticitythinking at large Rossby number. Quart. J. Roy. Meteor. Soc.,118, 987–1015.
Reasor, P. D., M. T. Montgomery, F. D. Marks Jr., and J. F. Gamache,2000: Low-wavenumber structure and evolution of the hurricaneinner core observed by airborne dual-Doppler radar. Mon. Wea.Rev., 128, 1653–1680.
Samsury, C. E., and R. E. Orville, 1994: Cloud-to-ground lightningin tropical cyclones: A study of Hurricanes Hugo (1989) andJerry (1989). Mon. Wea. Rev., 122, 1887–1896.
Senn, H. V., and H. W. Hiser, 1959: On the origin of hurricane spiralbands. J. Meteor., 16, 419–426.
Wang, Y., and G. J. Holland, 1996: Tropical cyclone motion andevolution in vertical shear. J. Atmos. Sci., 53, 3313–3332.
Willoughby, H. E., F. D. Marks Jr., and R. J. Feinberg, 1984: Sta-tionary and moving convective bands in hurricanes. J. Atmos.Sci., 41, 3189–3211.
Zehr, R. M., 1992: Tropical cyclogenesis in the Western Pacific.NOAA Tech. Rep. NESDIS 61, 181 pp.