the effects of temperature, inlet pollutant concentration, and microorganism concentration on the...
TRANSCRIPT

The Effects of Temperature, Inlet Pollutant Concentration, and Microorganism Concentration on
the Rate of Aerobic Biological Treatment
V. A. VAVILIN, Water Problems Institute, USSR Academy of Sciences, 103064 Moscow, Sadovo-Chemograyazskaya, 1313, USSR
summary
Systematic errors obtained in using traditional models of aerobic waste treatment processes are discussed. These errors are observed to arise due to the lack of matching of traditional models to experimental data in the case of broad variations of process parameters, for instance, organic loading. It is shown that the generalized models of waste treatment proposed earlier by the author permit these errors to be eliminated.
A GENERALIZED MODEL
A generalized model was proposed in refs. 1 and 2 for aerobic biological treatment, describing the specific rate of the process in the form
v = - - 1 - dL p ( L ) = Pmax L" a dt KLL{ + L"
in this case, L = Lo for t = 0 and L = L, for t = T , or
where Lo and L, are the pollutant concentration in the initial and purified liq- uid waste, respectively; a is the biomass in the unit volume of the reactor (for trickling filters and rotating disks, a is proportional to the specific surface of the media or disks); T = V/q is the time of the detention of sewage water in the reactor (where V is the reactor volume and q is the flow of water); pmax is the maximal specific treatment rate; KL is a constant associated with the half-saturation constant KL = numerically equal to the concen- tration L, under which the rate of the process is equal to one-half the max- imal one; n a n d p are positive coefficients with n > p.
For an excessive biomass of microorganisms it is assumed that
Aa = Y(L0 - L,) - baT (3)
Biotechnology and Bioengineering, Vol. XXIV, 4. 2609-2625 0 1982 John Wiley & Sons, Inc. CCC 0006-3592/82/ 122609-1 7M2.70
2610 VAVILIN
where a is the average biomass concentration in the reactor; Y is the yield coefficient for the biomass; b is the biomass autooxidation constant.
Usually in the process of waste treatment
ha << a
and eqs. (1) and ( 2 ) can be solved by using a as a parameter rather than a variable.
The values of positive coefficients ,omax, KL, n, andp depend on the type of sewage waters. In particular, for simple substrates p = 0, for multicompo- nent pollutants we find that
p = n - l
is not a bad approximation, and as a result we have three coefficients p,,, KL, and n. In the case of multicomponent pollutants which do not succumb easily to oxidation n 2 3 (p L 2 ) in model (1) and n 2 2 ( p 2 1) in model ( 2 ) .
A criterion reflecting the adequacy of the model to experimental data is a small magnitude of the mean square deviation
or the relative mean square deviation
where L y a s and L,CaIC are the measured and calculated values, respectively, of the exit pollutant concentration; N is the total number of experiments, K is the number of coefficients in the model. Finding the minimum of u and B can serve as a general method for determining the model coefficients.
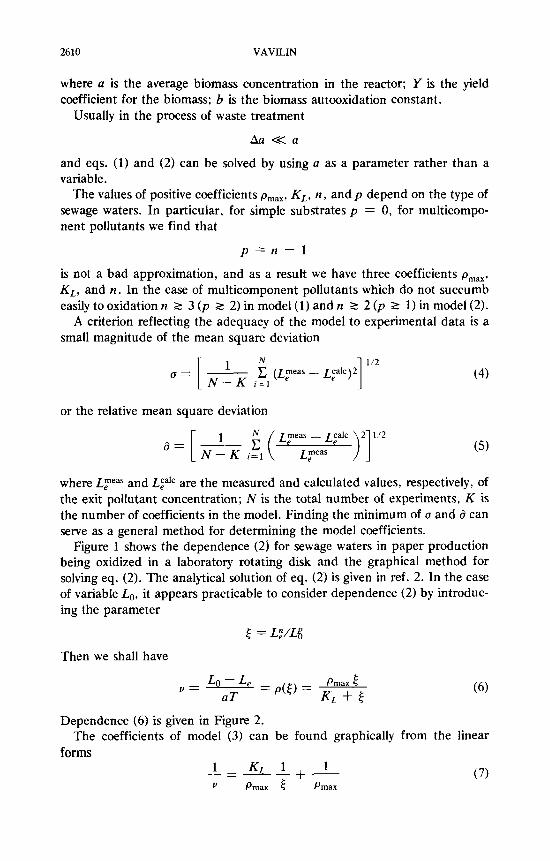
Figure 1 shows the dependence ( 2 ) for sewage waters in paper production being oxidized in a laboratory rotating disk and the graphical method for solving eq. ( 2 ) . The analytical solution of eq. (2) is given in ref. 2 . In the case of variable Lo, it appears practicable to consider dependence ( 2 ) by introduc- ing the parameter
t = L!/L{
Then we shall have
Dependence (6 ) is given in Figure 2.
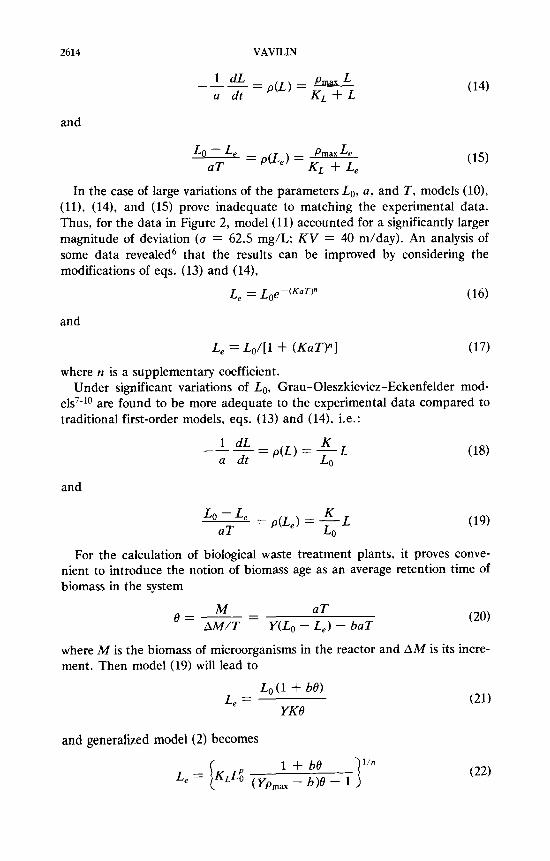
forms The coefficients of model ( 3 ) can be found graphically from the linear
(7)

FACTORS AFFECTING AEROBIC BIOLOGICAL TREATMENT RATES 261 1
Le ,g / lBOD
Fig. 1. An example of dependence (2) for a rotating disk ( n = 2, p = 1. Lo = 1072.5 mg/L). Experimental data was taken from ref. 3; pollutant is measured in BOD units.
0 0.25 0.5 0.75
2
5 Le/Lo. g / l B O D
Fig. 2. An example of dependence (6) ( n = 2, p = 1). Experimental data was taken from ref. 3; pollutant is measured in BOD units; z, = 0.513 g/L is the average value of effluent pollu- tant concentration.
2612 VAVILIN
or
5 - LA+- - 1 LJ Pmax Pmax
Figure 3 shows dependence (8) for the data in Figure 2. In generalized models (1) and (2) one can assume the magnitude of the
maximum treatment rate to be the function of temperature to and the con- centration of dissolved oxygen C
In particular, we can assume that
(9) - - K 1 o - ; Pmax - Pmax
where K is the temperature coefficient and f is a certain fixed temperature. The coefficients of models (1) and (2) depend on the method used to deter-
mine the total pollutant concentration. Figure 4 shows dependence (6) for sewage waters in paper prod~ct ion ,~ measured in COD units. A comparison between Figure 2 (BOD) and Figure 4 (COD) enables us to conclude that CODs are characterized by higher values of the n coefficient and lower values
In sewage waters, alongside dissolved pollutant, there is present, as a rule, its suspended form. The processing of certain data, for instance those con- tained in ref. 4, has revealed that the respective constants of the oxidation rate of dissolved BOD or COD are superior to the oxidation constants for total BOD or COD. The order of the reaction n can also be different.
of P m a x / K t .
m 0 H
n 2 4
M
N
\
0
Fig. 3. Graphical method of finding the coefficients of dependence (6) in accordance with linear form (8). Experimental data correspond to those of Fig. 2.

FACTORS AFFECTING AEROBIC BIOLOGICAL TREATMENT RATES 2613
0
Fig. 4. An example of dependence (2). with n = 2.5. p = 1.5. Experimental data was taken from ref. 3; pollutant is measured in COD units.
TRADITIONAL MODELS
A description of aerobic biological treatment traditionally involves the use of Eckenfelder’s models5:
= p(L) = KL 1 dL a dt (10)
and
Their solutions are correspondingly
L e O = L ePKaT [model (lo)] (12)
L, = Lo/(l + KaT) [model(ll)] (13)
Some researchers choose to use Monod’s hyperbolic dependence p(L) and p(L,), the classical one for microbiological systems. In this case, in place of eqs. (11) and (121, we shall have
and
2614 VAVILIN
1 dL - Pmax L - P(L) = K,+L a dt
and
In the case of large variations of the parameters LO, a , and T , models ( lo) , ( l l ) , (14), and (15) prove inadequate to matching the experimental data. Thus, for the data in Figure 2, model ( 1 1 ) accounted for a significantly larger magnitude of deviation (a = 62.5 mg/L; KV = 40 m/day). An analysis of some data revealed6 that the results can be improved by considering the modifications of eqs. (13) and (14),
L, Loe-(K"T)" (16)
and
Le = Lo/[l + (KaTP] (17)
where n is a supplementary coefficient. Under significant variations of Lo, Grau-Oleszkievicz-Eckenfelder mod-
els7-I0 are found to be more adequate to the experimental data compared to traditional first-order models, eqs. (13) and (14), i.e.:
K 1 dL a dt Lo
= p(L) = - L
and
K = p(Le) = - L LO - Le aT LO
(18)
(19)
For the calculation of biological waste treatment plants, it proves conve- nient to introduce the notion of biomass age as an average retention time of biomass in the system
aT Y(Lo - Le) - baT
- M M / T
,g=-----
where M is the biomass of microorganisms in the reactor and AM is its incre- ment. Then model (19) will lead to
Lo ( 1 + be) L, =
YKB
and generalized model (2) becomes
(21)

FACTORS AFFECTING AEROBIC BIOLOGICAL TREATMENT RATES 2615
The average retention time of biomass in the reactor can be used not only in the calculation of aeration tanks,” but also in the calculation of trickling fiIters.12
The effect of temperature is usually taken into account by assuming that
K = &-20” (3)
where K is a temperature correction. The above-mentioned traditional models are particular cases or approx-
imations of generalized models (1) and (2). Thus, for n = 1 a n d p = 0, we have Monod’s models (14) and (15) which, in turn, for the case of L << KL, change into first-order models (10) and (l l) , where K = pmax/KL. Models (18) and (19) ensue from eqs. (1) and (2) for the case of n = 1 a n d p = 1, when L/Lo << KL.
Apart from these traditional models, the rate of the treatment process can be described in the form of power functions with the parameters Lo, a , T , and to and of the type
where 11, . . . , l4 are empirical coefficients. We would like to refer, for in- stance, to ref. 13. In model (241, the rate of the waste treatment process is in- dependent of the variable L. An analysis of some data, however, reveals that the value of the coefficients 11, . . . , l4 is, in turn, determined by the regime of the waste treatment process, i.e., by the characteristic values of the parameters Lo, a, T, and to. Thus, for the chosen coefficients, model (24) “works” within a relatively narrow interval of parameter variability.
We would like to point, in compliance with ref. 2, to certain principles at the basis of generalized models (1) and (2). Reactors which realize the pro- cess of aerobic biological treatment are “processing” a specific spectrum of substrates-pollutants representing individual components of a multicompo- nent pollutant. In accordance with the spectrum of “processed” compounds and external conditions, the microbiological composition of sludge flocs is being formed in the aeration tank and biofilm, and in the trickling filter and rotating disk. Thus, the species composition of microorganisms is dependent not only on the type of sewage waters, but also on the functioning regime of the reactor exercising the treatment of sewage waters. The waste treatment rate depends on the oxidation rates of individual components and on their contribution to the overall oxidation rate. Under high concentrations of substrate-pollutant, the sludge or biofilm microorganisms in the reactor are being “saturated” with the most representative components of the substrate-pollutant, and the waste treatment rate becomes maximal, cor- responding to a zero-order reaction with respect to the combined pollutant L :
1 dL a dt - Pmax

2616 VAVILIN
and
In this case, the increment of biomass is also observed to be maximal. Under high pollutant concentration in the reactor for L 2 ( KLL$) a
good approximation for the generalized models (1) and (2) happens to be models with the l / n order of reaction:
and
where K = K ( t o , C ) . The solution of eq. (27) is
By substituting eq. (29) in eq. (27) we can obtain
L (30)
From eq. (30) we obtain a treatment rate constant of the quasi-first-order for the case of rough treatment
Ku LA-”” - K u ( l - l /n) t
_ - dL dt --
As seen from eq. (31), model (27) is applicable solely when
t < LA- ‘ /“ /Ku( l - l / n )
In place of the (l/n)-order models for the case of rough treatment, we can also consider the Monod-type models (14) and (15) or, finally, we can use a fixed order of l /n = l /2 .
In the process of waste treatment, a progressive disappearance of com- pounds which cease to be further oxidized is observed. With the rising deten- tion time of sewage water in the reactor T and higher concentration of microorganisms a, the proportion of the “processed” and not easily oxidized components of total pollutant increases. With the higher pollutant concen- tration in the initial sewage water, Lo, the spectrum of “processed” com- pounds is observed to shift towards easily oxidized compounds. In the case of low pollutant concentrations in the reactor, L (high-level treatment, L << ( KLLi) l /“) , the waste treatment rate obeys the n-order equations:

FACTORS AFFECTING AEROBIC BIOLOGICAL TREATMENT RATES 2617
Forp = n - 1, eq. (32) represents the Fair m0de1.l~ By solving eq. (32) we obtain
(34) L = Lo/[l + K ( n - l)L;-'-Pat]''("-') where K = pmax/KL. By substituting eq. (34) in eq. (32) we can obtain
By introducing the parameter = ~ ~ ~ n - 1 - p
0
we obtain the quasi-first-order treatment rate constant for the case of high- level waste treatment
It is not difficult to see that for P(n - l)t >> 1,
1 ( n - 1)t K1
i. e., it is independent of the parameter 0. At the same time, for P(n - l ) t << 1,
K1 = P It has already been pointed out in ref. 2 that, in accordance with models (1) and (2), the dependence of the waste treatment rate on the parameters a, T, Lo, and to is different for rough and high-level treatments. Let us dwell on this in greater detail.
MEAN DETENTION TIME OF LIQUID WASTE IN REACTOR
The oxidation kinetics of the generalized organic matter, as measured in oxygen or carbon units, can be viewed as the sum of kinetic oxidation curves of simple substrates. Eckenfelder and c o - ~ o r k e r s ~ ~ . ~ ~ have furnished evi- dence of some simple substrates being simultaneously oxidized, their oxida-
2618 VAVILIN
tion kinetics often obeying a zero-order equation with respect to pollutant concentration. Therefore, for the ith simple substrate, we can write
Si = Sio - Kist, if 0 I t I Sio/Kia (37)
where Sio is the initial concentration of the ith component: a is the concentra- tion of the biomass of microorganisms; ki is the treatment rate constant of a zero-order reaction of the ith component.
Suppose m simple substrates are being oxidized in total. Let the substrates be numbered in the order of their disappearance: i = 1, 2 . . . I, . . . m- 1, m. The summary kinetic curve will be made up of m linear sections. In this case, corresponding to the Ith section (1 5 I I m ) will be
si = 0, if t > Sio/Kia
m m ) - C Kiat = C { Soi - Ki[So,i-l/Kl-l -I- at] ] i=i i=l i= l
(38) if
So,i-1/K/-1 a I ti I Sol/Kia (39)
in this case, Soo = 0, Soo/Ko = 0. The summary kinetic curve is described by m coefficients of Ki, and m in-
itial conditions of Soi. We can write down an equation which, of course, is only a formal approximation of the summary kinetic curve1':
The following form has become quite popular from formal chemical kinetics:
For continuous reactors the current time t is substituted by the mean deten- tion time of the liquid in the reactor T. It should be noted that since the ox- idation reaction of separate components obeys the zero order, then L ( T ) will be similar both for the complete-mixing reactor and for the plug-flow reac- tor.
In the case of small t < Sol /K,a we have the zeroth order ( n = 0) of the oxidation reaction with respect to the summary pollutant L = Cy=lSi, namely
where pmax = Cy=.=,Ki and Lo = Cy=lSoi. As the interval t under consideration increases, the proportion of processed
and not easily oxidized compounds grows larger. This compels us to consider function (36) with larger values of the nth order, namely, n = 1,2,3, . . . .

FACTORS AFFECTING AEROBIC BIOLOGICAL TREATMENT RATES 2619
An increase of the n order with declining substrate concentration (increas- ing time) is “automatically” taken into account in generalized models (1) and (2).
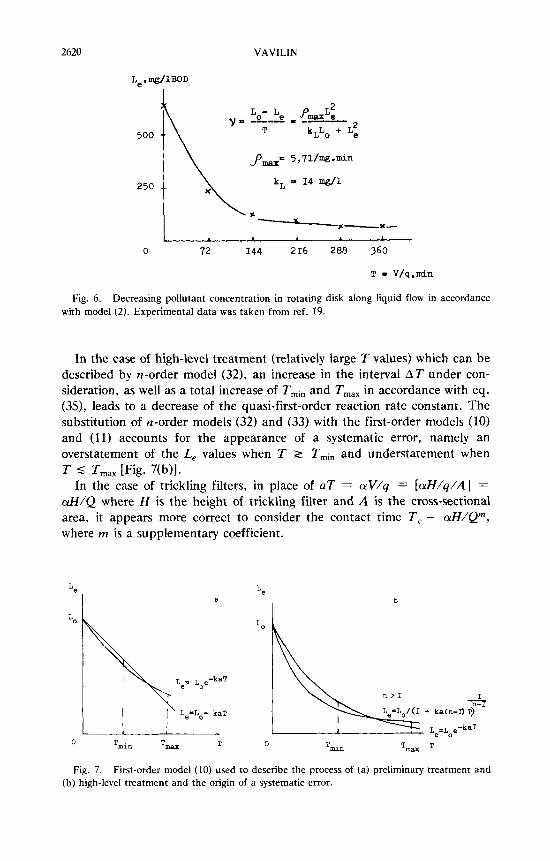
Figure 5 shows kinetic curves for the oxidation of municipal sewage waters in accordance with generalized model (1) and Figure 6 shows those for sewage waters in Pepsi Cola production according to generalized model (2). 18.19
In calculating reactors oxidizing sewage waters of one or another type, we must be concerned with a specified interval of T values:
Tmin I T I T,,,
Under small variations AT = T,,, - Tmin, all other conditions being equal, different models “operate” in an approximately similar marine$ (yielding an insignificantly different value of a).
In the case of preliminary treatment (relatively small T values) which can be described by (l/n)-order model (27), an increase in the interval AT under consideration, as well as a total increase of Tmin and T,,, in accordance with eq. (31), leads to a greater quasi-first-order treatment rate constant. The substitution of an (l/n)-order models (27) and (28) with the first-order models (10) and (11) accounts for the appearance of a systematic error, namely, an understatement of L, values when T 2 Tmin and an overstate- ment for T 5 T,,, [Fig. 7(a)].
0 2 4 6 t , b
Fig. 5. Kinetic curves for oxidation of concentrated municipal sewage waters in accordance with model (1). Experimental curves are from ref. 18. Activated sludge concentration: ( X ) X = 2920 mg/L, ( z ) X = 1560 mg/L, ( z ) X = 1260 mg/L.
2620 VAVILIN
Le , mg/lBOD I
500
250
t 0 72 144 216 288 360
T = V/q,min
Fig. 6. Decreasing pollutant concentration in rotating disk along liquid flow in accordance with model (2). Experimental data was taken from ref. 19.
In the case of high-level treatment (relatively large T values) which can be described by n-order model (32), an increase in the interval AT under con- sideration, as well as a total increase of Tmin and T,,, in accordance with eq. (35), leads to a decrease of the quasi-first-order reaction rate constant. The substitution of n-order models (32) and (33) with the first-order models (10) and (11) accounts for the appearance of a systematic error, namely an overstatement of the L, values when T 2 Tmin and understatement when T 5 T,,, [Fig. 7(b)].
In the case of trickling filters, in place of aT = aV/q = [ d Z / q / A ] = d/Q where H is the height of trickling filter and A is the cross-sectional area, it appears more correct to consider the contact time T , - &/Qrn, where rn is a supplementary coefficient.
b
Fig. 7. First-order model (10) used to describe the process of (a) preliminary treatment and (b) high-level treatment and the origin of a systematic error.

FACTORS AFFECTING AEROBIC BIOLOGICAL TREATMENT RATES 2621
BIOMASS CONCENTRATION IN THE REACTOR
In the calculation of reactors we are concerned with a definite interval of specific values
amin 5 a 5 amax
In the case of small variations Aa = amax - amin, all other conditions be- ing constant, different models “operate” approximately in a similar manner (giving an insignificantly different value of a).
In accordance with model (30) for the case of preliminary treatment (relatively small a values), the reaction rate rises with the growth of the biomass concentration a, the growth of a leading to an abrupt increase in the quasi-first-order reaction rate constant (31).
In accordance with model (35) for the case of high-level treatment (relatively large a values), the first-order treatment rate constant K 1 of eq. (36) for /3(n - 1)t >> 1 is independent of a. For practical calculations of aeration tanks, Eckenfelder’s model, eq. (1 l), is occasionally substituted with McKinney’s modelZo for which
K E K a = KMac - const
In the case of high-level treatment processes, McKinney’s model may give a value of deviation a insignificantly different from that of Eckenfelder’s model. However, either of the two models are significantly inferior to eq. (33) for n = 2 a n d p = 1 (Table I).21 For model (33) we can no longer consider Ka = const., since this leads to a significant growth of a.
TABLE I Results of Using Different Modelsa for Aeration Tanks in the Case of
High-Level Treatment (from ref. 21)
Data sources
Averaged data for 36 Averaged data for 6 plug-flow aeration
Laboratory mixing mixing aeration tanks, tanks. municipal aeration tank, peptone. municipal sewage sewage waters, and
and TOC (ref. 9) waters, and BOD BOD (ref. 22)
Constant U Constant U Constant U
Model value (mg/L) value (mg/L) value (mg/L)
Eckenfelder’s model (11) 2.3 X 5.7 1.2 X 10K3 5.3 9.4 X lop4 8.8
McKinney’s model 0.67 5.4 6.9 7.6 1.0 7.5 Model (33) 0.034 1.9 7.6 X lop3 1.9 5 X 5.0
aConstants are in Umg h)-’

2622 VAVILIN
Similarly, in calculating trickling filters, the inclusion of the specific sur- face of the media 01 into first-order models will not necessarily lead to a significant decline of u.
In using first-order models (10) and (ll), there appears to be a systematic error (its character being the same as in the case of the variation of detention time in reactor T) .
TEMPERATURE
In view of eq. (9), it is seen that treatment process rate described by the generalized models (1) and (2) rises with higher temperature. However, the effect of temperature will change with the extent of the treatment process. In accordance with eqs. (25)-(28), it is high in the case of preliminary treat- ment. According to eq. (31), the quasi-first-order treatment rate constant is observed to be strongly dependent on temperature.
In the case of high-level treatment, according to eq. (36), for /3 (n - 1)t >> 1 the quasi-first-order treatment rate constant is independent of temper-
H
H
.$ I T = 60mir?
0'01 1 (b) 2 = 1,012, kd = 0,036min-I, d = 6,2mg/l
0
Fig. 8. Treatment rate constants versus the parameter = L J L , under different tempera-
tures. For model (34). n = 1 andp = 0 in (a), and in (b) n = 2 and p = 1 . Experimental data was taken from ref. 2.3.

FACTORS AFFECTING AEROBIC BIOLOGICAL TREATMENT RATES 2623
ature. Figure 8 shows data for the oxidation of sewage waters on a laboratory rotating disk under different temperatures.u It is easy to see that for large LJLo, corresponding to small T = V/q and hence to a large organic loading F = Lo/cxT, we have a strong dependence of the first-order treatment rate constant on temperature (large K values). This dependence declines with in- creasing temperature. At the same time, it is easy to see that, generally, a first-order model incorporates a systematic error (the process rate being understated under large LJLo and overstated under small LJLo). In the case of first-order models [Fig. @a)], introducing a temperature correction only leads to an insignificant reduction of u.
More adequate models are free from the previously mentioned systematic error, and making a temperature correction in the case of a good model is likely to bring about a significant reduction of u [see Fig. @b)].
The usual method is to select the value of temperature correction K as be- ing fixed for a given type of waste treatment plant. Thus, for aeration tanks, we often choose K = 1.047, and for trickling filters, K = 1.035, At the same time, as pointed out in a number of works, the temperature correction is dependent on the functioning regime of the treatment plant and, in par- ticular, with increasing loading on an activated sludge system, K is observed to i n ~ r e a s e . ~ ~ - ~ ~ What has been said becomes apparent from dependence (36).
Since the maximum specific treatment rate pmax rises with the growing con- centration of dissolved oxygen C , we would like to note that the effect of C on the process rate declines with the extent of waste treatment process.
INFLUENT POLLUTANT CONCENTRATION
In accordance with generalized models (1) and (2), since n > p , the waste treatment rate rises with the growth of Lo. However, the effect of Lo on the process rate increases with the extent of waste treatment process (see ref. 13). In the case of zero-order models (25) and (261, the process rate is indepen- dent of Lo. In the case of preliminary treatment described by eq. (27), the treatment rate constant of the quasi-first-order kl according to eq. (31) is a decreasing function of Lo. This effect is actually taken into account in the for- mal models of Grau-Oleszkiewicz-Eckenfelder, eqs. (18) and (19), which, for the case of preliminary treatment, are in better agreement with experi- ment than traditional first-order models (10) and (11) (Fig. 9).27 Figure 10 is an illustration of the effect resulting from the substitution of a zero-order model with model (11). As seen from Figure 10, the rising& accounts for the necessity of reducing the first-order process rate constant in order to achieve a correct approximation of a zero-order model, as realized in models (18) and (19).
In accordance with eq. (36), for the case of high-level treatment for P(n - 1) >> 1 a quasi-first-order treatment rate constant K , is independent of Lo.

2624
5.0
H I
VAVILIN
.. * <
I
Y
P=
0
Y - k J
L.I L o 1 lL6?2 Lo2 L
Fig. 10. Approximation of a zero-order model with model (19) and the effect of declining first-order treatment rate constant with growing Lo.
CONCLUSIONS
Traditional models finding present-day application contain systematic er- rors which become manifest under broad variations of parameters: the reten- tion time of sewage liquid in the reactor, biomass concentration in the reac- tor, influent pollutant concentration, temperature, and dissolved oxygen concentration. The generalized models proposed earlier by the author make it possible to eliminate these systematic errors, thus leading to a reduction of the deviation of experimental from calculated values for effluent pollutant concentration.

FACTORS AFFECTING AEROBIC BIOLOGICAL TREATMENT RATES 2625
References
1. V. A. Vavilin, Dokl. ANSSSR, 258, 1269 (1981). 2. V. A. Vavilin, Biotechnol. Bioeng.. 24, 1721 (1982). 3. M. D. Borghi, E. Palazzi, and G. Ferraiolo, Chimica Ind. (Milan), 59, 77 (1977). 4. E. D. Toerber, V. L. Paulson, and H. S. Smith. J. Water Pollut. Control Fed., 46, 1955
5. W. W. Eckenfelder, Industrial Water Pollution Control (McGraw-Hill, New York, 1966). 6. V. A. Vavilin, Acta Hydrochim. Hydrobiol., 10, 211 (1982). 7. P. Grau, M. Dohanyos, and J. Chudoba, Water Res.. 9, 637 (1975). 8. J. Oleszkievicz, Env. Rot . Eng.. 2, 85 (1976). 9. C. E. Adams, W. W. Eckenfelder, and J. C. Hovions, Water Res.. 9, 37 (1975).
(1974).
10. W. W. Eckenfelder, Env. Rot . Eng., 4, 297 (1979). 11. L. Vandevenne and W. W. Eckenfelder, Water Res., 14, 561 (1980). 12. M. F. Kong, Biotechnol. Bioeng.. 21, 417 (1979). 13. W. Sarner, Water Res.. 15, 671 (1981). 14. C. M. Fair and J. C. Geyer, Water S u p p l ~ and Waste Water Disposal (Wiley, New York,
15. L. T. Tischler and W. W. Eckenfelder, Proceedings of the 4th Industrial Waste Con-
16. S. Siber and W. W. Eckenfelder, Water Res., 14, 471 (1980). 17. V. A. Vavilin, Env. Rot . Eng.. 6 , 319 (1980). 18. J. Chudoba, Proceedings of the 4th Industrial Waste Conference on Water Pollution
19. M. B. Pescod and J. V. Nair, Water Res.. 6, 1509 (1972). 20. L. E. McKinney, J. Sanit. Eng. Div. Am. Soc. Civ. Eng., 88, 87 (1962). 21. V. A. Vavilin, Dokl. ANSSSR, 256, 759 (1981). 22. T. R. Haseltine, Water Sew. Works, 102, 487 (1955). 23. K. V. Ellis and S. E. 1. Banaga, Water Pollut. Control, 75, 73 (1979). 24. K. Wuhrmann, in Water Resources Symposium (Univ. of Texas F’ress, Austin, 1968), p.
25. W. W. Eckenfelder, J. Sanit. Eng. Div. Am. Soc. Civ. Eng., 93, 157 (1967). 26. J. T. Novak, J. Water Pollut. Control Fed., 46, 1984 (1974). 27. Yu. V. Voronov, A. L. Ivchatov, V. A. Vavilin, and S. S. Kuzmin, Gidroliznoe proiz-
1954).
ference on Water Pollution Research (Pergamon, New York, 1968), p. 361.
Research (Pergamon, New York, 1968). p. 375.
143.
vodstvo, 6 , 19 (1981).
Accepted for Publication April 29, 1982 Corrected Proofs Received September 15, 1982