the effects of pricing on the sales force and the firm: a
TRANSCRIPT

Kennesaw State UniversityDigitalCommons@Kennesaw State University
Dissertations, Theses and Capstone Projects
7-1-2013
The Effects of Pricing on the Sales Force and theFirm: A Strategic ViewWendy RitzKennesaw State University
Follow this and additional works at: http://digitalcommons.kennesaw.edu/etdPart of the Sales and Merchandising Commons
This Dissertation is brought to you for free and open access by DigitalCommons@Kennesaw State University. It has been accepted for inclusion inDissertations, Theses and Capstone Projects by an authorized administrator of DigitalCommons@Kennesaw State University.
Recommended CitationRitz, Wendy, "The Effects of Pricing on the Sales Force and the Firm: A Strategic View" (2013). Dissertations, Theses and CapstoneProjects. Paper 576.

THE EFFECTS OF PRICING ON THE SALES FORCE AND THE FIRM:
A STRATEGIC VIEW
by
Wendy Ritz
A Dissertation
Presented in Partial Fulfillment of Requirement for the
Degree of
Doctor of Business Administration
In the
Coles College of Business
Kennesaw State University
Kennesaw, GA
2013

Copyright by
Wendy Ritz
2013

Coles College of Business Doctor of Business Administration
Dissertation Defense: July 9, 2013
DBA Candidate: Wendy Ritz
The content and format of the dissertation are appropriate and acceptable for the awarding of the
degree of Doctor of Business Administration .
Michelle Steward, PhD Committee Chair Associate Professor of Marketing School of Business Wake Forest University
Felicia N. Morgan, PhD Committee Member Associate Professor of Marketing Department of Marketing & Economics University of West Florida
Joseph F. Hair, Jr., PhD Committee Member DBA Founder and Senior Scholar Professor of Marketing Department of Marketing and Professional Sales Kennesaw State University
Brian N. Rutherford, PhD Reader Assistant Professor of Marketing Department of Marketing and Professional Sales Kennesaw State University
Juanne V. Greene, DBA Director, KSU DBA Program Senior Lecturer of Management Department of Management and Entrepreneurship Kennesaw State University
Charles J. Amlaner, Jr., DPhil Vice President for Research and Dean of Graduate College Kennesaw State University
--Signature: t- · ¥
Signature: ~ 71.-~
Signature: y~ ~
Signature cl~ ~\}

iv
ABSTRACT
THE EFFECTS OF PRICING ON THE SALES FORCE AND THE FIRM:
A STRATEGIC VIEW
by
Wendy Ritz
Previous research has examined the dysfunctional relationships often encountered
between marketing and sales, and the importance of cooperation and coordination
between these two functional areas. But no prior studies have investigated the
consequences of misaligned pricing and sales force compensation strategies that emerge
from these two functional areas. This dissertation examines the impact of the firm’s
pricing strategy on the sales force, and evaluates the importance of identifying the
misalignment of goals of the pricing and sales force compensation strategies as a
potential root cause of disappointing program outcomes. Essay 1 uses in-depth qualitative
interviews with business-to-business (B2B) salespeople and sales managers across
several industries to examine the nature and ramifications of strategic misalignment of
pricing and sales compensation approaches. Based on extant literature and insights from
the field, a series of potential relationships are proposed between pricing and sales force
compensation strategies. Essay 2 examines the effects of misalignment of goals of the
pricing and sales force compensation strategies on the salesperson’s expectancy,
instrumentality, motivation, and behavioral intention. A scenario-based experimental
design is used to test the hypotheses in Essay 2 based on data collected from salespeople.

v
The findings of this dissertation suggest that understanding the impact of the firm’s
pricing strategy on the salesperson is an unstudied yet critical factor influencing sales and
marketing program success.
Keywords: pricing strategy, sales force compensation strategy, marketing sales
interface, goal conflict, expectancy theory, motivation, behavioral intention

vi
Table of Contents
THE EFFECTS OF PRICING ON THE SALES FORCE AND THE FIRM:
A STRATEGIC VIEW..................................................................................................... i
Copyright ............................................................................................................................ ii
Signature Page ................................................................................................................... iii
Table of Contents ............................................................................................................... vi
CHAPTER 1 ....................................................................................................................... 1
Introduction ................................................................................................................. 1
Conceptual framework: Pricing and sales force compensation strategy ..................... 7
Background Literature ................................................................................................. 8
CHAPTER 2 (ESSAY 1) .................................................................................................. 21
EXPLORING THE EFFECTS OF PRICING ON THE SALES FORCE AND THE
FIRM: THE ADVERSE IMPACT OF STRATEGIC MISALIGNMENT ................... 21
Abstract ...................................................................................................................... 21
Research Method ....................................................................................................... 23
Propositions ............................................................................................................... 48
Discussion .................................................................................................................. 60
Future Research ......................................................................................................... 63
Conclusion ................................................................................................................. 64
References ................................................................................................................. 65
CHAPTER 3 (ESSAY 2) .................................................................................................. 73
THE EFFECTS OF (MIS)ALIGNED PRICING AND SALES FORCE
COMPENSATION STRATEGIES ON THE SALESPERSON ...................................... 73
Introduction ............................................................................................................... 74
Hypotheses................................................................................................................. 78
Methodology .............................................................................................................. 84
Pretest ........................................................................................................................ 88
Pretest Analysis ......................................................................................................... 91
Main Study ................................................................................................................ 99
Main Study Analysis ............................................................................................... 101
Discussion ................................................................................................................ 121

vii
Conclusion ............................................................................................................... 124
Limitations and Future Research ............................................................................. 125
References ............................................................................................................... 128
APPENDIX A ................................................................................................................. 135
APPENDIX B ................................................................................................................. 140

viii
LIST OF TABLES
Table Page
Table
1.1 B2B sales professionals .............................................................................................. 24
1.2 Illustration of codebook used for interviews .............................................................. 31
2.1 Scenarios ..................................................................................................................... 85
2.2 Pretest respondents per condition ............................................................................... 89
2.3 Pretest participant demographics ................................................................................ 89
2.4 Main study survey participation................................................................................ 101
2.5 Main study participant demographics ....................................................................... 105
2.6 Main study respondent per condition ........................................................................ 106
2.7 PCA Convergent validity report ............................................................................... 110
2.8 Discriminant validity test results .............................................................................. 111
2.9 Proportion of control variables per condition ........................................................... 113
2.10 Main study demographics ....................................................................................... 115
2.11 Hypothesis 3 results- Extrinsic motivation ............................................................. 119
2.12 Hypothesis 4 results- Behavioral intention ............................................................. 120
2.13 Hypothesis 4 Behavioral intention across scenarios ............................................... 120
2.14 Summary of main study hypotheses and tests ........................................................ 121

1
CHAPTER 1
INTRODUCTION
Poor financial performance of a business can be attributed to a variety of possible
reasons within sales and marketing, including failures of proper product development,
ineffective promotion, and misidentified target markets (Rouziès et al., 2005). The lack
of communication between marketing and sales also has been suggested as a root cause
of the problem (Hughes, LeBon, & Malshe, 2012; Cross et al., 2001; Maltz & Kohli,
1996; Strahle & Spiro, 1986). Indeed, the necessity for decisions to be coordinated
across marketing and sales has been underscored in previous research (Cespedes &
Piercy, 1996; Lawrence & Lorsch, 1986; Menon, Bharadwaj, & Howell, 1996).
Diagnosis of problems may be impeded, however, by the assumption that marketing and
sales strategies, in particular pricing and sales force compensation strategies, are
congruent and therefore aligned toward the same types of goals, such as market share
growth or profit maximization.
Despite significant research on dysfunctional relationships between marketing and
sales and the importance of cooperation and coordination between these two functional
areas (e.g. Homburg & Jensen, 2007), no prior studies in this domain have examined the

2
detrimental consequences of misaligned goals of the pricing and sales force
compensation strategies or the potential benefits to the firm of aligning these strategies.
Poor performance may be misdiagnosed because the true root of the problem, the
misaligned goals of the pricing and sales force compensation strategies, is undetected.
While suggestions for enhanced communication between the functional areas may be
helpful, poor performance may persist if the functional areas are not communicating
about the fundamental elements of strategy (Hutt, 1995; Malshe & Sohi, 2009; Menon,
Bhardwaj, Adidam, and Edison, 1999).
The marketing and sales functions are principally responsible for revenue
generation for the firm. In particular, marketing considers competitive pressures and
customer preferences when establishing the revenue per unit for a company’s products
and services through the pricing strategies. Similarly, the sales function determines the
forecasts for overall sales revenue and is accountable for achieving these goals. Hence, an
organization’s pricing strategy has a direct relationship with the creation and
implementation of an organization’s advertising and sales strategies (Homburg, Jensen, &
Hahn, 2012; Lancioni & Gattorna, 1993). When marketing and sales work well together,
the organization benefits. But when discord occurs between the functional areas, it
produces negative organizational effects (Cespedes et al., 1996; Dewsnap & Jobber,
2000; Strahle, Spiro, & Acito, 1996).
Problem Setting
The impetus for this dissertation emerged from a real-world problem that
businesses regularly face. Specifically, the situation that suggested the potential for this

3
dissertation occurred in a Fortune-250 B2B company in which misaligned goals of the
pricing strategy and sales force compensation strategy led to a series of ineffective
outcomes, in part because the true problem (misaligned goals) was never examined.
Consider the following example from the company: A supplier carries two brands within
a product line offering, Brand A and Brand B. The supplier’s salespeople sell the two
products with different brands to retailers. The marketing department of the supplier
organization implements a pricing strategy designed to grow the market share of Brand A
in a specific geographic area by offering the product at a discounted price for a limited
time. A similar strategy is not implemented for Brand B.
The marketing department set an initial period of three months for the discounted
price. Progress evaluations were to be held at the end of each month. At the end of the
first month, the discounted priced Brand A had lower sales than the previous month’s
sales when there was no discounted price. The reason was the sales force responsible for
selling the two products had de-emphasized selling the discounted product Brand A. As
a result of lower sales of Brand A, inventory levels remained high and the pricing
strategy objectives were not met. Marketing managers expected to sell more of Brand A
because of the discounted price, but this did not happen because of the lack of support of
the sales force.
The marketing department of the supplier grew anxious about failing to meet the
goal of growing marketing share within the targeted region and decided to offer an
incentive directly to the salespeople for each unit of Brand A sold. But the incentive
represented less than one percent of the sales force’s normal commission incentive rate.

4
As a result, at the end of the second month sales of the discounted product continued to
decrease from the norm and sales of the higher priced brand increased.
After a considerable amount of management input, the company decided to
increase the promotion of the discounted brand for the final month by adding a third daily
delivery time for retailers in the area to receive orders of Brand A. In contrast,
competitors in the same geographic area only offered two deliveries per day. This extra
service required that the supplier hire a driver and add another vehicle to the fleet.
Management believed that this extra service, coupled with the discounted price of Brand
A and the sales incentive to the salespeople would help to achieve the goal of growing
market share of Brand A.
At the end of the third and final month of the discounted price promotion, the
overall net result was a shift in sales from the discounted brand to the higher priced
brand. Moreover, the sales of Brand A did not support the cost of the driver or the
vehicle added for the additional delivery time. Follow up inquiries determined that
customers had established purchasing frequencies based on two deliveries per day and the
third daily delivery did not increase the overall volume of purchases. Instead, it merely
spread existing demand across three deliveries instead of two. After the three month
promotional pricing period, the supplier discontinued the third daily delivery.
Investigation into the failed three-month promotion yielded an unexpected result
for the supplier. The sales force compensation strategy of the company was based on
maximizing profit by paying the sales force commission based on gross margins. All
sales progress reports for the sales force were generated to show the contribution margin,
and not market share information. While profits in the area were trending up because

5
salespeople were selling more of the undiscounted Brand B, the pricing strategy to grow
the market share of Brand A failed, and the company did not meet its goals for the period.
It appeared, therefore, that the failure to align the pricing and sales force compensation
strategies was the reason the goal of increasing market share was not achieved.
Moreover, throughout the temporary discounted price period, the firm attempted to
modify the initial marketing strategy, but their efforts resulted in inefficiencies for the
firm and reduced goodwill with the firm’s customers. Unfortunately, even in highly
successful companies such as this Fortune-250 company, pressures to decide and act
swiftly often supplant careful consideration of the true root of problems.
Why might a firm’s pricing and sales force compensation strategies not be
aligned? There are two main reasons. First, marketing and sales may have different
orientations, with marketing being product-focused and sales being customer-focused
(Cespedes et al., 1996; Homburg et al., 2007). Moreover, these orientations may
encompass different, potentially non-overlapping facets of the environment. For example,
a product-focused orientation may lead the marketing function to consider the level of
research and development that went into the product creation, next generation products
on the horizon, or the positioning of the product within the firm’s product portfolio
(Rouziès et al., 2005; Ruekert & Walker Jr, 1987). In contrast, the typical customer-
focused orientation of the sales function may lead to an emphasis on the customer’s in-
house financial pressures, purchases of competing products of the supplier the customer
is considering, or attempts to meet the custom needs of the customer. These two different
lenses may result in different strategies designed to reach different goals, complicated by

6
the fact that the two strategies may be set in different divisions of the firm independently
of one another (Rouziès et al., 2005).
A second reason pricing and sales force compensation strategies may not be
naturally aligned is that the two strategies have different temporal influences (Cespedes,
1995; Cespedes et al., 1996; Homburg, Jensen, and Krohmer, 2008). For example, in the
heat of day-to-day competition, the pricing strategy, the quickest lever of the marketing
mix for organizations to adjust, often morphs in reaction to external forces, such as
changes from competitors, customers, suppliers, or even regulatory events. Adjustments
to pricing strategies can be considered short term because the frequencies may happen
annually or even many times within a year. In contrast, sales force compensation strategy
tends to be more stable, and guided by internally established goals, such as growing
market share in specific regions or product segments, or increasing contribution margin
profit (referred to as profit maximization) (Küster and Canales, 2011). For example,
through the process of evaluating the customer’s needs a salesperson would direct the
customer toward the most profitable product or service solution. These divergent
influences can result in a lack of goal congruence across the two strategies.
Purpose and Contribution
The purpose of this two-essay dissertation is to examine the impact the firm’s
pricing strategy may have on the sales force, and to determine the importance of
identifying goal misalignment of pricing and sales force compensation strategies as a
potential root cause of program failure. The dissertation takes a sales force-centric view
of misalignment by focusing on the effects of a firm’s pricing strategy on the sales force
and the salesperson. The overarching framework upon which this two-essay dissertation

7
is based is illustrated below. Essay 1 focuses on the core firm-level and functional-level
outcomes of the alignment of the pricing and sales force compensation strategies and how
these outcomes shape sales force behavior. The outcomes are identified using in-depth
qualitative interviews with B2B salespeople and sales managers across industries to delve
into the nature, identification, and ramifications of strategic misalignment. A series of
propositions are examined to determine the relationships between the extant literature in
pricing and sales force compensation, and perceptions from field interviews.
Conceptual framework: Pricing and sales force compensation strategy
Essay 2 focuses on identifying the effects of misaligned goals of the pricing and
sales force compensation strategies on the relationships among the salesperson’s

8
expectancy, instrumentality, motivation, and behavioral performance. A scenario-based
experimental design was used to test the hypotheses in Essay 2.
The contribution of this research is three-fold. First, the marketing-sales interface
literature will be extended by identifying the importance of aligning the goals of the
pricing and sales force compensation strategies. Specifically, the dissertation will
examine the degree to which this key, though perhaps overlooked, joint-planning activity
needs to be addressed for a firm to be successful. Second, the models of selling success
are enhanced by determining the nature of the dependency of the sales function upon the
alignment of pricing and sales force compensation strategies. Third, the areas in which
misaligned pricing and sales force compensation strategies can affect salesperson
performance through the salesperson’s motivation will be described.
BACKGROUND LITERATURE
This dissertation draws upon three general bodies of literature that are
traditionally treated separately: the marketing-sales interface, pricing strategy, and sales
force management. From the intersection of these domains, this dissertation examines
propositions related to the effects of the misalignment of pricing and sales force
compensation strategies on the organization (Essay 1), and develops and tests hypotheses
relating to the interaction and impact of these two strategies on the salesperson (Essay 2).
The key background literature that provides a foundation for this dissertation is presented
in this section.
Marketing-Sales Interface
Extant literature defines the marketing-sales interface as the relational
interdependence between marketing and sales as an environment where the functionality

9
of one group is contingent on the other (Cespedes et al., 1996). Scholars in the sales
domain have suggested that “in most companies, marketing and sales organizations are
separate functions with different perspectives on how best to manage customer
relationships” (Bradford et al., 2010, p. 248). Moreover, these different perspectives can
be a major obstacle to managing joint activities across the two functions (Bradford et al.,
2010; Homburg et al., 2007). In their research on the effects of the marketing-sales
disconnect on effective marketing communication programs, Smith, Gopalakrishna, and
Chatterjee (2006, p. 577) highlight the “crippling disconnect between the marketing and
sales functions within many organizations, resulting in large amounts of wasted
expenditures and energy for the firm”. Existing research on the marketing-sales interface
is important for this research because product pricing strategies generally originate from
the marketing department, whereas sales force compensation strategies are developed by
the sales department. While these two departments often operate in functional silos, as
boundary spanning units, both marketing and sales have access to competitor and
customer information that can be vital to the success of each department and the
organization overall (Hult, 2011).
The definitions of interface integration in previous literature are varied yet have
basic tenets, including quality of cooperation, frictionless collaboration, and a unity of
efforts toward a coordinated goal (Homburg et al., 2007). Research by Rouziès et al.
(2005) defines interface integration as the supportive coordination of the sales and
marketing functions such that the activities complement each other and facilitate goal
achievement for both areas. Similarly, Homburg et al. (2008) describe interface

10
integration as the extent to which there is a state of collaboration between marketing and
sales that is characterized by unity of effort and harmony (Lawrence et al., 1986).
Previous research has identified benefits of a strong marketing-sales interface,
including perhaps the most obvious, the creation and maintenance of a market orientation
(Le Meuneir-FitzHugh & Piercy, 2011). Other research has shown that a strong cross-
functional interface positively affects satisfaction in working with other departments,
project success and performance (Kahn & McDonough, 1997; Troilo, DeLuca, and
Guenzi, 2009). Importantly for this research, the benefits of cooperation within the
marketing-sales interface during the strategy creation stage are positively related to
successful strategy creation and implementation (Homburg et al., 2008; LeMeunier-
FitzHugh et al., 2011). In contrast, inhibitors of a strong interface between marketing and
sales include goal conflicts, unidimensional perspectives, and strong in-group identities
(Dewsnap and Jobber, 2002; Menon et al., 1999; Ruekert et al., 1987).
The cross-functional literature suggests that collaboration between functions
involves collectively creating, choosing, and implementing strategy such that
departments work to achieve goals harmoniously under the firm’s unified vision with
shared ideas and resources (Hughes, Le Bon, & Malshe, 2012). Typically, however, the
studies have been broad-based and not pinpointed the specific strategies that need to be
aligned, the conditions under which strategy misalignment may be masked, or the
ramifications of strategy misalignment that may ripple throughout the organization.
Marketing and sales strategy
Varadarajan (2010) places strategic marketing at the firm level. It involves,
therefore, a large commitment of firm resources spread over a relatively long term. At

11
the business level, marketing strategy involves an integration of choices and activities
pertaining to products and markets and the utilization of marketing resources for the
creation, communication, and delivery of value to customers (Varadarajan, 2010). Thus,
marketing strategy goals are focused on the business unit but achievement of unit goals
also benefits the firm (Varadarajan, 2010).
The concept of alignment of strategies used in this research bridges the
Varadarajan (2010) definition of marketing strategy with a definition representing the
marketing-sales interface integration proposed by Kahn et al. (1997). The goal of each
strategy, which is a unified vision (Kahn et al., 1997), must be clearly communicated to
facilitate alignment between marketing and sales. Therefore, the alignment of marketing
and sales strategies involves planning, creating, choosing, and implementing activities
and resources such that these efforts are in concert and become focused on the same goal.
Communication
Factors that contribute to marketing-sales interface integration include both
formal and informal communication and the efficient flow of information (Dewsnap et
al., 2000; Fisher & Maltz, 1997; Ruekert et al., 1987). The sales force is expected to
collect information regarding customer requirements, competitive pricing, and other
competitive activities (Cross et al., 2001; Dewsnap & Jobber, 2000). Some shared
information from marketing to sales would include the competitive analysis of products,
packaging features and benefits, and changes in pricing strategies (Rouziès et al., 2005).
Caution is warranted with regard to arbitrarily increasing communication to the point of
counterproductive overload, with the result being decreased integration (Maltz et al.,
1996; Rouziès et al., 2005). According to Rouziès et al. (2005), increased emphasis on

12
integrated marketing communications, and coordination of marketing mix activities, is
aimed at improving outward communication to the customer, but largely ignores the
internal sales force. But efficient and effective bidirectional communication is crucial
during the strategy creation and implementation stages to avoid conflicts of outcomes and
goals. Thus, communication in and of itself is insufficient. Instead, communication must
occur about the “right” elements of strategy.
Pricing Strategy
Pricing strategy is a marketing strategy (Varadarajan, 2010). The communication
and signaling of an organization’s pricing strategy affects the distribution channel, which
includes competitors and customers, as well as the internal sales force. However, the
effects of pricing strategy on the sales force have been established only anecdotally
(Lancioni et al., 1993; Strahle et al., 1996). Competitive market response to a pricing
communication or signal may be retaliatory behavior involving a price war, or
cooperative behavior in which the competitor raises prices to the new established referent
price (Ramaswamy, Gatignon, & Reibstein, 1994; Palazon and Delgado-Ballester, 2009;
Gu, Kim, Tse, & Wang, 2010).
Considerable literature focuses on customer responses to a pricing strategy. Some
examples of these responses include changes in perceptions of value (Munnukka, 2006;
Sharma & Iyer, 2011), in perceptions of quality (Tellis, 1986; Jacobs, Ratliff, and Smith,
2010), and in demand (switching) (Holden & Nagle, 1998). An important contribution
of this domain of literature is the awareness that the price of an item “enters either as an
attribute in the evaluation stage of the choice process or as a constraint in the ultimate
choice,” (Rao, 1984, p. 41). The significance of price and quality is emphasized across

13
consumer choice strategies (Tellis & Gaeth, 1990). Moreover, price is also underlined in
high quality brand choice strategy as consumers continue to maximize value by
evaluating the quality against the price paid.
In general, the typical pricing strategy has a long-term orientation and requires
periodic choices between maximizing profit margins and increasing/protecting market
share (Lancioni et al., 1993; Rao, 1984; Tellis, 1986). To increase market share,
companies may choose the fast approach of buying market share through deeply
discounting the price, or the slower approach of gaining and holding market share by
adding value or service at no additional charge to the customer (Lancioni et al., 1993).
Regardless of the approach, growing market share represents a trade-off against
maximizing profit margins.
On the other hand, a pricing objective of profit maximization includes activities
that focus on identifying the market price or the highest price the customer is willing to
pay, and then establishing and maintaining that price level (Nagle, 1983; Nagle & Hogan,
2007). With a profit maximizing approach, a company typically identifies similar
customer groups and offers levels of pricing based on transparent customer buying
thresholds (Nagle, 1983; Nagle & Cressman Jr, 2002).
Pricing and the Sales Force
When the domains of pricing and sales force behavior have been connected, it has
been through the choice of whether an organization should centralize pricing decisions or
delegate those decisions to the sales force (Lal, 1986; Stephenson, Cron, & Frazier, 1979;
Weinberg, 1975). However, the norm within the literature is that the goals of the pricing
strategy are set by the marketing department and sales force decision-making is limited to

14
determining the degree to which prices may be negotiated (Lal, 1986; Mishra & Prasad,
2004, 2005).
The price delegation literature assumes the firm has a profit maximizing goal, and
in order to award any authority, the sales force must be compensated on realized gross
margins to ward off any suboptimal trade-off between effort and price (Joseph, 2001;
Weinberg, 1975). Prior literature has suggested that the information asymmetry concern
on which the delegation decision was founded may be resolved through effective
contracts between the sales force and the firm, thereby negating the need for a delegation
decision (Hansen, Joseph, & Krafft, 2008; Mishra et al., 2004, 2005; Stephenson et al.,
1979). Although the price delegation literature explores relevant managerial issues and
offers an initial connection between pricing and the sales force, to date the domain has
neglected addressing pricing strategy as a marketing strategy with multiple business unit
level components and ramifications. Further, the price delegation literature deems only
one sales force compensation method to be optimal, and does not consider the multiple
possible objectives of the sales force compensation strategy.
Sales Force Management
The sales force management literature focuses on ways to improve sales force
performance by identifying a series of activities that are involved in the selling process
(Churchill, Ford, Hartley, & Walker, 1985; Walker, Churchill, & Ford, 1977; Weitz,
Sujan, & Sujan, 1987). In the seminal research by Walker et al. (1977), the authors used
Vroom’s expectancy theory to explore the determinants of salesperson performance
(Oliver, 1974; Vroom, 1964). The findings of Walker et al. (1977) suggest that the link
between perceived effort and performance (effort-performance expectancy) and the

15
perceived link between performance and reward (outcome-instrumentality) are
antecedents to salesperson motivation (DeCarlo, Teas, & McElroy, 1997). Sales force
motivation is an antecedent to salesperson performance (Oliver, 1974; Tyagi, 1982). The
elements found to influence sales force effort, motivation, and therefore performance,
include characteristics of the organizational context and characteristics of the control
system of which compensation is a part.
Organizational Characteristics
The organizational context variables that can affect sales force motivation and
performance include management practices and policies (Walker, Jr, & Ford, 1977). The
responsibilities of and expectations for a salesperson should be clearly communicated
through management practices and policies (Churchill, Ford, Hartley, & Walker, 1985;
Teas, 1981). Typically, the objectives and expectations of the sales force compensation
strategy are well communicated to the sales force. Clearly communicating the
company’s pricing policies and expectations to the sales force may seem intuitive
however the challenges of creating a pricing policy given product or service cost
characteristics, communicating the price to the market, watching for market responses,
and monitoring the outcomes (profit maximization or market share growth) are the
principal foci of pricing literature and pricing professionals (Anderson, Wouters, & van
Rossum, 2010; Dolan, 1987; Feldman, 2005; Tellis, 1986; Voss, Parasuraman, & Grewal,
1998). Nagle et al. (2002) make the case that although inconsistent pricing decisions
occur in order to resolve short-term issues they also produce long term repercussions that
include “conflict not only within the firm, but also between the firm and customers who
become aware of the inconsistency” (p. 31). Unclear or inaccurate expectations are

16
detrimental to sales force motivation. Setting high expectations will manifest perceptions
of conflict when those expectations are not met (Maltz & Kohli, 2000). Intentional
miscommunication between marketing and sales regarding product strategies has been
noted in previous research. For example, Strahle, Spiro, and Acito (1996) note, “Several
marketing executives admitted misleading their sales managers about products to keep
them pushing volume” (p. 14). This research suggests that the lack of clearly
communicated pricing strategy expectations is an indicator that the pricing and sales
force compensation strategies may be misaligned.
Central to expectations is how a salesperson perceives his/her role. Role
perception, as described in (Walker, et al., 1977), “includes role accuracy, perceived role
ambiguity, and perceived role conflict; all three variables are related to the salesperson’s
perceptions of his role partners’ expectations and demands” (p. 159). The lack of clarity
regarding job expectations and the criteria on which performance is evaluated contribute
to a salesperson’s role ambiguity (Miles & Perreault Jr, 1976). Misaligned pricing and
sales force compensation strategies are a source of negative role perceptions for the sales
force.
Role accuracy, as defined by Walker et al. (1977) pertains to the quality and
precision with which the salesperson understands the demands expected of them by the
supervisors. Perceived role ambiguity occurs when a salesperson feels information
asymmetry is constraining her/his ability to adequately meet performance expectations.
Role ambiguity is associated with confusion and uncertainty for the salesperson (Walker
et al., 1997) and it is negatively related to the salesperson’s effort instrumentality (Singh,
1998) and behavioral performance (Miao & Evans, 2007). Singh (1998) found that sales

17
force role conflict, role ambiguity, and role overload influence job tension, turnover
intentions, and performance. In situations of high role ambiguity, as when the strategies
are not aligned, the salespeople get mixed messages as to what activities, behaviors, and
job tasks will be most effective in accomplishing performance goals (Jaworski & Kohl,
1991). Moreover, the salesperson is confused as to the hierarchy of expectations, how
expectations should be met, and what criteria will be used to evaluate performance
(Walker, et al., 1977).
Research by Pritchard and Sanders (1973) found that role perceptions, external
constraints, and ability to accomplish objectives contribute to the salesperson’s
perceptions that an increase in effort would not increase performance. In some instances,
the salesperson may perceive the effort required to positively affect performance to be so
high that it is beyond his or her capacity.
A salesperson perceives a conflict with their role when they are required to meet
multiple concurrent but incongruous demands (Churchill, Ford, & Walker, 1976; Tyagi,
1982; Walker, 1977). The boundary spanning role of the sales force significantly
contributes to perceived role conflict as the salesperson is trying to satisfy both their
external customer and internal managers (Evans, Margheim, & Schlacter, 1982).
Perceived role conflict has been found to reduce salesperson confidence and his or her
ability to meet expectations, although did not significantly influence salesperson
motivation (Churchill et al., 1976; Evans et al., 1982).
Role conflict can be resolved and behavior predictability increased when
managers unify strategy goals and operational activities (Menon et el., 1999). In agency
theory, uncertainty is managed by balancing risks and rewards through the use of

18
compensation contracts (Eisenhardt, 1988). In general, strategies that are not aligned with
the sales force compensation strategy contribute to increased perceived risk, uncertainty,
and role conflict for the salesperson. Because of the high informational content of pricing
strategies and the fact that pricing is a key selling tool, it is possible that the misalignment
of the pricing and sales force compensation strategies in particular will be a significant
contributor to salespersons’ role conflict, and ultimately a detrimental influence on their
perception of required effort. However, these specific relationships have not been
explored in the literature. This dissertation will examine these relationships and further
propose that aligning the pricing and sales force compensation strategies toward
congruent goals will positively influence the salesperson’s perception of effort,
instrumentality, and motivation.
Sales Force Control Systems
Agency theory is the foundation of much of the sales force control systems
research that focuses on improving sales force performance (Anderson & Oliver, 1987;
Shipley & Jobber, 1991; Misra, Coughlan, & Narasimhan, 2005; Hoskisson, Castleton,
and Withers, 2009). A control system, as defined by Anderson et al. (1987), “is an
organization’s set of procedures for monitoring, directing, evaluating, and compensating
employees” (p. 76). In an effort to improve firm performance, the goals of the sales force
compensation strategy are typically related to the firm’s objectives (Coughlan & Sen,
1989). The organization’s control systems are designed to solve two issues at the heart of
agency theory: the difficulty in monitoring sales force behavior and the need to mitigate
varying attitudes toward risk (Eisenhardt, 1989).

19
Research by Anderson et al. (1987) classifies sales force control systems into
outcome-based and behavioral-based systems. Outcome-based control systems consist of
commission-based compensation tied to performance quotas that are aligned with the
firm’s performance objectives (Anderson et al., 1987). The benefits to the organization
of an outcome-based control system include transferring risk from the organization to the
sales force and reducing the managerial resources needed to measure sales force inputs
(Anderson et al., 1987; John & Weitz, 1989; Lo, Ghosh, and LaFontaine, 2011).
However, the relatively low levels of direct managerial control featured in outcome-based
control systems may increase salespersons’ role ambiguity and exacerbate his or her
perceptions of the transferred risk, resulting in an increase in stress and turnover
intentions (Singh, 1998).
The characteristics of the behavior-based control system include a salary-based
compensation and the infrastructure for monitoring and controlling sales force inputs
(Anderson et al., 1987; Piercy, Cravens, and Lane, 2012). One benefit to the organization
of a behavior-based control system is increased managerial control, or the ease with
which the organization can direct the sales force to “perform certain behaviors as part of
the company strategy without the necessity of convincing each salesperson that the
strategy is valid” (Anderson et al., 1987, p. 78).
The more comprehensive the behavior-based compensation program the more
likely the manager will measure performance only on a limited amount of qualitative
criteria (Anderson et al., 1987). Performance evaluations of behavior-based
compensation programs are based on subjective ratings of the sales manager, which may
be perceived as unfair as increased effort may not be rewarded (Anderson et al., 1987).

20
The successful execution and evaluation of the company’s pricing strategy depends upon
the behaviors and performance of the sales manager and sales force (Lancioni et al.,
1993). Again, given the high informational content of the pricing strategy and the
importance of price as an instrument of sales, it is interesting to note that the sales force
performance literature has not explored how the organization’s pricing strategy
influences the salesperson’s perception of risk. This study will explore the extent to
which the alignment of the pricing and sales force compensation strategies toward
congruent goals might lower the salesperson’s perceived risk.

21
CHAPTER 2 (ESSAY 1)
EXPLORING THE EFFECTS OF PRICING ON THE SALES FORCE AND THE
FIRM: THE ADVERSE IMPACT OF STRATEGIC MISALIGNMENT
ABSTRACT
While the marketing strategy implementation literature suggests that collaboration
between the marketing and sales areas may ensure successful implementation of a firm’s
strategy (Malshe & Sohi, 2009), pricing and sales force compensation strategies have not
been directly linked together in a research study. Pricing and compensation have been
identified separately as possible problem domains for agency issues where the principal
and the agent have different goals and risk preferences (Eisenhardt, 1989) and areas
representing conflict for top management teams (Bourgeois & Eisenhardt, 1988). When
pricing and the sales force have been examined together, it has been to answer the
question: “Under what compensation system is it appropriate for a salesman to have
control over price?” (Weinberg, 1975, p. 937). However, the pricing delegation literature
does not address marketing components such as product and promotion management of
which pricing is a key element. This study fills a void in marketing literature by
investigating the detriments of misalignment, as well as the benefits of alignment of the

22
pricing and sales force compensation strategies in relation to the salesperson, the
marketing-sales interface, and the performance of the firm.
This research originated from a real-world problem that businesses regularly face.
The problem setting referenced in Chapter 1 occurred in a Fortune-250 B2B company.
The reasons for the failed marketing strategy were misattributed to other causes, and the
firm did not look to the misalignment of goals as a potential source of the problem. The
pricing and sales force compensation strategies are the two revenue generating strategies
for a company. While it would seem logical for managers to align the goals of these two
strategies, the reality is that organizations are often outward focused and reacting to
changes in the structure of the industry. The challenge for managers is to develop an in-
house concentration where goal alignment is deliberate, and the benefit of goal alignment
is improvement in firm performance.
Misalignment of the pricing and sales force compensation strategies can affect
the sales force by creating ambiguous roles for the sales force as they experience
confusion and uncertainty as to which activities are actually required to meet
performance expectations. Multiple concurrent goals can create a conflict in roles for the
salesperson trying to satisfy the external customer as well as the internal customer, the
marketing and sales managers (Miles & Perreault Jr, 1976). Conflicting goals increase
the salesperson’s perception of risk. In an attempt to achieve a multitude of goal
expectations the salesperson may, therefore, lose sight of the preferred role and goal of
the selling organization. The purpose of this essay is to explore the existence and
ramifications of misaligned goals of the pricing and sales force compensation strategies.

23
RESEARCH METHOD
As the nature of this research is exploratory, given the lack of literature on pricing
and sales force compensation goal alignment, a qualitative, grounded theory approach
was appropriate (Flint, Woodruff, & Gardial, 2002). A qualitative data collection method
of in-depth interviews is appropriate for obtaining a first-hand (key informant) account of
a phenomenon (Strauss & Corbin, 1990). The phenomenon of interest in this dissertation
is the effects of misaligned goals of the pricing and sales force compensation strategies.
Through the process of inductive reasoning, this research develops an understanding of
how misaligned goals negatively affect salesperson behavior, the sales force, and
organizational resources and communication. “Inductive reasoning is a type of thinking
that involves identifying patterns in a data set to reach conclusions and build theories”
(Hair Jr., Celsi, Money, Samouel, & Page, 2011, p. 276). The literature by Strauss et al.
(1990) establishes the primary criteria for the grounded theory approach guiding this
research. The criteria include an explanation of how and why the sample was chosen,
how the theoretical formulations guided the evolution of the protocol and data collection,
and how predominant and representative the concepts were.
Sample
The purposive (judgment) sample chosen for this research is the B2B sales
professional. A purposive sample is one representing elements unique to the research
interest and “are chosen because the researcher believes they represent the target
population, but they are not necessarily representative,” (Hair Jr., et al., 2011, p. 175).
This sample was chosen in a deliberate and non-random manner. The B2B sales manager
and the salesperson are intimately familiar with the process of enacting a firm’s pricing

24
policies to their customers and achieving sales force compensation goals. Elements
unique to the sample in this research include: 1) sales professionals who were responsible
for a range of customers, not just one key account, and 2) the salespeople who were
responsible for administering the firm’s pricing strategy yet had limited pricing authority
(with upper management approval only). The total sample of 15 sales professionals
included seven sales managers and eight salespeople. There was one instance in which
the salesperson and his/her manager were both interviewed. Table 1.1 details the sample
used in this dissertation. The details of the two phases of data collection are to follow in
the data collection section (Phase One = 8 interviewees and Phase Two = 7 interviewees).
Table 1.1. B2B sales professional
Count
Objective (n=15) Percentage
Job Title Sales Manager 7 46.70%
Salesperson 8 53.30%
Sales Experience < 5 years 1 6.70%
6-10 years 2 13.30%
11-15 years 1 6.70%
> 16 years 11 73.30%
Current Job Experience < 5 years 12 80.00%
6-10 years 1 6.70%
11-15 years 0 0.00%
> 16 years 2 13.30%
Commission Compensation 0% 2 13.30%
1-5% 7 46.60%
6-25% 3 20.00%
26-50% 1 6.70%
51-75% 0 0.00%
76-100% 2 13.30%

25
Table 1.1 continued.
Misaligned Goals
(pricing & sales force
compensation)
yes 7 46.70%
no 8 53.30%
Gender Female 5 33.30%
Male 10 66.70%
Overall, this group of sales professionals had many years (Mean = 21 years) of
sales experience, however relatively few years (Mean = 4.7 years) of experience with
their current employer. Only one salesperson in the sample had 0-5 years of experience
in the sales profession. There were two individuals (13.3%) who had 6-10 years of sales
experience. One individual (6.7%) had 11-15 years sales experience. The majority, 11
(73.3%) of the sales professionals had greater than 16 years of experience. Experience
with the current employer yielded differing results with 12 sales professionals (80%)
working for their current employer for 0-5 years. There was one individual who had 6-10
years of tenure with their current company. Only two sales managers had greater than 16
years of experience with the current employer. The majority (66.7%) of sales
professionals were males.
When the sales managers recounted the percent of annual salary that is
commission for the sales force they did so from a company perspective by reporting on
how the sales force in general is compensated. The salespeople interviewed reported their
individual percent of annual salary that is commission. To avoid confusion, all of the
commission percentages are reported from a company perspective. There were two
(13.3%) companies that compensated salespeople solely on a salary basis. For the

26
majority (46.7%) of companies, commission comprised 1% to 5% of annual salary for the
sales force. The percent of annual salary that is commission ranged from 6% to 25% for
three (20.0%) of the companies that participated in this study. One sales organization
(6.7%) offered commission between 26% and 50% of annual compensation.
Commission percentages ranging from 76% to 100% occurred in only two (13.3%) sales
organizations.
Interestingly, when the sales professionals were asked “Have you ever faced a
situation in which the way the company priced and promoted its products did not match
with your [your sales force’s] incentive/compensation structure?” the responses were
“yes” from seven (46.7%) sales professionals and “no” from eight (53.3%) sales
professionals. The response to the misalignment question differed in the interview with
the sales manager and the direct report at the same company. The salesperson stated,
“Yes.” The sales manager replied, “No.” The sales manager did concede that the pricing
strategies for some products, relative to how the salesperson is paid, meant that the
salesperson “needs to go out and work harder.”
Context
The context of this study is companies in B2B markets. Manufacturing or
industrial sales and sales to wholesalers are subsets of B2B markets. Research by Weitz
(1978) states “Industrial sales situations are characterized by a relatively high level of
involvement by both the salesperson and customer and a continuing relationship between
both parties of the interaction” (p. 514). The sales professionals interviewed for this
research sell in B2B markets and include both industrial sales and sales to wholesalers.
Sales situations involving sales to wholesalers and distributors are characterized by large

27
volume orders, downward pressures on price, and a trend towards the commoditization of
products (Draganska, Klapper, & Villas-Boas, 2010; Kopalle et al., 2009). The sales
professional’s role in B2B markets is critical to the success of the selling organization.
Data Collection
Prior to the pilot interviews, roundtable discussions with salespeople were
conducted to confirm the nuances of the selling environment, as well as the nomenclature
of the interview protocol. Once the initial interview protocol was established, the data
collection began. Data collection was completed in two phases. The first phase involved
a pilot study with sales managers and salespeople from several industries (insurance and
financial services, automotive aftermarket, B2B consumer electronics, and recreational
sports equipment). The target sample size for this phase was eight interviews: four sales
managers and four salespeople. Research by Guest, Bunce & Johnson (2006) suggests
that when using a purposive and relatively homogeneous sample that six to twelve
interviews can provide quality information. The eight transcribed interviews for the pilot
phase provided saturation on occurrences of misaligned goals and unique effects on the
sales force and the organization. A further discussion of the findings is addressed in the
analysis section.
Telephone interviews lasting forty-five minutes to one hour were held with each
salesperson or sales manager. The sales professionals were asked a series of questions
about how their company established prices and how their sales compensation package
was constructed (the protocol is provided in Appendix A). A series of open-ended
questions were asked to elicit possible misalignment of the goals of the pricing and sales
compensation strategies. The objectives for Phase One were: 1) to better understand

28
whether and how misalignment of the goals of the pricing and sales compensation
strategies may occur, and 2) to refine the interview protocol.
The pilot interviews began in November of 2011 and were finished in December
of 2011. A review of each audio file was done while the files were being professionally
transcribed. Once the transcribed files were completed the text files were read while
listening to the audio files to ensure transcription accuracy. The pilot interviews were
coded and segregated into the key concepts. The protocol was continually refined to
facilitate specificity, range and definition of each concept (Corbin & Strauss, 2008).
Phase Two interviews began in July of 2012 and finished in February of 2013.
The target sample size for Phase Two was a total of seven interviews: three sales
managers and four salespeople. Saturation of the data continued in Phase Two. The
protocol did not change after September 2012.
Interview Protocol
In-depth interviews with semi-structured protocols are especially useful in
uncovering complex processes, and provide a degree of relevancy to the topics under
investigation (Bartholomew, 2000). In the B2B marketing literature, in-depth interviews
have been used effectively in contexts in which limited research has been conducted
(Flint, Woodruff, & Gardial, 2002; Madhavan & Grover, 1998; Tuli, Kohli, &
Bharadwaj, 2007; Ulaga & Eggert, 2006). Importantly, the semi-structured interview
protocol affords greater flexibility to prompt and probe into a given situation
(Bartholomew et al., 2000). Since this dissertation explores the complex sources of
misalignment of goals that are created in different divisions of the organization and the

29
implications of this misalignment, the use of a structured, in-depth-interview approach is
especially well suited to the context.
The goals of the interviews were to identify a) sources of incongruent goals of the
pricing and sales force compensation strategies within organizations, b) behaviors of
salespeople that result when the goals were incongruent, c) inefficient use of
organizational resources, and d) ineffective communication as a result of incongruent
goals of the pricing and sales force compensation strategies.
Corbin & Strauss (2008) state that “The original question in a qualitative study is
often broad and open-ended. It tends to become more refined and specific as the research
progresses and the issues and problems of the area under investigation are defined” (p.
41). The specificity and range of these concepts was enhanced with changes to the
protocol. For example, in the initial protocol, the question used to identify the
motivational influence of a firm’s pricing strategy was “Can you tell me about a time
when you felt any more or less motivated to sell/perform by price structure, price
changes, or other things out of your control?” In the first interview, the response from the
sales professional confirmed a situation where the selling company changed brands of a
product and increased their selling price to the market by 20 percent.
The sales manager, TW13 stated, “It was a tough sell for the salespeople
because it was such an increase in cost to the customer and the
salespeople could not envision [the customer paying that much for this
new brand].” The sales manager went on to say, for him “It was a hard
struggle to educate the sales force and the customer as to why the price of
this new brand of product was increased so much higher than the
originally offered brand of product.”
After this interview, the original question in the protocol was followed with a
question regarding the concept of customer satisfaction which asked “When you look at

30
product pricing, how does price affect the amount of customer satisfaction you have
established [your sales force has] to sell a product successfully?” In addition, a question
was added to inductively probe for situations where the salesperson’s perceived risk of
being unsuccessful was affected as a result of a pricing strategy. The extended question
was framed as “In general, how does your organization’s pricing approach affect your
[your sales force’s] ability to sell effectively? Does it cost you sales/customer
satisfaction? <Probe for either positively or negatively. Probe for examples of
salesperson risk or perceived effort.>.” In Appendix A, the original protocol is
displayed in regular text and the changes are listed in bold, italicized text.
In accordance with a grounded theory approach, this dissertation “should help the
reader to assess some of the components that emerged from the actual research process”
(Corbin & Strauss, 1990, p. 16). Table 1.2 illustrates the codebook that was created
using an iterative process as suggested by Guest et al. (2006). In this process, each code
has four parts: 1) a full definition that explains the concept; 2) a “when to use” section
that gives instances, based on the data, of how to identify the concept; 3) a sample of a
quote extracted from the data representing the concept; and 4) respondent interviews that
have occurrences of this specific concept.
Interrater Reliability
After the interviews were conducted and transcribed, two judges worked
independently to code a random subset of the transcripts for common themes. The coders
then discussed the major themes and defined each theme based upon mutual agreement.
The judges then independently coded each transcript for the presence of the main themes.
All disagreements among the judges were resolved by discussion. Intercoder reliability

31
was assessed using the established procedures of Rust and Cooil (1994). The resulting
interrater reliability score was .89, exceeding the .70 threshold for acceptable reliability.
Table 1.2. Illustration of codebook
Table 1.2. Illustration of codebook used for interviews
Concept Definition When to use Sample of coded item
Respondents with
occurences of the
concept
Misaligned goals
The goal of the pricing strategy
(either profit maximization or
market share growth) is
incongruent with the goal of the
sales force compensation
strategy (either profit
maximization or market share
growth).
Two different goals for the pricing and
sales force strategies exist. Code
associated with this concept: Goal
conflict.
"Unfortunately, it’s more to the
customer’s benefit because in this market
we’re always being pushed down on
price. I like my prices to be high and I like
the margin to be there [where I need it] ."
(KB6)
EJM4, KB6,MR7,
MQ8, PS9, SD11,
TE12, TW13, TA14,
Adverse selling
behaviors of the
salespeople
The negative activities that
salespeople conduct during the
selling process.
When the sales professional engages in a
tactic or activity during the selling process.
Examples include: planning, not performing
job responsibilities, and gaming the system.
Codes associated with this concept:
effect of pricing on sales performance,
multiple goals, offsetting noncompetitive
prices with other resources, customer
relationship building, and sales person role
conflict.
"If the product sales amount was too
small, even though it is new business, I
don’t get compensated… I am not
motivated to sell that product. " (DL3)
BR1, CS2, DL3,
EJM4, JG5,
KB6,MR7, MQ8, PS9,
RS10, SD11, TE12,
TW13, TA14, WW15
Sales force
perceived effort to
be successful
The salesperson's anticipated
amount of cognitive and physical
energy and time required for a
job task.
When the sales professional suggests that
his/her effort has been or will need to be
increased or decreased. Codes
associated with this concept: effort,
motivation, sales effort (perceived), sales
force performance, sales person role
conflict, sales professional helplessness no
control, trust.
"This situation requires a great deal more
effort on the part of the sales manager, to
educate the sales force, and for the sales
force to educate the customers on why
they should buy this new brand and pay
more." (TW13)
BR1, CS2, DL3,JG5,
EJM4, KB6, MR7,
MQ8, PS9, RS10,
SD11, TE12, TW13,
TA14, WW15
Perceived risk of
being unsuccessful
The perceived degree of
relationship a person sees
between his/her actions and
liklihood of not achieving the
desired outcome.
When the sales professional perceives that
their ability to perform and achieve the
desired level of accomplishment has been
compromised. Codes associated with
this concept: instrumentality, perceived
risk- ability to be competitive, perceived
risk of achieving a goal, price adjustments,
sales force performance, organizational
resources
"Even with 90 percent of market share
you still have to be careful with pricing.
If you open the door for your competitors
to come in, you will be screwed. You will
lose customers [and everything else] and
then you will regret having administered
the price increase ." (SD11)
BR1,CS2, DL3, EJM4,
JG5, KB6, MR7,
MQ8, PS9, RS10,
SD11, TE12, TW13,
TA14, WW15

32
Table 1.2 continued
Key Emergent Concepts
The following seven concepts emerged from the data as being affected by
misaligned pricing and sales force compensation goals:
selling behaviors of the sales force;
perceived effort by the salesperson;
perceived risk of being unsuccessful;
cost of monitoring sales force outcomes;
Table 1.2 Continued . Illustration of codebook used for interviews
Concept Definition When to use Sample of coded item
Respondents with
occurences of the
concept
Cost to monitor
sales force
outcomes
The use of resources as they
relate to managing, monitoring,
or evaluating sales force tactics,
activities, and outcomes. .
When the sales professional indicates a
monitoring, reporting or evaluative process.
These included both planned and
unplanned. Codes associated with this
concept: cost of monitoring sales,
monitoring sales, promotion non-price
related, sales person perk
"The computer will not let the salesperson
enter an order or sell something cheaper
than the established price. The
salesperson has to get a manager to sign
off on something like that; especially, if
you are trying to do a favor for a
customer [that is on a higher price
level] ." (TW13)
BR1, CS2, DL3,
EJM4, LG5, KB6,
MR7, MQ8, PS9,
RS10, SD11, TE12,
TW13, TA14, WW15
Use of
organizational
resources
The inefficient and unauthorized
use of organizational resources,
and loss of tangible and
intangible resources.
When the sales professional indicates an
inefficient or unauthorized distribution of an
organizational resource. Codes
associated with this concept: offsetting
noncompetitive prices with other resources
"A salesman who is paid commission to
sell volume, has a product that’s high-
priced and to try to get a customer to buy
at the higher price, they throw in free
freight or they throw in terms, or they
scrounge around and find something
throw in to offset the high price. It
happens every day. " (WW15)
BR1,CS2, JG5, KB6,
MR7, MQ8, PS9,
RS10, SD11, TE12,
TW13, WW15
Quality of
Organizational
Communication
Quality of communication is the
interpersonal, transactional,
symbolic process by which
individuals achieve and maintain
understanding.
When the sales professional represents the
selling organization in a message. When an
organization communicates to the market.
When the quality of communication
between the sales and marketing
departments is mentioned. Codes
associated with this concept: Customer
relationship building, external
communication, goal conflict, internal
communication, organizational
communcation
"A couple of years ago, when I was with
my other company, we had price changes
three or four times a year. It was really
uncomfortable to call the customer to tell
them, “Guess what, we are going to
change the prices, AGAIN .” (PS9)
BR1, CS2, DL3, JG5,
KB6, MR7, MQ8,
PS9, RS10, SD11,
TE12, TW13, TA14,
WW15
Inter-functional
relationship
between marketing
and sales
The inter-dependence and
relational environment between
the marketing and sales
functional areas.
When the respondent mentions the
marketing department or pricing manager.
(Can be positive or negative connotation.)
Codes associated with this concept:
interface between marketing and sales and
marketing and sales dept. conflict.
"Initially the marketing department was
separate from the sales department.
There were some very clear disconnects
when marketing and sales weren’t
working close together. There were
missteps in the promotion and more
importantly, a lack of sales support out of
the marketing department ." (BR1)
BR1, CS2, DL3,
EJM4, KB6, MR7,
MQ8, PS9, RS10,
SD11, TE12, TW13,
TA14, WW15

33
use of organizational resources;
quality of organizational communication;
inter-functional relationship between marketing and sales.
In this section, each of the seven concepts will be explained. Then a series of
propositions will be developed focusing on the relationship between each of the emerging
concepts and the misalignment of the goals of the pricing and sales force compensation
strategies.
The concept of goal misalignment originated out of a phenomenon experienced
by the author. Despite the fact that the author had a working understanding of the goals
of both the pricing and sales force compensation strategies, confirmation of the ubiquity
of these goals in B2B markets was required. Conversations with salespeople prior to the
pilot interviews confirmed that the goals of both the pricing and sales force compensation
strategies generally were focused to either maximize profit or grow market share.
Throughout the interviews, when prompted to focus on one product group or product
line, the goal of the pricing strategy was communicated as either profit or “the high-end”,
or market share growth or “the low-end.” All of the sales professionals interviewed
confirmed having either profit maximization or market share growth as a sales goal.
Once these goals of profit maximization and market share growth were confirmed, the
process of uncovering the concept of misalignment began.
The nature of goal misalignment and the seven concepts emerged from the data
through described events, actions, and/or feelings from those interviewed. The following
section details how these concepts emerged.

34
Goal Misalignment
Misaligned goals of the pricing and sales force compensation strategies occurred
in approximately 50% of the companies represented by sales professionals interviewed
for this study. All of the sales professionals acknowledged the salesperson’s dependence
on price as a tool. A sales manager (TE12) suggested “if anything they may use price as a
crutch.” This study suggests that when the goals are misaligned the organization is
restraining the sales force from accomplishing the sales goal for which they are being
compensated. As a sales manager (TW13) stated in reference to changes in pricing and
the stationary market share growth target for his salespeople,
One was different from the other. It didn’t matter what they did with the
pricing. Your growth expectancy still remains. They want you to grow
20%-30% before you hit your bonus and it does not matter whether the
pricing has changed during the year.
During the interview process, the concept of having congruent goals for these two
strategies seemed foreign to some and familiar to others. Therefore, two approaches
were used to identify if the company’s goals for their pricing and sales force
compensation strategies were incongruent. The first approach was to have the sales
professional think about the goals of each strategy separately. The sales professional was
asked “Is your compensation based on profit margin goals or market share growth
goals?” Later in the interview the sales professional responded to the following question,
“Are the goals of the pricing strategies apparent or communicated to the sales force?”
All individuals responded “yes” and communicated the specific goal of the pricing
strategy. When asked about the goals of these two strategies in a separate fashion, nine
sales professionals (60.0%) indicated that the goals were incongruent with each other.
The second approach included the question, mentioned earlier, “Have you ever faced a

35
situation in which the way the company priced and promoted its products did not match
with your [your sales force’s] incentive/compensation structure?”, which yielded a
response of seven (46.7%) sales professionals stating “yes”. Several sales professionals
recounted incidents they observed relating to other salespeople with regard to pricing
acting as a constraint to sales performance. As the interviews progressed the negative
effects of misalignment were apparent on the sales force, the misuse of organizational
resources, the quality of organizational communication, and the quality of the inter-
functional relationship between the marketing and sales functions.
Adverse Selling Behaviors of the Sales Force
When continually comparing the transcribed interviews, more refined concepts
affected by the misaligned goals of the pricing and sales force compensation strategies
emerged, such as adverse selling behaviors. Misaligned strategies may encourage
salespeople to adversely adapt their selling behaviors. For example, MQ8 is a
salesperson who earns commission on market share growth while the pricing goal is
admittedly based on profit. When MQ8 perceives that the price of the product is too high
for the customer, MQ8 offers the following,
I work out a deal with the customer offering free freight or whatever
provides the customer with more value.
The salesperson who has access to resources within the selling organization will
invest his/her time seeking ways to counteract the high selling prices. If adverse selling
behaviors were on a continuum perhaps spending time “giving away profit” instead of
making new sales would be on one end and on the opposite end would be abstaining from
selling certain products entirely. Salesperson DL3, who is compensated on profit margin

36
maximization, talked about refraining from selling products not priced high enough. DL3
reports,
If the product total is a small value even though it is new business, I don’t
get anything… I am not motivated to sell that product.
Salesperson SD11 is compensated on market share growth yet his company prices
the products SD11 sells with a profit maximization objective. SD11 sells to wholesalers.
The company that SD11 sells for has a published price sheet however SD11 has found a
way to circumvent the system. In fact SD11 comments,
You know, we are legitimate, we publish our pricing list and we stick to it.
But then there are also pricing levels. Every company, whether they admit
it or not, has multi-pricing levels. The levels are contingent on the
purchasing power [purchasing volume] the customer has. If a company is
just starting out, and I know this person and I know he is going to be good.
I will help him out with a better pricing level.
The Marketing department of SD11’s company has likely established pricing
levels to reward companies that buy large volumes with lower prices in an effort to
protect the margin opportunity in the resell channel. Typically these buying companies
have significant overhead and demand large margins when pricing to their end customers.
When SD11 offers the product to a start-up company (likely with less overhead than the
large company) at the large volume customer price level it affords the start-up company
the opportunity to undercut or “lowball” the large company’s selling price with the exact
same product. The long term ramifications of SD11’s behaviors will erode the referent
price of the product in the end-user market, and the company’s large customer will
become extremely angry. Meanwhile, SD11 is growing market share by opening start-up
companies albeit at less margin than was designed by marketing with the pricing strategy.

37
Perceived Effort to be Successful
Effort is defined as the amount of cognitive and physical energy and time invested
in a job task (Jaramillo & Mulki, 2008; Rangarajan, Jones, & Chin, 2005). Perceived
effort would then be the salesperson’s anticipated amount of cognitive and physical
energy and time required for a task. Organizations establish sales thresholds for the sales
force and award outcome or behaviors with compensation. Sales management literature
states that sales force control systems are thought to be able to direct efforts. “Control
systems have an impact on the salesperson’s thoughts and feelings and certain behaviors”
(Oliver & Anderson, 1994, p. 60). This study finds that indeed the pricing strategy
influences a salesperson’s perceptions of the effort believed to be required to be
successful. The pricing strategy in concert with the goal of the sales force compensation
strategy enables the salesperson to evaluate and determine the effort needed and react
accordingly. Sales manager EJM4’s sales force is compensated on market share growth
and the firm’s pricing strategy is profit maximization. EJM4 commented on the various
levels of sales force effort,
When the sales force knows that the price of a product is hot and right
[lowest in the market], they are in the field pushing and selling. When the
sales force knows that the price of a product is about the same as the
competitors, that is how they treat it, just the same as everybody. When
they know that the price of a product is too high, way out of line with the
market, they will not even try to sell it.
Sales manager TW13 remembers a situation where the selling company switched to a
brand of product and priced the product 20% higher than the originally carried brand.
The sales force, compensated on market share growth, perceived that it would take too
much effort to try to convince the customers to buy. TW13 states,

38
This situation requires a great deal more effort on the part of the sales
manager to educate the sales force, and for the sales force to educate the
customers on why they should buy this new brand and pay more.
Perceived Risk of Being Unsuccessful
As discussed in Chapter 1, risk is deliberately induced and transferred to and from
the sales force and the company through sales force control systems. Outcome control
systems require very little managerial involvement, include objective performance
evaluations, are associated with pay for performance compensation methods, and as a
result, transfer risk to the salesperson (Oliver, et al., 1994). In contrast, behavioral
control systems require extensive managerial involvement through monitoring,
evaluation, and approval processes. Behavioral control systems are associated with a
larger salary component of compensation whereby risk is maintained with the company
(Oliver et. al., 1994).
To understand how the concept of the salesperson’s perceived risk of being
unsuccessful emerged from the data as an important concept in this study, sales manager
TE12 stated,
In the last two years, price has moved up to the number two or three top
challenge [to overcome] as reported by the sales force.
Sales manager TW13, whose team is compensated with a market share growth
goal, speculates the reason for his/her organization’s high profit margin requirement on
product pricing is the result of the organization’s low purchasing power. This company
must pay a higher price for the components, and may attempt to recoup the higher costs
with a higher priced product. However, the resulting price was higher than the market
referent price. In response to management’s growth expectations (year over year, double
digit growth), TW13’s level of perceived risk of being unsuccessful is high,

39
There is always going to be somebody that is going to buy from you
because it is convenient. But when it comes down to fighting it out on the
streets [for new market growth] unless the selling company has their costs
under control, and can price the product competitively, you are not going
to grow the business and you are not going to make it as a salesperson.
One of the sales managers interviewed explained that once a year, the salesperson
and the manager sit down together and establish the bonus thresholds for the coming
year. The manager, TE12, stated,
It is a team process with feedback. It doesn’t do us any good to put
unrealistic goals. The salesperson knows the market better than anyone
else. Admittedly, there is a fine line between sandbagging and setting
goals way too high and that is the negotiation point. The salesperson and
the sales manager agree on a goal that is motivating and not
demotivating.
Another concept that emerged from the interviews that is related to a
salesperson’s perceived risk of being unsuccessful is a salesperson’s perception that
he/she can be competitive selling the company’s product offering. The perception of
being competitive is most relevant when the competition is intent on stealing business
from the salesperson. The threat of losing a big customer as a result of pricing can put a
salesperson’s sales goal and commission or bonus at risk. This occurs even with the
salesperson participating in establishing the sales goal threshold. Again, comments from
sales manager TE12,
We have a customer that is an $800 million distribution center. Our
salesperson is saying the customer is threating to leave. If we want to
keep the business we have to meet their new price demand. The selling
company produces original equipment quality parts and the large
distributor is threatening to pull the business and go with an off-shore
supplier whose selling price is 70% of our selling price. It caught the
salesperson and me off guard.
40
In this case, the actions of the selling company and the customer determine the
salesperson’s reward outcome and the salesperson will likely perceive a high degree of
risk in not achieving the sales goal, hence his/her bonus.
One sales professional participating in this study expressed concerned with
pricing although the company enjoys near monopoly in the market. This salesperson still
fears the competition coming in and eroding what the sales force has accumulated.
Comments from salesperson SD11 (compensated on market share growth),
Even with 90 percent of market share, you still have to be careful with
pricing. If you open the door for your competitors to come in, you will be
screwed. You will lose customers [and everything else] and then you will
regret having administered the price increase.
When the goals of the pricing and sales force compensation strategies are
misaligned the salesperson perceives a higher risk of being unsuccessful. Perceived risk
is very real to salespeople. If performance goals are not met, the salesperson is out of a
job. Sales manager, BR1 confirms,
I remember releasing salespeople that were not producing. I let them go
because I do not think they were working hard enough or perhaps they felt
it was too difficult to sell and just didn’t produce.
Cost to Monitor Sales Force Outcomes
When an organization establishes the sales force compensation strategy, the
resources for monitoring and systems for evaluating are also in place. Moreover, the
monitoring costs are anticipated. When goals are misaligned the frequency of failed goal
attempts increases. Organizations do not grow if the sales force is not achieving sales
goals and salespeople do not remain in positions when sales goals are not met. The
organization that employs SD11 has misaligned goals. SD11’s organization has created

41
extensions or exception-monitoring programs to accommodate the occurrences of failed
sales goals. Salesperson SD11 who is compensated on market share growth noted,
We get evaluated on a quarterly basis. If you hit your sales goal, you get
commission. If you do not [hit your sales goal] you are in the hole for the
next quarter review. You have to make up the prior quarters negatives or
deficits before you can earn commission. This continues throughout the
year.
A profit maximization compensation strategy is associated with a behavioral
control system that requires a great deal of managerial input, monitoring, feedback, and
guidance. Once the behavioral control systems are part of daily operation, it is
cumbersome for an organization to manage a market share growth price promotion.
Managers get conditioned to measure changes in specific matrices. A requirement of an
effective sales force control system is that the sales force comprehends the parameters on
which they are being evaluated. Behavioral control systems would likely measure profit
margin growth and return on sales, which are completely different matrices than revenue
market share and/or customer or market penetration. In the problem setting referenced
earlier, the organization, which compensates the sales force based on profit, tried to run a
market share growth price promotion in a specific region. The organization did not have
standard reports in place that would show the incremental growth of sales in units per
salesperson. The results of the first month were not readily available to the salespeople.
The organization enlisted the aid of an employee from the accounting department to
create a report for the remaining two months of the promotion. At the end of each month
of the promotion, the managers met to discuss possible ways to positively influence the
outcome of the promotion. The application of ineffective solutions cost the company

42
resources and created extra audit measures for the added delivery service. This problem
stemmed from misaligned goals.
A market share growth compensation strategy is associated with an outcome
control system requiring minimal supervisory monitoring, evaluation, and input. A sales
force evaluated on outcomes, not behaviors that it takes to achieve these outcomes,
performs his/her job duties with a high level of autonomy (Oliver & Anderson, 1994).
The benefits of an autonomous sales force with a goal to grow market share are placed in
double jeopardy when the challenge of misaligned pricing (profit maximization goal) is
combined with an organizational restriction on who can change prices. With sales goal
achievement at risk, the members of the sales force will either continually appeal to their
supervisor and/or other members of the management team for relief, or they will
circumvent organizational procedures that manifest in misattributed loss of resources.
Unplanned events in business cost managers time and detract from efficiencies and
growth. Salesperson MQ8 references the additional supervisory involvement needed
when faced with a compensation goal of growing market share, but when forced to sell
products with increasing prices,
In searching for something to offset the higher prices for one particular
order, I will go to my manager and explain the customer situation and ask
if the manager will approve a five percent discount for the customer
paying for the order cash in advance or a two or three percent discount if
the customer pays in ten days. I am not empowered to authorize these
things.
Sales manager TW13 comments,
The computer will not let the salesperson enter an order or sell something
cheaper than the established price. The salesperson has to get a manager
to sign off on something like that, especially if you are trying to do a favor
for a customer.

43
Sales manager TE12 discusses the process that his company goes through when a
salesperson requests lower than listed prices,
When the salesperson comes to management and says, “We need a 10 to
15 percent price reduction on this part to continue our sales volume with
this customer and here is what is going on,” management gets together
and determines if we can do this or not. If we can’t, then we try to buy a
couple of days, or weeks to get our purchasing and procurement guys
involved and say, “Listen, we have to get a better price.”
One of the most proximal drains on organizational resources is an increase in costs to
monitor and manage the sales force. This drain increases with misaligned goals of the
pricing and sales force compensation strategies.
An organization that has aligned goals for the pricing and sales force
compensation strategies has processes and systems in place that are conducive to the flow
of information throughout management. A sales manager (CS2) who is in an
environment in which the pricing and sales force compensation goals are both market
share elaborates,
We have an automated process called the SPAR process, Special Price
Authorization Request. The form asks the salesperson to key in responses
to basic questions that management would want to view. For instance,
who is the competition, what is the competitive price, what is it the
competitors are offering and for how long. As the sales manager, I have
authorization to deviate from the published price and offer a discount. All
of the details are in the computer system and everything is done up front.
Organizational Resources
This research is specifically concerned with the inefficient and unauthorized use
of organizational resources that may result from misaligned goals. Resources at risk of
being commandeered are those that do not impact the sales force compensation or the
compensation goal. The interviews revealed the losses of tangible and intangible

44
resources are often undetected or erroneously misattributed to conditions other than the
misaligned goals of the pricing and sales force compensation strategies. A salesperson
compensated on market share growth may misappropriate organizational resources if it
results in growing his/her territories market share. Sales manager TW13 makes the point
about such a situation,
If your prices are not that great [compared to competition], and you want
to win the sale, we have told customers that we will deliver to them [free]
four and five times a day whereas the competition will only come twice.
Opening new accounts and securing new business is a responsibility of the sales
force. Salesperson MR7 is compensated on market share growth and is expected to open
new accounts and secure new business. When a salesperson spends nearly half of his/her
time in pricing negotiations with customers, there is limited time for prospecting. Also at
risk is the current customer base, as constant negotiation slows down the selling process.
A reduction in speed or frequency of the selling process results in fewer products in the
market, in other words, a smaller share of the market. In the words of the salesperson
(MR7) compensated on market share but tasked with selling products priced to maximize
profit,
I have a particular area in my territory that is an extremely competitive
market, it is a big market and for that reason is very important. It is hard
for us to meet the customer’s price requirements. Most of the time, we do
not give the customer the price they are requesting. It frustrates the
customers. I spend 60 to 70 percent of my time in price negotiations in
this region. Overall, I spend 40 to 50 percent of my time talking to
customers about price.
The hidden costs of misaligned goals erode an organization’s profits. Considering the
total number of customer orders an organization processes in a year, these losses could be
substantial.

45
Organizational Communication
The scope of organizational communication used in this research includes
messages to and from the external market partners as well as to and from the internal
marketing and sales areas. “Quality communication is the interpersonal, transactional,
symbolic process by which individuals achieve and maintain understanding”
(Montgomery, 1981, p. 21). Quality communication occurs between individuals, such as
a salesperson and a buyer, when they can interpret meaning using verbal and nonverbal
cues. Quality communication is a process of constant interactions and develops over time
(Montgomery, 1981). Consider the situation where the organization is not clearly
communicating to the customer the need to frequently adjust prices; however, the
salesperson is sufficiently clear on his/her communication regarding the frequent price
adjustments. The sales professionals interviewed for this study stated that the pricing
information was shared with customers by another functional area of the organization.
However, the salesperson called their customers to have a follow-up conversation to
explain why the price adjustment (usually an increase) occurred. Salesperson PS9 is
compensated on market share growth and the goal of the pricing strategy is profit
maximization. The organization that PS9 sells for strives to maintain a high profit
margin and as raw material costs increase the organization quickly passes those costs on
to the customers. PS9 could have chosen to improve the quality of communication
regarding the numerous price increases by listing and explaining the various sources of
the increase. Instead, PS9 who is compensated on market share growth corrodes the
communication with negative attitude. PS9 commented,
A couple of years ago, when I was with my other company, we had price
changes three or four times a year. It was really uncomfortable to call the

46
customer to tell them, Guess what, we are going to change the prices,
AGAIN.
The frustration that the salesperson felt toward the organization was transmitted to the
customer. In this situation, misaligned goals of the pricing and sales force compensation
strategies do not benefit the salesperson nor do they benefit the customer. It is likely that
the reputation of the selling organization was tainted and that the customer was
empathetic towards PS9. Had PS9 been compensated on profit maximization, hence the
goals of the pricing and sales force compensation strategies aligned, then PS9 may have
been more motivated to clarify the organization’s communication.
Salesperson KB6 explains a situation involving an original equipment
manufacturer (OEM) that tried to gain entrance into the aftermarket. An OEM typically
commands a high profit margin for the products. Aftermarket manufacturers are not held
to the same standards of an OEM and therefore sell at a much lower referent price.
Salesperson KB6 was hired by the OEM, compensated on market share growth, and was
tasked with growing business in the aftermarket with high profit margin prices. In
addition to the misaligned strategies, the OEM lacked the product marketing
infrastructure required to participate in the aftermarket. KB6 explains the lack of product
information and how this lack of product communication impeded the sales process.
KB6 stated,
The quality of the product was good but their prices were too high. On the
price list the company listed their part number and a price. The sales
force was not given a medium with which to communicate the benefits of
the high priced product. There was no interchange to industry numbers,
and no reports that communicated product comparisons to competitors’
products.

47
A low quality of internal communication may signal to the customer that there are other
problems throughout the salesperson’s organization. KB6 eventually became so
frustrated that he quit the company.
Inter-functional Relationship between Marketing and Sales
Trade publications and academic literature have documented the sometimes
venomous relationship between marketing and sales. Tenuous relationships between
marketing and sales are made worse when the goals of the pricing and sales force
compensation strategies are misaligned. From the salesperson’s point of view, the
pricing strategy is created by marketing, and marketing is out of touch with the market
reality. The sales force is responsible for the implementation and success of the pricing
strategy, yet the sales force has limited or no input and the sales force compensation goals
are not considered. A good example of this is reported by sales manager CS2,
Here we are siloed. We have a VP of Marketing and a VP of Sales. The
fact of the matter is that sales and marketing are butting heads. The
marketing people are over in their fiefdom doing their stuff, and they are
not telling us what they are doing. They think they communicate, but they
don’t and they complain about us. The marketing guys complain, “Sales
guys are dumb and don’t know what they are doing. Having separate
leaders for sales and marketing is obstructing the pursuit of sales growth
here.”
Misaligned pricing and sales force compensation goals are a forecast for imminent failure
of one or both strategies. Sales manager BR1 managed a sales force compensated on
market share growth, and responded,
Initially, the marketing department was separate from the sales
department. There were some very clear disconnects when marketing and
sales weren’t working close together. There were missteps in the
promotion and more importantly, a lack of sales support out of the
marketing department.

48
The success of a pricing strategy is co-owned by the marketing and sales
functional areas. Research by Malshi et al. (2009) demonstrated that “successful strategy
creation and execution requires both functions (marketing and sales) to be equally
invested in the entire process” (p. 401). Malshi et al. (2009) found that
“an open exchange of ideas” and a mutual “understanding of the market
reality” were necessary to facilitate the “three main stages (groundwork,
transfer, and follow-up) of marketing strategy making across the
marketing-sales interface” (p. 415).
When misaligned goals emerge from the two functional areas, relationships are
unnecessarily complicated.
PROPOSITIONS
In the following section a series of propositions are developed based on the
literature and interviews. These propositions elucidate the significant challenges that
organizations face when the goals of the pricing and sales force compensation strategies
are misaligned.
Misalignment and Sales Force Behavior
Weitz (1981, p. 85) develops a contingency framework based on the idea that the
effectiveness of sales behaviors are at least in part determined through the interactions of
“sales behaviors, resources of the salesperson, the nature of the customers’ buying task,
and characteristics of the salesperson-customer relationship”. The resources belonging to
the salesperson include his/her sales ability, knowledge about the product and customer,
and personal characteristics (Weitz, 1981). In the qualitative study, Weitz (1981)
mentions the extent to which company resources are available to the salesperson to use or
offer as a way to satisfy customer needs. Company resources include, “the company

49
reputation, price, delivery, and terms” (Weitz, 1981, p. 93). Experienced salespeople
become adept at identifying the company resources that can be easily offered to the
customer in consolation for high prices. The salesperson deliberately offers resources to
customers that pose no compensation repercussions to themselves, albeit come as a cost
to the selling organization. The effectiveness of the sales behavior relates to the
salesperson adapting to the sales environment only when the “result in the benefits
outweighs the costs of practicing adaptive selling” (Weitz, Sujan & Sujan, 1986, p. 176).
Sales manager EJM4 provides an organizationally supported solution,
We instruct the salespeople that if they need, what we call display units,
they can give them to the customer free of charge. We are willing to give
the unit away if necessary to garner the business. The salespeople have
certain added value tools that they can use to bring the value of the order
to where it needs to be to compete against the low ball price of a
competitor.
Salespeople are trained to highlight the quality of the products or services and
accentuate the customer service element of the company when persuading a customer to
buy (Lancioni & Gattorna, 1992). Talking about price too early can diminish the
salesperson’s opportunity to properly sell the products or services to the customer
(Lancioni & Gattorna, 1992). Pricing that is broadcast directly to the customers pre-
empts the salesperson’s ability to highlight the benefits of the company or any possibility
of upselling to a more profitable or expensive product. Placed in a situation where the
customer already has knowledge of the pricing and the salesperson has conflicting goals
of the pricing and sales force compensation strategies, requires that the salesperson
become creative at adding value for the customer or creative in the selection of products
to sell or not sell. Misalignment increases the likelihood that one or more goals will not
50
be achieved. Actively including both sales and marketing in the strategy development
process increases the chance for goal alignment and strategy success.
Misalignment of strategies occurs at the time of strategy development within the
respective functional areas. Marketing and sales collaboration must be supported with
aligned goals and processes (Le Meunier-FitzHugh et al., 2011; Rouziès et al., 2005). A
disjointed planning process between the marketing and sales interface may negatively
impact firm performance (Rouziès, et al., 2005). In practice, the pricing strategy
critically impacts the ability of the sales force to effectively achieve their goals and
compensation (Joseph, 2001; Weinberg, 1975). Anecdotally, managers dismiss claims
made by the sales force of lost sales as a result of an unresolved price issues but they
never really know for sure. The sales force suffers from alienation of their own firm
where misalignment exists, while simultaneously attempting to form long-term
relationships with their customers. The disenfranchisement of the sales force from the
firm due to misalignment is not only costly in the form of reduced sales, but also likely to
be contagious to the customer resulting in reduced satisfaction with the firm.
Performance expectations and demands accumulate to establish the role of the
salesperson (Walker et al., 1977). If the expectations and demands are in conflict,
choosing and completing the appropriate task to improve the salesperson’s performance
becomes difficult. For example, consider a sales strategy with a goal to increase market
share by eight percent. In this scenario, for the sales force compensation strategy and the
evaluative process to be effective, both would focus toward gaining market share.
However, if frequent price increases by the marketing area occur in response to a
dynamic customer environment or internal changes, this transmits confusing messages to
51
the sales force. In this example, the activities and behaviors of the sales force would be
representative of a market share growth strategy while the frequent pricing increases
suggest the pricing for a product with a profit maximization strategy.
Pricing and sales force compensation strategies that have misaligned elements and
conflicting goals cause confusion with regard to the evaluative standards and processes
established for the sales force. The outcomes as a result of goal misalignment may yield
effective yet objectionable sales behavior. Thus,
P1: When the pricing and sales force compensation strategies are not aligned
toward achieving congruent goals, there is a negative effect on the selling
behaviors of the sales force.
Perceived Effort
When a firm has multiple incongruent goals governing the sales force, the results
may be chaotic for the sales force. The lack of clarity of expectation can cause the sales
force to experience role ambiguity (Miles and Perreault Jr, 1976), and role ambiguity
increases the effort that salespeople perceive will be necessary to complete a task (Singh,
1998). Evidence of the resulting effort inefficiencies may also be visible to the external
market through the sales function. In an attempt to offset escalating prices and preserve a
competitive level of customer value in the face of a conflicting compensation package,
for example, the sales force may scramble to offer easily available resources that may be
perceived as benefits to the customer but are unnecessarily costly to the organization.
A commonly exhibited agency problem is that the goals of the principal are
different from the goals of the firm (Eisenhardt, 1989). When the pricing and sales force
compensation strategies are aligned toward congruent goals the expectations of the sales

52
force are clear and role and goal ambiguity is reduced. Allowing the sales force to focus
on clear goals ensures the opportunity for success. For example, consider two pricing
strategies: one that supports a profit maximization goal and one that supports a market
share growth goal. In general, a profit maximization price strategy removes the lengthy
price negotiation and allows the sales force to concentrate on performance enhancing
behaviors such as offering customers the right product or service solutions. A market
share growth price strategy can lengthen the sales process for the salesperson as
discounted pricing may invite frequent price negotiations while the customer attempts to
find the bottom or lowest price. However, a market share growth goal for the price
strategy can also help the organization gain access to new market share. If the sales force
compensation strategy is aimed toward market share growth, and the pricing strategy is
also aimed at market share growth, then the salespeople have the pricing tools, the
direction from management, and the reward structure they need to go out and sell, and
ultimately improve the firm’s performance through gaining market share. Misaligned
pricing and sales force compensation strategies invite the perception of lengthy price
negotiations, intense manipulation of the sales environment, and unachievable
performance expectations. Thus,
P2: The misalignment of the goals of the pricing and sales force compensation
strategies increases the salesperson’s perception of effort needed to be successful.
Perceived Risk
Uncertainty and subsequent resulting risk is present in the sales environment
because of the unpredictable changes in customer needs and competitor strategies
(Bergen, Dutta, & Walker, 1992). An organization also introduces conflict into the sales

53
environment by altering policies and activities in response to multiple market changes.
The salesperson uses past experiences and knowledge of the environment to assess the
risks of being successful and adapts his or her behaviors to reduce that risk. Sales
manager EJM4 reiterates,
Salespeople will always take the path of least resistance in order to make
a sale. They may make more money if they sell at a higher price and put in
more effort, however they would rather make the sale than chance not
making the sale.
In highly complicated or involved selling situations the salesperson will work first
to mitigate his or her risk regardless of the optimality for the company. A salesperson’s
perceived risk involves achieving sales goals and consequent compensation awards. In
accord with previous research in this area, this dissertation assumes that the organization
is risk neutral and the sales force is risk averse (Basu, Lal, Srinivasan & Staelin, 1985).
Elements of the sales force control system are intended to address the behaviors of a risk-
averse sales force (Anderson et al., 1987; Basu et al., 1985; Lal & Staelin, 1986). The
organization assumes the risk when the sales force compensation is salary-based
(Anderson et al., 1987). A salaried contract releases the salesperson from compensation
penalties should the salesperson’s behaviors fail to yield the desired sales results. Other
ways the organization can mitigate sales force perceptions of risk through elements of the
control system include: 1) engaged-monitoring by sales management, and 2) the inclusion
of the salesperson when establishing sales strategy evaluative standards (Anderson et al.,
1987). When a salesperson is clear about the sales goals and methods of evaluation, the
salesperson will perceive less uncertainty and therefore less risk (Bergen, Dutta &
Walker Jr, 1992).

54
Role conflict occurs when the salesperson is required to meet multiple
incongruent demands (Churchill et al., 1976; Tyagi, 1982; Walker et al., 1977). When the
goals of the pricing and sales force compensation strategies are misaligned the
salesperson perceives role conflict and therefore risk. When product pricing goals are
not matched with the goals of the salesperson’s compensation package, mixed signals are
sent to the salesperson. The salesperson may be motivated by the compensation package,
yet a pricing strategy aimed at goals incongruent to the compensation goals increases the
uncertainty and risk that the salesperson will be successful in both achieving his or her
objectives as well as the firm’s objectives. Thus,
P3: The misalignment of the goals of the pricing and sales force compensation
strategies increases the salesperson’s perceived risk.
Costs to Monitor Sales Force Outcomes
Anderson et al. (1987) define a control system as: “an organization’s set of
procedures for monitoring, directing, evaluating, and compensating its employees” (p.
76). The organization benefits from reducing monitoring costs as a form of process
improvement, which in turn increases manager efficiency and effectiveness. The sales
force control mechanism, of which sales force compensation is a part, is the most
comprehensive part related to the costs of a firms’ product or service. Sales force
compensation plans that are salary-based require more levels of sales management to
monitor and assess behavior (John & Weitz, 1989). Companies can invest in the high
costs to monitor sales force efforts or develop a compensation program based on
performance (Basu, et al., 1985).

55
Multiple goals and differing strategies dilute the monitoring efforts of the sales
manager. The effect of diluted sales manager effort is an increasingly inefficient and
costly sales mechanism. Sales force control systems do not accommodate performance
monitoring on goals external to the sales department. While pricing and other marketing
strategies rely on the execution of the sales force, they require additional monitoring and
direction from the marketing manager (Malshe et al., 2009). When pricing and sales force
compensation strategies are aligned toward congruent goals, marketing and sales
manager resources required to monitor and guide the efforts and behaviors of the sales
force are streamlined and more efficient. Misaligned goals increase monitoring
redundancies and promote contradictory standards for evaluation of sales force
performance. Hence,
P4: The misalignment of the goals of the pricing and sales force compensation
strategies increases the cost of monitoring sales force outcomes.
Organizational Resources
Scarcity of organizational resources is a fact of life for businesses. To achieve
high levels of performance, organizational resources such as budgets, time, energy,
information, and personnel must not be wasted. Past literature considers the importance
of committing both tangible and intangible resources to ensure successful strategy
implementation (Menon, et al., 1999; Siguaw, Brown & Widing, 1994). The failure to
support these strategies and to work with full efficiencies leads to discord in the
interactions between the sales force and the firm, resulting in constraints to sales or
worse, an inability to do business with the customer.

56
Efficient development of pricing strategies involves incorporating information
from other functional areas such as costs from production, capacity and carrying costs
from inventory management, lead times, minimum order quantities, and costs of raw
material or components from procurement, and profit margin guidelines from accounting.
The creation, implementation, and maintenance of a pricing strategy depends on a high
level of information exchange between marketing and sales (Rouziès, et al., 2005). The
challenge of information exchange between the marketing and sales interface is
confounded as a result of the orientation differences of their respective areas (Cespedes et
al., 1996; Homburg et al., 2007). The diversity of the product orientation for marketing
and customer orientation for sales is most apparent when the pricing and sales force
compensation strategies are not aligned toward the same goal. Over time, the above
referenced situation and the causes of firm failure will likely be misattributed to
obscurely related events such as poor sales forecasting, customer account selection, or
ineffective target marketing. The effects of inefficiencies such as divergent orientations
are multiplied when the pricing and sales force compensation strategies are not aligned
toward congruent goals.
Top management must be supportive in providing resources needed to maintain
inventory levels, breadth of product lines, efficient processes, and sufficient budgets to
facilitate the strategies. Firm commitment to pay the sales force commission or
increasing sales force expenses to ensure the success of a pricing strategy is another
example of the availability of organizational resources. When the pricing and sales force
compensation strategies are not aligned to achieve the same goals the firm can experience
an inefficient use of tangible and intangible resources. Therefore,
57
P5: The misalignment of the goals of the pricing and sales force compensation
strategies results in the inefficient use of organizational resources.
Communication
The efficiencies created by aligned strategies include deliberate and focused sales
force effort and efficient use of organizational resources such as management evaluation
time, and internal and external communication resources. The marketing-sales interface
literature suggests that frequent, formal and informal, bi-directional communication will
improve the integration of the two functional areas but may not improve the performance
of the business unit or the firm (Kahn et al., 1997; Rouziès et al., 2005; Ruekert et al.,
1987). Over-communicating can render both groups paralyzed with indecision and
increase redundancies in the communication process (Fisher et al., 1997; Maltz & Kohli,
1996; Rouziès et al., 2005).
Effective communication across the marketing-sales interface must be
bidirectional, of high quality, and must contribute to the purpose and goals whereby both
areas benefit. The goal of the sales force compensation strategy should be considered the
primary indicator of sales force activities. From an understanding of the sales force goal
comes the possibility for open communication and collaboration between marketing and
sales on the development of new marketing strategies. Research by Le Meunier-FitzHugh
and Piercy (2009) demonstrates that effective communication is an important component
of the collaborative effort. Bidirectional communication helps create an understanding of
the goals of each of the areas and a broader understanding of the marketing environment
(Malshe et al., 2009). A high level of quality communication is void of resource
consuming redundancies and coerciveness (Fisher et al., 1997). Quality communication

58
between the functional areas promotes a unity of efforts that can enhance the creation of
aligned, effective, and high quality strategies (Homburg et al., 2008; Malshe et al., 2009).
Quality communication to the external market is imperative to the reputation and
perception of the organization. As mentioned previously, internal inefficiencies and
conflicting goals can manifest outward to the market affecting the customer and
competitor perception of the inefficient organization.
Communication between the marketing and sales areas is challenging as a result
of their differing temporal based (i.e., marketing is long term and sales is short term) and
focus based (marketing is product focused and sales is customer focused) orientations
(Homburg et al., 2007). Inefficient communication within the organization can transcend
organizational boundaries and produce confusing and arbitrary communications to
customers and competitors. Pricing and sales force strategies that are not aligned toward
congruent goals suggest that the organization has difficulty integrating signals received
externally from the market with the information internally communicated by the sales
force and sales management. Therefore,
P6: The misalignment of the goals of the pricing and sales force compensation
strategies reduces the quality of organizational communication.
Intra-functional Relationships Between Marketing and Sales
The domain of the marketing-sales interface is rich in research that establishes
antecedents of integration, optimal levels of integration, and the benefits of integration.
This domain of literature has found that through a harmonious collaboration of ideas and
resources the marketing and sales areas will become better integrated (Kahn et al., 1997;
Rouziès et al., 2005). The process of aligning the activities and tactics associated with

59
the pricing and sales force compensation strategies involves an allocation of meeting time
to facilitate bidirectional sharing of information and the coordinated use of resources
throughout the implementation and maintenance stages of the strategies.
Marketing-sales interface research has varied views on what constitutes activity
alignment. For example, research by Cross et al. (2001), Strahle et al. (1996), and Strahle
and Spiro (1986) suggests that the activities and tactics of the sales force are to be aligned
with the established marketing strategies. These works support the popular premise that
marketing creates the strategies and the sales force implements the strategies. The
disadvantage of this scenario is that strategy creators are not in control of the
implementation. The research that supports collaboration between the marketing-sales
interface suggests that the goals of the functional areas be aligned (Le Meunier-FitzHugh
et al., 2011). Aligned or congruent goals provide a focal point to which all efforts can be
unified.
Research that promotes a collaborative effort throughout the strategy creation,
implementation, and evaluative stages has found an increase in successful outcomes
(Malshe et al., 2009; Rouziès et al., 2005). Successful outcomes involving the joint-
planning process include higher quality strategies, increased value to the organization,
and a more complete integration of the marketing-sales interface (Homburg et al., 2008;
Menon et al., 1996; Rouziès et al., 2005). Involving the sales force in the marketing
strategy creation stage can help to determine potential customer issues and ensures buy-in
of the sales force at strategy inception (Piercy, 2006).
In practice and in extant literature, the likelihood of achieving long-term market
share and profitability through a pricing strategy seems elusive (Feldman, 2005; Uslay,

60
Altinig, & Winsor, 2010). Marketers struggle to seek balance between pricing their
products and services competitively yet pricing to what the market will bear, all while
focusing on their product goal objectives. Marketing managers have admitted to
purposely misdirecting the sales force and sales management towards inflated sales
volume goals to ensure sales volume objectives (Strahle, Spiro, & Acito, 1996). As long
as the goals of the pricing and sales force compensation strategies are misaligned, the
relationship between these two functional areas will continue to degrade.
Dewsnap and Jobber (2002) report that goal conflict and in-group identity
negatively impact the relationship between marketing and sales. Generating revenue is
the functional goal of the marketing and sales areas, and specifically the objective of the
firm’s pricing strategy. The misalignment of the pricing and sales force compensation
strategies limits the ability of the functional areas to optimize revenue generation.
Research by (Hughes, LeBon, & Malshe, 2012) suggests that a dysfunctional marketing
sales interface may delay the “development of market based capabilities and subsequent
competitive advantage” (p. 69). Hence,
P7: Misalignment of the goals of the pricing and sales force compensation
strategies reduces the quality of the intra-functional relationship between
marketing and sales.
DISCUSSION
This research suggests that there are hazards of misalignment that affect the sales
force and the organization. Ultimately, the danger of misaligned goals is the erosion of
firm performance. Similarly, Rouziès et al. 2005 asserts that organization performance is
reliant upon marketing and sales, “coordinating and supporting each other’s activities”

61
through new product launches (p. 121). Strategies that are aligned coordinate the
activities and efforts of the marketing and sales departments facilitating goal achievement
and benefiting firm performance.
As an extension of the marketing sales interface literature, this study suggests that
a higher level of marketing sales integration will result from the process of creating goal
focused, aligned pricing and sales force compensation strategies. Conversely, Menon, et
al. (1999), suggests that a high level of integration must exist, through formalization of
processes and determination of roles, before effective, quality strategies can be created
(Menon, et al., 1991). Findings by Malshe and Sohi (2009) indicate that the creation of
effective, quality strategies “across the marketing sales interface” is the result of a three
step process that includes the creation, implementation, and evaluation (p. 415).
As mentioned previously, pricing literature has been intent on investigating the
effects of a firm’s pricing strategy on the customer and the competitor (Smith & Nagle,
1995; Dolan, 1987, Cressman & Nagle, 2002). The most important contribution this
research makes is identifying the effects of the firm’s pricing strategy on the sales force;
specifically, unfavorable behaviors as a result of misaligned strategies. Some examples
of unfavorable behaviors include the salesperson spending 30% to 50% of their time on
price negotiations or refusing to sell an item because the low margin of the price did not
meet the minimum margin threshold of the compensation program. Examples of
salespeople giving away company profits include offering a customer free freight for the
transportation of the goods or changing the customer’s price level to a lower,
unsubstantiated level (outside of the organization’s parameter). Some manager’s may

62
perceive the “giving away of company profits” as stealing from stakeholders. However
the salespeople view their actions as off-setting the risk of being unsuccessful.
The phenomenon of misalignment of goals emerged from the qualitative
interviews. When questioned about the current sales objective, the sales professional was
quick to respond it was either profit maximization or market share. The response was
just as forthcoming when asked about the pricing goal. The result of the separate goal
inquiries confirmed nine out of fifteen (60%) of the interviewees worked in environments
in which misaligned pricing and sales force compensation goals were actively in effect.
Only 47% of the interviewees acknowledged being in a situation where the way a
company priced and promoted its products interfered with the sales compensation
structure. Yet, nearly all of the sales professionals acknowledged and discussed
mitigating the possibility of lost sales and/or compensation as a result of a pricing
strategy. The participants of this research clearly articulated the repercussions of
misalignment however could not identify the cause, which reinforces one of the original
premises that often managers misattribute the effects of goal misalignment.
The two key concepts of perceived effort to be successful and the perceived risk
of being unsuccessful emerged when some respondents communicated a sense of
hopelessness when faced with the condition of misaligned goals. The salesperson
perceived a greater amount of effort required to be successful under conditions of
misalignment than when goals were aligned. The perceived risk of being unsuccessful
emerged from the salesperson’s fears that the pricing would not allow them to compete
and therefore fail to meet the expectations of both the selling firm and the customer. The
sales force management literature confirms transferring risk from the firm to the sales

63
force via outcome based compensation methods as an inducement or motivator
(Eisenhardt, 1989; Cravens et al., 1993). Different from the motivating element of an
outcome based compensation method and strategy, the misaligned pricing strategy
produced the perceived risk of being unsuccessful which was considered, by the
salesperson, to be a de-motivating factor.
Using the sample of this study as being representative of B2B markets,
misalignment is prevalent in at least half of the B2B organizations. For change to occur,
managers must diligently look for the indicators of misalignment. One key indicator of
misaligned goals is a failed pricing strategy and/or an increase in unplanned price
negotiation on behalf of the sales force. Management must evaluate the goals for each
product line and be cognizant that the amount of motivation and effort with which the
sales force will engage in goal achievement are dependent on the goals of both the
pricing and the sales force compensation strategies.
FUTURE RESEARCH
The propositional inventory provided in this paper serves as a launch pad for
more research on the effects of marketing strategies upon the internal sales force.
Empirical testing of the propositions will further theory development in the area of
pricing and sales force behavior. The functional area of pricing has greatly expanded in
the past ten years. Today, many companies employ pricing analysts, strategic pricing
managers, and/or directors of pricing analytics. Research on the relationship between the
pricing professional and the sales professional would provide more depth to this research
stream.
64
CONCLUSION
This qualitative research provides a new direction for researchers to examine the
firm’s pricing strategy as a motivational influencer on the sales force. Findings that
emerged from this study indicate, as proposed, that conditions of a firm’s pricing strategy
have resulted in adverse behaviors by the sales force. When the goals of the pricing and
sales force compensation strategies were conflicted the salespeople conveyed perceptions
of more required effort to be successful. In particular conditions the salesperson
perceived the risk of being unsuccessful so high that they abstained from selling.
Managing the sales force with misaligned goals gives cause to create new reports,
extensions on evaluations, and more frequent less favorable performance evaluations.
The sales professionals interviewed for this research want to do a good job. When the
salesperson spoke about adding more value for the customer in an effort to salvage the
sale, they were trying to please the customer and themselves. More importantly, the
salesperson seemed to have the belief that obtaining the sale, regardless of the cost, was
better than losing the sale to a competitor.
Aligning pricing and sales force compensation strategies toward a congruent goal
would require joint planning between the marketing and sales functions, effective
communication (internal to the firm and external to the market), sharing of organizational
resources, and establishing expectations of outcomes and roles. The anticipated
outcomes of aligning the pricing and sales force compensation strategies include an
increase in customer satisfaction, reduced costs, and increased sales.

65
References
Anderson, E. & Oliver, R. L. (1987). Perspectives on Behavior-Based Versus Outcome
Based Salesforce Control Systems. Journal of Marketing, 51(4), 76-88.
Anderson, J., Wouters, M. & van Rossum, W. (2010). Why the Highest Price Isn’t the
Best Price. MIT Sloan Management Review, 51(2), 69-76.
Bartholomew, M. (2000). Foundation for Nonlinear Models with Thresholds for
Longitudinal Data. Journal of Biopharmaceutical Statistics, 10(4), 469-481.
Basu, A. K., Lal, R., Srinivasan, V., & Staelin, R. (1985). Salesforce Compensation
Plans: An Agency Theoretic Perspective. Marketing Science, 4(4), 267-291.
Bergen, M., Dutta, S., & Walker Jr, O. C. (1992). Agency Relationships in Marketing: A
Review of the Implications and Applications of Agency and Related Theories.
Journal of Marketing, 56(3), 1-24.
Bourgeois III, L. J., Eisenhardt, K. M. (1988). Strategic Decision Process in High
Velocity Environments: Four Cases in the Microcomputer Industry.
Management Science, 34(7), 816-835.
Bradford, K., Brown, S., Ganesan, S., Hunter, G., Onyemah, V., Palmatier, R., …Weitz,
B. (2010). The Embedded Sales Force: Connecting Buying and Selling
Organizations. Marketing Letters, 21(3), 239-253.
Cespedes, F. V., & Piercy, N. F. (1996). Implementing Marketing Strategy. Journal of
Marketing Management, 12(1-3), 135-160.
Churchill Jr, G. A. J., Ford, N. M., Hartley, S., W., & Walker Jr, O. C. (1985). The
Determinants of Salesperson Performance: A Meta-Analysis. Journal of
Marketing Research, 22(2), 103-118.
Churchill Jr, G. A., Ford, N. M., Walker Jr, O. C. (1976). Organizational Climate and
Job Satisfaction in the Sales Force. Journal of Marketing Research, 13(4), 323-
332.
Corbin, J. & Strauss, A. (1990). Grounded Theory Research: Procedures, Canons, and
Evaluative Criteria. Qualitative Sociology, 13(1), 3-21.
Corbin, J., & Strauss, A. (2008). Basics of Qualitative Research: Techniques and
Procedures for Developing Grounded Theory. Los Angles, CA. Sage
Publications.

66
Cross, J., Hartley, S., Rudelius, W., & Vassey, M. (2001). Sales Force Activities and
Marketing Strategies in Industrial Firms: Relationships and Implications. Journal
of Personal Selling & Sales Management, 21(3), 199-206.
Coughlan, A. T., & Sen, S. K. (1989). Salesforce Compensation: Theory and Managerial
Implications. Marketing Science, 8(4), 324-342.
DeCarlo, T.E., Teas, K.R., & McElroy, J.C. (1997). Attribution Processes and Salesforce
Expectancy Perceptions. Journal of Marketing Management, 7(1), 14-33.
Dewsnap, B., & Jobber, D. (2000). The Sales-Marketing Interface in Consumer
Packaged-Goods Companies: A Conceptual Framework. Journal of Personal
Selling & Sales Management, 20(2), 109-119.
Dewsnap, B., & Jobber, D. (2002). A Social Psychological Model of Relations Between
Marketing and Sales. European Journal of Marketing, 36(7), 874-894.
Dolan, R. J. (1987). Quantity Discounts: Managerial Issues and Research Opportunities.
Marketing Science, 6(1), 1-22.
Draganska, M., Kapper, D., & Villas-Boas, S. B. (2010). A Larger Slice or a Larger Pie?
An Empirical Investigation of Bargaining Power in the Distribution Channel.
Marketing Science, 29(1), 57-74.
Eisenhardt, K. M. (1988). Agency- and Institutional-Theory Explanations: The Case of
Retail Sales Compensation. Academy of Management Journal, 31(3), 488-544.
Eisenhardt, K. M. (1989). Agency Theory: An Assessment and Review. Academy of
Management Review, 14(1), 57-74.
Evans, K. R., Margheim, L., & Schlacter, J. L. (1982). A Review of Expectancy Theory
Research in Selling. Journal of Personal Selling & Sales Management, 2(2), 33-
40.
Feldman, D., M. (2005). Making Cents of Pricing. Marketing Management, 14(3), 20-25.
Fisher, R. J., & Maltz, E. (1997). Enhancing Communication Between Marketing and
Engineering: The Moderating Role of Relative Functional Identification. Journal
of Marketing, 61(3), 54-70.
Flint, D. J., Woodruff, R. B., & Gardial, S. F. (2002). Exploring the Phenomenon of
Customer’s Desired Value Change in a Business-to-Business Context. Journal of
Marketing, 66(4), 102-117.

67
Gu, F. F., Kim, N., Tse, D. K., & Wang, D. T. (2010). Managing Distributors’ Changing
Motivations Over the Course of a Joint Sales Program. Journal of Marketing,
74(5), 32-47.
Guest, G., Bunce, A., & Johnson, L. (2006). How Many Interviews Are Enough? An
Experiment with Data Saturation and Variability. Field Methods, 18, 59-82.
Hair Jr, J. F., Celsi, M. W., Money, A. H., Phillip, S., & Page, M. J. (2011). Essentials of
Business Research Methods, Second Edition, Armonk, New York. M.E. Sharpe.
Hansen, A., Joseph, K., & Krafft, M. (2008). Price Delegation in Sales Organizations: An
Empirical Investigation. Business Research, 1(1), 94-104.
Holden, R. K., & Nagle, T. T. (1998). Kamikaze Pricing. Marketing Management, 7(2),
30-39.
Homburg, C., & Jensen, O. (2007). The Thought Worlds of Marketing and Sales: Which
Differences Make a Difference? Journal of Marketing, 71(3), 124-142.
Homburg, C., Jensen, O., & Krohmer, H. (2008). Configurations of Marketing and Sales:
A Taxonomy. Journal of Marketing, 72(2), 133-154.
Homburg, C., Jensen, O., & Hahn, A. (2012). How to Organize Pricing? Vertical
Delegation and Horizontal Dispersion of Pricing Authority. Journal of Marketing,
76(5), 49-69.
Hoskisson, R.E., Castleton, M. W., & Withers, M. C. (2009). Complementarity in
Monitoring and Bonding: More Intense Monitoring Leads to Higher Executive
Compensation. Academy of Management Perspectives, 23(2), 57-74.
Hughes, D. E., LeBon, J., & Malshe, A. (2012). The Marketing-Sales Interface at the
Interface: Creating Market-Based Capabilities through Organizational Synergy.
Journal of Personal Selling & Sales Management, 32(1), 57-72.
Hult, T. G. (2011). Toward a Theory of the Boundary-Spanning Marketing Organization
and Insights from 31 Organization Theories. Journal of the Academy of Marketing
Science, 39(4), 509-536.
Hutt, M. (1995). Cross-Functional Working Relationships in Marketing. Journal of the
Academy of Marketing Science, 23(4), 351-357.
Jaramillo, F., & Mulki, J. M. (2008). Sales Effort: The Intertwined Roles of the Leader,
Customers, and the Salesperson. Journal of Personal Selling & Sales
Management, 28(1), 37-51.
68
Jaworski, B. J., & Kohl, A. K. (1991). Supervisory Feedback: Alternative Types and
Their Impact on Salespeople's Performance and Satisfaction. Journal of
Marketing Research, 28(2), 190-201.
John, G., & Weitz, B. (1989). Salesforce Compensation: An Empirical Investigation of
Factors Related to Use of Salary Versus Incentive Compensation. Journal of
Marketing Research, 26, 1-14.
Joseph, K. (2001). On the Optimality of Delegating Pricing Authority to the Sales Force.
Journal of Marketing, 65(1), 62-70.
Kahn, K. B., & McDonough, E. F. (1997). Marketing's Integration with R&D and
Manufacturing: A Cross-Regional Analysis. Journal of International Marketing,
5(1), 51-76.
Kopalle, P., Biswas, D., Chintagunta, P., Fan, J., Pauwels, K., Ratchford, B., & Sills, J.
(2009). Retailer Pricing and Competitive Effects. Journal of Retailing, 85(1), 56-
70.
Küster, I., & Canales, P. (2011). Compensation and Control Sales Policies, and Sales
Performance: the Field Sales Manager’s Points of View. Journal of Business &
Industrial Marketing, 26(4), 273-285.
Lal, R. (1986). Delegating Pricing Responsibility to the Sales Force. Marketing Science,
5(2), 159-168.
Lancioni, R., & Gattorna, J. (1993). Pricing for profit. Management Research News,
16(7), 1-4.
Lawrence, P. R., & Lorsch, J. W. (1986). Organization and Environment: Managing
Differentiation and Integration. Boston: Harvard Business School Press.
Le Meunier-FitzHugh, K., & Piercy, N.F. (2011). Exploring the Relationship Between
Market Orientation and Sales and Marketing Collaboration. Journal of Personal
Selling & Sales Management, 31(3), 287-296.
Lo, D. H., Ghosh, M., & LaFontaine, F. (2011). The Incentive and Selection Roles of
Sales Force Compensation Contracts. Journal of Marketing Research,
48(August), 781-798.
Madhavan, R., & Grover, R. (1998). From Embedded Knowledge to Embodied
Knowledge: New Product Development as Knowledge Management. Journal of
Marketing, 62(4), 1-12.

69
Malshe, A., & Sohi, R. S. (2009). What Makes Strategy Making Across the Sales-
Marketing Interface More Successful? Journal of the Academy of Marketing
Science, 37(4), 400-421.
Maltz, E., & Kohli, A. K. (1996). Market Intelligence Dissemination Across Functional
Boundaries. Journal of Marketing Research, 33(1), 47-61.
Maltz, E., & Kohli, A. K. (2000). Reducing Marketing's Conflict with Other Functions:
The Differential Effects of Integrating Mechanisms. Journal of the Academy of
Marketing Science, 28(4), 479-492.
Menon, A., Bhardwaj, S., Adidam, P. T., & Edison, S. (1991). Antecedents and
Consequences of Marketing Strategy Making: A Model and a Test. Journal of
Marketing, 63(2), 18-40.
Menon, A., Bharadwaj, S., & Howell, R. (1996). The Quality and Effectiveness of
Marketing Strategy: Effects of Functional and Dysfunctional Conflict in
Intraorganizational Relationships. Journal of the Academy of Marketing Science,
25(4), 299-313.
Menon, A., Bharadwaj, S., Adidam, P. T., & Edison, S. (1999). Antecedents and
Consequences of Marketing Strategy Making: A Model and a Test. Journal of
Marketing, 63(2), 18-40.
Miles, R. H., & Perreault Jr, W. D. (1976). Organizational Role Conflict: Its Antecedents
and Consequences. Organizational Behavior & Human Performance, 17(1), 19-
44.
Miao, F. C., & Evans, K. R. (2007). The Impact of Salesperson Motivation on Role
Perceptions and Job Performance—A Cognitive and Affective Perspective.
Journal of Personal Selling & Sales Management, 27(1), 89-101.
Mishra, B. K., & Prasad, A. (2004). Centralized Pricing Versus Delegating Pricing to the
Salesforce Under Information Asymmetry. Marketing Science, 23(1), 21-27.
Misra, S., Coughlan, A., & Narasimhan, C. (2005). Salesforce Compensation: An
Analytical and Empirical Examination of the Agency Theoretic Approach.
Quantitative Marketing & Economics, 3(1), 5-39.
Montgomery, B. M. (1981). The Form and Function of Quality Communication in
Marriage. Family Relations, 30(1), 21-30.
Munnukka, J. (2006). Pricing Method as a Tool for Improved Price Perception. Journal
of Revenue & Pricing Management, 5(3), 207-220.
Nagle, T. (1983). Pricing As Creative Marketing. Business Horizons, 26(4), 14-19.

70
Nagle, T. & Cressman Jr, G. E. (2002). Don’t Just Set Prices, Manage Them. Marketing
Management, 11(6), 29-33.
Nagle, T. & Hogan, J. (2007). Is Your Sales Force a Barrier to More Profitable Pricing…
Or Is It You? Business Strategy Series, 8(5), 365-368.
Oliver, R. L. (1974). Expectancy Theory Predictions of Salesmen's Performance. Journal
of Marketing Research, 11(3), 243-253.
Palazon, M., & Delgado-Ballester, E. (2009). Effectiveness of Price Discounts and
Premium Promotions. Psychology & Marketing, 26(12), 1108-1129.
Piercy, N. F., Cravens, D. W., & Lane, N. (2012). Sales Manager Behavior-Based
Control and Salesperson Performance: The Effects of Manager Control
Competencies and Organizational Citizenship Behavior. Journal of Marketing
Theory & Practice, 20(1), 7-22.
Piercy, N. F. (2006). The Strategic Sales Organization. Marketing Review, 6(1), 3-28.
Pritchard, R. D., & Sanders, M. S. (1973). The Influence of Valence, Instrumentality, and
Expectancy on Effort and Performance. Journal of Applied Psychology, 57(1), 55-
60.
Ramaswamy, V., Gatignon, H., & Reibstein, D. (1994). Competitive Marketing Behavior
in Industrial Markets. Journal of Marketing, 58(2), 45-55.
Rangarajan, D., Jones, E., & Chin, W. (2005). Impact of Sales Force Automation on
Technology-Related Stress, Effort and Technology Usage Among Salespeople.
Industrial Marketing Management, 34(4), 345-354.
Rao, V. R. (1984). Pricing Research in Marketing: The State of the Art. Journal of
Business, 57(1), 39-60.
Rouziès, D., Anderson, E., Kohli, A. K., Michaels, R.E., Weitz, B.A., & Zoltners, A.A.
(2005). Sales and Marketing Integration: A Proposed Framework. Journal of
Personal Selling & Sales Management, 25(2), 113-122.
Ruekert, R. W., & Walker, Jr., O. C. (1987). Marketing’s Interaction with Other
Functional Units: A Conceptual Framework and Empirical Evidence. Journal of
Marketing, 51(1), 1-19.
Rust, R. T., Cooil, B. (1994). Reliability Measures for Qualitative Data: Theory and
Implications. Journal of Marketing Research, 31(1), 1-14.
71
Sharma, A. & Iyer, G. R. (2011). Are Pricing Policies an Impediment to the Success of
Customer Solutions? Industrial Marketing Management, 40(5), 723-729.
Shipley, D., & Jobber, D. (1991). Salesforce Motivation, Compensation and Evaluation
by Industrial Distributors. Service Industries Journal, 11(2), 154-170.
Siguaw, J. A., Brown, G., & Widing II, R. E. (1994). The Influence of the Market
Orientation of the Firm on Sales Force Behavior and Attitudes. Journal of
Marketing, 31(1), 106-116.
Singh, J. (1998). Striking a Balance in Boundary-Spanning Positions: An Investigation of
Some Unconventional Influences of Role Stressors and Job Characteristics on Job
Outcomes of Salespeople. Journal of Marketing, 62(3), 69-86.
Smith, T. M., Gopalakrishna, S., & Chatterjee, R. (2006). A Three-Stage Model of
Integrated Marketing Communications at the Marketing-Sales Interface. Journal
of Marketing, 43(4), 534-579.
Stephenson, P. R., Cron, W. L., & Frazier, G. L. (1979). Delegating Pricing Authority to
the Sales Force: The Effects on Sales and Profit Performance. Journal of
Marketing, 43(2), 21-28.
Strahle, W., Spiro, R., & Acito, F. (1996). Marketing and Sales: Strategic Alignment and
Functional Implementation. The Journal of Personal Selling & Sales
Management, 16(1), 1-20.
Strauss, A., & Corbin, J. (1990). Basics of Qualitative Research. Newbury Park, CA.
Sage Publications.
Teas, R. K. (1981). An Empirical Test of Models of Salespersons' Job Expectancy and
Instrumentality Perceptions. Journal of Marketing Research, 18(2), 209-226
Tellis, G. J. (1986). Beyond the Many Faces of Price: An Integration of Pricing
Strategies. Journal of Marketing, 50(4), 146-160.
Tellis, G. J., & Gaeth, G. J. (1990). Best Value, Price-Seeking, and Price Aversion: The
Impact O. Journal of Marketing, 54(2), 34.
Troilo, G., De Luca, L. M., & Guenzi, P. (2009). Dispersion of Influence Between
Marketing and Sales; Its Effects on Superior Customer Value and Market
Performance. Industrial Marketing Management, 38(8), 872-882.
Tuli, K.R., Kohli, A. K., & Bharadwaj, S. G. (2007). Rethinking Customer Solutions:
From Product Bundles to Relational Processes. Journal of Marketing, 71(July),
1-17.

72
Tyagi, P. K. (1982). Perceived Organizational Climate and the Process of Salesperson
Motivation. Journal of Marketing Research, 19(2), 240-254.
Ulaga, W., & Eggert, A. (2006). Relationship Value and Relationship Quality. European
Journal of Marketing, 40(3), 311-327.
Uslay, C., Altinig, Z. A., & Winsor, R. D. (2010). An Empirical Examination of the
“Rule of Three”: Strategy Implications for Top Management, Marketers, and
Investors. Journal of Marketing, 74(2), 20-39.
Varadarajan, R. (2010). Strategic Marketing and Marketing Strategy: Domain, Definition,
Fundamental Issues and Foundational Premises. Journal of the Academy of
Marketing Science, 38(2), 119-140.
Voss, G. B., Parasuraman, A., & Grewel, D. (1998). The Roles of Price, Performance,
and Expectations in Determining Satisfaction in Service Exchanges. Journal of
Marketing, 62(4), 46-61.
Walker Jr, O. C., Churchill Jr, G.A., & Ford, N. M. (1977). Motivation and Performance
in Industrial Selling - Present Knowledge and Needed Research. Journal of
Marketing Research, 14(2), 156-168.
Weinberg, C. B. (1975). An Optimal Commission Plan for Salesmen's Control Over
Price. Management Science, 21(8), 937-943.
Weitz, B.A. (1978). Relationship Between Salesperson Performance and Understanding
of Customer Decision Making. Journal of Marketing Research, 15(4), 501-516.
Weitz, B.A. (1981). Effectiveness in Sales Interactions: A Contingency Framework.
Journal of Marketing, 45(1), 85-103.
Weitz, B. A., Sujan, H., & Sujan, M. (1986). Knowledge, Motivation, and Adaptive
Behavior: A Framework for Improving Selling Effectiveness. Journal of
Marketing, 50(Oct), 174-191.

73
CHAPTER 3 (ESSAY 2)
THE EFFECTS OF (MIS)ALIGNED PRICING AND SALES FORCE
COMPENSATION STRATEGIES ON THE SALESPERSON
In this essay, the focus shifts from an understanding of the relevant relationships
between goal misalignment, the sales force, and the organization (Essay 1) to the effects
that this misalignment has on the individual salesperson (Essay 2). The purpose of Essay
2 is to use expectancy theory to examine the impact that aligned versus misaligned goals
of the pricing and sales force compensation strategies have upon the B2B salesperson’s
motivation and behavior.
The first theoretical contribution of this research is to define the nature of
alignment of differing goals for the pricing and sales force compensation strategies.
Second, this research is designed to empirically determine how a firm’s pricing strategy
influences salesperson motivation and behavior. Specifically, the lens of expectancy
theory is used to understand the salesperson’s beliefs that he/she can actually be
successful given a situation and how the achievement of his/her goals may influence how
he/she is perceived internally by management and externally by customers. Additionally,
the effects of these perceptions on motivation were examined. Finally, the impact on the

74
salesperson’s behavioral intentions, given conditions of alignment or misalignment of the
pricing and compensation goals, was explored.
INTRODUCTION
Expectancy Theory
Expectancy theory prescribes that a salesperson’s actions are intentional and
focused based on what the salesperson believes or anticipates will occur. Accordingly,
the salesperson’s motivation to act in a certain way is a product of the beliefs that a
salesperson has that a certain level of effort will create the necessary results and achieve
certain rewards the salesperson values (Vroom, 1964). Historically, expectancy theory
has been effective in determining sales force motivation (Oliver, 1974; Peters, 1977;
Walker, Churchill, & Ford, 1977). The more recent expectancy theory-based research
has concentrated on supportive leadership (Jaramillo & Mulki, 2008), incentive plans
(Liccione, 2007), and strategy implementation (Smith, 2009). Each of these areas offers
foundation for this research.
Vroom’s (1964) expectancy theory has been expounded upon and applied to
salesperson performance (Oliver, 1974). The core constructs of expectancy theory
include: 1) expectancy (the belief that one’s efforts will achieve the goal); 2)
instrumentality (the belief that if one achieves the goal, certain rewards will be gained);
and 3) valence (the value that one has for the earned rewards). These three constructs
(expectancy, instrumentality, and valence) determine the salesperson’s motivation and
subsequent behavior (Chiang, Jang, Canter, & Prince, 2008). “Expectancy theory is
characterized by the view that behavior is purposeful, based on conscious intention, and
goal-directed,” (Evans, Margheim & Schlacter, 1982 p. 34).

75
The concepts of effort and expectancy seem similar, however are contrary with
regard to goals. When goal levels are high, salespeople perceive high effort. At the same
time, however, lower expectancies are associated with high goal levels (Locke,
Motowidlo, & Bobko, 1986). This research adopts the definition of expectancy
referenced by Miao, Lund and Evans (2009): “Expectancy is a salesperson’s estimate of
the probability that expending a given amount of effort on a task will lead to an improved
level of performance” (p. 245). Expectancy has been referenced in literature as a
probability estimate (Pritchard & Sanders, 1973) and as a higher or lower strength
(Tyagi, 1982). In this research, the evaluation of expectancy is categorized as higher or
lower, which indicates the salesperson’s estimate of the chance or probability that his/her
performance will achieve the assigned sales goal.
Instrumentality is the salespersons’ perception of the link between a specific type
or level of performance leading to a specific type or level of reward (Walker, et al.,
1977). Instrumentality has been referenced in several different ways, such as positive,
negative, or zero (Oliver, 1974), as high probability or low probability (Teas, 1981;
Walker, et al., 1977), and as high level and low level (Hirschfeld, Schmitt & Bedeian,
2002). In this research, the evaluation of instrumentality is categorized as a strong link or
a weak link, indicating the degree to which the salesperson believes a given level of
performance will result in a given reward. Further, in this research both internal and
external rewards are examined.
Valence is the salesperson’s perception of the value or importance of obtaining a
specific reward (Pritchard et. al., 1973; Smith, 2009; Vroom, 1964). Oliver (1974), states
that a salesperson could be indifferent toward a reward whereby valence would be

76
nonexistent. Past research has indicated that valence and instrumentality are highly
correlated, and that the latter is a better predictor of performance than valence (Oliver,
1974; Pritchard & De Leo, 1973). Thus, this essay focuses exclusively on the impact of
goal alignment and misalignment on expectancy and instrumentality.
Pricing and Sales Force Compensation Goals
This essay considers two main, but different, goals of an organization’s strategies:
market share growth and profit maximization. Academic interest in the goals of market
share growth and profit maximization include literature that debates the positive linear
relationship between the two goals (Schwalbach, 1991; Sheth & Sisodia, 2002; Uslay, et
al., 2010). The Rule of Three theory, developed by Sheth and Sisodia (2002), states that
almost every industry evolves towards the existence of three large generalist companies
that strive towards market share growth goals and a numerous amount of small, specialist
companies that endeavor towards profit maximization goals. Then, there are those
companies that Sheth and Sisodia (2002) claim live in the “ditch” with 5% to 10% of
market share and are neither the generalist nor the specialist, whereby both strategies can
be in play at any given time for any given product line. Within all companies, regardless
of size, there exists the potential for the goals of the revenue generating strategies to
become misaligned. The goals of market share growth and profit maximization each
suggest a particular type of pricing and sales force compensation strategy.
Market share growth
Pricing
Pricing strategies with a market share growth goal are used to further penetrate a current
distribution channel or to introduce a product to a new channel (Holden & Nagle, 1998).

77
Previous literature classified pricing strategies that had a goal of increasing market share
to be characterized by discounted prices that offer buyers an incentive to purchase the
product (Sethuraman & Tellis, 1991). Research by Anderson, Fornell, and Lehmann
(1994) suggests that market share growth goals when accompanied with discounted
prices can increase customer satisfaction.
Compensation
This research associates a market share growth goal with a sales force
compensation contract that incents the salesperson to sell a high level of product volume.
Such an outcome-based compensation program allows the salesperson autonomy in
choosing their sales methods (DelVecchio & Wagner, 2011; Mahajan, Churchill Jr, Ford,
& Walker Jr, 1984). Incenting a salesperson for improving an organization’s market
share position in the market may produce short-term benefits for the salesperson.
However, the long term effects of a market share growth goal for both the organization
and the salesperson depend on the market continually expanding.
Profit maximization
Pricing
Firms may have a product pricing goal of profit maximization when they are able to
make use of economies of scale, capitalize on add-on sales with products that are
mutually dependent on one another, or exploit a competitive advantage such as vertical
integration (Tellis, 1986). Lancioni and Gattorna (1993) suggest that an organization that
develops pricing strategies with the goal of profit maximization “never compromises on
price” (p. 3). Maximizing profits through pricing involves market research as to what the

78
customer is willing to pay and then raising “willingness to pay closer to the value
received” (Nagle & Cressman Jr, 2002, p. 30).
Compensation
Sales force compensation contracts with a profit maximization goal are based on
motivating the salesperson to achieve predetermined levels of gross margins. These types
of contracts are typically accompanied by a significant salary component of the
compensation package. Profit maximizing goals are established to ensure that sale of
products below a predetermined margin will occur less frequently (Weinberg, 1975). The
organization removes the risk of performance uncertainty when the compensation
contract is salary, whereby the salesperson is guaranteed a salary regardless of the
outcome (Eisenhardt, 1989). This allows the sales force to invest in activities such as
customer relationship building and communicating product differentiation and
diversification benefits.
HYPOTHESES
Expectancy
Expectancy theory suggests expectancy to be highest when the goals are easily
achievable with no conflicts, as all efforts and energies contribute to increased
performance levels. “Because difficult goals are harder to attain than easy goals,
expectancy of goal success would presumably be negatively related to performance”
(Locke & Latham, 2002, p. 706). Both aligned and misaligned goals can be perceived as
difficult and challenging, however misaligned goals increase goal difficulty as a result of
the goal conflict. Goal conflict is defined by Cheng et al. (2007) as “the degree to which
individuals feel that performance expectations (i.e., goals) with respect to the multiple

79
dimensions of a task, or among multiple tasks, are incompatible” (p. 222). When the
goals of the pricing and sales force compensation strategies are misaligned the
salesperson’s levels of expectancy will likely be low.
Significant cognition is involved when a person attempts to determine the amount
of effort that might be required to meet or achieve expectations, and then act upon that
assessment (Bandura, 2001). When salespeople consider the expected goals to be
challenging their efforts are intensified. The salesperson may achieve goals that are
congruent with effort. However, misaligned goals pose the challenge of deciding which
goal to pursue whereby failure is eminent. Salespeople can become despondent when
failing to achieve difficult and conflicting goals. Research by Bandura (2001) states “if
they read their failures as indicants of personal deficiencies; if they believe they are being
exploited, coerced, disrespected or manipulated, they respond apathetically,
oppositionally, or hostilely” (p. 5). Low levels of salesperson expectancy and apathetic
behaviors are likely to occur when assigned, misaligned goals are perceived to restrict or
limit salesperson compensation and sales growth. When a discounted pricing approach is
encouraged by the firm the compensation contract encourages the salesperson to invest
time building a customer relationship and an understanding of the customer needs. A
profit maximization compensation strategy encourages the salesperson to sell the
customer a product or service solution that brings the most profit to the selling firm. In
this situation, the salesperson will perceive extremely low expectancies as the level of
performance required to obtain the sales goal as insurmountable.
In the setting where the goals of the pricing and sales force compensation
strategies are misaligned, the salesperson perceives low expectancies as a result of goal

80
and role conflict. In specific situations where the salesperson estimates that the
probability of his/her efforts and activities will not improve his/her level of performance,
the salesperson’s expectancy is the lowest. In this line of reasoning the following
hypotheses are suggested:
Hypothesis 1a: When the goals of the pricing and sales force compensation
strategy are misaligned, the salesperson’s expectancy will be lower than
when the goals are aligned.
Hypothesis 1b: When the goal of the sales force compensation strategy is
profit maximization and the goal of the pricing strategy is market share
growth, the salesperson’s expectancy will be lowest.
Instrumentality
When the salesperson considers how his/her performance, and related activities
required to obtain that performance, relate to the reward that he/she might obtain, the
salesperson evaluates all of the organizational elements that enable the performance as
well as the type of reward (Teas, 1981). For salespeople, rewards are not only financial,
but also come in the form of recognition both internally from managers (Cron, Dubinsky,
& Michaels, 1988; Pritchard & Sanders, 1973; Teas, 1981) and peers, and externally
from customers (Teas, 1981).
When the pricing and sales force compensation goals are congruent, the signals to
the market are echoing the efforts of the salespeople and the voice of marketing

81
(Homburg, Jensen, & Krohmer, 2008). As a result of goal alignment, the salesperson
feels a part of the collective sales and marketing process that also serves to reduce the
salesperson’s perceived risk that his/her objectives will not be met. In situations where
there is goal alignment between the pricing and sales force compensation strategies the
salesperson will perceive the opportunity to achieve the goal that may be challenging, but
is realizable. This provides strong instrumentality for the salesperson. Therefore,
Hypothesis 2a: When the goals of the pricing and sales force compensation
strategy are misaligned, the salesperson’s instrumentality will be weaker
than when the goals are aligned.
Compensation contracts designed to incentivize salespeople to grow market share
are based on providing commissions for achieving that outcome. These types of contracts
are appealing because salespeople under these contracts require little supervision during
the process, and instead management’s job is to measure whether the desired outcomes
were achieved or not (Anderson et. al., 1987; Cravens, Ingram, LaForge & Young, 1993;
Eisenhardt, 1989). Salespeople paid to grow market share, but armed with a list price and
no authority to discount prices, will perceive little or no opportunity to achieve their
objectives. With this type of goal mismatch, the progress of the sales force may be easy
to monitor, but the sales force may consider the pricing too high to achieve required
performance objectives. Instrumentality is low or weak if the salesperson perceives that
there is no relation between his/her level performance and reaching a threshold or gaining
a reward (Tyagi, 2010). With a goal of growing the market, but the constraint of no

82
flexibility on already higher prices, the salesperson may perceive reaching his/her goal
impossible. Hence,
Hypothesis 2b: When the goal of the compensation strategy is market share
growth and the goal of the pricing strategy is profit maximization, the
salesperson’s instrumentality will be the weakest.
Motivation
Sales force motivation is an accumulation of individual perceptions that precludes
performance outcomes (Oliver, 1974; Vroom, 1964). Expectancy theory not only
identifies situational, organizational, and individual variables that influence behavior, the
theory enables the exploration of the process by which these variables are influential
(Tyagi, 1982). The expectancy theory framework has been expanded in past literature to
include intrinsic and extrinsic motivation types (Oliver & Anderson, 1994; Tyagi, 1982).
Given that intrinsic motivation has been demonstrated to be a rather stable, trait-like
individual characteristic (Amabile 1993, 1994) and that the focus of this essay is on how
pricing—a factor external to the salesperson—affects the salesperson, extrinsic
motivation is the more relevant variable for this research.
Expectancy theory offers that motivation is the result of a multiplicative
relationship between the salesperson’s perceived level of effort required to complete or
accomplish a task to produce progress toward his/her overall performance objective and
instrumentality (Broedlirig, 1975). Previous expectancy theory literature has found
support for individual motivation and behavior being influenced by perceptions of his/her

83
environment (Oliver, 1974; Teas et. al., 1986). This well-established relationship among
perceived effort, instrumentality and motivation is examined empirically in this study to
illustrate the full influence of the interaction of pricing and sales force compensation
goals on the salesperson. Hence,
Hypothesis 3: The interaction of the salesperson’s expectancy and instrumentality
will be positively related to the salesperson’s extrinsic motivation.
Behavioral Intention
Behavioral intention is defined as “a person’s perceived likelihood or subjective
probability that he/she will engage in a given behavior” (Committee for Communication
for Behavior Change in the 21st Century, 2002, p. 31). According to the theory of planned
behavior (Ajzen, 1991), behaviors are predetermined by behavioral intentions. A person’s
behavioral intention occurs on a continuum as a measure of strength or degree of the
intent (Armitage & Conner, 2001). This research references a low level of salesperson
behavioral intention for a low degree of goal commitment and a high level of behavioral
intention for strong or high degree of goal commitment.
The sales force compensation strategy is designed to direct salesperson behaviors
such that the goals of the compensation strategy are achieved. When the salesperson is
exposed to multiple or conflicting goals the intended behaviors of each of those goals
lose priority or focus. Research has found that when an individual is experiencing goal
conflict the performance of and commitment towards one goal is sacrificed at the expense
of the other goal (Cheng, Luckett, & Mahama, 2007; Locke, Smith, Erez, Dong-Ok, &

84
Schaffer, 1994; Schmidt & Dolls, 2009). Misaligned goals of the pricing and sales force
compensation strategies allow for the salesperson to subjectively determine which goals
to pursue, in which behaviors to engage and to what extent. The consequence of
misaligned goals of the pricing and sales force compensation strategies with regard to
behavioral intention is the possibility of low behavioral intention. Hence,
Hypothesis 4: When the goals of the pricing and sales force compensation
strategy are misaligned, the salesperson’s behavioral intention will be
lower than when the goals are aligned.
METHODOLOGY
An experiment was used to test the hypotheses in this essay. The experiment was
scenario-based, with a between-subjects design. The experiment was used to examine the
differences in the expectancy, instrumentality, extrinsic motivation, and behavioral
intention of B2B salespeople across different combinations of goals of pricing and sales
force compensation strategies. The design was appropriate for this research as the use of
scenarios allowed for a more powerful and controlled manipulation of goal alignment and
misalignment. The study was designed to ascertain the ways in which a firm’s pricing
strategy may influence the salesperson.
The context in which this study evaluated the effect of (mis)aligned goals of the
pricing and sales force compensation strategies was B2B markets. B2B markets include
industrial sales and wholesaling wherein there tends to be a commoditization of products
and services resulting in downward pressures on price. Sales growth within the B2B
market is dependent upon the organization’s sales force (Behrman & Perreault, Jr. 1982).

85
The organization’s profitability and market share are premised on the selling
organization’s pricing strategies (Homburg, Jensen, & Hahn, 2012; Ramaswamy,
Gatignon, & Reibstein, 1994). The decisions of the sales force and the price of the
product or service are critical marketing components which influence success for an
organization in B2B markets (Homburg, et al., 2012).
In the pretest and main study described in the following sections, B2B sales
professionals were randomly assigned to one of four scenarios. In the scenarios the goals
were either aligned or misaligned. Specifically, the goal of the pricing strategy was either
market share growth or profit margin maximization, and the goal of the sales force
compensation strategy was either market share growth or profit margin maximization.
For ease of referencing throughout the rest of this section, the scenarios will be
referenced by the designated acronym; the compensation goal is referenced first, the
pricing goal is referenced second. Acronyms are shown below in Table 2.1.
Table 2.1. Scenarios
Strategy
Sales Force
Compensation Goal Pricing Goal Acronym*
Misaligned Profit maximization Market share growth PM-Mis
Misaligned Market share growth Profit maximization MP-Mis
Aligned Profit maximization Profit maximization PP-Align
Aligned Market share growth Market share growth MM-Align
* The sales force compensation strategy goal is always referenced first within the
acronym.
After reading the scenario, the participants in each group completed a brief
questionnaire to assess whether the conditions influenced the salespeople’s level of
expectancy, instrumentality, extrinsic motivation and behavioral intent. In addition,
participants responded to a series of questions that were used for manipulation checks

86
and to collect demographic information. The overall goal of the research design and
methodology was to elicit perceptions from salespeople, across industry sectors, by
placing them in a realistic selling environment inclusive of the manipulation of key
factors under investigation.
An ANOVA is a test of group differences that determines whether or not two or
more groups differ with respect to the one dependent variable. ANCOVA is a test of
association or covariation to determine whether or not there a relationship between two or
more variables within a group. A covariate is a variable that is related to the dependent
variable (expectancy, instrumentality, or behavioral intention). The objective of
conducting the ANCOVA would be to remove the relationship of the covariate from the
dependent variable prior to assessing the differences on the on the independent variables.
ANOVA was used for the pre-test to isolate only the differences in means while the
effectiveness of the scenarios was being assessed. The hypotheses tested included
control variables, thus ANCOVA was used. To test if differences in means across groups
existed in both the pre-test and main study, respondents were grouped.
Multiple tests were conducted both using the groupings based on the scenario
viewed by the respondent (therefore, a four-level factor, see Table 2.1, Acronym column)
and a second set of groupings represented the alignment or misalignment group (a two-
level factor, see Table 2.1, Strategy column). The information within each factor is
unique to each level or category. The factors representing the scenarios and alignment are
categorical variables. A one-way ANOVA is used when there are categorical
independent variables and one dependent variable (Leech, Barrett, & Morgan, 2008). A
one-way ANOVA tests the differences in means based on the ratio of between group

87
variance to within variance. Previous marketing literature has used ANOVA to test
variance with scenario-based, between-subjects experiments (Dutta, Biswas, and Grewal,
2007; Miao, Lund et al. 2009; Wagner, Hennig-Thurau, and Rudolph, 2009; Küster and
Canales, 2011; Palazon¸ and Delgado-Ballester, 2009).
The following section provides details on the derivation of the instrument.
Subsequent sections describe the pretest and main study procedures, statistical tests,
results, and conclusions.
Design
The four scenarios were initially developed based on the scholar’s industry
experience and refined through discussion with other B2B sales professionals. In
marketing, the majority (70%) of experimental scenarios are created by the scholar
himself/herself (Wason, Polonsky & Hyman, 2002). This convention was followed. After
each scenario was developed, each scenario was rotated among the dissertation
committee for refinement. Following the changes to the scenarios, each scenario was then
shown to a group of salespeople for comments before the formal pretest.
Prior to the pretest an analysis of the scenarios was performed with a set of B2B
salespeople. The objective was two-fold: 1) to confirm that the language of the
hypothetical scenarios was appropriate for the salespeople; and 2) to maximize the
differences among the scenarios. According to previous literature, the experimental
conditions in the scenarios should be emphasized (Burstin, Doughtie & Raphaeli, 1980)
and created to maximally differ from one another (Kerlinger, 1973).
The survey that followed the scenario included reflective multi-item measures
obtained from extant literature for all latent variables. More detail on the scales used for

88
each variable will be provided in the pretest and main study sections. All items were
adapted to fit the purpose of this study. The scenarios and pretest and main study survey
items appear in Appendix B.
Pretest
The pretest instrument was administered in an online panel forum. Extreme care
was taken to protect the validity of the context, which contributed to the challenge in
obtaining a pretest sample of 60. The pretest was administered to 171 participants.
However, 30 respondents were screened out of the survey as their current responsibilities
did not include managing customers. Respondents who did not sell into B2B markets
also were excluded from the survey, reducing the respondent count by 44. Two quality
control filters were placed in strategic locations within the survey to ensure that
respondents were indeed reading the questions. The quality control filters asked the
respondents to “Please select Strongly Agree to continue” and “Please select Strongly
Disagree to continue”. The 26 respondents who did not respond as directed were
prevented from finishing the survey. A total of 11 respondents had not completed the
survey within the 10 day activity period, therefore those surveys were excluded. The
total pretest sample of 60 respondents is in accordance with previous literature
(Diamantopoulos, Reynolds, & Schlegelmilch, 1994) which has suggested pretest sample
sizes should be small (i.e., up to 100 respondents). The sample was spread across the
four groups through the randomization of scenarios and established quotas for each
group. The distribution of respondents across groups is listed in Table 2.2.

89
Table 2.2. Pretest respondents per condition
Conditions N = 60
PM-Mis 16
MP-Mis 15
PP-Align 15
MM-Align 14
Demographics
The 60 sales professionals who participated in the pretest met two criteria: 1) they
had account responsibilities, and 2) they sold in B2B markets. The demographics in
Table 2.3 indicate that the sample was suitable and representative of B2B sales
professionals and therefore appropriate for the pretest.
Table 2.3. Pretest participant demographics
TABLE 2.3. Participant demographics (n = 60 salespeople)
Variable Number PercentAccum
Percent
Job Title
28 46.7 46.7
27 45.0 91.7
5 8.3 100
1-9 years 30 50.0 50.0
25 41.6 91.6
5 8.3 100.0
1-9 years 48 80.0 80.0
10 16.6 96.6
2 3.4 100.0
Salesperson
Sales Manager with accounts
Other type of sales professional
with accounts
Sales Experience
10-19 years
> 20 years
Company Sales Experience
10-20 years
> 20 years

90
TABLE 2.3. Participant demographics continued (n = 60 salespeople)
Variable Number PercentAccum
Percent
Gender
Male 39 65.0 65.0
Female 21 35.0 100.0
Education
9 15.0 15.0
11 18.3 33.3
8 13.3 46.6
25 41.7 88.3
7 11.7 100.0
Industry
5 8.3 8.3
4 6.7 15.0
Retail 4 6.7 21.7
3 5.0 26.7
Unknown 3 5.0 31.7
3 5.0 36.7
3 5.0 41.7
3 5.0 46.7
Clothing 2 3.3 50.0
Sales 2 3.3 53.3
2 3.3 56.6
2 3.3 59.9
1 1.7 100.0
0-9% 19 31.7 31.7
10 16.7 48.4
8 13.3 61.7
4 6.7 68.4
2 3.3 71.7
7 11.6 83.3
6 10.0 93.3
0 0.0 93.3
1 1.7 95.0
0 0.0 95.0
100% 3 5.0 100.0
Manufacturing
High School/GED
Some College
2-Year College Degree
4-Year College Degree
Graduate Degree
Software/development services
Automotive
Electronics
Insurance/Risk Management
Computers
Telecommunications
TV/Cable
*Accessories, Agriculture Products, Cell Phones, Corporate
Management, Electrical, Finance, Healthcare, Housing,
Industrial, Information Technology, Jewelry, Merchant
Services, Metal Fasteners, Metal Finishing/Manufacturing,
Office Supplies, Printing, Publishing, Pump & Motors,
Services, Souvenirs, Telemarketing, Wholesale, Wine.
* 24 Industries
20%-29%
Commission % of Compensation
10%-19%
90%-99%
30%-39%
40%-49%
50%-59%
60%-69%
70%-79%
80%-89%

91
Pretest Analysis
The overall results of the pretest were not as strong as expected, and the
hypotheses were not tested since one of the manipulation checks did not operate as
intended. However, valuable insights were gained in the pretest (as is part of the purpose
of a pretest), and changes that will be explained later were made to the main study based
on these findings. The statistical program, SPSS 18, was used to determine descriptive
statistics, assess the reliability of the scales with Cronbach’s alpha, and analyze
differences across groups with ANOVA. The following sections evaluate the
effectiveness of the manipulations and the reliability of the variables of interest during
the actual pretest of the instrument.
Manipulation Check and Related Issues
To create realistic manipulations, the author consulted with salespeople within the
context of this research (Wagner et al., 2009). The interviews from Essay 1 provided
common details of pricing and sales force compensation goals. To test the
manipulations, a one-way ANOVA was performed to determine if the results differed
across scenarios as intended. The manipulation check question for the pricing strategy
asked participants to reflect on the scenario they had just read and select a response to “In
the scenario, the goal of the pricing strategy is to maximize profits” (1 = “strongly
disagree to 7 = “strongly agree”). To test whether or not differences existed, respondents
who had viewed a scenario containing a profit maximizing pricing goal (MP-Mis and PP-
Align) were grouped together and called “Price_Strat_Profit” and compared to the two
groups who did not view a scenario containing a profit maximizing pricing goal (MM-
Align and PM-Mis). The results of the one-way ANOVA comparing items across the two

92
groups found that the manipulation was successful (Price_Strat_Profit: M = 5.86, SD =
1.22; NOT_Price_Strat_Profit: M = 4.90, SD = 1.72; F = 6.14, p ≤ .05).
The other manipulation check question was used to evaluate the strength of the
differences in the scenarios for the goal of the sales force compensation strategy.
Participants were asked to reflect on the scenario they had just read and select a response
to the question “In the scenario, the goal of the sales force compensation strategy is to
increase market share” (1 = “strongly disagree to 7 = “strongly agree”). To analyze this
manipulation, a new variable (Comp_Strat_MS) was computed grouping those
respondents who had viewed a condition where the sales force compensation goal was
market share growth (MP-Mis and MM-Align) and those who had not. The results of this
sales force compensation manipulation check were not as strong as expected
(Comp_Strat_MS: M = 5.87, SD = 1.14; NOT_Comp_Strat_MS: M = 5.30, SD = 1.62; F
= 2.45, p = .12).
Research has shown that order effects recall (Dahl, Brimacombe, and Lindsay,
2008; St Clair-Thompson, and Allen, 2012). Respondents in experiments are more likely
to recall the items presented at the end of a long series of information, called recency
effect, as opposed to placing more weight or recalling the items at the beginning of a long
series of information, called primacy effect (Pinsker, 2011). Research has found that
information length and pattern can reduce order effects (Trotman and Wright, 2000). To
mitigate this concern a summary statement describing both goals was added to the end of
the scenarios. For example, “In summary, the goal of the sale force compensation
strategy is to maximize profits and the goal of the pricing strategy is to increase market
share.” The manipulation check items were retained for the main study.

93
Realism Check
Research by Darley and Lim (1994) notes that “creating realism and involvement
checks is a difficult endeavor, [and] the importance of ensuring experimental realism
calls for nothing less” (p. 493). The realism of the selling environment was tested with
two items. Salespeople were asked the degree to which they agreed with the following
two statements: “I can imagine a company actually implementing the initiatives described
in the scenario”, and “The sales situation described in the scenario likely occurs in
business today” (1 = “strongly disagree to 7 = “strongly agree”). A new composite
variable was computed from the average of the two realism items. For future reference,
this scale item is called Realism.
To test whether realism differed across scenarios (as well as to test for differences
in other constructs throughout the study), a variable was computed that identified whether
a particular condition was aligned or misaligned. For future reference, this variable will
be referred to as Alignment. A one-way ANOVA tested whether perceptions of Realism
differed across conditions of aligned goals versus misaligned goals. Results showed no
significant difference in the rating of scenario realism. Overall, the participants found the
scenario to be realistic. (Aligned: M = 5.77, SD = .98; Misaligned: M = 5.77, SD = .96; F
= .00, p = .99). The realism items were retained for the main study.
Interpretation Check
The interpretation check was established to verify the attractiveness of the reward
described in the scenario as offered by the company if the salesperson achieved the sales
force compensation goal. In the scenario, the participants learned that the commission
“will increase by an additional 3% on total monthly sales when you achieve your new

94
goal.” The interpretation of the attractiveness of the reward was measured on a seven-
point Likert scale ranging from (1) “very unattractive” to (7) “very attractive”. An
analysis of variance for participants who viewed the aligned conditions versus those who
viewed misaligned conditions was not statistically significant (≤ .05) (Aligned: M = 5.03,
SD = 1.15; Misaligned: M = 4.87, SD = 1.28; F = .86, p = .46). The interpretation check
verifies that across scenarios the commission is not influencing one group more than any
other. This item was retained for the main study.
Conflict Check
The study suggests that salespeople who were exposed to the misaligned
conditions should experience a higher degree of goal conflict than the salespeople
exposed to the aligned conditions. The conflict check item was adapted from the goal
conflict scale of Locke, Smith, Erez, Chah and Schaffer (1994). Participants were asked,
“To what degree do you feel the pricing goal in the scenario is in conflict with the sales
force compensation goal?” (0= “not at all” to 100= “completely”). Analysis of variance
was used to test the difference in perceptions of goal conflict between aligned and
misaligned groups. While directionally appropriate (misaligned groups rated a higher
level of goal conflict than aligned groups), there was near significance (where
significance ≤ .05) regarding respondent goal conflict between those exposed to the
aligned scenarios versus the participants exposed to the misaligned scenarios (Aligned: M
= 58.07, SD = 22.06; Misaligned: M = 68.16, SD = 20.761; F = 3.33, p = .07). As
indicated earlier, the addition of the summary statement to the scenarios in the main study
was expected to make the conditions more robust to the participant. For the main study, a
second more direct, conflict check question was added: “In the scenario, the goal of the

95
pricing strategy is in conflict with the goal of the sales force compensation strategy” and
was measured on a seven-point Likert scale with anchors 1= “strongly disagree” to 7=
“strongly agree”.
Behavioral Intention
In this study, behavioral intention reflects the extent to which the salesperson will
commit to the activities and behaviors needed to pursue a stated goal. The two
behavioral intent items were adapted from Locke et al. (1994). The respondents were
asked to reflect on the degree to which they would: 1) “try to achieve the pricing goal”,
and 2) “try to achieve the sales force compensation goal” (0 = “not at all” to 100 =
“completely”).
A higher level of behavioral intention is expected of a salesperson when the goals
are aligned. A one-way ANOVA was used to determine whether the behavioral intention
differed across the two groups. The salesperson’s intention to achieve the goals of the
scenarios was not significantly different across aligned or misaligned strategies (Aligned:
M = 78.03, SD = 18.73; Misaligned: M = 81.50, SD = 15.08; F = .63, p = .43). As noted
previously, the strength of the scenarios needed to be improved. The behavioral intention
items were retained for the main study.
Expectancy
The measure of a salesperson’s estimate of the probability that a prescribed
amount of effort will lead to a higher level of performance was adapted from Sims et al.
(1976). The five items were developed to quantify a salesperson’s probability estimates
of successful sales goal achievement. For example, survey participants were asked to
select a response that best represents their feelings to the statement “Performing my
96
duties as well as I am capable would result in reaching my sales goal,” measured on a
seven-point Likert scale (1 = “strongly disagree to 7 = “strongly agree”). The reliability
analysis on the five-item expectancy scale produced a Cronbach’s alpha coefficient of
.84. This measure of internal reliability would be improved to .91 with the removal of the
one reverse coded item: “It would be unlikely that my efforts would enable me to achieve
the goal for this product line”. This item was omitted for the main study.
When analyzing the variance of the four-item expectancy scale across aligned and
misaligned conditions, salesperson expectancy for viewers of the aligned scenarios was
not significantly different from the respondents who viewed the misaligned scenarios. A
one-way ANOVA was used to determine whether Expectancy differed across the two
groups represented by Alignment (Aligned: M = 4.95, SD = .95; Misaligned: M = 4.63,
SD = 1.20; F = 1.35, p = .25). The four items were retained for the main study, and as
mentioned before the scenarios were refined.
Instrumentality
Instrumentality is the salesperson’s perceived link between performance and
reward. The five item scale was adapted from Teas (1981). Of the five survey items
used to measure instrumentality, two questions focused on monetary rewards and three
questions concentrated on performance recognition. Throughout the rest of this section,
the constructs will are referenced as INST_ Monet with items coded as INST_Monet a,
INST_Monet_b; and INST_Perf_Rec with items coded as INST_Perf_Rec_c,
INST_Perf_Rec_d, and INST_Perf_Rec_e. Examples of instrumentality items include
“If I achieve my sales goal, I will be viewed more favorably by my customers” and
“Reaching my sales goal will result in earning my commission”, measured on a seven-

97
point Likert scale (1 = “strongly disagree” to 7 = “strongly agree”). The internal
reliability for the five items creating the instrumentality construct was .61. However,
including the two items in INST_Monet resulted in an improved Cronbach’s alpha of .78.
The univariate analysis of variance of INST_Monet exhibited near significance (where
significance ≤ .05) between aligned and misaligned scenario conditions (Aligned: M =
5.43, SD = 1.05; Misaligned: M = 5.89, SD = 1.00; F = 2.93, p = .09).
Given these results and a review of the literature, the decision was made to create
a more voluminous, multi-dimensional scale for the main study (Chowdhury, 1993; Cron,
et al., 1988). An eight-item instrumentality measure was created for the main study. The
monetary reward dimension was expanded by one item (for a total of three items), which
stated: “If I reach my sales goal my overall pay will increase.” The instrumentality
dimension representing performance recognition was expanded to five items—three
items reflecting customer recognition of the salesperson’s efforts and two items reflecting
recognition of the salesperson within his/her own firm. The items in the pretest
maintained the multi-dimensional complexity of instrumentality scales with much fewer
items, which may have been the reason for a low internal reliability score.
Extrinsic Motivation
Extrinsic motivation is the existence of an entity “external to the work” that
stimulates a level of performance; examples are “a reward or recognition” (Amabile, Hill,
Hennessey, & Tighe, 1994, p. 950). A five-item scale adapted from Amabile et al.
(1994) was used to assess the level of extrinsic motivation across aligned and misaligned
strategies condition groups. One such item included “the extra money that I could earn
from achieving the sales goal would strongly motivate my efforts” (1 = “strongly

98
disagree” to 7 = “strongly agree”). The Cronbach’s alpha coefficient of .86 was again
above the recommended level of .70 (Nunnally, 1978). A one-way ANOVA was used to
determine whether extrinsic motivation differed across the two groups represented by
Alignment. There was no significant difference (Aligned: M = 5.64, SD = 1.01;
Misaligned: M = 5.96, SD = .86; F = 1.74, p = .19). All items were retained for the main
study.
Goal Difficulty
Goal difficulty “refers to the difficulty individuals perceive in implementing a
goal” (Fang, Palmatier, & Evans, 2004, p. 189). If goals are misaligned, the perception
of goal difficulty should increase. The internal reliability of the three-item scale was .39.
However, reliability increased to .63 with the removal of the reverse coded item “I would
have little difficulty in reaching my assigned sales goal,” measured on a seven-point scale
(1) “strongly disagree” to (7) “strongly agree”. Following a further review of the other
two items “My assigned sales goal would be very difficult to achieve” and “Given the
details in the scenario, my assigned sales goal is challenging,” and the goal difficulty
literature, a decision was made to make the questions more relevant to the pricing
strategy and more specific with regard to the level of difficulty.
New goal difficulty questions were created for the main study. The new questions
included: “The pricing strategy will make it more difficult to achieve my assigned sales
goal” (1 = “strongly disagree” to 7 = “strongly agree”); “The pricing strategy makes
achieving the assigned sales goal ___,” (1 = “much easier” to 7 = “much harder”); and “
The assigned sales goal in the scenario would be ____,” (1 = “not difficult at all” to 7 =
99
“very difficult”). The enhanced questions and the more robust scenarios were designed
to improve the reliability of this construct for the main study.
Main Study
Based on the findings of the pretest, the following changes were made to the
instrument for the main study: the scenarios were strengthened; one additional conflict
manipulation item was added; three additional instrumentality items were added; and the
three goal difficulty questions were enhanced to reference both pricing and sales goals.
In addition, the scenarios were made more robust with a summary statement at the end of
each scenario, for example in the PP-Align scenario the summary statement read as
follows, “In summary, the goal of the sales force compensation strategy is to maximize
profits and the goal of the pricing strategy is to maximize profits.” The addition of this
statement improved the manipulation effects, signifying that indeed respondents read and
understood the goals of both the pricing and sales force compensation strategies
described in the scenarios. The conflict manipulation check was effectively strengthened
with the addition of a second, more direct question. More depth was added to the
instrumentality construct. The main study added three items to the five items used in the
pretest. The additional instrumentality items included one new item representing
monetary rewards and two items representing customer facing performance recognition.
The three goal difficulty items were made more specific by referencing the pricing and
the sales goal in each item. In the pretest, the items only referenced the sales goal.
Data for the main study was collected after the analysis of the pretest was
completed and the instrument was amended as noted in the previous sections. The main
study instrument was administered in an online panel forum and was collected within

100
seven days. A total of 1,670 individuals were invited to participate although not all were
qualified to participate in the study. The breakdown of respondents (1,325) that were
either not qualified or that did not respond to qualifier questions included: 1) they did not
begin the survey (less 81 respondents), 2) they did not provide consent to participate in
the survey (less 260 respondents), 3) they did not respond to the question regarding their
current job responsibilities (less 46 respondents), 4) their current responsibilities did not
include managing customers (less 442 respondents), or 5) they did not sell into B2B
markets (less 496 respondents). The remaining 345 qualified respondents comprised of
invited and consenting online panel sales professionals that had account responsibilities
and sold in B2B markets.
Further evaluation of the 345 qualified respondents resulted in elimination of 170
respondents for reasons that included: 1) they failed to respond to a question (less a total
of 35 respondents) or 2) they failed one of the two quality control filters placed randomly
in the survey (less a total of 135 respondents). The remaining 175 respondents (51% of
345) were then evaluated on passing or failing the manipulation check and conflict
verification questions. Details of the manipulation check process are to follow in the
manipulation check section. Table 2.4 Main Study Survey Participation details the
evolution of usable complete surveys.

101
Table 2.4. Main study survey participation
Respondent Action- Description
Total
Survey
Count
Survey
Adjustment
Count Percent*
Invited to participate in the Survey 1670 1670 nq
Began the survey 1589 -81 nq
Gave consent to participate 1329 -260 nq
Responded to question 2 (What
describes your job?) 1283 -46 nq
Had account responsibilities 841 -442 nq
Sold in B2B markets 345 -496 100%
Responded to question 4 (Manipulation
check) 325 -20 94%
Responded to question 6 (Realism
check) 317 -8 92%
Responded to question 13 (Behavioral
intention) 314 -3 91%
Passed first quality control filter (Select Strongly Agree to continue) 213 -101 62%
Passed second quality control filter
(Select Strongly Disagree to continue) 179 -34 52%
Responded to years of selling experience 175 -4 51%
Passed compensation manipulation
check 151 -24 44%
Passed pricing manipulation check 138 -13 40%
Determined degree of conflict 136 -2 39%
Identified goal conflict 135 -1 39%
* nq = respondent not qualified to participate in the survey.
Percentage reported is what is remaining from the qualified sample of 345.
Main Study Analysis
Manipulation Check and Related Issues
The data from the remaining 175 respondents was evaluated to confirm that
respondents passed the two manipulation checks regarding the goals of the pricing and

102
sales force compensation strategies. Additional confirmations were made to assure that
the online panel respondents were not merely selecting options without clearly reading
the scenario. While a researcher cannot read the mind of the respondent, additional
efforts can be taken to systematically assess additional manipulation checks. (See Perdue
and Summers [1986] for additional approaches to manipulation checks in experiments.)
The decision rules applied (four separate double elimination procedures based on extreme
responses indicating lack of understanding the experimental scenarios) can be duplicated
on similar contextual samples such that the sample would yield similar findings. The
double elimination procedures considered the affirmation (understanding) and negation
(lack of understanding) of the compensation, pricing, and alignment/misalignment
manipulations.
The first manipulation check question asked respondents to confirm the sales
force compensation goal in the scenario, “The goal of the sales force compensation
strategy is to increase market share (1= "strongly disagree" to 7 = "strongly agree").”
Elimination evaluation for the first check involved looking at respondents that viewed
compensation scenarios where the compensation strategy was profit maximization (PM
and PP) and eliminating all respondents that chose seven, “strongly agree” (i.e., they
believed the goal was market share when it was profit maximization). An additional
evaluation was then performed to verify the affirmation. All of the respondents that
viewed compensation scenarios where the compensation strategy was market share
growth (MP and MM) and chose one, “strongly disagree” were removed (i.e., did not
believe the goal was market share when it was in fact market share). In total 24
responses were eliminated based on this method. The remaining 151 respondents (44%

103
of 345 qualified respondents) were then evaluated for passing or failing the pricing goal
manipulation.
The second, double elimination procedure occurred when respondents were
requested to report if the goal of the pricing strategy, in the scenario, was to maximize
profits. Consistent with the evaluation of the first manipulation check question, the
responses to the question, “The goal of the pricing strategy is to maximize profits,” based
on 1 = "strongly disagree" to 7 = "strongly agree" were evaluated and eliminated when
the manipulation clearly failed. Those respondents that viewed a scenario where the
pricing strategy was market share (PM and MM) and chose a response of seven,
“strongly agree” were eliminated (i.e., they believed the goal was profit maximization
when it was market share). The second step in the pricing evaluation process included
respondents that viewed a scenario where the pricing strategy goal was to maximize
profits (MP and PP) and chose a one “strongly disagree”; those respondents were
eliminated (i.e., they did not believe the goal was profit maximization when it was in fact
profit maximization). In total 13 responses were eliminated based on this method.
The remaining 138 responses (40% of 345 qualified respondents) were evaluated
based on the identification of congruent or incongruent goals. In the third evaluation
manipulation procedure, the respondents were asked to determine the degree of goal
congruence in the scenario they viewed. The responses to the question, “To what degree
do you feel the pricing goal in the scenario is in conflict with the sales force
compensation goal? (0 = "not at all" to 100 = "completely"),” were reviewed based on the
established decision rule. If the respondent viewed a scenario with congruent goals (MM
or PP) and indicated that the goals were completely in conflict, the response was removed

104
(i.e., they believed the goals were in conflict when the goals were not in conflict). During
the second confirmation of manipulation on this question, respondents that viewed a
scenario with incongruent or misaligned goals (PM or MP) and indicated that the goals
were “not at all” in conflict were removed (i.e. they did not believe the goals were in
conflict when the goals were in fact in conflict). Only two respondents were removed.
In the fourth elimination, the remaining 136 respondents (39.4% of 345 qualified
respondents) were evaluated on their ability to identify goal congruence or incongruence
in the scenario. Once again, a double elimination procedure was performed on the
responses. The question, “The goal of the pricing strategy is in conflict with the goal of
the sales force compensation strategy, respond, 1= "strongly disagree" to 7 = "strongly
agree",” allowed salespeople to choose the response that applied to the scenario that was
viewed. Respondents that viewed scenarios that affirmed the sentence, (scenarios PM
and MP) and yet chose one, “strongly disagree” were removed (i.e., they did not believe
the goals were in conflict when they were in fact in conflict). Likewise, respondents that
viewed scenarios that negated the sentence, (scenarios PP and MM) and yet chose seven,
“strongly agree” were removed (i.e., they believed the goals were in conflict when they
were not in conflict). Only one respondent was removed. The main study sample resulted
in a total of 135 out of the 345 qualified respondents completing the survey for a 39%
usable response rate.
The last evaluation method used to eliminate respondents was response time.
Insufficient response time and excessive response time when compared to the average
were eliminated (Swain, Weathers, & Niedrich, 2008). After all of the prior evaluation,
there were no respondents removed as a result of deviations from the average response

105
time. The evaluation of the manipulations of this study followed a strict removal process
that better ensured the validity of the experimental process. Removing those respondents
that failed the manipulation checks using the Extreme method resulted in a sample size of
135 respondents, spread relatively equally across conditions. The sample size of 135 was
used to test the hypotheses. A breakdown of the demographics is listed below in Table
2.5.
Table 2.5. Main study participant demographics
Participant demographics (n = 135 salespeople) Variable Number Percent
Job Title
Salesperson 61 45.0
Sales Manager with accounts 50 37.0
Other type of sales professional with
accounts 24 18.0
Sales Experience
0-14 years 69 51.1
> 15 years 66 48.9
Company Sales Experience
1-9 years 91 67.0
10-19 years 31 23.0
> 20 years 13 10.0
Gender
Male 77 57.0
Female 58 43.0
Education
High School/GED 13 9.6
Some College 30 22.2
2-Year College Degree 24 17.8
4-Year College Degree 52 38.5
Graduate Degree 16 11.9
Industry
Service 79 59.4
Product 54 40.6

106
Table 2.5 continued
Commission % of Compensation
0-24% 64 48.1
25%-100% 69 51.9
The distribution of respondents across groups is listed in Table 2.6.
Table 2.6. Main study respondent per condition
Treatment Groups N = 135
PM-Mis 31
MP-Mis 39
PP-Align 31
MM-Align 34
To test the manipulations of the sales force compensation and pricing goals, two
separate one-way ANOVAs were performed using the variable created from the
manipulation items; one for checking the manipulation of the compensation strategy
(Manip_Ck_Compensation) and one for checking the manipulation of the pricing strategy
(Manip_Ck_Pricing). An ANOVA testing the compensation goal used
Manip_Ck_Compensation across the variable that represented all scenarios with a market
share compensation goal, Comp_Strat_MS. The difference in Manip_Ck_Compensation
was significant (≤ .001) across those conditions with a market share compensation
strategy and those without a market share compensation strategy (Comp_Strat_MS: M =
5.89, SD = 1.20; NOT_Comp_Strat_MS: M = 4.16, SD = 1.67; F = 48.908, p ≤ .001).
A one-way ANOVA was used to determine whether the variable representing
pricing goal manipulation called Manip_Ck_Pricing differed across scenarios where the
pricing goal was profit and where the pricing goal was not profit, using the variable
named Price_Strat_Profit. The difference across conditions was significant (≤ .001).

107
(Price_Strat_Profit: M = 6.06, SD = 1.20; NOT_Price_Strat_Profit: M = 4.60, SD = 1.72;
F = 61.82, p ≤ .001). The additional summary statement that was added to the end of each
scenario helped respondents clearly identify the goals for both the pricing and sales force
compensation strategies.
Realism Check
Similar to the pretest, the measure of the realism of the scenario that respondents
viewed had strong internal reliability; the Cronbach’s alpha was .80. A one-way
ANOVA was used to determine whether Realism differed across the two groups
represented by Alignment. There were no significant differences across conditions.
Once again, overall the participants found the scenario to be realistic (Aligned: M = 5.61,
SD = 1.29; Misaligned: M = 5.46, SD = 1.28; F = .51, p = .48).
Interpretation Check
The interpretation check was established to verify the attractiveness of the reward
in the scenario for achieving the sales force compensation goal. An ANOVA testing
whether participants who viewed the aligned conditions responded differently from the
participants exposed to the misaligned conditions was not statistically significant at a
level of ≤ .05. The one-way ANOVA used the variable for interpretation as the dependent
variable and Alignment as the independent variable. The interpretation check verifies that
across scenarios, the commission is not influencing one group more than any other
(Aligned: M = 5.15, SD = 1.56; Misaligned: M = 4.84, SD = 1.64; F = 1.61, p = .21).
Conflict Check
In the main study, participants were asked two conflict check items. The first
item (referred to as Conflict_Ck_a) was “To what degree do you feel the pricing goal in

108
the scenario is in conflict with the sales force compensation goal?” (0 = “not at all” to
100 = “completely”). The second item (referred to as Conflict_Ck_b) asked “Is the goal
of the pricing strategy in conflict with the goal of the sales force compensation strategy”
(1 = “strongly disagree” to 7 = “strongly agree”). A one-way ANOVA was used to
determine whether Conflict_Ck_a differed across the two Alignment groups. As
expected, the difference was significant (≤ .05) such that that those respondents who
viewed a misaligned condition responded on average greater than those respondents who
viewed an aligned condition (Aligned: M = 49.75, SD = 30.33; Misaligned: M = 60.14,
SD = 25.63; F = 5.57, p ≤ .05).
For the second goal conflict item, Conflict_Ck_b, respondents who experienced a
misaligned scenario rated conflict significantly higher (≤ .001) than respondents who
experienced a scenario with aligned goals (Aligned: M = 3.77, SD = 1.77; Misaligned: M
= 4.67, SD = 1.53; F = 13.56, p ≤ .001). Thus, the addition of the summary statement to
the scenario was effective in creating distinct and clear descriptions for the respondent.
Behavioral Intention
In the hypotheses section, the results will be presented that show a salesperson’s
intention to achieve goals was significantly higher for respondents that viewed an aligned
scenario than those respondents that had viewed a misaligned scenario.
Expectancy
During the pretest, the reverse-coded item included in the scale performed poorly
when included with the other items. For the main study, the four-item expectancy scale
produced a coefficient alpha of .92. Also for the main study, salesperson expectancy for
viewers of the aligned scenarios was significantly higher than from the respondents who

109
viewed the misaligned scenarios. The results for the hypothesis test involving expectancy
will be discussed further in the hypotheses section.
Instrumentality
After evaluating the pretest results, the decision was made to expand the number
of items (from 5 to 8 items) that represented salesperson instrumentality. The Cronbach’s
alpha coefficient of .82 for the instrumentality scale in the main study was well above the
recommended level of .70 (DeVellis, 1991; Eisinga, Grotenhuis, and Pelzer, 2012). The
multi-dimensionality of the eight-item Instrumentality scale is as follows: three items
representing monetary rewards (referenced as INST_Monet) and five items representing
performance recognition. The five items for performance recognition represented two
dimensions: internal performance recognition from within the organizational (two-item
measure referenced as Inst_Org_Rec) and external performance recognition from the
customer (three-item measure referenced as Inst_Org_Rec). All survey items used in the
main study appear in Appendix B.
Because of the changes made to the scale, tests performed to verify the
instrumentality scale used in the main study included: construct reliability, convergent
validity, discriminant validity, and nomological validity. Convergent validity of the
variables was performed using three tests: 1) the Eigenvalue check (rule > 1.00); 2) the
Average Variance Extracted (AVE) test (rule: > .50; and 3) construct reliability (rule: ≥
.70 is good, between .60-.69 is marginal) according to common guidelines (DeVellis,
1991; Nunnally and Bernstein, 1994). DeVillis (1991) and Nunnally et al. (1994) suggest
that lower values for exploratory constructs are acceptable. Convergent validity was
confirmed through results that show the variables within the instrumentality construct are

110
converging on the same concepts. The results for the tests of convergent validity can be
viewed in Table 2.7.
Table 2.7. PCA Convergent validity report
Customer_Facing
_Instrumentality INST_Monet Inst_Org_Rec
Eigenvalue 3.75 1.90 0.99
Check Pass Pass Fail
AVE 77.80 63.20 49.50
Test 2: Good Good Acceptable
Construct
Reliability 0.91 0.87 0.87
Test 3: Good Good Good
Discriminant validity determines if monetary reward items, customer facing
performance recognition items, and organizational recognition items are measuring
different concepts. According to Hair et al. (2010), one way to test discriminant validity
is to determine whether the average variance within the items is greater than the variance
the items share with other constructs: “the within variance extracted estimates should be
greater than the squared between correlation estimates,” (p. 688). The findings indicate
that monetary rewards, customer facing performance recognition, and organizational
performance recognition are measuring unique concepts. The correlation matrix and
squared correlation matrix can be viewed in Table 2.8. The squared correlations are
much less than the lowest AVE of 49.50.

111
Table 2.8. Discriminant validity test results
Nomological validity verifies that the items in the construct correlation matrix are
consistent with theory and logic. A check of the correlations among these variables was
performed and nomological validity was confirmed.
An internal reliability test was performed on the three items representing
monetary rewards. The coefficient alpha score was .74, and with the removal of
INST_Monet_c the alpha score improves to .76. This item was retained to maintain a
three-item scale. The internal reliability results for the internal performance recognition
from within the organization produced a coefficient alpha of .85. The variable
representing external performance recognition from the customer had a Cronbach’s alpha
of .90. The results for the hypothesis test involving instrumentality will be discussed
further in the hypotheses section.
Correlation
Matrix
Customer_Facing
_Instrumentality INST_Monet Inst_Org_Rec
Customer_Facing_
Instrumentality 1.00
INST_Monet 0.02 1.00
Inst_Org_Rec 0.52 0.26 1.00
Correlation
Matrix Squared
Customer_Facing
_Instrumentality INST_Monet Inst_Org_Rec
Customer_Facing_
Instrumentality 1.00
INST_Monet 0.00 1.00
Inst_Org_Rec 0.27 0.07 1.00
Discriminant
Validity Test
Customer_Facing
_Instrumentality INST_Monet Inst_Perf Org
Customer_Facing_
Instrumentality
INST_Monet Pass
Inst_Perf Org Pass Pass

112
Extrinsic Motivation
Expectancy theory maintains that extrinsic motivation exhibits a multiplicative
relation between expectancy and instrumentality. This research hopes to reconfirm that
relationship in the hypotheses section. The Cronbach’s alpha coefficient for the five-item
measure was .86. The internal reliability score increased to .89 with the removal of the
question “If I were in the situation described in the scenario, I would be strongly
motivated by the recognition I could earn from other people,” measured on a seven-point
scale (1)”strongly disagree” to (7) “strongly agree”.
A one-way ANOVA was performed with the four-item (averaged) extrinsic
motivation construct as the dependent variable and Alignment as the independent
variable. The results showed there was no significant (≤ .05) difference in the means of
the aligned and misaligned conditions (Aligned: M = 5.67, SD = 1.00) (Misaligned: M =
5.69, SD = 1.06) (F = .03, p = .88).
Control Variables
The six control variables used in the analysis included; sales experience, company
experience, gender, education, industry, and commission. Previous sales motivation
research suggested that gender, job experience, education, and industry may be related to
expectancy (Cron et al., 1988; Teas, 1981; Walker et al., 1977). The variables sales
experience, and commission (incentive compensation) have been suggested to be related
to instrumentality in previous research (Zoltners, Sinha, & Lorimer, 2012; Murphy &
Dacin, 1998). In Essay 1, the respondents would often talk about the pricing strategy in
relation to a specific product or service. Therefore, it was important to include the
variable, industry as it related to a salesperson selling a product or service. Additionally,

113
the respondents worked for a large number of industries, so a consolidation mechanism
was necessary. The 135 sales professionals were grouped based on industry and pay
portfolio (percent of current annual compensation that is commission).
The salesperson’s industry for 135 respondents yielded 97 different industries.
The 97 unique industries were evaluated based on what was being sold and the new
variable was coded Two_Category_Industry. In Essay 1, those in the insurance industry
sold a service and those in the automotive aftermarket sold products. In Essay 2, the
industries were similarly divided into those selling primarily products and those selling
primarily services. For example, the respondents that indicated restaurant equipment,
manufacturing, and wine and spirits were coded as products. In contrast, respondents
indicating insurance, banking, and rail freight transportation were coded as Services.
Previous salesperson motivation literature references the demographic variable that
delineates what the salesperson sells as products and services (Smith, Jones, & Blair,
2000). Two individuals working independently sorted the industries into the two groups
and then compared the results, resolving any differences via discussion.
The proportion of gender, industry (product, service), and percent of salary that is
commission per aligned and misaligned scenarios is displayed in Table 2.9.
Table 2.9. Proportion of control variables per condition
Condition (Goals)
Aligned MISaligned Total
Gender
Male 39 38 58
Female 26 32 77
Total 65 70 135
Table 2.9 continued

114
Industry Code
Services 39 40 79
Products 24 30 54
Total 63 70 133*
Two_Category_Commission
Smaller- < 25% 29 35 64
Larger- >25% 35 34 69
Total 64 69 133*
* Missing data
The variable that represented the percent of annual compensation that is
commission yielded 32 responses not including two missing data entries. Based on the
cumulative percent of the frequency distribution, nearly half of the respondents (48.1%)
reported a smaller percent of annual pay that was commission, which equated to 24% or
less, and the remaining respondents (51.9%) reported a larger percent of annual pay that
was commission, which equated to 25% -100%. The new item was coded
Two_Cat_Commission.
A further evaluation of the sample included computing ANOVAs to determine if
the variance in sales experience, company experience, education, and commission were
significantly different across aligned or misaligned scenarios. Company experience was
shown to be significantly different (≤ .05) for respondents across aligned and misaligned
scenarios. The results can be viewed in Table 2.10.

115
Table 2.10. Main study demographics
Pricing and Sales Force
Compensation Strategies
Aligned Misaligned df F sig.
Sales Experience
16.06
(11.66)
15.13
(10.25) 1 0.24 0.62
Company
Experience
9.51
(8.41)
6.74
(5.31) 1 5.30 0.02*
Education Level
4.28
(1.16)
4.14
(1.20) 1 0.42 0.52
Commission
42.59
(38.01)
36.16
(36.17) 1 0.99 0.32
* p ≤ .05
Values in parentheses are standard deviation.
Hypotheses Tests
A GLM analysis of variance was used to examine how the organization’s pricing
strategy affects the salesperson and test the hypotheses. The GLM method allowed
multiple independent categorical variables, as well as continuous dependent variables, to
be easily tested within the same model.
Hypothesis 1 Expectancy
H1a: When the goals of the pricing and sales force compensation strategy are
misaligned, the salesperson’s expectancy will be lower than when the goals are
aligned.
Hypothesis 1a examined the main effect of the two-level factor Alignment on the
dependent variable Expectancy. The variables gender and industry were used as
116
covariates. There was a significant main effect of this factor indicating that a lower level
of expectancy is associated with conditions of misalignment of the goals of the sales
force compensation and pricing strategies (Aligned: M = 5.27, SD = .94; Misaligned: M =
4.71, SD = 1.28; F = 7.33, p ≤ .01). Hypothesis 1a is supported.
H1b: When the goal of the sales force compensation strategy is profit
maximization and the goal of the pricing strategy is market share growth, the
salesperson’s expectancy will be lowest.
Hypothesis 1b predicted the lowest level of expectancy would be associated with
a specific configuration of pricing and sales force compensation goals—PM-Misalign.
Gender and industry were controlled for in this test. First, an overall main effect of the
type of scenario on expectancy was found to be significant (F = 3.90, p ≤ .01), so further
differences were tested across the pairs of scenarios. The results indicated that
respondents in the PM-Misalign condition exhibited the lowest expectancy (M = 4.38),
and the result was significantly different from MM-Align (M = 5.48, t = 3.27, p ≤ .001),
marginally significantly different from PP-Align (M = 4.97, t = 1.75, p = .08), but not
significantly different from MP-Misalign (M = 4.76, t = 1.23, ns). Hypothesis 1b is
partially supported.
Hypothesis 2 Instrumentality
Hypothesis 2a predicted the main effect of two-level factor Alignment on
dependent variable Instrumentality. This study included three measures of
instrumentality ( INST_Monet, Inst_Perf_Org, and Customer-Facing_Instrumentality).

117
There was no support for INST_Monet, or for Inst_Perf_Org differing across the aligned
and misaligned conditions. A follow up assessment focused only on the customer-facing
part of instrumentality, represented by two items: “if I achieve my sales goal I will be
viewed more favorably by my customers” and “if I achieve my sales goal I will have
fewer complaints from my customers.” An ANCOVA was performed with the variable
representing the two customer facing items as the dependent variable, and Alignment as
the independent variable, and the control variables were Two_Cat_Industry and
Two_Cat_Commission. The results were not significant. (Alignment: M = 4.12, SD =
1.63; Misaligned: M = 4.10, SD = 1.34; F = .20, p = .65). Hypothesis 2a was not
supported.
H2b. When the goal of the compensation strategy is market share growth and the
goal of the pricing strategy is profit maximization, the salesperson’s
instrumentality will be the weakest.
Hypothesis 2b predicted the weakest instrumentality would exist in a specific
configuration of pricing and sales force compensation goals—MP-Misalign
(compensation- market share, pricing- profit). First, an overall main effect of the type of
scenario on instrumentality was found to be significant (F = 3.47, p ≤ .05), so further
differences were tested across the pairs of scenarios. However, the results were not as
predicted. MP-Misalign (M = 4.15) was not significantly weaker than any of the pairs,
and in fact was marginally significantly stronger than the PP-Align in instrumentality (M
= 3.37, t = 1.92, p= .058). Additionally, PP-Align was significantly weaker than MM-

118
Align (M = 4.67, t = 3.20, p ≤ .01) and PM-Misalign (M = 4.21, t = 2.08, p ≤ .05).
Hypothesis 2b is not supported.
These are interesting results when evaluated with the findings comparing the
aligned conditions to the misaligned conditions (in H2a). The results suggest that the
pricing strategy was an interference factor in salesperson instrumentality. Apparently,
the salesperson operating in the aligned condition of MM-Align believes that he/she will
be perceived in a positive light by the customer since the prices are low. In contrast, in
the PP-Align (both profit) condition, the salesperson does not believe that he/she will be
perceived as well by the customers because the prices are high. The salesperson is aware
that the customer is not concerned with his/her commissions.
In the misaligned group, the internal pressures from the selling organization seem
to have created an interfering effect for the salesperson but not for his/her customer. In
the condition of PM-Mis (compensation-profit, pricing- market share), the salesperson
perceives that the recognition from the customers will be favorable as a result of the low
prices. The recognition from the customer will be less as a result of high prices in the
MP-Mis (market share-compensation strategy and profit – pricing goal) condition.
Conceptual nuances with regard to instrumentality are widespread in the literature and
like many prior studies (Cron et al. 1988 ;Murphy & Dacin, 1998;Gibson, 2008;Miao,
Lund, & Evans, 2009;Tyagi, 2010) this study also indicates that instrumentality remains
an area for further future research.
Hypothesis 3 Extrinsic motivation

119
H3: The interaction of the salesperson’s expectancy and instrumentality will be
positively related to the salesperson’s extrinsic motivation.
Hypothesis 3 suggests that extrinsic motivation is the product of an interaction
between expectancy and instrumentality. The results replicate the relationships found
among these variables in previous work (Extrinsic Motivation: M = 5.51, SD = 1.03; F =
30.813, p = ≤ .001). Hypothesis 3 is supported. See Table 2.11 for Hypothesis 3
results.
Table 2.11. Hypothesis 3 results- Extrinsic motivation
Hypothesis 4 Behavioral Intention
H4: When the goals of the pricing and sales force compensation strategy are
misaligned, the salesperson’s behavioral intention will be lower than when the
goals are aligned.
Sum of Squares df t F p value
Expectancy 12.22 1 4.39 19.27 ≤ .001
Instrumentality 7.01 1 3.32 11.05 ≤.001
Expectancy *
Customer_Facing_
Instrumentality 3.11 1 -2.22 4.91 0.03

120
Hypothesis 4 indicates that the two-level factor alignment will influence the
dependent variable behavioral intention. There was a significant main effect indicating
that salespeople with aligned goals of the pricing and sales force compensation strategy
have significantly higher intentions to strive to achieve the goals than do those
salespeople who have misaligned goals. This analysis included the control variables
Two_Cat_Industry and gender, neither of which was significantly related to behavioral
intention (Aligned: M = 80.46, SD = 15.34; Misaligned: M = 71.54, SD = 20.12; F =
7.22, p ≤ .05). Hypothesis 4 is supported.
In addition, the means for behavioral intention were significantly lower for the
misaligned scenarios than for the aligned scenarios. A one-way ANOVA was used to
determine whether differences in behavioral intention differed across the scenarios (F =
3.98, p ≤ .05). Results indicated behavioral intentions were significantly different. See
results for hypothesis 4 in Table’s 2.12 and 2.13.
Table 2.12. Hypothesis 4 results- Behavioral intention
Sum of Squares df F
p
value
Alignment 2379.12 1 7.22 ≤ .05
Industry_Code 2.12 1 0.006 0.94
Gender 32.76 1 0.1 0.75
Table 2.13. Hypothesis 4 - Behavioral intention across scenarios
Scenarios Mean SD
PM 73.82 15.52
MP 70.72 23.25
PP 74.12 16.38
MM 84.26 12.36
(F= 3.98, p ≤ .05)

121
Summary of Main Study Hypotheses Tests
A summary of the Main Study Hypotheses and test results is shown in Table 2.14.
Table 2.14. Summary of Main Study hypotheses and tests
DISCUSSION
Tests Results
Expectancy
H1aMisaligned goals negatively
impact salesperson
expectancies.
Main effect of
expectancy on
aligned and
misaligned goals
Supported
H1bPM scenario will have the
lowest salesperson
expectancies.
Main effect of
expectancy on the
scenarios
Partially supported. The respondents in
the PM-misaligned condition did have
the lowest expectancy (Mean= 4.38).
Significantly different from the aligned
conditions but not significantly different
from MP- misaligned.
Instrumentality
H2aMisaligned goals negatively
impact salesperson
instrumentality
Main effect of
instrumentality on
aligned and
misaligned goals
Not supported. The complex construct
has too many "reward elements"
(please the company, please the
customer, please thyself) to achieve
significance acrossed aligned or
misaligned goals.
MP-Weakest Instrumentality
H2b
MP scenario will have the
weakest salesperson
instrumentality
Main effect of
instrumentality on the
scenarios
Not supported. The complexity of
misaligned conditions is amplified by
the price issue in MP.
Extrinsic Motivation
H3
There will be an interaction
between expectancy and
instrumentality that will be
positively related to
extrinsic motivation
Two-way interaction
of expectancy and
instrumentality on
extrinsic motivation
Supported
Behavioral Intention
H4Misaligned goals negatively
impact salesperson
behavioral intention
Main effect of
misaligned goals on
salesperson
behavioral intention
Supported
Main study Hypotheses

122
This research provides three key findings for researchers and managers. First, the
results provide empirical evidence that pricing does in fact affect a salesperson’s
evaluation of required efforts. The salesperson evaluates the probability that a high level
of effort, time, and activity will lead to an improvement in their level of performance. If
the salesperson realizes that the firm’s pricing constrains his/her performance, the result
is a lower expectation that his/her efforts will yield an incremental increase in
performance. This finding is consistent with goal setting theory (Locke & Latham,
2002), which maintains that for difficult goals, expectancy of goal achievement is
“negatively related to performance” (p. 704).
Second, the findings of this research indicate that in conditions of misaligned
goals there is the likelihood that the salesperson will not try to achieve the goals. This
conflicts with sales force management literature which suggests that the more behavioral-
based the control system (salary and high managerial involvement) the more the
salesperson will pursue the goals of the company (Oliver & Anderson, 1994). Sales force
compensation strategies are not the only strategy that governs the efforts, intentions, and
behaviors of the sales force. The findings of this research indicate that pricing strategy
also influences behavior.
The third, finding is that occurrences of misaligned conditions are real and exist in
business today. Planning goal alignment is time consuming and difficult. Companies
may often find it much easier to price in response to customer demands and competitor
prices. Aligning goals is costly. Alignment would likely involve paying the salespeople
more on certain products than on others. Instead of constraining sales, alignment would
give the salesperson the option to accommodate the price sensitive customer as well as
123
the quality oriented customer. Alignment may involve changing a compensation program
as frequently as the pricing programs change. What is missing in marketing literature is
research that investigates the effects of a firms pricing strategy on salespeople. This study
is an initial effort to fill that gap.
The implications of this research for sales managers are a platform for more sales
support and for open dialogue about the effects of price on the behaviors of a salesperson.
Sales managers are measured on the performance of their sales force and therefore have a
vested interest in obtaining sales tools or creating a selling environment to promote sales.
Collaboration between the sales and marketing departments on pricing programs provides
an opportunity for the sales force to have ownership in the program prior to release. The
collaborative process will likely be perceived by the salespeople as supportive and the
outcome program will be viewed as a sales assistance program. When the sales force is
involved in the creation of a strategy in which they must implement, the perception of the
amount of expected effort required for an increased performance level will likely be
lower. When the sales manager comprehends the effects of misaligned goals then he/she
can be proactive in selecting performance measures for the sales force that directs efforts
towards the preferred goal and providing marketing with more realistic success
thresholds. Sales managers that have an understanding of the effects of misaligned goals
should re-evaluate failed programs to determine if goal misalignment was the cause.
Armed with the information of this study, sales managers can facilitate an open
dialogue with top managers about the relationship between pricing strategies and
salesperson behavior. Top managers expect salespeople to sell based on price. This
ubiquitous point of view prevents earnest conversations about pricing with the sales

124
force. Salespeople are often reluctant to mention price to top managers as to avoid the
reputation of being a salesperson that only sells based on (low) price. When the
salesperson is compensated on growing market share he/she will chose the products that
enable access to new customers or markets and those should be the low or competitively
priced items. When the salesperson is compensated on profit maximization he/she will
chose the products that offer the highest margins and can still be sold. Correcting
misaligned goals is actionable by managers, if they know what to look for.
CONCLUSION
In conclusion, the central thesis of this essay was supported—a firm’s pricing
strategy does affect the sales force. Further, the analysis confirmed support for the effects
of expectancy; specifically, in a condition when goals are misaligned a salesperson will
perceive lower expectancies than when goals are aligned.
The instrumentality hypotheses were not supported. When comparing conditions
where the pricing goal was market share growth the salespeople responded as
hypothesized: expectancy for the aligned goals MM-Align was higher than the condition
of misaligned goals PM-Mis. Unfortunately, that outcome did not hold true for the
conditions where the pricing goal was profit maximization. When the goal of the pricing
strategy was to maximize profits the salespeople perceived high instrumentality (link
between performance and reward) given a market share compensation goal. Perhaps the
salesperson was familiar with this scenario (MP). Salespeople have openly admitted to
marshaling company resources to offer the customer in an effort to offset higher prices. .

125
The work of expectancy theorists has once again been confirmed, in that
expectancy and instrumentality are positively related to extrinsic motivation. Knowing
how to predict extrinsic motivation is a valuable tool for supporting a sales force. Given
the direction of the outcomes for expectancy and goal conflict, the inference can be made
that aligned goals positively influence levels of extrinsic motivation. Most importantly
this research has produced results that show misaligned goals will lessen the intentions of
the sales force to commit to achieving the sales goal. This research has found support for
an important but often overlooked influencer of salesperson behavior, the firm’s pricing
strategy.
LIMITATIONS AND FUTURE RESEARCH
This study is subject to several limitations; those limitations related to the design
of this study provide future research opportunities. Although a benefit of this experiment
was the ability to isolate the goals of the pricing and sales force compensation strategies
and to test for predicted effects of the salesperson’s expectancy, instrumentality, and
behavioral intention; a weakness, of this and other experimental research is the inability
to replicate all of the elements that respondents experience in the selling environment.
Future research should use different research methods in order to represent other
variables potentially impacting the influence of pricing on the salesperson in selling
environments. Next, while the goal of this study was to capture the salesperson’s view
of the firm’s pricing strategy; single-source bias is a potential limitation. Future research
should combine self-reported data and objective data. Compared to a single-industry or a
single-organization design, this study more aptly casts a wide net to assess the effects of
aligned and misaligned goals on B2B salespeople. However, this study is limited to

126
respondents that sell in B2B markets with in the United States and therefore readers must
be cautioned as to the representativeness and the generalizability of the results across all
B2B markets. A deeper examination of global markets is required for future research.
A potential limitation of the respondents used in this study is the limited amount
of years as a sales professional with the current company. Most of the respondents, 67%,
have been selling for the current company for 1-9 years; however, the average total years
of selling experience is 15.6 years. Analysis using company sales experience as a control
variable was not significant. Future research may include personal variables in addition
to traits of the salesperson such as organizational commitment, locus of control, and
tolerance for ambiguity as these may impact behavioral intention (Teas, 1981; Singh,
1998). The main effect of goal alignment is not a statistically significant predictor of a
salesperson’s instrumentality. One potential cause may be the respondents’ limited years
of sales experience with the current company. Salespeople that have longer tenure with
the same company may have more confidence that an increase in their level of
performance will yield a particular reward. The results of this study should be checked
with a sample of salespeople that have substantially more years of experience with their
current company.
Moreover, the dimensions of instrumentality are complex. The instrumentality
construct includes the determination of a level of performance and a vast amount of
rewards which are intrinsic and extrinsic motivators of behavior towards the determined
level of performance. Rewards associated with intrinsic motivation include self-
fulfillment and status (Teas, 1981). In keeping with the scope of this study, the measures
of instrumentality adapted from Teas (1981), included achieving the sales goal and

127
rewards associated with extrinsic motivation. Respondent fatigue was a concern of this
study; however subsequent research should include a more exhaustive list of
instrumentality measures.
This study measures salespersons’ behavioral intention; although intention may
predict behavior (Ajzen, 1991); a degree of uncertainty regarding actual behavior still
remains when the salesperson is placed in the actual sales situation. Future research
should measure the effects of aligned and misaligned goals of the pricing and sales force
compensation strategies on specific sales force behaviors such as opening new accounts,
making proposals and presentations, and selling new product offerings.
Future research that emerges from this study should investigate the relationship
between salesperson perceived effort given aligned and misaligned goals. It is
anticipated that salespeople will perceive misaligned goals as more difficult therefore
require more effort to achieve. Findings of previous research have shown that difficult
goals positively influence selling effort (Fang et al., 2004). Finally, this study provides
the foundation for future research into the importance of the motivational effects of a
firm’s pricing strategy on sales performance.

128
References
Ajzen, I. (1991). Theory of Planned Behavior. Organizational Behavior and Human
Decision Processes, 50, 179-211.
Anderson, E., Fornell, C., & Lehmann, D. (1994). Customer Satisfaction, Market Share,
and Profitability: Findings from Sweden. Journal of Marketing, 58(3), 53-66.
Anderson, E. & Oliver, R. L. (1987). Perspectives on Behavior-Based Versus Outcome
Based Salesforce Control Systems. Journal of Marketing, 51(4), 76-88.
Amabile, T.M. (1993). Motivational synergy: Toward new conceptualizations of intrinsic
and extrinsic motivation in the workplace. Human Resource Management Review,
3(3), 185-201.
Amabile, T.M., Hill, K..G., Hennessey, B.A., & Tighe, E. M. (1994). The work
preference inventory: Assessing intrinsic and extrinsic motivational orientations.
Journal of Personality & Social Psychology, 66(5), 950-967.
Armitage, C. J. & Conner, M. (2001). Efficacy of the Theory of Planned Behaviour: A
Meta-analytic Review, British Journal of Social Psychology, 40(4), 471-499.
Bandura, A. (2001). Social Cognitive Theory: An Agentic Perspective. Annual Review of
Psychology, 52(1), 1-26.
Bandura, A. & Jourden, F. J. (1991). Self-Regulatory Mechanisms Governing the Impact
of Social Comparison on Complex Decision Making. Journal of Personality &
Social Psychology, 60(6), 945-951.
Behrman, D., & Perreault Jr., W. D. (1982). Measuring the Performance of Industrial
Salespersons. Journal of Business Research, 10, 355-370.
Broedlirig, L. A. (1975). Relationship of Internal- External Control to Work Motivation
and Performance in an Expectancy Model. Journal of Applied Psychology, 60(1),
65-70.
Burstin, K., Doughtie, E.B., & Raphaeli, V. (1980). Contrastive vignette technique: An
indirect methodology designed to address reactive social attitude measurement.
Journal of Applied Social Psychology, 10(2). 147-165.
Cheng, M. M., Luckett, P.F. & Mahama, H. (2007). Effect of Perceived Conflict amount
Multiple Performance Goals and Goal Difficulty on Task Performance.
Accounting & Finance, 47(2), 221-242.
Chiang, C., Jang, S.S., Canter, D., & Prince, B. (2008). An Expectancy Theory Model for
Hotel Employee Motivation: Examining the Moderating Role of Communication

129
Satisfaction. International Journal of Hospitality & Tourism Administration, 9(4),
327-351.
Chowdhury, J. (1993). The Motivational Impact of Sales Quotas on Effort. Journal of
Marketing Research, 30(1), 28-41.
Committee on Communication for Behavior Change in the 21st Century. (2002).
Speaking of Health: Assessing Health Communication Strategies for Diverse
Populations, Washington DC. National Academies Press.
Cravens, D. W., Ingram, T. N., LaForge, R.W., & Young, C. E. (1993). Behavior-Based
and Outcome-Based Salesforce Control Systems. Journal of Marketing, 57(4), 47-
59.
Cron, W. L., Dubinsky, A. J., & Michaels, R. E. (1988). The Influence of Career Stages
on Components of Salesperson Motivation. Journal of Marketing, 52(1), 78-92.
Dahl, L., Brimacombe, C., & Lindsay, D. (2009). Investigating Investigators: How
Presentation Order Influences Participant-Investigators’ Interpretations of
Eyewitness Identification and Alibi Evidence. Law & Human Behavior, 33(5),
368-380.
Darley, W. K. & Lim, J. (1993). Assessing Demand Artifacts in Consumer Research: An
Alternative Perspective. Journal of Consumer Research, 20(3), 489-495.
DelVecchio, S. & Wagner, J. (2011). Motivation and Monetary Incentives: A Closer
Look. Journal of Management & Marketing Research, 7, 1-13.
DeVellis, R. F. (1991). Scale Development: Theory and Applications. Newbury Park,
CA: Sage Publications.
Diamantopoulos, A., Reynolds, N., & Schlegelmilch, B. (1994). Pretesting in
Questionnaire Design: the Impact of Respondent Characteristics on error
detection. Journal of Market Research Society. 36(4), 295-313.
Dutta, S., Biswas, A., & Grewal, D. (2007). Low Price Signal Default: An Empirical
Investigation of its Consequences. Journal of Academy of Marketing Science,
35(1), 76-88.
Eisenhardt, K. M. (1989). Agency Theory: An Assessment and Review. Academy of
Management Review, 14(1), 57-74.
Eisinga, R., Grotenhuis, M. T., & Pelzer, B. (2012). The Reliability of a Two-item Scale:
Pearson, Cronbach, or Spearman-Brown? International Journal of Public Health,
(Oct).

130
Evans, K. R., Margheim, L., & Schlacter, J. L. (1982). A Review of Expectancy Theory
Research in Selling. Journal of Personal Selling & Sales Management, 2(2), 33-
40.
Fang, E., Palmatier, R. W., & Evans, K. R. (2004). Goal-Setting Paradoxes? Trade-Offs
Between Working Hard and Working Smart: The United States versus China.
Journal of the Academy of Marketing Science, 32(2), 188-202.
Gibson, L. (2008). In Defense of Instrumentality. Cultural Trends, 17(4), 247-257.
Hair Jr., J.F., Black, W. C., Babin, B. J., & Anderson, R.E. (2010). Multivariate Data
Analysis. Upper Saddle River, NJ, Prentice Hall.
Hirschfeld, R.R., Schmitt, L. P., & Bedeian, A. G. (2002). Job-content Perceptions,
Performance-reward Expectancies, and Absenteeism among Low-wage Public-
Sector Clerical Employees. Journal of Business and Psychology, 16(4).
Holden R. K. & Nagle, T.T. (1998). Kamikaze Pricing. Marketing Management, 7(2),
30-39.
Homburg, C., Jensen, O., & Krohmer, H. (2008). Configurations of Marketing and Sales:
A Taxonomy. Journal of Marketing, 72(2), 133-154.
Homburg, C., Jensen, O., & Hahn, A. (2012). How to Organize Pricing? Vertical
Delegation and Horizontal Dispersion of Pricing Authority. Journal of Marketing,
76(5), 49-69.
Jaramillo, F., & Mulki, J. M. (2008). Sales Effort: The Intertwined Roles of the Leader,
Customers, and the Salesperson. Journal of Personal Selling & Sales
Management, 28(1), 37-51.
Kerlinger, F. N. (1972). The Structure and Content of Social Attitude Referents: A
Preliminary Study, Educational and Psychological Measurement, 32(3), 613-630.
Küster, I., & Canales, P. (2011). Compensation and Control Sales Policies, and Sales
Performance: the Field Sales Manager’s Points of View. Journal of Business &
Industrial Marketing, 26(4), 273-285.
Lancioni, R., & Gattorna, J. (1993). Pricing for profit. Management Research News,
16(7), 1-4.
Lee, C., Bobko, P., Earley, C. P., & Locke, E. A. (1991). An Empirical Analysis of Goal
Setting Questionair. Journal of Organizational Behavior, 12(6), 467-482.
Liccione, W. J. (2007). A Framework for Compensation Plans with Incentive Value.
Performance Improvement, 46(2), 16-21.

131
Locke, E. A., & Latham, G. P. (2002). Building a Practically Useful Theory of Goal
Setting and Task Motivation: A 35 Year Odyssey. American Psychologist, 57(9),
705-717.
Locke, E.A., Motowidlo, S. J., & Bobko, P. (1986). Using Self-Efficacy Theory to
Resolve the Conflict Between Goal-Setting Theory and Expectancy Theory in
Organizational Behavior and Industrial/Organizational Psychology. Journal of
Social and Clinical Psychology, 4(3). 328-338.
Locke, E. A., Smith, K. G., Erez, M., Dong-Ok, C., & Schaffer, A. (1994). The Effects of
Intra-Individual Goal Conflict on Performance. Journal of Management, 20(1),
67-91.
Mahajan, J., Churchill Jr, G.A., Ford, N.M., & Walker Jr, O. C. (1984). A Comparison of
the Impact of Organizational Climate on the Job Satisfaction of Manufacturers’
Agents and Company Salespeople: An Exploratory Study. Journal of Personal
Selling & Sales Management, 4(1), 1-10.
Mallin, M. L. & Pullins, E. B. (2008). The Moderating Effect of Control Systems on the
Relationship Between Commission and Salesperson Intrinsic Motivation in a
Customer Oriented Environment. Industrial Marketing Management, 38(2009),
769-777.
Miao, F. C., Lund, D. J., & Evans, K. R. (2009). Reexamining the Influence of Career
Stages on Salesperson Motivation: A Cognitive and Affective Perspective.
Journal of Personal Selling & Sales Management, 29(3), 243-255.
Murphy, W.H., & Dacin, P. A. (1998). Sales Contests: A Research Agenda. Journal of
Personal Selling & Sales Management, 18(1), 1-16.
Nagle, T. & Cressman Jr, G. E. (2002). Don’t Just Set Prices, Manage Them. Marketing
Management, 11(6), 29-33.
Nunnally, J. C. (1978). Psychometric Theory. New York: McGraw-Hill.
Nunnally, J. C., & Bernstein, I. H. (1994). Psychometric Theory (3rd
ed.). New York:
McGraw-Hill Book Company.
Oliver, R. L. (1974). Expectancy Theory Predictions of Salesmen's Performance. Journal
of Marketing Research, 11(3), 243-253.

132
Oliver, R. L., & Anderson, E. (1994). An Empirical Test of the Consequences of
Behavior- and Outcome-Based Sales Control Systems, Journal of Marketing,
58(4), 53-67.
Palazon, M., & Delgado-Ballester, E. (2009). Effectiveness of Price Discounts and
Premium Promotions. Psychology & Marketing, 26(12), 1108-1129.
Perdue, B. C. & Summers, J. O. (1995). Checking the Success of Manipulations in
Marketing Experiments. Journal of Marketing Research, 23(4), 317-326.
Peters, L. H. (1977). Cognitive Models of Motivation, Expectancy Theory and Effort: An
Analysis and Empirical Test. Organizational Behavior & Human Performance,
20(1), 129-148.
Pinsker, R. (2011). Primacy or Recency? A Study of Order Effects When
Nonprofessional Investors are Provided a Long Series of Disclosures. Behavioral
Research in Accounting, 23(1), 161-183.
Pritchard, R.D. & DeLeo, P.J. (1973). Experimental Test of the Valence-Instrumentality
Relationship in Job Performance. Journal of Applied Psychology, 57(3), 264-270.
Pritchard, R. D., & Sanders, M. S. (1973). The Influence of Valence, Instrumentality, and
Expectancy on Effort and Performance. Journal of Applied Psychology, 57(1), 55-
60.
Ramaswamy, V., Gatignon, H., & Reibstein, D. (1994). Competitive Marketing Behavior
in Industrial Markets. Journal of Marketing, 58(2), 45-55.
Schmidt, A. M., & Dolls, C. M. (2009). Something’s Got to Give: The Effects of Dual-
Goal Difficulty, Goal Progress, and Expectancies on Resource Allocations.
Journal of Applied Psychology, 94(3), 678-691.
Schwalbach, J. (1991). Profitability and Market Share: A Reflection on the Functional
Relationship. Strategic Management Journal, 12(4), 299-306.
Sethuraman, R. & Tellis, G. J. (1991). An Analysis of the Tradeoff Between Advertising
and Price Discounting. Journal of Marketing Research, 28(2), 160-174.
Sheth, J. N. & Sisodia, R. S. (2002). The Rule of Three: Surviving and Thriving in
Competitive Markets. New York, The Free Press.
Sims Jr., H. P., Szilagyi, A.D., & McKemey, D. R. (1976). Antecedents of Work Related
Experiences. Academy of Management Journal, 19(4), 547-559.

133
Singh, J. (1998). Striking a Balance in Boundary-Spanning Positions: An Investigation of
Some Unconventional Influences of Role Stressors and Job Characteristics on Job
Outcomes of Salespeople. Journal of Marketing, 62(3), 69-86.
Smith, B.D. (2009). Maybe I will, Maybe I Won’t: What the Connected Perspectives of
Motivation Theory and Organizational Commitment May Contribute to our
Understanding of Strategy Implementation. Journal of Strategic Marketing, 17(6),
473-485.
Smith, K., Jones, E., & Blair, E. (2000). Managing Salesperson Motivation in a Territory
Realignment. The Journal of Personal Selling & Sales Management, 20(4), 214-
226.
Teas, R. K. (1981). An Empirical Test of Models of Salespersons' Job Expectancy and
Instrumentality Perceptions. Journal of Marketing Research, 18(2), 209-226.
Teas, R. K., & McElroy, J. C. (1986). Casual Attributions and Expectancy Estimates: A
Framework for Understanding the Dynamics of Salesforce Motivation. Journal of
Marketing, 50(1), 75-86.
Tellis, G. J. (1986). Beyond the Many Faces of Price: An Integration of Pricing
Strategies. Journal of Marketing, 50(4), 146-160.
Trotman, K. T., & Wright, A. (2000). Order Effects and Recency: Where Do We Go
From Here? Accounting and Finance, 40, 169-182.
Tyagi, P. K. (1982). Perceived Organizational Climate and the Process of Salesperson
Motivation. Journal of Marketing Research, 19(2), 240-254.
Tyagi, P. K. (2010). Expectancy Theory and Social Loafing in Marketing Research
Group Projects. The Business Review, 14(2), 22-27.
Wagner, T., Hennig-Thurau T., & Rudolph, T. (2009). Does Customer Demotion
Jeopardize Loyalty? Journal of Marketing, 73(3), 69-85.
Walker Jr, O. C., Churchill Jr, G.A., & Ford, N. M. (1977). Motivation and Performance
in Industrial Selling - Present Knowledge and Needed Research. Journal of
Marketing Research, 14(2), 156-168.
Wang, G. & Netemeyer, R. G. (2002). The Effects of Job Autonomy, Customer
Demandingness, and Trait Competitiveness on Salesperson Learning, Self-
Efficacy, and Performance. Journal of Academy of Marketing Science, 30(3),
217-228.
Wason, K.D., Polonsky, M.J., & Hyman, M.R. (2002). Designing vignette studies in
marketing, Australasian Marketing Journal, 10(3), 41-58.

134
Vroom, V. (1964). Work and Motivation. New York. Wiley.
Weinberg, C. B. (1975). An Optimal Commission Plan for Salesmen's Control Over
Price. Management Science, 21(8), 937-943.

135
APPENDIX A
Essay 1: Exploratory Interviews—Protocol
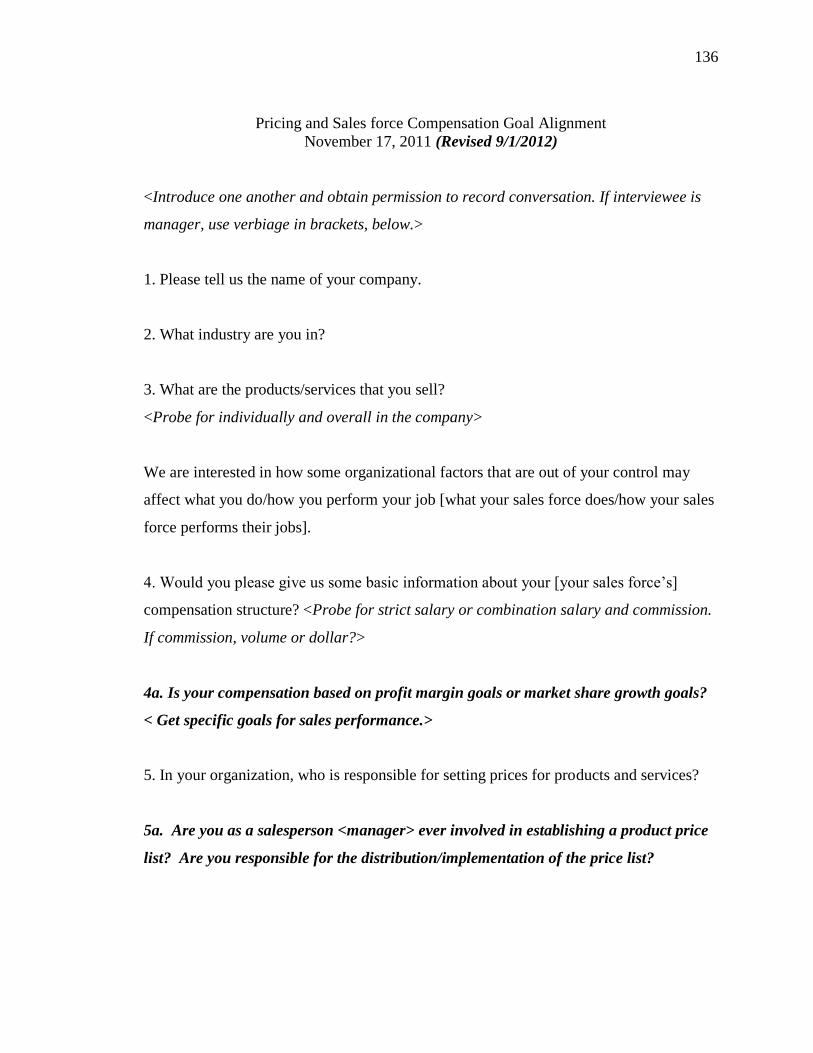
136
Pricing and Sales force Compensation Goal Alignment
November 17, 2011 (Revised 9/1/2012)
<Introduce one another and obtain permission to record conversation. If interviewee is
manager, use verbiage in brackets, below.>
1. Please tell us the name of your company.
2. What industry are you in?
3. What are the products/services that you sell?
<Probe for individually and overall in the company>
We are interested in how some organizational factors that are out of your control may
affect what you do/how you perform your job [what your sales force does/how your sales
force performs their jobs].
4. Would you please give us some basic information about your [your sales force’s]
compensation structure? <Probe for strict salary or combination salary and commission.
If commission, volume or dollar?>
4a. Is your compensation based on profit margin goals or market share growth goals?
< Get specific goals for sales performance.>
5. In your organization, who is responsible for setting prices for products and services?
5a. Are you as a salesperson <manager> ever involved in establishing a product price
list? Are you responsible for the distribution/implementation of the price list?
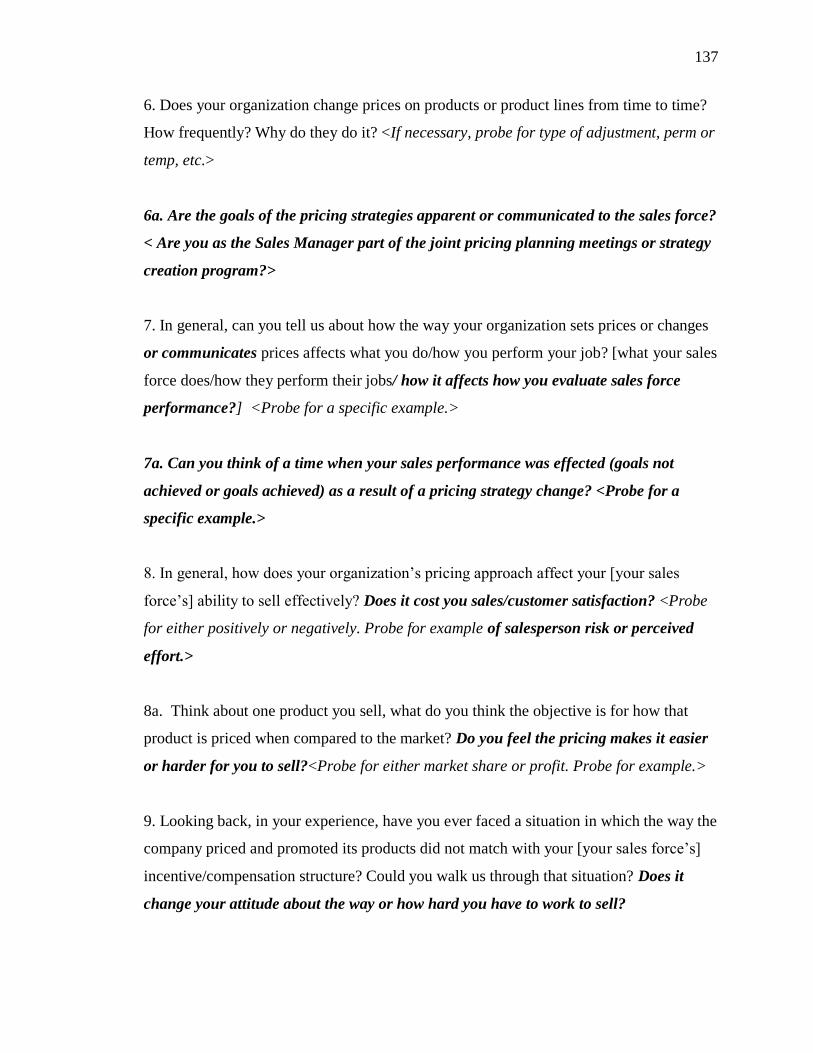
137
6. Does your organization change prices on products or product lines from time to time?
How frequently? Why do they do it? <If necessary, probe for type of adjustment, perm or
temp, etc.>
6a. Are the goals of the pricing strategies apparent or communicated to the sales force?
< Are you as the Sales Manager part of the joint pricing planning meetings or strategy
creation program?>
7. In general, can you tell us about how the way your organization sets prices or changes
or communicates prices affects what you do/how you perform your job? [what your sales
force does/how they perform their jobs/ how it affects how you evaluate sales force
performance?] <Probe for a specific example.>
7a. Can you think of a time when your sales performance was effected (goals not
achieved or goals achieved) as a result of a pricing strategy change? <Probe for a
specific example.>
8. In general, how does your organization’s pricing approach affect your [your sales
force’s] ability to sell effectively? Does it cost you sales/customer satisfaction? <Probe
for either positively or negatively. Probe for example of salesperson risk or perceived
effort.>
8a. Think about one product you sell, what do you think the objective is for how that
product is priced when compared to the market? Do you feel the pricing makes it easier
or harder for you to sell?<Probe for either market share or profit. Probe for example.>
9. Looking back, in your experience, have you ever faced a situation in which the way the
company priced and promoted its products did not match with your [your sales force’s]
incentive/compensation structure? Could you walk us through that situation? Does it
change your attitude about the way or how hard you have to work to sell?

138
10. How well was this problem understood or acknowledged by management [across the
firm]? <Probe for what was considered as the source(s) of the problem. Probe further as
to whether mis-match between pricing and compensation was considered a source.>
11. When you look at product pricing, how does price affect the amount of effort you
have [your sales force has] to expend to sell a product successfully? <Probe for
circumstances under which this happen; if manager, how it affects him/her.>
12. How does the pricing approach of your organization affect your [your sales force’s]
motivation to sell/perform? <Probe for specific example.>
OR
13. Can you tell me about time when you felt any more or less motivated to sell/perform
by price structure, price changes, or other things out of your control? <If no, probe for
anyone else in the firm.>
13a. When you look at product pricing, how does price affect the amount of customer
satisfaction you have established [your sales force has] to sell a product successfully?
<Probe for circumstances under which this happen; if manager, how it affects
him/her.>
13b. When you look at product pricing, does it require you to find and offer additional
service items to your customers to offset prices enabling you [your sales force] to sell a
product successfully? <Probe for circumstances under which this happen; if manager,
how it affects him/her or the costs to the firm.>
13c. In your opinion, is your product pricing communicated effectively (of high
quality- timely, easy to understand) to your customers (and maybe your competitors)?
Is your product pricing communicated effectively (of high quality- timely, easy to
understand) to you and the rest of the sales force? <Probe for circumstances under
which both effect and non-effective communication happens; if manager, how it
affects him/her.>

139
14. Who sets your [your sales force’s] compensation plan? Does it change? How often?
15. How satisfied are you with the way your [your sales force’s] compensation plan is
structured? Is it a fair structure? How effective do you think it is? Does it motivate you to
increase your sales/open new customers/only sell high margined product? <If
manager,probe for how this affects their job performance, ease of doing their job, etc.>
16. Any final comments or questions?
<Conclude and thank.>

140
APPENDIX B
Essay 2: Pretest and Main Study Instruments

141
Pricing and Sales Force Compensation
Thank you for agreeing to participate in this survey. You must be at least 21
years of age or older to participate in this study. The goal of this study is to develop a
better understanding of selling strategies. Your participation is strictly voluntary. You
may opt out of the survey at any time with no penalty.
You will not be identified in any way. Responses will be combined for all
participants and studied only in the aggregate. All of the information that you provide is
strictly confidential.
Your voluntary participation and candid responses are vital to the study. The
questionnaire should take approximately 15 to 20 minutes to complete. Instructions are
provided for each section of the questionnaire.
Thank you very much for your assistance!
Participation:
_ I agree and give my consent to participate in this research project. I understand
that participation is voluntary and that I may withdraw my consent at any time without
penalty.
_ I do not agree to participate and will be excluded from the remainder of the
questions.
If the participant chooses NOT to agree, then the participant is skipped to the end
of the survey.
Qualifier questions:
Q#1. What best describes your current job? (Salesperson, Sales Manager with account
responsibility, Sales Manager with no accounts, VP of Sales, other type of sales
professional with account responsibility, other type of sales professional without account
responsibility).
If Sales Manager with no accounts, VP of Sales, and other type of sales professional
without account responsibility are chosen- then the participant is skipped to the end of
the survey.
Q#2. Do you sell in Business to Business markets? (yes, no)
If no is selected then the participant is skipped to the end of the survey.

142
Scenario
Please read the short scenario that follows and place yourself in the situation described in
the scenario. Responding to the survey will take 15-20 minutes of your time. This same
scenario will appear two more times during the survey. You can refer back to the
scenario throughout the survey.
Scenario Version PM
You work for a company that just announced their goals for the year. You are a
sales professional for this company, and your customer base includes manufacturers and
distributors. You are responsible for the complete sales cycle which includes obtaining
and conveying market and product information, completing sales reports, and
maintaining customer relationships. The Marketing Department is responsible for
advertising, promoting, and pricing all of the products you sell.
You just found out that your sales goal for the year is to increase the profit
margin for sales of a product line in your territory by 3%. For this fiscal year, your
commission will increase by an additional 3% on total monthly sales when you achieve
your new goal of increased profit margin. There is no earnings cap. Based on last year’s
pricing structure you know you will have to increase your sales of this product line
significantly in the coming year in order to receive the extra commission. However, you
also just learned that the Marketing Department has communicated to the market a
“fighting” product pricing strategy with lower prices for the same product line in
order to gain market share. Marketing has indicated that the lower prices are in effect
for at least a year.
Scenario Version MP
You work for a company that just announced their goals for the year. You are a
sales professional for this company, and your customer base includes manufacturers and
distributors. You are responsible for the complete sales cycle which includes obtaining
and conveying market and product information, completing sales reports, and
maintaining customer relationships. The Marketing Department is responsible for
advertising, promoting, and pricing all of the products you sell.
You just found out that your sales goal for the year is to increase the market
share for sales of a product line in your territory by 3%. For this fiscal year, your
commission will increase by an additional 3% on total monthly sales when you achieve
your new goal of increased market share. There is no earnings cap. Based on last year’s
pricing structure you know you will have to increase your sales of this product line
significantly in the coming year in order to receive the extra commission. However, you
also just learned that the Marketing Department has communicated to the market a
“premium” product pricing strategy with higher prices for the same product line in

143
order to maximize profits. Marketing has indicated that the higher prices are in effect
for at least a year.
Scenario Version PP
You work for a company that just announced their goals for the year. You are a
sales professional for this company, and your customer base includes manufacturers and
distributors. You are responsible for the complete sales cycle which includes obtaining
and conveying market and product information, completing sales reports, and
maintaining customer relationships. The Marketing Department is responsible for
advertising, promoting, and pricing all of the products you sell.
You just found out that your sales goal for the year is to increase the profit
margin for sales of a product line in your territory by 3%. For this fiscal year, your
commission will increase by an additional 3% on total monthly sales when you achieve
your new goal of increased profit margin. There is no earnings cap. Based on last year’s
pricing structure you know you will have to increase your sales of this product line
significantly in the coming year in order to receive the extra commission. However, you
also just learned that the Marketing Department has communicated to the market a
“premium” product pricing strategy with higher prices for the same product line in
order to maximize profits. Marketing has indicated that the higher prices are in effect
for at least a year.
Scenario Version MM
You work for a company that just announced their goals for the year. You are a
sales professional for this company, and your customer base includes manufacturers and
distributors. You are responsible for the complete sales cycle which includes obtaining
and conveying market and product information, completing sales reports, and
maintaining customer relationships. The Marketing Department is responsible for
advertising, promoting, and pricing all of the products you sell.
You just found out that your sales goal for the year is to increase the market
share for sales of a product line in your territory by 3%. For this fiscal year, your
commission will increase by an additional 3% on total monthly sales when you achieve
your new goal of increased market share. There is no earnings cap. Based on last year’s
pricing structure you know you will have to increase your sales of this product line
significantly in the coming year in order to receive the extra commission. However, you
also just learned that the Marketing Department has communicated to the market a
“fighting” product pricing strategy with lower prices for the same product line in
order to gain market share. Marketing has indicated that the lower prices are in effect
for at least a year.
Survey

144
Please reflect on the scenario that you just read when answering the following questions.
Select the response that best represents how you feel based on the scenario. Use a scale
ranging from (1) “strongly disagree” to (7) “strongly agree”.
Manipulation check
1. In the scenario, the goal of the sales force compensation strategy is to increase
market share.
2. In the scenario, the goal of the pricing strategy is to maximize profits.
Realism check (α= .813)
3. I can imagine a company actually implementing the initiatives described in the
scenario.
4. The sales situation described in the scenario likely occurs in business today.
Interpretation check
5. Based on the scenario, the potential 3 percent increase in my commission is __.
(1) “very unattractive” to (7) “very attractive”
Please consider the scenario and slide the bar to reflect your response to the following
questions. Use your cursor to slide the bar from (0) “not at all” to (100) “a lot”.
Conflict check
6. To what degree do you feel the pricing goal in the scenario is in conflict with the
sales force compensation goal?
Behavioral intention (α= .759)
7. If you were in the situation described in the scenario, to what degree would you
try to achieve the pricing goal?
8. If you were in the situation described in the scenario, to what degree would you
try to achieve the sales force compensation goal?
Consider the scenario when you respond to the following questions. Indicate the
response that best represents your feelings about the statement on the scale ranging from
(1) “strongly agree” to (7) “strongly disagree”.
Instrumentality (α= .604; but α= .779 if Q15.3 and Q15.4 only)

145
9. Based on the information in the scenario, if I meet my sales goal my commission
will increase by an additional 3 percent this year.
10. Based on the information in the scenario, reaching my sales goal will result in
earning my commission.
11. Based on the information in the scenario, if I achieve my sales goal I will be
viewed more favorably by my manager.
12. Based on the information in the scenario, if I achieve my sales goal I will attain
more prestige within my organization.
13. Based on the information in the scenario, if I achieve my sales goal I will be
viewed more favorably by my customers.
Consider the scenario when you respond to the following questions. Indicate the
response that best represents your feelings about the statement on the scale ranging from
(1) “strongly disagree” to (7) “strongly agree”.
Extrinsic motivation (α= .864)
14. If I were in the situation described in the scenario, the extra money that I could
earn from achieving the sales goal would strongly motivate my efforts.
15. If I were in the situation described in the scenario, I would be keenly aware of the
income rewards available to me.
16. If I were in the situation described in the scenario, I would be strongly motivated
by the recognition I could earn from other people.
17. The situation described in the scenario would provide an opportunity for me to
show others how well I can perform in my job.
18. If I were in the situation described in the scenario, the extra commission I could
earn would make me work harder to achieve my sales goal.
Consider the scenario when you respond to the following questions. Indicate the
response that best represents your feelings about the statement on the scale ranging from
(1) to (7).
Expectancy (α= .843 with reverse coded item)
19. Given the scenario, I would estimate my chances of success in achieving the
assigned sales goal to be _____. (1 = very poor, 7 = excellent)

146
20. Based on the scenario, performing my duties as well as I am capable would result
in reaching my sales goal. (1=strongly disagree, 7=strongly agree).
21. Given the scenario, it would be unlikely that my efforts would enable me to
achieve the goal for this product line. (1=strongly disagree, 7=strongly agree).(R)
22. Given the scenario, the probability that I would be able to achieve the necessary
increase in sales would be _____. (1= very low, 7=very high)
23. Given the scenario, achieving the sales goal would be____. (1= highly unlikely,
7= highly likely)
The following questions are about your current job and your feelings based on your
selling experience. Indicate the response that best represents your feelings about the
statement on the scale ranging from (1) “strongly agree” to (7) “strongly disagree”.
Demographics
The following questions are about your current job and your experience. Please insert or
select the appropriate response.
24. How many years of experience do you have as a sales professional? (fill in the
blank)
25. How many years have you worked in sales at your current company? (fill in the
blank)
26. What is your gender? (male, female)
27. What is the highest level of education you have completed? (Less than high
school, High School/GED, Some college, 2-year College Degree, 4-year College
Degree, Graduate Degree)
28. What industry do you sell in? (fill in the blank)
29. What percent of your total compensation is commission? (fill in the blank)

147
Main Study Instrument
Pricing and Sales Force Compensation
Scenario Version PM (Other scenarios were changed in the same manner)
Please read the short scenario that follows and place yourself in the situation
described. Responding to the survey will take 15-20 minutes of your time. This same
scenario will appear two more times during the survey for your reference.
You work for a company that just announced their goals for the year. You are a
sales professional for this company, and your customer base includes manufacturers and
distributors. You are responsible for the complete sales cycle which includes obtaining
and conveying market and product information, completing sales reports, and
maintaining customer relationships. The Marketing Department is responsible for
advertising, promoting, and pricing all of the products you sell.
You just found out that your sales goal for the year is to increase the profit
margin for sales of a product line in your territory by 3%. If you do this, your
commission will increase by an additional 3% on total monthly sales. There is no
earnings cap. Based on last year’s pricing structure you know you will have to increase
your sales of this product line significantly in the coming year in order to receive the
extra commission. However, you also just learned that the Marketing Department has
communicated to the market a “fighting” product pricing strategy with lower prices
for the same product line in order to gain market share. These lower prices are in
effect for at least a year.
In summary, the goal of the sales force compensation strategy is to maximize
profits and the goal of the pricing strategy is to increase market share.
Survey
Please reflect on the scenario that you just read when answering the following questions.
Select the response that best represents how you feel based on the scenario. Use a scale
ranging from (1) “strongly disagree” to (7) “strongly agree”.
Manipulation check
1. In the scenario, the goal of the sales force compensation strategy is to increase
market share. (F=11.31, p ≤ .001)
2. In the scenario, the goal of the pricing strategy is to maximize profits.
(F=13.99, p ≤ .001)

148
Realism check (α =.78)
3. I can imagine a company actually implementing the initiatives described in
the scenario.
4. The sales situation described in the scenario likely occurs in business today.
Interpretation check
5. Based on the scenario, the potential 3 percent increase in my commission is
__. (1) “very unattractive” to (7) “very attractive”
Please consider the scenario and slide the bar to reflect your response to the following
questions. Use your cursor to slide the bar from (0) “not at all” to (100) “completely”.
Conflict check
6. To what degree do you feel the pricing goal in the scenario is in conflict with
the sales force compensation goal? (F=5.85, p ≤ .05)
7. In the scenario, the goal of the pricing strategy is in conflict with the goal of
the sales force compensation strategy. (1) “strongly disagree” to (7) “strongly
agree” (F=12.08, p ≤ .001)
Behavioral intention (α= .71)
8. If you were in the situation described in the scenario, to what degree would
you try to achieve the pricing goal?
9. If you were in the situation described in the scenario, to what degree would
you try to achieve the sales force compensation goal?
Please reflect on the scenario you just read when you are answering the following
questions. Check the response that best represents how you feel about the question.
Expectancy (α=.93)
10. Given the scenario, I would estimate my chances of success in achieving the
assigned sales goal to be_____. (1= very poor, 7 = excellent)
11. Based on the scenario, performing my duties as well as I am capable would
result in reaching my sales goal. (1=strongly disagree, 7=strongly agree)
12. Given the scenario, the probability that I would be able to achieve the
necessary increase in sales would be _____. (1= very low, 7=very high)

149
13. Given the scenario, achieving the sales goal would be____. (1= highly
unlikely, 7= highly likely)
Instrumentality (α=.83) Monetary reward. (Eigenvalue 1.46) (α= .74)
14. Based on the information in the scenario, if I meet my sales goal my
commission will increase by an additional 3 percent this year. Factor .87
15. Based on the information in the scenario, reaching my sales goal will result in
an increase in commission. Factor .90
16. Based on the information in the scenario, if I reach my sales goal my overall
pay will increase. Factor .71
Performance recognition—internal (organizational recognition) and external
(customer facing recognition) (5 items: Eigenvalue 3.75, α=.89)
17. Based on the information in the scenario, if I achieve my sales goal I will be
viewed more favorably by my manager. Factor .73
18. Based on the information in the scenario, if I achieve my sales goal I will
attain more prestige within my organization. Factor .80
Performance recognition--External Customer_Facing_Instrumentality (3
items: Eigenvalue 3.45, α =.90, M = 4.14)
19. Based on the information in the scenario, if I achieve my sales goal I will be
viewed more favorably by my customers. Factor .80
20. Based on the information in the scenario, if I achieve my sales goal I will have
fewer complaints from my customers. Factor .93
21. Based on the information in the scenario, achieving my sales goal, will result
in better working relationships with my customers. Factor .834
Extrinsic motivation (α= .88)
22. If I were in the situation described in the scenario, the extra money that I
could earn from achieving the sales goal would strongly motivate my efforts.
23. If I were in the situation described in the scenario, I would be keenly aware of
the income rewards available to me.

150
24. The situation described in the scenario would provide an opportunity for me to
show others how well I can perform in my job.
25. If I were in the situation described in the scenario, the extra commission I
could earn would make me work harder to achieve my sales goal.
Goal difficulty (α= .81)
When responding to these next questions please think about the degree to which the
pricing strategy helps or hinders your ability to achieve your sales goal.
26. In the scenario, the pricing strategy will make it more difficult to achieve my
assigned sales goal. (1) “strongly disagree” to (7) “strongly agree”
27. As described in the scenario, the pricing strategy makes achieving the
assigned sales goal ___. (1) “much easier” to (7) “much harder”
28. Given the pricing strategy, the assigned sales goal in the scenario would be
____. (1) “not difficult at all” to (7) “very difficult”
Demographics
The following questions are about your current job and your experience. Please insert or
select the appropriate response.
29. How many years of experience do you have as a sales professional? Not
significant (F = .25, p =.62)
30. How many years have you worked in sales at your current company? Not
significant (F=1.68, p = .174)
31. What is your gender? (male, female) Not significant (F=.36, p = .79)
32. What is the highest level of education you have completed? (Less than high
school, High School/GED, Some college, 2-year College Degree, 4-year
College Degree, Graduate Degree) Not significant (F = .03, p =.99)
33. What industry do you work in? Not significant (F =.31, p =.58)
34. What percent of your total compensation is commission? Not significant (F
=.39, p =.54)