the effects of perception vs. “reality” on travel behavior ... the effects of perception vs....
TRANSCRIPT
1
The Effects of Perception vs. “Reality” on Travel Behavior after a Major Transit Service Change
The Effects of Perception vs. “Reality” on Travel Behavior after a Major Transit Service Change: The
Case of Tallahassee, FloridaTorsha Bhattacharya
University of Hawaii, Manoa
Jeffrey Brown, Michal Jaroszynski, Tuna Batuhan Florida State University
Abstract
An individual’s perception plays an important role in determining the decisions that people make involving the use of public transportation. An individual’s perception about the qualities of transit service might differ from the objective measures (“real-ity”) of service quality used by planners to make and evaluate decisions. This study explores the roles of perception and “reality” of transit service quality as influences on the attitudes and behaviors of two different groups of transit dependent riders after a major service change in Tallahassee, Florida. Using a combination of community surveys, key informant interviews, and agency data, the study finds that perception mattered more than “reality” as an influence on the attitudes and behaviors of the two groups. The need for more effective outreach to understand the reasons that individual perception might differ from the objective measures used and understood by transit professionals also emerges as an important lesson of the study.
Journal of Public Transportation, Vol. 17, No. 2, 2014
2
IntroductionAn individual’s perception plays an important role in the decisions that people make every day, including decisions involving transportation. An individual’s deci-sion about travel routes, modes, times, destination choices, and the like depends on her/his perception of the quality, ease, and cost of travel, as well as the qualities of the destination opportunities available for that particular trip. Past scholarship suggests that, often, it is the perception of travel as opposed to the actual mea-surable attributes of travel that is the fundamental driver of individual decision-making (Goodwin and Lyons 2009). In short, perception can often trump reality, making perception the more appropriate lens through which to understand, and perhaps modify, individual travel decisions.
Perception and reality often do not align. This has become particularly noteworthy in the literature on public transit and travel behavior. Transit is frequently perceived as being less convenient, less accessible, and less safe than it objectively would seem to be based on measurable attributes (Kenyon and Lyons 2003; Loukaitou-Sideris 1999). Within transit, bus rapid transit (BRT) and rail modes are perceived as being more convenient, more reliable, and faster than bus services, when this may or may not actually be the case (Deng and Nelson 2012; Thompson, Brown, and Bhat-tacharya 2012). Clearly, the transit industry understands the importance of percep-tion, and the need to alter perception, given the numerous examples of branding higher quality bus services such as BRT differently from traditional local bus ser-vices (Deng and Nelson 2012; Wirthlin Worldwide and FJCandN 2000). Frequent transit riders also tend to perceive transit service very differently from infrequent riders, who, in turn, have different perceptions than the larger, non-transit-using public (Mahmoud and Hine 2013). This adds an important group dimension to the understanding of the role of perception vs. reality in affecting individual attitudes and behavior.
This paper explores the similarities and differences between perception and real-ity and their relationship to transit use after a major service change in Tallahas-see, Florida, where the previously downtown-focused transit system was entirely restructured overnight to serve a more dispersed array of travel destinations. This change was driven largely by a desire to increase the system’s appeal to infrequent and discretionary riders. The local transit system, StarMetro, overwhelmingly catered to a transit-dependent ridership market dominated by two very different types of riders: university students, who are a transient population, and the long-term resident, lower-income community. Using a combination of quantitative

3
The Effects of Perception vs. “Reality” on Travel Behavior after a Major Transit Service Change
data about service quality and ridership, community surveys, and key informant interviews, the authors document the important role that perception played in affecting individual attitudes and travel behavior decisions and how these changed before and after the major service change. The results indicate the importance of perception over reality, which suggests the need for more effective outreach, listening, and engagement when transit agencies propose similar kinds of service changes in other locales. The results also suggest some important, if subtle, differ-ences between the two groups of transit-dependent riders.
Case Study SettingOn July 11, 2011, StarMetro, the transit agency in Tallahassee, restructured its network from one focused on the downtown (a classic radial pattern) to one that was decentralized (a grid-like pattern) to serve a wider array of travel destina-tions in a decentralized community where population and employment growth is highest in outlying locations. The presence of two major universities to the west and southwest of downtown Tallahassee, Florida State University (FSU) and Florida Agricultural and Mechanical University (FAMU), as well as a major regional community college, Tallahassee Community College (TCC), and the presence of state government offices in downtown has maintained a strong core of activity at the center of the community, but in recent years the departure of many state agencies and private employers to the outlying districts has eroded downtown’s role as a major activity center (see Figure 1). The Southwood area, a major New Urbanist style suburban development located southeast of the downtown, and Killearn, a more traditional post-war suburban development located northeast of the downtown, have been major centers for population and employment growth in recent years. Closer to the center of Tallahassee, however, the Frenchtown and Southside neighborhoods remain important centers of the local African-American community. Central Tallahassee remains the most important activity center in the region, although it is one in relative decline. Population and employment growth is expected to occur primarily in outlying areas, as has already been the case for the preceding several decades.

Journal of Public Transportation, Vol. 17, No. 2, 2014
4
Figure 1. Major activity centers in Tallahassee, Florida
Many local observers believed there was a mismatch between the downtown-oriented transit system and the decentralized pattern of urban development, and local planners embraced the restructuring of the transit network as a means to increase transit’s relevance and usefulness to the community. By making this major service change, planners sought to better align the geography of transit to the distribution of population and employment and to thus increase transit’s appeal to potential riders. Planners also hoped to improve the agency’s image in the com-munity, thereby affecting the community’s perception about the quality and con-venience of transit service (StarMetro Transit Development Plan 2011). By chang-ing the agency’s image and providing service to new locations, planners hoped to increase use of the system by discretionary and infrequent riders in particular. Prior to the service change, more than 70 percent of StarMetro’s riders were transit-dependent riders who lacked access to a car (Renaissance Planning Group 2009).
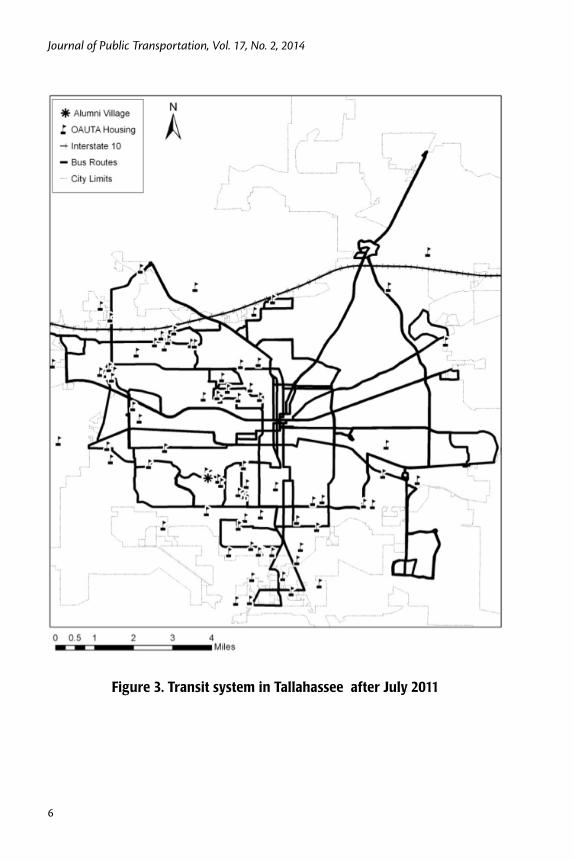
Figures 2 and 3 show the transit system before and after the July 2011 restructur-ing. Although visually similar, due to the overwhelmingly radial orientation of the local arterial road network, there are important differences between the two

5
The Effects of Perception vs. “Reality” on Travel Behavior after a Major Transit Service Change
Figure 2. Transit system in Tallahassee before July 2011
Journal of Public Transportation, Vol. 17, No. 2, 2014
6
Figure 3. Transit system in Tallahassee after July 2011

7
The Effects of Perception vs. “Reality” on Travel Behavior after a Major Transit Service Change
network designs. The service restructuring removed many routes from within neighborhoods and placed them on arterial roads, so as to increase bus speeds and reduce travel times. New crosstown routes were added in several important north-south and east-west corridors, providing direct connections to and between outlying locations. In the old system, all routes terminated at a central terminal, where transfers had to be made for all crosstown trips. Through the restructuring, half of the new routes were removed entirely from the central terminal, with new transfer locations designated outside the center of Tallahassee that allowed riders to make their crosstown trips without making a deviation through the central business district (CBD). Planners believed that the net result of the route changes would be increased overall accessibility to destinations throughout the commu-nity, although the removal of routes from within neighborhoods would negatively affect some riders. StarMetro staff engaged in substantial public outreach during the two years preceding the actual service change, holding more than 100 public meetings, as they communicated their intentions to residents and made a series of adjustments to their plans based on public comments. These adjustments contin-ued right up until implementation of the new system, and several additional minor route adjustments were made in the months that followed the service change.
A survey conducted prior to service restructuring demonstrated that StarMetro carried an overwhelmingly transit-dependent ridership consisting of two dis-tinct groups of riders: a transient population of college students and a long-term population of low-income residents (Renaissance Planning Group 2009). Students accounted for more than 40 percent of riders, while other low-income, transit-dependent residents accounted for more than 30 percent. Both groups had low levels of vehicle access, which meant they relied heavily on transit service to meet their daily travel needs. They would, thus, be strongly affected by the service change, which was designed primarily with an eye toward increasing the system’s appeal to infrequent and discretionary riders. Given their importance in the local transit market, the authors felt it would be particularly important to determine how these groups perceived and were ultimately affected by the service change.
To do so, the authors selected two large communities for targeted surveys and key informant interviews: Alumni Village, a student apartment complex, and the Orange Avenue Unified Tenant’s Association (OAUTA), a tenant’s group repre-senting residents of local public housing complexes. Both communities consist overwhelmingly of low-income, transit-dependent residents. Their locations are denoted on Figure 1 shown earlier. Alumni Village houses the largest local concen-

Journal of Public Transportation, Vol. 17, No. 2, 2014
8
tration of students within a single neighborhood. Many residents are international graduate students who do not have access to personal vehicles; some residents have families and, therefore, have varied travel needs.
Alumni Village residents are FSU students who must rely on a car or transit to reach classes and other community destinations due to the community’s relatively isolated location. Residents are served by local bus routes and a dedicated campus shuttle route that operates on a limited basis only when classes are in session.
OAUTA is an organization of public housing tenants who reside in Tallahassee Housing Authority operated housing complexes located throughout the city. In general, however, most low-income housing complexes are scattered around the south and west of Tallahassee, as shown in Figure 1. Many housing complex resi-dents lack easy access to a personal vehicle and depend on StarMetro to reach their employment or other important destinations. Residents are served by the local bus system whose routes were changed through the restructuring process.
Research Design and MethodologyThe authors sought to address three questions with respect to the attitudes and behavior of residents of the two communities: Alumni Village and OAUTA. First, did perception of the service change affect the travel behavior of residents of these two communities? The authors use the results of surveys conducted in the two communities to address this question. Second, was perception more important than objective measures of service quality as a determinant of behavior? The authors relate results from surveys and interviews to quantitative indicators of service levels, and their change before and after the service change, to address this question. Finally, were there differences in perception, and/or in the influence of perception on behavior, between the two communities? The authors compare the survey results and interview results from key informant interviews in each com-munity to one another to address this question.
The authors structure the analysis in three parts, each of which has a different set of data sources and methodologies. The first part, which the authors title “reality,” represents the objective outcomes of the service restructuring in each of the sur-veyed communities in terms of the accessibility provided by transit to reach travel destinations. The second part, which the authors title “perception,” consists of the results of community surveys and key informant interviews conducted in each of the communities. The third part, which the authors title “outcome,” consists of the
9
The Effects of Perception vs. “Reality” on Travel Behavior after a Major Transit Service Change
measured travel behavior of community residents as obtained from community surveys and transit agency ridership data.
The authors use the concept of accessibility as a primary means of gauging the objective results of the restructuring on each community. This method involves calculating an accessibility score based on the number of transit-accessible desti-nations available from a particular location as discounted by the time it actually takes to reach these destinations (Handy and Niemeier 1997). The authors use employment as a measure of destinations, as is traditionally done in transporta-tion analyses given its ability to represent employment destinations directly and to serve as a proxy for other destinations that are co-located with employment (Bhattacharya et al. 2013). To calculate the accessibility measure, the authors geocoded the locations of FSU student and low-income residential locations to their appropriate traffic analysis zone (TAZ) in a geographic information systems program, ArcGIS. The authors obtained student address data from the university registrar’s office (FSU Office of University Registrar 2012) and low-income housing complex addresses from the Tallahassee Housing Authority website (http://www.tallha.org). The authors then obtained the travel time matrix from the regional transportation demand model for both transit networks (Travel Demand Model, http://www.crtpa.org/). The resulting zone-to-zone (TAZ) travel times were then linked to TAZ employment numbers acquired from U.S. Census Bureau (Longi-tudinal Employer-Household Dynamic, http://onthemap.ces.census.gov/) in the following accessibility formula:
Ai = ∑ j=1 to n (Empj/Tij)
Where,
Ai = job accessibility from origin zone i to destination zone j
Empj = number of jobs within the destination zone j
Tij = total transit travel time from origin zone i to destination zone j
The authors calculated the total accessibility for the combined sets of zones con-taining all FSU student housing and low-income housing complexes, before and after the service change. As part of the accessibility analysis, the authors consider the change in the locations of bus stops (which affects walk time to stops) and the service frequencies (headways) and locations of bus routes in the surveyed com-munities (which also affects the overall transit accessibility provided in the com-

Journal of Public Transportation, Vol. 17, No. 2, 2014
10
munity). The authors obtained the stop location and service data directly from StarMetro staff (StarMetro 2011, 2012).
An important component of accessibility is travel time by transit. The authors use the regional travel model to calculate the change in three different components of transit travel time (walk time to a bus stop, in-vehicle travel time on the bus, and total travel time to begin and complete a trip) as a result of the restructuring to further investigate how each time component was affected by the transit system redesign and how each community experienced each of these changes in transit travel times. Such objective measures are useful tools for transit planners in under-standing the effectiveness of transit, although the literature noted earlier suggests that perceptions are even more important determinants of individual behavior. For that reason, the authors pair the objective calculations just noted with a consider-ation of individuals’ perceptions about transit service discussed below.
The perception analysis relies on the results of community surveys conducted in each of the two communities, as well as key informant interviews. The surveys focused on the respondents’ satisfaction with 11 different aspects of transit ser-vice quality, including frequency, safety, accessibility, and amenities. Respondents graded each aspect of the transit system on an ordinal scale ranging from “very satisfied” to “very dissatisfied.” The surveys were distributed electronically to resi-dents of Alumni Village, using the complex’s e-mail list serve, and by staff in the sampled OAUTA public housing complexes. There were 60 respondents for the Alumni Village survey and 76 respondents for the OAUTA survey. The authors also conducted 29 hour-long detailed interviews with key informants, including two from each of these communities to gain a better understanding of the prevailing perceptions of the community towards the service change as well as to learn about any outreach efforts conducted by StarMetro staff targeted towards these com-munities. Key informants were people in recognized leadership positions within each of the communities.
The outcomes analysis relies on measured effects on travel behavior as obtained from community surveys and stop-level monthly ridership data for a selected representative month for the neighborhoods surrounding the two communities obtained directly from StarMetro staff (StarMetro 2012).
The authors use the results of these two outcome analyses to understand the actual effects of the service change on travel behavior in the two communities and to understand the relative roles of perceptions vs. the objective measures

11
The Effects of Perception vs. “Reality” on Travel Behavior after a Major Transit Service Change
(“reality”) in influencing the travel behavior of community residents in each of the communities.
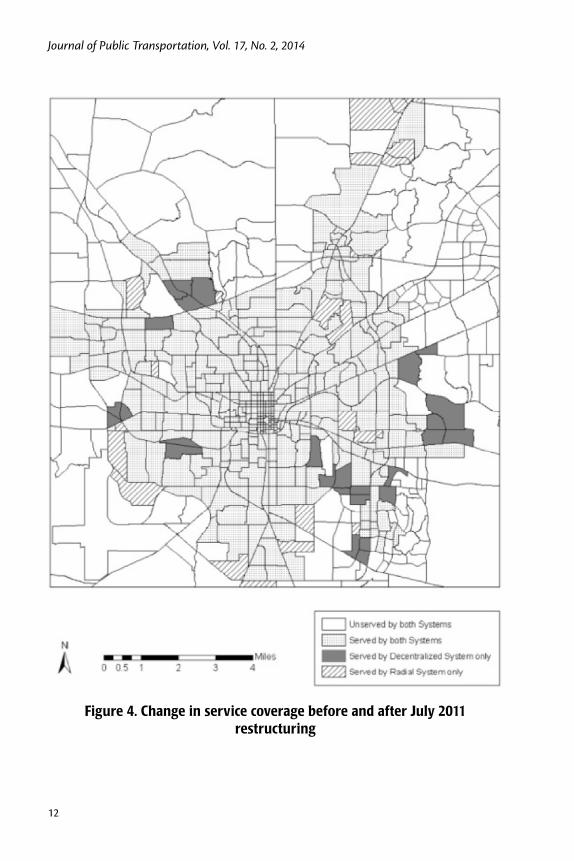
ResultsThe first part of the analysis is the objective examination of the service restructur-ing, which the authors label “reality.” The removal of routes from within neighbor-hoods, decentralization of routes from the central terminal to outlying locations, and addition of new crosstown services through the restructuring did change the pattern of transit accessibility in the community. Figure 4 shows that 28 TAZs lost access to transit service, largely due to the removal of stops within neighborhoods, while 48 TAZs became accessible via transit service, due to the addition of new outlying service. It should be noted, of course, that this visual depiction ignores the reality that people residing in TAZs that lost service might still be able to walk to nearby bus stops located outside their home TAZ. The map indicates that TAZs added and removed are randomly distributed across the entire transit service area, with a few clusters in the east and south east, but, overall, there is no particular spatial pattern to the elimination or reduction of transit service.
The accessibility analysis indicates that both community groups enjoyed higher average transit accessibility to destinations as a result of restructuring. The average accessibility scores for the student community was 1076 before and 1162 after the service change. The average scores for the low-income community was 1363 before and 1451 after the change. Therefore, it can be concluded that the "real" change in accessibility after the service change was positive for both the groups, with the low-income community being made relatively better off, in terms of the ability to access more destinations via transit, than the student community, on average.
The travel time analyses indicate that the loss of stops within neighborhoods has led to increased walk times to bus stops for these communities. The average change in walk time was an added 3.15 minutes for the low-income residents but only an added 2.70 minutes for the students. However, the more direct routing led to lower in-vehicle travel times once riders reached their bus stops. The aver-age reduction in total travel time was 9 minutes for low-income residents and 8 minutes for students. The net result of the restructuring was reduced overall travel times for both groups, with the benefits slightly greater for low-income residents than for students.
The analysis clearly indicates that some neighborhoods lost stops, and this very visible result of the restructuring emerged as an important issue in the surveys and
Journal of Public Transportation, Vol. 17, No. 2, 2014
12
Figure 4. Change in service coverage before and after July 2011 restructuring

13
The Effects of Perception vs. “Reality” on Travel Behavior after a Major Transit Service Change
interviews discussed later. Given that people tend to value their time spent access-ing or waiting for a bus as more burdensome than time spent actually in the vehicle (Thompson et al. 2012; Corradino Group 2008), the net results of the change with respect to travel time become much more difficult to evaluate. If riders value their time spent walking to the bus as two or three times as burdensome as time spent in the vehicle, which might be realistic considering the lack of significant sidewalk infrastructure in many of these communities, then the perceived net result of the restructuring might become closer to no effective change, or even negative.
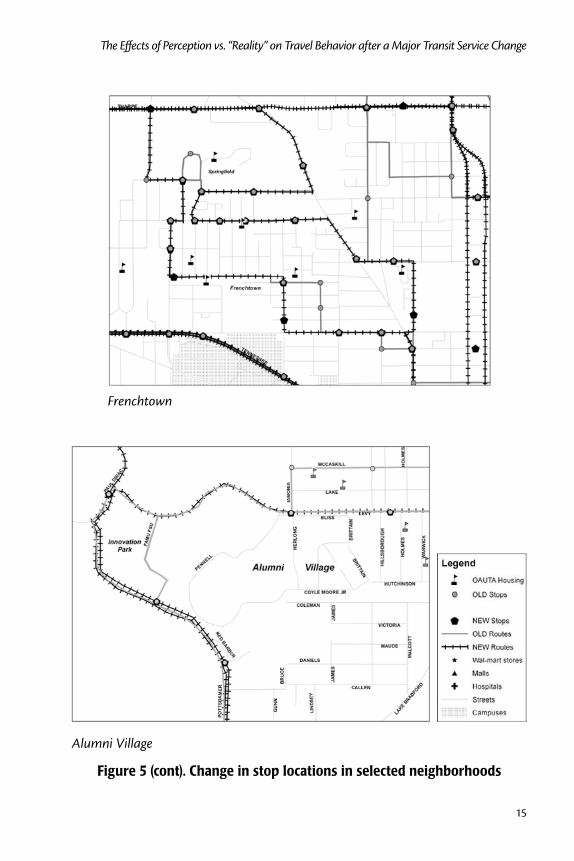
Figure 5 shows the pattern of bus stop location change in several neighborhoods and corridors containing OAUTA housing complexes. Particularly noteworthy are the changes in the Southside community along the Orange Avenue corridor. It con-tained many public housing complexes that lost bus stops and, hence, its residents experienced longer walks. The other panels indicate changes in stop locations in the Northwest area, Frenchtown, and Alumni Village. From StarMetro’s perspec-tive, the addition of more frequent service and the addition of stops nearby might make up for the added inconvenience of the longer walk. But is it true from the rider’s perspective as well?

Journal of Public Transportation, Vol. 17, No. 2, 2014
14
Southside
Northwest
Figure 5. Change in stop locations in selected neighborhoods
15
The Effects of Perception vs. “Reality” on Travel Behavior after a Major Transit Service Change
Frenchtown
Alumni Village
Figure 5 (cont). Change in stop locations in selected neighborhoods

Journal of Public Transportation, Vol. 17, No. 2, 2014
16
The authors relied on the community surveys and two key informant interviews from each of the two communities to document how residents in the two com-munities perceived the service change and its effects. The results from the two community surveys, conducted in summer 2012, are shown in Table 1.
Table 1. Resident Satisfaction with Transit Service Quality, Alumni Village (n=60) and OAUTA (n=76)
CategoryVery
SatisfiedSatisfied Neutral Dissatisfied
Very Dissatisfied
AV OAUTA AV OAUTA AV OAUTA AV OAUTA AV OAUTA
Frequency of Service
15.0% 4.0% 45.0% 15.8% 13.3% 23.7% 18.3% 19.7% 8.3% 31.6%
Service to Destinations
27.6% 4.0% 22.4% 22.4% 22.4% 17.1% 17.2% 17.1% 10.3% 32.9%
Service in Neighbor-hood
26.7% 4.0% 46.7% 17.1% 16.7% 10.5% 16.7% 19.7% 3.3% 40.8%
Service Reliability
25.0% 1.3% 26.7% 13.2% 21.7% 19.7% 20.0% 23.7% 6.7% 36.8%
Night and Weekend Service
20.0% 4.0% 21.7% 10.5% 20.0% 19.7% 26.7% 15.8% 11.7% 38.2%
Sense of Personal Safety
35.0% 5.3% 45.0% 30.3% 11.7% 25.0% 3.3% 14.5% 5.0% 17.1%
Availability of Shelters, Benches, Sidewalks
25.0% 4.0% 36.7% 14.5% 18.3% 15.8% 11.7% 15.8% 8.3% 43.4%
Walking Distance to Bus Stop
28.3% 9.2% 41.7% 10.5% 16.7% 14.5% 8.3% 22.4% 5.0% 36.8%
Ease of Transfers/Connections
13.3% 4.0% 25.0% 19.7% 36.7% 21.1% 13.3% 17.1% 11.7% 31.6%
Information on Service Changes
13.3% 5.3% 26.7% 10.5% 41.7% 21.1% 11.7% 23.7% 6.7% 30.3%
Overall Satisfaction with StarMetro Service
11.7% 4.0% 43.3% 10.5% 23.3% 21.1% 13.3% 25.0% 8.3% 32.9%
Source: Survey conducted by authors, 2012

17
The Effects of Perception vs. “Reality” on Travel Behavior after a Major Transit Service Change
Community Survey, 2012
Table 1 shows there are similarities and differences among the two sets of survey respondents in terms of their perceptions of the service change. On most ques-tions, Alumni Village respondents expressed majority sentiment in the “satisfied” or “very satisfied” classes for each dimension of service quality. However, OAUTA respondents took an opposite view, with a majority falling into the “dissatisfied” or “very dissatisfied” categories on each dimension. The difference in perceptions was particularly striking with respect to the walking distance issue, with most Alumni Village residents satisfied or very satisfied about walking distance and OAUTA respondents dissatisfied or very dissatisfied. This distinction is particularly striking given the not-too-different actual changes in walk times to stops, noted earlier, for these two communities. Overall, Alumni Village respondents had an overall posi-tive perception of transit service, whereas OAUTA respondents had an overwhelm-ingly negative perception. By and large, OAUTA respondents were quite dissatisfied with the results of the service changes.
Alumni Village respondents suggested service improvements that were very specific to their ease of reaching key destinations such as the FSU main campus, Walmart shopping centers, regional malls, and the airport, especially during weekend and off-peak hours. On the other hand, about half of the respondents in the OAUTA survey wanted StarMetro to bring back the old system. As a group, OAUTA respondents had much more specific complaints about the service change and suggestions for improvement than the Alumni Village respondent group, indicating their higher level of dissatisfaction with service restructuring. About 40 percent of Alumni Village residents were satisfied or very satisfied with Star Metro’s outreach efforts, whereas more than 50 percent of OAUTA residents were dissatisfied or very dissatisfied with information provided to them regarding the service change.
The key informant interviews added additional insights into the perception of the restructuring, and of transit more generally, in each community. One particularly important issue that came up in the interviews was perception about the level and type of public outreach StarMetro conducted in each community in advance of the service restructuring. The Alumni Village interviewee voiced concern about the lack of advance warning from StarMetro staff about the relocation of bus stops from within the community to its periphery and about changes to evening service. This interviewee noted that Alumni Village staff and residents had to reach out to StarMetro, but that eventually StarMetro staff worked with the community
Journal of Public Transportation, Vol. 17, No. 2, 2014
18
and seemed to be listening carefully to its needs. The interviewee at OAUTA also expressed concern about stop relocation but seemed to have a much more nega-tive view of StarMetro’s efforts to reach out to or address needs within this com-munity around this and other service issues. Overall, StarMetro staff held more than 100 public meetings prior to restructuring the service, including some within close proximity to these communities. But there is still a clear perception among OAUTA respondents, in particular, that the outreach effort was insufficient or that staff did not adequately take into account their concerns raised during these outreach sessions.
The objective indicators indicate improved transit travel times and higher accessi-bility to destinations for each of the communities, with the low-income community having higher accessibility and more reduced total travel times than the student community, with the important caveat about residents experiencing longer aver-age walk times to bus stops. However, the perception in one community (Alumni Village) was largely positive and the other was largely negative (OAUTA), which indicates an inconsistency between the objective indicators of service change and individual perceptions of the changes. So, what are the outcomes of the service change with respect to transit ridership and travel behavior in these communities? Do they differ? Is perception more important than reality?
At a system level, StarMetro was a primarily transit-dependent serving system prior to restructuring as well as afterward (Renaissance Planning Group 2009 and StarMetro Customer Satisfaction Survey 2012) (see Table 2). Those without regu-lar access to vehicles dominated among respondents to surveys conducted both before and after the restructuring. However, the survey results also suggest that efforts to increase the system’s appeal to infrequent and discretionary riders have succeeded to some degree, given modest increases shown in the number of infre-quent riders and increased proportion of non-work and non-school trips. Overall, ridership on the new system is down slightly from the older system, on a month-to-month basis, although StarMetro staff caution that the short timeframe within which the new system has been operational has not provided sufficient time for riders to adjust. The average monthly decrease in systemwide ridership is around 12 percent. Still, the results in Tallahassee are similar to those found at similar points in time in other systems that made significant service changes (Jaroszynski et al. 2013).

19
The Effects of Perception vs. “Reality” on Travel Behavior after a Major Transit Service Change
Table 2. Results of Restructuring on Overall Transit Use in Tallahassee
Before (2009) After (2012)
Car Access
Yes 533 (27.08%) 82 (14.16%)
No 1,435 (72.92%) 497 (85.85%)
Total responses 1,968 579
Frequency of Use (per week)
More than 5 days 1,360 (69.11%) 348 (57.62%)
3–4 days 438 (22.26% 184 (30.46%)
2 days 89 (4.52%) 39 (6.46%)
0–1 day 81 (4.52%) 39 (6.46%)
Total responses 1,968 604
Trip Purpose
Work 1,095 (51.03%) 258 (31.77%)
School 744 (34.67%) 266 (32.76%)
Medical care 80 (3.73%) 99 (12.19%)
Leisure/other 227 (10.58%) 189 (23.28%)
Total responses 2,146 812
Walk Distance to Bus Stop
0–1/8 mile 191 (57.01%) 172 (29.66%)
1/8–1/4 mile 41 (12.24%) 128 (22.07%)
1/4–1/2 mile 23 (6.87%) 135 (23.28%)
More than 1/2 mile 80 (23.88%) 145 (25.00%)
Total responses 335 580
Sources: Renaissance Planning Group 2009, StarMetro Customer Satisfaction Survey 2012
Table 3 explores the specific results in the two surveyed communities. Both sets of survey respondents consist overwhelmingly of individuals lacking vehicle access who use transit frequently for a diverse array of trip types. Both sets of respondents were also aware of the service change in July 2011. An overwhelming majority of the Alumni Village respondents are students (more than 83%; the remainder are spouses or dependents), whereas a plurality of the OAUTA respondents (just under 45%) are employed individuals. OAUTA respondents also included unemployed people, retired persons, and homemakers, representing a much more diverse group with diverse travel needs than the Alumni Village survey respondents. Nearly three-
Journal of Public Transportation, Vol. 17, No. 2, 2014
20
quarters of Alumni Village respondents reported using transit about the same or more frequently than they did prior to the restructuring, while nearly two-thirds of the OAUTA respondents reported using transit less frequently than before restruc-turing. In general, the largely negative perception that OAUTA respondents have of the service change is indeed reflected in their lower use of the system, despite the objective indicators suggesting that the quality of the service provided to them has improved overall (based on the accessibility and total travel time measures).
The authors also obtained stop-level boarding data for the areas within which these two communities reside to serve as an additional source of outcome data about ridership changes before and after restructuring (StarMetro 2012). In the Southside area, where many OAUTA housing complexes are located, there were 44 stops that recorded 3,245 average monthly boardings in February 2011 (before restructuring); in February 2012 (after restructuring), 59 stops recorded 5,221 boardings, a signifi-cant increase in ridership in this area—although the presence of two major transfer points in the area complicates the results. On balance, ridership in this area is, thus, only slightly changed from before restructuring. In the Frenchtown area, also the location of a large number of OAUTA housing complexes, 47 stops recorded 11,275 average monthly boardings in February 2011, and 53 stops recorded 6,811 board-ings in February 2012, indicating a significant drop in ridership in this area. For the Alumni Village area, 6 stops recorded 431 boardings in February 2011 and 6 stops recorded 1411 boardings in February 2012, representing a significant increase in ridership. By and large, the results of the stop-level boardings analyses echo those reported through the community surveys. The student community has increased its transit ridership, while the low-income community has decreased its ridership (when the net results for the Southside and Frenchtown are considered as a single whole).

21
The Effects of Perception vs. “Reality” on Travel Behavior after a Major Transit Service Change
Table 3. Results of Restructuring on Transit Use in Alumni Village (n=60) and OAUTA (n=76)
AV OAUTA
Access to an Automobile
Yes 35.0% 25.0%
No 65.0% 72.4%
No response 2.6%
Use of Public Transit
Never 3.3% 10.4%
Less than Once per Week 11.7% 19.5%
1–2 Days per Week 11.7% 10.4%
3–4 Days per Week 20.0% 23.4%
5 or More Days per Week 53.5% 35.1%
Use of Public Transit for Different Trip Types
Work 43.3% 42.1%
School 83.3% 35.5%
Medical 15.0% 46.1%
Other 53.3% 38.2%
Awareness of Service Change in July 2011
Yes 68.3% 67.1%
No 31.7% 32.9%
Change in Use of Transit Service Since Change in July 2011
Using More Frequently 21.7% 14.5%
Using About the Same 55.0% 18.4%
Using Less Frequently 23.3% 65.8%
No Response 1.3%
Status of Respondent
Employed 16.7% 31.6%
Employed and a Student 43.4% 13.2%
Student 40.0% 9.2%
Homemaker 15.8%
Unemployed 19.7%
Retired 10.5%
Total Responses 60 76
Source: Survey conducted by authors, 2012

Journal of Public Transportation, Vol. 17, No. 2, 2014
22
Discussion The objective (“reality”) analysis of the service change suggests that both commu-nities received increased accessibility and reduced total travel times as a result of the service change. It also indicates that the low-income community is relatively better off than the student community as a result of the change. They do have to walk slightly further than the student riders to reach a bus stop, on average, but once they reach the bus stops, their travel is faster, on average. While both rider groups experience higher accessibility levels after the restructuring, the low-income community has a higher accessibility score than the student community. However, the perception of the Alumni Village respondents is overwhelmingly pos-itive, whereas that of the OAUTA respondents is overwhelmingly negative. Respon-dents in Alumni Village were also more satisfied with StarMetro’s outreach efforts and responsiveness to their concerns than OAUTA respondents. However, it must also be cautioned that the non-random nature of the two surveys might affect the results. It is possible that the most dissatisfied persons responded in disproportion-ate numbers to the OAUTA survey. This is a possibility, although the consistency of the survey responses with the key informant interviews and local press coverage suggest that the survey is reflective of a larger community sentiment.
The travel behavior results suggest that perception exercises a stronger influence than the objective “reality” on attitudes and behavior in both communities. The community that perceived the service change positively responded favorably in terms of its actual use of public transit, whereas the community that perceived the change negatively responded negatively in terms of its actual use, based on both the travel survey and stop-level results. These results occurred despite the fact that the community that perceived the changes most favorably (students in Alumni Village) was actually not made as better off as the community that perceived the changes less favorably (OAUTA). Perception definitely affected people’s behavior in the two communities surveyed, and it proved more powerful an influence on behavior than the objective measures of service change (“reality”). These results clearly indicate that in these communities, and particularly among low-income residents, more outreach efforts targeted at influencing individual perceptions are needed to increase transit ridership. StarMetro staff made significant efforts at public outreach to explain the service changes prior to their occurrence, including hosting more than 100 public meetings, but the nature of that outreach was clearly perceived to be insufficient and turned out to be relatively ineffective in at least one of the two communities.

23
The Effects of Perception vs. “Reality” on Travel Behavior after a Major Transit Service Change
RecommendationThe study indicates that in the case of the transit restructuring in Tallahassee, perception matters and was a stronger influence on travel behavior than were objective measures of the service change. This case indicates the importance of effective outreach geared toward understanding how and why communities have particular perceptions of the effects of planning decisions, particularly percep-tions that, at least superficially, appear to be different from the objective measures typically used by planners to make and evaluate decisions (Innes and Booher 2010). Effective outreach should involve a genuine dialogue with the community to better understand their issues and concerns and should not be limited to making pre-sentations or delivering information. The more engaged the community is in the dialogue, the greater the ability to change their perceptions, or perhaps even for planners to change their own views to better reflect the needs and concerns of the communities for which they are planning (Wirthlin Worldwide and FJCandN 2000). Whenever members of a community feel left out of a decision making process that affects their day-to-day lives, there is much greater likelihood of detachment, nega-tive perceptions, and a general lack of acceptance of the solutions defined by “oth-ers” who are not part of the community. The low-income community discussed in this study would appear to fall into this category, whereas the outreach done, albeit somewhat belatedly, in the student community appears to have been successful in helping to gain more acceptance of the service change by these individuals.
Acknowledgments
The authors thank the Mineta Transportation Institute for funding this work. The authors thank the staff at StarMetro, Alumni Village, and the Orange Avenue Uni-fied Tenants Association for their assistance in the study.
References
Bhattacharya, T., J. Brown, M. Jaroszynski, and T. Batuhan. 2013. How does restruc-turing from a CBD-focused transit system to a decentralized transit system affect transit riders and their accessibility to destinations: A case study of Star-Metro in Tallahassee, Florida. Transportation Research Record.
Corradino Group, in Association with AECOM Consult, Inc. 2008. Southeast Regional Planning Model VI, 2000 and 2030 Models, Technical Report 3, Model

Journal of Public Transportation, Vol. 17, No. 2, 2014
24
application guidelines. Ft. Lauderdale: Florida Department of Transportation, District IV.
Deng, T., and J. D. Nelson. 2012. The perception of bus rapid transit: A passenger survey from Beijing Southern Axis BRT Line 1. Transportation Planning and Technology 35: 201-219.
Florida State University Office of University Registrar. 2012. FSU Student Residen-tial Locations. E-mail correspondence with Mike Spear, May.
Goodwin, P., and G. Lyons. 2009. Public attitudes to transport: Interpreting the evidence. Transportation Planning and Technology 33: 3-17.
Handy, S., and D.A. Niemeier. 1997. Measuring accessibility: An exploration of issues and alternatives. Environment and Planning A, 29: 1175-94.
Innes, J., and D. Booher. 2010. Planning with Complexity: An Introduction to Collab-orative Rationality for Public Policy. Routledge: New York.
Jaroszynski, M., J. Brown, T. Batuhan, and T. Bhattacharya. 2013. Understanding the effects of system-wide transit network restructuring in a decentralized US metropolitan area on transit agency ridership and performance: A case study of StarMetro in Tallahassee, Florida. Working Paper, FSU Department of Urban and Regional Planning, Tallahassee.
Kenyon, S., and G. Lyons. 2003. The value of integrated multimodal information and its potential contribution to modal change. Transportation Research Part F 6: 1-21.
Loukaitou-Sideris, A. 1999. Hot spots of bus stop crime: The importance of environ-mental attributes. Journal of the American Planning Association 65: 395-411.
Mahmoud, M., and J. Hine. 2013. Using AHP to measure the perception gap between current and potential users of bus services. Transportation Planning and Technology 36: 4-23.
Renaissance Planning Group. StarMetro on-board passenger survey. 2009. Provided by StarMetro staff.
Renaissance Planning Group. StarMetro customer satisfaction survey. 2012. Pro-vided by StarMetro staff.
StarMetro. 2011. Bus routes GIS shapefile for radial and decentralized systems, Samuel Scheib, September.

25
The Effects of Perception vs. “Reality” on Travel Behavior after a Major Transit Service Change
StarMetro. 2012. Boarding and alighting data, Arnetria Thomas.
StarMetro Transit Development Plan, Capital Region Transportation Planning Agency, 2011.
Tallahassee Housing Authority, http://www.tallha.org.
Wirthlin Worldwide with FJCandN. 2000. TCRP report 63, Enhancing the visibility and image of transit in the United States and Canada. Transportation Research Board, National Research Council.
Thompson, G. L., J. Brown, and T. Bhattacharya. 2012. What really matters for increasing transit ridership: A statistical analysis of how transit level of service and land use variables affect transit patronage in Broward County, Florida. Urban Studies 49: 3327-3345.
Travel Demand Model. Capital Region Transportation Planning Agency. http://www.crtpa.org/ Accessed May 1, 2012.
U.S. Census Bureau. Longitudinal employer-household dynamic. Employee data for Leon County, http://onthemap.ces.census.gov/ Area Analysis of Leon County, Florida. Accessed June 1, 2012.
About the Authors
Torsha Bhattacharya ([email protected], [email protected]) is an Assistant Professor in the School of Travel Industry Management at the University of Hawaii, Manoa. She received her Ph.D. from Florida State University. Her research interests include transportation systems, the relationship between transportation and land use, equity in transportation, and sustainable infrastructure planning. She is also interested in research geared towards improving accessibility for disadvantaged groups.
Jeffrey Brown ( [email protected]) is Associate Professor and Director of the Master’s Program in the Department of Urban and Regional Planning at FSU. He received his Ph.D. at University of California, Los Angeles. His research interests include the early professionalization of transportation planning, the changing nature of street and highway planning in the United States, transportation finance, and the relevance of different service strategies for making public transit more successful in decentralized urban areas.

Journal of Public Transportation, Vol. 17, No. 2, 2014
26
Michal Jaroszynski ([email protected]) is a doctoral candidate at FSU. His research interests include the economic aspects of public transportation, such as assessing costs and benefits or finding the methods of improving its efficiency and productivity. He is also interested in analyzing policies related to public transit service planning, especially rail and multimodal transit systems.
Tuna Batuhan ([email protected]) is a doctoral candidate at FSU. His research interests include the effects of mega-events on the transportation planning processes and institutions in host communities.