the effects of landscape transformation in a changing climate on local water resources
TRANSCRIPT
This article was downloaded by: [University of New Hampshire]On: 08 October 2014, At: 05:00Publisher: Taylor & FrancisInforma Ltd Registered in England and Wales Registered Number: 1072954 Registered office: Mortimer House,37-41 Mortimer Street, London W1T 3JH, UK
Physical GeographyPublication details, including instructions for authors and subscription information:http://www.tandfonline.com/loi/tphy20
The Effects of Landscape Transformation in a ChangingClimate on Local Water ResourcesCarrie E. Davis Todd a , Alison M. Goss b , Dibyajyoti Tripathy b & Jonathan M. Harbor ca Worcester State Collegeb Purdue Universityc University of Colorado, DenverPublished online: 15 May 2013.
To cite this article: Carrie E. Davis Todd , Alison M. Goss , Dibyajyoti Tripathy & Jonathan M. Harbor (2007) The Effects ofLandscape Transformation in a Changing Climate on Local Water Resources, Physical Geography, 28:1, 21-36
To link to this article: http://dx.doi.org/10.2747/0272-3646.28.1.21
PLEASE SCROLL DOWN FOR ARTICLE
Taylor & Francis makes every effort to ensure the accuracy of all the information (the “Content”) containedin the publications on our platform. However, Taylor & Francis, our agents, and our licensors make norepresentations or warranties whatsoever as to the accuracy, completeness, or suitability for any purpose of theContent. Any opinions and views expressed in this publication are the opinions and views of the authors, andare not the views of or endorsed by Taylor & Francis. The accuracy of the Content should not be relied upon andshould be independently verified with primary sources of information. Taylor and Francis shall not be liable forany losses, actions, claims, proceedings, demands, costs, expenses, damages, and other liabilities whatsoeveror howsoever caused arising directly or indirectly in connection with, in relation to or arising out of the use ofthe Content.
This article may be used for research, teaching, and private study purposes. Any substantial or systematicreproduction, redistribution, reselling, loan, sub-licensing, systematic supply, or distribution in anyform to anyone is expressly forbidden. Terms & Conditions of access and use can be found at http://www.tandfonline.com/page/terms-and-conditions
21
Physical Geography, 2007, 28, 1, pp. 21–36.Copyright © 2007 by V. H. Winston & Son, Inc. All rights reserved.
THE EFFECTS OF LANDSCAPE TRANSFORMATION IN ACHANGING CLIMATE ON LOCAL WATER RESOURCES
Carrie E. Davis ToddDepartment of Physical and Earth Sciences
Worcester State College486 Chandler Street
Worcester, Massachusetts 01602
Alison M. Goss and Dibyajyoti TripathyDepartment of Earth and Atmospheric Sciences
Purdue University550 Stadium Mall Drive
West Lafayette, Indiana 47907
Jonathan M. HarborDepartment of Geography and Environmental Sciences
University of Colorado at Denver and Health Sciences CenterDenver, Colorado 80217-3364
Abstract: Integrated watershed studies can provide insight into the ways land-use change and climate change interact to transform regional and local hydrology. Most past work has treated baseflow and streamflow separately, and focused either on land-use change or climate change. To assess the relative role of climate change and land-cover change on baseflow, streamflow and peak runoff events for the rapidly urbanizing area surrounding Indianapolis, Indiana, we analyzed long-term records of streamflow, rainfall and land-use data, and performed modeling studies of water fluxes based on recon-structed land-cover change. Statistically significant increasing trends for streamflow and baseflow were present throughout the record, although precipitation did not show similar increases. This indicates that other factors, such as land-use change, had greater influence on watershed hydrology in this area than climate. However, large-scale modeling was not able to demonstrate that changes in hydrology were driven by land-cover change, suggest-ing that other aspects of land use, such as groundwater withdrawal might be significant. Although more detailed modeling work is required for this specific location, the general framework for integrating studies of streamflow, baseflow and land-cover change pre-sented here is easily transferable to other watersheds and will be of use to communities and government agencies involved in water-resource planning. [Key words: watershed modeling, climate change, streamflow, baseflow, urbanization, Indianapolis.]
INTRODUCTION
Interactions between land-use change and hydrologic processes have recently emerged as a major scientific and management challenge throughout the United States (National Science Foundation, 2003; DeFries and Eshleman, 2004). The U.S. EPA Office of Research, through its “Water and Watersheds” program, has
Dow
nloa
ded
by [
Uni
vers
ity o
f N
ew H
amps
hire
] at
05:
00 0
8 O
ctob
er 2
014
22 DAVIS TODD ET AL.
identified the need for greater emphasis on watershed management that is based on understanding how human activities, such as land use, impact water resources (EPA, 1998). Land-use changes, such as urbanization, can have a profound impact on local hydrology through increased impervious surface area, removal of vegeta-tion, and increased water consumption/removal (e.g., Leopold, 1968). Conse-quently, these changes impact flood timing and magnitude, streamflow regime, channel and soil erosion, aquatic habitats, groundwater recharge, and baseflow (Harbor et al., 2001). Baseflow maintains streamflow during seasonal dry periods in much of the United States and also has important ecological and environmental functions. Decreased infiltration rates and increased groundwater withdrawal from urban areas have the potential to reduce groundwater discharge to streams, lakes, and wetlands. Lowered baseflow can impose limitations on long-term availability of groundwater and can adversely affect stream resilience to drought conditions.
The hydrologic impacts of land-use change can be compounded or offset by changes in regional climate. The effects of climate change on hydrology may include increased evaporation, increased frequency of floods and droughts, and increased heavy precipitation (Karl and Knight, 1998; Davis Todd et al., 2006). Thus, communities that are struggling to deal with hydrologic change and land-use regulation are faced with the concern that adverse changes might have resulted from climate change, and therefore land-use regulation may not have the intended impact in reducing hydrologic changes.
Many existing watershed hydrology studies have been conducted in highly con-trolled experimental watersheds and have focused on analyzing select variables using classic scientific experimental methods (Goodrich et al., 1995; Sun et al., 2000; Endale et al., 2006). Although this work has provided valuable insights into specific processes and conditions, real-world watershed management also needs to be informed by studies and models that integrate watershed hydrology, land use, and climate change in complex and changing environments. Thus, in the work pre-sented here, we have developed a transferable methodology for integrated water-shed hydrology that examines the relationships among land cover, precipitation (as a proxy for climate change), streamflow, and groundwater. By using readily avail-able datasets, rather than data collected specifically for the purpose of this type of analysis, the methodology of this study can be easily translated to watersheds throughout the country. In addition, we examine the use of a physical model addressing land-cover change, hydrologic fluctuations, and climate change scenar-ios combined with historic hydrologic and land-use data. The purpose of the model application is to enable the assessment of future consequences of land-cover change and climate on water resources, and therefore addresses policy questions related to sustainable water resources.
The research conducted in this project includes a case-study investigation of how human modifications of landscape, combined with observed and modeled climate scenarios, affect water cycling at various scales in the Greater Indianapolis area. We investigated this issue by combining recreations of historical land use (“backcasts”) with a hydrologic model that predicts surface and subsurface water flows, as well as by statistical analysis of historical streamflow and precipitation data, in the Greater Indianapolis area. The primary objectives of this integrated project were to
Dow
nloa
ded
by [
Uni
vers
ity o
f N
ew H
amps
hire
] at
05:
00 0
8 O
ctob
er 2
014
URBANIZATION AND WATER RESOURCES 23
determine the historical relationships among urbanization, climate, and watershed hydrology (specifically, streamflow, peak flows, and baseflow) in the Greater India-napolis area and to create an integrated approach for comprehensive water-resource management.
Study Area
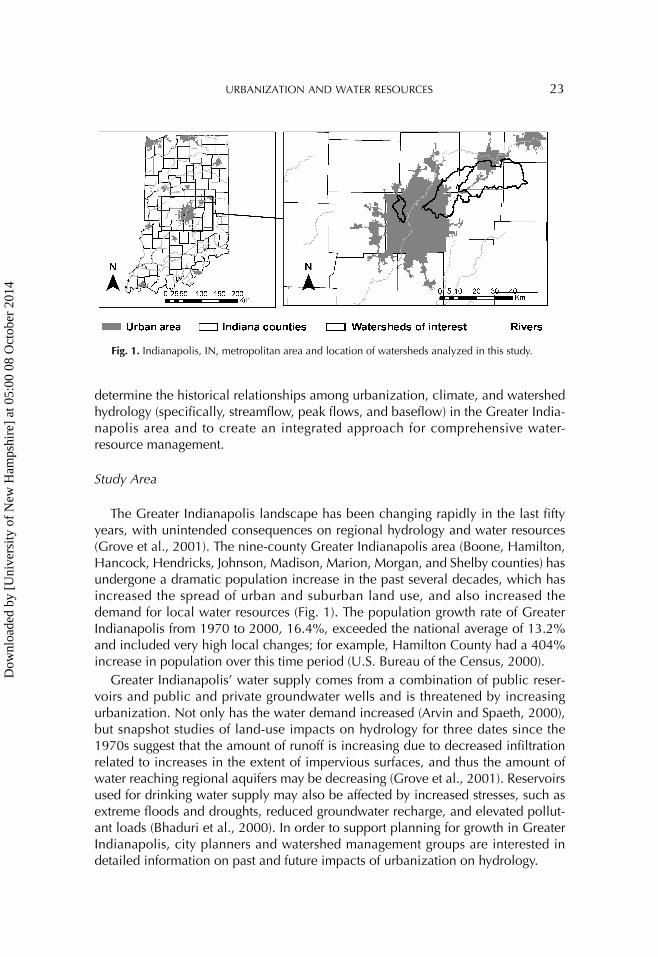
The Greater Indianapolis landscape has been changing rapidly in the last fifty years, with unintended consequences on regional hydrology and water resources (Grove et al., 2001). The nine-county Greater Indianapolis area (Boone, Hamilton, Hancock, Hendricks, Johnson, Madison, Marion, Morgan, and Shelby counties) has undergone a dramatic population increase in the past several decades, which has increased the spread of urban and suburban land use, and also increased the demand for local water resources (Fig. 1). The population growth rate of Greater Indianapolis from 1970 to 2000, 16.4%, exceeded the national average of 13.2% and included very high local changes; for example, Hamilton County had a 404% increase in population over this time period (U.S. Bureau of the Census, 2000).
Greater Indianapolis’ water supply comes from a combination of public reser-voirs and public and private groundwater wells and is threatened by increasing urbanization. Not only has the water demand increased (Arvin and Spaeth, 2000), but snapshot studies of land-use impacts on hydrology for three dates since the 1970s suggest that the amount of runoff is increasing due to decreased infiltration related to increases in the extent of impervious surfaces, and thus the amount of water reaching regional aquifers may be decreasing (Grove et al., 2001). Reservoirs used for drinking water supply may also be affected by increased stresses, such as extreme floods and droughts, reduced groundwater recharge, and elevated pollut-ant loads (Bhaduri et al., 2000). In order to support planning for growth in Greater Indianapolis, city planners and watershed management groups are interested in detailed information on past and future impacts of urbanization on hydrology.
Fig. 1. Indianapolis, IN, metropolitan area and location of watersheds analyzed in this study.
Dow
nloa
ded
by [
Uni
vers
ity o
f N
ew H
amps
hire
] at
05:
00 0
8 O
ctob
er 2
014
24 DAVIS TODD ET AL.
METHODOLOGY
Precipitation, streamflow, and baseflow derived using hydrograph separation for three urbanizing watersheds in Greater Indianapolis (Fig. 1; Fall Creek near Fortville, USGS #03351500; Fall Creek at Millersville, USGS #03352500; Little Eagle Creek at Speedway, USGS #03353600) were used to quantify the interactions between historical changes in hydrology, climate change and land use. Watershed selection within the overall study region was based on the length and availability of continuous streamflow and precipitation data. Historical peak annual and seasonal discharge records were also examined for the three watersheds, to determine whether flood magnitudes and frequencies have changed over time. Historical hydrologic data were combined with modeled past land-cover data and water fluxes to examine the relative impacts of urbanization and climate change on streamflow, baseflow, and flooding. Distinguishing natural climate impacts from human-induced changes on streamflow and baseflow was approached by modeling changes to hydrology while holding either land cover or climatology static. Mod-eled land-use data were coupled with estimated urban, agricultural, forest, and shrubland/grassland areas for pre-1940 and present using U.S. Census and National Agricultural Statistics Service (NASS) datasets for the selected watersheds. Detailed methodologies for each element of the study are outlined below.
Quantifying Interactions between Hydrology and Land Use
Measured streamflow and precipitation, and baseflow derived using hydrograph separation, were statistically examined to: (1) evaluate the amount of variation in streamflow, baseflow, and precipitation and (2) quantify the relative influences of natural and anthropogenic variation on streamflow and baseflow. The Mann-Kendall Rank Correlation Test allowed for both the detection of monotonic trends and significance determination for any trends. The Mann-Kendall test is a common method for determining the presence of trends in hydrologic data (Lins and Slack, 1999; Stogner, 2000; Pilon and Yue, 2002) and is a nonparametric test, resistant to the skewing influences of outliers (Helsel and Hirsch, 1992). Regression techniques were used to determine the relative amount of streamflow and baseflow variation accounted for by climate and urbanization.
Streamflow and Baseflow Records
Fifty years of continuous data are often recommended to detect and analyze trends in historical hydrologic data (Lettenmaier et al., 1994; Stogner, 2000; McCabe and Wolock, 2002). The entire period of historical streamflow and corre-sponding precipitation data available for the three study sites was used in this anal-ysis. Fall Creek at Fortville (FC-F) and Fall Creek at Millersville (FC-M) had 63 and 75 years of available data, respectively, while Little Eagle Creek (LEC) had only 45 years of streamflow data, which were deemed sufficient for this study. Since all three watersheds were gauged by the U.S. Geological Survey (USGS), daily stream-flow data were obtained from the USGS website (USGS, 2006) and daily
Dow
nloa
ded
by [
Uni
vers
ity o
f N
ew H
amps
hire
] at
05:
00 0
8 O
ctob
er 2
014
URBANIZATION AND WATER RESOURCES 25
precipitation data for nearby weather stations were accessed through the National Climatic Data Center website (NCDC, 2006).
The weather stations selected to represent each watershed were the closest weather stations located within 10 km of the gauging station, preferably within the watershed boundaries. Although the daily precipitation data were over 95% complete, missing data were replaced with observations from other nearby weather stations within 10 km of the gauging station.
Baseflow can be separated from historical streamflow data using a variety of hydrograph separation techniques and in this analysis a Web-based Hydrograph Analysis Tool (WHAT; Lim et al., 2005) was employed for baseflow separation. This automated hydrograph separation method relies on flow peak and flow minimum detection from continuous streamflow data and produces results comparable with the widely used HYSEP program (Sloto and Crouse, 1996).
Analysis of Frequency and Magnitude of Extreme Hydrologic Events
Extreme value distributions from the historic precipitation and streamflow data were used to determine the magnitude of rainfall and discharge events with various recurrence intervals. The data were analyzed using the Extreme Value Type 1 distri-bution commonly used to model storm events (Chow et al., 1988). To examine changing precipitation and streamflow magnitudes and frequencies, flood fre-quency analysis was applied to a 10-year moving window. Use of moving window analysis for a set length of time reduces the influence of record length on extreme event statistics, and allows for a comparison of changing rainfall and runoff statistics based on equivalent time periods (Davis Todd et al., 2006).
Hydrologic Modeling
Hydrologic modeling is one way to isolate the potential drivers of changes to hydrology within a given basin, by controlling for those factors that are not of interest. Through modeling historic land-cover change within a basin and maintaining a con-sistent climatology, the true impact of certain types of land-cover change on hydrology can be ascertained. The Variable Infiltration Capacity (VIC) model (Liang et al., 1994; Liang et al., 1996; Cherkauer et al., 2003) calculates water fluxes such as baseflow, evaporation, and runoff within grid cells using percent cover of each land-use type.
In order to input historical estimates of land cover into a hydrology model, the operational unit of the historical data used to derive estimates must be converted to the resolution of the hydrology model. Historical land-use scenarios spanning 60 years in a selected watershed were developed based on demographic and land-use databases at the minor civil division (MCD) and county level.
The VIC model is an energy and water balance system (Liang et al., 1994, 1996; Cherkauer et al., 2003). Unlike other Soil-Vegetation-Atmosphere Transfer Schemes (SVATS), the VIC model is able to model variability in soil-moisture capacity as a probability distribution, as well as parameterize baseflow, so that it is separated from quick storm response (Zhao et al., 1980; Dumenil and Todini, 1992). The model relies on a vegetation library file that provides information, such as leaf-area index
Dow
nloa
ded
by [
Uni
vers
ity o
f N
ew H
amps
hire
] at
05:
00 0
8 O
ctob
er 2
014
26 DAVIS TODD ET AL.
and albedo, for each land-use type. These figures were derived and provided to the model for urban areas. Evapotranspiration, surface runoff, and baseflow were then computed for each cover type and summed over all cover types within a grid cell. The outputs include energy and water balance flux information, as well as outflow hydrographs. Four land-use types were used to characterize the historical landscape of the study area: urban (impervious), agricultural, shrubland/grassland, and forest.
Large-scale land-cover data for the study area are limited by the availability of reliable remotely sensed data which emerged in 1978 with the Landsat TM satellite images. Using a technique developed by Goss et al. (2005), United States Census data were used for estimates of urban growth in the time period before present. Total housing units data for each time period were derived from the “Year Built” sta-tistic (referred to as “QT-H7 Year Structure Built and Year Householder Moved Into Unit” or “Occupied Housing Units” within the Summary File 4 dataset for the 2000 Census; U.S. Bureau of the Census, 2000). The number of houses built before 2000 (used to represent “present” because it is the last available Landscan TM image) in each township was calculated. Using the number of houses built during each time step, the amount of impervious area that existed during that time step could be esti-mated for the operational unit of the hydrology model used.
The NASS Census of Agriculture served as a proxy for agricultural data. It pro-vided the number of acres that are agricultural in each county (called “Land in Farms”; U.S. Bureau of the Census, 1980). Decadal values were normalized by the ratio of Land in Farms in 2000 to agricultural land cover in 2000 (taken from Land-sat TM data) for each county. These values were corrected by area-weighting the spatial relationship between each county and each VIC grid cell, which provided the percent agricultural for each VIC grid cell.
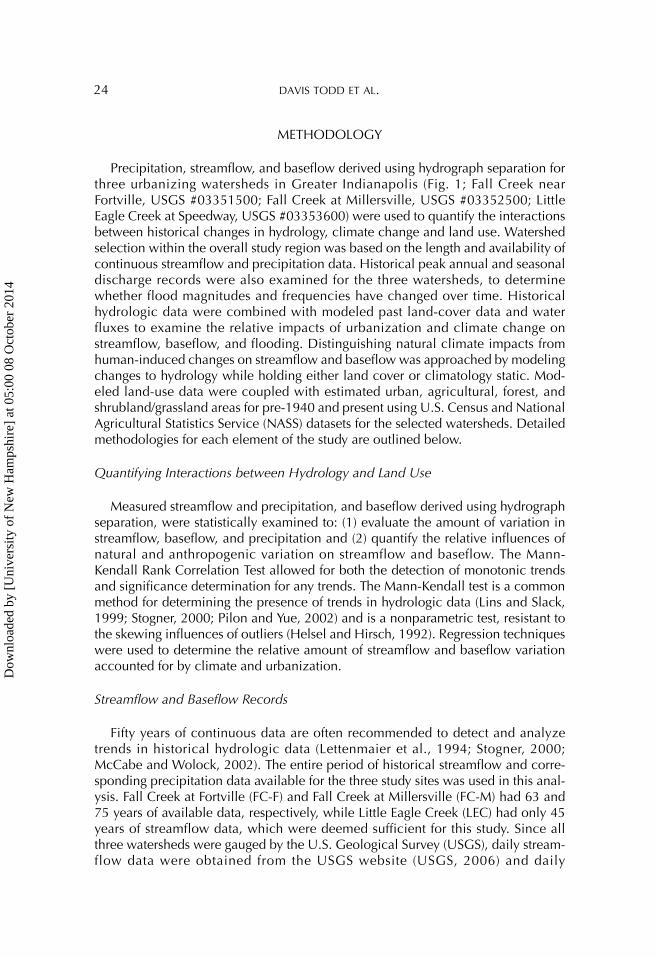
Table 1. Significance Level of Peak Precipitation Trends for the Study Sitesa
Peak annual Peak winter Peak spring Peak summer Peak autumn
Little Eagle Creek .641 .737 .081 .50 .045
Fall Creek near Fortville .739 .636 .763 .504 .393
Fall Creek near Millersville .727 .373 .601 .717 .251aValues approaching zero are the most significant increases, while the values closer to one indicate decreases. Although not significant, peak annual precipitation is increasing, while peak autumn precipitation is increasing. The bold value indicates statistical significance at the α = .05 level.
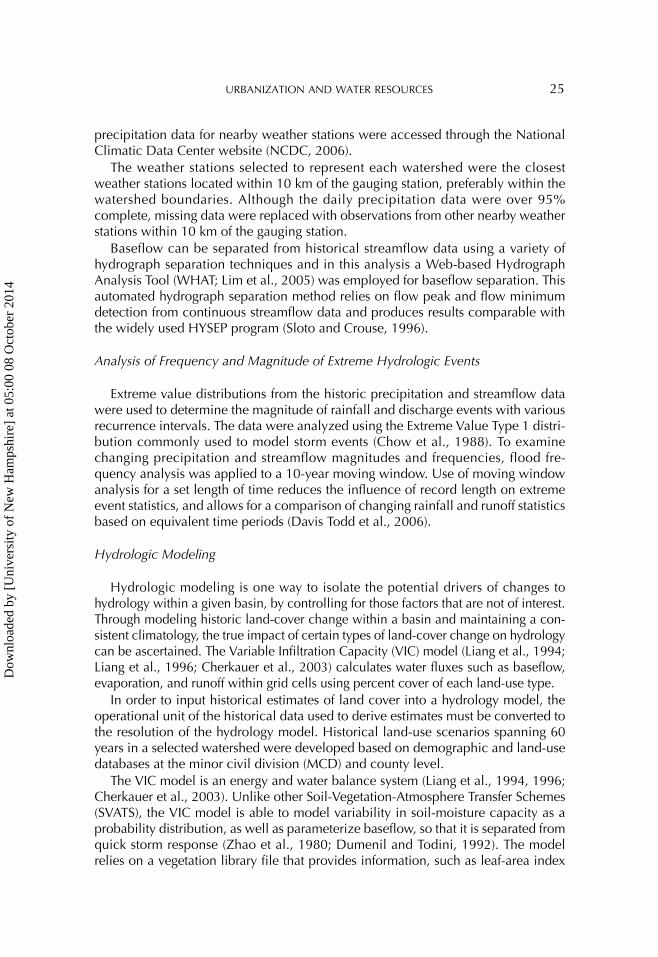
Table 2. Significance Level of Total Precipitation Trends for the Study Sitesa
Total annual Total winter Total spring Total summer Total autumn
Little Eagle Creek .292 .896 .19 .146 .04
Fall Creek near Fortville .621 .514 .935 .384 .163
Fall Creek near Millersville .164 .217 .512 .165 .106aValues approaching zero are the most significant increases, while the values closer to one indicate decreases. The bold value indicates statistical significance at the α = .05 level.
Dow
nloa
ded
by [
Uni
vers
ity o
f N
ew H
amps
hire
] at
05:
00 0
8 O
ctob
er 2
014

URBANIZATION AND WATER RESOURCES 27
The percent of each VIC grid cell covered by the remaining two land uses—shrubland/grassland and forest—was determined by applying a transition matrix for the watershed from 1978 to 1998. The ratios of change from and to each of the four land uses were combined with the estimated urban and agricultural values for 1940 to generate estimates of shrubland/grassland and forest for the VIC grid cells. In this way, the output of the model was land cover for 1940, a time for which reliable his-torical land-use data are not available.
RESULTS AND DISCUSSION
Historical Precipitation
Mann-Kendall trend analysis indicated no statistically significant trends in peak annual daily precipitation or total annual precipitation for the three study sites (Tables 1 and 2). Seasonal precipitation analysis, however, showed that autumn pre-cipitation in the Little Eagle Creek (LEC) watershed is increasing; peak autumn daily precipitation and total autumn precipitation both show statistically significant increasing trends in the LEC watershed.
The timing of peak precipitation events was also examined to determine whether they were correlated with peak discharge events. As expected, most peak precipi-tation events occur in the summer months of June and July, while peak streamflow events tend to occur in the late-winter (February) and spring (May). Approximately 30% of peak daily precipitation events were directly correlated with peak daily streamflow events for LEC and FC-F, while the frequency was lower (23%) for FC-M. These findings indicate that over two-thirds of peak streamflow events are not directly caused by peak daily precipitation events. Many peak streamflow events were the result of several days of precipitation, rather than a single day of heavy rainfall. Further examination of the relationship between seasonal precipitation and streamflow, however, indicated that peak events are occurring in concert with one another more frequently in the later part of the record. Prior to 1980, many peak precipitation events caused elevated discharge levels, but not peak streamflow events. After 1980, however, the correlation between annual peak daily precipita-tion and annual peak daily streamflow events is much higher, possibly indicating a decreased lag time due to land-use conversion.
A 10-year moving-window analysis indicated no consistent change in the 24-hour events for all precipitation recurrence intervals over the period of record. This
Table 3. Significance Level of Trends in Annual Baseflow Found UsingLinear Regression and the Mann-Kendall Test for the Study Sitesa
Linear regressionP-value Mann-Kendall significance level
Little Eagle Creek .001 .0005
Fall Creek near Fortville .07 .009
Fall Creek near Millersville .02 .007aValues approaching zero are the most significant increases, while the values closer to one indi-cate decreases. The bold values indicate statistical significance at the α = .05 level.
Dow
nloa
ded
by [
Uni
vers
ity o
f N
ew H
amps
hire
] at
05:
00 0
8 O
ctob
er 2
014
28 DAVIS TODD ET AL.
suggests that high-magnitude precipitation events are not becoming more frequent or intense at this site. Although much of the Midwest has experienced a change in extreme precipitation events, these trends do not appear as pronounced in central Indiana (Davis Todd et al., 2006).
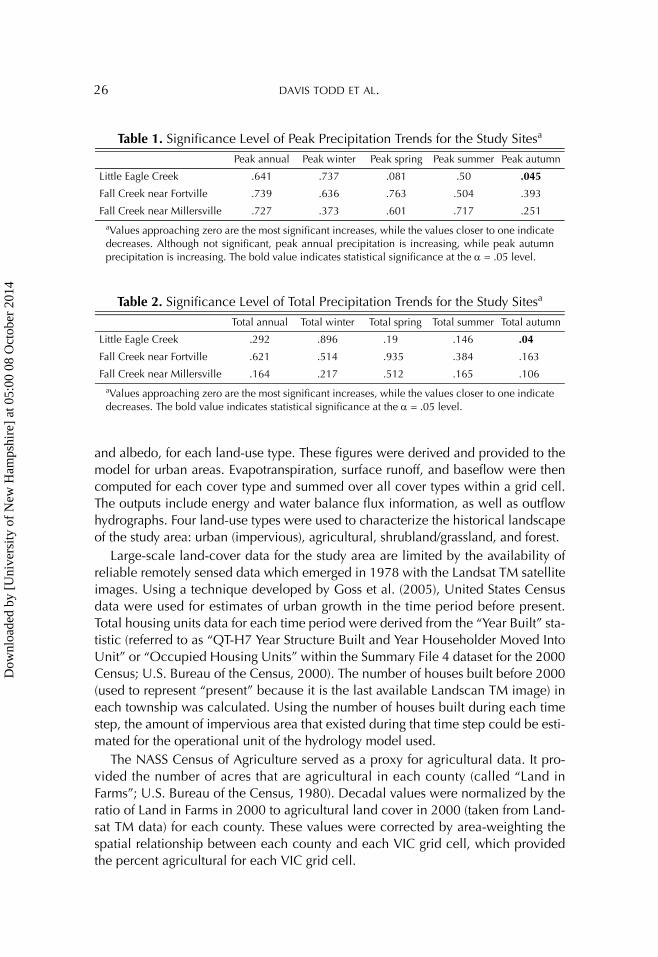
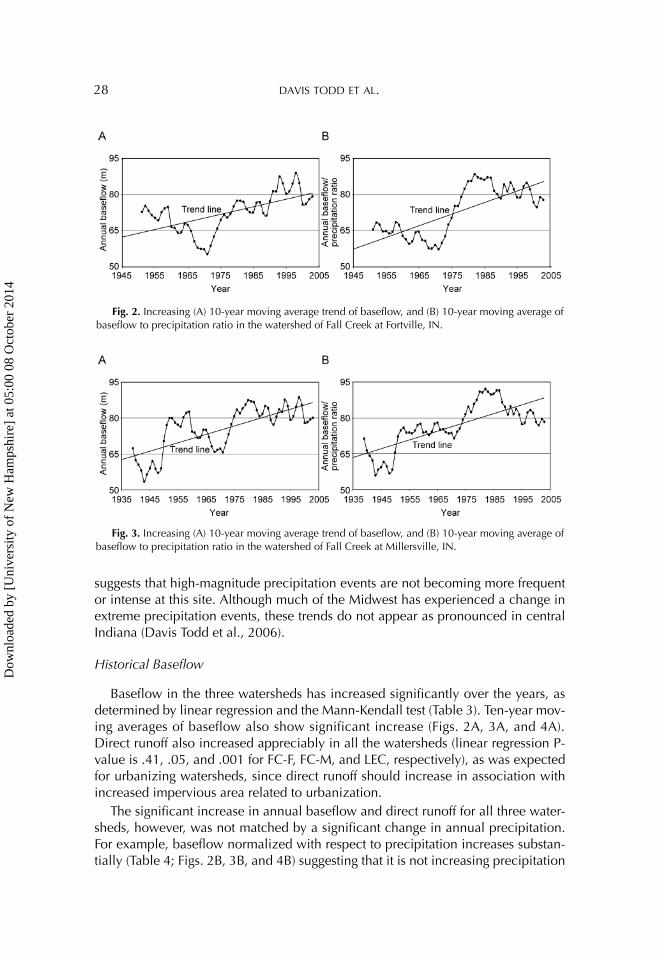
Historical Baseflow
Baseflow in the three watersheds has increased significantly over the years, as determined by linear regression and the Mann-Kendall test (Table 3). Ten-year mov-ing averages of baseflow also show significant increase (Figs. 2A, 3A, and 4A). Direct runoff also increased appreciably in all the watersheds (linear regression P-value is .41, .05, and .001 for FC-F, FC-M, and LEC, respectively), as was expected for urbanizing watersheds, since direct runoff should increase in association with increased impervious area related to urbanization.
The significant increase in annual baseflow and direct runoff for all three water-sheds, however, was not matched by a significant change in annual precipitation. For example, baseflow normalized with respect to precipitation increases substan-tially (Table 4; Figs. 2B, 3B, and 4B) suggesting that it is not increasing precipitation
Fig. 2. Increasing (A) 10-year moving average trend of baseflow, and (B) 10-year moving average of baseflow to precipitation ratio in the watershed of Fall Creek at Fortville, IN.
Fig. 3. Increasing (A) 10-year moving average trend of baseflow, and (B) 10-year moving average of baseflow to precipitation ratio in the watershed of Fall Creek at Millersville, IN.
Dow
nloa
ded
by [
Uni
vers
ity o
f N
ew H
amps
hire
] at
05:
00 0
8 O
ctob
er 2
014
URBANIZATION AND WATER RESOURCES 29
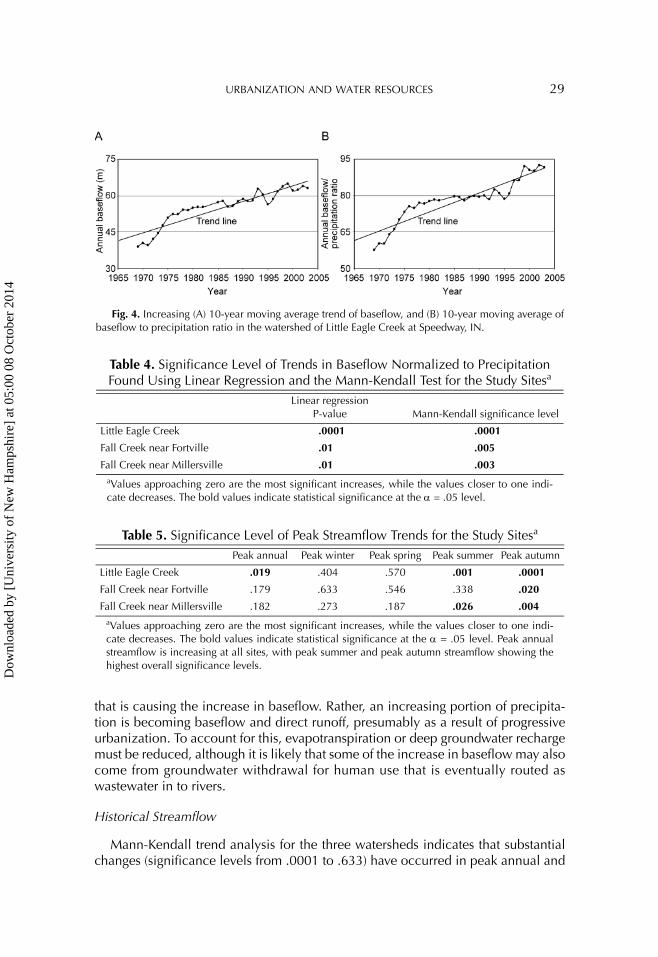
that is causing the increase in baseflow. Rather, an increasing portion of precipita-tion is becoming baseflow and direct runoff, presumably as a result of progressive urbanization. To account for this, evapotranspiration or deep groundwater recharge must be reduced, although it is likely that some of the increase in baseflow may also come from groundwater withdrawal for human use that is eventually routed as wastewater in to rivers.
Historical Streamflow
Mann-Kendall trend analysis for the three watersheds indicates that substantial changes (significance levels from .0001 to .633) have occurred in peak annual and
Table 4. Significance Level of Trends in Baseflow Normalized to Precipitation Found Using Linear Regression and the Mann-Kendall Test for the Study Sitesa
Linear regressionP-value Mann-Kendall significance level
Little Eagle Creek .0001 .0001
Fall Creek near Fortville .01 .005
Fall Creek near Millersville .01 .003aValues approaching zero are the most significant increases, while the values closer to one indi-cate decreases. The bold values indicate statistical significance at the α = .05 level.
Table 5. Significance Level of Peak Streamflow Trends for the Study Sitesa
Peak annual Peak winter Peak spring Peak summer Peak autumn
Little Eagle Creek .019 .404 .570 .001 .0001
Fall Creek near Fortville .179 .633 .546 .338 .020
Fall Creek near Millersville .182 .273 .187 .026 .004aValues approaching zero are the most significant increases, while the values closer to one indi-cate decreases. The bold values indicate statistical significance at the α = .05 level. Peak annual streamflow is increasing at all sites, with peak summer and peak autumn streamflow showing the highest overall significance levels.
Fig. 4. Increasing (A) 10-year moving average trend of baseflow, and (B) 10-year moving average of baseflow to precipitation ratio in the watershed of Little Eagle Creek at Speedway, IN.
Dow
nloa
ded
by [
Uni
vers
ity o
f N
ew H
amps
hire
] at
05:
00 0
8 O
ctob
er 2
014
30 DAVIS TODD ET AL.
peak seasonal streamflow (Table 5). LEC has experienced the greatest change in peak streamflow, with statistically significant increasing trends in peak annual, peak summer, and peak autumn streamflow. Both Fall Creek sites had statistically significant increasing trends in peak autumn streamflow and FC-M also showed a statistically significant increasing trend in peak summer streamflow.
As with the baseflow, streamflow was normalized with respect to precipitation and subjected to Mann-Kendall trend analysis. The resulting significance levels (.002, .005, and .0001 for FC-F, FC-M, and LEC, respectively) indicate statistically significant increasing trends in normalized streamflow, suggesting that land-use change rather than precipitation is the driving force in observed streamflow trends.
Further investigation into seasonal streamflow at the sites indicated that a low percentage (approximately 10%) of peak annual discharge events occur in autumn, so the changes observed in peak annual streamflow were probably not driven by the autumnal increases in precipitation. This is important for local water-resource mangers, as a shift from the typical late-winter/early-spring peak discharge to autumn would result in very different management practices. Heavy streamflow occurring early in the growing season is important for crop productivity, as well as providing the basis for water supply and recreational reservoirs. Since the peak autumn streamflow trends were so strong at all three sites, further investigation is needed to determine if this matches a regional pattern of seasonal streamflow change.
Flood Magnitude
Extreme value distributions from the historic data were used to determine the magnitude of high discharge events with various recurrence intervals. Rapidly urbanizing areas are at risk for unexpected flash flooding events, and thus there is considerable interest in any changes in flood frequency in areas such as Greater Indianapolis. A 10-year moving window analysis indicated that flood magnitude has not experienced a dramatic change over the period of record, in contrast to trends found in other areas of the Midwest (Changnon and Kunkel, 1995). This could be the result of the fact that there are dams in the upper reaches of these watersheds, which serve to regulate the discharge of water at both sites.
Modeled Land-Cover Change and Water Fluxes
The empirical data suggest that increases in baseflow and direct runoff are occur-ring in the absence of significant increases in precipitation. It is hypothesized that this is a result of the land-cover component of land-use change, and to examine this possibility we used a distributed hydrologic model to predict changes in water fluxes that might be expected in one of the study watersheds (FC-F) as a result of his-torical land-cover change (comparing 1940 land cover with 2000 land cover). Use of a distributed hydrologic model also allows for the identification of spatial pat-terns and trends in water fluxes within a watershed that cannot be detected by sim-ply examining a point value of baseflow or streamflow at the watershed outlet.
Dow
nloa
ded
by [
Uni
vers
ity o
f N
ew H
amps
hire
] at
05:
00 0
8 O
ctob
er 2
014
URBANIZATION AND WATER RESOURCES 31
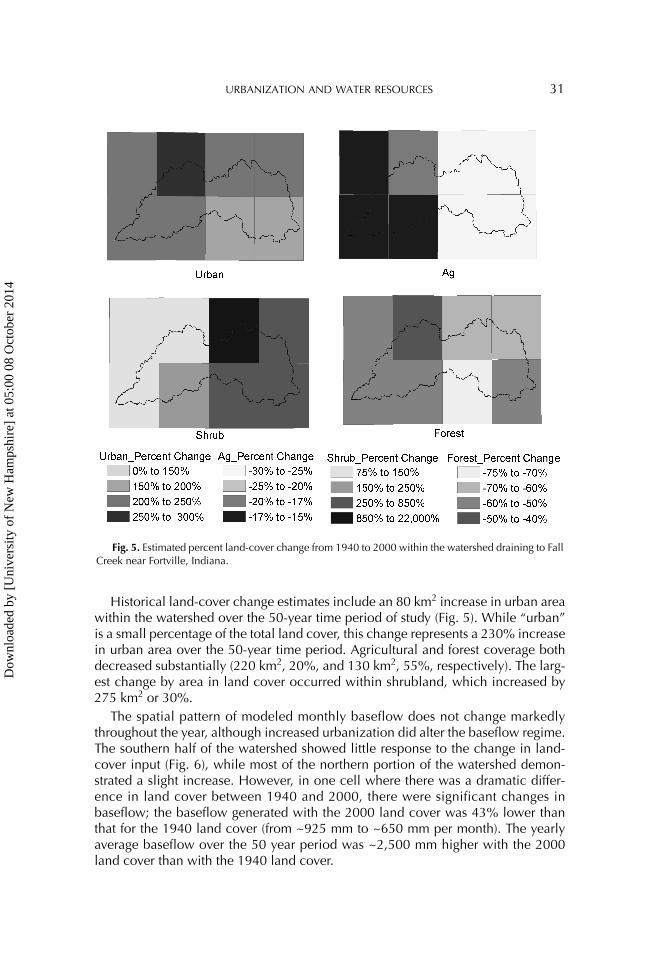
Historical land-cover change estimates include an 80 km2 increase in urban area within the watershed over the 50-year time period of study (Fig. 5). While “urban” is a small percentage of the total land cover, this change represents a 230% increase in urban area over the 50-year time period. Agricultural and forest coverage both decreased substantially (220 km2, 20%, and 130 km2, 55%, respectively). The larg-est change by area in land cover occurred within shrubland, which increased by 275 km2 or 30%.
The spatial pattern of modeled monthly baseflow does not change markedly throughout the year, although increased urbanization did alter the baseflow regime. The southern half of the watershed showed little response to the change in land-cover input (Fig. 6), while most of the northern portion of the watershed demon-strated a slight increase. However, in one cell where there was a dramatic differ-ence in land cover between 1940 and 2000, there were significant changes in baseflow; the baseflow generated with the 2000 land cover was 43% lower than that for the 1940 land cover (from ~925 mm to ~650 mm per month). The yearly average baseflow over the 50 year period was ~2,500 mm higher with the 2000 land cover than with the 1940 land cover.
Fig. 5. Estimated percent land-cover change from 1940 to 2000 within the watershed draining to Fall Creek near Fortville, Indiana.
Dow
nloa
ded
by [
Uni
vers
ity o
f N
ew H
amps
hire
] at
05:
00 0
8 O
ctob
er 2
014
32 DAVIS TODD ET AL.
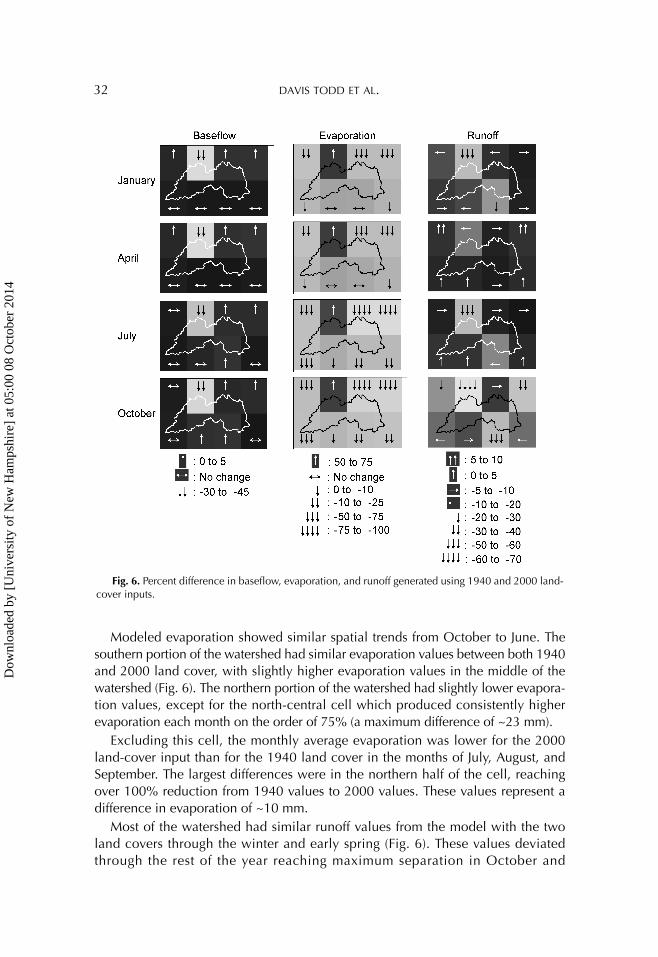
Modeled evaporation showed similar spatial trends from October to June. The southern portion of the watershed had similar evaporation values between both 1940 and 2000 land cover, with slightly higher evaporation values in the middle of the watershed (Fig. 6). The northern portion of the watershed had slightly lower evapora-tion values, except for the north-central cell which produced consistently higher evaporation each month on the order of 75% (a maximum difference of ~23 mm).
Excluding this cell, the monthly average evaporation was lower for the 2000 land-cover input than for the 1940 land cover in the months of July, August, and September. The largest differences were in the northern half of the cell, reaching over 100% reduction from 1940 values to 2000 values. These values represent a difference in evaporation of ~10 mm.
Most of the watershed had similar runoff values from the model with the two land covers through the winter and early spring (Fig. 6). These values deviated through the rest of the year reaching maximum separation in October and
Fig. 6. Percent difference in baseflow, evaporation, and runoff generated using 1940 and 2000 land-cover inputs.
Dow
nloa
ded
by [
Uni
vers
ity o
f N
ew H
amps
hire
] at
05:
00 0
8 O
ctob
er 2
014

URBANIZATION AND WATER RESOURCES 33
November. Year 2000 land cover resulted in lower runoff values for most of the watershed than for the 1940 land cover, yet most of the difference between cells was within 50%. The north-central cell with higher precipitation inputs produced some of the largest differences between the two land covers. In some months, up to 70% less runoff (13 mm vs. 8 mm) was produced with the 2000 land cover than the 1940 land cover. The total runoff generated by cells within the watershed was slightly larger with the 1940 land cover than the 2000 land cover (3114 mm and 2833 mm, respectively).
The details of the land-cover change scenario provide insight in to why there was a decrease in model-predicted runoff, despite urbanization. Generally, agriculture produces more evapotranspiration and runoff than shrubland within the model framework. A decrease in forest cover and increase in urban cover should increase runoff, but the increase in shrubland attenuated this change. Thus the model sug-gests that land-cover change alone may not explain the empirical observation of increasing runoff and baseflow during a period of no significant precipitation change. This suggests that groundwater that is withdrawn from aquifers for human use and then returned as wastewater to rivers may be an important component of the change in streamflow. As groundwater withdrawal increases with population size, and water use per person has increased over time with increasing standards of living, it is likely that the diversion of groundwater to surface water has increased roughly parallel to the increase in urbanization over time in Greater Indianapolis.
CONCLUSIONS
The integrated approach outlined in this study, combining statistical analyses of precipitation, streamflow and baseflow data with hydrologic modeling of the impacts of land-cover change allowed for the quantification of hydrologic changes important for areas such as water resources and flood hazards, including a better understanding of likely causal relationships. No statistically significant trends were found in the precipitation record for any of the study sites, although streamflow and baseflow were found to have increased. The increases in streamflow were most dra-matic in the autumn months, but were not matched by similar precipitation increases. The lack of correlation between precipitation and streamflow and base-flow were further illustrated by very significant trends in flow normalized to precip-itation, suggesting that land conversion influenced watershed hydrology to a greater degree than climate change. Estimated land-cover changes combined with hydro-logic modeling, however, do not match the observed hydrologic data: modeled baseflow increased slightly, modeled runoff decreased, and modeled evaporation decreased. It is possible that some of the increase in baseflow and streamflow may be the result of increased input of surface water from wastewater that originated as groundwater.
The information generated in this study can be used in developing approaches to minimize the effects of upstream urban land uses on downstream processes, and will also be used in a reevaluation of current watershed planning for Greater Indianapolis. A better understanding of the water and energy fluxes between land, atmosphere, and hydrology enables the development of strategies to mitigate the
Dow
nloa
ded
by [
Uni
vers
ity o
f N
ew H
amps
hire
] at
05:
00 0
8 O
ctob
er 2
014
34 DAVIS TODD ET AL.
impacts of future landscape transformation and climate change. Knowledge of cur-rent streamflow regimes and prediction of future effects on flood frequency and magnitude will allow for better planning and mitigation of damage, and a better understanding of how environmental systems respond to both climate change and urbanization. An improved understanding of how watersheds function and how human activities (such as urbanization) impact water resources enables government agencies and communities to manage water resources more effectively.
Acknowledgments: This work was funded in part by a grant from the Indiana Water Resources Research Center. Additionally, Davis Todd was a supported on a fellowship through the NSF GK-12 Program and funding from the Purdue Research Foundation, Goss was supported by a fellowship from the U.S. EPA Science To Achieve Results (STAR) Program and Tripathy was supported by funding from the Northeastern Illinois Planning Commission (NIPC), Chicago.
REFERENCES
Arvin, D. V. and Spaeth, R. (2000) Trends in Indiana’s Water Use, 1986–1996. Indianapolis, IN: Indiana Department of Natural Resources, Division of Water Special Report No. 1.
Bhaduri, B., Harbor, J., Engel, B., and Grove, M. (2000) Assessing watershed-scale, long-term hydrologic impacts of land use change using a GIS-NPS model. Envi-ronmental Management, Vol. 26, 643–658.
Changnon, S. A. and Kunkel, K. E. (1995) Climate-related fluctuations in Midwest-ern floods during 1921–1985. Journal of Water Resources Planning and Manage-ment, Vol. 121, 326–334.
Cherkauer, K. A., Bowling, L. C., and Lettenmaier, D. P. (2003) Variable Infiltration Capacity (VIC) cold land process model updates. Global and Planetary Change, Vol. 38, 151–159.
Chow, V. T., Maidment, D. R., and Mays, L. W. (1988) Applied Hydrology. New York, NY: McGraw-Hill.
Davis Todd, C. E., Harbor, J. M., and Tyner, B. (2006) Increasing magnitudes and frequencies of extreme precipitation events used for engineering design in the Midwestern United States. Journal of Soil and Water Conservation, Vol. 61, 179–185.
DeFries, R. and Eshleman, K. N. (2004) Land-use change and hydrologic processes: A major focus for the future. Hydrological Processes, Vol. 18, 2183–2186.
Dumenil, L. and Todini, E. (1992) A rainfall-runoff scheme for use in the Hamburg climate model. In P. O’Kane, ed., Advances in Theoretical Hydrology, A Tribute to James Dooge, European Geophysical Society Series on Hydrological Sciences 1. Amsterdam, The Netherlands: Elsevier, 129–157.
Endale, D. M., Fisher, D. S., and Steiner, J. L. (2006) Hydrology of a zero-order Southern Piedmont watershed through 45 years of changing agricultural land use. Part 1. Monthly and seasonal rainfall-runoff relationships. Journal of Hydrol-ogy, Vol. 316, Nos. 1–4, 1–12.
Environmental Protection Agency. (1998) STAR Report: Water and Watershed Research. Washington, DC: U.S. EPA Office of Research and Development’s Sci-ence to Achieve Results (STAR) Research in progress 2:4. EPA/600/F-98/017.
Dow
nloa
ded
by [
Uni
vers
ity o
f N
ew H
amps
hire
] at
05:
00 0
8 O
ctob
er 2
014
URBANIZATION AND WATER RESOURCES 35
Goodrich, D. C., Faures, J. M., Woolhiser, D. A., Lane, L. J., and Sorooshian, S. (1995) Measurement and analysis of small-scale convective storm rainfall vari-ability. Journal of Hydrology, Vol. 173, Nos. 1–4, 283–308.
Goss, A. M., Bowling, L., and Harbor, J. (2005) Recreating Historical Land Cover Change for Hydrologic Impact Analysis, Muskegon Watershed, MI. Unpublished paper presented at the American Water Resources Association Annual Confer-ence, Seattle, WA.
Grove, M., Harbor, J., Engel, B., and Muthukrishnan, S. (2001) Impacts of urbaniza-tion on surface hydrology, Little Eagle Creek, Indiana, and analysis of LTHIA model sensitivity to data resolution. Physical Geography, Vol. 22, 135–153.
Harbor, J., Bhaduri, B., Minner. M., Jaganapathy, S., Herzog, M., and Teufert, J. (2001) Urbanization and Environment. In A. Orme, ed., The Physical Geography of North America. New York, NY: Oxford University Press, Oxford Regional Environments Series, 501–515.
Helsel, D. R. and Hirsch, R. M. (1992) Statistical Methods in Water Resources. New York, NY: Elsevier.
Karl, T. R. and Knight, R. W. (1998) Secular trends of precipitation amount, fre-quency, and intensity in the United States. Bulletin of the American Meteorolog-ical Society, Vol. 79, 231–241.
Leopold, L. B. (1968) Hydrology for Urban Land Planning—A Guidebook on the Hydrologic Effects of Urban Land Use. Reston, VA: USGS Circular 554.
Lettenmaier, D. P., Wood, E. F., and Wallis, J. R. (1994) Hydroclimatological trends in the continental United States, 1948–88. Journal of Climate, Vol. 7, 586–607.
Liang, X., Lettenmaier, D. P., Wood, E. F., and Burges, S. J. (1994) A simple hydrologically-based model of land surface water and energy fluxes for GCMs. Journal of Geophysical Research, Vol. 99, No. D7, 14415–14428.
Liang, X., Wood, E. F., and Lettenmaier, D. P. (1996) Surface soil moisture parame-terization of the VIC-2L model: Evaluation and modifications. Global and Plane-tary Change, Vol. 13, 195–206.
Lim, K. J., Engel, B. A., Tang, Z., Choi, J., Kim, K., Muthukrishnan, S., and Tripathy, D. (2005) Automated Web GIS Based Hydrograph Analysis Tool, WHAT. Journal of the American Water Resources Association, Vol. 41, No. 6, 1407–1416.
Lins, H. F. and Slack, J. R. (1999) Streamflow trends in the United States. Geophys-ical Research Letters, Vol. 26, 227–230.
McCabe, G. J. and Wolock, D. M. (2002) A step increase in streamflow in the con-terminous United States. Geophysical Research Letters, Vol. 29, 38.1–38.4.
National Climatic Data Center. (2006) National Climatic Data Center. Retrieved January 19, 2006, from the National Climatic Data Center website at http://www.ncdc.noaa.gov/oa/ncdc.html
National Science Foundation Advisory Committee for Environmental Research and Education. (2003) Complex Environmental Systems: Synthesis for Earth, Life, and Society in the 21st Century. Retrieved November 30, 2004, from the National Science Foundation website at http://www.nsf.gov/geo/ere/ereweb/ac-ere/acere_synthesis_rpt_full.pdf
Pilon, P. J. and Yue, S. (2002) Detecting climate-related trends in streamflow data. Water Science and Technology, Vol. 45, 89–104.
Dow
nloa
ded
by [
Uni
vers
ity o
f N
ew H
amps
hire
] at
05:
00 0
8 O
ctob
er 2
014
36 DAVIS TODD ET AL.
Sloto, R. A. and Crouse, M. Y. (1996) A Computer Program for Stream Flow Hydrograph Separation and Analysis. Reston, VA: U.S. Geological Survey, Water-Resources Investigations Report 96-4040.
Stogner, R. W., Sr. (2000) Trends in Precipitation and Streamflow and Changes in Stream Morphology in the Fountain Creek Watershed, Colorado, 1939–1999. Reston, VA: U.S. Geological Survey, Water Resources Investigation Report 00-4130.
Sun, G., Amatya, D. M., McNulty, S. G., Skaggs, R. W., and Hughes, J. H. (2000). Climate change impacts on the hydrology and productivity of a pine plantation. Journal of the American Water Resources Association, Vol. 36, No. 2, 367–374.
U.S. Bureau of the Census. (1980) United States Census of Agriculture 1978. Washington, DC: Government Printing Office.
U.S. Bureau of the Census. (2000) Census 2000 Summary File. Available at http://factfinder.census.gov
U.S. Geological Survey. (2006) Surface Water Data for the Nation. Retrieved March 30, 2006, from the U.S. Geological Survey website at http://waterdata.usgs.gov/nwis/sw
Zhao, R. J., Zhang, Y. L., Fang, L. R., Liu, X. R., and Zhang, Q. S. (1980) The Xinanjiang model. In Hydrological Forecasting Proceedings: Oxford Symposium, Vol. 129. Wallingford, Oxfordshire, UK: International Association of Hydrologi-cal Sciences, 351–356.
Dow
nloa
ded
by [
Uni
vers
ity o
f N
ew H
amps
hire
] at
05:
00 0
8 O
ctob
er 2
014