the effects of immunity and drug resistance on the
TRANSCRIPT

Page 1 of 21 U.Y. Madaki, M. A. Jatau and S. B. Sambo 2021
GSJ: Volume 9, Issue 8, August 2021, Online: ISSN 2320-9186
www.globalscientificjournal.com THE EFFECTS OF IMMUNITY AND DRUG RESISTANCE ON THE
TRANSMISSION DYNAMICS OF TUBERCULOSIS
Umar Yusuf Madaki*, Mohammed Ahmed Jatau and Saudatu Baba Sambo Department of Mathematics and Statistics, Yobe State University, Damaturu, Nigeria ABSTRACT
In this research, a Susceptible-Exposed-Infected-Recovered (SEIR) epidemiological model was modified to determine the effect of immunity and drug resistance on the transmission dynamics of tuberculosis. The equilibrium point was found and its stability was investigated. By analyzing the model, we found a threshold value R0, the basic reproduction number and the existence of the endemic point. The disease free equilibrium point of the model is locally stable (Eq0) since basic reproduction number R0<1 which was obtained from the numerical simulation of the model. The model has two non-negative equilibrium namely the disease free equilibrium (Eq0) and endemic equilibrium point (EEP). The graphical solutions of the differential equations were developed using MATLAB as well as the computer simulation.
BACKGROUND OF THE STUDY The sequencing of the genome for M. tuberculosis, completed in 1998 at the Sange Institute in Paris, must rank as one of the most important developments in the study of the history of tuberculosis. There are two principal reasons for this. First, it enabled scientists to confirm that human remains from prehistoric times, which were believed to show signs of tuberculosis disease on clinical grounds, could now be proved to have the tubercle bacillus present in the tissues. The DNA of the bacillus could be extracted from such specimens and provide positive identification. Secondly, the structure of the genomic sequence disproved an earlier hypothesis that humans had derived their disease from the animals they kept. For this to be true, the bacteria usually causing disease in animals, M. bovis, would have to have been the antecedent of the human tuberculosis bacterium, M. tuberculosis. Comparing the two bacterial genomes it is apparent that M. tuberculosis was, if anything, the antecedent of M. bovis, not the other way round. Therefore, it is possible that humans gave their disease to the animals. Further study is needed on this new genome driven hypothesis. Tuberculosis is an airborne disease caused by Mycobacterium tuberculosis (MTB) bacteria. It is an ancient disease with evidence of its existence being found in relics from ancient Egypt, India and China. In the eighteenth century, Western Europe suffered terribly from this disease with prevalence as high as 900 deaths per 100,000. This was largely due
GSJ: Volume 9, Issue 8, August 2021 ISSN 2320-9186 226
GSJ© 2021 www.globalscientificjournal.com
Page 2 of 21 U.Y. Madaki, M. A. Jatau and S. B. Sambo 2021
to poor ventilation, overcrowded housing, primitive sanitation and malnutrition among other risk factors that led to the epidemic (Daniel, 2006). Today, this disease ranks as the second leading cause of morbidity and mortality in the world from a single infectious agent, after the human immunodeficiency virus (HIV). Interestingly, about one-third of the world’s population is infected with MTB with approximately nine million people developing active tuberculosis and up to nearly two million people worldwide died from the disease every year. Clearly, this reveals that the current investment in tuberculosis falls below the low and middle-income country’s needs. (MTB) bacteria spread through inhaling droplets from the cough or sneeze of a person suffering from active tuberculosis. The bacteria enters the body causing an MTB infection affecting majorly the lungs but it can also affect any other part of the body including the urinary tract, brain, lymph nodes, bones, joints and the ear. Person(s) with lowered immunity such as those with HIV, diabetes, immune disorders, end-stage renal disease, those on drugs that suppress immunity, young children and pregnant women among others are at a higher risk of contracting the disease (Mandal, 2013). Also people suffering from malnutrition due to lifestyle, drug abuse or poverty equally are at risk of contracting tuberculosis. Another category of people largely at risk of contracting tuberculosis are those who work closely or live close to a person with active tuberculosis and they could include health care workers, people living in crowded living spaces or confined places such as schools or prisons (Zaman, 2010). The intensity of transmission depends on factors related to the bacteria, the human host, the environment and migration. Non-climatic factors such as environmental development and urbanization, population movement and migration affect the severity and incidence of tuberculosis. When it comes to environment and urbanization, the incidence of tuberculosis is generally lower in prime urban areas than in rural areas as there is difficult accessing proper medical care in rural villages compared to urban areas. However, rapid urbanization of areas within or on the outskirts of urban centers is commonly done in an uncontrolled fashion without thought or planning. The settlers are mainly migrant workers from rural villages and they tend to settle mostly in poor, overcrowded houses commonly known as slums with hardly any proper sanitation and this in turn leads to increased exposure of the population to MTB hence a possibility of amplification of the disease to epidemic proportions through lack of effective treatment (Mandal, 2013).
Population movements have significant implications for tuberculosis transmission as migration introduces tuberculosis problem to the areas to which the migrants migrate to. Temporary migrant workers often bring the bacteria to lower prevalence areas and local transmission can be readily established (Semenza et al., 2010). Tuberculosis is curable provided an early diagnosis is made and one follows the proper treatment regimen which could take six months up to two years for the active tuberculosis to clear (Trauer, Denholm and McBryde, 2014). In 2015, there were an estimated 480, 000 new cases of multidrug-resistant TB (MDR-TB) and an additional 100, 000 people with rifampicin-resistant TB (RR-TB) who were also newly eligible for MDR-TB treatment. India, China and the Russian Federation accounted for 45% of the combined 580, 000 cases (WHO, 2016). AIM AND OBJECTIVES OF THE STUDY The aim of this study is to model the effects of immunity and drug resistance on transmission dynamics of tuberculosis. Thus, the objectives are:
GSJ: Volume 9, Issue 8, August 2021 ISSN 2320-9186 227
GSJ© 2021 www.globalscientificjournal.com

Page 3 of 21 U.Y. Madaki, M. A. Jatau and S. B. Sambo 2021
1. To derive the disease free equilibrium. 2. To obtain the basic reproduction number. 3. To carry out stability analysis on the model. 4. To solve the model equations numerically to show the effects of immunity and drug resistance on transmission dynamics of tuberculosis. STATEMENT OF THE PROBLEM There were an estimated 1.4 million TB deaths in 2015, and an additional 0.4 million deaths resulting from TB disease among people living with HIV. Although the number of TB deaths fell by 22% between 2000 and 2015, TB remained one of the top 10 causes of death worldwide in 2015 (WHO, 2016). Andam, (2013) formulated a deterministic model for the transmission dynamics of tuberculosis. However, the model did not incorporate drug resistant to the first line of treatment of tuberculosis and immunity at susceptible class. We, therefore, intend to investigate the effects of immunity and drug resistance on transmission dynamics of tuberculosis. RESEARCH QUESTIONS 1. How do we know the diseases is in free equilibrium state? 2. How long does it obtain the reproduction number? 3. How does it stability analysis on the model? 4. To know whether there is effect of immunity and drug resistance on transmission dynamic of tuberculosis. SIGNIFICANCE OF THE STUDY Considering the epidemics of tuberculosis and its attendant effects on population, the need to develop an effective control and management strategy cannot be over emphasized. Studying the effects of immunity and drug resistance on transmission dynamics of tuberculosis may yield interesting results that may usher in a new dimension in the control management by health service providers. SCOPE OF THE STUDY This research is only restricted to the use of mathematical modeling to investigate the effects of immunity and drug resistance on the transmission dynamics tuberculosis. A system of non-linear ordinary differential equations is formed and the trace method is used to study the stability of Disease Free Equilibrium Points of the model followed by numerical simulation only. TB MODE OF TRANSMISSION TB is an infectious disease which is spread from person-to-person through the air by droplet nuclei. Droplet nuclei are produced when person with pulmonary or laryngeal tuberculosis cough, sneeze, spit talk or sing. The size of the nuclei is estimated to be about 1-5 and normal air current can keep them airborne for a long time and spread them throughout a room or building until they are removed by natural or mechanical ventilation. SIGNS AND SYMPTOMS OF TUBERCULOSIS 1. A bad cough that last three weeks or longer 2. Pain in the chest 3. Coughing up blood or sputum 4. Weakness or fatigue 5. Weight loss 6. No appetite
GSJ: Volume 9, Issue 8, August 2021 ISSN 2320-9186 228
GSJ© 2021 www.globalscientificjournal.com

Page 4 of 21 U.Y. Madaki, M. A. Jatau and S. B. Sambo 2021
7. Fever 8. Sweating at night TREATMENT OF TUBERCULOSIS Antibiotics are used in the treatment of tuberculosis. Antibiotics treatment therapy is lengthy and one have to take them for 6 to 12 months to completely destroy the bacteria, the length of treatment and the type of drug that is needed is determined by age, overall health, result of susceptibility tests and weather one have TB infection or active TB. A REVIEW OF SOME RELATED LITERATURE Epidemiology of Tuberculosis Tuberculosis (TB) is one of the major public health threats, competing with the human immunodeficiency virus (HIV) as the cause of death due to infectious diseases worldwide. Although a declining trend in TB incidence, prevalence and mortality has been observed over the last decade, elimination of the disease at global level is still out of reach, and massive resource investment is still required. TB is a poverty-related disease that disproportionately affects the poorest; the most vulnerable and marginalized population groups wherever it occurs. Improving access to diagnosis and care, the basic requirements in the fight against TB, are particularly challenging in these persons. Besides, TB control cannot be carried out without setting up an effective surveillance system in order to define the course of the epidemic and assess the impact of control measures on the disease. Hence, TB national programs must devote significant resources to the disease-specific recording and reporting system. Routine surveillance systems represent the best method for drug resistance assessment and monitoring, though high-quality data can be generated only by the allocation of significant resources. The increasing number of detected multidrug-resistant forms is among the current most frightening issues, requiring a strong and comprehensive commitment in terms of funds allocation, research promotion and field implementation of new tools and protocols (WHO, 2014). MATHEMATICAL MODELS ON TUBERCULOSIS The first model for the transmission dynamics of tuberculosis was developed by Waaler, and Anderson (1962) who used a mathematical model to study the epidemiology of tuberculosis. With time other models have been developed to help prevent the risk of transmission of tuberculosis. Recent global reports of multidrug resistant and extensively drug-resistant tuberculosis have renewed concerns that antibiotic resistance may undermine progress in tuberculosis control (Young, Stark and Kirschner, 2008). Including MDR tuberculosis in mathematical models is relatively new and there are very few models with this aspect. Mandal et al (2017), among the estimated 1 million cases of childhood (0-14 years) TB worldwide, about 75% occur in the 22 high burden countries only. Being one of the high burden countries for TB, almost 10% of total TB cases in India is Pediatric TB. Pediatric TB has traditionally received a lower priority compared to the adult form of the disease because it is considered non-infectious, difficult to diagnose, too few in number and the wrong assumption that effective control of adult TB along with BCG by itself could effectively control childhood TB. Fortunately, World Health Organization (WHO) and the Revised National Tuberculosis Control Program (RNTCP) in India have realized the importance of pediatric TB and included special considerations for the Pediatric TB. In the wake of the recent changes in the guidelines regarding diagnosis and management of TB by
GSJ: Volume 9, Issue 8, August 2021 ISSN 2320-9186 229
GSJ© 2021 www.globalscientificjournal.com
Page 5 of 21 U.Y. Madaki, M. A. Jatau and S. B. Sambo 2021
the RNTCP and WHO, we would like to highlight the changes applicable especially for the pediatric population: Three new goals in the management of TB have been adopted, viz. (a) relapse free cure; b) prevention of drug resistance and (c) break chain of transmission by rendering the patient non-infectious and decreasing the pool of infection. Definition of presumptive pediatric TB is provided which includes children with persistent fever and cough, loss of weight (loss of 5% body weight as compared to highest weight recorded)/no weight gain in last 3 months and history of contact with infectious TB cases. Diagnosis of tuberculosis based only on X-ray to be called as ‘Clinically diagnosed tuberculosis’. Classification based on drug resistance now also includes Mono-resistance (MR) and poly-drug resistance (PDR) TB apart from MDR (Multi-drug resistant) and XDR (Extensively-drug resistant) TB. MR is defined as resistance to one first-line anti-TB drug (ATD) only; while PDR refers to resistance to more than one first-line ATD, other than both INH and Rifampicin. Use of CBNAAT (Cartridge based nucleic acid amplification test) and Line probe assay for MTB (Mycobacterium tuberculosis) complex in pulmonary specimens for diagnosis of TBDR (Drug resistant)-TB in presumptive cases. Use of CBNAAT for the diagnosis of extrapulmonary TB (EPTB): (a) as an additional test to conventional smear microscopy, culture and cytology in fine-needle aspiration cytology (FNAC) specimens; (b) as an adjunctive test for tuberculous meningitis but (c) not be routinely used to diagnose pleural TB. Rapid drug susceptibility testing (DST) of at least Rifampicin is recommended at the time of TB diagnosis. In patients with Rifampicin-resistant or MDR- TB who have not been previously treated with second-line drugs and in whom resistance to fluoroquinolones and second-line injectable agents has been excluded or is considered highly unlikely, a shorter MDR-TB regimen of 9-12 months may be used. Agusto et al, (2015), used a deterministic model with isolation where they studied the transmission dynamics of three strains of mycobacterium tuberculosis (TB), namely; the drug sensitive, multi-drug-resistance (MDR) and extensively-drug-resistance (XDR) tuberculosis strains. Their result of the global sensitivity analysis indicated that the dominant parameters are the disease progression rate, the recovery rate, the infectivity parameter, the isolation rate, and the rate of cost to follow up and fraction of fast progression rates. They also found that an increase in isolation rate leads to a decrease in the total number of individuals who are cost to follow up. James M. Traver et al (2014), they present a mathematical model to stimulate Tuberculosis (TB) transmission in highly endemic regions of the Asia-Pacific, where epidemiology does not appear to be primarily driven by HIV co-infection deterministic model captures many of the observed phenomena important to disease dynamics, including partial and temporary vaccine efficacy, declining risk of active disease following infection, the possibility of re-infection both during the infection latent period and after treatment, multi-drug resistant TB (MDR - TB) and resistance during treatment. They found that the model could not be calibrated to the estimated incidence ratio without allowing for re-infection during latency, and that even in the presence of a moderate fitness cost and a lower value of R0, MDR - TB becomes the dominant strain at equilibrium.
GSJ: Volume 9, Issue 8, August 2021 ISSN 2320-9186 230
GSJ© 2021 www.globalscientificjournal.com

Page 6 of 21 U.Y. Madaki, M. A. Jatau and S. B. Sambo 2021
Mandal (2013), there is an emerging form of tuberculosis commonly known as multi-drug resistant (MDR) tuberculosis which is defined as tuberculosis resistant to both of the two most effective first line of antibiotic treatment of active tuberculosis i.e., isoniazid (INH) and rifampin (RIF), and it is harder and more expensive to treat. It is currently a major health concern to medical workers and researchers and one can get MDR tuberculosis by either spending time with an MDR patient or breathing in the MDR tuberculosis bacteria or those with active tuberculosis not following their prescribed treatment regimen or TB medicine not being readily available to them. MDR tuberculosis is much more difficult to treat and the mortality of persons with this form of tuberculosis is far much higher if the second line of antibiotic treatment is not effected promptly. Kalu A. U et al, (2013), also presented an epidemiological model that tuberculosis can effectively be controlled or even be eradicated if effort is made to ensure that the total removal rate from both the latent and the infectious classes is always less than the product of total contraction and total breakdown of the susceptible class. S.Mariam H. et al (2011), tuberculosis disease (TB) due to Mycobacterium tuberculosis infections caused an estimated 1.3 million deaths globally. When active TB is manifested the infection is normally treated with antibiotics, thereby providing an external pressure for the selection of antibiotic resistant bacilli. The risk of resistance development will be determined by a number of different factors, including the antibiotic selective pressure (set by the number, dosing and quality of the used drugs), any pre-existing resistances in the infecting clone, the immune status of the treated individuals and their compliance with the drug regime. In addition, since all resistance development in M. tuberculosis occurs via mutational changes in the chromosome, the bacterial population size and the bacterial mutation rate will also affect the probability by which resistant clones appear during treatment. Furthermore, the ability of a resistant clone to grow and rise in frequency in the treated individual is influenced by the effect of the resistance on bacterial fitness. Bhunu et al, (2008), presented a SEIR tuberculosis model which incorporated treatment of infectious individuals and chemoprophylaxis (treatment for the latently infected). The model assumed that the latently infected individuals develop active disease as a result of endogenous re-activation, exogenous re-infection and disease relapse. The study shows that treatment of infectious individuals is more effective in the first years of implementation as it cleared active TB immediately. As a result, chemoprophylaxis will do better in controlling the number of infectious due to reduced progression to active TB. Cohen, and Murray (2004), modeled epidemics of multi- drug resistant tuberculosis of heterogeneous fitness. Their model suggested that the threat of multidrug resistance to tuberculosis control depends on relative fitness of MDR strains and this implied that the strains is considerably less than that of drug-sensitive strains and that the emergence of resistance would not jeopardize the success of tuberculosis control efforts. Their results implied that current epidemiological measures and short- term trends in the burden of MDR tuberculosis do not provide evidence that MDR tuberculosis strains can be contained in the absence of specific efforts to limit transmission from those with MDR disease. Ziv et al, (2001), used an SEIR-model with fast and slow progression to numerically compare the effects of preventative treatment of those in the fast-progressing latent class with treatment of those with active, infectious disease. They concluded that contact tracing and preventative treatment compare quite favourably to treatment of those with the disease.
GSJ: Volume 9, Issue 8, August 2021 ISSN 2320-9186 231
GSJ© 2021 www.globalscientificjournal.com

Page 7 of 21 U.Y. Madaki, M. A. Jatau and S. B. Sambo 2021
Dye et al, (1998), presented a model with explicit fast and slow progression from two latent classes. They studied drug-resistant TB alone, representing treatment failures as potential transmitters of drug-resistant TB. Using Monte Carlo methods to estimate the model’s R0 for drug-resistant TB, they argued that short-course chemotherapy can bring resistant strains under control, preventing drug-resistant TB from emerging, and that this can probably be done by meeting the WHO targets for case detection and cure. METHODOLOGY In this section, we will formulate the model with immunity and drug resistance effects on the transmission dynamics of tuberculosis. EXISTING TUBERCULOSIS MODEL We reviewed the existing model by Andam, (2013) in terms of assumptions, model description, model diagram, and model equations. This served as the framework for the model with immunity and drug resistant effect on the transmission dynamics of tuberculosis. Model Assumptions 1. Age, sex, social status, race coupled with climatic conditions in the district does not affect the probability of an individual being infected. 2. The death rate of all individuals is balanced by a birth rate (birth and deaths occurs at equal rates). 3. He assumes that once an individual is infected, he or she becomes exposed to the environment before becoming infectious. Description of the Model In the model developed by Andam, (2013) the total population (N) is divided into four classes: Susceptible (S), Exposed (E), Infectious (I), and Recovered (R). The class of susceptible individuals S is increased by birth or immigration at a rate λ. It is decreased by infection due to contact with infected individuals at a rate β and diminished by natural death at a rate µ. The class of exposed individuals E is generated through contact with infected individuals and decreased by breakthrough into infected class I at a rate ε and diminished by natural death at a rate µ . The class of infected individuals I is generated by breakthrough of exposed individuals E, decreased by recovery from infection at a rate γ and diminished by natural death µ. This generates a class R of individuals who have complete protection against the disease and is diminished by natural death at a rate µ. Model Diagram Below is the model flow diagram of the dynamics of tuberculosis by Andam, (2013)
Figure 3.1: Existing Model Diagram by Andam, (2013).
Model Equations Below is the system of first order non-linear ordinary differential equations formulated by Andam, (2013). 𝑑𝑑𝑑𝑑𝑑𝑑𝑑𝑑
= 𝑃𝑃𝑃𝑃𝑃𝑃 − 𝛽𝛽𝛽𝛽𝐼𝐼 − 𝜇𝜇𝛽𝛽. (1) 𝑑𝑑𝑑𝑑𝑑𝑑𝑑𝑑
= 𝛽𝛽𝛽𝛽𝐼𝐼 − (𝜇𝜇 + 𝜀𝜀)𝑑𝑑. (2)
GSJ: Volume 9, Issue 8, August 2021 ISSN 2320-9186 232
GSJ© 2021 www.globalscientificjournal.com

Page 8 of 21 U.Y. Madaki, M. A. Jatau and S. B. Sambo 2021
𝑑𝑑𝑑𝑑𝑑𝑑𝑑𝑑
= 𝜀𝜀𝛽𝛽 − (𝜇𝜇 + 𝛾𝛾)𝐼𝐼. (3) 𝑑𝑑𝑑𝑑𝑑𝑑𝑑𝑑
= 𝛾𝛾𝐼𝐼 − 𝜇𝜇𝑑𝑑. (4)
Symbols Description
N(t) Total Population
S(t) Number of Susceptible individuals at time t
E(t) Number of Exposed individuals at time t
I(t) Number of Infectious individuals at time t
R(t) Number of Recovered individuals at time t
λ Birth rate
β Contact rate
µ Death rate
ε Infectious rate
γ Recovery rate
Table 1.1: Parameters and variable description. Reviewed Model Below are the assumptions, description, diagram and model equations of the formulated modified model. Assumptions of the with Immunity and Drug Resistance The following assumptions were made: 1. Parameters and variables are considered non-negative. 2. Recruitment into the susceptible compartment is variable. 3. Transition into and out of any compartment is governed by a specified rate. 4. Natural death and death due to tuberculosis occurs at variable rate. 5. The members of the study population interact freely. Description of the Model The human population is categorized into six compartments such that at time t ≥ 0 there are (S), susceptible humans, (M), immune infants, (E), exposed humans to tuberculosis, (I), infected humans with active tuberculosis, (RES ) , resistant humans to the first line of treatment, (RH ) , recovered humans. Thus the size of the human population is given as N = S + M + E + I + RES + RH . In our model, the recruitment into the susceptible human population is by birth Pπ. The size of the susceptible class is further increased by the immune infants in (M), partially immune humans in (RH ) after they lose their immunity at the rate η and ρ respectively. The susceptible class is decreased by natural death µ and exposed to MTB. The immune class (M) is increased by birth with immunity at a rate (1-P)π and decreased by natural death µ. The exposed susceptible to MTB move to the
GSJ: Volume 9, Issue 8, August 2021 ISSN 2320-9186 233
GSJ© 2021 www.globalscientificjournal.com
Page 9 of 21 U.Y. Madaki, M. A. Jatau and S. B. Sambo 2021
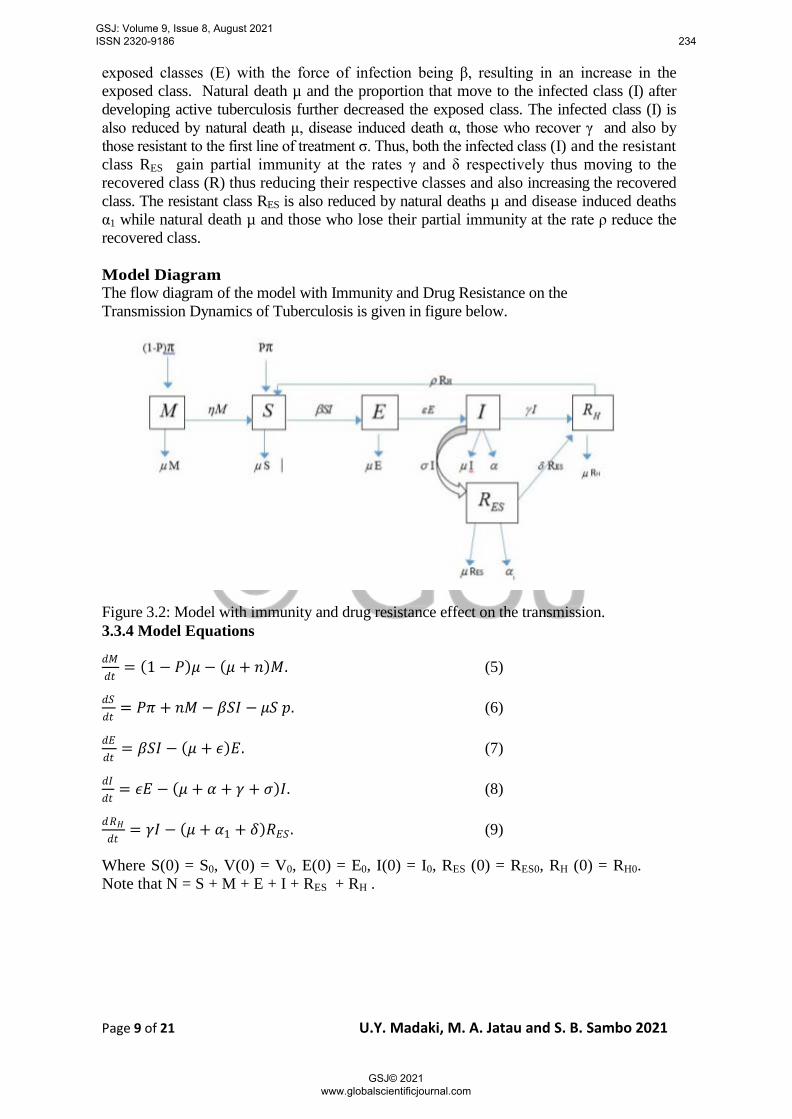
exposed classes (E) with the force of infection being β, resulting in an increase in the exposed class. Natural death µ and the proportion that move to the infected class (I) after developing active tuberculosis further decreased the exposed class. The infected class (I) is also reduced by natural death µ, disease induced death α, those who recover γ and also by those resistant to the first line of treatment σ. Thus, both the infected class (I) and the resistant class RES gain partial immunity at the rates γ and δ respectively thus moving to the recovered class (R) thus reducing their respective classes and also increasing the recovered class. The resistant class RES is also reduced by natural deaths µ and disease induced deaths α1 while natural death µ and those who lose their partial immunity at the rate ρ reduce the recovered class. Model Diagram The flow diagram of the model with Immunity and Drug Resistance on the Transmission Dynamics of Tuberculosis is given in figure below.
Figure 3.2: Model with immunity and drug resistance effect on the transmission. 3.3.4 Model Equations
𝑑𝑑𝑑𝑑𝑑𝑑𝑑𝑑
= (1 − 𝑃𝑃)𝜇𝜇 − (𝜇𝜇 + 𝑛𝑛)𝑑𝑑. (5)
𝑑𝑑𝛽𝛽𝑑𝑑𝑑𝑑
= 𝑃𝑃𝑃𝑃 + 𝑛𝑛𝑑𝑑 − 𝛽𝛽𝛽𝛽𝐼𝐼 − 𝜇𝜇𝛽𝛽 𝑝𝑝. (6)
𝑑𝑑𝑑𝑑𝑑𝑑𝑑𝑑
= 𝛽𝛽𝛽𝛽𝐼𝐼 − (𝜇𝜇 + 𝜖𝜖)𝑑𝑑. (7)
𝑑𝑑𝐼𝐼𝑑𝑑𝑑𝑑
= 𝜖𝜖𝑑𝑑 − (𝜇𝜇 + 𝛼𝛼 + 𝛾𝛾 + 𝜎𝜎)𝐼𝐼. (8)
𝑑𝑑𝑑𝑑𝐻𝐻𝑑𝑑𝑑𝑑
= 𝛾𝛾𝐼𝐼 − (𝜇𝜇 + 𝛼𝛼1 + 𝛿𝛿)𝑑𝑑𝑑𝑑𝛽𝛽 . (9)
Where S(0) = S0, V(0) = V0, E(0) = E0, I(0) = I0, RES (0) = RES0, RH (0) = RH0. Note that N = S + M + E + I + RES + RH .
GSJ: Volume 9, Issue 8, August 2021 ISSN 2320-9186 234
GSJ© 2021 www.globalscientificjournal.com

Page 10 of 21 U.Y. Madaki, M. A. Jatau and S. B. Sambo 2021
Symbols Description
M(t) Number of immune infants at time t
RH(t) Number of Recovered humans from both active and MDR tuberculosis at time t
RES(t) Number of Resistant humans to first line of treatment at time t
I(t) Number of Infectious individuals at time t
Pπ Birth rate without immunity
(1-P)π Birth rate with immunity
Η Rate at which immune infants become susceptible
Α Disease induced death rate due to active tuberculosis
α1 Disease induced death rate due to MDR tuberculosis
Δ Recovery rate of infected humans from MDR tuberculosis
Σ Rate at which infected humans become resistance to first line of treatment
Ρ Rate at which infected humans become susceptible
Table 1.2: Additional parameters and variables. Method of Model Analysis Various methods are considered in this section to carry out the analysis which are as follows: Existence and Uniqueness Theorem 1 Let D denote the region |t − to| ≤ α and |x − x0| ≤ b, where x = (x1, x2, x3 . . . xn ) and x0 = (x0,1, x0,2, x0,3 . . . x0,n ). Suppose that f(t, x) satisfies Lipchiz condition |f (t, x1) − f (t, x2)| ≤ K |x1 − x2| where the pair (t, x1) and (t, x2) belongs to D and K is a positive constant. Thus consider the following lemma. Lemma 1 Let x1 = M, x2 = S, x3 = E, x4 = I, x5 = RES , x6 = RH and f1, f2, f3, f4, f5 and f6 be the respective equations in system (5) - (9) and let λ = β x2 x4. The goal is to show that 𝑑𝑑𝑑𝑑𝑖𝑖𝑑𝑑𝑑𝑑𝑗𝑗
i,j = 1, 2, 3, 4, 5, 6 are continuous and bounded in D. Now
f1 = (1-P)π-(µ+η)𝑑𝑑1 �𝑑𝑑𝑑𝑑1𝑑𝑑𝑑𝑑1
� = |−𝜇𝜇 − 𝑛𝑛| < ∞; �𝑑𝑑𝑑𝑑1𝑑𝑑𝑑𝑑2
� = �𝑑𝑑𝑑𝑑1𝑑𝑑𝑑𝑑3
� = �𝑑𝑑𝑑𝑑1𝑑𝑑𝑑𝑑4
� = �𝑑𝑑𝑑𝑑1𝑑𝑑𝑑𝑑5
� = �𝑑𝑑𝑑𝑑1𝑑𝑑𝑑𝑑6
� = 0 < ∞
Similarly, going on in same manner for f2, f3, f4, f5 and f6 of model (5 - 9) above, we see that their partial derivatives exists for all equations and are continuous and bounded. Hence the system (5 - 9) has a unique solution. 3.4.2 Positivity of the solution Lemma 2 Let the initial solution set {M (0) > 0, S(0) > 0, E(0) > 0, I(0) > 0, RES (0) > 0, RH (0) > 0} ∈ R6+, then the solution set {M (t), S(t), E(t), I(t), RES (t), RH (t), } is positive for all time t > 0. Proof
GSJ: Volume 9, Issue 8, August 2021 ISSN 2320-9186 235
GSJ© 2021 www.globalscientificjournal.com

Page 11 of 21 U.Y. Madaki, M. A. Jatau and S. B. Sambo 2021
Let the force of infection be λ = βSI. Consider the first equation (i.e. equation (5)) 𝑑𝑑𝑑𝑑𝑑𝑑𝑑𝑑
= (1 − 𝑃𝑃)𝑃𝑃 − (𝜇𝜇 + 𝑛𝑛)𝑑𝑑. ≥ −(𝜇𝜇 + 𝑛𝑛)𝑑𝑑.
𝑑𝑑(𝑑𝑑) = 𝑑𝑑(0)𝑒𝑒𝑑𝑑𝑝𝑝−∫(𝜇𝜇+𝑛𝑛)𝑑𝑑𝑑𝑑 > 0 Also for the second equation (i.e. equation (3.6))
𝑑𝑑𝛽𝛽𝑑𝑑𝑑𝑑
= 𝑃𝑃𝑃𝑃 + 𝑛𝑛𝑑𝑑 − 𝛽𝛽𝛽𝛽𝐼𝐼 − 𝜇𝜇𝛽𝛽 + 𝑝𝑝𝑑𝑑𝐻𝐻 . ≥ −(𝛽𝛽𝐼𝐼 + 𝜇𝜇)𝛽𝛽.
𝛽𝛽(𝑑𝑑) = 𝛽𝛽(0)𝑒𝑒𝑑𝑑𝑝𝑝−∫(𝛽𝛽𝐼𝐼+𝜇𝜇 )𝑑𝑑𝑑𝑑 > 0. Going in same manner for the third, fourth, fifth and sixth equation, we found that E(t) > 0, I(t)> 0, RES (t)> 0, RH (t)>0 respectively. Hence the solution set is positive for all time t > 0. Invariant Set If a solution of a differential equation or a system of differential equations start on a given space, surface, or curve and remains within it for all time t, then the set is said to be invariant. Hence a positively invariant set will have solutions that are positive for all time. Now, let N = S + M + E + I + RES + RH be the total population at any time t. Therefore,
𝑑𝑑𝑃𝑃𝑑𝑑𝑑𝑑
=𝑑𝑑𝑑𝑑𝑑𝑑𝑑𝑑
+𝑑𝑑𝛽𝛽𝑑𝑑𝑑𝑑
+𝑑𝑑𝑑𝑑𝑑𝑑𝑑𝑑
+𝑑𝑑𝐼𝐼𝑑𝑑𝑑𝑑
+𝑑𝑑𝑑𝑑𝑑𝑑𝛽𝛽𝑑𝑑𝑑𝑑
+𝑑𝑑𝑑𝑑𝐻𝐻𝑑𝑑𝑑𝑑
= 𝑃𝑃 − 𝑃𝑃𝑃𝑃 − 𝜇𝜇𝑑𝑑 − 𝜂𝜂𝑑𝑑 + 𝑃𝑃𝑃𝑃 + 𝜂𝜂𝑑𝑑 − 𝛽𝛽𝛽𝛽𝐼𝐼 − 𝜇𝜇𝛽𝛽 + 𝑝𝑝𝑑𝑑𝐻𝐻 + 𝛽𝛽𝛽𝛽𝐼𝐼 − 𝜇𝜇𝑑𝑑 − 𝜀𝜀𝑑𝑑 + 𝜀𝜀𝑑𝑑 − 𝜇𝜇𝐼𝐼
− 𝛼𝛼𝐼𝐼 − 𝛾𝛾𝐼𝐼 − 𝜎𝜎𝐼𝐼 − 𝜇𝜇𝑑𝑑𝑑𝑑𝛽𝛽 − 𝛼𝛼1𝑑𝑑𝑑𝑑𝛽𝛽 − 𝛿𝛿𝑑𝑑𝑑𝑑𝛽𝛽 + 𝛾𝛾𝐼𝐼 − 𝜇𝜇𝑑𝑑𝐻𝐻 − 𝑝𝑝𝑑𝑑𝐻𝐻 + 𝛿𝛿𝑑𝑑𝑑𝑑𝛽𝛽 . 𝑑𝑑𝑃𝑃𝑑𝑑𝑑𝑑
= 𝑃𝑃 − 𝛼𝛼𝐼𝐼 − 𝛼𝛼1𝑑𝑑𝑑𝑑𝛽𝛽 − 𝜇𝜇(𝑑𝑑 + 𝛽𝛽 + 𝑑𝑑 + 𝐼𝐼 + 𝑑𝑑𝑑𝑑𝛽𝛽 + 𝑑𝑑𝐻𝐻) = 𝑃𝑃 − 𝛼𝛼𝐼𝐼 − 𝛼𝛼1𝑑𝑑𝑑𝑑𝛽𝛽 − 𝜇𝜇𝑃𝑃.
𝑑𝑑𝑃𝑃𝑑𝑑𝑑𝑑
= 𝑃𝑃 − 𝜇𝜇𝑃𝑃.
Integrating this by variable separable method we have
�𝑑𝑑𝑃𝑃
𝑃𝑃 − 𝜇𝜇𝑃𝑃= �𝑑𝑑𝑑𝑑
−1𝜇𝜇
= ln(𝑃𝑃 − 𝜇𝜇𝑃𝑃) + 𝑙𝑙𝑛𝑛𝑙𝑙 = 𝑑𝑑
ln(𝑃𝑃 − 𝜇𝜇) − 𝜇𝜇𝑙𝑙𝑛𝑛𝑙𝑙 = −𝜇𝜇𝑑𝑑 ln(𝑃𝑃 − 𝜇𝜇𝑃𝑃) − 𝑙𝑙𝑛𝑛𝑙𝑙𝜇𝜇 = −𝑃𝑃𝑑𝑑 ln(𝑃𝑃 − 𝜇𝜇𝑃𝑃) = −𝜇𝜇𝑑𝑑 + 𝑙𝑙𝑛𝑛𝑙𝑙𝜇𝜇 𝜇𝜇 − 𝜇𝜇𝑃𝑃 = 𝑒𝑒𝑑𝑑𝑝𝑝−𝜇𝜇𝑑𝑑+𝑙𝑙𝑛𝑛𝑙𝑙𝜇𝜇
𝑃𝑃 − 𝜇𝜇𝑃𝑃 = 𝑃𝑃0𝑒𝑒𝑑𝑑𝑝𝑝−𝜇𝜇𝑑𝑑 ; 𝑤𝑤ℎ𝑒𝑒𝑒𝑒𝑒𝑒 𝑃𝑃0 = 𝑙𝑙𝜇𝜇 𝜇𝜇𝑃𝑃 = 𝑃𝑃 − 𝑃𝑃0𝑒𝑒𝑑𝑑𝑝𝑝−𝜇𝜇𝑑𝑑
𝑃𝑃 =1𝜇𝜇
(𝑃𝑃 − 𝑃𝑃0𝑒𝑒𝑑𝑑𝑝𝑝−𝜇𝜇𝑑𝑑 )
Where N0 is the initial population at time t = 0, thus as t → ∞, we have N = 𝑃𝑃𝜇𝜇 Now, at
any time (t), the total population 𝑃𝑃(𝑑𝑑) ≤
𝑃𝑃𝜇𝜇
and therefore, if we let Ω to represent the invariant set, then
Ω= �(𝑑𝑑 + 𝛽𝛽 + 𝑑𝑑 + 𝐼𝐼 + 𝑑𝑑𝑑𝑑𝛽𝛽 + 𝑑𝑑𝐻𝐻)𝜖𝜖𝑑𝑑+6 :𝑃𝑃 = 𝑃𝑃
𝜇𝜇�
GSJ: Volume 9, Issue 8, August 2021 ISSN 2320-9186 236
GSJ© 2021 www.globalscientificjournal.com

Page 12 of 21 U.Y. Madaki, M. A. Jatau and S. B. Sambo 2021
Equilibrium States The equilibrium state for the model is obtained by setting the model equations to zero.
𝑖𝑖. 𝑒𝑒 𝑑𝑑𝑑𝑑𝑑𝑑𝑑𝑑
= 𝑑𝑑𝛽𝛽𝑑𝑑𝑑𝑑
= 𝑑𝑑𝑑𝑑𝑑𝑑𝑑𝑑
= 𝑑𝑑𝐼𝐼𝑑𝑑𝑑𝑑
𝑑𝑑𝑑𝑑𝑑𝑑𝛽𝛽𝑑𝑑𝑑𝑑
= 𝑑𝑑𝑑𝑑𝐻𝐻𝑑𝑑𝑑𝑑
= 0
Disease Free Equilibrium (Eq0) The disease free equilibrium point of a system represent the state at which there are no infections in the whole population. Now, considering the two compartments 𝑑𝑑𝑑𝑑
𝑑𝑑𝑑𝑑 and 𝑑𝑑𝛽𝛽
𝑑𝑑𝑑𝑑.
𝑑𝑑𝑑𝑑𝑑𝑑𝑑𝑑
= (1 − 𝑃𝑃)𝑃𝑃 − (𝜇𝜇 + 𝜂𝜂)𝑑𝑑. (1 − 𝑃𝑃)𝑃𝑃 − (𝜇𝜇 − 𝜂𝜂)𝑚𝑚 = 0.
𝑑𝑑0 =(1 − 𝜂𝜂)𝜇𝜇 + 𝜂𝜂
.
𝑑𝑑𝛽𝛽𝑑𝑑𝑑𝑑
= 𝑃𝑃𝑃𝑃 + 𝜂𝜂𝑑𝑑 − 𝛽𝛽𝛽𝛽𝐼𝐼 − 𝜇𝜇𝛽𝛽 + 𝑝𝑝𝑑𝑑𝐻𝐻 = 0. 𝑃𝑃𝑃𝑃 + 𝜂𝜂𝑑𝑑 − 𝛽𝛽𝛽𝛽𝐼𝐼 − 𝜇𝜇𝛽𝛽 + 𝑝𝑝𝑑𝑑𝐻𝐻 = 0.
𝛽𝛽0 =𝑃𝑃𝑃𝑃(𝜇𝜇 + 𝜂𝜂) + (1 − 𝑃𝑃)𝜂𝜂𝑃𝑃
𝜇𝜇(𝜇𝜇 + 𝜂𝜂)
𝑑𝑑0 = 𝐼𝐼0 = 𝑑𝑑𝑑𝑑𝛽𝛽0 = 0. Therefore, the disease free equilibrium state for the model is
𝑑𝑑𝐸𝐸0(𝑑𝑑0, 𝛽𝛽0,𝑑𝑑0, 𝐼𝐼0,𝑑𝑑𝑑𝑑𝛽𝛽0 ,𝑑𝑑𝐻𝐻0 ) = �(1−𝑃𝑃)𝑃𝑃𝜇𝜇+𝜂𝜂
, 𝑃𝑃𝑃𝑃(𝜇𝜇+𝜂𝜂)+(1−𝑃𝑃)𝜂𝜂𝑃𝑃𝜇𝜇 (𝜇𝜇+𝜂𝜂)
, 0,0,0,0�.
Basic Reproduction Number The reproduction number R0 is defined as the average number of secondary cases of infection generated by one primary case in a whole susceptible population. The basic reproduction number is used to predict whether the epidemic will spread or die out. In this model, I will adopt the method of the next generation on the equations (5-9) in the form of matrices F and V. Let: Fi be the rate of approach of the new infection in a compartment. Vi be the transfer of individuals out of compartment by another means. X0 be the disease-free equilibrium (Eq0). The basic reproduction number is (R0) is obtained by setting;
R0 = ρ(FV−1); where F = �𝜕𝜕𝐹𝐹𝑖𝑖(𝑑𝑑0)𝜕𝜕𝑑𝑑𝑗𝑗
� and V = �𝜕𝜕𝑉𝑉𝑖𝑖(𝑑𝑑0)𝜕𝜕𝑑𝑑𝑗𝑗
� for i ≥ 1 for the number of
compartments and 1 ≤ j ≤ m for the infected compartments only. ρ(FV−1) denotes the spectral radius of the matrix F and V are m × m matrices, where m is the number of infected classes (Diekmann, & Heesterbeek, 2000). Considering the infected compartments;
�𝑑𝑑𝑑𝑑𝑑𝑑𝑑𝑑
= 𝛽𝛽𝛽𝛽𝐼𝐼 − (𝜇𝜇 + 𝜀𝜀)𝑑𝑑𝑑𝑑𝐼𝐼𝑑𝑑𝑑𝑑
= 𝜀𝜀𝑑𝑑 − (𝜇𝜇 + 𝛼𝛼 + 𝛾𝛾 + 𝜎𝜎)𝐼𝐼� (10)
The system (10) can be represented in a matrix form as follows;
�
𝑑𝑑𝑑𝑑𝑑𝑑𝑑𝑑𝑑𝑑𝐼𝐼𝑑𝑑𝑑𝑑
� = �0 𝛽𝛽𝛽𝛽0 0 � �𝑑𝑑𝐼𝐼 � − �𝜇𝜇 + 𝜀𝜀 0
−𝜀𝜀 𝜇𝜇 + 𝛼𝛼 + 𝛾𝛾 + 𝜎𝜎� �𝑑𝑑𝐼𝐼 �
GSJ: Volume 9, Issue 8, August 2021 ISSN 2320-9186 237
GSJ© 2021 www.globalscientificjournal.com

Page 13 of 21 U.Y. Madaki, M. A. Jatau and S. B. Sambo 2021
𝐹𝐹 = �0 𝛽𝛽𝛽𝛽0 0 � = �0 𝛽𝛽
𝑃𝑃𝑃𝑃(𝜇𝜇 + 𝜂𝜂) + (1 − 𝑃𝑃)𝜂𝜂𝑃𝑃𝜇𝜇(𝜇𝜇 + 𝜂𝜂)
0 0�
𝐹𝐹 = �0 𝛽𝛽𝑃𝑃𝑃𝑃(𝜇𝜇 + 𝜂𝜂) + (1 − 𝑃𝑃)𝜂𝜂𝑃𝑃
𝜇𝜇(𝜇𝜇 + 𝜂𝜂)0 0
�
𝑉𝑉 = �𝜇𝜇 + 𝜀𝜀 0−𝜀𝜀 𝜇𝜇 + 𝛼𝛼 + 𝛾𝛾 + 𝜎𝜎�
To find
𝑉𝑉−1 =1
|𝑉𝑉|𝐴𝐴𝑑𝑑𝑗𝑗𝑉𝑉.
|𝑉𝑉| = �𝜇𝜇 + 𝜀𝜀 0−𝜀𝜀 𝜇𝜇 + 𝛼𝛼 + 𝛾𝛾 + 𝜎𝜎�
|𝑉𝑉| = (𝜇𝜇 + 𝜀𝜀)(𝜇𝜇 + 𝛼𝛼 + 𝛾𝛾 + 𝜎𝜎) and
𝐴𝐴𝑑𝑑𝑗𝑗𝑉𝑉 = �𝜇𝜇 + 𝛼𝛼 + 𝛾𝛾 + 𝜎𝜎 0𝜀𝜀 𝜇𝜇 + 𝜀𝜀�
𝑉𝑉−1 =
⎝
⎛
1𝜇𝜇 + 𝜀𝜀
0
𝜀𝜀(𝜇𝜇 + 𝜀𝜀)(𝜇𝜇 + 𝛼𝛼 + 𝛾𝛾 + 𝜎𝜎)
1𝜇𝜇 + 𝛼𝛼 + 𝛾𝛾 + 𝜎𝜎⎠
⎞
𝐹𝐹𝑉𝑉−1 = �0 𝛽𝛽 𝑃𝑃𝑃𝑃(𝜇𝜇+𝜂𝜂)+(1−𝑃𝑃)𝜂𝜂𝑃𝑃𝜇𝜇 (𝜇𝜇+𝜂𝜂)
0 0��
1𝜇𝜇+𝜀𝜀
0𝜀𝜀
(𝜇𝜇+𝜀𝜀)(𝜇𝜇+𝛼𝛼+𝛾𝛾+𝜎𝜎)1
𝜇𝜇+𝛼𝛼+𝛾𝛾+𝜎𝜎
�
𝐹𝐹𝑉𝑉−1 = �𝛽𝛽𝜀𝜀 [𝑃𝑃𝑃𝑃(𝜇𝜇+𝜂𝜂)+(1−𝑃𝑃)𝜂𝜂𝑃𝑃 ]𝜇𝜇 (𝜇𝜇+𝜀𝜀)(𝜇𝜇+𝜂𝜂)(𝜇𝜇+𝛼𝛼+𝛾𝛾+𝜎𝜎)
𝛽𝛽 [𝑃𝑃𝑃𝑃+(1−𝑃𝑃)𝜂𝜂𝑃𝑃 ]𝜇𝜇(𝜇𝜇+𝛼𝛼+𝛾𝛾+𝜎𝜎)(𝜇𝜇+𝜂𝜂)
0 0�
𝜌𝜌(𝐹𝐹𝑉𝑉−1) = �𝛽𝛽𝜀𝜀 [𝑃𝑃𝑃𝑃(𝜇𝜇+𝜂𝜂)+(1−𝑃𝑃)𝜂𝜂𝑃𝑃 ]𝜇𝜇(𝜇𝜇+𝜀𝜀)(𝜇𝜇+𝜂𝜂)(𝜇𝜇+𝛼𝛼+𝛾𝛾+𝜎𝜎)
− 𝜆𝜆 𝛽𝛽 [𝑃𝑃𝑃𝑃+(1−𝑃𝑃)𝜂𝜂𝑃𝑃 ]𝜇𝜇 (𝜇𝜇+𝛼𝛼+𝛾𝛾+𝜎𝜎)(𝜇𝜇+𝜂𝜂)
0 0 − 𝜆𝜆� = 0
�𝛽𝛽𝜀𝜀[𝑃𝑃𝑃𝑃(𝜇𝜇 + 𝜂𝜂) + (1 − 𝑃𝑃)𝜂𝜂𝑃𝑃]
𝜇𝜇(𝜇𝜇 + 𝜀𝜀)(𝜇𝜇 + 𝜂𝜂)(𝜇𝜇 + 𝛼𝛼 + 𝛾𝛾 + 𝜎𝜎) − 𝜆𝜆� (−𝜆𝜆) = 0
𝜆𝜆1 = 0 and
𝛽𝛽𝜀𝜀[𝑃𝑃𝑃𝑃(𝜇𝜇 + 𝜂𝜂) + (1 − 𝑃𝑃)𝜂𝜂𝑃𝑃]𝜇𝜇(𝜇𝜇 + 𝜀𝜀)(𝜇𝜇 + 𝜂𝜂)(𝜇𝜇 + 𝛼𝛼 + 𝛾𝛾 + 𝜎𝜎)
− 𝜆𝜆 = 0
𝜆𝜆2 =𝛽𝛽𝜀𝜀[𝑃𝑃𝑃𝑃(𝜇𝜇 + 𝜂𝜂) + (1 − 𝑃𝑃)𝜂𝜂𝑃𝑃]
𝜇𝜇(𝜇𝜇 + 𝜀𝜀)(𝜇𝜇 + 𝜂𝜂)(𝜇𝜇 + 𝛼𝛼 + 𝛾𝛾 + 𝜎𝜎)
𝜌𝜌(𝐹𝐹𝑉𝑉−1) =𝛽𝛽𝜀𝜀[𝑃𝑃𝑃𝑃(𝜇𝜇 + 𝜂𝜂) + (1 − 𝑃𝑃)𝜂𝜂𝑃𝑃]
𝜇𝜇(𝜇𝜇 + 𝜀𝜀)(𝜇𝜇 + 𝜂𝜂)(𝜇𝜇 + 𝛼𝛼 + 𝛾𝛾 + 𝜎𝜎)
𝑑𝑑0 =𝛽𝛽𝜀𝜀[𝑃𝑃𝑃𝑃(𝜇𝜇 + 𝜂𝜂) + (1 − 𝑃𝑃)𝜂𝜂𝑃𝑃]
𝜇𝜇(𝜇𝜇 + 𝜀𝜀)(𝜇𝜇 + 𝜂𝜂)(𝜇𝜇 + 𝛼𝛼 + 𝛾𝛾 + 𝜎𝜎)
The disease free equilibrium point of model (5 - 9) is locally stable if R0 < 1 and unstable if R0 > 1. Local Stability Analysis of the Disease Free Equilibrium of the Model To check for the local stability of the disease free equilibrium of the model, we use trace method. Lemma 2
GSJ: Volume 9, Issue 8, August 2021 ISSN 2320-9186 238
GSJ© 2021 www.globalscientificjournal.com

Page 14 of 21 U.Y. Madaki, M. A. Jatau and S. B. Sambo 2021
The disease free equilibrium point (Eq0) is locally asymptotically stable if the trace Tr(J Eq0) < 0 and the determinant Det(J Eq0) > 0 where J Eq0 is the Jacobian matrix of the disease free equilibrium. Proof Recall system (5 - 9)
𝑑𝑑1 = (1 − 𝑃𝑃)𝑃𝑃 − (𝜇𝜇 + 𝜂𝜂)𝑑𝑑.
𝑑𝑑2 = 𝑃𝑃𝑃𝑃 + 𝜂𝜂𝑑𝑑 − 𝛽𝛽𝛽𝛽𝐼𝐼 − 𝜇𝜇𝛽𝛽 + 𝜌𝜌𝑑𝑑𝐻𝐻 .
𝑑𝑑3 = 𝛽𝛽𝛽𝛽𝐼𝐼 − (𝜇𝜇 + 𝜀𝜀)𝑑𝑑.
𝑑𝑑4 = 𝜀𝜀𝑑𝑑 − (𝜇𝜇 + 𝛼𝛼 + 𝛾𝛾 + 𝜎𝜎)𝐼𝐼.
𝑑𝑑5 = 𝜎𝜎𝐼𝐼 − (𝜇𝜇 + 𝛼𝛼1 + 𝛿𝛿)𝑑𝑑𝑑𝑑𝛽𝛽 .
𝑑𝑑6 = 𝛾𝛾𝐼𝐼 − (𝜇𝜇 + 𝜌𝜌)𝑑𝑑𝐻𝐻 + 𝛿𝛿𝑑𝑑𝑑𝑑𝛽𝛽 .
The Jacobian matrix of the system of equations is given as;
⎝
⎜⎜⎛−(𝜇𝜇 + 𝜂𝜂)
𝜂𝜂0
0−(𝛽𝛽𝐼𝐼 + 𝜇𝜇)
𝛽𝛽𝐼𝐼
00
−(𝜇𝜇 − 𝜀𝜀)0 0 𝜀𝜀00
00
00
0−𝛽𝛽𝛽𝛽𝛽𝛽𝛽𝛽
000
0𝜌𝜌0
−(𝜇𝜇 + 𝛼𝛼 + 𝛾𝛾 + 𝜎𝜎) 0 0𝜎𝜎𝛾𝛾
−(𝜇𝜇 + 𝛼𝛼1 + 𝛿𝛿)𝛿𝛿
0−(𝜇𝜇 + 𝜌𝜌)⎠
⎟⎟⎞
At disease free equilibrium (𝑑𝑑𝐸𝐸0) the component is given as
(𝑑𝑑𝐸𝐸0) = (𝑑𝑑0, 𝛽𝛽0,𝑑𝑑0, 𝐼𝐼0,𝑑𝑑𝑑𝑑𝛽𝛽0 ,𝑑𝑑𝐻𝐻0 ) = �(1−𝑃𝑃)𝑃𝑃𝑃𝑃+𝜂𝜂
, 𝑃𝑃𝑃𝑃(𝜇𝜇+𝜂𝜂)+(1−𝑃𝑃)𝜂𝜂𝑃𝑃𝜇𝜇 (𝜇𝜇+𝜂𝜂)
, 0, 0, 0, 0�
There Jacobian matrix of the becomes;
(𝐽𝐽𝑑𝑑𝐸𝐸0)
=
⎝
⎜⎜⎜⎜⎜⎛−(𝜇𝜇 + 𝜂𝜂)
𝜂𝜂0
0−𝜇𝜇0
00
−(𝜇𝜇 + 𝜀𝜀)0 0 𝜀𝜀00
00
00
0
−𝛽𝛽[𝑃𝑃𝑃𝑃(𝜇𝜇 + 𝜂𝜂) + (1 − 𝑃𝑃)𝜂𝜂𝑃𝑃]
𝜇𝜇(𝜇𝜇 + 𝜂𝜂)
𝛽𝛽𝑃𝑃𝑃𝑃(𝜇𝜇 + 𝜂𝜂) + (1 − 𝑃𝑃)𝜂𝜂𝑃𝑃
𝜇𝜇(𝜇𝜇 + 𝜂𝜂)
000
0𝜌𝜌0
−(𝜇𝜇 + 𝛼𝛼 + 𝛾𝛾 + 𝜎𝜎) 0 0𝜎𝜎𝛾𝛾
−(𝜇𝜇 + 𝛼𝛼1 + 𝛿𝛿)𝛿𝛿
0−(𝜇𝜇 + 𝜌𝜌)⎠
⎟⎟⎟⎟⎟⎞
(𝐽𝐽𝑑𝑑𝐸𝐸0) =
⎝
⎜⎜⎛
−𝛽𝛽𝜂𝜂0
0−𝜇𝜇0
00−𝑙𝑙
0 0 𝜀𝜀00
00
00
0−𝐷𝐷𝐷𝐷
000
0𝜌𝜌0
−𝑑𝑑 0 0𝜎𝜎𝛾𝛾
−𝐹𝐹𝛿𝛿
0−𝐺𝐺⎠
⎟⎟⎞
Where B = (𝜇𝜇 + 𝜂𝜂), C= (𝜇𝜇 + 𝜀𝜀), D = 𝛽𝛽 [𝑃𝑃𝑃𝑃(𝜇𝜇+𝜂𝜂)+(1−𝑃𝑃)𝜂𝜂𝑃𝑃 ]𝜇𝜇 (𝜇𝜇+𝜂𝜂)
,𝑑𝑑 = (𝜇𝜇 + 𝛼𝛼 + 𝛾𝛾 + 𝜎𝜎), F = (𝜇𝜇 + 𝛼𝛼1 + 𝛿𝛿) and G = (𝜇𝜇 + 𝜌𝜌). Now, the trace is determine as;
−(𝐵𝐵 + 𝜇𝜇 + 𝑙𝑙 + 𝑑𝑑 + 𝐹𝐹 + 𝐺𝐺) < 0. and
GSJ: Volume 9, Issue 8, August 2021 ISSN 2320-9186 239
GSJ© 2021 www.globalscientificjournal.com

Page 15 of 21 U.Y. Madaki, M. A. Jatau and S. B. Sambo 2021
𝐷𝐷𝑒𝑒𝑑𝑑(𝐽𝐽𝑑𝑑𝐸𝐸0) = −𝐵𝐵 ��
−𝜇𝜇00
0−𝑙𝑙𝜀𝜀
−𝐷𝐷𝐷𝐷−𝑑𝑑
0 0 𝜎𝜎0 0 𝛾𝛾
000
𝜌𝜌00
−𝐹𝐹 0𝛿𝛿 −𝐺𝐺
��
= −𝐵𝐵(−𝜇𝜇 �
−𝑙𝑙𝜀𝜀
𝐷𝐷−𝑑𝑑
00
0 𝜎𝜎 −𝐹𝐹0 𝛾𝛾 𝛿𝛿
000−𝐺𝐺
� − 𝐷𝐷 �00
−𝑙𝑙𝜀𝜀
00
0 0 −𝐹𝐹0 0 𝛿𝛿
000−𝐺𝐺
� + 𝜌𝜌 �
00
−𝑙𝑙𝜀𝜀
𝐷𝐷−𝑑𝑑
0 0 𝜎𝜎0 0 𝛾𝛾
00−𝐹𝐹𝛿𝛿
�
= −𝐵𝐵 �−𝜇𝜇 �−𝑙𝑙 �−𝑑𝑑 0 0𝜎𝜎 −𝐹𝐹 0𝛾𝛾 𝛿𝛿 −𝐺𝐺
� − 𝐷𝐷 �𝜀𝜀 0 00 −𝐹𝐹 00 𝛿𝛿 −𝐺𝐺
�) − 𝐷𝐷(𝑙𝑙 �0 0 00 −𝐹𝐹 00 𝛿𝛿 −𝐺𝐺
���)
+𝜌𝜌(𝑙𝑙 �0 − 00 𝜎𝜎 −𝐹𝐹0 𝛾𝛾 𝛿𝛿
� + 𝐷𝐷 �0 𝜀𝜀 00 0 −𝐹𝐹0 0 𝛿𝛿
�)]
= −𝐵𝐵[−𝜇𝜇 �−𝑙𝑙 �−𝑑𝑑 �−𝐹𝐹 0𝛿𝛿 −𝐺𝐺�� − 𝐷𝐷 �𝜀𝜀 �−𝐹𝐹 0
𝛿𝛿 −𝐺𝐺��� − 𝐷𝐷(𝑙𝑙 �−𝐹𝐹 0𝛿𝛿 −𝐺𝐺�)
+𝜌𝜌(𝑙𝑙 �𝑑𝑑 �0 −𝐹𝐹0 𝛿𝛿 �� + 𝐷𝐷 �−𝜀𝜀 �0 −𝐹𝐹
0 𝛿𝛿 ��)]
= −𝐵𝐵[−𝜇𝜇(−𝑙𝑙)(−𝑑𝑑)(𝐹𝐹𝐺𝐺) − 𝐷𝐷(𝜀𝜀)(𝐹𝐹𝐺𝐺) − 𝐷𝐷�𝑙𝑙(0)(𝐹𝐹𝐺𝐺) + 𝜌𝜌�𝑙𝑙(𝑑𝑑)(0) + 𝐷𝐷(−𝜀𝜀)(0)��. = −𝐵𝐵(−𝜇𝜇𝑙𝑙𝑑𝑑𝐹𝐹𝐺𝐺 + 𝜇𝜇𝜀𝜀𝐷𝐷𝐹𝐹𝐺𝐺 − 0 + 0 + 0)
= −𝐵𝐵(−𝜇𝜇𝑙𝑙𝑑𝑑𝐹𝐹𝐺𝐺 + 𝜇𝜇𝜀𝜀𝐷𝐷𝐹𝐹𝐺𝐺)
= 𝜇𝜇𝐵𝐵𝑙𝑙𝑑𝑑𝐹𝐹𝐺𝐺 − 𝜇𝜇𝜀𝜀𝐵𝐵𝐷𝐷𝐹𝐹𝐺𝐺.
Where B = (𝜇𝜇 + 𝜂𝜂), C = (𝜇𝜇 + 𝜀𝜀), D = 𝛽𝛽 [𝑃𝑃𝑃𝑃(𝜇𝜇+𝜂𝜂)+(1−𝑃𝑃)𝜂𝜂𝑃𝑃 ]𝜇𝜇 (𝜇𝜇+𝜂𝜂)
,𝑑𝑑 = (𝜇𝜇 + 𝛼𝛼 + 𝛾𝛾 + 𝜎𝜎), F = (𝜇𝜇 + 𝛼𝛼1 + 𝛿𝛿) and G = (𝜇𝜇 + 𝜌𝜌).
𝐷𝐷𝑒𝑒𝑑𝑑(𝐽𝐽𝐹𝐹𝐸𝐸0) = 𝜇𝜇(𝜇𝜇 + 𝜂𝜂)(𝜇𝜇 + 𝜀𝜀)(𝜇𝜇 + 𝜌𝜌)(𝜇𝜇 + 𝛼𝛼1 + 𝛿𝛿)(𝜇𝜇 + 𝛼𝛼 + 𝛾𝛾 + 𝜎𝜎)
−𝜇𝜇𝜀𝜀 �𝛽𝛽[𝑃𝑃𝑃𝑃(𝜇𝜇 + 𝜂𝜂) + (1 − 𝑃𝑃)𝜂𝜂𝑃𝑃]
𝜇𝜇(𝜇𝜇 + 𝜂𝜂) � (𝜇𝜇 + 𝛼𝛼1 + 𝛿𝛿)(𝜇𝜇 + 𝜌𝜌)(𝜇𝜇 + 𝜂𝜂)
= 𝜇𝜇(𝜇𝜇 + 𝜂𝜂)(𝜇𝜇 + 𝜀𝜀)(𝜇𝜇 + 𝛼𝛼1 + 𝛿𝛿)(𝜇𝜇 + 𝛼𝛼 + 𝛾𝛾 + 𝜎𝜎)
�1 −𝛽𝛽[𝑃𝑃𝑃𝑃(𝜇𝜇 + 𝜂𝜂) + (1 − 𝑃𝑃)𝜂𝜂𝑃𝑃]
𝜇𝜇(𝜇𝜇 + 𝜂𝜂)(𝜇𝜇 + 𝜀𝜀)(𝜇𝜇 + 𝛼𝛼 + 𝛾𝛾 + 𝜎𝜎)�
= 𝜇𝜇𝐵𝐵𝑙𝑙𝑑𝑑𝐹𝐹𝐺𝐺 �1 −𝛽𝛽[𝑃𝑃𝑃𝑃(𝜇𝜇 + 𝜂𝜂) + (1 − 𝑃𝑃)𝜂𝜂𝑃𝑃]
𝜇𝜇(𝜇𝜇 + 𝜂𝜂)(𝜇𝜇 + 𝜀𝜀)(𝜇𝜇 + 𝛼𝛼 + 𝛾𝛾 + 𝜎𝜎)�
𝐷𝐷𝑒𝑒𝑑𝑑(𝐽𝐽𝑑𝑑𝐸𝐸0) = 𝜇𝜇𝐵𝐵𝑙𝑙𝑑𝑑𝐹𝐹𝐺𝐺(1 − 𝑑𝑑0)
Thus, the𝐷𝐷𝑒𝑒𝑑𝑑(𝐽𝐽𝑑𝑑𝐸𝐸0) will only be greater than zero if 𝑑𝑑0 < 1. Hence if it’s so, the disease free equilibrium point (𝑑𝑑𝐸𝐸0) is locally asymptotically stable. Endemic Point Setting (5 – 9) to zero we have
𝑑𝑑∗ =(1 − 𝑝𝑝)𝑃𝑃𝜇𝜇 + 𝜂𝜂
=(1 − 𝑝𝑝)𝑃𝑃
𝐾𝐾1
GSJ: Volume 9, Issue 8, August 2021 ISSN 2320-9186 240
GSJ© 2021 www.globalscientificjournal.com
Page 16 of 21 U.Y. Madaki, M. A. Jatau and S. B. Sambo 2021
𝛽𝛽∗ =𝑝𝑝𝑃𝑃𝐾𝐾1 + 𝜂𝜂𝑃𝑃(1 − 𝑝𝑝) + 𝑝𝑝𝐴𝐴𝑑𝑑𝐻𝐻∗
(𝛽𝛽𝐼𝐼8 + 𝜇𝜇)𝐾𝐾1
𝑑𝑑∗ = 𝛽𝛽𝛽𝛽 ∗𝐼𝐼∗
𝐾𝐾2 , 𝐼𝐼∗ = 𝜀𝜀𝑑𝑑
∗
𝐾𝐾3 → (11)
𝑑𝑑𝑑𝑑𝛽𝛽∗ =𝜎𝜎𝐼𝐼∗
𝐾𝐾4, 𝑑𝑑𝐻𝐻∗ =
𝛾𝛾𝐼𝐼∗ + 𝛿𝛿𝑑𝑑𝑑𝑑𝛽𝛽∗
𝑑𝑑5
Where 𝐾𝐾1 = (𝜇𝜇 + 𝜂𝜂),𝑑𝑑2 = 𝜇𝜇 + 𝜀𝜀,𝐾𝐾3 = 𝜇𝜇 + 𝑑𝑑 + 𝛾𝛾 + 𝜎𝜎,𝐾𝐾4 = 𝜇𝜇 + 𝛼𝛼1 + 𝛿𝛿,𝐾𝐾5 = 𝜇𝜇 + 𝜌𝜌. From (11) 𝑑𝑑∗ = 𝐼𝐼∗𝐾𝐾3
𝜀𝜀.
⟹𝐼𝐼∗𝐾𝐾3
𝜀𝜀=𝛽𝛽𝛽𝛽∗𝐼𝐼∗
𝐾𝐾2⟹ 𝛽𝛽∗ =
𝐾𝐾2𝐾𝐾3
𝛽𝛽𝜖𝜖
𝐾𝐾2𝐾𝐾3
𝛽𝛽𝜖𝜖=
𝑝𝑝𝑃𝑃𝑘𝑘1+𝜂𝜂𝑃𝑃 (1−𝑝𝑝)𝐾𝐾1
+ 𝑝𝑝𝐾𝐾1(𝛾𝛾𝐾𝐾4+𝛿𝛿𝜎𝜎 )𝐼𝐼∗
𝐾𝐾1𝐾𝐾4𝐾𝐾5
(𝛽𝛽𝐼𝐼∗ + 𝜇𝜇)𝐾𝐾1
⟹ 𝐼𝐼∗ =𝑝𝑝𝑃𝑃𝛽𝛽𝜖𝜖𝐾𝐾1𝐾𝐾4𝐾𝐾5 + 𝛽𝛽𝜖𝜖𝜂𝜂𝑃𝑃(1 − 𝑝𝑝)𝐾𝐾4𝐾𝐾5 − 𝐾𝐾1𝐾𝐾2𝐾𝐾3𝐾𝐾4𝐾𝐾5𝜇𝜇
𝐾𝐾1𝐾𝐾2𝐾𝐾3𝐾𝐾4𝐾𝐾5𝛽𝛽 − 𝑝𝑝𝐾𝐾1𝛽𝛽𝜀𝜀(𝛾𝛾𝐾𝐾4 − 𝛿𝛿𝜎𝜎)
𝐾𝐾∗ = 𝐾𝐾3𝐾𝐾6𝐾𝐾7
where 𝐾𝐾6 = 𝜌𝜌𝑃𝑃𝛽𝛽𝐾𝐾1𝐾𝐾4𝐾𝐾5 + 𝛽𝛽𝜀𝜀𝑃𝑃𝜂𝜂(1 − 𝑝𝑝)𝐾𝐾4𝐾𝐾5 − 𝐾𝐾1𝐾𝐾2𝐾𝐾3𝐾𝐾4𝜇𝜇. 𝐾𝐾7 = 𝐾𝐾1𝐾𝐾2𝐾𝐾3𝐾𝐾4𝐾𝐾5𝛽𝛽 − 𝑝𝑝𝐾𝐾1𝛽𝛽𝜀𝜀(𝛾𝛾𝐾𝐾4 − 𝛿𝛿𝜎𝜎)
𝑑𝑑𝑑𝑑𝛽𝛽∗ =𝜎𝜎𝐾𝐾3𝐾𝐾6
𝐾𝐾4𝐾𝐾7
𝑑𝑑𝐻𝐻∗ =(𝛾𝛾𝐾𝐾4 + 𝛿𝛿𝜎𝜎)𝐾𝐾6
𝐾𝐾4𝐾𝐾5𝐾𝐾7=𝐾𝐾6(𝛾𝛾𝐾𝐾4 + 𝛿𝛿𝜎𝜎)
𝐾𝐾4𝐾𝐾5𝐾𝐾7
𝛽𝛽∗ =𝐾𝐾2𝐾𝐾3
𝛽𝛽𝜀𝜀
𝑑𝑑∗ =(1 − 𝑝𝑝)𝑃𝑃
𝐾𝐾1
𝑑𝑑∗ = 𝐾𝐾2𝐾𝐾3𝐾𝐾6𝜀𝜀𝐾𝐾7
’𝐼𝐼∗ = 𝐾𝐾6𝐾𝐾7
From 𝐼𝐼∗ = 𝐾𝐾6𝐾𝐾7
Since the force of infection 𝜆𝜆∗ = 𝛽𝛽𝐼𝐼∗𝛽𝛽∗ then
𝜆𝜆∗ = 𝛽𝛽𝐼𝐼∗𝛽𝛽∗ = �𝐾𝐾1𝐾𝐾2𝐾𝐾3𝐾𝐾4𝐾𝐾5𝜇𝜇(𝑑𝑑0 − 1)
𝐾𝐾1𝐾𝐾2𝐾𝐾3𝐾𝐾4𝐾𝐾5𝛽𝛽 − 𝑝𝑝𝐾𝐾1𝛽𝛽(𝛾𝛾𝐾𝐾4 + 𝛿𝛿𝜎𝜎)�
Lemma 3:
The endemic Equilibrium point (EEP) exist and is unique and is locally asymptotically stable if and only if 𝑑𝑑0 > 1. (By Descartes Rule of signs).
RESULT AND DISCUSSION
Numerical Simulation The numerical simulation of the model was carried out using MATLAB. The estimated parameter values used in the simulation of this model are presented in table 2.1. Since the parameter values are known, then we can solve our system of differential equations (5 - 9), since the model uses six separate differential equations one must use a numerical solver to plot the solution. This is easier with MATLAB. We used the parameter values (Table 2.1) in MATLAB and plot the graph. The numerical simulation result is displayed in figure 1.1.
GSJ: Volume 9, Issue 8, August 2021 ISSN 2320-9186 241
GSJ© 2021 www.globalscientificjournal.com
Page 17 of 21 U.Y. Madaki, M. A. Jatau and S. B. Sambo 2021
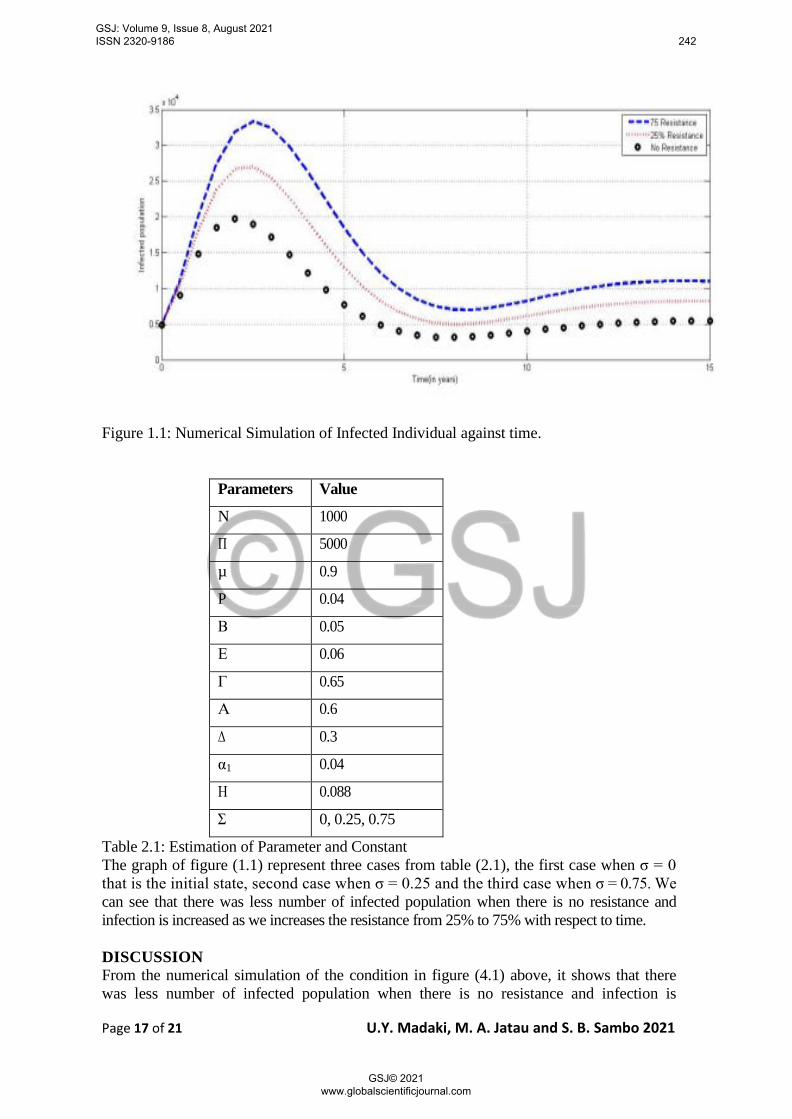
Figure 1.1: Numerical Simulation of Infected Individual against time.
Parameters Value
N 1000
Π 5000
µ 0.9
P 0.04
Β 0.05
Ε 0.06
Γ 0.65
Α 0.6
Δ 0.3
α1 0.04
Η 0.088
Σ 0, 0.25, 0.75
Table 2.1: Estimation of Parameter and Constant The graph of figure (1.1) represent three cases from table (2.1), the first case when σ = 0 that is the initial state, second case when σ = 0.25 and the third case when σ = 0.75. We can see that there was less number of infected population when there is no resistance and infection is increased as we increases the resistance from 25% to 75% with respect to time. DISCUSSION From the numerical simulation of the condition in figure (4.1) above, it shows that there was less number of infected population when there is no resistance and infection is
GSJ: Volume 9, Issue 8, August 2021 ISSN 2320-9186 242
GSJ© 2021 www.globalscientificjournal.com

Page 18 of 21 U.Y. Madaki, M. A. Jatau and S. B. Sambo 2021
increased as we increases the resistance from 25% to 75%. This was achieved by first choosing σ = 0 simulation gives R0 = 0.865116 < 1, secondly when σ = 0.25 simulation gives R0 = 0.907885 < 1 and lastly when σ = 0.75 < 1 simulation gives R0 = 0.751353 < 1 showing that the disease free equilibrium point (Eq0) of the model is locally stable in all the three (3) different values of σ. Since the basic reproduction number R0 < 1, it implies that the disease will gradually die out in the population when there are no resistance and the disease will increase when there is resistance to first line of treatment. SUMMARY This research was designed to model, analyzed and to study the effect of immunity and drug resistance on the transmission dynamics of tuberculosis using MSEIR model. The disease free equilibrium was obtained Eq0, the basic reproduction number was obtained (R0), stability analysis of the model was obtained, the existence of the endemic point and also numerical simulation of the model was done using MATLAB software with estimate values from table (2.1) using different values of sigma (σ) as in figure 1.1 above which shows that there was less number of infected population when there is no resistance and infection is increased as we increase the resistance from 25% to 75% which was also achieved by changing the value of sigma from 0 to 0.25 and then to 0.75. The result shows that there is less number of infected population when there is no resistance to first line of treatment in the population. CONCLUSION Mathematical model is a useful technique for solving real life situations; a deterministic model to study the effect of immunity and drug resistance on the transmission dynamics of tuberculosis was modeled and analyzed in order to see the effect of resistance to first line of treatment in a population. The analysis and numerical simulation of the model reveal that the disease free equilibrium (Eq0) is locally stable since R0 < 1, which implies that TB disease will be gradually eliminated from the population. The numerical simulation of the model was carried out using MATLAB. RECOMMENDATION In line with this research findings the following recommendations are made; 1. Encourage the use of mathematical models to model real life problems, which simplifies problems in the society. 2. The government should integrate TB programmes into other existing health services such as outreach, maternal and child welfare programmes among others in order to increase its awareness. 3. The government should intensify the education on TB in schools, community gathering, worship centers etc., to sensitize the individuals in the communities of its existence, free access to medical care and treatment duration. 4. TB patients who migrate must be given referral to the clinics in such areas for continuation of treatment. 5. Further research work is also recommended in order to help develop other suitable models to help public health professionals to adopt other strategies to control and eradicate the disease. REFERENCES Andam E. P. (2013). Analysis of transmission dynamics of tuberculosis using differential
equations. A case study of Amansie West District Ghana.
GSJ: Volume 9, Issue 8, August 2021 ISSN 2320-9186 243
GSJ© 2021 www.globalscientificjournal.com

Page 19 of 21 U.Y. Madaki, M. A. Jatau and S. B. Sambo 2021
Brooks-Pollock, E; Cohen, T; Murray, M (2010). The impact of realistic age structure in simple models of tuberculosis transmission. Plos.one, 5(1).
Bhunu C. P.,Garira W., Mukandavire Z., Zimba M. (2008).,Tuberculosis transmission model with chemoprophylaxis and treatment. Bull. Math. Biol. 70: 1163-1191. Dye C, Garnett
G.P, Sleemank, Williams B.G (1998), Global Tuberculosis Programme. Evans C.C. (1994) History background In: Davies PDO (ed). Clinical tuberculosis London: Chapman and Hall, PP. 1-18.
Agusto F. B., Cook J., Shelton P.D, Wickers M.G. (2015). Mathematical model of Mdrtb and Xdr-tb with isolation and lost of follow-up.
Gupta K.B, Atreja A. (2006). Transmission of tuberculosis infection and its control in health. Cave facilities NTI Bulletin.
Mandal A, Singh A (2017). Recent changes in tuberculosis guidelines foe children. My cobact Dis 7: 237.
Mariam S.H., Werngren J., Aronsson J., Hoffner S., Andersson D.I. (2011). Dynamics of antibiotic resistant mycobacterium tuberculosis during long term infection and antibiotic treatment.
Murna P. (2015). The transmission of tuberculosis and its prevalence on age and gender : (A case study of infectious disease hospital (IDP) Bayara Bauchi).
Egbetade S. A, Ibrahim M. O (2012). Existence of solution of tuberculosis epidemic model ; Journal of Mathematics IOSR, 4(1): 50-52.
Waaler and Anderson (1962).The use of mathematical models in the study of the epidemiology of tuberculosis, American journal of public health and nations health.
World Health Organization [WHO] (2017). Guidelines for treatment of drug-susceptible tuberculosis and patient care.
Ziv E., Daley C. L., Blower S.M. (2001). Early therapy for latent tuberculosis infection, American journal of epidemiology, 153(4), 381-385.
APPENDIX
function vprime = tbmodel(t,y)
vprime = zeros(6,1);
pi = 5000;
rho = 0.56;
beta = 0.05
varepsilon = 0.06;
gamma = 0.65;
alpha = 0.6;
delta = 0.3;
alpha1 = 0.04;
% immunity and resistance parameters
GSJ: Volume 9, Issue 8, August 2021 ISSN 2320-9186 244
GSJ© 2021 www.globalscientificjournal.com

Page 20 of 21 U.Y. Madaki, M. A. Jatau and S. B. Sambo 2021
eta = 0.088;
sigma = 0; % Variables y(1) = M; y(2) = S; y(3) = E; y(4) = I; y(5) = RES ; y(6) = RH ;
yprime(1) = (1-p)*pi-(mu+eta)*y(1);
yprime(2) = p*pi+eta*y(1)-beta*y(2)*y(4)-rho*y(6)-mu*y(1);
yprime(3) = beta*y(2)*y(4)-(mu+varepsilon)*y(3);
yprime(4) = varepsilon*y(3)-(mu+alpha+gamma+sigma)*y(4);
yprime(5) = sigma*y(4)-(mu+alpha1+delta)*y(5);
yprime(6) = gamma*y(4)-(mu+rho)*y(6)+delta*y(5);
function vprime = tbmodel(t,y) vprime = zeros(6,1); pi = 5000; rho = 0.56; beta = 0.05 varepsilon = 0.06; gamma = 0.65; alpha = 0.6; delta = 0.3; alpha1 = 0.04; % immunity and resistance parameters eta = 0.088; sigma = 0.25; % Variables y(1) = M; y(2) = S; y(3) = E; y(4) = I; y(5) = RES ; y(6) = RH; yprime(1) = (1-p)*pi-(mu+eta)*y(1); yprime(2) = p*pi+eta*y(1)-beta*y(2)*y(4)-rho*y(6) mu*y(1); yprime(3) = beta*y(2)*y(4)-(mu+varepsilon)*y(3); yprime(4) = varepsilon*y(3)-(mu+alpha+gamma+sigma)*y(4); yprime(5) = sigma*y(4)-(mu+alpha1+delta)*y(5); yprime(6) = gamma*y(4)-(mu+rho)*y(6)+delta*y(5); function vprime = tbmodel(t,y) vprime = zeros(6,1); pi = 5000; rho = 0.56; beta = 0.05 varepsilon = 0.06; gamma = 0.65; alpha = 0.6; delta = 0.3; alpha1 = 0.04; % immunity and resistance parameters eta = 0.088; sigma = 0.75; % Variables y(1) = M; y(2) = S; y(3) = E; y(4) = I; y(5) = RES ; y(6) = RH ; yprime(1) = (1-p)*pi-(mu+eta)*y(1); yprime(2) = p*pi+eta*y(1)-beta*y(2)*y(4)-rho*y(6) mu*y(1); yprime(3) = beta*y(2)*y(4)-(mu+varepsilon)*y(3); yprime(4) = varepsilon*y(3)-(mu+alpha+gamma+sigma)*y(4); yprime(5) = sigma*y(4)-(mu+alpha1+delta)*y(5); yprime(6) = gamma*y(4)-(mu+rho)*y(6)+delta*y(5);
GSJ: Volume 9, Issue 8, August 2021 ISSN 2320-9186 245
GSJ© 2021 www.globalscientificjournal.com

Page 21 of 21 U.Y. Madaki, M. A. Jatau and S. B. Sambo 2021
y0 = [102520, 12126, 2122, 4844, 1928, 6298]; tspan = [0:0.5:15]; [T, Y ] = ode45(′tbmodel′, tspan, y0); [P, Q] = ode45(′tbmodel25imm′, tspan, y0); [R, S] = ode45(′tbmodel75imm′, tspan, y0); plot(T,Y(:,4),’-’) hold on plot(P,Q(:,4),’k’) hold on plot(R,S(:,4),’o’) xlabel(’Time(in years)’) ylabel(’Infected population’) legend(’No Resistance’, ’25% Resistance’, 75% Resistance’)
GSJ: Volume 9, Issue 8, August 2021 ISSN 2320-9186 246
GSJ© 2021 www.globalscientificjournal.com