the effects of flexible work practices on employee ... · the effects of flexible work practices on...
TRANSCRIPT
1
The Effects of Flexible Work Practices on Employee Attitudes: Evidence
from a Large-Scale Panel Study in Germany
Claudia Kröll and Stephan Nüesch*
Chair of Business Management, University of Münster, Münster, Germany
Georgskommende 26, 48143 Münster. Correspondence concerning this article should be
addressed to [email protected]

2
The Effects of Flexible Work Practices on Employee Attitudes: Evidence
from a Large-Scale Panel Study in Germany
We explore the effects of flexible work practices (FWPs) on the work attitudes (job
satisfaction and turnover intention) and non-work attitudes (leisure satisfaction and
perceived health) of employees based on representative large-scale German panel data.
Because unobserved individual characteristics can easily act as confounders, we estimate
both pooled OLS models and individual fixed-effects models. Controlling for time-
constant individual heterogeneity, we find that the three considered FWPs—flexitime,
sabbaticals and working from home—significantly increase job satisfaction and that
sabbaticals and working from home (but not flexitime) significantly decrease turnover
intention. In addition, sabbaticals but not flexitime or working from home significantly
increase leisure satisfaction. The effects of FWPs on health are mostly weak and
statistically insignificant. Models that do not control for such individual heterogeneity
either underestimate the positive effects of FWPs or find detrimental effects. Our
findings indicate that organizations in Germany can increase job satisfaction and
decrease employee turnover intention by offering FWPs.
Keywords: flexible work practices, job satisfaction, turnover intention, leisure
satisfaction, health, fixed effects
Introduction
Globally, organizations are increasingly implementing flexible work practices (FWPs) (e.g.,
Leslie, Manchester, Park, & Mehng, 2012). Hill et al. (2008) define FWPs as policies that
enable employees to decide when (e.g., flexitime), where (e.g., working from home), and for
how long (e.g., sabbaticals) they engage in work-related tasks. Flexitime allows employees to
vary the times when they start and finish work. Moreover, employees can mostly self-

3
determine their daily working hours as long as their weekly, monthly or yearly numbers of
required hours of work are fulfilled according to their contracts of employment. Working from
home enables employees to work from a location outside their central workplace (Gajendran
& Harrison, 2007). Sabbaticals are defined as paid leaves from the work environment (Carr &
Tang, 2005; Davidson et al., 2010).
The high prevalence of FWPs (e.g., Leslie, Manchester, Park, & Mehng, 2012) is hardly
surprising given their potential benefits. Whereas some scholars (e.g., Golden, 2012;
Zeytinoglu, Cooke & Mann, 2009) argue that organizations implement FWPs primarily to
improve organizational efficiency by attracting and holding motivated employees with desired
talents, others emphasize more the employee-related advantages of FWPs such as increased
job satisfaction (Baltes, Briggs, Huff, Wright, & Neuman, 1999; Gajendran & Harrison, 2007).
This study investigates the effects of voluntary FWPs on the employee work attitudes (job
satisfaction and turnover intention) and non-work attitudes (leisure satisfaction and perceived
health) while still arguing that improved labor conditions may also positively affect long-term
organizational efficiency, creating a win-win situation for both employees and the
organization1.
We use representative German data to test our predictions. Several national laws and
initiatives in Germany promote FWPs. In 1998, a new law (“Gesetz zur sozialrechtlichen
Absicherung flexibler Arbeitszeitregelungen”) took effect that regulates lifetime working-time
accounts and also awards social security to people taking a sabbatical. The “codetermination
act” (entered into law on May 4, 1976) also gives employees a voice concerning FWPs in large
organizations. In the European Union, the “flexicurity” initiative has been started recently. An
important component of “flexicurity” is to formulate policies that facilitate both flexible and
reliable contractual arrangements (Bekker & Wilthagen, 2008). A cross-country comparison
shows that Germany is one of the countries in which FWPs are most prevalent, directly after

4
Denmark and Sweden (Plantenga & Remery, 2010). For instance, 54.7% of men and 49.6% of
women in Germany have access to flexitime. Due to the high prevalence of FWPs in Germany,
knowing the effects of FWPs is important for policymakers, practitioners and researchers.
The cumulative findings of research from other countries regarding the effects of FWPs
are mostly inconsistent. FWPs have been found to increase job satisfaction in some studies
(e.g., Baltes et al., 1999). Other studies, however, have found no relationship between FWPs
and job satisfaction (e.g., Hicks & Klimoski, 1981) or have even found that FWPs decrease job
satisfaction (e.g., Saltzstein, Ting & Saltzstein, 2001). Furthermore, while Igbaria and
Guimaraes (1999) show that working from home decreases turnover intention, Kossek, Lautsch
and Eaton (2006) find that working from home does not affect turnover intention. While Batt
and Valcour (2003) find that flexitime decreases turnover intention, Casper and Harris (2008)
find that flexitime does not affect turnover intention. There may be several reasons for the
inconsistency such as endogeneity, unobserved heterogeneity, different institutional settings,
unrepresentative data and different research designs.
Recently, experimental methods have been applied to test the effects of FWPs. Bloom,
Liang, Roberts, and Ying (2015) randomly assigned call center employees of a Chinese travel
agency either to work from home or in the office. They find that working from home leads to
a 13% performance increase. Dutcher (2012) shows that students who were randomly assigned
to work in the lab performed better with dull tasks and worse with creative tasks than students
who were randomly assigned to work outside the lab. Hunton and Norman (2010) show that
medical coders in a large health care company who were randomly assigned to work from
home were more committed to the organization than a control group of coders. While such
experiments can solve endogeneity issues, the experimental evidence is typically based on
unrepresentative student samples and/or based on specific settings. The transferability of these
results to the rest of the population is therefore questionable.

5
We reexamine the effects of FWPs on employee attitudes using the German Socio-
Economic Panel (GSOEP), which is a representative panel survey of German individuals.
Panel data enable us to run fixed-effects regressions that control for time-constant individual
heterogeneity such as stable personality, which is likely to influence cross-sectional estimates.
Personality is likely to influence both job selection and thus the availability of FWPs (e.g.,
Clark, Karau & Michalisin, 2012) and employee attitudes such as satisfaction (Costa &
McCrae, 1980; Smith, Patmos & Pitts, 2015), turnover intention (e.g., Jenkins, 1993) and
perceived health (e.g., Roysamb, Neale, Tambs, Reichborn-Kjennerud & Harris, 2003).
Because personality is widely considered to be a stable concept (e.g., Ferguson, 2010),
individual fixed effects largely eliminate the confounding influence from personality traits.
While large-scale panel data and fixed-effects models have been used to test the effects of
commuting time on psychological wellbeing (Roberts, Hodgson & Dolan, 2011) or the
influence of paid overtime work on job satisfaction (Hunt, 2013), we are the first to use
representative large-scale panel data and fixed-effects models to test the influence of FWPs on
employee attitudes.
The Consequences of FWPs
According to the conservation of resources (COR) theory (Hobfoll, 1989), employees want to
obtain, retain, foster and protect their resources. Resources include, for example, energies such
as time and knowledge (Grandey & Cropanzano, 1999). Energy resources are restricted
resources for which both work and non-work domains compete (Allen et al., 2013). Because
FWPs allow employees a largely self-determined allocation of their working time and place,
FWPs can help to protect resources (Hall et al., 2006).

6
Job Satisfaction
Job satisfaction is defined as a positive emotional state resulting from the appraisal of one’s
job or job experiences (Locke & Latham, 1990). FWPs provide employees with a great amount
of autonomy, which increases job satisfaction (e.g., Baltes et al., 1999; Scandura & Lankau,
1997; Evans, 1973; Almer & Kaplan, 2002; Golden, 2006; McNall, Masuda & Nicklin, 2010).
Flexitime, for example, enables employees to have flexibility in choosing when they will start
work. Employees who take a sabbatical usually also have high amounts of discretion in
determining its purpose and timing (Carr & Tang, 2005). And working from home gives
employees more control over breaks, clothing and lighting (e.g., Gajendran & Harrison, 2007).
In line with the COR theory, FWPs help to protect employee resources and positively affect
job satisfaction due to the increase of perceived autonomy (Hackman & Oldham, 1976).
Hypothesis 1a: Flexitime increases job satisfaction.
Hypothesis 1b: Sabbaticals increase job satisfaction.
Hypothesis 1c: Working from home increases job satisfaction.
Turnover Intention
Turnover intention is defined as an employee’s conscious and carefully considered plan to
leave the organization (Tett & Meyer, 1993). The COR theory argues that when employees
perceive their resources to be inadequate for handling work demands, they try to change their
situation (Hobfoll, 1989; Grandey & Cropanzano, 1999). By giving employees increased
autonomy over when and how to carry out work, FWPs provide employees with the means to
manage their resources (Hall et al., 2006), alleviating the need to quit their jobs to protect these
resources. Prior studies support this assumption, as they show that FWPs decrease turnover
intention (e.g., Igbaria & Guimaraes, 1999; Batt & Valcour, 2003; Stavrou & Kilaniotis, 2010;
7
Almer & Kaplan, 2002). Grund (2013) shows that self-initiated job changes increase the
perceived ability of employees to regulate their working hours, indicating that the regulation
of work hours is valuable for employees.
Hypothesis 2a: Flexitime decreases turnover intention.
Hypothesis 2b: Sabbaticals decrease turnover intention.
Hypothesis 2c: Working from home decreases turnover intention.
Leisure Satisfaction
Leisure is defined as a domain of freedom and self-determined experiences (e.g., Westman &
Eden, 1997). The greater flexibility in working conditions that FWPs provide also presents
employees with more freedom in the non-work domain, and therefore, with more opportunities
for the pursuit of leisure. Flexitime, for example, enables employees to start their working days
earlier to participate in leisure activities in the afternoon. When taking a sabbatical, employees
can largely self-determine its purpose, such as to learn a new language or to travel around the
world (Carr & Tang, 2005). Working from home eliminates or reduces commuting time and
so offers employees more leisure time. We therefore assume that FWPs increase leisure
satisfaction.
Hypothesis 3a: Flexitime increases leisure satisfaction.
Hypothesis 3b: Sabbaticals increase leisure satisfaction.
Hypothesis 3c: Working from home increases leisure satisfaction.
Health
Health consists of a physical (e.g., cardiovascular status) and a mental (e.g., perceived stress)
component. Health is defined as a “state of complete physical [and] mental … well-being and
8
not merely the absence of disease or infirmity” (p. 100, World Health Organization, 1948). As
employees perceive their work as increasingly stressful, a growing number of employees report
impaired health statuses (Leiter, 2014). In light of the COR theory, the impaired health status
is the consequence of an actual resource loss, a perceived threat of resource loss or a failure to
receive an expected resource gain (Hobfoll, 1989). Because FWPs give employees the
opportunity to act largely autonomously, employees are better equipped to protect their
resources (Hall et al., 2006). Flexitime and working from home, for example, improve health
by giving employees control over their work schedules (Baltes et al., 1999, Gajendran &
Harrison, 2007). Sabbaticals help employees to disconnect from work, which facilitates general
recovery. Furthermore, sabbaticals engender new perspectives, renewed vigor and better health
(Davidson et al., 2010). We therefore argue that FWPs result in better health.
Hypothesis 4a: Flexitime increases health.
Hypothesis 4b: Sabbaticals increase health.
Hypothesis 4c: Working from home increases health.
Methods
Data
The data for our analyses are drawn from employee responses to the German Socio-Economic
Panel (GSOEP)2, a large, representative panel survey of private households in Germany
(Wagner, Frick & Schupp, 2007). Because data on FWPs were not collected each year, we
have to use different sub-samples. More precisely, the analyses of flexitime are based on data
from every second year from 2003 to 2009, the analyses of sabbaticals are based on data from
every year from 2002 to 2013, and the analyses of working from home are based on data from
the years 1999 and 2009.

9
To avoid biases relating to apprenticeship and early retirement, we restricted our sample
to employees between the ages of 20 and 60. Moreover, we dropped self-employed participants
because they by definition have higher autonomy and flexibility at work than other types of
employees (Hundley, 2001). In addition, we limited our sample to employees who answered
at least once to all three FWPs in the considered years. Thus, even though the sample size is
different across the three different FWPs, the pool of employees is always the same.
Measures
All FWPs are measured dichotomous and equal 1 if FWPs are available. The predictor flexitime
is measured through the question, “Do you have access to flexitime and a working-time
account, and a certain control of daily working time within this framework?” Sabbaticals are
measured with the question, “Can overtime hours flow into a so-called working-time account
that you can equalize within a year or more with time off?” Working from home is derived from
the question, “Do you ever carry out your work activity at home?”
The GSOEP collects data about job satisfaction and leisure satisfaction based on a
rating scale from 0 (totally unhappy) to 10 (totally happy) with the question: “How satisfied
are you today with your job?” and “How satisfied are you today with your leisure time?”,
respectively. The variable turnover intention is derived from the question “How likely is it that
you will look for a new job on your own initiative within the next two years?” Respondents
estimate the probability of their turnover intention according to a scale from 0 (very unlikely)
to 100 (very likely). Information about perceived health is taken from the question “How would
you describe your current health?”, with the following possible answers: 1) “Very Good,” 2)
“Good,” 3) “Satisfactory,” 4) “Poor” or 5) “Bad.” We dichotomize these categories for our
analyses due to the questionable interval scale. The new binary indicator health equals 1 if the
employees perceive their health to be at least satisfactory and 0 otherwise. However, the results

10
would not change in any significant way when using other threshold levels for dichotomization
or when using health as a metrical variable.
Because the meta-analytic results by Carsten and Spector (1987) show that
unemployment is correlated with job satisfaction and turnover intention, we include years of
unemployment as a control variable in our analyses. Based on prior literature (e.g., Griffeth,
Hom & Gaertner, 2000), we also control for the following socioeconomic and demographic
characteristics that are likely to covary with our dependent variables: a) age, b) gender c)
stipulated working hours, d) organizational size, e) tenure, f) logged hourly gross wage, g) type
of workers (hourly paid vs. salaried), h) number of persons in household, i) children under the
age of 16 in household, j) commuting distance, k) hours of overtime, l) hours of undertime, m)
experience in part-time work and n) if a job change took place.
Statistical Methods
Because personality traits significantly affect self-reported measures such as job satisfaction
(e.g., Costa & McCrae, 1980) and because personality traits are largely considered to be stable3
(e.g., Ferguson, 2010), we use fixed-effects modeling to estimate the influence of FWPs.4
Fixed-effects modeling only uses within-person changes over time and controls for time-
invariant unobserved heterogeneity (Allison, 2006). To test the potential influence of
unobserved time-constant confounders, we compare the results of the fixed-effects models to
the results of pooled ordinary least squares (OLS) regressions.
We run fixed-effects linear probability models (LPM) when estimating our binary
health variable rather than fixed-effects logit models for two reasons. First, observations with
no within-variation in the dependent variables are dropped from a fixed-effects logit model,
which would change the interpretation and the generalizability of the results (e.g., Caudill,
1988). Second, unlike linear models, logit estimates cannot be directly compared with those

11
from a fixed-effects model because including fixed effects in a logit model would change the
estimates even if fixed effects were independent of the variables of interest (e.g., Norton, 2012).
Results
Descriptive Statistics
Table 1 shows descriptive statistics of all the considered variables, categorized by FWPs. Our
flexitime sample includes 8,325 employees and 21,428 person-year observations. The
sabbaticals sample includes 7,585 employees and 19,198 person-year observations. The
working from home sample includes 6,132 employees and 7,126 person-year observations.
----------------------------------- Insert Table 1 about here
------------------------------------
Results of Hypotheses Testing
Job Satisfaction
Table 2 shows the pooled OLS (column 1) and the fixed-effects results (column 2) of FWPs
on job satisfaction. Focusing on fixed-effect results, we find that flexitime (b = .05, SE = .03,
p <.10), sabbaticals (b = .08, SE = .02, p <.001) and working from home (b = .21, SE = .11, p
<.05) significantly increase job satisfaction. Thus, we find support for Hypotheses 1a, 1b and
1c. When comparing the fixed-effects results in column (2) with the pooled OLS results in
column (1), we see that the pooled OLS results are negatively biased. The significantly positive
effects of sabbaticals and working from home on job satisfaction are larger in the fixed-effects
models than in the OLS models. The effect of flexitime even becomes significantly negative if
we do not control for individual heterogeneity.
----------------------------------- Insert Table 2 about here
------------------------------------

12
Turnover Intention
Table 3 shows that sabbaticals (b = -.04, SE = .02, p <.10) and working from home (b = -.28,
SE = .11, p <.05) significantly decrease turnover intention, whereas the negative effect of
flexitime on turnover intention is not statistically significant (b = -.04, SE = .03, ns.). Hence,
the data support Hypotheses 2b and 2c, but not Hypothesis 2a. Here again, the pooled OLS
results are quite different: flexitime and working from home do not decrease but significantly
increase turnover intention when not controlling for individual heterogeneity.
-----------------------------------
Insert Table 3 about here ------------------------------------
Leisure Satisfaction
Table 4 shows that sabbaticals significantly increase leisure satisfaction (b = .06, SE = .02, p
<.01), whereas the effects of flexitime (b = .01, SE = .03, ns.) and working from home (b = -
.01, SE = .10, ns.) are small and statistically insignificant. The data support Hypothesis 3b, but
not Hypotheses 3a and 3c. Regarding leisure satisfaction, the pooled OLS models lead to
virtually the same results as the fixed-effects models.
----------------------------------- Insert Table 4 about here
------------------------------------
Health
Table 5 shows that flexitime (b = -.02, SE = .01, ns.), sabbaticals (b = -.01, SE = .01, ns.) and
working from home (b = .02, SE = .05, ns.) do not have a significant effect on health when
controlling for individual heterogeneity. Hence, the data do not support Hypotheses 4a, 4b or
4c. In the pooled OLS models, however, the negative effect of flexitime on health is highly
significant at the 0.1% level, and the negative effect of sabbaticals and the positive effect of
working from home on health are marginally significant at the 10% level.

13
----------------------------------- Insert Table 5 about here
------------------------------------
Discussion
Contribution to the Literature
Fixed-effects analyses show that FWPs increase job satisfaction, which is in line with prior
literature (e.g., Baltes et al., 1999; McNall et al., 2010) and the COR theory. Through FWPs,
employees have more flexibility in determining the timing and location of their work, which
helps them to protect important resources such as time (Grandey & Cropanzano, 1999).
We also find that sabbaticals and working from home decrease turnover intention.
Whereas the negative effect of working from home is large and highly significant, the negative
effect of sabbaticals is smaller and marginally significant, and the negative effect of flexitime
is marginally insignificant. The significant findings are in line with prior literature (e.g.,
Halpern, 2005) and the COR theory. Through increased autonomy via FWPs, employees can
better protect their resources, which results in lower turnover intention. Contrary to our
expectations, we could not find a significant effect of flexitime on turnover intention. One
explanation may be that flexitime fails to protect resources due to highly unstructured and
often-changing daily schedules (e.g., Brummelhuis, Haar, & van der Lippe, 2010). Moreover,
unlike working from home and sabbaticals, flexitime does not provide additional time for work
and non-work domains.
Whereas sabbaticals significantly increase leisure satisfaction, flexitime and working
from home yield no significant effects. Sabbaticals allow employees to compensate overtime
with extended periods of time off and thus enable employees to pursue private goals and desires
such as travelling, doing further education, and learning a language. The opportunity to
compensate overtime in the future may increase leisure satisfaction because employees are
14
likely to anticipate the positive experiences of doing a sabbatical in the future. In contrast to
our expectations, we could not find a significantly positive effect of flexitime and working
from home on leisure satisfaction. Through flexitime and working from home, the boundary of
work and non-work domains may become more permeable. Heijstra and Rafnsdottir (2010)
show that working from home turns home into a place of work, which seems to hinder these
employees from enjoying their leisure time. As employees who work from home aim to
maintain good relations with their colleagues and supervisors, they often believe they have to
be continually available for work. Thus, employees who work from home invest more of their
resources into the work domain, which tends to defeat the positive effects of having to spend
less time commuting.
FWPs have no significant effect on health. FWPs seem to have both positive and
negative effects on health, which balance each other out. On the one hand, FWPs increase the
frequency of role changes, process losses and perceived cognitive complexity (e.g., Kossek &
Lautsch, 2012), which may have detrimental effects on health. On the other hand, FWPs
improve employee coping mechanisms, which helps them to protect health-relevant resources
(e.g., Hall et al., 2006).
Methodological Contribution
A comparison of the pooled OLS and fixed-effects results shows that the pooled OLS
effects of FWPs on job satisfaction are negatively biased, while on turnover intention, these
results are mostly positively biased. Thus, FWPs appear to have far less positive and often even
detrimental effects on work attitudes if we do not control for time-constant individual
heterogeneity. The observable variables reveal that the availability of FWPs is positively
correlated with tenure (r = .09, p <.001), hourly wage (r = .06, p <.001) and working hours (r
= .06, p <.001), which indicate that jobs with FWPs are typically white-collar and managerial-
level jobs (e.g., Golden, 2001, Golden, 2012; Zeytinoglu et al., 2009). Moreover, our results
15
and prior literature (e.g., Griffeth et al., 2000) show that longer tenure (r = -.03, p <.001) and
working hours (r = -.03, p <.001) are related to lower job satisfaction.
Because the provision of FWPs depends on firm characteristics such as firm size and
industry (Kotey & Sharma, 2015; Zeytinoglu et al., 2009) and because individuals apply for
jobs with or without FWPs based on their own attitudes and personalities (Giannikis & Mihail,
2011), the availability of FWPs is not random. For example, Clark et al. (2012) show that
individuals with high neuroticism tend to prefer working from home. At the same time, such
individuals generally show higher turnover intention (Houkes, Janssen, de Jonge & Nijhuis,
2001) and decreased satisfaction (Judge, Heller & Mount, 2002). Thus, results from models
that do not control for unobserved individual heterogeneity such as stable personality (e.g.,
Ferguson, 2010) are likely to be biased. Panel data and fixed-effects models offer an easy way
to control for unobserved but stable personality traits.
Limitations and Directions for Future Research
Some limitations are based on the data itself. Information about working from home is only
available from two years, which leads to a relatively low cases-to-variables ratio and hence low
statistical power in the fixed-effects models. However, a low cases-to-variables ratio does not
lead to biased estimates itself, although it increases standard errors, which makes significant
results less likely. We still find significant results of working from home on both job
satisfaction and turnover intention.
In addition, the study is also limited by the operationalizations of flexitime, working
from home and sabbaticals. The operationalization of flexitime is based on the presence of
working-time accounts. If working hours can be saved up over a longer period of time,
flexitime resembles sabbaticals. Working from home is measured by the question of whether
the employee sometimes works at home, which includes employees who work at home for
entire days but also persons who, for example, respond to work emails in the evening if

16
necessary. To eliminate the confounding influence of a high workload, we control for overtime
hours. Sabbaticals are measured rather vaguely. Panel subjects were only asked whether the
employees are allowed to use their overtime hours for time off within a year or more. Hence,
we do not know if employees can take only one day, several days or even months off from
work.
Because the variables we use in our analysis are only offered as single-item questions,
we could not examine their reliability. We therefore encourage further panel studies that
analyze the effects of FWPs based on multiple-item measurements. The substantial differences
between the pooled OLS and the fixed-effects results suggest that unobserved heterogeneity
factors such as personality influences attitudes. We thus encourage using panel data and fixed-
effects regressions also in other contexts in which unobserved but stable factors act as
confounders.
Our analysis is based on a specific case in Germany; hence, we cannot generalize our
findings. Raghuram, London and Larsen (2001) and Kossek and Ollier-Malaterre (2013)
highlight the importance of national context when analyzing the effects of FWPs. Similarly,
Masuda et al. (2012) stress the importance of examining the impact of socio-cultural factors
such as collectivism on FWPs and their effects. We therefore encourage future replication
studies to test the transferability of our results to other countries with other legal and
institutional backgrounds. The effects of FWPs on employee attitudes may be less beneficial
in countries in which the legal and institutional background is less employee-friendly than in
Germany. As the body of literature about FWPs is growing, meta-analyses could also explicitly
include institutions as moderating or intervening variables into their models.
We further encourage future studies to examine the interplay between work and non-
work domains. Sonnentag (2003) shows that non-work aspects can influence how one feels
and behaves at work. Because we find that sabbaticals increase leisure satisfaction, sabbaticals

17
may also increase work aspects beyond job satisfaction and turnover intention such as
organizational attachment.
Implication for Practice
This study demonstrates that FWPs have a significantly positive influence on employee work
attitudes. Hence, organizations benefit from offering FWPs for three reasons. First, flexitime,
sabbaticals and working from home significantly increase job satisfaction. Job satisfaction is
an important work attitude, as it is linked to increased job performance (e.g., Judge, Bono,
Thoresen & Patton, 2001) and organizational commitment (e.g., Brunetto, Teo, Shacklock &
Farr-Wharton, 2012). Moreover, employees who are more motivated may share their positive
attitudes with their coworkers and so improve their working atmospheres (Grover & Crooker,
1995).
Second, offering sabbaticals and working from home significantly decrease turnover
intention. Because turnover is very costly (e.g., Halpern, 2005), offering FWPs saves
organizations from the costs of hiring and training new employees. Furthermore, employees
who intend to leave their organizations typically reduce their productivity, which results in
lower organizational performance, even when the employees do not officially quit their jobs
(Halpern, 2005).
Third, organizations should offer sabbaticals not only because they increase job
satisfaction and decrease turnover intention but also because they increase leisure satisfaction
and because positive non-work attitudes tend to have positive spillovers into work attitudes.
Employees who are satisfied with their non-work domains show higher work engagement and
proactive behavior (Sonnentag, 2003). Whereas offering to allow employees to work from
home and to have flexitime is not feasible for certain jobs such as assembly line work, offering
sabbaticals is feasible for all types of jobs.
18
Our results indicate that FWPs do not significantly improve the health of employees.
However, there may be interventions that more specifically focus on health improvement, such
as stress management trainings, and may have a significant impact on employee health (e.g.,
Richardson & Rothstein, 2008).
Conclusion
The world-wide research on the effects of flexible work practices (FWPs) has produced
conflicting results. We reexamined the effects of voluntary FWPs on employee attitudes using
representative large-scale panel data from Germany. The results from individual fixed-effects
models show that flexitime, sabbaticals and working from home significantly increase job
satisfaction, that sabbaticals and working from home significantly decrease turnover intention
and that sabbaticals significantly increase leisure satisfaction. Moreover, we show that it is
important to control for individual unobserved heterogeneity, such as stable personality traits.
Notes
1. The effects of FWPs on employee attitudes are likely to be less beneficial when
the use of FWPs is mandatory, and FWPs therefore do not increase flexibility
(e.g., employees who have to work from home). Thorsteinson (2003) shows, for
example, that employees who voluntarily work part-time are more satisfied with
their jobs than employees who have to work part-time.
2. The data are provided from the German Institute for Economic Research (DIW
Berlin).
3. Our data show that four out of the five personality traits (e.g., McCrae & Costa,
1987) do not significantly differ from the mean per person over time.

19
4. Except in three models that include working from home as predictor, the Hausman
specification test (Hausman, 1978) is statistically significant at a 5% significance
level, supporting the use of fixed-effects modeling. In the three models with an
insignificant Hausman specification test, the results with random effects modeling
are virtually the same.
References
Allen, T. D., Johnson, R. C., Kiburz, K. M., & Shockley, K. M. (2013). Work-family conflict and flexible work arrangements: deconstructing flexibility. Personnel Psychology, 66, 345–376. doi: 10.1111/peps.12012
Allison, P. D. (2006). Fixed effects regressions. In SAS (Paper 184-31). Proceedings of the 31st Annual SAS User Group International Conference (pp. 1–20). Cary, NC: SAS Institute Inc.
Almer, E. D., & Kaplan, S. E. (2002). The effects of flexible work arrangements on stressors, burnout, and behavioral job outcomes in public accounting. Behavioral Research in Accounting, 14, 1–34. doi: http://dx.doi.org/10.2308/bria.2002.14.1.1
Baltes, B. B., Briggs, T. E., Huff, J. W., Wright, J. A., & Neuman, G. A. (1999). Flexible and compressed workweek schedules: A meta-analysis of their effects on work-related criteria. Journal of Applied Psychology, 84, 496–513. doi: 10.1037/0021-9010.84.4.496
Batt, R., & Valcour, P. M. (2003). Human resources practices as predictors of work-family outcomes and employee turnover. Industrial Relations, 42, 189–220. doi: 10.1111/1468-232X.00287
Bekker, S., & Wilthagen, T. (2008). Europe’s Pathways to flexicurity: Lessons presented from and to the Netherlands. Intereconomics, 43, 68–73. doi: 10.1007/s10272-008-0244-0
Bloom, N., Liang, J., Roberts, J., & Ying, Z. J. (2015). Does working from home work? Evidence from a Chinese experiment. The Quarterly Journal of Economics, 130, 165–218. doi: 10.1093/qje/qju032
Brunetto, Y., Teo, S. T. T., Shacklock, K., & Farr-Wharton, R. (2012). Emotional intelligence, job satisfaction, well-being and engagement: Explaining organizational commitment and turnover intentions in policing. Human Resource Management Journal, 22, 428–441. doi: 10.1111/j.1748-8583.2012.00198.x
Carr, A. E., & Tang, L.-P. (2005). Sabbaticals and employee motivation: Benefits, concerns and implications. Journal of Education for Business, 80, 160–164. doi: 10.3200/JOEB.80.3.160-164
Carsten, J. M., & Spector, P. E. (1987). Unemployment, job satisfaction and employee turnover: A meta-analytic test of the Muchinsky model. Journal of Applied Psychology, 72, 374–381. doi: 10.1037/0021-9010.72.3.374
Caudill, S. B. (1988). Practitioners corner. An advantage of the Linear Probability Model over probit or logit. Oxford Bulletin of Economics and Statistics, 50, 425–427. doi: 10.1111/j.1468-0084.1988.mp50004005.x
Clark, L. A., Karau, S. J., & Michalisin, M. D. (2012). Work from home attitudes and the ‘big five’ personality dimensions. Journal of Management Policy and Practice, 13, 31–46. Retrieved from http://www.na-businesspress.com

20
Costa, P. T. Jr., & McCrae, R. R. (1980). Influence of extraversion and neuroticism on subjective well-being. Journal of Personality and Social Psychology, 38, 668–678. doi: 10.1037/0022-3514.38.4.668
Davidson, O. B., Eden, D., Westman, M., Cohen-Carash, Y., Hammer, L. B., Kluger, A. N., … Spector, P. (2010). Sabbatical leave: Who gains and how much? Journal of Applied Psychology, 95, 953–964. doi: 10.1037/a0020068
Dutcher, E. G. (2012). The effects of work from home on productivity: An experimental examination. The role of dull and creative tasks. Journal of Economic Behavior & Organization, 84, 355–363. doi: 10.1016/j.jebo.2012.04.009
Evans, M. G. (1973). Notes on the impact of flexitime in a large insurance company: Reactions of non-supervisory employees. Occupational Psychology, 47, 237–240. Retrieved from http://psycnet.apa.org/psycinfo/1975-22060-001
Ferguson, C. J. (2010). A meta-analysis of normal and disordered personality across the life span. Journal of Personality and Social Psychology, 98, 659–667. doi: 10.1037/a0018770
Gajendran, R. S., & Harrison, D. A. (2007). The good, the bad, and the unknown about work from home: A meta-analysis of psychological mediators and individual consequences. Journal of Applied Psychology, 92, 1524–1541. doi: 10.1037/0021-9010.92.6.1524
Giannikis, S. K., & Mihail, D. M. (2011). Flexible work arrangements in Greece: A study of employee perceptions. The International Journal of Human Resources, 22, 417–432. doi: 10.1080/09585192.2011.540163
Golden, L. (2001). Flexitime. Which workers get them? American Behavioral Scientist, 44, 1157–1178. doi: 10.1177/00027640121956700
Golden, L. (2012). The effects of working time on productivity and firm performance: A research synthesis paper. Conditions of Work and Employment Series No. 33. Retrieved from http://www.oit.org/wcmsp5/groups/public/---ed_protect/---protrav/---travail/ documents/publication/wcms_187307.pdf
Golden, T. D. (2006). The role of relationships in understanding telecommuter satisfaction. Journal of Organizational Behavior, 27, 319–340. doi: 10.1002/job.369
Grandey, A. A., & Cropanzano, R. (1999). The conservation of resources model applied to work–family conflict and strain. Journal of Vocational Behavior, 54, 350–370. doi: 10.1006/jvbe.1998.1666
Griffeth, R. W., Hom, P. W., & Gaertner, S. (2000). A meta-analysis of antecedents and correlates of employee turnover: Update, moderator test, and research implications for the next millennium. Journal of Management, 26, 463–488. doi: 10.1177/014920630002600305
Grover, S. L., & Crooker, K. J. (1995). Who appreciates family-responsive human resource policies: The impact of family-friendly policies on the organizational attachment of parents and non-parents. Personnel Psychology, 48, 271–288. doi: 10.1111/j.1744-6570.1995.tb01757.x
Grund, C. (2013). Job preferences as revealed by employee-initiated job changes. The International Journal of Human Resource Management, 24, 2825–2850. doi: 10.1080/09585192.2013.804689
Hackman, J. R., & Oldham, G. R. (1976). Motivation through the design of work: Test of a theory. Organizational Behavior and Human Performance, 16, 250–279. doi: 10.1016/0030-5073(76)90016-7
Hall, A. T., Royle, M. T., Brymer, R. A., Perrewé, P. L., Ferris, G. R., & Hochwarter, W. A. (2006). Relationships between felt accountability as a stressor and strain reactions: The neutralizing role of autonomy across two studies. Journal of Occupational Health Psychology, 11, 87–99. doi: 10.1037/1076-8998.11.1.87

21
Halpern, D. F. (2005). How time-flexible work policies can reduce stress, improve health and save money. Stress and Health, 21, 157–168. doi: 10.1002/smi.1049
Hausman, J. A. (1978). Specification tests in econometrics. Econometrica, 46, 1251–1271. doi: 10.2307/1913827
Heijstra, T. M., & Rafnsdottir, G. L. (2010). The internet and academics' workload and work–family balance. Internet and Higher Education, 13, 158–163. doi: 10.1016/j.iheduc.2010.03.004
Hicks, W. D., & Klimoski, R. J. (1981). The impact of flexitime on employee attitudes. The Academy of Management Journal, 24, 333–341. doi: 10.2307/255845
Hill, J. E., Grzywacz, J. G., Allen, S., Blanchard, V. L., Matz-Costa, C., Shulkin, S., & Pitt-Catsouphes, M. (2008). Defining and conceptualizing workplace flexibility. Community, Work and Family, 11, 149–163. doi: 10.1080/13668800802024678
Hobfoll, S. E. (1989). Conservation of resources: A new attempt at conceptualizing stress. American Psychologist, 44, 513–524. doi: 10.1037/0003-066X.44.3.513
Houkes, I., Janssen, P. P. M., De Jonge, J., & Nijhuis, F. J. N. (2001). Specific relationships between work characteristics and intrinsic work motivation, burnout and turnover intention: A multi-sample analysis. European Journal of Work and Organizational Psychology, 10, 1–23. doi: 0.1080/13594320042000007
Hundley, G. (2001), Why and when are the self-employed more satisfied with their work? Industrial Relations: A Journal of Economy and Society, 40, 293–316. doi: 10.1111/0019-8676.00209
Hunt, J. (2013). Flexible work time in Germany: Do workers like it and how have employers exploited it over the cycle? Perspektiven der Wirtschaftspolitik, 14, 67–98. doi: 10.2139/ssrn.2166717
Hunton, J. E., & Norman, C. S. (2010). The impact of alternative telework arrangements on organizational commitment: Insights from a longitudinal field experiment. Journal of Information Systems, 24, 67–90. doi: 10.2308/jis.2010.24.1.67
Igbaria, M., & Guimaraes, T. (1999). Exploring differences in employee turnover intentions and its determinants among telecommuters and non- telecommuters. Journal of Management Information Systems, 16, 147–64. doi: 10.1080/07421222.1999. 11518237
Jenkins, J. M. (1993). Self-monitoring and turnover: The impact of personality on intent to leave. Journal of Organizational Behavior, 14, 83–91. doi: 10.1002/job.4030140108
Judge, T. A., Bono, J. E., Thoresen, C. J., & Patton, G. K. (2001). The job satisfaction – job performance relationship: A qualitative and quantitative review. Psychological Bulletin, 127, 376–407. doi: 10.1037/0033- 2909.127.3.376
Judge, T. A., Heller, D., & Mount, M. K. (2002). Five-factor model of personality and job satisfaction: A meta-analysis. Journal of Applied Psychology, 87, 530–541. doi: 10.1037//0021-9010.87.3.530
Kossek, E. E., & Lautsch, B. A. (2012). Work-family boundary management styles in organizations: A cross-level model, Organizational Psychology Review, 2, 152–171. doi: 10.1177/2041386611436264
Kossek, E. E., Lautsch, B. A., & Eaton, S. C. (2006). Telecommuting, control, and boundary management: Correlates of policy use and practice, job control, and work–family effectiveness: Journal of Vocational Behavior, 68, 347–367. doi: 10.1016/j.jvb.2005.07.002
Kossek, E. E., & Michel, J. S. (2011). Flexible work schedules. In S. Zedeck (Ed.), APA Handbook of Industrial and Organizational Psychology. Vol. 1, Washington, DC: American Psychological Association.

22
Kossek, E. E., & Ollier-Malaterre, A. (2012). Work-family policies: Linking national contexts, organizational practice and people for multi-level change. In S. Poelmans, J. Greenhaus, & M. Ias Heras (Eds.). New Frontiers in Work-Family Research: A Vision for the Future in a Global World. London: Palgrave.
Kotey, B., & Sharma, B. (2015). Predictors of flexible working arrangement provision in small and medium enterprises (SMEs). The International Journal of Human Resource Management, doi: 10.1080/09585192.2015.1102160
Leiter, M. P. (2014). Key worklife areas contributing to health care burnout: Reflections on the ORCAB project. British Journal of Health Psychology, 20, 223–227. doi: 10.1111/bjhp.12124
Leslie, L. M., Manchester, C. F., Park, T., & Mehng, S. A. (2012). Flexible work practices: A source of career premiums or penalties. Academy of Management Journal, 55, 1407-1428. doi: 10.5465/amj.2010.0651
Locke, E. A., & Latham, G. P. (1990). A theory of goal setting and task performance. Englewood Cliffs, NJ: Prentice-Hall.
McCrae, R. R., & Costa, P. T. Jr. (1987). Validation of the five-factor model of personality across instruments and observers. Journal of Personality and Social Psychology, 52, 81–90. doi: 10.1037//0022-3514.52.1.81
McNall, L. A., Masuda, A. D., & Nicklin, J. M. (2010). Flexible work arrangements, job satisfaction and turnover intentions: The mediating role of work-to-family enrichment. The Journal of Psychology, 144, 61–81. doi: 10.1080/00223980903356073
Norton, E. C. (2012). Log odds and ends. NBER Working Paper Series 18252, National Bureau of Economic Research, Inc. doi: 10.3386/w18252
Plantenga, J., & Remery, C. (2010). Flexible working time arrangements and gender equality. A comparative review of 30 European countries. Luxembourg: Publications Office of the European Union. doi: 10.2767/29844
Raghuram, S., London, M., & Larsen, H. H. (2001). Flexible employment practices in Europe: Country versus culture. International Journal of Human Resource Management, 12, 738–753. doi: 10.1080/09585190110047811
Richardson, K. M., & Rothstein, H. R. (2008). Effects of occupational stress management intervention programs: a meta-analysis. Journal of Occupational Health Psychology, 13, 69-93. doi: 10.1037/1076-8998.13.1.69
Roberts, J., Hodgson, R., & Dolan, P. (2011). “It’s driving her mad”: Gender differences in the effects of commuting on psychological health. Journal of Health Economics, 5, 1064–1076. doi: 10.1016/j.jhealeco.2011.07.006
Roysamb, E., Neale, M. C., Tambs, K., Reichborn-Kjennerud, T., & Harris, J. R. (2003). Happiness and health: Environmental and genetic contributions to the relationship between subjective wellbeing, perceived health, and somatic illness. Journal of Personality and Social Psychology, 85, 1136–1146. doi: 10.1037/0022-3514.85.6.1136
Saltzstein, A. L., Ting, Y., & Saltzstein, G. H. (2001). Work-family balance and job satisfaction: The impact of family-friendly policies on attitudes of federal government employees. Public Administration Review, 61, 452–467. doi: 10.1111/0033-3352.00049
Scandura, T. A., & Lankau, M. J. (1997). Relationships of gender, family responsibility and flexible work hours to organizational commitment and job satisfaction. Journal of Organizational Behavior, 18, 377–391. doi: http://www.jstor.org/stable/3100183
Smith, S. A., Patmos, A., & Pitts, M. J. (2015). Communication and teleworking: A study of communication channel satisfaction, personality, and job satisfaction for teleworking employees. International Journal of Business Communication, doi: 10.1177/2329488415589101. doi: 10.1177/2329488415589101

23
Sonnentag, S. (2003). Recovery, work engagement, and proactive behavior: A new look at the interface between nonwork and work. Journal of Applied Psychology, 88, 518–528. doi: 10.1037/0021-9010.88.3.518
Stavrou, E., & Kilaniotis, C. (2010). Flexible work and turnover: An empirical investigation across cultures. British Journal of Management, 21, 541 –554. doi: 10.1111/j.1467-8551.2009.00659.x
ten Brummelhuis, L. L., Haar, J. M., & van der Lippe, T. (2010). Collegiality under pressure: The effects of family demands and flexible work arrangements in the Netherlands. The International Journal of Human Resource Management, 21, 2831–2847. doi: 10.1080/ 09585192.2010.528666
Tett, R. P., & Meyer, J. P. (1993). Job satisfaction, organizational commitment, turnover intention, and turnover: Path analyses based on meta-analytic findings. Personnel Psychology, 46, 259-293. doi: 10.1111/j.1744-6570.1993.tb00874.x
Thorsteinson, T. J. (2003). Job attitudes of part-time vs. full-time workers: A meta-analytic review. Journal of Occupational and Organizational Psychology, 76, 151–177. doi: 10.1348/096317903765913687
Wagner, G. G., Frick, J. R., & Schupp, J. (2007). The German Socio-Economic Panel Study (SOEP) – Scope, evolution and enhancements. Schmollers Jahrbuch 127, 123–169. doi: 10.5684/soep.v36
Westman, M., & Eden, D. (1997). Effects of a respite from work on bornout: Vacation relief and fade-out. Journal of Applied Psychology, 82, 516–527. doi: 10.1037//0021-9010.82.4.516
World Health Organization (1948). Preamble to the constitution of the WHO. Official records of the WHO (No. 2, p. 100). Entered into force April, 7, 1948.
Zeytinoglu, I. U., Cooke, G. B., & Mann, S. L. (2009). Flexibility: Whose choice is it anyway? Relations Industrielles/Industrial Relations, 64, 555–574. Retrieved from http://web.a.ebscohost.com/ehost/pdfviewer/pdfviewer?sid=52905cbb-e3e9-49af-980f-3e482af0b4d4%40sessionmgr4006&vid=0&hid=4206

24
Table 1. Descriptive Statistics
Flexitime1 Sabbaticals2 Working from Home3
Variables M SD M SD M SD Dependent Variables Job Satisfaction Overall 6.99 1.93 6.95 1.93 6.92 1.97 Within 1.14 1.13 .59 Turnover Intention Overall 21.23 29.40 21.86 29.31 22.97 30.17 Within 16.86 17.08 8.99 Leisure Satisfaction Overall 6.57 2.05 6.50 2.05 6.53 2.07 Within 1.12 1.11 .62 Healtha Overall .57 .49 .56 .50 .56 .50 Within .29 .29 .15 Predictors Flexitime Overall .27 .44 Within .20 Sabbaticals Overall .67 .47 Within .25
Working from Home Overall .15 .36
Within .10 Controls Malea Overall .52 .50 .54 .50 .53 .50 Within .00 .00 .00 Age Overall 43.26 9.98 43.61 9.87 42.63 10.24 Within 1.93 2.58 2.64 Salaried Workersa Overall .73 .44 .75 .43 .71 .45 Within .13 .13 .07
Tenurec Overall 12.35 10.05 12.60 10.05 11.77 9.99 Within 2.24 2.75 2.41 Childrena Overall .36 .48 .35 .48 .37 .48 Within .20 .22 .18
Persons in Household Overall 2.83 1.21 2.79 1.21 2.85 1.21
Within .41 .45 .33 Number of Observations 21.428 19.198 7.126 Number of Individuals 8.325 7.585 6.132 Note: M = mean; SD = standard deviation; 1Years 2003, 2005, 2007, 2009; 2Years 2002-2013; 3Years 1999, 2009; aDummy variables; bIncluded imputed values, deflated to the basic year 2010; cIn years.
25
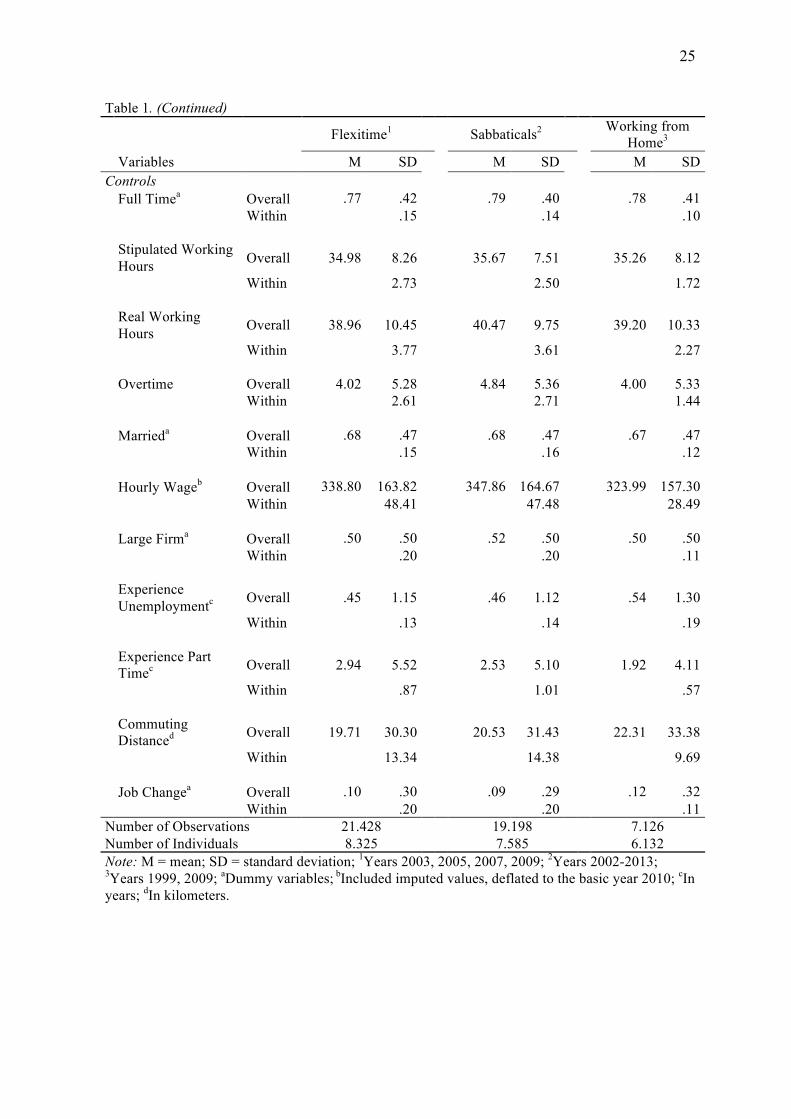
Table 1. (Continued)
Flexitime1 Sabbaticals2 Working from Home3
Variables M SD M SD M SD Controls Full Timea Overall .77 .42 .79 .40 .78 .41 Within .15 .14 .10
Stipulated Working Hours Overall 34.98 8.26 35.67 7.51 35.26 8.12
Within 2.73 2.50 1.72
Real Working Hours Overall 38.96 10.45 40.47 9.75 39.20 10.33
Within 3.77 3.61 2.27 Overtime Overall 4.02 5.28 4.84 5.36 4.00 5.33 Within 2.61 2.71 1.44 Marrieda Overall .68 .47 .68 .47 .67 .47 Within .15 .16 .12 Hourly Wageb Overall 338.80 163.82 347.86 164.67 323.99 157.30 Within 48.41 47.48 28.49 Large Firma Overall .50 .50 .52 .50 .50 .50 Within .20 .20 .11
Experience Unemploymentc Overall .45 1.15 .46 1.12 .54 1.30
Within .13 .14 .19
Experience Part Timec Overall 2.94 5.52 2.53 5.10 1.92 4.11
Within .87 1.01 .57
Commuting Distanced Overall 19.71 30.30 20.53 31.43 22.31 33.38
Within 13.34 14.38 9.69 Job Changea Overall .10 .30 .09 .29 .12 .32 Within .20 .20 .11 Number of Observations 21.428 19.198 7.126 Number of Individuals 8.325 7.585 6.132 Note: M = mean; SD = standard deviation; 1Years 2003, 2005, 2007, 2009; 2Years 2002-2013; 3Years 1999, 2009; aDummy variables; bIncluded imputed values, deflated to the basic year 2010; cIn years; dIn kilometers.

26
Table 2. Effects of Flexible Work Practices on Job Satisfaction (1) (2) (1) (2) (1) (2) Pooled Model FE Model Pooled Model FE Model Pooled Model FE Model
Variables b SE b SE b SE b SE b SE b SE Controls Age -.48 .08 *** -.03 .16 -.62 .09 *** -.26 .15 † -.38 .11 ** .13 .26 Age Squared .41 .08 *** -.11 .15 .56 .08 *** .24 .14 † .29 .11 ** -.25 .26 Stipulated Working Hoursa -.01 .01 .06 .02 ** -.02 .01 .04 .03 -.02 .02 .03 .05 Organizational Size -.02 .02 .04 .03 -.04 .02 † .05 .03 † .02 .03 .22 .09 * Tenure -.05 .01 *** -.25 .04 *** -.05 .01 *** -.27 .06 *** -.05 .02 ** -.13 .06 * Hourly Wagea, b, c .27 .02 *** .23 .04 *** .33 .03 *** .27 .05 *** .22 .03 *** .12 .14 Salaried Workers .08 .02 *** .02 .04 .04 .03 † -.04 .05 .06 .03 * .21 .14 Persons in Household .03 .01 ** -.01 .02 .02 .01 * .01 .02 .03 .01 * -.01 .04 Children under 16 .02 .02 .03 .03 .05 .03 † .01 .03 .03 .03 .01 .06 Commuting Distance -.03 .01 ** .01 .01 -.02 .01 * .01 .02 -.01 .01 .01 .03 Overtime -.05 .01 *** -.01 .01 -.04 .01 *** -.01 .01 -.06 .01 *** -.04 .04 Undertime .01 .01 .01 .01 .01 .01 -.01 .01 .01 .01 -.02 .01 Experiences Unemployment -.03 .01 ** .11 .07 -.02 .01 † .32 .09 ** -.03 .01 * .01 .08 Experiences Part Time .02 .01 -.01 .04 -.00 .01 -.01 .05 .04 .01 * .12 .11 Job Change .08 .03 ** .11 .03 *** .10 .03 ** .13 .04 *** .09 .04 * .20 .08 * Men -.01 .02 -.02 .02 .01 .03 Predictors Flexitime -.08 .02 *** .05 .03 † Sabbaticals .03 .02 † .08 .02 *** Working from Home .11 .03 ** .21 .11 * Number of Observations 21.428 21.428 19.198 19.198 7.126 7.126 Time Fixed Effects yes yes yes yes yes yes Control for Imputed Values yes yes yes yes yes yes Individual Fixed Effects no yes no yes no yes
Note. aData are trimmed at the 99% quantile, badjusted for inflation and logarithmized, cin Euros, Columns (1) are pooled OLS regressions, columns (2) are fixed-effects regressions; b = robust estimate; SE = robust standard error; FE = fixed effects; values in bold support hypothesized results. *** p <.001; ** p <.01; * p <.05; † p <.10

27
Table 3. Effects of Flexible Work Practices on Turnover Intention (1) (2) (1) (2) (1) (2)
Pooled Model FE Model Pooled Model FE Model Pooled Model FE Model Variables b SE b SE b SE b SE b SE b SE Controls Age .05 .07 -.07 .17 .12 .08 .01 .15 .04 .10 .22 .27 Age Squared -.29 .07 *** -.17 .15 -.38 .07 *** -.33 .13 * -.27 .10 ** -.36 .25 Stipulated Working Hoursa -.05 .01 *** -.11 .02 *** -.04 .01 ** -.07 .03 * -.04 .02 ** -.13 .05 * Organizational Size -.02 .02 .03 .03 -.01 .02 .04 .03 -.04 .02 † -.20 .10 * Tenure -.15 .01 *** .20 .05 *** -.16 .01 *** .25 .06 *** -.16 .01 *** .08 .07 Hourly Wagea, b, c -.13 .02 *** -.28 .04 *** -.10 .02 *** -.29 .05 *** -.16 .03 *** -.39 .16 * Salaried Workers .14 .02 *** -.01 .04 .18 .02 *** .08 .05 .17 .03 *** -.01 .13 Persons in Household -.01 .01 .01 .02 -.01 .01 .01 .01 -.02 .01 † .01 .04 Children under 16 -.12 .02 *** -.07 .03 * -.13 .02 *** -.05 .03 -.08 .03 * -.10 .07 Commuting Distance .05 .01 *** .03 .02 * .06 .01 *** .03 .02 † .05 .01 *** .09 .04 * Overtime .06 .01 *** -.01 .01 .05 .01 *** -.02 .01 .06 .01 *** .01 .04 Undertime .02 .01 * .01 .01 .02 .01 .01 .01 .02 .01 -.01 .01 Experiences Unemployment .04 .01 ** -.17 .08 * .03 .01 * -.19 .12 .04 .01 * -.06 .10 Experiences Part Time -.01 .01 -.01 .04 .01 .01 .01 .05 .01 .02 -.26 .10 * Job Change .26 .03 *** .06 .03 † .24 .03 *** .02 .04 .19 .05 *** .23 .11 * Men .13 .02 *** .15 .02 *** .14 .03 *** Predictors Flexitime .10 .02 *** -.04 .03 Sabbaticals -.06 .02 *** -.04 .02 † Working from Home .13 .03 *** -.28 .11 * Number of Observations 21.428 21.428 19.198 19.198 7.126 7.126 Time Fixed Effects yes yes yes yes yes yes Control for Imputed Values yes yes yes yes yes yes Individual Fixed Effects no yes no yes no yes
Note. aData are trimmed at the 99% quantile, badjusted for inflation and logarithmized, cin Euros, Columns (1) are pooled OLS regressions, columns (2) are fixed-effects regressions; b = robust estimate; SE = robust standard error; FE = fixed effects; values in bold support hypothesized results. *** p <.001; ** p <.01; * p <.05; † p <.10

28
Table 4. Effects of Flexible Work Practices on Leisure Satisfaction (1) (2) (1) (2) (1) (2) Pooled Model FE Model Pooled Model FE Model Pooled Model FE Model
Variables b SE b SE b SE b SE b SE b SE Controls Age -.36 .07 *** .01 .15 -.42 .08 *** -.15 .13 -.32 .10 ** -.19 .25 Age Squared .32 .07 *** .06 .13 .38 .08 *** .20 .12 † .29 .10 ** .35 .24 Stipulated Working Hoursa -.08 .01 *** -.12 .02 *** -.12 .01 *** -.13 .02 *** -.10 .02 *** -.05 .05 Organizational Size .01 .02 -.01 .03 -.01 .02 .03 .03 .05 .03 † -.00 .09 Tenure .03 .01 ** -.01 .03 .03 .01 † .03 .04 .03 .02 † -.07 .07 Hourly Wagea, b, c .12 .02 *** -.06 .04 .12 .03 *** -.01 .05 .05 .03 .15 .13 Salaried Workers -.03 .02 .09 .04 * .02 .03 .10 .05 * -.02 .03 .02 .14 Persons in Household -.01 .01 -.05 .01 *** -.02 .01 * -.06 .02 *** -.02 .01 -.05 .03 Children under 16 -.15 .02 *** -.03 .03 -.15 .03 *** -.02 .03 -.16 .03 *** -.07 .07 Commuting Distance -.07 .01 *** -.03 .12 * -.07 .01 *** -.02 .01 † -.07 .01 *** -.02 .04 Overtime -.16 .01 *** -.09 .01 *** -.16 .01 *** -.10 .01 *** -.17 .01 *** -.11 .04 ** Undertime .01 .01 .01 .01 † -.01 .01 .02 .01 † .01 .01 .02 .01 * Experiences Unemployment -.06 .01 *** -.04 .06 -.06 .01 *** .08 .09 -.04 .01 ** -.02 .09 Experiences Part Time .03 .01 ** .03 .04 .02 .01 .01 .05 .01 .02 -.07 .11 Job Change -.03 .02 -.05 .03 * -.02 .03 -.03 .03 -.03 .04 -.09 .08 Men .20 .02 *** .18 .03 *** .17 .03 *** Predictors Flexitime -.04 .02 .01 .03 Sabbaticals .07 .02 *** .06 .02 ** Working from Home .05 .03 -.01 .10 Number of Observations 21.428 21.428 19.198 19.198 7.126 7.126 Time Fixed Effects yes yes yes yes yes yes Control for Imputed Values yes yes yes yes yes yes Individual Fixed Effects no yes no yes no yes
Note. aData are trimmed at the 99% quantile, badjusted for inflation and logarithmized, cin Euros, Columns (1) are pooled OLS regressions, columns (2) are fixed-effects regressions; b = robust estimate; SE = robust standard error; FE = fixed effects; values in bold support hypothesized results. *** p <.001; ** p <.01; * p <.05; † p <.10

29
Table 5. Effects of Flexible Work Practices on Health (1) (2) (1) (2) (1) (2) Pooled Model FE Model Pooled Model FE Model Pooled Model FE Model
Variables b SE b SE b SE b SE b SE b SE Controls Age -.18 .04 *** -.06 .07 -.23 .04 *** -.08 .09 -.20 .05 *** .14 .12 Age Squared .06 .04 -.11 .07 .11 .04 ** -.10 .09 .08 .05 -.23 .12 † Stipulated Working Hoursa .01 .01 * .01 .01 .02 .01 ** .01 .01 .01 .01 † .02 .02 Organizational Size -.01 .01 -.00 .01 -.01 .01 .01 .01 -.01 .01 -.08 .04 † Tenure -.02 .01 ** -.01 .01 -.02 .01 ** .01 .02 -.02 .01 ** -.04 .03 Hourly Wagea, b, c .09 .01 *** .02 .02 .10 .01 *** .03 .02 .07 .02 *** .02 .06 Salaried Workers .07 .01 *** .01 .02 .06 .01 *** .01 .02 .05 .01 *** -.01 .06 Persons in Household .02 .01 ** -.01 .01 † .01 .01 * -.02 .01 ** .02 .01 ** -.01 .02 Children under 16 -.01 .01 -.00 .01 -.01 .01 -.01 .02 -.01 .02 .02 .03 Commuting Distance -.01 .01 ** -.00 .01 -.01 .01 * .01 .01 -.01 .01 * .01 .01 Overtime -.02 .01 *** -.01 .01 -.01 .01 * -.01 .01 -.02 .01 ** -.02 .02 Undertime -.00 .01 -.00 .02 .00 .01 -.01 .01 .01 .01 .01 .01 Experiences Unemployment -.02 .01 ** .03 .03 -.02 .01 ** -.02 .04 -.01 .01 † -.08 .04 * Experiences Part Time .01 .01 -.00 .02 .01 .01 -.01 .02 .01 .01 -.01 .05 Job Change .02 .01 † .04 .01 ** .02 .01 .04 .02 * .04 .02 * .07 .04 Men .02 .01 .02 .01 .04 .02 ** Predictors Flexitime -.04 .01 *** -.02 .01 Sabbaticals -.02 .01 † -.01 .01 Working from Home .03 .02 † .02 .05 Number of Observations 21.428 21.428 19.198 19.198 7.126 7.126 Time Fixed Effects yes yes yes yes yes yes Control for Imputed Values yes yes yes yes yes yes Individual Fixed Effects no yes no yes no yes
Note. aData are trimmed at the 99% quantile, badjusted for inflation and logarithmized, cin Euros, Columns (1) are pooled OLS regressions, columns (2) are fixed-effects regressions; b = robust estimate; SE = robust standard error; FE = fixed effects; values in bold support hypothesized results. *** p <.001; ** p <.01; * p < 05; † p <S.10