the effects of extinction on human performance …
TRANSCRIPT
APPROVED:
Jesus Rosales-Ruiz, Major ProfessorRichard Smith, Committee MemberSigrid Glenn, Committee MemberDavid Hartman, Dean of the School of Community ServiceC. Neal Tate, Dean of the Robert B. Toulouse School of
Graduate Studies
THE EFFECTS OF EXTINCTION ON HUMAN PERFORMANCE FOLLOWING
EXPOSURE TO FIXED RATIO SCHEDULES OF REINFORCEMENT
Richard L. Anderson, B.A.A.S.
Thesis Prepared for the Degree of
MASTER OF SCIENCE
UNIVERSITY OF NORTH TEXAS
May, 2000

Anderson, Richard L., The Effects of Extinction on Human Performance
Following Exposure to Fixed Ratio Schedules of Reinforcement. Master of Science
(Behavior Analysis), May 2000, 67 pp., 18 illustrations, references, 36 titles.
This experiment examined the effects of extinction on rate of responding and
several topographical and temporal measures in adult humans. Three college students
were trained to type the sequence 1•5•3 on a numeric keypad on a computer. The
subjects were exposed to different fixed-ratio schedules of reinforcement (FR1, FR 5, and
FR10 respectively) and extinction. Subjects displayed typical schedule performances
during the maintenance phase of the experiment. During extinction the performances
were disrupted, they showed a “break and run” pattern and a general decrease in
responding. Also, new topographical and temporal patterns emerged. These data are
consistent with those reported for non-human species and special human populations.

ii
Copyright 1999
by
Richard L. Anderson

iii
ACKNOWLEDGMENTS
I would like to extend my deepest gratitude to my mentor and major professor Dr.
Jesus Rosales-Ruiz for his assistance throughout the course of this experiment and my
graduate education. Furthermore, I would like to thank my committee of Drs. Sigrid
Glenn and Richard Smith for their patience and guidance. In addition, I would like to
acknowledge the contributions of Michael Flyger, Sean Dearman, Yuka Koremura,
Kristina Hensley, and Monica Meriage for their assistance in running this experiment.
Finally, I would like to thank Dr. Joel Greenspoon for his timely advice, wisdom, and the
enormous contribution he has made to my development as a behavior analyst and as a
scientist.

iv
TABLE OF CONTENTS
Page
ACKNOWLEDGMENTS............................................................................................... iii
LIST OF ILLUSTRATIONS .......................................................................................... vi
Chapter
1. INTRODUCTION......................................................................................... 1
2. METHOD...................................................................................................... 7
3. RESULTS...................................................................................................... 12
4. DISCUSSION ............................................................................................... 20
APPENDIX ..................................................................................................................... 26
REFERENCE LIST......................................................................................................... 63
v
LIST OF ILLUSTRATIONS
Figure Page
1. The keyboard used as the operandum in this experiment. The black square delineatesthe numeric keypad. .................................................................................................. 26
2. The subject was required to click the “start” button before beginning the session... 28
3. The subject saw a 3x3 grid on the computer monitor throughout the experiment. Thesquares on the grid corresponded with the keys 1-9 on the numeric keypad. .......... 30
4. When the subject met the schedule contingency, a button with a speaker icon wouldappear below the grid. ............................................................................................... 32
5. Changes in the grid as a result of the subject’s key pressing behavior. .................... 34
6. Changes in the grid resulting from the subject’s key pressing behavior (A) and thedelivery of a sound clip (B)....................................................................................... 36
7. Daily celerations for subjects AA-Sp98 (left), TW-Su98 (center), and GS-Sp98(right)......................................................................................................................... 38
8. Cumulative records for Subject AA-Sp98 during the last session FR-1 (top) and thefirst session of extinction (bottom)............................................................................ 40
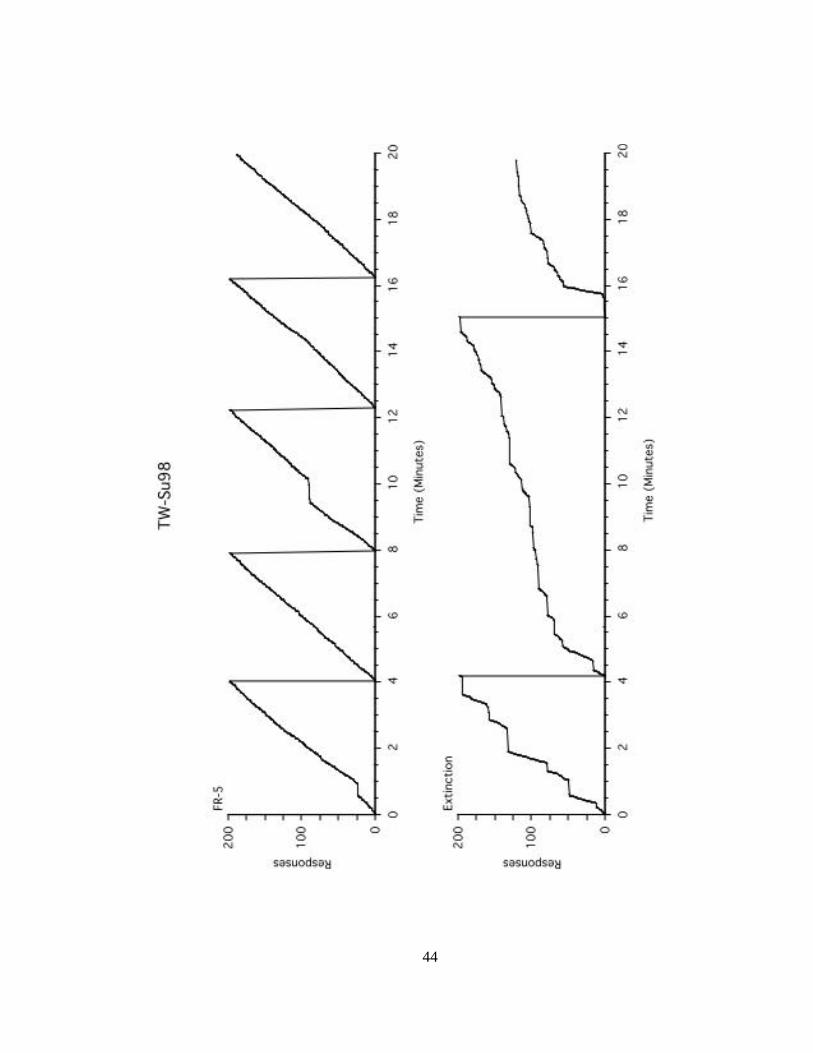
9. Cumulative records for Subject TW-Su98 during the last session of FR-5 and the firstsession of extinction. ................................................................................................. 42
10. Cumulative records for Subject GS-Sp98 during the last session of FR-10 and the firstsession of extinction .................................................................................................. 44
11. Response durations in seconds over time during the last session of schedulemaintenance and the first session of extinction for subjects AA-Sp98 (top), TW-Su98(center), and GS-Sp98 (bottom) ................................................................................ 46
12. Interresponse times (IRT) during the last session of schedule maintenance and thefirst session of extinction for subjects AA-Sp98 (top), TW-Su98 (center), and GS-Sp98 (bottom)............................................................................................................ 48
13. Interkeystroke times during the last session of schedule maintenance and the firstsession of extinction for subjects AA-Sp98 (top), TW-Su98 (center), and GS-Sp98

vi
(bottom)..................................................................................................................... 50
14. Keystrokes as they occur over time during the last session of schedule maintenanceand the first session of extinction for subjects AA-Sp98 (top), TW-Su98 (center), andGS-Sp98 (bottom) ..................................................................................................... 52
15. Pattern length in keystrokes over time during the last session of schedule maintenanceand the first session of extinction for subjects AA-Sp98 (top), TW-Su98 (center), andGS-Sp98 (bottom) ..................................................................................................... 54
16. Frequency of three key response patterns during acquisition, schedule maintenance,and extinction for subject AA-Sp98.......................................................................... 56
17. Frequency of three key response patterns during acquisition, schedule maintenance,and extinction for subject TW-Su98 ......................................................................... 58
18. Frequency of three key response patterns during acquisition, schedule maintenance,and extinction for subject GS-Sp98........................................................................... 60

1
CHAPTER 1
INTRODUCTION
Schedules of reinforcement have wide applicability for use in establishing
baseline measures in behavior analysis (e.g., Sidman, 1960; Zeiler, 1984; Baron, Perone,
& Galizio, 1991). This is in part due to the generality of performances generated across
species as diverse as rats (e.g., Skinner, 1938; Keller & Schoenfeld, 1950), pigeons
(Ferster & Skinner, 1957), goldfish (Wertheim & Singer, 1964), and monkeys (Verhave,
1959).
Humans, however, have been rather enigmatic in regard to performance under
schedules of reinforcement. It has been very difficult to produce characteristic schedule
performances with human subjects. For example, Weiner (1964) and Weiner (1969)
were unable to show characteristic fixed ratio and fixed interval schedule performances
with normal adults. Bentall, Lowe, and Beasty (1985) were unable to produce
characteristic performances with children older than 2-years. This has led the field to
believe that schedule effects in operant labs can be seen only in non-verbal subjects.
Apparently, adults’ verbal behavior interferes with schedule performance. However, this
issue is far from settled. Other experimenters point to differences in methodology that
may also account for the disparity of effects (e.g., Shull & Lawrence, 1998; Baron,
Perone, & Galizio, 1991).
Furthermore, when characteristic schedule performances have been obtained with
human subjects, these performances have been insensitive to changing contingencies.

2
That is, changing schedules or applying an extinction procedure has had little or no effect
on the subjects’ behavior. For example, Shimoff, Catania, and Mathews (1981) produced
high rates of behavior using random ratio schedules and then changed the contingency to
a DRL (differential reinforcement of low rates) schedule that arranges for the delivery of
consequences only for long interresponse times. However, they found that high rates of
behavior maintained during the DRL condition. Hayes, Brownstein, Zettle, Rosenfarb,
and Korn (1986a) used instructions to produce high and low rates of behavior and then
exposed the subjects to fixed ratio and DRL schedules. They found that performances
were more closely aligned to the instructions than the programmed contingency. Hayes,
Brownstein, Haas, and Greenway (1986b) replicated Hayes et. al. (1986a), but used
extinction in addition to changing schedule contingencies and found that very few
subjects showed behavior change when exposed to an extinction procedure. Shimoff ,
Catania , and Mathews (1981) consider insensitivity to changing contingencies to be “the
defining property of instructional control.” (p. 207)
The term “sensitivity” has been used extensively in the literature on schedule
control and rule governed behavior. Madden, Chase, and Joyce (1998) caution us that the
term “sensitivity” has been a confusing, variously defined concept in behavioral research.
They found two common uses of the term “sensitivity.” The first use of the term refers to
the comparison of behavior across species or organisms. Behavior is said to be
“insensitive” to schedule control when performances characteristic of a specific schedule
of reinforcement are not obtained when the subject is exposed to that schedule
contingency (e.g., Bentall, Lowe & Beasty, 1985; Bentall & Lowe, 1987). The second
use of the term refers to the comparison of behavior across changing conditions for a
3
single organism (e.g., Hayes, Brownstein, Haas & Greenway, 1986; Hayes, Brownstein,
Zettle, Rosenfarb, & Korn, 1986; Shimoff, Catania, & Mathews, 1981). Part of the
confusion over the term, “sensitivity,” stems from the fact that researchers point to
instructions and self-instructions occurring during the experiment to account for
insensitivity to schedule contingencies whether they are talking about across-species
behavior comparison (e.g., Weiner, 1964; Weiner, 1969; Weiner, 1970; Bentall, Lowe &
Beasty, 1985; Bentall & Lowe, 1987) or within-subject comparison of behavior across
changing conditions (e.g., Hayes, Brownstein, Haas & Greenway, 1986; Hayes,
Brownstein, Zettle, Rosenfarb, & Korn, 1986; Shimoff, Catania, & Mathews, 1981).
In spite of the confusion about the uses of sensitivity, there is agreement that
seeing changes in behavior correlated with changes in programmed contingencies is
necessary for determining whether human performances are under the control of schedule
contingencies or under the control rules or instructions. For example, Hayes and Ju
(1998) recommend the use of unannounced changes in schedule contingencies or the
deployment of an extinction procedure as a tactic for ensuring that human schedule
performance is under the control of programmed contingencies rather than rules or
instructions. If the performance changes with the contingency, then we can be confident
that the performance is sensitive to schedule control. In the present study, behavior will
be considered sensitive to changing contingencies when changes in the subject’s behavior
are correlated to changes in programmed contingencies. Also, “generality of results” (see
Sidman, 1960) will be used when examining the results of this study in the context of
other studies with other species.

4
There have been some exceptions showing that human subjects are sensitive to
changes in schedule contingencies. For example, Flyger and Rosales-Ruiz (1997) and
Rosales-Ruiz, Anderson, Hensley, and Koremura (1999) demonstrated sensitivity to
changing fixed ratio and fixed interval schedule contingencies with adult humans.
Additionally, the performances generated in these studies showed similar performances
to those generated by non-human subjects in the experimental literature. Their success
may be due to the fact that they attempted to create an analog environment to the operant
chamber used in non-human research that would include features not seen in previous
human operant research. The response was shaped rather than instructed and the chain of
events typically found in an operant chamber was replicated. Furthermore, sound clips
from television and cartoons were used as reinforcers that could be consumed
immediately rather than points or tokens, which are typically accumulated and used at a
later time. This experiment uses the apparatus developed by Flyger and Rosales-Ruiz
(1997).
There have also been a few cases in the study of schedules of reinforcement
where humans have been shown to be sensitive to extinction procedures (e.g., Hutchinson
& Azrin, 1961; Weissberg & Fink, 1966). The subjects in these studies, however, might
not be representative of normal adults due to a lack of verbal development. Also, in the
applied literature, extinction has been shown to be an effective technique to reduce
responding (see Lerman, Iwata, & Wallace, 1999). If performance under extinction is to
be used as a test for schedule control, as Hayes & Ju (1998) suggest, then we should see
changes in rate of response, changes in temporal measures, and changes in topography
similar to the ones found with non-humans.

5
One well-documented effect of extinction is the deceleration of rate over time
(e.g., Skinner, 1938; Ferster and Skinner, 1957; Keller & Schoenfeld, 1950; Weissberg &
Fink, 1966; Hutchinson & Azrin, 1961). This effect has been shown to be a function of
the ratio value of the fixed ratio schedule. Behavior exposed to higher fixed ratio
schedule values decelerates at a lower rate than behavior exposed to lower schedule
values. In other words, higher fixed ratio schedule values are more resistant to extinction
(e.g., Skinner, 1938; Keller & Schoenfeld, 1950).
If extinction effects are examined on a moment-to-moment basis, cumulative
records reveal a “break and run” pattern of responding during extinction in which periods
of high rate responding (“bursts” or “runs”) are intermixed with periods of no responding
(“breaks”). This effect has been demonstrated with pigeons (Ferster & Skinner, 1957),
rats (e.g., Skinner, 1938; Keller & Schoenfeld, 1950), human children (Weissberg &
Fink, 1966), and adult humans diagnosed with schizophrenia (Hutchinson & Azrin,
1961).
The effects can also be seen on the distribution of interresponse times (IRT) and
response durations during extinction. Blough (1963) found that pigeons displayed a
bimodal distribution of IRTs during fixed ratio schedules of reinforcement. During
extinction, the pigeons showed a transition from the bimodal IRT pattern seen with the
fixed ratio schedules to a variable, single modal pattern of responses. Millenson and
Hurwitz (1961) studied the distribution of IRTs in rats after exposure to a continuous
schedule of reinforcement and found patterns similar to Blough (1963). Another temporal
measure affected by extinction is response duration. Marguiles (1961) studied response
duration in rats during extinction after exposure to a continuous schedule of

6
reinforcement (FR-1) and found that response durations at the operant level were
variable, the response durations were tightly distributed during FR-1, and were variable
during extinction.
In addition to the effects on rate of responding and other temporal measures,
changes in topography as a result of extinction have been reported in the literature.
Eckerman and Lanson (1969) studied the effects of extinction on the location of keypecks
around a response key by pigeons after exposure to continuous schedules of
reinforcement. The pigeons produced very little variability when keypecks were being
reinforced. During extinction, the pigeons showed a great deal of deviation in keypeck
location. These data is consistent with the results achieved by Antonitis (1951) with rats.
Another common effect of extinction is the emergence of new behaviors. One
example of the emergence of new behaviors was provided by Azrin, Hutchinson & Hake
(1966). They trained pigeons (the experimental pigeons) under a continuous schedule of
reinforcement to peck a key for food with another bird (the target pigeon) present in the
chamber. While the reinforcement contingency was in place the experimental pigeons
only pecked the key and ate food. When exposed to extinction, the experimental pigeons
vigorously attacked the target pigeon in addition to pecking the key.
This experiment analyzes the effects of extinction on human behavior maintained
by a fixed ratio schedule of reinforcement. As can be seen, extinction affects the
behavior of non-humans in ways other than simply reducing behavior. Will the behavior
of adult humans be sensitive to an extinction procedure and can we expect to see similar
results as those seen in the literature with non-verbal subjects?

7
CHAPTER 2
METHOD
Subjects and Setting
One male and two female college students participated in this study. They
received $5.00 for each session they attended. The money was not contingent on the
subject’s performance. Sessions were conducted in the Department of Behavior Analysis
at the University of North Texas. Each session lasted 20 minutes.
Apparatus
The apparatus consisted of a Pentium (TM) computer, monitor, mouse, a
keyboard, and a set of audio headphones. Subjects sat in front of the monitor and had
access to the computer keyboard and mouse and wore the headphones. Through
instructions, the subject’s responses were restricted to the keys 1-9 on the numeric
keypad. The response topography targeted for this experiment was pressing the keys 1,
5, and 3 in that order (see Figure 1). Each occurrence of the 1•5•3 response sequence
produced a click sound. At the beginning of the session, a button with the word
“START” on it was presented on the screen (see Figure 2). A mouse-click on this button
produced a 3 x 3 grid of gray squares in the center of the screen. The 3 x 3 grid was a
square of approximately 8 cm with each of the individual squares being 2 cm. A border
enclosed the grid. Each square looked line a three-dimensional button, and was separated
from the others by .5 cm. When the experiment began, the squares always appeared
“popped out” and changed their appearance depending upon key-presses made by the

8
subject. Below the grid was a 5.5 cm square (see Figure 3). Under certain experimental
conditions, a button with a speaker icon would appear in this square accompanied by a
chiming sound (see Figure 4). When the subject pressed this button with the mouse, a
random sound clip from a bank of 214 sounds was played. The sounds had playing
lengths from .38 s to 6.639 s. The sounds were used as response consequences and
consisted of humorous quotes, cartoon-character sounds, or interesting special effects. At
the end of the session, a dialog box appeared to the subject with the words “Thank You.”
Experimental Procedures
The experiment consisted of three phases. The first phase was response
acquisition. The second phase of the experiment was fixed ratio schedule maintenance.
The final phase was extinction.
Response acquisition. After the subject was seated in front of the computer, the
experimenter said to the subject, “Press any of these nine keys,” while concurrently
pointing at the nine keys of the numerical keypad. Then the experimenter pointed to the
area on the screen below the 3 x 3 grid and said, “A button will occasionally appear here.
When it does, click it with the mouse.” At this point, the experimenter left the room.
All squares in the grid on the computer screen initially had a “popped-out”
appearance. Pressing any key in the middle column of the keypad (2, 5, or 8) or the right
column of the keypad (3, 6, or 9) produced no change in the grid, however, when the
subject pressed any key in the left column of the numeric keypad (1, 4, or 7), the
corresponding square on the grid changed to a “pressed-in” appearance. At this point,
any key the subject pressed in the middle column caused the corresponding grid square to
change to the “pressed-in” appearance. Any key pressed in the left or right columns of

9
the numeric keypad would not produce a change in the grid. After the subject presses a
key in the middle column, only a key pressed in the right column produced a change in
the grid. A key press on the left column of the keypad reset the grid and caused the
corresponding square in the left column of the grid to appear “pressed-in.” Figure 5
shows a sample sequence.
If the subject pressed a sequence of keys that resulted in the 1, the 5, and the 3
(1•5•3) grid squares to appear “pressed-in,” two events immediately happened. First, a
chime sound was played. Second, a button appeared below the 3 x 3 grid. When the
subject clicked this button, a random sound clip was played from the bank of 214 sounds.
Only the 1•5•3 sequence produced the button and sound clip. Figure 6 shows a response
sequence meeting the response requirement and the consequences that follow the
response.
Schedule maintenance. Three schedules of reinforcement, FR-1, FR-5, and FR-10
were used during schedule maintenance. The apparatus operated in the same fashion
during the schedule maintenance phase of the experiment except that consequences were
programmed to occur after 1, 5, or 10 target responses. Target responses not scheduled
for reinforcement produced a click sound. AA-Sp98 was exposed to an FR-1 schedule of
reinforcement and to extinction. TW-Su98 was exposed to FR-1 during acquisition, FR-5
during the schedule maintenance phase of the experiment and extinction. GS-Sp98 was
exposed to FR-1 during acquisition, FR-10 during schedule maintenance, and extinction.
Extinction. During the extinction phase, no scheduled consequences were
delivered. The grid still changed in accordance to the subject’s key presses and the target
response always produced the click.

10
Dependent Variables
The effects of extinction on behavior following schedules of reinforcement was
measured on frequency of responding, changes in frequency of responding (celeration),
response duration, interresponse time (IRT), interkeystroke time (IKT), response length
in keystrokes, emitted over time, and the frequency of response patterns.
Celeration. Celeration measures the amount of weekly change in the frequency of
behavior expressed as a factor which gives direction and slope. A multiplication sign (x)
is used if there is an upward trend in the data and a division sign (÷) is used if there is a
downward trend. Celerations were calculated by drawing a line that best fit the trend of
the data during the schedule maintenance and extinction phases of the experiment on a
Standard Behavior Chart (Oliva, 1981).
Frequency of responding. Cumulative records were used to analyze within
session moment to moment changes in frequency of responding. Frequency jumps were
calculated using the Standard Behavior Chart. A frequency jump is the vertical distance
between the celeration during schedule maintenance and the frequency of the first session
of extinction The frequency jump is calculated by dividing the highest frequency by the
lowest. Frequency jumps are expressed as a factor which gives the direction and the
magnitude of the jump. A multiplication sign (x) is used if the jump is to a higher
frequency and division sign (÷) is used if the jump is to a lower frequency (Lindsley &
Rosales-Ruiz, 1992).
Response Duration. Response duration was the amount of time measured from
the first keystroke of a new pattern to the last keystroke of that pattern.

11
Interresponse time. Interresponse time was the amount of time measured from the
last keystroke of a completed pattern to the next keystroke.
Interkeystroke time. Interkeystoke time was the amount of time between
individual keystrokes.
Keystrokes. Keystrokes were specified by their label on the keyboard.
Pattern. A pattern contained three parts. The first part of the pattern could consist
of any number of keystrokes on the middle or right columns of the numeric keypad
followed by a terminal keystroke on any of the keys in the left column. The second part
of the pattern consisted of any number of keystrokes in the left or right columns followed
by a terminal keystroke in the middle column. The third part could consist of any
number of keystrokes in the left of middle columns followed by a terminal keystroke in
the right column. This can be expressed as a regular expression with the pattern of
/[^147]*([147])[^258]*([258])[^369]*([369])/ (see Friedl, 1996 for a detailed explanation
of regular expressions).
Pattern length. The pattern length is the number of keystrokes that make up a
pattern.

12
CHAPTER 3
RESULTS
Figure 7 shows the rate of the target response (1•5•3) for subjects AA-Sp98, TW-
Su98, and GS-Sp98 during acquisition, schedule maintenance, and extinction. AA-Sp98
(left graph) acquired the target response during the first session. Her rate of responding
increased from 0.35 responses per minute (r/min) to 18.6 r/min in the second session and
stabilized to approximately 20 r/min during sessions 3 and 4. During extinction, her rate
of responding jumped down (÷2.3) and turned down (÷5).
TW-Su98 (middle graph) acquired the target response during the Session 2 and
responded at a rate of 11.6 r/min. During FR-5 schedule maintenance, he responded at
rates of 58.45, 66.2, 85.2, and 49.45 with a celeration of x1.0. His rate of responding
jumped down (÷3) and turned down (÷2.8) during extinction.
GS-Sp98 (right graph) acquired the target response during Session 2 and
responded at a rate of 11.25 r/min. During FR-10 schedule maintenance, she responded
at rates of 48.15, 59.35, and 64.05 r/min with a celeration of x1.4. Her rate of responding
jumped down (÷1.8) and turned down (÷1.6) during extinction.
Figure 8 shows cumulative records of the target response for AA-Sp98 during the
last session of FR-1 (top graph) and the first session of extinction (bottom graph). AA-
Sp98 responded at a steady rate of approximately 22 r/min with 4 breaks in responding
including a 45 s break at 4.75 minutes into the session, a 10 s break at 8 minutes, a 30 s
break at 12.5 minutes, and a 20 s break at 17.75 minutes. During the first session of

13
extinction, AA-Sp98 responded at a rate of approximately 12 r/min for 2 minutes
followed by 3 bursts of responding at a rate of between 75 and 100 r/min during the next
2 minutes. At minute 4, AA-Sp98 begins a 12.5 minute break in responding followed by
2 short bursts of responding at rates of 190 r/min and 90 r/min. At minute 16.5, AA-Sp98
stopped responding for approximately 2 minutes. AA-Sp98 ended the session with a 30 s
burst of responding at a rate of 100 r/min followed by a 45 second break in responding.
Figure 9 shows cumulative records of the target response for TW-Su98 during the
last session of FR-5 (top graph) and the first session of extinction (bottom graph). TW-
Su98 responded at a steady rate of approximately 50 r/min with two short breaks
occurring at 30 seconds and 9.5 minutes into the session during the last session of FR-5.
During the first 15 s of the first session of extinction, he responded at a rate of 50 r/min
followed by a brief pause. During the next four minutes, he responded 200 times with 6
bursts of high rate responding and five breaks in responding. During the next 12.5
minutes, his responding consisted of shorter bursts of responding and longer pauses with
an overall rate of 22 r/min. At minute 16, he responded at a high rate for approximately
45 seconds and ends the session with a period of responding at approximately 15 r/min.
Figure 10 shows cumulative records of the target response for GS-Sp98 during the
last session of FR-10 schedule maintenance and the first session of extinction. GS-Sp98
responds at a steady rate of approximately 64 r/min during the last session of schedule
maintenance with a 30 s break in responding occurring at 8.5 minutes. She responded
200 times during the first 7 minutes of the first session of extinction with 6 response
bursts and breaks of 15 s, 30 s, 1 min, 30 s, 1 min, and 1 min. She responded 500 times
over the course of the next 10 minutes with a 15 s break occurring at 9.5 minutes into the

14
session. This was followed by a three-minute break in responding and 1 minute of
sustained responding at approximately 100 r/min.
Figure 11 shows scatterplots of response durations of all left to right responses as
they occur in time during the last FR session and the first session of extinction for
subjects AA-Sp98 (top graph), TW-Su98 (middle graph), and GS-Sp98 (bottom graph).
AA-Sp98 displayed a bimodal pattern of response durations during the last session of FR-
1 with a mean of 0.36 s and a standard deviation of 0.21 s. The primary mode (lower
distribution) was 0.2 s and the secondary mode was 0.5 s. During the first session of
extinction, she displayed a highly variable, single modal distribution of response
durations with a standard deviation of 1.35 s and a mean of 0.65 s.
TW-Su98 displayed a single modal pattern of response durations during the last
session of schedule maintenance with a standard deviation of 0.51 s and a mean of 0.59 s.
The pattern consisted of either concentrated durations of approximately 0.5 s or dispersed
durations between 0.1 s and 2.5 s. During the first session of extinction, TW-Su98
displayed a single modal distribution of response durations with a standard deviation of
1.44 s and a mean of 90.09 s. Variability increased as the session progressed.
GS-Sp98 displayed a bimodal distribution of response patterns during the last
session of FR-10 with a standard deviation of 0.48 s and a mean of 0.51 s. The primary
mode was 0.3 s, and the secondary mode was 4 s. During the first session of extinction,
she displayed a variable, bimodal distribution of response durations with a standard
deviation of 2.48 s and a mean of 0.72 s. The primary mode was 0.4 s, and the secondary
mode was 3 s.

15
Figure 12 shows interresponse times (IRT) of all left to right responses as they
occur in time during the last session of schedule maintenance and the first session of
extinction for subjects AA-Sp98, TW-Su98, and GS-Sp98. AA-Sp98 displayed a single
modal distribution of IRTs during the last session of FR-1 with a standard deviation of
2.4 s and a mean of 2.22 s. During the first session of extinction, she displayed a highly
variable, single modal distribution of IRTs with a standard deviation of 30.46 s and a
mean of 0.41 s.
TW-Su98 displayed a highly variable, bimodal distribution of IRTs with a
standard deviation of 0.62 s and a mean of 0.58 s. The primary mode (lower distribution)
was 0.3 s and the secondary mode (upper distribution) was 2 s. He displayed a single
modal distribution of IRTs during the first session of extinction with a standard deviation
of 2.07 s and a mean of 0.73 s.
GS-Sp98 displayed a bimodal distribution of IRTs with a standard deviation of
1.02 s during the last session of FR-10. The primary mode (lower distribution) was 0.25
s and the secondary mode (upper distribution) was 3 s. During the first session of
extinction, she displayed a highly variable, single modal distribution of IRTs. The
standard deviation of the IRT distribution during the first session of extinction for GS-
Sp98 was 2.12 s, and the mean was 0.59 s.
Figure 13 shows the time between individual keystrokes (IKT) as they occur in
time for subjects AA-Sp98, TW-Su98, and GS-Sp98 for the last session of schedule
maintenance and the first session of extinction. AA-Sp98 displayed a variable, bimodal
distribution of IKTs during the last session of FR-1 with a standard deviation of 1.68 s
and a mean of 0.3 s. The primary mode (lower distribution) was 0.2 s and the secondary

16
mode (upper distribution) was 2.25 s. During the first session of extinction, she
displayed a highly variable, single modal distribution of IKTs with a standard deviation
of 16.66 s and a mean of 4.15 s.
During the last session of schedule maintenance, TW-Su98 displayed a bimodal
distribution of IKTs with a standard deviation 0.41 s and a mean of 0.3 s. The primary
mode (lower distribution) was 0.2 s and the secondary mode was 1.85 s. During the first
session of extinction, he displayed a variable, single modal distribution of IKTs with a
standard deviation of 0.91 s and a mean of 0.24 s.
GS-Sp98 displayed a bimodal distribution of IKTs with a standard deviation of
0.63 s and a mean of 0.29 s in the last session of FR-10 schedule maintenance. The
primary mode (lower distribution) was 0.25 s and the secondary mode (upper
distribution) was 2.5 s. During the first session of extinction, she displayed a single
modal distribution of IKTs with a standard deviation of 1.69 s and a mean of 0.37 s.
Figure 14 shows keystrokes as they occur in time for subjects AA-Sp98 (top
graph), TW-Su98 (middle graph), and GS-Sp98 (bottom graph). All subjects show very
little variability in keystroke distribution during the last session of schedule maintenance
with most responding consisting of 1, 3, and 5. TW-Su98 and GS-Sp98 showed a short
period of variability during the early part of the session. Additionally, TW-Su98 showed
a short period of variability at approximately 10 minutes into the session. During
extinction, AA-Sp98 showed variable responding on all keys (1-9) for the first 4 minutes
of the first session of extinction. All remaining keystrokes are either 1, 3, or 5. TW-
Su98 displayed variable responding on all keys throughout the first session of extinction
with concentrations on keys 1, 3, and 5 from minute 12.5 until minute19. He responded
17
almost exclusively on keys 1, 3, and 5 in the last minute of the session. GS-Sp98
responds exclusively on keys 1, 3, and 5 during the first 30 s of the first session of
extinction. She then responds on all keys until minute7 with breaks in responding at
minute 2 and again at minute 4. From minutes 7 to 16, GS-Sp98 shows very little
variability in response and a high density of keys 1, 3, and 5. Responding on all keys
resumed afterwards and continued for the last 4 minutes.
Figure 15 shows the length of all left to right patterns in keystrokes as they occur
in time for subjects AA-Sp98, TW-Su98, and GS-Sp98 during the last session of
schedule maintenance and the first session of extinction. During the last session of FR-1,
AA-Sp98 displayed a distribution of pattern lengths with a standard deviation of 0.22
keystrokes and a mean of 3.03 keystrokes per response. She displayed a variable
distribution of pattern lengths during the first session of extinction with a standard
deviation of 2.16 keystrokes and a mean of 3.91 keystrokes per response.
TW-Su98 shows a variable distribution of pattern lengths with a standard
deviation of 2.12 keystrokes and a mean of 3.98 keystrokes per response in the last
session of FR-5. During the first session of extinction, he displayed a distribution of
pattern lengths with a standard deviation of 14.7 keystrokes and a mean of 24.46
keystrokes per response.
GS-Sp98 displayed a distribution of pattern lengths with a standard deviation of
0.63 keystrokes and a mean of 3.13 responses per keystroke during the last session of FR-
10. During extinction, she displayed a distribution of pattern lengths with a standard
deviation of 1.95 keystrokes and a mean of 3.58 keystrokes per response.

18
Figure 16 is a frequency distribution of three-key response patterns emitted more
than once for AA-Sp98 during the acquisition session (top graph), the last session of FR-
1 schedule maintenance (middle graph), and the first session of extinction (bottom
graph). AA-Sp98 emitted 27 different three-key response patterns during acquisition.
The most frequent patterns were 1•5•3, 1•2•3, 4•5•6, 4•8•9 and 7•8•9. During the last
session of FR-1, she emitted responses in the 1•5•3 response pattern almost exclusively.
During the first session of extinction, she emitted 12 different three-key response patterns
with 1•5•3, 1•2•3, 4•5•6, and 7•8•9 being the most frequent.
Figure 17 is a frequency distribution of three-key response patterns emitted more
than once for TW-Su98 during the acquisition session (top graph), the last session of FR-
5 schedule maintenance (middle graph), and the first session of extinction (bottom
graph). TW-Su98 emitted 23 different three-key response patterns during the acquisition
session with 1•5•3 being the most frequent with 223 instances and all other response
patterns falling in the range of 2 to 8 instances. During the last session of FR-5, he
emitted nine different three-key response patterns. 1•5•3 was the most frequent response
pattern with 990 instances. All other response patterns occurred four or fewer times.
TW-Su98 emitted 15 different three-key response patterns in the first session of
extinction. 1•5•3 had the highest frequency with 326 instances. Four other response
patterns had a frequency of greater than 10 instances including 1•8•3, 4•5•6, 4•8•6, and
7•5•3.
Figure 18 is a frequency distribution of three-key response patterns emitted more
than once for GS-Sp98 during the acquisition session (top graph), the last session of FR-
10 schedule maintenance (middle graph), and the first session of extinction (bottom

19
graph). During the acquisition, she emitted 11 different three-key response patterns with
1•5•3 being the most frequent with 226 instances. GS-Sp98 emitted 1•2•3 seventeen
times, 4•5•6 sixteen times, and 7•8•9 sixteen times. During the last session of FR-10, she
emitted 7 different three-key response patterns. 1•5•3 had the greatest frequency with
1282 instances. All other response patterns emitted during the last session of FR-10
ranged in frequency from 2 to 3 instances. GS-Sp98 emitted 17 different three-key
response patterns with 1•5•3 being the most frequent with 754 instances during the first
session of extinction. Six response patterns had a frequency of greater than 10 instances
including 7•8•9 with 44 instances, 4•5•6 with 21 instances, and 1•2•3 with 17 instances.

20
CHAPTER 4
DISCUSSION
The results of this experiment closely resemble those reported by earlier
investigators studying extinction with a variety of non-human species (e.g., Skinner,
1938; Ferster & Skinner, 1957; Keller & Schoenfeld, 1950) and with 2-year-old children
(Weissberg & Fink, 1966) and adult mental patients diagnosed with schizophrenia
(Hutchinson & Azrin, 1961).
The cumulative records generated by the subjects in this experiment (normal
adults) are consistent with those reported previously for fixed ratio (FR) schedules of
reinforcement with non-humans. In the beginning of extinction, all subjects responded at
rates similar to the rate at which they responded during the previous FR schedule.
Subsequently, their performances consisted of periods of rapid responding (“bursts” or
“runs”) combined with increasingly long breaks in responding. The point at which each
subject made the transition from normal responding to the “break and run” pattern was
dependent on the FR value to which that subject was exposed prior to extinction. That is,
lower schedule values resulted in earlier transitions to the “break and run” pattern during
extinction. This phenomenon was well documented by Skinner (1938), Ferster and
Skinner (1957) and Keller and Schoenfeld (1950).
Another similarity in results was the systematic decrease in behavior during
extinction. The deceleration of behavior was related to the FR schedule value that the
subject was exposed to prior to extinction. Higher schedule values resulted in slower

21
decelerations of responding per week. In other words, higher FR schedule values were
more resistant to extinction (e.g., Skinner, 1938; Keller & Schoenfeld, 1957; Ferster &
Skinner, 1957).
Besides the similarities in the moment to moment changes of behavior within the
session and the change in behavior across days, changes in other temporal characteristics
were also replicated. Subjects in the experiment who were exposed to schedule values
higher than FR-1 displayed a bimodal distribution of interresponse times (IRT) during
schedule maintenance. The bimodal distribution persisted early in the first session of
extinction before becoming a variable, single modal distribution. AA-Sp98, who was
exposed to an FR-1 schedule of reinforcement during maintenance, produced a single
modal distribution of IRTs during schedule maintenance. During extinction, however,
she produced a distribution with the same characteristics for a short period of time and
then produced a variable single modal distribution much like the other subjects in the
experiment. The point at which the distribution changed was dependent on the schedule
of reinforcement: lower schedule values changing earlier than higher schedule values.
These data are consistent with those reported by Blough (1963) in his work with pigeons
and Millenson and Hurwitz (1961) with rats.
Similarly, all subjects in this experiment displayed a bimodal pattern of response
durations during the maintenance phase of the experiment and the beginning of the first
session of extinction. As the extinction session progressed, the distribution of response
durations became single modal and dispersed. The point at which the distribution
changed was dependent on the schedule of reinforcement to which the subject was
exposed. Subjects exposed to lower schedule values displayed a change in the

22
distribution at an earlier point in extinction. These results are consistent with the results
reported by Marguiles (1961) in his work with rats.
As in response duration, an analysis of the time between individual keystrokes
(IKT) reveals a bimodal pattern for all subjects during the maintenance phase of the
experiment and the early part of the first session of extinction. The point at which the
IKT distribution was disrupted follows the pattern of other measures presented in this
study and is dependent on the schedule under which the subject’s behavior had been
reinforced.
In addition to temporal variability of responding, there was topographical
variability of old responses and the appearance of new topographies during extinction.
During the maintenance phase of the experiment, all subjects pressed the 1•5•3 keystroke
pattern with very little variation in the composition of the pattern or the length of the
pattern. Like other measures reported in this study, this persisted for a period of time
during extinction and then became disrupted. The point of disruption was dependent
upon the schedule of reinforcement. Subjects exposed to lower schedule values showed
topographical variability earlier in the session than subjects exposed to higher schedule
values. These data are consistent with those presented by Eckerman and Lanson (1969)
and Antonitis (1951).
Although extinction is a widely used procedure to decrease the frequency of
behavior (e.g., Lerman, Iwata & Wallace, 1999), very little research has been published
analyzing the effects of extinction on normal human subjects or the relationship between
schedules of reinforcement and the effects of extinction. Nonetheless, the applied
literature shows general agreement with respect to the effects of extinction on the overall

23
rate of responding and particular side effects of extinction such as topographical
variability. Interestingly, Lerman, Iwata, and Wallace (1999) and Lerman and Iwata
(1995) found a very low prevalence of extinction bursts. This finding may be due to their
definition of an extinction burst as “an increase in responding during any of the first three
treatment sessions above that observed during all of the last five baseline sessions or all
of baseline if it was briefer than five sessions” (Lerman & Iwata, 1995, p. 93). The data
presented in this experiment suggest that a moment-to-moment analysis of the effects of
extinction may reveal information about these phenomena that is not apparent from a
more macroscopic level (see also Vollmer, Iwata, Zarcone, Smith & Mazaleski, 1993).
Basic research on extinction effects on schedule performances of normal, adult
humans is practically absent. This is perhaps due to the fact that researchers have not
generally produced characteristic schedule control over these subjects’ performances
(e.g., Weiner, 1969; Bentall, Lowe & Beasty, 1985; Bentall & Lowe, 1987). In this
experiment, fixed ratio schedule performances closely resembled the performances of
non-human species such as those reported by Ferster and Skinner (1957) and those
reported by Flyger and Rosales-Ruiz (1997) and Rosales-Ruiz, Anderson, Hensley, and
Koremura (1999) with normal human adults. However, Hayes and Ju (1998) assert that
typical schedule performances by human subjects are insufficient to rule out the
possibility of the performances being under the control of instructions. Sensitivity to
changing contingencies or extinction is necessary to demonstrate that schedule
performances are under the control of the programmed contingencies. Flyger and
Rosales (1997) and Rosales-Ruiz, Anderson, Koremura and Hensley (1999) have shown
sensitivity to changing schedule contingencies with FR and FI schedules. This

24
experiment extends those results to sensitivity to extinction. If the extinction
performances are to be used as an indicator of sensitivity to schedules of reinforcement as
Hayes and Ju suggest, then the current outcomes indicate that the behavior of the subjects
in this experiment were clearly under control of the programmed contingencies. These
data, as well as those reported by Flyger and Rosales-Ruiz (1997) and Rosales-Ruiz,
Anderson, Koremura, and Hensley (1999) should restore confidence that schedule control
and extinction can be replicated in the human operant laboratory. Perhaps these data will
encourage a reexamination of the relative roles of rules or instructions and schedules of
reinforcement in the human operant laboratory.
The failure of earlier investigators to produce characteristic performances under
schedules of reinforcement has led to questions regarding the generality of behavioral
processes seen with non-human species to human behavior and the value of this research
to the study of human behavior (Baron, Perone, & Galizio, 1991). The implications of
this conclusion are significant. If we cannot utilize the enormous volume of data
generated in the operant laboratory with non-humans to guide our understanding of
behavior with normal human beings, then we are left with a very tenuous basis for
applied technology and the generality of basic principles derived from experiments with
non-human animals is questionable. Baron, Perone, and Galizio (1991) identified
procedural differences between human and non-human research as being one possible
explanation for the researchers have has in replicating non-human studies in the operant
lab with normal, adult humans. The method used in this study addresses this question by
attempting to create an analog environment to the operant chamber used in the non-
human literature. The results of this study along with those of Flyger and Rosales-Ruiz

25
(1997) and Rosales-Ruiz et. al. (1999) suggest that the behavioral principles documented
so extensively in the animal literature generalize to normal, adult humans. The results of
these studies suggest that schedules of reinforcement can be used as a baseline for
studying phenomena such as rule governed behavior or verbal behavior.
The apparatus and methodology used in this study hold promise for studying basic
behavioral processes in the human operant laboratory. The next logical step in this line
of research is to examine the effects of extinction after exposure to other schedules
arrangements such as fixed interval schedules and variable ratio and interval schedules.
Additionally, the apparatus and methodology used in this study can be expanded to
include discriminative stimuli, allowing multiple schedule arrangements, and possibly,
the study of stimulus control along with schedules of reinforcement and extinction.

26
APPENDIX
ILLUSTRATIONS

27
Figure 1. Keyboard used as the operandum in this experiment. The black square
delineates the numeric keypad.

28

29
Figure 2. The subject was required to click the “start” button with the mouse before
beginning the session.

30
31
Figure 3. The subject saw a 3x3 grid on the computer monitor throughout the
experiment. The squares on the grid corresponded with the keys 1-9 on the numeric
keypad.

32

33
Figure 4. When the subject met the schedule contingency, a button with a speaker icon
would appear below the grid.

34

35
Figure 5. Changes in the grid as a result of the subject’s key pressing behavior.

36

37
Figure 6. Changes in the grid from resulting from the subject’s key pressing behavior
(A) and the delivery of sound clip (B).

38

39
Figure 7. Daily celerations for subjects AA-Sp98 (FR-1), TW-Su98 (FR-5), and GS-
Sp98 (FR-10).

40

41
Figure 8. Cumulative records for AA-Sp98 during the last session of FR-1 (top) and the
first session of extinction (bottom).

42

43
Figure 9. Cumulative records for TW-Su98 during the last session of FR-5 (top) and the
first session of extinction (bottom).
44

45
Figure 10. Cumulative records for GS-Sp98 during the last session of FR-10 (top) and the
first session of extinction (bottom).

46

47
Figure 11. Response durations in seconds over time during the last session of schedule
maintenance and the first session of extinction for subjects AA-Sp98 (top), TW-Su98
(center), and GS-Sp98 (bottom).

48

49
Figure 12. Interresponse times (IRT) in seconds over time during the last session of
schedule maintenance and the first session of extinction for subjects AA-Sp98 (top), TW-
Su98 (center), and GS-Sp98 (bottom).

50

51
Figure 13. Interkeystroke times (IKT) in seconds over time during the last session of
schedule maintenance and the first session of extinction for subjects AA-Sp98 (top), TW-
Su98 (center), and GS-Sp98 (bottom).

52

53
Figure 14. Keystrokes as they over time during the last session of schedule maintenance
and the first session of extinction for subjects AA-Sp98 (top), TW-Su98 (center), and
GS-Sp98 (bottom).

54

55
Figure 15. Pattern length in keystrokes over time during the last session of schedule
maintenance and the first session of extinction for subjects AA-Sp98 (top), TW-Su98
(center), and GS-Sp98 (bottom).

56

57
Figure 16. Frequency of three key response patterns during acquistion, schedule
maintenance, and extinction for subject AA-Sp98.

58

59
Figure 17. Frequency of three key response patterns during acquistion, schedule
maintenance, and extinction for subject TW-Su98.

60

61
Figure 18. Frequency of three key response patterns during acquistion, schedule
maintenance, and extinction for subject GS-Sp98.

62

63
REFERENCES
Antonitis, J. J. (1951). Response variability in the white rat during conditioning,
extinction, and reconditioning. Journal of Experimental Psychology, 42, 273-281.
Azrin, N. H., Hutchinson, R. R., & Hake, D. F. (1966). Extinction-induced
aggression. Journal of the Experimental Analysis of Behavior, 9, 191-204.
Baron, A., Perone, M., & Galizio, M. (1991). Analyzing the reinforcement
process at the human level: Can application and behavioristic interpretation replace
laboratory research? The Behavior Analyst, 14, 95-105.
Bentall, R. P., Lowe, C. F., & Beasty, A. (1985). The role of verbal behavior in
human learning: II. Developmental differences. Journal of the Experimental Analysis of
Behavior, 43, 165-181.
Bentall, R. P., & Lowe, C. F. (1987). The role of verbal behavior in human
learning: III. Instructional effects in children. Journal of the Experimental Analysis of
Behavior, 47, 177-190.
Blough, D. S. (1963). Interresponse time as a function of continuous variables: A
new method and some data. Journal of the Experimental Analysis of Behavior, 6, 237-
246.
Eckerman, D. A., & Lanson, R. N. (1969). Variability of response location for
pigeons responding under continuous reinforcement, intermittent reinforcement, and
extinction. Journal of the Experimental Analysis of Behavior, 12, 73-80.

64
Ferster, C. B., & Skinner, B. F. (1957). Schedules of reinforcement. New York:
Appleton-Century-Croft.
Friedl, J. E. (1996). Mastering regular expressions: Powerful techniques for perl
and other tools. Sebastopol, CA: O’Reilly & Associates.
Flyger, M. & Rosales-Ruiz, J. (1997, May). Human schedule performance: In
spite of talking. Poster session presented at the annual convention of the Association for
Behavioral Analysis, Chicago, IL.
Galizio, M. (1979). Contingency-shaped and rule-governed behavior:
Instructional control of human loss avoidance. Journal of the Experimental Analysis of
Behavior, 31, 53-70.
Hayes, S. C., Brownstein, A. J., Zettle, R. D., Rosenfarb, I., & Korn, Z. (1986a).
Rule-governed behavior and sensitivity to changing consequences of responding. Journal
of the Experimental Analysis of Behavior, 45, 237-256.
Hayes, S. C., Brownstein, A. J., Haas, J. R., & Greenway, D. E. (1986b).
Instructions, multiple schedules, and extinction: Distinguishing rule-governed from
schedule-controlled behavior. Journal of the Experimental Analysis of Behavior, 46, 137-
147.
Hayes, S. C. & Ju, W. (1998). The applied implications of rule governed
behavior. In O’Donohue, W. (Ed.), Learning and Behavior Therapy (pp. 374-391).
Boston, MA: Allyn & Bacon.
Hutchinson, R. R., & Azrin, N. H. (1961). Conditioning of mental-hospital
patients to fixed-ratio schedules of reinforcement. Journal of the Experimental Analysis
of Behavior, 4, 87-95.

65
Keller, F. S., & Schoenfeld, W. N. (1950). Principles of Psychology. Acton,
MA: Copley Publishing Group.
Lerman, D. C., & Iwata, B. A. (1995). Prevalence of the extinction burst and its
attenuation during treatment. Journal of Applied Behavior Analysis, 28, 93-94.
Lerman, D.C., Iwata, B.A., & Wallace, M.D.(1999). Side effects of extinction:
Prevalence of bursting and aggression during the treatment of self-injurious behavior.
Journal of Applied Behavior Analysis, 32, 1-8.
Lindsely, O. R., & Rosales-Ruiz, J. (1992). Meta-charting of overcorrection
literature. (Available from Precision Media, P.O. Box 3222, Kansas City, KS, 66103)
Madden, G. J., Chase, P. N., & Joyce, J. H. (1998). Making sense of sensitivity in
the human operant literature. The Behavior Analyst, 21. 1-12.
Margulies, S. (1961). Response duration in operant level, regular reinforcement,
and extinction. Journal of the Experimental Analysis of Behavior, 4, 317-321.
Millenson, J. R., & Hurwitz, H. M. B. (1961). Some temporal and sequential
properties of behavior during conditioning and extinction. Journal of the Experimental
Analysis of Behavior, 4, 97-106.
Olivia, C. M. (1981). A comparsion of the accuracies of five future projection
method. Unpublished doctoral dissertation, University of Kansas, Lawrence.
Rosales-Ruiz, J., Anderson, R.L., Hensley, K., & Koremura, Y. (1999, May).
Conditioning and maintenance of schedule performances in humans. In J. Marr (Chair),
The successful control of human behavior by schedules of reinforcement. Symposium
conducted at the meeting of the 25th annual meeting of the Association for Behavior
Analysis, Chicago, IL.

66
Shimoff, E., Catania, A. C., & Matthews, B. A. (1981). Uninstructed human
responding: Sensitivity of low-rate performance to schedule contingencies. Journal of the
Experimental Analysis of Behavior, 36, 207-220.
Shull, R. L., & Lawrence, P. S., (1998). Reinforcement: Schedule Performance.
In K. A. Lattal & M. Perone (Eds.), Handbook of research methods in human operant
behavior (pp. 95-129). New York: Plenum Press.
Sidman, M. (1960). Tactics of scientific research. Boston, MA: Authors
Cooperative, Inc.
Skinner, B. F. (1938). The behavior of organisms. Acton, MA: Copley
Publishing Group.
Verhave, T. (1959). The effect of secobarbital on a multiple schedule in the
monkey. Journal of the Experimental Analysis of Behavior, 2, 117-120.
Vollmer, T. R., Iwata, B. A., Zarcone, J. R., Smith, R. G., & Mazaleski, J. L.
(1993). Within-session patterns of self-injury as indicators of behavioral function.
Research in Developmental Disabilities, 14. 479-492.
Weiner, H. (1964). Conditioning history and human fixed-interval performance.
Journal of the Experimental Analysis of Behavior, 7, 383-385.
Weiner, H. (1969). Controlling human fixed-interval performance. Journal of the
Experimental Analysis of Behavior, 12, 349-373.
Weiner, H. (1970). Instructional control of human operant responding during
extinction following fixed-ratio conditioning. Journal of the Experimental Analysis of
Behavior, 13, 391-394.

67
Weissberg, P., & Fink, E. (1966). Fixed ratio and extinction performance of
infants in the second year of life. Journal of the Experimental Analysis of Behavior, 9,
105-109.
Wertheim, G. A., & Singer, R. D. (1964). Resistance to extinction in the goldfish
following schedules of continuous and variable interval reinforcement. Journal of the
Experimental Analysis of Behavior, 7, 357-360.
Zeiler, M. D. (1984). The sleeping giant: Reinforcement schedules. Journal of the
Experimental Analysis of Behavior, 42, 485-493.