the effectiveness of using pictures on
TRANSCRIPT

THE EFFECTIVENESS OF USING PICTURES ONSTUDENTS’ WRITING OF RECOUNT TEXT
(A Quasi-Experimental Study at the Tenth Grade Students of SMANegeri 9 Kota Tangerang Selatan)
By:
ROSYA KURNIATI
1111014000007
THE DEPARTMENT OF ENGLISH EDUCATION
FACULTY OF TARBIYA AND TEACHERS TRAINING
SYARIF HIDAYATULLAH STATE ISLAMIC UNIVERSITY
JAKARTA
2015


iv
ABSTRACT
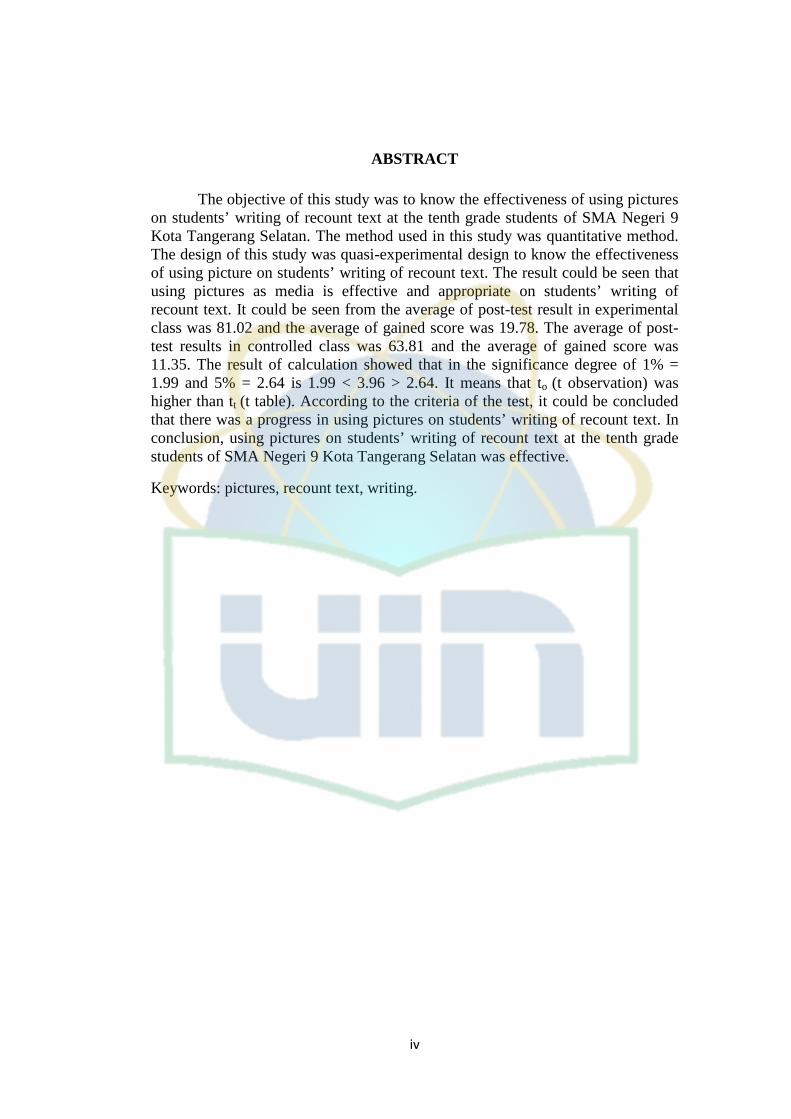
The objective of this study was to know the effectiveness of using pictureson students’ writing of recount text at the tenth grade students of SMA Negeri 9Kota Tangerang Selatan. The method used in this study was quantitative method.The design of this study was quasi-experimental design to know the effectivenessof using picture on students’ writing of recount text. The result could be seen thatusing pictures as media is effective and appropriate on students’ writing ofrecount text. It could be seen from the average of post-test result in experimentalclass was 81.02 and the average of gained score was 19.78. The average of post-test results in controlled class was 63.81 and the average of gained score was11.35. The result of calculation showed that in the significance degree of 1% =1.99 and 5% = 2.64 is 1.99 < 3.96 > 2.64. It means that to (t observation) washigher than tt (t table). According to the criteria of the test, it could be concludedthat there was a progress in using pictures on students’ writing of recount text. Inconclusion, using pictures on students’ writing of recount text at the tenth gradestudents of SMA Negeri 9 Kota Tangerang Selatan was effective.
Keywords: pictures, recount text, writing.

v
ABSTRAK
Tujuan penelitian ini adalah untuk mengetahui keefektifan penggunaangambar dalam tulisan recount text siswa di kelas X siswa SMA Negeri 9 KotaTangerang Selatan. Metode yang digunakan dalam penelitian ini adalah metodekuantitatif. Rancangan penelitian ini adalah quasi-experimental untuk mengetahuikeefektifan penggunaan gambar dalam tulisan recount text siswa. Hasilnya dapatdilihat bahwa penggunaan gambar sebagai media cocok dan efektif dalam tulisanrecount text siswa. Ini dapat terlihat dari rata-rata hasil post test di kelaseksperimen yaitu 81.02 dan rata-rata nilai rentangnya yaitu 19.78. rata-rata hasilpost test di kelas kontrol yaitu 63.81 dan rata-rata nilai rentangnya yaitu 11.35.Hasil penghitungan menunjukkan bahwa dalam derajat signifikansi 1% = 1.99 dan5% = 2.64 adalah 1.99 < 3.96 > 2.64. Ini berarti bahwa to (t observasi) lebih tinggidisbanding tt (t table). Berdasarkan kriteria pengujian, dapat disimpulkan bahwaada kemajuan dalam penggunaan gambar pada tulisan recount text siswa.Kesimpulannya, penggunaan gambar dalam tulisan recount text siswa di kelas Xsiswa SMA Negeri 9 Kota Tangerang Selatan adalah efektif.
Kata kunci: gambar, recount text, tulisan.

vi
ACKNOWLEDGEMENT
In the name of Allah, The Beneficent, The Merciful
All praise be to Allah, The Lord of the worlds, Who give the writer His
mercy in completing this research. Peace and blessing be upon our Prophet
Muhammad SAW, his families, his companion and his followers.
This research can also not be completed without a great deal of help,
guidance, correction and suggestion from Mrs. Dr. Farida Hamid, M.Pd. and Mrs.
Yenny Rahmawati, M.Ed. as the writer’s advisors.
The deepest thank also goes to those who have helped the writer in
finishing her research with their love, support and prayers, they are:
1. Prof. Dr. Ahmad Thib Raya, M.A., the Dean of Faculty of Tarbiya and
Teachers’ Training of Syarif Hidayatullah State Islamic University
Jakarta.
2. Dr. Alek, M.Pd., the Head of The Department of English Education.
3. Zaharil Anasy, M.Hum., as the secretary of The Department of English
Eduaction.
4. Sunardi (Alm.) and Surani as the writer’s parents and Romi Asriani,
S.E., as her sister who always be her spirit to make them proud and
happy.
5. The headmaster, the teachers, the staffs and the students of SMA
Negeri 9 Kota Tangerang Selatan.
6. The writer’s long-life best friends: Afifatul, A.Md Kep., Bripda Bisma,
Indah Yuni, Kartika Wulan, Kemas, S.T. and Bripda Windra, who
always cheer me both in my happiness and sadness. Thanks for all
crazy moments.
7. The writer’s high school-friends, Ita Rosita, A.Md, Gita, S.Sos.,
Eviyanti, S.S., Hendrianto, S.Si., Halfy Safitri, Syarafina, Pratiwi and
Tonny. You are great.

vii
8. All members of EED class A, especially Miryanti, Rismalia, S.Pd.,
Utul, Eka, Fawzia and Nurul. Thanks for all great moments and
togetherness.
9. To any other persons whose name cannot be mentioned one by one for
their contribution to the writer during finishing her research.
Hopefully, this research can be useful to the readers, particularly to the
writer. Also, the writer realized that this research is far from being perfect. It is a
pleasure for her to receive constructive critics and suggestion from anyone who
read her research for valuable improvement.
Jakarta,
The Writer
ROSYA KURNIATI
NIM. 1111014000007

viii
TABLE OF CONTENTS
APPROVAL ................................................................................................ i
ENDORSEMENT SHEET ......................................................................... ii
SURAT PERNYATAAN KARYA SENDIRI ............................................... iii
ABSTARCT................................................................................................. iv
ABSTRAK..................................................................................................... v
ACKNOWLEDGEMENT.......................................................................... vi
TABLE OF CONTENTS............................................................................ viii
LIST OF TABLES ...................................................................................... xi
LIST OF APPENDICES ............................................................................ xiii
CHAPTER I INTRODUCTION .............................................................. 1
A. The Background of the Study ........................................... 1
B. Identification of Problem.................................................. 3
C. Limitation of the Study..................................................... 4
D. Formulation of the Study .................................................. 4
E. Purpose of the Study......................................................... 4
F. Significance of the Study .................................................. 4
CHAPTER II THEORETICAL FRAMEWORK ................................... 5
A. Writing.............................................................................. 5
1. The Definition of Writing ................................................ 5
2. Stages of Writing.............................................................. 6
3. Purposes of Writing ......................................................... 11
B. Recount Text..................................................................... 12
1. Definition of Recount Text ............................................... 12
2. Purpose of Recount Text .................................................. 12

ix
3. The Generic Structure of Recount Text............................ 12
4. Sample of Recount Text ................................................... 13
5. Kinds of Recount Text ..................................................... 14
C. Picture .............................................................................. 14
1. Definition of Picture ......................................................... 14
2. Types of Picture ................................................................ 15
3. The Advantages of Picture................................................ 16
D. Teaching Writing by Using Picture .................................. 17
1. Picture Sets for Writing .................................................... 17
2. Picture for Whole-class Discussion of Writing ................ 18
3. One Picture – Many Different Techniques for Writing.... 18
4. One Picture – A Sequence of Tasks for Writing .............. 19
5. Teaching Writing by Using Picture Procedures ............... 21
E. Previous Study ................................................................. 22
F. Thinking Framework ....................................................... 24
G. Research Hypothesis ........................................................ 24
CHAPTER III RESEARCH METHODOLOGY .................................. 25
A. Place and Time ................................................................. 25
B. Research Design ............................................................... 25
C. Population and Sample .................................................... 26
D. Research Instrument ......................................................... 26
E. Technique of Data Collection ........................................... 26
F. Technique of Data Analysis ............................................. 27
G. Statistical Hypothesis........................................................ 29
CHAPTER IV FINDING AND DISCUSSION ....................................... 30
A. Data Description ............................................................... 30
1. The Data of Experimental Class (X MIPA 1) .................. 30
2. The Data of Controlled Class (X MIPA 5) ....................... 32
B. Analysis of Data and Hypothesis Testing......................... 33

x
1. Results of Pre-test of Experimental and Controlled Class
.......................................................................................... 33
2. Results of Post-test of Experimental and Controlled Class
.......................................................................................... 38
3. Normality Test .................................................................. 42
4. Homogeneity Test............................................................. 43
5. Hypothesis Testing ........................................................... 43
C. Interpretation of the Result ............................................... 47
CHAPTER V CONCLUSION AND SUGGESTION .............................. 49
A. Conclusion ................................................................... 49
B. Suggestion .................................................................... 49
REFERENCES ........................................................................................... 51
APPENDICES ............................................................................................. 53

xi
LIST OF TABLES
Table 4.1 : Pre-test and Post Test of Experimental Class ................... 30
Table 4.2 : Pre-test and Post Text of Controlled Class ....................... 32
Table 4.3 : Table of Data Description of Pre-test Result of Experimental
Class .................................................................................. 34
Table 4.4 : Table of Frequency Distribution of Pre-test Result of
Experimental Class ............................................................ 35
Table 4.5 : Table of Data Description of Pre-test Result of Controlled Class
............................................................................................ 36
Table 4.6 : Table of Frequency Distribution of Pre-test Result of Controlled
Class .................................................................................. 37
Table 4.7 : Table of Data Description of Post Test Result of Experimental
Class .................................................................................. 38
Table 4.8 : Table of Frequency Distribution of Post Test Result of
Experimental Class ............................................................ 39
Table 4.9 : Table of Data Description of Post Test Result of Controlled Class
............................................................................................ 40
Table 4.10 : Table of Frequency Distribution of Post Test Result of
Controlled Class ................................................................ 41
Table 4.11 : Normality Pre-test Results between Experimental and Controlled
Class .................................................................................. 42
Table 4.12 : Normality Post Test Results between Experimental and
Controlled Class ................................................................ 42
Table 4.13 : Homogeneity Pre-test Result between Experimental and..
Controlled Class ................................................................ 43
Table 4.14 : Homogeneity Post Test Result between Experimental and
Controlled Class ................................................................ 43
Table 4.15 : The Comparison of Gained Score between Students in
Experimental Class and Students in Controlled Class ...... 44

xiii
LIST OF APPENDICES
Appendix 1 : Scoring Table of Writing ................................................... 53
Appendix 2 : Timeline Research .............................................................. 57
Appendix 3 : Syllabus............................................................................... 61
Appendix 4 : Lesson Planning (RPP) ...................................................... 74
Appendix 5 : Students’ Writings with the Picture ................................... 87
Appendix 6 : Research Documentation (photos) ..................................... 93
Appendix 7 : Lembar Uji Referensi ......................................................... 94
Appendix 8 : Surat Pengesahan Proposal ............................................... 107
Appendix 9 : Surat Bimbingan Skripsi .................................................... 108
Appendix 10 : Surat Pernyataan Jurusan ................................................. 109
Appendix 11 : Surat Permohonan Izin Penelitian ..................................... 110

1
CHAPTER I
INTRODUCTION
A. The Background of the Study
Language as “a tool” to communicate cannot be separated in our lives has
been taught since we were children, moreover since we were a baby – language
was heard to us. What is a language? The meaning of language depends on where
it occurs within a larger stretch of discourse.1 Language also has function, which
is to achieve a purpose when you say or write something.2 Today, language which
is an international language – it is spoken by people around the world, is English.
English is used in almost every part of the world is important to learn, so many
countries offer English as their lesson in schools to be learned by their students, whether
in elementary schools, secondary schools or even kindergarten. In Indonesia, English is
an obligatory subject in junior and senior high schools. It also becomes one of subjects
tested in National Examination (Ujian Nasional). As in Peraturan Pemerintah Republik
Indonesia Nomor 19 Tahun 2005 pasal 70 ayat 3, ayat 5 dan ayat 7 “Pada jenjang
SMA/MA/SMALB, atau bentuk lain yang sederajat, Ujian Nasional mencakup pelajaran
Bahasa Indonesia, Bahasa Inggris, Matematika dan mata pelajaran yang menjadi ciri
khas program pendidikan” (verse 5). Therefore, all of students need and learn English to
achieve academic purposes. One of the academic purposes is to understand English texts
and also to communicate when it is needed.
One of ways of communication is writing and students are asked to master
this skill as it is a tool to assess their knowledge. Writing is one of productive
skills which have to be taught to students in schools in Indonesia based on
standard curriculum. The tasks which teacher usually gives for English subject are
mostly in written form, for example making dialog, paragraphs, answering essay
test, etc., therefore writing ability is important.3 Students are demanded to master
1 Jeremy Harmer, How to Teach English, (Essex: Pearson Education Limited, 2007), p.59.
2 Ibid., p. 76.3 Dorothy E. Zemach and Carol Islam, Writing in Paragraphs, (MacMillan, 2005), p. iv.

2
aspects of writing – content, structure and diction, in producing good writing.4
Readers of English text also expect a clear topic sentence and a unified paragraph
that deals with one idea, so the writers are asked to achieve unity, to achieve
coherence and to achieve concrete details in their texts.5 In fact, we can find some
students in Indonesia still have difficulties to write in English and do some errors
because of the difference between the two languages, both in structure, spelling
and lexical meaning.6 Besides, they lack of vocabularies to write although they
have their main idea but they should write about their own experience as in
recount text – one of kinds of text taught in Indonesia.
Kinds of text in Indonesia such as report, descriptive, procedure, narrative
and recount are taught and stated in curriculum as parts of English lesson students
should master. Recount as one of kinds of text taught in school is usually
practiced by writing self experience in past time but students are seldom provided
to use media. They usually lean upon their memory about the event. It can limit
their vocabularies to put in text, therefore they can only write short text of
recount. Therefore, they need interesting media, such as picture, to support their
writing.
Picture is one of media which is usually used and it can be provided easily by
teachers. The examples of picture are painting, sketch, photo, etc. Picture usually
used is photo because it reminds and tells student about what happened at that
time. Teachers are asked to use all of possible media to help students studying
easily and fun. Picture is one of useful media to make it fun and easy because it
can help them to build their ideas, to make cohesive and systematic sentence and
to use more vocabularies based on the theme given because some of students are
lack of vocabularies, and this is one of the causes students feel difficult to
4 Giyatno, Improving Students’ Writing Skill On Recount Text Using QuestioningTechnique and Facebook Media, (Surakarta: Sebelas Maret University, 2011), p. 18.
5 Donald Pharr and Santi V. Buscemi, Writing Today, (New York: McGraw HillCompanies, 2005), p. 63.
6 Haryati, An Analysis on the Grammatical Errors in the Students’ Recount Text Writing,(Jakarta: UIN Syarif Hidayatullah Jakarta, 2012), p. 1.

3
speaking and writing.7 Picture also gives imagination to build their ideas based on
the picture they see. As the writer’s experience, some students feel difficult in
writing due to some factors.
The first factor students have less interest in writing. They think that the ideas
they want to write are difficult to come into their mind and it makes them bored,
so it causes the second factor. They usually feel confused how to start writing.
They do not know which part should be the first thing to be written and what
words they should put. The third, students lack of vocabularies. It happens in
almost all of kinds of text – narrative, descriptive, report, procedure and recount
and it may be caused the students’ reading motivation to improve their vocabulary
is insufficient. In writing recount, when students are asked to write about their
own experience, they still have difficulty to write it although it should be easier
because they involved in that moment or experience but the problems above can
limit students’ ability in writing, which is one of important skills in academic
purposes.
Based on the problem and explanation above, the focus of this research can
be stated to find that picture as one of media is effective to improve students’
writing of recount text. Therefore, this research will be conducted by the title
“The Effectiveness of Using Pictures on Students’ Writing of Recount Text(A Quasi-Experimental Research at the Tenth Grade Students of SMA
Negeri 9 Kota Tangerang Selatan)”.
B. Identification of Problem
Based on the object which was investigated in writing recount text, some
problems were identified:
1. Students have less interest in writing.
2. Students usually feel confused how to start writing.
3. Students lack of vocabularies.
7 Dewi Awaliah, The Effectiveness of Picture Series Towards Students’ Writing Skill inNarrative, (Jakarta: UIN Syarif Hidayatullah Jakarta, 2014), p. 2.

4
C. Limitation of the Study
Based on the identification of problem, the study was focused on the
effectiveness of using pictures on students’ writing of recount text of the tenth
grade students of SMA Negeri 9 Kota Tangerang Selatan.
D. Formulation of the Study
As the limitation stated, the problem of this study could be formulated as:
Was there any effectiveness of using pictures on students’ writing of recount
text?
E. Purpose of the Study
Based on the formulation of the problem, the purpose of the study was to
know the effectiveness of using pictures on students’ writing of recount text at the
tenth grade students of SMAN 9 Kota Tangerang Selatan.
F. Significance of the Study
By conducting this study, some significances could be expected in
contribution for students, teachers and further research.
Students.
This study will help them to use and adopt creative way in learning English,
especially in writing recount, so that they can write easily and fun.
Teachers.
This study will give them information that picture can be useful to help
students in writing so teachers can use it and make it more attractive in improving
students’ recount writing skill. Teachers can also use other visual aids or media in
their teaching and learning process.
Further Research.
For further research, this study can be one of references in research about
writing recount, both in learning and teaching writing.

CHAPTER II
THEORETICAL FRAMEWORK
This part talks about the topic-related matters which focus on writing, recount
text and picture.
A. Writing Skill
1. Definition of Writing
Generally, writing is one of the English productive skills. Writing needs
evidence that supports the idea with specific reasons or details.1 While in
speaking, it is a spontaneous action and it does not challenge people to give
reason of what people say.2 In order to make the skill develop better, people can
learn it and practice extensively, and more crucial is belief to improve the skill.3
Harmer stated in How to Teach Writing: “Spoken language, for a child, is
acquired naturally as a result of being exposed to it, whereas the ability to write
has to be consciously learned”.4 There are some definitions about writing appear
from educational experts. An action where we write something using some tools
such as book or paper, pen or pencil, computer and other gadgets can be called as
writing. Today, writing can not only be done by using paper and pencil but also
gadgets.
In Barnet and Stubbs’s Practical Guide to Writing, writing is a physical act
that needs material and energy and requires practice.5 While Rosen said, which
restated in Writing by Hedge, writing is detached from the wide range of
expressive possibilities in speech. It requires a number of things – high degree of
1 John Langan, Exploring Writing: Paragraphs and Essays, (New York: McGraw-Hill,2008), p. 3.
2 Laidlaw Brothers, Composition and Grammar II: Steps in the Writing Process,(California: The Laidlaw Brothers Publishers, 1985), p. 13.
3 John Langan, Op. cit., pp. 7—9 .4 Jeremy Harmer, How to Teach Writing, (Essex: Pearson Education, 2004), p. 3.5 Sylvan Barnet and Marcia Stubbs, Barnet & Stubbs’s Practical Guide to Writing:
Fourth Edition, (Canada: Little, Brown & Company (Canada) Limited, 1983), p. 3.

6
organization, accuracy, the use of complex grammatical devices, vocabulary
selection, grammatical patterns and sentence structures.6
The other writing definition says that it is as human act. It means that writing
as a way to communicate and the writer will speak through written form in their
own words by reading other resources before.7 Writing is a way of remembering
and a way of thinking as well because it makes ideas permanent, and thus expands
the collective memory of human being than remember idea orally.8 In writing,
idea is put on a medium so that it can be permanent, while in speaking there is no
medium. Therefore, writing is used either as evidence of successful learning in
schools or as a means of learning.9
From those definitions above, the difference between writing and speaking
can be seen from the medium. Writing needs medium to put the ideas on it, such
as paper, book, laptop, etc., while speaking the speaker only speak directly
although they can use medium such as telephone, video call, etc. but it is just a
connector between one speaker and the other, not a medium to put the ideas.
Writing, like speaking, is productive a skill as a way of communication but it has
special demands in communication as a complex process that consists of four
stages – prewriting, organizing, writing and revising.10 The four stages help
people arrange their writing well-organized because some people are confused to
start writing and what ideas they will write.
2. Stages of Writing
There are some books which explain stages of writing. Here are stages of
writing based on Composition and Grammar II by Laidlaw Brothers and Writing
in Process by Binder and Lopez-Nerney.
6 Tricia Hedge, Writing, (Oxford: Oxford University Press, 1988), p. 5.7 Robert Scholes and Nancy R. Comley, The Practice of Writing: Second Edition, (New
York, St. Martin’s Press Inc, 1985), pp. 2—3.8 James C. Raymond, Writing (Is an Unnatural Act), (New York: Harper & Row
Publishers, 1980), p. 2.9 Jack C. Richards, The Language Teaching Matrix, (USA: Cambridge University Press,
1990), p. 100.10 Laidlaw Brothers, Op. cit., p. 13.

7
Stages of writing stated by Laidlaw Brothers11:
a. Prewriting
First of all, in order to make writing easier and organized, someone needs to
take this stage, which is prewriting, also known as idea-generating stage. In
morphology the prefix pre- means ‘before’, therefore prewriting is an activity we
should do before take writing. It is a process in collecting idea that may include
experience or something someone has ever been as bases or sources of their
writing. It is free flowing and spontaneous.12 Writers may take a note or a journal
about idea and everything they want to write.
In prewriting stage, one thing might be added to make their writing is
recording impressions. It means that sources of writing come from people
(including the writer itself), places, objects, events, situations and ideas. The
writer can use their journal to discover, capture and preserve for later use.13
b. Organizing
After writer has done with the first stage, the next is organizing. It means that
writer generates ideas which one will be included or discovered for their writing.14
In this step, writer should be aware of the purpose for writing. Bring it for writing
into sharp focus and identifying the audience.
c. Writing
In the next step of writing, which is writing itself, writer gathers all pieces of
the ideas and information then creates meaningful and satisfying writing.15 This
process is “the real writing” because writer should gather all of the ideas he/she
gets then creates the important and meaningful point for their writing.
d. Revising
The last step, revising, writer should be the reader position. The writer should
evaluate his/her writing – it is better and easier waiting for the next day after
writing, from the reader’s point of view. It is to find out how what the writer has
11 Ibid., p. 17.12 Ibid., p. 17.13 Ibid., p. 19.14 Ibid., p. 25.15 Ibid., p. 30.

8
written will strike the readers.16 This process is important to be done because
writer should look from both two sides – as the writer itself and as the reader.
While Binder and Lopez-Nerney stated there are three stages of writing –
planning, writing and finalizing which are divided into some parts in each stage.
Planning is divided into four steps – formulating a question, determining purpose
and audiences, generating ideas and organizing/outlining. Writing is divided into
drafting and revising, and the last stage, finalizing, is divided into editing and
formatting and documenting.17
a. Planning
1. Formulating a question
Generally, writing is an extended response to a question, so the writer should
give wide information. It can be said that planning is a process which basically
begins with a question. Instead, a topic may be set as “a question” for writers to be
formulated into their writing.18
2. Determining Purpose and Audience
After the planning has been arranged, writer should take some time to
understand purpose and readers of his/her writing. Therefore, before writers write
something in a piece of paper, they should consider two things – purpose and
audience.
To consider the purpose of writing, it is necessary to know why someone is
writing, so he/she can choose appropriate information, language and style. Some
examples of why people write are to inform, to express an opinion, to convince, to
argue, to entertain, etc. If writers have identified the purpose, it will help them
how to present their idea.
Besides the reason to know why someone writes, it is good to know for
him/her who they are writing for. It is essential to remember that writers are
always writing for specific readers because it helps to decide the suitability of the
16 Ibid., p. 35.17 Carol A. Binder and Susan Lopez-Nerney, Writing in Process: Second Edition,
(Singapore: Pearson Prentice Hall, 2005), p. 6.18 Ibid., p. 6.

9
topic and level of difficulty of their writing in terms of vocabulary, style and
tone.19
3. Generating Ideas
In generating ideas, writers should bring ideas which come to their mind into
“a note”. They spend more time thinking about and writing down ideas that can be
used in their writing. This stage helps writers to identify the ideas will be put
properly for their writing.
There are two ways in generating ideas. First is brainstorming and the second
is mind-mapping. In brainstorming, writers list down everything that comes into
their mind about a topic. The objective is to allow ideas just come and flow onto
paper. The other step is mind-mapping, which is in form of drawing of branches.
Mind-mapping not only helps in generating ideas but also in organizing them.
This method helps writers develop new ideas by finding connections to their
original thoughts.20
4. Organizing/Outlining
When the first three stages are done, the next stage is to choose information
which writers want to put in their writing. By noticing ideas which best respond to
the question writers formulated, this stage can be done. After that, categorize the
different types of information and organize them so the readers can follow
writers’ thought easily.21
b. Writing
1. Drafting
Draft is an attempt of the first complete writing based on the outline.
Additional drafts continue to build on the foundation of the first draft. At final
writing, a number of drafts may be produced.22 While making a draft, writers
should concern about the ideas and the organization of them and should not spend
much time worrying about grammar.23
19 Ibid., p. 8.20 Ibid., p. 9.21 Ibid., p. 10.22 Jeremy Harmer, Op.cit., p. 5.23 Carol A. Binder and Susan Lopez-Nerney, Op.cit., p. 12.

10
2. Revising
Revising is to check organization of the paragraphs and the clarity of the
ideas which should be explained logically and clearly. From revising stage,
writers should get feedback from another reader. It can be gotten from teacher,
students or someone who is equal to the writers. The way to get feedback from
someone who has equal information or knowledge is called peer feedback or peer
review.24
c. Finalizing
1. Editing
Editing is checking process for spelling, punctuation and grammar errors.
Besides, writers should check the flow of their idea. Writers can read their writing
aloud to help spot any errors and check for any sections or parts.25 More skilled
writers tend to look at issues of general meaning and overall structure before
concentrating on detailed features – individual words and grammatical accuracy.26
2. Formatting and Documenting Information Sources
Along with editing, writers should do a final check the format of their writing
which means visual presentation. It is called as formatting.
Documenting indicates the source of writers’ information. It is usually used
for essay writing because the writers need to acknowledge the source for their
writing. Several documentation styles are APA (American Psychological
Association), MLA (The Modern Language Association), The Chicago Manual of
Style, etc.27
3. Purposes of Writing
Writing includes the ability to organize ideas, to construct correct sentences,
to use tenses and to choose appropriate words. Students are demanded to master
aspects of writing – content, structure and diction, in producing good writing.28
24 Ibid., p. 12.25 Ibid., p. 13.26 Jeremy Harmer, Op.cit., p. 5.27 Carol A. Binder and Susan Lopez-Nerney, Op.cit., p. 13.28 Giyatno, Op.cit., p. 18.

11
However, writing has purposes as a way of communicating to deliver ideas to the
readers. Based on Miller, the purposes of writing are29:
1. To describe what a writer hopes to accomplish.
2. To amuse the readers.
3. To persuade the readers (like in hortatory exposition)
While Carol A. Binder and Susan Lopez-Nerney, stated the purposes of
writing as follow30:
1. To inform. It means that writing can help readers to know what they do not
know before they read the text. Writing gives information in many forms,
such as newspaper, articles, books, magazines, etc.
2. To express an opinion. It means that writing can express what the writer feels
or thinks and express their idea or response about something.
3. To convince. To convince is same as to persuade. Writer can convince reader
through their writing in discussing an issue. Today, there are some writers,
moreover journalists, who write their writing to convince so many people in
form of internet article, newspaper, magazine and books.
4. To argue. Besides to persuade, writing has also a purpose to argue an issue
which is being talked by some people.
5. To entertain. It means that writing entertains readers from the text written.
The examples of entertaining text are short story, novel, entertainment news,
etc. It gives such refreshment for mind and imaginative idea and is included
in the two kinds of text – narrative and recount text.
B. Recount Text
1. Definition of Recount Text
Recount text recount is a piece of text that retells past events, usually in the
order in which they happened.31 It tells significance event happened to the writer
29 Robert Keith Miller, Motives for Writing Fifth Edition, (New York: McGraw-Hill,2006), p. 4.
30 Carol A. Binder and Susan Lopez-Nerney, Op.cit., p. 7.

12
and it usually uses the first person as recount tells about writer’s lives.32 Recount,
as the other text types, has purpose to deliver what writer wants to share with
readers.
2. Purpose of Recount Text
The purpose of recount text is to tell what and when something happened to
the audience. Miller stated goals of recount text are to make the writers more
understand about them, and for the readers, it makes them understanding of their
own experience and the writer’s.33 While in Adibah’s book, she wrote social
function of recount text is to retell events for the purpose of informing or
entertaining.34 In order to achieve the purpose, recount text has generic structure
as a base for the writing.
3. The Generic Structure of Recount Text
In order to create well-organized recount text, students should pay attention to
the features (past tense, proper nouns, word order of events) and the generic
structure. The generic structure of recount text should be known by students to
characterize between recount text and the other kind of texts. This structure, as
Hall stated in Writing Well: 2nd Edition which restated by Haryati in her research,
and Hyland in Writing Text Types: A Practical Journal, is orientation, event and
reorientation.35
a) Orientation : setting and participants.
b) Event : what happened in what sequence.
c) Reorientation : closure of events (optional).
31Mark and Katy Anderson, Text Types in English, (South Yara: MacMillan Education,1997), p. 48.
32 Robert Keith Miller, Motives for Writing Fifth Edition, (New York: McGraw-Hill,2006), p. 47.
33 Robert Keith Miller, Op. cit., p. 47.34 Adibah, Bank Soal Bahasa Inggris SMA Kelas X, XI dan XII, (Yogyakarta: Pustaka
Edukasi, 2013), p. 3.35 Maureen Hyland, Op.cit., p. 1.

13
Recount also focuses on individual participants, past tenses, temporal
sequence of events and action clauses.36
4. Sample of Recount Text
My First Experience to Ride Motorcycle
One day, when I was ten years old, my father bought an old
motorcycle. That was "Honda 75". I think it was small light object
and easy to ride it. I persuaded my father to teach me to ride
"Honda 75". Firstly, my father refused my request and promised
that he would teach me two or three years later, but I still
whimpered. Finally, my father surrendered and promised to teach
me.
He began to teach me riding the motorcycle around a field in
my village. My father was very patient to give me some directions. I
was very happy when I realized my ability to ride a motorcycle.
"Yes, I did it!"
One day after that, when I was alone at home, I intended to try
my riding ability. So, I tried bravely. All ran fluently in the
beginning, but when I was going back to my home and I must pass
through a narrow slippery street, I got nervous. I lost my control
and I fell to the ditch.
After that, I told my father about the last accident. I imagined
my father would be angry and never let me ride a motorcycle
anymore. But the reality was exactly on the contrary, my father was
very proud of me. He just gave me some advice and since that
accident, I got my father's permission to ride motorcycle.
Based on the sample above, it can be found that the purpose is to tell the
readers about the writer’s first experience in riding a motorcycle. From the first
paragraph, it is known as the orientation of this recount text. The second to the
36 Haryati, Op. cit, p.15.

14
third is the event of this recount text which is the story how the writer had the
experience. As the closure, it is in the fourth paragraph.
5. Kinds of Recount Text
Texts which included as recount are diary, journal and everything tells
personal experiences. Personal experience also included as narrative but it is not
fully narrative as in novels, historical occurrences, or even myths, therefore it
belongs to recount text.37 Narrator tries to communicate through his/her writing
about what happened in the event the narrator included and nothing is artificial
about the event.38 So that, by writing recount text, students are hoped to write
easily and enjoyably.
C. Picture
1. Definition of Picture
Picture in teaching technique, based on Raimes, is drawings, photographs,
posters, slides, cartoons, magazine advertisements, diagrams, graphs, tables,
charts and maps can be valuable resource for teaching writing. Pictures provide a
shared experience for the students in the class, a common base that leads to a
variety of language activities.39
In addition, Schwartz’s opinion about picture which rewritten by Yusnita,
Sada and Novita is a great incentive for language production and can be used in
many ways in the classroom to interest and to motivate a sense of language
context and stimulus.40 Moreover, picture can bring the world outside the students
have not known before into the class in a concrete way, as it provides41:
a) A shared experience in the classroom.
b) A need for common language forms to use in the classroom.
37 Sylvan Barnet and Marcia Stubbs, Op.cit., p. 178.38 Sylvan Barnet and Marcia Stubbs, Op cit., p. 181.39 Ann Raimes, Techniques in Teaching Writing, (Oxford: Oxford University Press,
1983), p. 27.40 Enny Yusnita, Clarry Sada and Dewi Novita, Improving Students’ Recount Writing
Text by Using Picture Series, (Pontianak: Tanjungpura University, 2011), p. 5.41 Ann Raimes, Op.cit., p. 28.
15
c) A variety of tasks.
d) A focus of interest for students.
2. Types of Picture
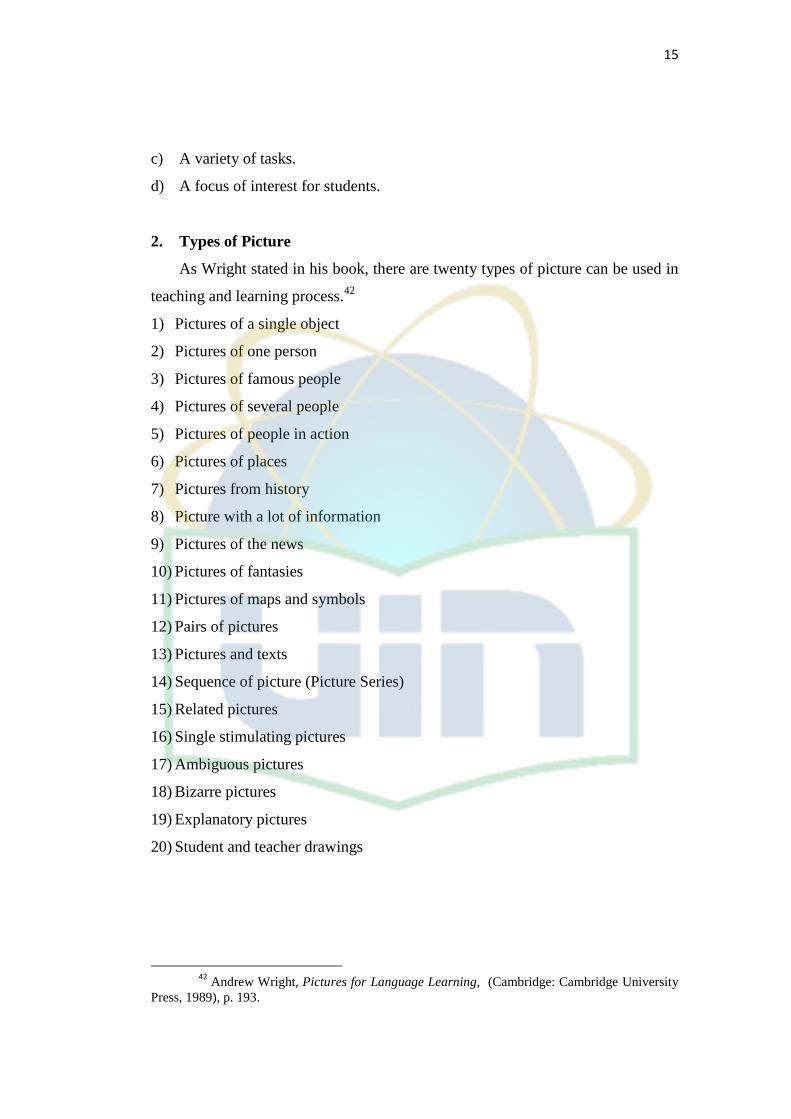
As Wright stated in his book, there are twenty types of picture can be used in
teaching and learning process.42
1) Pictures of a single object
2) Pictures of one person
3) Pictures of famous people
4) Pictures of several people
5) Pictures of people in action
6) Pictures of places
7) Pictures from history
8) Picture with a lot of information
9) Pictures of the news
10) Pictures of fantasies
11) Pictures of maps and symbols
12) Pairs of pictures
13) Pictures and texts
14) Sequence of picture (Picture Series)
15) Related pictures
16) Single stimulating pictures
17) Ambiguous pictures
18) Bizarre pictures
19) Explanatory pictures
20) Student and teacher drawings
42 Andrew Wright, Pictures for Language Learning, (Cambridge: Cambridge UniversityPress, 1989), p. 193.

16
3. The Advantages of Picture
Picture is one of visual and printed media and it is widely used for
educational purposes. Picture as one of media can be used by teacher in teaching
learning process has some advantages. Based on Gerlach and Ely, restated in
research by Dwi Nur Indah, the advantages of picture are43:
a) Picture is inexpensive and widely available.
b) Provide common experiences for an entire group.
c) Visual details make it possible to study subject that would otherwise be
impossible.
d) Picture after stimulus to further study reading and research.
e) Pictures help to focus attention and develop critical judgment.
f) Pictures are easily to manipulate.
In Wright’s book, Pictures for Language Learning, he wrote some
advantages of pictures:44
a) Easy to prepare.
b) Easy to organize.
c) Interesting.
d) Meaningful and authentic.
e) Sufficient amount of language.
Besides the five advantages above, Wright also said that picture can be used
for teachers and students in whatever syllabus they are following.
There are some suggestions for general strategies for teachers using any
picture in a classroom45:
a) Whole-class discussion – it can lead to writing by giving any type of pictures.
b) Changing information – it can lead to speaking by dividing 2 groups in a class.
One group one picture, then they share and exchange their information about
the picture.
43 Dwi Nur Indah, Improving Writing Recount Text by Using Photographs, (Semarang:IKIP PGRI Semarang, 2010), p. 10.
44 Andrew Wright, Op.cit., p. 3.45 Ann Raimes, Op.cit., p. 28.

17
c) Working in pairs or small groups – the teacher gives each student of the pair
or give each group different picture to work with.
d) Real communicative tasks – students provide themselves their own pictures. It
has advantage that teacher is relieved of the task of finding a picture and
students can share their personal moments.
D. Teaching Writing by Using Picture
Teaching writing by using picture can lead to interesting learning for
students.46 As the writer’s experience when she was in school, her friends were
more interested in book which has so many pictures. Here are some ways to teach
writing by using picture.
1. Picture Sets for Writing
Picture sets is pair of pictures or pictures in sequence provide variety of
guided and free writing. It provides the subject matter about the story in the
picture.47 It is usually used for narrative writing but it can be flexible for any kinds
of text. For recount writing, these pictures can be sequenced photographs from
students itself. This can help students in offering vocabulary, sentence structure
and organization about new subject matter.48
By using picture sets, students are hoped to produce more words and various
vocabularies which can be put in their writings.
2. Picture for Whole-class Discussion of Writing
Teacher can provide two pictures while he/she is teaching in the classroom if
some pictures are not possible. Give a half class one picture and the other half
another.49 The teacher can give a task to write all the information about the
picture, then, each group will share or exchange the information about their own
picture.
46 Dwi Nur Indah, Improving Writing Recount Text by Using Photographs, (Semarang:IKIP PGRI Semarang, 2010), p .9.
47 Ann Raimes, Op.cit, p. 36.48 Ibid., p. 36.49 Ibid., p. 28.
18
3. One Picture – Many Different Techniques for Writing
For example, a teacher has a sketch as the picture for students’ writing and
the sketch can be used for many types of writing – description, sentence
combining, role-play, questions and answers, etc.50
For writing description, firstly students need to label some parts in the sketch
with word or phrase. After that, in small groups, students discuss and write down
what other words and phrases they will need to describe it.51 If the sketch is drawn
by the teacher on the board, he/she can erase it and ask students to write
description paragraphs from their memory. If it is in a piece of paper, exchange it
to other groups/students.
Combining sentence by using picture may be shorter than a paragraph or if it
is continued, can be as long as paragraph. For example, there are two pictures
which contain a sentence that can be combined each other to make new sentence.
They are given to two students randomly. Example sentences52:
a) Debbie Johnson’s room is small.
and
b) Debbie Johnson’s room is practical.
Each student in the class should find partner whose sentence will combine
with the one he/she has. Therefore, students are asked to find the sentence which
has same meaning. Some of the possibilities with the two sentences above are:
a) Debbie Johnson’s room is small and practical.
b) Debbie Johnson’s room is small but practical.
c) Debbie Johnson’s room is small yet practical.
d) Although Debbie Johnson’s room is small, it is practical.
e) Though small, Debbie Johnson’s room is practical.
f) Debbie Johnson’s room, though small, is practical.
50 Ibid., p. 30.51 Ibid., p. 30.52 Ibid., p. 31.

19
With the new sentences above, students can discuss to organize those
sentences to make a paragraph.
Role-play demands practical action in a classroom. In writing by using
picture, teacher asks students to work in pairs groups to make attractive writing
about the picture then discuss the details about the picture given. After that,
students are asked to write it in a paragraph. Final step, they read their own aloud
to each other and discuss which one works the best and why.53
In questions-answers session, a class is divided into four groups. The teacher
gives one picture with a word for each group. For example, the teacher has
pictures of Debbie Johnson’s “bedroom, garden, kitchen and house” which given
to four groups. Then, ask the students to compile some questions about it, pretend
that they will stay there and do not know the house. After that, the teacher collects
them from each group and redistribute to other groups. Each group of students
writes a letter from Debbie that answers those questions.54
4. One Picture – A Sequence of Tasks for Writing
Using a picture can give teachers opportunity to develop not only wide
variety of tasks but also a sequence of tasks, so that students can move from one
level of difficulty to another, gathering more vocabulary, knowledge of idiom and
sentence structure and organizational skill. The picture can be discussed by the
students for cultural phenomenon and their own experience related to it.55
The example of one picture for a sequence of tasks56:
1. Divide class into some groups and ask students to answer: “What is happening
in this picture?” The picture is about Debbie’s wedding. They should write
down related words or phrases then the teacher compares the result and writes
necessary vocabularies on the board.
2. Still in groups, students are asked to answers such questions:
a) How old are the two people getting married?
b) Do their parents want them to get married?
53 Ibid., p. 33.54 Ibid., p. 33.55 Ibid, p.34.56 Ibid, p.35.

20
c) What jobs do the two people have?
d) Will the people have children? When? How many?
e) Have you ever been to a wedding? Was it like Debbie’s?
The groups share the result and the teacher write necessary words and idioms,
again on the board.
3. The class reads a paragraph describing Debbie Johnson’s traditional wedding:
Debbie Johnson and Frank Willett had a traditional wedding last Saturday.
The bride wore her grandmother’s veil and her mother’s wedding dress,
which was made of white satin. She wore her sister’s necklace and carried a
bouquet of blue flowers – so she had the bride’s traditional “something old,
something new, something borrowed something blue”. She had six
bridesmaids. They wore long dresses of flowered blue lace. The bridegroom
and the bride’s father were wearing traditional morning suits – a black jacket
and grey pants. The couple was married in church and the bride’s parents
held a reception for 100 guests at their home.
The students examine the paragraph and determine which sentence makes the
main point.
4. Then, students imagine that they are Debbie Johnson writing a letter a friend
abroad, six month before, telling her what the wedding will be like. Students
can take sentences from the paragraph before and change the subjects. For
example, the couple becomes we, the bride’s parents becomes my parents, etc.
5. Small groups discuss and write a description about the wedding for a local
newspaper, and then the other groups make comments and suggestions.
6. After discussion, students are asked to describe a typical traditional wedding
in their country, or in Indonesia, in provinces.

21
5. Teaching Writing by Using Picture Procedures
The writing task can be approached in two ways – students select a previous
piece that they can rewrite or enhance and students create a new piece. Students
are led to follow basic steps57:
1. Talk the picture. Teachers give each student one to three sheets of paper.
Students talk with each other and the teacher, discussing what they can draw
to tell their story. Teachers coach and support students in providing rich
description and they ask questions that will lead to detailed illustrations and a
coherent story line.
2. The picture. Students illustrate the story they have described and are
reminded to include the key elements. The richer details, the richer the
conversation and the writing will be.
3. Talk the writing. Students discuss, describe and “read” the picture story.
Teachers model and support students in formulating sentence to make a story.
Students practice saying the story aloud.
4. The writing. Students then write the picture story. They are reminded to
utilize the rich and descriptive language they practiced.
5. The share. Students read their story to the group. Students ask questions and
compare the completed story to the previous discussion.
Some ways of using picture in teaching writing also stated by Harner through
“drills”, which is in form of grammar items for cueing different sentences or
practicing vocabulary, “(communication) games” for creative writing, where
teachers give some pictures to be written by the students then practice it in
speaking, and “understanding” which is an easy way of explaining the meaning
of words by having a picture.58
57 Teresa Walter, Teaching English Language Learners, (New York: Pearson Education,2004), p.77.
58 Jeremy Harmer, The Practice of English Language Teaching: 3rd edition, (Essex:Pearson Education, 2001), p.134.

22
E. Previous Study
Some researches had been conducted related to the use of pictures on writing
of recount text. There were so many kinds of picture used by the researchers. The
first research was entitled “Improving Students’ Recount Text Writing by Using
Picture Series (A Classroom Action Research to the Tenth Grade Students of SMK
Panca Bhakti Kubu Raya in Academic Year 2011/2012)” written by Eni Yusnita,
Clarry Sada and Dewi Novita had problem that students felt difficult to get ideas
in recount text paragraph, so that the writers decided to use picture series to
improve students’ recount text. The result found that by using picture series,
students’ recount text writing could be improved. The result of first cycle was
61,5 (less than 65, not achieved), while the second cycle was 66 (achieved, higher
than KKM score). The differences between this research and the writer’s are the
writer will conduct an experimental research which is different from the research
above – a classroom action research, the writer will not use picture series and the
place of the research is also different.
The second research was entitled “The Use of Picture Series to Improve
Students’ Ability in Writing Recount Texts (A Classroom Action Research on the
Eight Grader of SMPN 3 Kartasura in 2009/2010 Academic Year)” by
Muhammad Luqman Hakim stated the problem that students felt difficult in
making correct grammatical sentences, developing paragraph and finding
appropriate vocabulary. Moreover, the teacher seldom taught writing process and
only asked for writing production. Based on the questionnaire, 73.5% of students
felt that writing was difficult, 61,8% of students felt that the time for writing was
not enough, 55,9% said that they felt difficult to start writing, 52,9% students
seldom paid attention to appropriate vocabularies and 52,9% students did not
arrange an outline or draft before writing. The result said that there was an
improvement of students’ ability in writing recount text, an improvement in
teaching learning situation and an improvement in students’ personal competence.
The differences between this research and the writer’s are the writer will conduct
an experimental research which is different from the research above – a classroom
action research, the writer will not use picture series and questionnaire as the

23
instrument of data collection. The other difference is the place and the population
of the research.
The third research was entitled “Improving Writing Recount Text by Using
Photographs: A Case Study of the Eleventh Year Students of SMA Negeri 1
Batangan Pati in the Academic Year of 2009/2010” written by Dwi Nur Indah.
She thought that writing is more complex and difficult to teach because it needs
grammatical mastery and theoretically devices and also the conceptual and
judgment. The purpose was improving students’ recount writing by using
photograph as it guided students to generate idea into a meaningful composition.
The result of the improvement was very good which was 62,07 from pre-test
became 76,8 from post-test. It meant that teaching writing recount text by using
photographs in experimental class was successful. The differences between this
research and the writer’s are the writer will use not only photographs but also
illustration picture during the experiment process and the place and the population
of the research is also different.
F. Thinking Frameworks
Writing as a skill which is needed to be mastered for students in Indonesia
seems to be improved because some students do not interested in writing, feel
confused to start writing and they lack of vocabularies. Students need interesting
way to learn producing good writing.
Recount is one of kinds of text which should be mastered by students because
it is taught in high school. Writing recount means that students should write their
own experience in written form. They should put their ideas in well-ordered
writing.
After reviewing theories about teaching writing by using picture, especially
writing recount text, the writer could see that students’ were more interested in
writing if they had clue such as picture as visual aid. It made them easier in
organizing paragraphs for their writings. So that, the writer was interested in
conducting research to know the effectiveness of using pictures on students’

24
writing of recount text at the tenth grade students of SMA Negeri 9 Kota
Tangerang Selatan.
G. Theoretical Hypothesis
The hypothesis of the study can be formulated as follows:
Ha: There was effectiveness of using pictures on students’ writing of
recount text.
Ho: There was no effectiveness of using pictures on students’ writing of
recount text.

25
CHAPTER III
RESEARCH METHODOLOGY
A. Place and Time
This research was held at SMAN 9 Kota Tangerang Selatan for students at
the tenth grade during the first semester starting from August 18 – September 9
2015.
B. Research Design
This research is categorized as quantitative research with experimental study.
The design of this study is a quasi-experimental research to know the
effectiveness of using pictures on students’ writing of recount text. The
independent variable in this study is picture while the dependent variable is
writing recount text.
In this research, pre-test and post-test were used for both experimental class
and controlled class. The experimental class received treatment which was using
pictures in their recount writing while the controlled class did not receive the
treatment. The effectiveness in recount writing improvement would be seen from
the post-test score in experimental class. Below is the explanation of experimental
design by Cresswell.1
Table 3.1
Types of Experimental Designs
True
Experiment
Quasi-
Experiment
Factorial Time
Series
Repeated
Measures
Single
Subject
Random
assignment?
yes no may be
used
no no no
Number of
groups
compared?
Two or
more
Two or
more
Two or
more
One group One group One
individual
studied at a
time
Number of
intervention
used?
One or more
intervention
s
One or more
intervention
s
Two or
more
interventi
ons
One or
more
interventi
ons
Two or more
interventions
One or
more
intervention
s
1 John W. Creswell, Educational Research: 4th edition, (Boston:Pearson Education Inc.,
2012), p. 307.

26
True
Experiment
Quasi-
Experiment
Factorial
Time
Series
Repeated
Measures
Single
Subject
Number of times
the dependent
variable
observed?
Once Once Once After each
interventi
on
After each
intervention
Multiple
points
Controls
typically used?
Pre-test,
matching,
blocking,
covariates
Pre-test,
matching,
blocking,
covariates
Pre-test,
matching,
blocking,
covariates
Group
becomes
its own
control
Covariates Individuals
become
their own
control
C. Population and Sample
The population of this study was the tenth grade students of SMA Negeri 9
Kota Tangerang Selatan. The total of class X was ten classes which were divided
into five sciences and five social. Each class consisted of 37 students. The
sampling technique used was sample random sampling to choose experimental
and controlled class based on the same characteristic because there were so many
classes could be the participant, so two classes were chosen randomly. The classes
for the sample were X MIPA 1 as the experimental class and X MIPA 5 as the
controlled class. Therefore, the total of students as the sample in this research was
74 students.
D. Research Instrument
The instrument the writer used was test in form of imperative sentence “Write
about your memorable moment in your life, minimum 3 paragraphs!”. The
requirements students should have in writing by using picture were:
a. Students should have minimum 3 paragraph as recount generic structure
(orientation, event, reorientation),
b. Students should pay attention to the cohesive, unity, and clarity in their
writing.
E. Technique of Data Collection
In collecting the data, the writer used writing test. The students should make
recount writing by using their own picture, which is a photograph of their own
activity, and should pay attention to the cohesive, unity, and clarity in their
writing.

27
The steps the writer conducted were as follows:
1. Chose control class and experimental class based on the English teacher’s
recommendation.
2. Gave pre-test to both classes to write their memorable moment in 3 paragraphs
(for minimum).
3. Taught to both classes about recount text. Gave treatment for experimental
class and no treatment for control class. Experimental class was taught to
write recount by using pictures. First, the picture was given by the writer.
Next, the picture was their own photo (students’ photo).
4. Gave post-test to both classes to write their memorable moment in 3
paragraphs (for minimum).
5. The writer calculated and compared the scores from pre-test and post-test to
find the effectiveness of using pictures on students’ writing of recount text.
In calculating the scores, the scoring would be used was rating scale by
Weigle which can be seen in appendix 1.2
F. Technique of Data Analysis
In calculating the data, the writer used t-test formula. The two classes are
compared to the independent variable, the experiment class is X variable and the
control class is Y variable. T-test formula is as follow:
Where:
= Mean of Variable X
= Mean of Variable Y
= Standard Error
2 Sara C. Weigle, Assessing Writing, (Cape Town: Cambridge University Press, 2002), p.
116.

28
Afterwards, the calculation goes to several processes as follows:
1. Determining Mean of Variable X.
2. Determining Mean of Variable Y.
3. Determining Standard of Deviation Score of Variable X.
√
4. Determining Standard of Deviation Score of Variable Y.
√
5. Determining Standard Error of Mean of Variable X.
√
6. Determining Standard Error of Mean of Variable Y.
√
7. Determining Standard Error of Difference of Mean of Variable X and Y.
√
8. Determining to.
9. Determining ttable in significance level 5%, with df (degrees of freedom).
df or db =(Nx+Ny )-2
Where:
M = the average of students score
SD = standard deviation

29
SE = standard errors
X = experimental class
Y = controlled class
N = number of students
df = degree of freedom
G. Statistical Hypothesis
The statistical hypothesis of this study could be seen as:
Ho : µ1 = µ2
Ha : µ1 ≠ µ2
Ho: There was effectiveness of using pictures on students’ writing of
recount text.
Ha: There was no effectiveness of using pictures on students’ writing of
recount text.
And then, the criteria used as follows:
1. If t-test (to) > t-table (tt) in significant degree of 0.05, Ho (null hypothesis) is
rejected. It means that the rates of mean score of the experimental group are
higher than the control group. The using of pictures is effective on students’
writing of recount text.
2. If t-test (to) < t-table (tt) in significant degree of 0.05, Ho (the null hypothesis)
is accepted. It means that the rates of the means score of the experimental
group are same as or lower than the control group. The using of pictures is not
effective on students’ writing of recount text.

30
CHAPTER IV
RESEARCH FINDING AND INTERPRETATION
A. Data Description
The data were collected from the tenth grade students of SMA Negeri 9 Kota
Tangerang Selatan for pre-test and post-test. The experimental class was X MIPA
1 and the controlled class was X MIPA 5. The data which was obtained described
into two tables. Each table had five columns; the first column showed the number
of students, the second and the third column showed pre-test and post-test scores,
the fourth column showed the gain score from pre-test and post-test, and the last
column showed the catogorization in post test score.
1. The Data of Experimental Class (X MIPA 1)
Table 4.1
Pre-test and Post-test of Experimental Class
Name Pre-test score Post-test
score
Gained
score
Categorization
in post test
Student 1 50 62 12 Fair
Student 2 67 79 12
Good
Student 3 65 79 14
Good
Student 4 46 78 32
Good
Student 5 66 88 22
Excellent
Student 6 38 72 34
Good
Student 7 88 90 2
Excellent
Student 8 90 90 0
Excellent
Student 9 78 87 9
Excellent
Student 10 49 80 31
Excellent
Student 11 52 77 25
Good
Student 12 80 85 5
Excellent
Student 13 77 90 13
Excellent
Student 14 62 82 20
Excellent
31
Name Pre-test score Post-test
score
Gained
score
Categorization
in post test
Student 15 47 75 28
Good
Student 16 65 80 15
Excellent
Student 17 34 74 40
Good
Student 18 49 75 26
Good
Student 19 71 88 17
Excellent
Student 20 65 86 21
Excellent
Student 21 52 76 24
Good
Student 22 67 80 13
Excellent
Student 23 47 78 31
Good
Student 24 47 75 28
Good
Student 25 51 85 34
Excellent
Student 26 77 88 11
Excellent
Student 27 37 74 37
Good
Student 28 45 76 31
Good
Student 29 66 89 23
Excellent
Student 30 67 77 10
Good
Student 31 47 79 32
Good
Student 32 67 80 13
Excellent
Student 33 64 86 22
Excellent
Student 34 64 72 8
Good
Student 35 78 87 9
Excellent
Student 36 72 89 17
Excellent
Student 37 79 90 11
Excellent
TOTAL 2266
2998 732
∑ 61,24 81,02 19,78
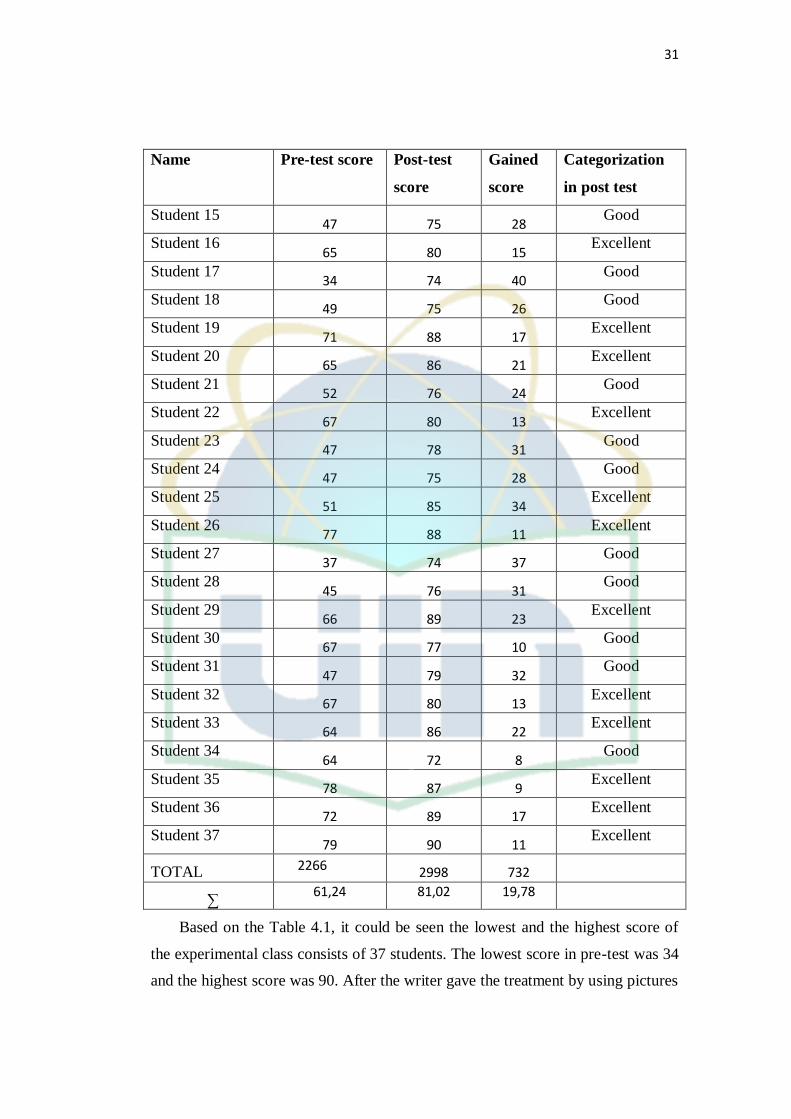
Based on the Table 4.1, it could be seen the lowest and the highest score of
the experimental class consists of 37 students. The lowest score in pre-test was 34
and the highest score was 90. After the writer gave the treatment by using pictures

32
in teaching writing recount text, the writer gave the students post-test. The data
showed in the post-test that the lowest score was 62 and the highest was 90.
2. The Data of Controlled Class (X MIPA 5)
Table 4.2
Pre-test and Post-test of Controlled Class
Name Pre-test
score
Post test
score
Gained score Categorization
in post test
Student 1 37 44 7 Very poor
Student 2 68 72 4
Good
Student 3 55 60 5
Fair
Student 4 36 46 10
Very poor
Student 5 54 66 12
Fair
Student 6 72 69 -3
Fair
Student 7 35 47 12
Very poor
Student 8 42 74 32
Good
Student 9 44 60 16
Fair
Student 10 56 59 3
Poor
Student 11 58 71 13
Good
Student 12 39 65 26
Fair
Student 13 39 60 21
Fair
Student 14 65 68 3
Fair
Student 15 48 60 12
Fair
Student 16 39 65 26
Fair
Student 17 57 66 9
Fair
Student 18 59 68 9
Fair
Student 19 36 55 19
Poor
Student 20 46 65 19
Fair
Student 21 79 85 6
Excellent
Student 22 48 62 14
Fair

33
Name Pre-test
score
Post-test
score
Gained score Categorization
in post test
Student 23 49 68 19
Fair
Student 24 37 44 7
Very poor
Student 25 45 62 17
Fair
Student 26 49 66 17
Fair
Student 27 72 70 -2
Good
Student 28 42 59 17
Poor
Student 29 34 47 13
Very poor
Student 30 56 65 9
Fair
Student 31 34 48 14
Very poor
Student 32 54 62 8
Fair
Student 33 80 83 3
Excellent
Student 34 69 75 6
Good
Student 35 78 79 1
Good
Student 36 60 66 6
Fair
Student 37 70 80 10
Excellent
TOTAL 1941 2361 420
∑ 52,46 63,81 11,35
Based on the Table 4.2, it could be seen the lowest and the highest score of
the controlled class consists of 37 students. The lowest score in pre-test was 34
and the highest score was 80. The data showed in the post-test that the lowest
score was 44 and the highest was 85.
B. Analysis of Data and Hypothesis Testing
1. Results of Pre-test of Experimental and Controlled Class
The result of pre-test of experimental and controlled class based on SPSS 22
version software was gained from the steps as follows: Analyze >> Description
Statistic >> Frequencies. Then put post-test into variables >> Click Statistic >>
Checklist the entire menu >> Click OK.

34
Table 4.3
Table of Data Description of Pre-test Result of Experimental Class
Statistics
Experimental
N Valid 37
Missing 37
Mean 61.24
Median 65.00
Mode 47a
Variance 210.967
Range 56
Minimum 34
Maximum 90
Sum 2266
a. Multiple modes exist. The
smallest value is shown Table 4.3 showed that the data of X MIPA 1 as the experimental class
consisted of 37 students. The total of all data which was divided with the number
of data determined as mean score from the experimental class was 61.24. Median
score was 65.00. The median is the numerical value separating the higher half of a
data sample, a population, or a probability distribution, from the lower half. The
mode is defined as the element that appears most frequently in a given set of
elements. The mode score from the table was 47. The set of scores constituted a
population determined a variance score was 210.967. The highest score of the
experimental class was 90 and the lowest was 34. The sum gained from the total
scores was 2266.
According to the table, it could be made a table of frequency distribution
which is presented as follows:

35
Table 4.4
Table of Frequency Distribution of Pre-test Result of Experimental
Class
Experimental
Frequency Percent Valid Percent
Cumulative
Percent
Valid 34 1 1.4 2.7 2.7
37 1 1.4 2.7 5.4
38 1 1.4 2.7 8.1
45 1 1.4 2.7 10.8
46 1 1.4 2.7 13.5
47 4 5.4 10.8 24.3
49 2 2.7 5.4 29.7
50 1 1.4 2.7 32.4
51 1 1.4 2.7 35.1
52 2 2.7 5.4 40.5
62 1 1.4 2.7 43.2
64 2 2.7 5.4 48.6
65 3 4.1 8.1 56.8
66 2 2.7 5.4 62.2
67 4 5.4 10.8 73.0
71 1 1.4 2.7 75.7
72 1 1.4 2.7 78.4
77 2 2.7 5.4 83.8
78 2 2.7 5.4 89.2
79 1 1.4 2.7 91.9
80 1 1.4 2.7 94.6
88 1 1.4 2.7 97.3
90 1 1.4 2.7 100.0
Total 37 50.0 100.0
Missing System 37 50.0
Total 74 100.0

36
Table 4.4 was tool of presentation consisting of columns and rows and there
were numbers which describe the division and the percentage of frequency
distribution.
Results gained from a pre-test in class X MIPA 5 as the controlled class of
this research were presented in a table below:
Table 4.5
Table of Data Description of Pre-test Result of Controlled Class
Statistics Controlled
N Valid 37
Missing 37
Mean 52.46
Median 49.00
Mode 39
Variance 195.755
Range 46
Minimum 34
Maximum 80
Sum 1941 Table 4.5 showed that the data of X MIPA 5 as the controlled class was 37
students. The total of all data which was divided with the number of data
determined as mean score from the controlled class was 52.46. Median score was
49.00. The median is the numerical value separating the higher half of a data
sample, a population, or a probability distribution, from the lower half. The mode
is defined as the element that appears most frequently in a given set of elements.
The mode score from the table was 39. The set of scores constituted a population
determined a variance score was 195.755. The highest score of the controlled
class was 80 and the lowest is 34. The sum gained from the total scores was 1941.

37
Table 4.6
Table of Frequency Distribution of Pre-test Result of Controlled Class
Controlled
Frequency Percent Valid Percent
Cumulative
Percent
Valid 34 2 2.7 5.4 5.4
35 1 1.4 2.7 8.1
36 2 2.7 5.4 13.5
37 2 2.7 5.4 18.9
39 3 4.1 8.1 27.0
42 2 2.7 5.4 32.4
44 1 1.4 2.7 35.1
45 1 1.4 2.7 37.8
46 1 1.4 2.7 40.5
48 2 2.7 5.4 45.9
49 2 2.7 5.4 51.4
54 2 2.7 5.4 56.8
55 1 1.4 2.7 59.5
56 2 2.7 5.4 64.9
57 1 1.4 2.7 67.6
58 1 1.4 2.7 70.3
59 1 1.4 2.7 73.0
60 1 1.4 2.7 75.7
65 1 1.4 2.7 78.4
68 1 1.4 2.7 81.1
69 1 1.4 2.7 83.8
70 1 1.4 2.7 86.5
72 2 2.7 5.4 91.9
78 1 1.4 2.7 94.6
79 1 1.4 2.7 97.3
80 1 1.4 2.7 100.0
Total 37 50.0 100.0
Missing System 37 50.0
Total 74 100.0

38
2. Results of Post-test of Experimental and Controlled Class
The result of post-test of experimental and controlled class based on SPSS 22
version software was gained from the steps as follows: Analyze >> Description
Statistic >> Frequencies. Then put post-test into variables >> Click Statistic >>
Checklist the entire menu >> Click OK.
Table 4.7
Table of Data Description of Post-test Result of Experimental Class
Statistics
Experiment
N Valid 37
Missing 37
Mean 81.03
Median 80.00
Mode 80a
Variance 44.416
Range 28
Minimum 62
Maximum 90
Sum 2998
a. Multiple modes exist. The
smallest value is shown
Table 4.7 showed that the data of X MIPA 1 as the experimental class
consisted of 37 students. The total of all data which was divided with the number
of data determined as mean score from the experimental class was 81.03. Median
score was 80.00. The mode score from the table was also 80.00. The set of scores
constituted a population determined a variance score was 44.416. The highest
score of the experimental class was 90 and the lowest was 62. The sum gained
from the total scores was 2998.
According to the table, it could be made a table of frequency distribution
which was presented as follows:

39
Table 4.8
Table of Frequency Distribution of Post Test Result of Experimental Class
Experiment
Frequency Percent Valid Percent
Cumulative
Percent
Valid 62 1 1.4 2.7 2.7
72 2 2.7 5.4 8.1
74 2 2.7 5.4 13.5
75 3 4.1 8.1 21.6
76 2 2.7 5.4 27.0
77 2 2.7 5.4 32.4
78 2 2.7 5.4 37.8
79 3 4.1 8.1 45.9
80 4 5.4 10.8 56.8
82 1 1.4 2.7 59.5
85 2 2.7 5.4 64.9
86 2 2.7 5.4 70.3
87 2 2.7 5.4 75.7
88 3 4.1 8.1 83.8
89 2 2.7 5.4 89.2
90 4 5.4 10.8 100.0
Total 37 50.0 100.0
Missing System 37 50.0
Total 74 100.0

40
Table 4.9
Table of Data Description of Post Test Result of Controlled Class
Statistics
Control
N Valid 37
Missing 37
Mean 63.81
Median 65.00
Mode 60a
Variance 108.602
Range
Minimum
41
44
Maximum 85
Sum 2361
a. Multiple modes exist. The
smallest value is shown Table 4.9 showed that the data of X MIPA 5 as the controlled class consisted
of 37 students. The total of all data which was divided with the number of data
determined as mean score from the controlled class was 63.81. Median score was
65.00. The mode score from the table was also 60.00. The set of scores constituted
a population determined a variance score was 108.602. The highest score of the
experimental class was 85 and the lowest is 44. The sum gained from the total
scores was 2361.

41
Table 4.10
Table of Frequency Distribution of Post Test Result of Controlled Class
Control
Frequency Percent Valid Percent
Cumulative
Percent
Valid 44 2 2.7 5.4 5.4
46 1 1.4 2.7 8.1
47 2 2.7 5.4 13.5
48 1 1.4 2.7 16.2
55 1 1.4 2.7 18.9
59 2 2.7 5.4 24.3
60 4 5.4 10.8 35.1
62 3 4.1 8.1 43.2
65 4 5.4 10.8 54.1
66 4 5.4 10.8 64.9
68 3 4.1 8.1 73.0
69 1 1.4 2.7 75.7
70 1 1.4 2.7 78.4
71 1 1.4 2.7 81.1
72 1 1.4 2.7 83.8
74 1 1.4 2.7 86.5
75 1 1.4 2.7 89.2
79 1 1.4 2.7 91.9
80 1 1.4 2.7 94.6
83 1 1.4 2.7 97.3
85 1 1.4 2.7 100.0
Total 37 50.0 100.0
Missing System 37 50.0
Total 74 100.0
Before the writer calculated the value of t-test to look at the hypothesis, the
writer had to analyze the normality and homogeneity of the data. The examination
of normality was needed to know whether the data had been normally distributed.
Then, after getting the normality, the next step was calculating the homogeneity of
data. It was proposed to look at whether the data was homogeneous or
heterogeneous.

42
3. Normality Test
The normality test is performed using Kolmogorov Smirnnov and Shapiro-
Wilk. The test is for the two groups, both post-test and pre-test group, to
determine if the distribution of the data from the sample is normal. Thus, the
researcher used SPSS version 22 software. If the normality is more than the level
of significance α (0.05), scores will be normally distributed.
Table 4.11
Normality Pre-test Results between Experimental and Controlled Class
Tests of Normality
Kelas
Kolmogorov-Smirnova Shapiro-Wilk Statistic df Sig. Statistic df Sig.
Pretest Experiment .143 37 .054 .957 37 .160
Control .111 37 .200* .933 37 .027
*. This is a lower bound of the true significance.
a. Lilliefors Significance Correction
Table 4.12
Normality Post Test Results between Experimental and Controlled Class
Tests of Normality
Kelas
Kolmogorov-Smirnova Shapiro-Wilk Statistic df Sig. Statistic df Sig.
Posttest Experiment .130 37 .118 .929 37 .021
Control .108 37 .200* .966 37 .319
*. This is a lower bound of the true significance.
a. Lilliefors Significance Correction
In normality test based on Kolmogorov-Smirnov, data were stated as
distributed normal when sig. score was above 0.05. In the table above, it showed
that both experimental and controlled class had normal distribution data. The sig.
score in pre-test in controlled and experimental class were 0.054 and 0.200.
Meanwhile the sig. score in post-test between both of the class were 0.118 and
0.200.
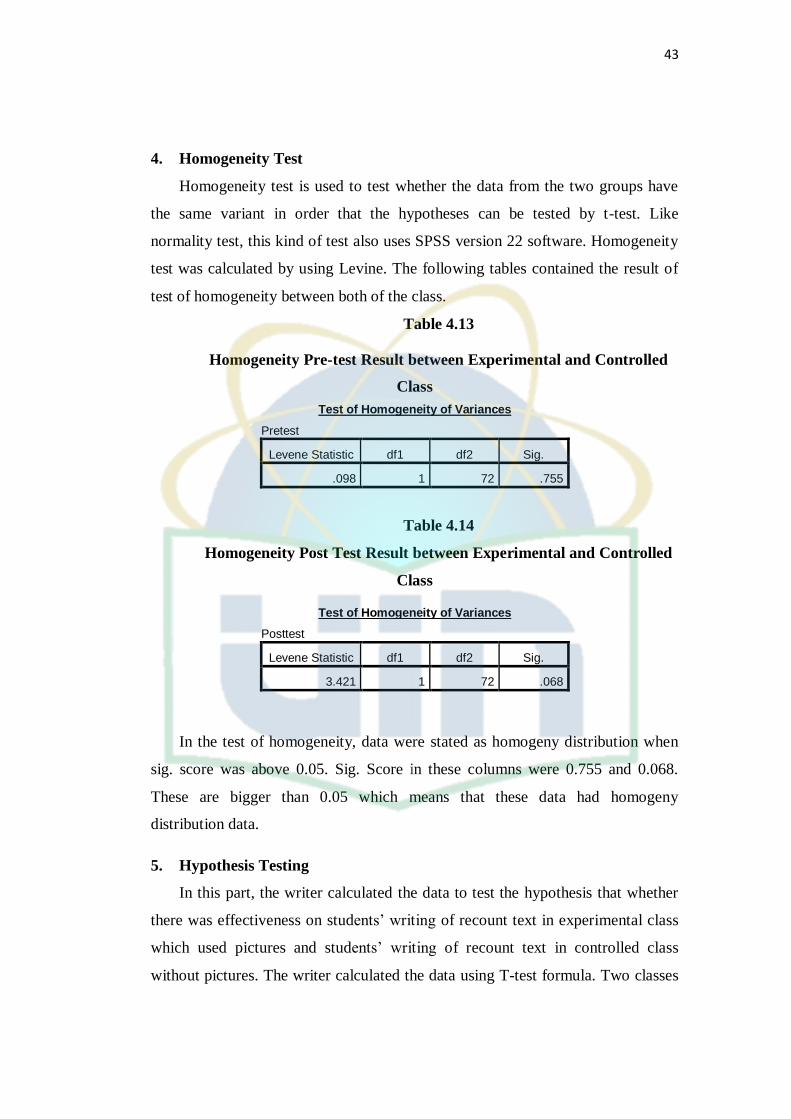
43
4. Homogeneity Test
Homogeneity test is used to test whether the data from the two groups have
the same variant in order that the hypotheses can be tested by t-test. Like
normality test, this kind of test also uses SPSS version 22 software. Homogeneity
test was calculated by using Levine. The following tables contained the result of
test of homogeneity between both of the class.
Table 4.13
Homogeneity Pre-test Result between Experimental and Controlled
Class
Test of Homogeneity of Variances
Pretest
Levene Statistic df1 df2 Sig.
.098 1 72 .755
Table 4.14
Homogeneity Post Test Result between Experimental and Controlled
Class
Test of Homogeneity of Variances
Posttest
Levene Statistic df1 df2 Sig.
3.421 1 72 .068
In the test of homogeneity, data were stated as homogeny distribution when
sig. score was above 0.05. Sig. Score in these columns were 0.755 and 0.068.
These are bigger than 0.05 which means that these data had homogeny
distribution data.
5. Hypothesis Testing
In this part, the writer calculated the data to test the hypothesis that whether
there was effectiveness on students’ writing of recount text in experimental class
which used pictures and students’ writing of recount text in controlled class
without pictures. The writer calculated the data using T-test formula. Two classes

44
were compared, the experiment class was X variable and the controlled class was
Y variable. The formula of T-test was expressed as follows:
Here is the table of calculation between experimental class and controlled
class:
Table 4.15
The Comparison of Gained Score between Students in Experimental
Class and Students in Controlled Class
No. Eks X ctrl Y x=Mx-X y=My-Y x² y²
1 12 7 -7.78 -4.35 60.53 18.92
2 12 4 -7.78 -7.35 60.53 54.02
3 14 5 -5.78 -6.35 33.41 40.32
4 32 10 12.22 -1.35 149.33 1.82
5 22 12 2.22 0.65 4.93 0.42
6 34 -3 14.22 -14.35 202.21 205.92
7 2 12 -17.78 0.65 316.13 0.42
8 0 32 -19.78 20.65 391.25 426.42
9 9 16 -10.78 4.65 116.21 21.62
10 31 3 11.22 -8.35 125.89 69.72
11 25 13 5.22 1.65 27.25 2.72
12 5 26 -14.78 14.65 218.45 214.62
13 13 21 -6.78 9.65 45.97 93.12
14 20 3 0.22 -8.35 0.05 69.72
15 28 12 8.22 0.65 67.57 0.42
16 15 26 -4.78 14.65 22.85 214.62
17 40 9 20.22 -2.35 408.85 5.52
18 26 9 6.22 -2.35 38.69 5.52
19 17 19 -2.78 7.65 7.73 58.52
20 21 19 1.22 7.65 1.49 58.52
21 24 6 4.22 -5.35 17.81 28.62
22 13 14 -6.78 2.65 45.97 7.02
23 31 19 11.22 7.65 125.89 58.52
24 28 7 8.22 -4.35 67.57 18.92
25 34 17 14.22 5.65 202.21 31.92
26 11 17 -8.78 5.65 77.09 31.92
27 37 -2 17.22 -13.35 296.53 178.22
28 31 17 11.22 5.65 125.89 31.92
29 23 13 3.22 1.65 10.37 2.72
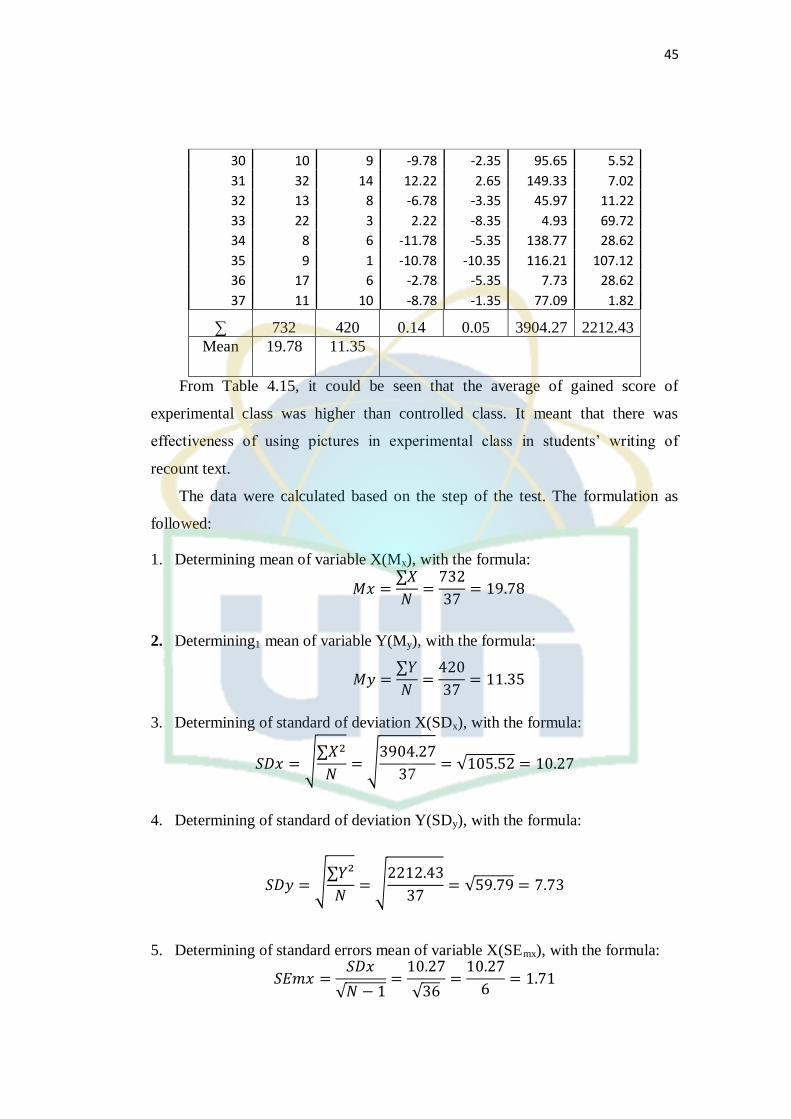
45
30 10 9 -9.78 -2.35 95.65 5.52
31 32 14 12.22 2.65 149.33 7.02
32 13 8 -6.78 -3.35 45.97 11.22
33 22 3 2.22 -8.35 4.93 69.72
34 8 6 -11.78 -5.35 138.77 28.62
35 9 1 -10.78 -10.35 116.21 107.12
36 17 6 -2.78 -5.35 7.73 28.62
37 11 10 -8.78 -1.35 77.09 1.82
∑ 732 420 0.14 0.05 3904.27 2212.43
Mean 19.78 11.35
From Table 4.15, it could be seen that the average of gained score of
experimental class was higher than controlled class. It meant that there was
effectiveness of using pictures in experimental class in students’ writing of
recount text.
The data were calculated based on the step of the test. The formulation as
followed:
1. Determining mean of variable X(Mx), with the formula:
2. Determining1 mean of variable Y(My), with the formula:
3. Determining of standard of deviation X(SDx), with the formula:
√
√
√
4. Determining of standard of deviation Y(SDy), with the formula:
√
√
√
5. Determining of standard errors mean of variable X(SEmx), with the formula:
√
√

46
6. Determining of standard errors mean of variable Y(SEmy), with the formula:
√
√
7. Determining of standard errors of different mean of variable X and mean of
variable Y, with the formula:
√
√( ) ( )
√
√
= 2.13
8. Determining with the formula:
df = (N1+N2)-2
= (37+37)-2
=72

47
Based on the hypothesis that had been explained in chapter III, which was:
Ho: There was effectiveness of using pictures on students’ writing of recount
text.
Ha: There was no effectiveness of using pictures on students’ writing of
recount text.
To prove the hypothesis, the data obtained from experimental and controlled
class were calculated by using t-test formula with assumption as follows:
If to ≥ ttable the Null Hypothesis (Ho) is rejected, it means that there was
effectiveness of using picture on students’ writing of recount text. In the other
hand, if to ≤ ttable the Null Hypothesis is accepted, it means that there was no
effectiveness of using picture on students’ writing of recount text.
Based on the description of the calculation above, it could be concluded that:
a) The value of ttable in the significance 1% was 2.63 and 5% was 1.99
b) The value of t0 was 3.96
c) So, the result was 1.99 < 3.96 > 2.63. It meant that to (t observation) was
higher than tt (t table).
C. Interpretation of the Result
The discussion of the research was based on the research question, which was
to know whether there was effectiveness of using pictures on students’ writing of
recount text at the tenth grade students of SMA Negeri 9 Kota Tangerang Selatan.
Based on the post-test result was known that the students’ writing of recount text
showed difference in both experimental class and controlled class. The average of
pre-test score in experimental class was 61.24 and in controlled class was 52.46.
Comparing with the average score of post-test, experimental class had 81.02 and
controlled class had 63.81. The post-test in experimental was higher than the
controlled class.
Each class had 37 students, so the degree of freedom (df) was (37 + 37) – 2 =
72. The critical value with df 78 in significance of 5% was 1.99 while in
48
significance 1% was 2.63. The to was 3.96. Therefore, to = 3.96 was higher that the
degree of significance 5% and 1%, 1.99 < 3.96 > 2.63, which meant that the null
hypothesis was rejected and the alternative hypothesis was accepted.
Related to the theories in chapter II about writing, recount text and picture,
picture can be used in a class because of the two advantages of picture for
teaching and learning, which are sufficient amount of language and help students
to focus attention and develop critical judgment. Therefore, in teaching writing of
recount text by using pictures was effective based on the result of the study and
the theory. It could be concluded that using pictures was effective on students’
writing on recount text at the tenth grade students of SMA Negeri 9 Kota
Tangerang Selatan.

49
CHAPTER V
CONCLUSION AND SUGGESTION
A. Conclusion
After conducting the research and calculating the data, conclusion could be
stated that it was effective of using pictures on students’ writing of recount text. It
could be seen from the average of post-test result in experimental class was 81.02
and the average of gained score was 19.78. The average of post-test result in
controlled class was 63.81 and the average of gained score was 11.35.
Statistically, it was proven that in significance degree of 5% is 1.99 < 3.96 >
2.63. It meant that to (t observation) was higher that tt (t table). So, the null
hypothesis (H0) was rejected. The answer of research problem was proven that
there was effectiveness of using pictures on students’ writing of recount text,
where there is a significant progress in students’ recount writing.
Students’ writing of recount text got higher score if students used pictures to
help them in writing as it can help to build their ideas. Students who did not
receive treatment got lower score than students who received treatment.
B. Suggestion
The result of this study showed that it is effective to be applied in teaching
and learning process. After the writer conducted the research, suggestion could be
appeared related to research findings and discussion. The points are:
1. Students should use picture to help them improve their writing skill as picture
has so many advantages.
2. Students who have skill in drawing can use it to improve language skills, such
as writing, so that they can increase their writing ability, especially for
academic purposes in school.
3. The teachers should develop students’ idea by using pictures (or other media)
and make it come easier when students should write. By using picture – in this
case students’ photo, their memory will appear about what to write.
4. The teachers should motivate students to develop their writing by using media,
and the simplest one is picture, because it makes students’ visualization

50
refreshed. So, they do not only see their writing but also pictures as their tool for
writing recount text.

51
REFERENCES
Adibah. Bank Soal Bahasa Inggris SMA Kelas X, XI dan XII. Yogyakarta: Pustaka
Edukasi, 2013
Anderson, Mark and Kathy. Text Types in English. South Yarra: MacMillan
Education, 1997
Awaliah, Dewi. The Effectiveness of Picture Series towards Students’ Writing
Skill in Narrative. Jakarta: UIN Syarif Hidayatullah Jakarta, 2014
Azmi, Ulul. A Correlation between Students’ Mastery of Past Tense and Their
Ability in Writing Recount Text. Jakarta: UIN Syarif Hidayatullah Jakarta,
2011
Barnet, Sylvan and Marcia Stubbs. Barnet & Stubbs’s Practical Guide to Writing:
Fourth Edition. Canada: Little, Brown & Company (Canada) Limited,
1983
Binder, Carol A. and Susan Lopez-Nerney. Writing in Process: Strategies for
Organization and Development, 2nd edition. Singapore: Pearson Education
South Asia, 2005
Creswell, John W. Educational Research: 4th edition. Boston: Pearson Education
Inc., 2012
Giyatno. Improving Students’ Writing Skill On Recount Text Using Questioning
Technique and Facebook Media. Surakarta: Sebelas Maret University,
2011
Harmer, Jeremy. The Practice of English Language Teaching: 3rd edition. Essex:
Pearson Education, 2001
Haryati. An Analysis on the Grammatical Errors in the Students’ Recount Text
Writing. Jakarta: UIN Syarif Hidayatullah Jakarta, 2012
Hedge, Tricia. Writing. Oxford: Oxford University Press, 1988
Hyland, Maureen. Writing Text Types: A Practical Journal. Western Australia:
RIC Publications, 2009
Indah, Dwi N. Improving Writing Recount Text by Using Photographs. Semarang:
IKIP PGRI Semarang, 2010

52
Langan, John. Exploring Writing Paragraphs and Essays. New York: McGraw
Hill, 2008
Miller, Robert Keith. Motives for Writing Fifth Edition. New York: McGraw-Hill,
2006
Pharr, Donald and Santi V. Buscemi, Writing Today. New York: McGraw Hill
Companies, 2005
Raimes, Ann. Techniques in Teaching Writing. Oxford: Oxford University Press,
1983
Raymond, James C. Writing (Is an Unnatural Act). New York: Harper & Row
Publishers, 1980
Richards, Jack C. The Language Teaching Matrix, USA: Cambridge University
Press, 1990
Scholes, Robert and Nancy R. Comley. The Practice of Writing: Second Edition.
New York: St. Martin’s Press Inc., 1985
Walter, Teresa. Teaching Englsih Language Learners. New York: Pearson
Education, 2004
Weigle, Sara C. Assessing Writing. Cape Town: Cambridge University Press,
2002
Wright, Andrew. Pictures for Language Learning. Cambridge: Cambridge
University Press, 1989
Yusnita, Enny, Clarry Sada and Dewi Novita. Improving Students’ Recount
Writing Text by Using Picture Series. Pontianak: Tanjungpura University,
2011
Zemach, Dorothy E. and Carol Islam. Writing in Paragraphs. MacMillan, 2005
http://educasi-mediafor.blogspot.com/2013/06/definition-and-examples-of.htmlhttp://www.englishindo.com/2012/03/report-text-penjelasan-contoh.html#definition%20of%20report%20texthttp://www.englishindo.com/2012/03/report-text-penjelasan-
contoh.html#definition%20of%20report%20text
http://serc.carleton.edu/sp/library/media.htmlhttp://zvavanhuchopper.blogspot.com/2010/10/blog-post_17.html

APPENDICES
Scoring Table for Writing
Scoring
Element
Scale Quality Description
Content 30-27 Excellent to
very good
Knowledge – substantive –
thorough development of thesis –
relevant to assigned topic.
22-26 Good to
average
Some knowledge of subject –
adequate range – limited
development of thesis – mostly
relevant to topic, but lack detail.
21-17 Fair to poor Limited knowledge of subject –
little substance – inadequate
development of topic.
16-13 Very poor Does not show knowledge of
subject – non-substantive – not
pertinent – OR not enough to
evaluate.
Organization 20-18 Excellent to
very good
Fluent expression – ideas clearly
stated/supported – succinct – well
organized – logical sequencing –
cohesive.
17-14 Good to
average
Somewhat choppy – loosely
organized but main ideas stand out
– limited support – logical but
incomplete sequencing.
13-10 Fair to poor Non fluent – ideas confused or
disconnected – lacks logical
sequencing and development.
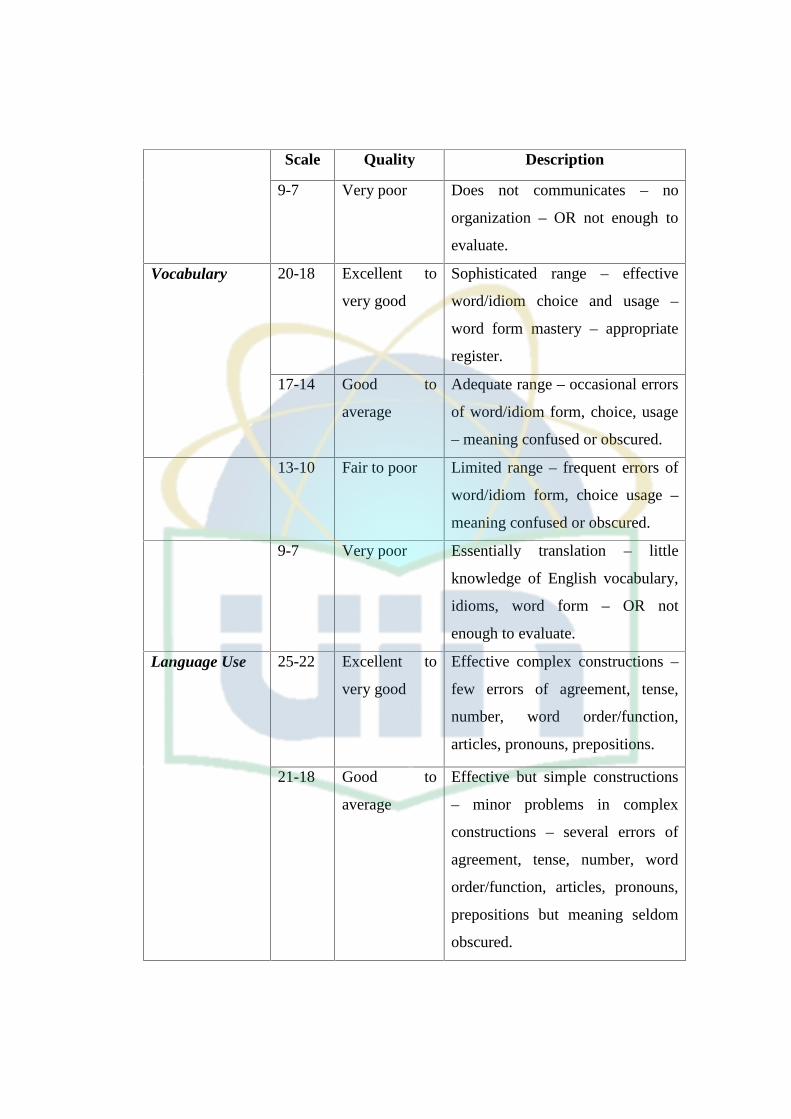
Scale Quality Description
9-7 Very poor Does not communicates – no
organization – OR not enough to
evaluate.
Vocabulary 20-18 Excellent to
very good
Sophisticated range – effective
word/idiom choice and usage –
word form mastery – appropriate
register.
17-14 Good to
average
Adequate range – occasional errors
of word/idiom form, choice, usage
– meaning confused or obscured.
13-10 Fair to poor Limited range – frequent errors of
word/idiom form, choice usage –
meaning confused or obscured.
9-7 Very poor Essentially translation – little
knowledge of English vocabulary,
idioms, word form – OR not
enough to evaluate.
Language Use 25-22 Excellent to
very good
Effective complex constructions –
few errors of agreement, tense,
number, word order/function,
articles, pronouns, prepositions.
21-18 Good to
average
Effective but simple constructions
– minor problems in complex
constructions – several errors of
agreement, tense, number, word
order/function, articles, pronouns,
prepositions but meaning seldom
obscured.

Scale Quality Description
17-11 Fair to poor Major problems in simple/
complex constructions – frequent
errors of negation, agreement,
tense, number, word
order/function, articles, pronouns,
prepositions and/or fragments, run-
ons, deletions – meaning confused
or obscured.
10-5 Very poor Virtually no mastery of sentence
construction rules – dominated by
errors – does not communicate –
OR not enough to evaluate.
Mechanics 5 Excellent to
good
Demonstrates mastery of
conventions – few errors of
spelling, punctuation,
capitalization, paragraphing.
4 Good to
average
Occasional errors of spelling,
punctuation, capitalization,
paragraphing but meaning not
obscured.
3 Fair to poor Frequent errors of spelling,
punctuation, capitalization,
paragraphing – poor handwriting –
meaning confused or obscured.
2 Very poor No mastery of conventions –
dominated by errors of spelling,
punctuation, capitalization,

paragraphing – handwriting
illegible – OR not enough to
evaluate.
SCORE:
Content + Organization + Vocabulary + Language Use + Mechanics = (TOTAL
SCORE)
Categorization of Scoring
Categorization Score
Excellent 80 – 90
Good 70 – 80
Fair 60 – 70
Poor 50 – 60

TIMELINE RESEARCH
Experimental Class (X MIPA 1)
No. Date Time Description
1.
2.
August 18 2015
August 25 2015
10.30-12.00
10.30-12.00
a. The teacher introduced herself and
delivered her purpose.
b. The teacher gave pre-test with this
command:
“Write 3 paragraphs (± 150 words)
about your MOST MEMORABLE
MOMENT in your life!”
c. The teacher gave explanation about
recount text (definition, structure,
purpose and kinds of recount text).
d. The teacher gave 5 different pictures to
5 groups in the class.
e. Students should complete the story by
completing the sentences given by the
teacher in each picture.
f. Randomly, the teacher showed the
pictures one by one on the screen. The
group which got the picture shown must
present their work.
a. The teacher told her story when she was
studying in the school, then the teacher
asked 2 students to tell their stories in
previous school (junior high school).
b. The teacher asked students to make a
group consisted of 5 students and gave
recount text without title.
c. Students were asked to find the generic

3.
4.
September 1 2015
September 8 2015
10.30-12.00
10.30-12.00
structure and to guess the title. After
that, they should draw what the text
about.
d. Each group presented their work but
firstly, they asked the other students to
guess the title of the picture they had
drawn.
a. The teacher discussed about the latest
issue – “selfie” to start the experiment
that students should write by looking
their own photographs.
b. The teacher asked students to choose
their photo in their gadget.
c. The students were asked to write short
story about the picture by paying
attention to these questions:
1. What did you do at that time?
2. Why did you do that?
3. Where were you?
4. When did you take the picture?
d. The teacher asked 2 students to tell their
story behind the photo in front of the
class. Some students (if they wanted)
showed the photo on the screen, then
told the story.
a. The teacher showed a photo that had
been taken in the previous meeting.
b. Students were asked to write what
happened in the class last week based on
the photo.
c. 2 students were asked to tell their

writing. After that, they chose 2 other
students to tell their writing.
d. The teacher gave post-test with this
command:
“Write 3 paragraphs (± 150 words) about
your MOST MEMORABLE MOMENT
in your life!”
Controlled Class (X MIPA 5)
No. Date Time Description
1.
2.
August 19 2015
August 26 2015
10.30-12.00
10.30-12.00
a. The teacher introduced herself and
delivered her purpose.
b. The teacher gave pre-test with this
command:
“Write 3 paragraphs (± 150 words)
about your MOST MEMORABLE
MOMENT in your life!”
c. The teacher gave explanation about
recount text (definition, structure,
purpose and kinds of recount text).
d. The teacher asked students to write
down an example of recount text.
Students were allowed to find it via
internet or borrow English books in the
library.
e. Students were asked to make a mark for
each feature of recount text on their text.
a. Students translated the text they had
written in the previous meeting.
b. The task was collected to the teacher.

3.
4.
September 2 2015
September 9 2015
10.30-12.00
10.30-12.00
a. The teacher showed recount text on the
screen and students were asked to find
the verbs 2.
b. The verbs 2 which students had found
should be used to make a sentence for
each verb. They were free to make
sentence by using the verbs.
c. Some students wrote their sentence on
the whiteboard.
a. The teacher gave a task in form of essay
questions.
b. Students were asked to answer those
questions based on the texts given.
c. Students should underline the verb 2 in
the texts.
d. The teacher gave post-test with this
command:
“Write 3 paragraphs (± 150 words) about
your MOST MEMORABLE MOMENT
in your life!”