using results chains to improve strategy effectiveness€¦ · using results chains to improve...
TRANSCRIPT

Using Results Chains to
Improve Strategy Effectiveness
An FOS How-To Guide
May 2007
Foundations of Success Improving the Practice of Conservation
www.FOSonline.org [email protected]

Contents What are Results Chains?........................................................................................................1 Why Results Chains Are Useful ..............................................................................................1
1. Discuss and Refine Their Theories of Change ................................................................1 2. Measure Effectiveness.....................................................................................................4 3. Develop a Common Framework for Cross-Site Learning...............................................4
When to Use Results Chains....................................................................................................5 How to Develop and Use Results Chains................................................................................5
Step 1. Construct an Initial Results Chain Based on Your Conceptual Model ...................6 Step 2. Complete the Links in the Results Chain ................................................................7 Step 3. Verify that Your Results Chain Meets Criteria of a Good Results Chain...............7 Step 4. Develop Key Results Into Good Objectives............................................................8 Step 5. Establish Indicators to Monitor the Effectiveness of Your Strategy.......................9 Step 6. Document Your Work ...........................................................................................10
Examples of Results Chains...................................................................................................10 Example 1. Strategies to Reduce Agricultural Expansion in Grasslands..........................10 Example 2. Strategy to Strengthen Law Enforcement to Reduce Illegal Fishing .............11
How Project Teams Have Used Results Chains...................................................................12 1. Results Chains Help Teams Discuss and Refine their Theories of Change ..................12 2. Results Chains Help Teams Measure Effectiveness .....................................................14 3. Results Chains Help Teams Develop a Framework for Cross-Site Learning ...............14
Some References .....................................................................................................................15 This guide is part of an ongoing series from Foundations of Success. Our aim is to help conservation practitioners design, manage, monitor, and learn from their work. This guide is based on the Adaptive Management principles and practices in the Conservation Measure Partnership’s Open Standards for the Practice of Conservation. Materials in this guide have been adapted from previous works produced by Foundations of Success and members of the Conservation Measures Partnership. To provide feedback or comments, you can contact Foundations of Success at [email protected]. Visit our website at www.FOSonline.org to download the most recent version of this guide. Please cite this work as:
Foundations of Success. 2007. Using Results Chains to Improve Strategy Effectiveness. An FOS How-To Guide. Foundations of Success, Bethesda, Maryland, USA.
This work is licensed under the Creative Commons Attribution-Noncommercial-Share Alike 3.0 License. To view a copy of this license, visit http://creativecommons.org/licenses/by-nc-sa/3.0/ or send a letter to Creative Commons, 171 Second Street, Suite 300, San Francisco, CA 94105, USA.

What are Results Chains? A results chain is a tool that shows how a project team believes a particular action it takes will lead to some desired result. More specifically, for conservation projects, a results chain represents a team’s assumptions about how project or program strategies will contribute to reducing important threats, leading to the conservation of priority targets. In essence, results chains are diagrams that map out a series of causal statements that link short-, medium-, and long-term results in an “if…then” fashion. As shown in Figure 1, there are three basic components of a results chain: a strategy, expected outcomes, and desired impact. Using these components, a project team can then go on to define objectives and goals that describe desired future outcomes and impacts, respectively (see Box 1 for a definition of these terms). Figure 1. The Basic Components of a Results Chain
Results chains are often derived from conceptual models. But they differ in that conceptual models show the state of the world before the project takes action, while a results chain shows the state of the world resulting from this action. Results chains are similar to the logic models used by many organizations, but results chains have the added benefit of showing more detail and the direct relationship between one result and another.
Why Results Chains Are Useful Results chains help conservation project teams accomplish three things:
1. Discuss and Refine Their Theories of Change Often, project teams implement strategies without really knowing for sure how these actions will lead to conservation. They rely on past experience, expert knowledge, or wishful thinking to guide their selection of strategies. Whatever the reason, they rarely formally state their assumptions about exactly how their strategies will achieve their desired outcomes and impacts. As shown in Figure 2, it is likely that they have many implicit assumptions about how their strategies will contribute to achieving conservation – these series of assumptions represent their “theory of change.” At the same time, it is not uncommon for members from the same team to hold different assumptions that they have not communicated with one another. Because the assumptions are not explicit, the project team cannot come to an agreement on their theory of change or test it and learn over time whether it is valid. Figure 2. Implicit Assumptions

2 Foundations of Success
For example, a team may decide that they will help build community capacity for forest resource management and that this will decrease illegal logging in indigenous communities and conserve the state of primary forest in those communities. But, how will they know if that has happened? They may assume that stronger community capacity will increase community knowledge about their rights, and with these rights, they will exert more control over external actors, including those responsible for the illegal logging. The team may also assume this control will result in more illegal wood confiscated and less illegal logging. It is quite likely, however, that they have not made their assumptions explicit – and that they are not testing them. As such, they have little chance of systematically testing whether their actions are contributing to less illegal logging and the conservation of primary forest. If, however, the team members make their assumptions explicit using a results chain as shown in Figure 3, then they can debate their theory of change both internally and with external stakeholders and advisors. They can see if the results they expected to see actually materialize. They can also look outside of their results chain to see if other external factors might be influencing the degree to which they are achieving their expected results. For
Box 1. An Overview of Terms Used to Describe Results There is a great deal of confusion over the different terms used to describe the results of a project. What one person calls an “outcome,” another calls a “result,” and yet a third person calls an “impact.” The following figure shows the terms as they are most commonly used by evaluation experts in different fields such as development and public health.
Based on the above figure, the following terms can be defined for use in results chains in biodiversity conservation projects:
• Strategies – The actions or interventions that a project implements.
• Outcome – The desired future state of a threat or opportunity factor. An objective is a formal statement of the desired outcome.
• Impact – The desired future state of a conservation target. A goal is a formal statement of the desired impact.
• Result – A generic term used to describe the desired future state of a target or factor. Includes impacts, outcomes, and outputs.
The above terms refer primarily to a sequence of results in a logical sense. There is also a sequence of results in a temporal sense:
• Final result – The ultimate desired result over time.
• Intermediate result – A milestone along the way to that final result.

Using Results Chains 3
instance, in the community capacity building example, there are many points at which this project team’s logic could break down – for example, just because the community has greater knowledge about its rights does not mean that they will take the next step and exert more control over illegal loggers. Perhaps there are security concerns that would prevent them from taking action. Or maybe they are able to reduce the amount of illegal selective logging that happens, but the government has just designated a block of forest for clear cutting. So, the primary forest would still not be conserved. This new knowledge may prompt the project team to revise their theory of change to take into consideration these other influences, or it may prompt the team to modify or abandon this strategy because it is not likely to be successful under the current conditions.
Figure 3. Results Chain for Community Capacity Building for Forest Resource Management
To be successful, a project must be based on both sound project theory – in other words, an accurate results chain – and good implementation. When a project does not produce desired results, people usually assume that the project team did not carry out the planned activities well enough. As shown in Figure 4, however, even when the project team does an excellent job implementing the project activities, they may still fail because the theory of change was wrong. Results chains can be used to help diagnose this theory failure once it has happened, or better yet, before the project is fully designed and implemented. Figure 4. Necessary Ingredients for Project Success

4 Foundations of Success
2. Measure Effectiveness Once a project team has come to agreement on their theory of change, they can use their results chain to define their project objectives and indicators needed to measure effectiveness. An objective is a desired result that is specific, measurable and time-bound (See FOS guidance on objectives for more detail, forthcoming at www.fosonline.org). Determining a project’s objectives is often a struggle for project teams. It is quite common for teams to try to develop objectives that are merely shorter-term versions of their goals. It is also quite common for teams to just try to brainstorm objectives without considering what should qualify as an objective. Results chains help teams avoid both of these common errors because they explicitly lay out all the results that a team should consider for setting objectives. Because objectives should be tied directly to results, the team should only set objectives for the results they specified in their results chains. Thus, results chains help teams narrow down a huge universe of potential objectives to those that will help them determine if their theories of change hold. For example, returning to the chain in Figure 3, if a project team wants to achieve the result of “more indigenous knowledge about rights,” they can convert this result into an objective by specifying who needs to have more knowledge (how many individuals and communities), what knowledge they need to have, and by when. They can then identify indicators to measure whether or not they achieve this desired change. Establishing objectives and indicators along the chain will set the project team up to collect the data needed to test their assumptions and learn whether their theory of change is valid. In addition to project-cycle monitoring, results chains are also useful to help set up more formal experimental monitoring designs where appropriate. By laying out hypotheses in a results chain, project teams and researchers can then develop and implement the appropriate research design to test these hypotheses.
3. Develop a Common Framework for Cross-Site Learning Finally, results chains can help practitioners learn across sites. Project teams working in different sites are often implementing the same strategies and have common assumptions about how these strategies will contribute to conservation. Results chains can provide a framework for defining and testing these common assumptions and learning about the conditions under which a strategy is or is not effective, and why. For example, two projects operating in different parts of the country or even the world might be using a similar community capacity building strategy for forest resource management to ultimately influence the direct threat of illegal selective logging and ensure the conservation of primary forest (Figure 5). Project A is using the strategy to help indigenous communities understand their legally-granted rights and assert these rights The team assumes this will lead to greater control over external actors and this, in turn, will help communities confiscate illegal wood, thus reducing illegal selective logging and conserving the primary forest. Project B is using the community capacity building strategy to train indigenous community members to enforce forestry laws. Trained members would then work directly with government enforcement officials to enforce forestry laws. As with Project A, the team

Using Results Chains 5
assumes this would lead to more control and vigilance over external actors, more illegal wood confiscated, and less illegal selective logging. As Figure 5 illustrates, these two projects operating at separate sites share many assumptions in common. By explicitly laying out those assumptions in a results chain, they would have a framework for defining and testing the common assumptions and learning about the conditions under which this community capacity building strategy is or is not effective, and why. Figure 5. Overlap in Results Chains for Community Capacity Building in 2 Projects
Community capacity
building for forest resource management
Greater control of &
vigilance over external actors
More illegal wood
confiscated
Less illegal selective logging
in indigenous communities
Greater indigenous knowledge about rights
Communities assist gov’t in enforcement
efforts
Community capacity
building for forest resource management
Greater control of &
vigilance over external actors
More illegal wood
confiscated
Less illegal selective logging
in indigenous communities
Communities capable of enforcing
forest laws
Community capacity
building for forest resource management
Greater control of &
vigilance over external actors
More illegal wood
confiscated
Less illegal selective logging
in indigenous communities
Project A
Project B
Overlap in Results from
Projects A & B
Primary forest
conserved
Primary forest
conserved
Primary forest
conserved
When to Use Results Chains Results chains are an important tool to use in Developing Your Action Plan (Step 2A of the CMP Open Standards for the Practice of Conservation). In particular, results chains help you make your assumptions explicit about how your strategies will help you achieve your conservation results. You will also use the results chains for Designing Your Monitoring Plan (Step 2B) and for the Analyze, Use and Adapt step (Step 4), when you will analyze the extent to which you have achieved your goals and objectives and why you have or have not seen progress. If you have implemented your project as planned but have not achieved your desired results, you should examine what assumptions in the results chain may not be valid and make necessary changes to strengthen your project theory. The results chains will also be important inputs for external evaluations (Step 5C), because they define your project theory, which provides evaluators with a framework for measuring the progress of your project.
How to Develop and Use Results Chains The following outlines the basic steps for completing a results chain. This guide assumes that you have already developed a conceptual model for your project and prioritized your direct threats (see forthcoming guidance for Steps 1C and 1D, available from www.fosonline.org). It also assumes that you have selected from your conceptual model a conservation target, direct threat, and strategy for which you want to develop a results chain. To illustrate how to develop and use results chains, we will use a fictitious example, based on a watershed site. We will focus on the threat of harvesting of sturgeon for caviar, which was ranked as a very high threat to sturgeon. As shown in Figure 6, the Blue River watershed project team has decided to organize a media campaign to influence the critical factor of

6 Foundations of Success
“traditions and consumer preferences” that drives the demand for caviar and harvesting of sturgeon. We will develop a results chain for this media campaign strategy. In workshop settings, it is best to develop results chains using index cards and a sticky board or flipchart paper and Post-it notes. The final product can then be captured using Miradi (see Box 2), MS Visio, PowerPoint, or another flow-charting software program as outlined below.
Step 1. Construct an Initial Results Chain Based on Your Conceptual Model Start by developing a very simple (and probably incomplete) chain, based on the relevant factors in your conceptual model. To do this, you will just need to convert these factors into results. Factors are neutral (e.g., government fisheries policies) or may be negative (e.g., weak institutional capacity), whereas results are stated as desired changes in these factors (e.g., strengthened capacity to enforce fisheries regulations). A very simple results chain based on our watershed example is shown in Figure 7. Figure 7. Factors from a Conceptual Model Converted into an Initial Results Chain
Figure 6. One Strategy and Chain of Factors in a Conceptual Model
Using Results Chains 7
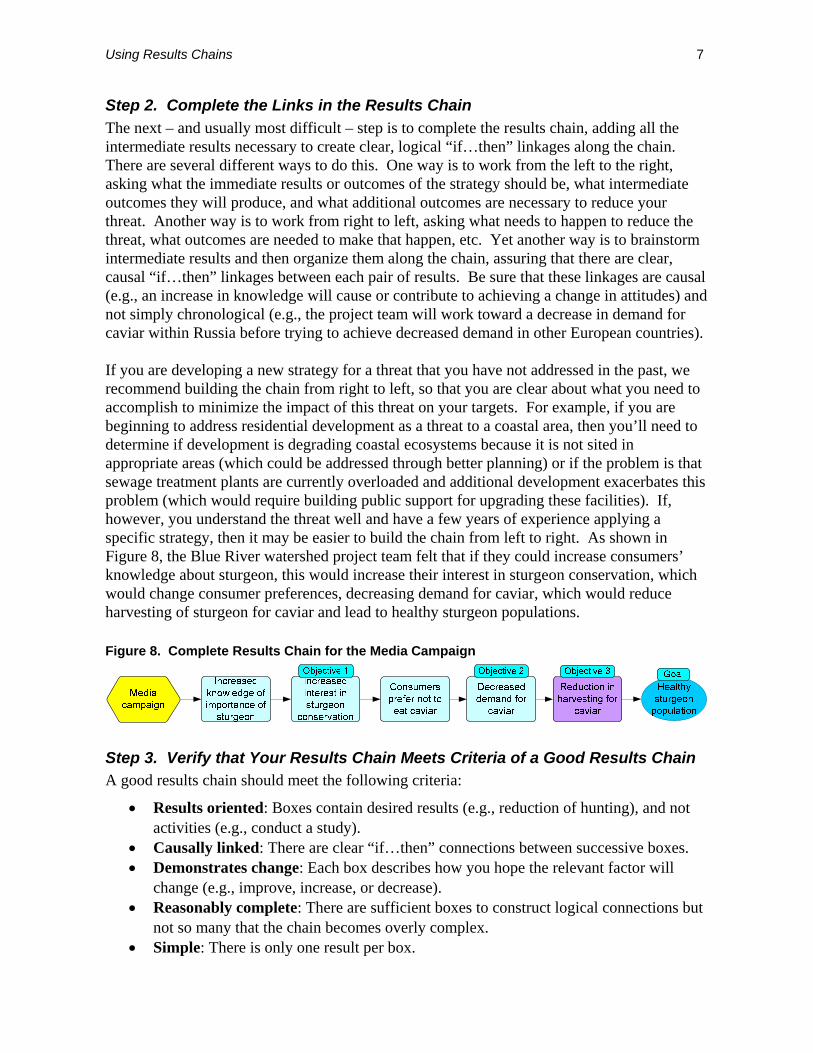
Step 2. Complete the Links in the Results Chain The next – and usually most difficult – step is to complete the results chain, adding all the intermediate results necessary to create clear, logical “if…then” linkages along the chain. There are several different ways to do this. One way is to work from the left to the right, asking what the immediate results or outcomes of the strategy should be, what intermediate outcomes they will produce, and what additional outcomes are necessary to reduce your threat. Another way is to work from right to left, asking what needs to happen to reduce the threat, what outcomes are needed to make that happen, etc. Yet another way is to brainstorm intermediate results and then organize them along the chain, assuring that there are clear, causal “if…then” linkages between each pair of results. Be sure that these linkages are causal (e.g., an increase in knowledge will cause or contribute to achieving a change in attitudes) and not simply chronological (e.g., the project team will work toward a decrease in demand for caviar within Russia before trying to achieve decreased demand in other European countries). If you are developing a new strategy for a threat that you have not addressed in the past, we recommend building the chain from right to left, so that you are clear about what you need to accomplish to minimize the impact of this threat on your targets. For example, if you are beginning to address residential development as a threat to a coastal area, then you’ll need to determine if development is degrading coastal ecosystems because it is not sited in appropriate areas (which could be addressed through better planning) or if the problem is that sewage treatment plants are currently overloaded and additional development exacerbates this problem (which would require building public support for upgrading these facilities). If, however, you understand the threat well and have a few years of experience applying a specific strategy, then it may be easier to build the chain from left to right. As shown in Figure 8, the Blue River watershed project team felt that if they could increase consumers’ knowledge about sturgeon, this would increase their interest in sturgeon conservation, which would change consumer preferences, decreasing demand for caviar, which would reduce harvesting of sturgeon for caviar and lead to healthy sturgeon populations. Figure 8. Complete Results Chain for the Media Campaign
Step 3. Verify that Your Results Chain Meets Criteria of a Good Results Chain A good results chain should meet the following criteria:
• Results oriented: Boxes contain desired results (e.g., reduction of hunting), and not activities (e.g., conduct a study).
• Causally linked: There are clear “if…then” connections between successive boxes. • Demonstrates change: Each box describes how you hope the relevant factor will
change (e.g., improve, increase, or decrease). • Reasonably complete: There are sufficient boxes to construct logical connections but
not so many that the chain becomes overly complex. • Simple: There is only one result per box.

8 Foundations of Success
For this step, you should review these criteria and make sure your results chain meets them. In particular, you want to make sure that your results chain is results oriented. A common mistake with developing results chains is to list all the activities that your team must undertake to implement your strategy (see Figure 9 for an example). This produces an implementation chain, not a results chain. An implementation chain does not show the causal logic that connects a strategy to a desired conservation impact. As such, it does not provide you with the assumptions you need to test to know whether your strategy is working or not. Figure 9. Example of an Implementation Chain, NOT a Results Chain
Identify target audience
Media campaign
Distribute educational materials
Produce educational materials
Monitor & evaluate the campaign’s
effectiveness
Healthy sturgeon
population
Step 4. Develop Key Results Into Good Objectives Each result in your results chains is a potential place where your team could set an objective. Obviously, you do not want to have objectives for all results. If, however, you know certain results are necessary for the assumptions behind your strategy to hold, then you have a good idea of where you need to set your objectives – they should be tied to key results in your results chains. You and your team will have to use your judgment to determine which results in your chain are particularly important and set objectives for these results. At a minimum, you should try to choose results for which if you don’t see a change, the rest of the chain will not hold. In addition, you should always establish a threat reduction objective (attached to the purple box) and it is generally advisable to have objectives at various points along the chain. Figure 10 shows which results the team considered key results and, consequently, where they decided to set their objectives. Figure 10. Example of Objectives Linked to the Results Chain It is important to pay attention to the timing of the objectives along the chain. In this example, the project team plans to reduce demand for caviar by 2010. Harvesting of sturgeon is driven by demand for caviar, so it will not be possible to reduce harvesting of sturgeon until after demand for caviar decreases. With this timing in mind, the objective for reducing harvesting of sturgeon for caviar is set for 2012. As a general rule, once you have developed your draft objectives, you should review them to make sure that they meet all the criteria for a good objective:
• Results Oriented − Specifies necessary changes in critical threats and other factors that affect one or more project goals
Consumers prefer not to eat caviar
Media campaign
Reduction in harvesting for
caviar
Decreased demand for
caviar
Increased knowledge of importance of
sturgeon
Increased interest in sturgeon
conservation
Occurs 2007 Occurs 2008 Occurs 2010 Occurs 2010 Occurs 2012 Occurs 2017
Objective 3Objective 1 Objective 2
Healthy sturgeon
population
Goal

Using Results Chains 9
• Time Limited − Achievable within a specific period of time
• Measurable − Definable in relation to some standard scale (numbers, percentage, fractions, or all/nothing states)
• Specific − Clearly defined so that all people involved in the project have the same understanding of what the terms in the objective mean
• Practical − Achievable and appropriate within the context of the project site In the Blue River example, the project team developed the following objectives, linked to their chain:
Objective 1. By 2008, at least 70% of the target population in 8 major European cities is supportive of existing laws to conserve Russian sturgeon.
Objective 2. By 2010, the number of kilos of Russian caviar sold annually in these 8 major European cities has decreased at least 30%.
Objective 3. By 2012, the average monthly sturgeon harvest in the Blue River watershed has decreased at least 30%.
Additional guidance for developing objectives and goals is forthcoming and may be found at www.fosonline.org.
Step 5. Establish Indicators to Monitor the Effectiveness of Your Strategy Once you have developed your results chain and linked objectives and goals to it, it should be fairly easy to identify what indicators you should use to monitor the effectiveness of your strategy. By developing results chains and setting good goals and objectives, you have narrowed down a nearly infinite set of potential indicators to a very manageable set. Below are example indicators developed for each of the objectives for the media campaign to reduce harvesting of sturgeon. Because these objectives are specific and measurable, the indicators are taken directly from the objectives. Additional guidance for defining indicators and developing monitoring plans is forthcoming and may be found at www.fosonline.org.
Objective 1. By 2008, at least 70% of the target population in 8 major European cities is supportive of existing laws to conserve Russian sturgeon.
Indicator: % of the target population in 8 major European cities that are supportive of existing laws to conserve Russian sturgeon
Objective 2. By 2010, the number of kilos of Russian caviar sold annually in these 8 major European cities has decreased at least 30%.
Indicator: # of kilos of Russian caviar sold annually in these 8 major European cities
Objective 3. By 2012, the average monthly sturgeon harvest in the Blue River watershed has decreased at least 30%.
Indicator: # of sturgeon harvested monthly in the Blue River watershed
10 Foundations of Success
Step 6. Document Your Work Once the group is happy with the results chain, then you should capture what you have done using a computer flow-chart program. Software programs you can use include:
• Miradi Adaptive Management Software – Software that the Conservation Measures Partnership is designing to help practitioners complete all of the steps in the adaptive management cycle. It includes diagramming software that facilitates the design of conceptual models and results chains. See Box 2.
• Visio – Commercial diagramming software with features that facilitate flow charts such as results chains.
• Word or PowerPoint – You can use the drawing features in Microsoft Word or PowerPoint to create results chains, but they tend to be more time-consuming and less user-friendly than the features in Visio or Miradi.
In addition to digitizing the results chain and linking your objectives and indicators to it, you may also want to write a few paragraphs describing the chain. This text will help others who did not participate in the discussion to understand your assumptions, and it will also serve the purpose of formally documenting group discussions and decisions.
Examples of Results Chains In this section, we provide some examples of results chains developed by real project teams. In most cases, we have made a few minor changes to the chains to remove site-specific elements and make them easier to understand.
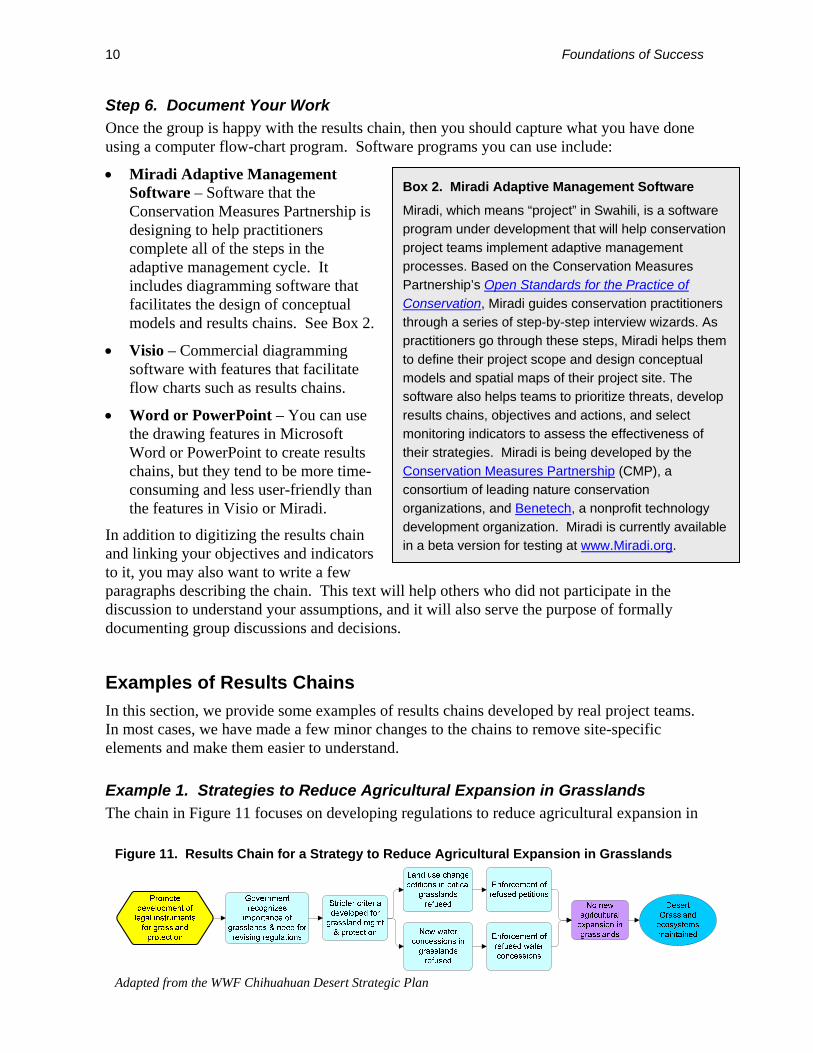
Example 1. Strategies to Reduce Agricultural Expansion in Grasslands The chain in Figure 11 focuses on developing regulations to reduce agricultural expansion in
Box 2. Miradi Adaptive Management Software
Miradi, which means “project” in Swahili, is a software program under development that will help conservation project teams implement adaptive management processes. Based on the Conservation Measures Partnership’s Open Standards for the Practice of Conservation, Miradi guides conservation practitioners through a series of step-by-step interview wizards. As practitioners go through these steps, Miradi helps them to define their project scope and design conceptual models and spatial maps of their project site. The software also helps teams to prioritize threats, develop results chains, objectives and actions, and select monitoring indicators to assess the effectiveness of their strategies. Miradi is being developed by the Conservation Measures Partnership (CMP), a consortium of leading nature conservation organizations, and Benetech, a nonprofit technology development organization. Miradi is currently available in a beta version for testing at www.Miradi.org.
Figure 11. Results Chain for a Strategy to Reduce Agricultural Expansion in Grasslands
Adapted from the WWF Chihuahuan Desert Strategic Plan
Using Results Chains 11
priority desert grasslands. As this example shows, a results chain can include more than one chain. This chain includes one branch leading to the refusal of land use change petitions in priority grasslands and another branch leading to the refusal of new water concessions (which make it possible to use the grasslands for agriculture).
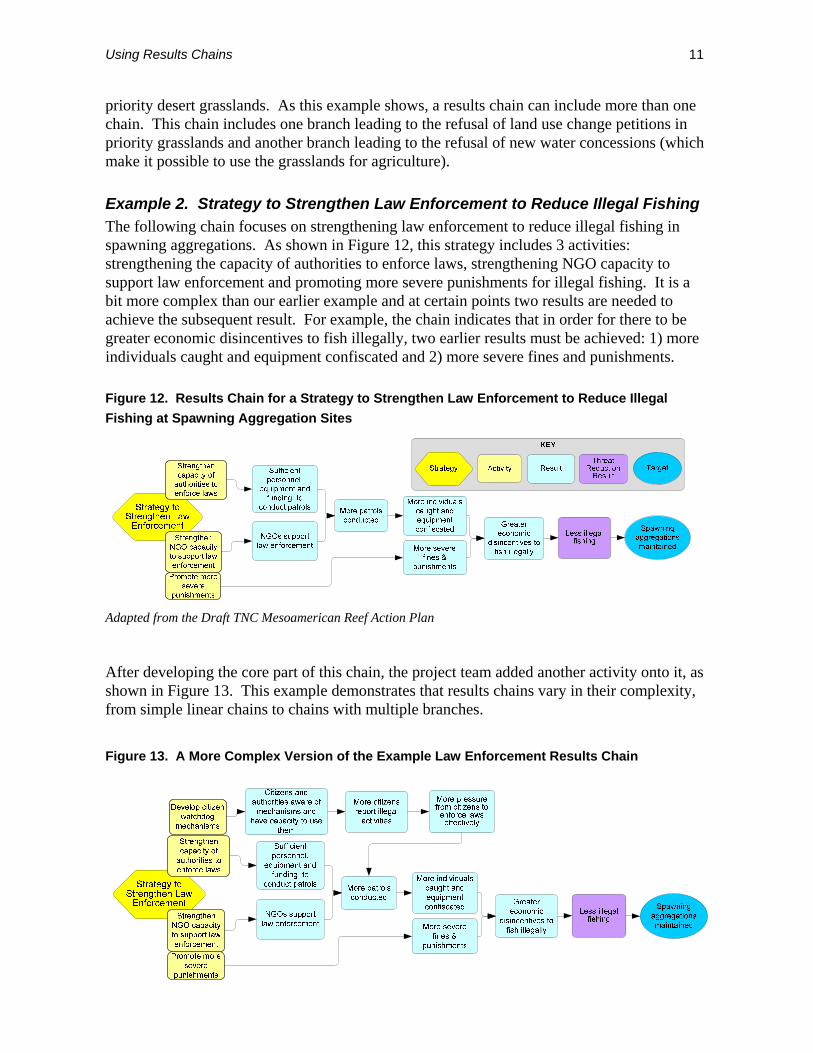
Example 2. Strategy to Strengthen Law Enforcement to Reduce Illegal Fishing The following chain focuses on strengthening law enforcement to reduce illegal fishing in spawning aggregations. As shown in Figure 12, this strategy includes 3 activities: strengthening the capacity of authorities to enforce laws, strengthening NGO capacity to support law enforcement and promoting more severe punishments for illegal fishing. It is a bit more complex than our earlier example and at certain points two results are needed to achieve the subsequent result. For example, the chain indicates that in order for there to be greater economic disincentives to fish illegally, two earlier results must be achieved: 1) more individuals caught and equipment confiscated and 2) more severe fines and punishments. Figure 12. Results Chain for a Strategy to Strengthen Law Enforcement to Reduce Illegal Fishing at Spawning Aggregation Sites
Adapted from the Draft TNC Mesoamerican Reef Action Plan After developing the core part of this chain, the project team added another activity onto it, as shown in Figure 13. This example demonstrates that results chains vary in their complexity, from simple linear chains to chains with multiple branches.
Figure 13. A More Complex Version of the Example Law Enforcement Results Chain

12 Foundations of Success
How Project Teams Have Used Results Chains In this section, we discuss how project teams have used results chains to increase their effectiveness.
1. Results Chains Help Teams Discuss and Refine their Theories of Change As stated above, results chains can help teams to discuss their assumptions openly and either reach agreement on shared assumptions or agree to disagree on certain parts of their theory of change. For example, most conservation enterprise projects are based on a common set of assumptions about activities increasing the income of project beneficiaries and this increase in income contributing to biodiversity conservation. It can be difficult, however, to define specifically how increased income contributes to greater biodiversity conservation. Figure 14 shows a results chain produced by a real-world conservation project team working on the management, marketing and sale of Brazil nuts (a non-timber forest product). The team developed their chain working from both the left and the right side of the chain. On the left-hand side of the chain, project interventions would lead to higher quality Brazil nuts, which would be worth more and lead to increased income for the Brazil nut harvesters. On the right-hand side of the chain, the team was trying to reduce agricultural encroachment into primary forest. In the middle, their initial chain included a gap. They had a hard time defining exactly how higher income would contribute to less agricultural encroachment. Figure 14. Initial Results Chain for Improving the Management of Brazil Nut Forests
The team hoped the Brazil nut harvesters’ higher income would improve their quality of life, which would increase the nut harvesters’ recognition of the economic value of intact forest, and thus increase their commitment to forest conservation and management (Figure 15). They were concerned, however, that higher income could have unintended outcomes. Because Brazil nut harvesters only work harvesting the nuts for about 3 months each year, they depend on other sources of income during the other 9 months of the year. Increasing their income could cause them to invest money in an activity that isn’t compatible with forest conservation. For example, they could decide to buy some cattle and clear little patches of forest to create pasture (in remote areas of Latin America, people often invest their savings in cattle instead of banks). Building a results chain helped this team talk about desirable and undesirable outcomes and how to increase the probability that their actions would lead to forest conservation. The team agreed that they needed to understand better who was responsible for most of the current forest encroachment, as well as what the Brazil nut harvesters do during the 9 months of the year that they are not harvesting nuts. They discussed the need to work with the harvesters to develop forest management plans that include not only Brazil nut management but also other sustainable resource use activities.

Using Results Chains 13
Figure 15. Positive and Negative Results from Improving the Management of Brazil Nut Forests
Greater recognition of
forest’s economic value
Less conversion of forest to ag
Higher quality brazil nut
Higher income
Local people committed to forest mgmt
Higher quality of
life
Brazil nut mgmt plan
More people buy cattle (as
savings)
More conversion of
forest to pasture
Mgmt plans implemented
Brazil nut forest
conserved
Less Brazil Nut Forest
Adapted from the WWF Strategic Plan for the Manuripi Reserve, Bolivia As an extreme example of results chains influencing strategy implementation, some teams have used results chains to discuss the likelihood that a strategy will be successful and have decided that it is not worthwhile to invest in that strategy. For example, one ecoregional project team in Africa determined that conversion of forest to agricultural land was a very high threat to two of their conservation targets. They discussed different possible strategies for addressing agricultural encroachment, one of which was sustainable agriculture. But after spending a couple of hours building a more detailed version of a sustainable agriculture chain than what is shown in Figure 16, they determined that many organizations have been investing in sustainable agriculture in Africa for the past several decades, and there is no evidence to show that increased yields, more permanent crops, or increased income will lead to less conversion of forest to agriculture. They decided not to implement this strategy, because they did not believe it would be effective. Their conclusion was that it is better to invest a few hours discussing assumptions and theories of change and deciding that a specific strategy is unlikely to be effective, rather than investing several years and many thousand dollars implementing projects that are unlikely to contribute to conservation. Figure 16. Results Chain for Using Sustainable Agriculture to Reduce Forest Conversion
14 Foundations of Success
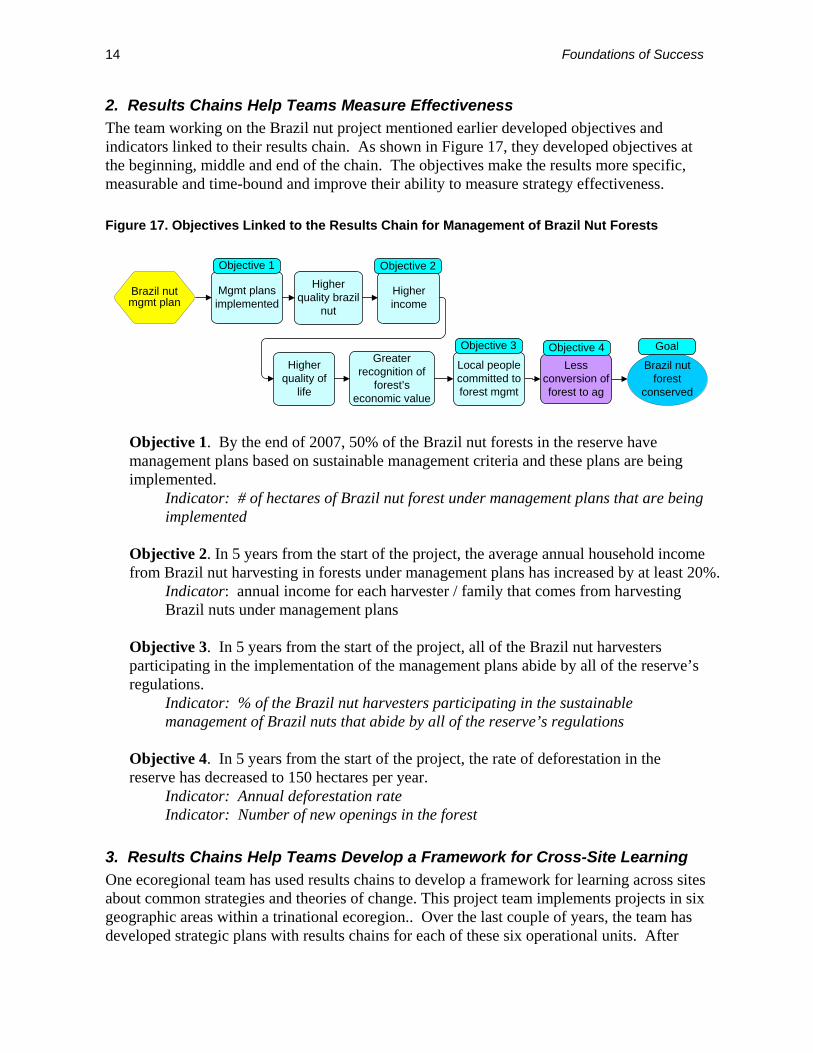
2. Results Chains Help Teams Measure Effectiveness The team working on the Brazil nut project mentioned earlier developed objectives and indicators linked to their results chain. As shown in Figure 17, they developed objectives at the beginning, middle and end of the chain. The objectives make the results more specific, measurable and time-bound and improve their ability to measure strategy effectiveness. Figure 17. Objectives Linked to the Results Chain for Management of Brazil Nut Forests
Greater recognition of
forest’s economic value
Less conversion of forest to ag
Higher quality brazil
nut
Higher income
Local people committed to forest mgmt
Higher quality of
life
Brazil nut mgmt plan
Objective 2
Objective 4
Mgmt plans implemented
Objective 3
Objective 1
Brazil nut forest
conserved
Goal
Objective 1. By the end of 2007, 50% of the Brazil nut forests in the reserve have management plans based on sustainable management criteria and these plans are being implemented.
Indicator: # of hectares of Brazil nut forest under management plans that are being implemented
Objective 2. In 5 years from the start of the project, the average annual household income from Brazil nut harvesting in forests under management plans has increased by at least 20%.
Indicator: annual income for each harvester / family that comes from harvesting Brazil nuts under management plans
Objective 3. In 5 years from the start of the project, all of the Brazil nut harvesters participating in the implementation of the management plans abide by all of the reserve’s regulations.
Indicator: % of the Brazil nut harvesters participating in the sustainable management of Brazil nuts that abide by all of the reserve’s regulations
Objective 4. In 5 years from the start of the project, the rate of deforestation in the reserve has decreased to 150 hectares per year.
Indicator: Annual deforestation rate Indicator: Number of new openings in the forest
3. Results Chains Help Teams Develop a Framework for Cross-Site Learning One ecoregional team has used results chains to develop a framework for learning across sites about common strategies and theories of change. This project team implements projects in six geographic areas within a trinational ecoregion.. Over the last couple of years, the team has developed strategic plans with results chains for each of these six operational units. After

Using Results Chains 15
developing these plans, the trinational ecoregional team decided to examine all of their plans together and identify common strategies and assumptions that could serve as the basis for cross-site learning. The team identified four common strategies: protected areas management, forest management, fisheries management, and enforcement of natural resource management regulations. For each of these strategies, they took their existing results chains and boiled them down to the elements that were common to all of the sites. In this way, they produced one results chain per strategy that contains assumptions common to several or all of the sites. These chains represent their framework for cross-site learning. Figure 18 shows one of their common results chains. The trinational team has identified indicators linked to each of the four results chains, and they are beginning to monitor the effectiveness of these shared strategies across their sites. Figure 18. Results Chain for Cross-Site Learning about Protected Area Management
Adapted from the WWF Southwest Amazon Cross-site Learning Framework
Some References CMP. 2007. Open Standards for the Practice of Conservation. Conservation Measures
Partnership. Available at www.conservationmeasures.org.
Margoluis, Richard, and Nick Salafsky. 1998. Measures of Success: Designing, Managing, and Monitoring Conservation and Development Projects. Chapter 6. Island Press, Washington, D.C.
W.K. Kellogg Foundation. Updated January 2004. Logic Model Development Guide: Using Logic Models to Bring Together Planning, Evaluation & Action. Battle Creek, Michigan. http://www.wkkf.org/Pubs/Tools/Evaluation/Pub3669.pdf.