the effect of tube diameter on vertical two-phase flow...
TRANSCRIPT

1
The Effect of Tube Diameter on Vertical Two-phase Flow
Regimes in Small Tubes
L. Chen1 Y. S. Tian
2 and T. G. Karayiannis
1*
1. School of Engineering and Design, Brunel University, West London, Uxbridge,
Middlesex, U.K., UB8 3PH
E-mail: [email protected]
2. Aspentech Inc., 90 Milton Park, Abington, Oxfordshire, OX14 4RY, U.K.
E-mail: [email protected]
ABSTRACT
Flow boiling flow patterns in four circular tubes with internal diameters of 1.10, 2.01,
2.88 and 4.26 mm were investigated in the present project. The experiments were
conducted in vertical upward two-phase flow using R134a as the working fluid. The
observed flow patterns include dispersed bubble, bubbly, confined bubble, slug,
churn, annular and mist flow. The flow characteristics in the 2.88 and 4.26 mm tubes
are similar to those typically described in normal size tubes. The smaller diameter
tubes, 1.10 and 2.01 mm, exhibit strong “small tube characteristics” as described in
earlier studies. The sketched flow maps show that the transition boundaries of slug-
churn and churn-annular depend strongly on diameter. On the contrary, the dispersed
bubble to churn and bubbly to slug boundaries are less affected. The transition
boundaries are compared with existing models for normal size tubes showing poor
agreement.
Keywords: flow patterns, two-phase flow, small diameter, vertical.
INTRODUCTION
The literature review carried out as part of this project revealed that there are a
number of vague statements and discrepant results in the reported studies of two-
* Corresponding author

2
phase flow regimes in small channels, which need further experimental work and
theoretical investigation. To start with, the classification of normal, small and micro
channels is not as yet well defined. Currently, the lack of general agreement on this
issue makes the comparison between the experiments difficult, especially when using
different fluids or at different experimental conditions. Engineers used to regard tube
diameters in the order of centimetre and millimetre as normal and small-scale tubes
respectively. Now many researchers think the criterion ought to be based on the
combination of channel size and fluid thermo-hydraulic properties rather than only on
channel dimension. Kew and Cornwell [1] reported that two-phase flow exhibits
different flow and heat transfer characteristics when the Confinement Number,
Co=( gD2)1/2
, is greater than 0.5. For instance, isolated bubbles prevail when
Co>0.5 and form a typical flow regime in small tubes, i.e. confined bubble flow.
Brauner and Moalem-Maron [2] recommended Eötvös number, defined as
Eö=(2 )2
gD2, as the criterion indicating confinement effects. They stated that
surface tension dominates when Eö>1 and this marks the boundary for small
passages. Triplett et al. [3] found that stratified flow became impossible when Eö>100
in their experiments indicating size effects. Akbar et al. [4] summarized the previous
studies and concluded that the buoyancy effect can be negligible when the Bond
number, Bo=( gD2/ )
1/2, is less than 0.3 for which condition the flow regimes are
insensitive to the channel orientation. In fact, all classification numbers, Co, Eö and
Bo, consider the effect of fluid density, surface tension and channel size on two-phase
flow. Table 1 illustrates the different results given by the above three criteria, i.e. the
size of a tube that indicates deviation from normal size behaviour. The discrepancy is
quite large especially if Eö=1 is included. For example, as seen in the table, for the
air/water mixture the criteria give a range from 0.81 to 17.1 mm. Note that the
diameter corresponding to Co=0.5 is 6.66 times that based on Bo=0.3. Similarly the
diameter is proportional to Eö-1/2
so changing the criterion Eö=100 to Eö=1 increase
the critical diameter by a factor of 10. Therefore, the need for further work to clarify
and conclude on the classification of normal and small size tubes is obvious. The
distinction between small diameter channels, minichannels and microchannels based
on heat transfer results, is not clearly established in the literature, Kandlikar [5]. He
reviewed the developments and application of flow boiling in channels and summed
up that: 3 mm may be the lower limit for the hydraulic diameters of the conventional

3
evaporator tubes; channels employing hydraulic diameter between 200 m and 3 mm
maybe referred to as minichannels; tubes with 10 to 200 m hydraulic diameter could
be considered as microchannels. This is of course a general classification and further
verification and adoption maybe needed.
Table 1. The different criteria for small tubes
Parameters Air / water R-134a
Pressure (MPa) 0.10 0.60 1.00 1.40
Temperature (oC) 25.0 21.6 39.4 52.5
Critical Diameter (mm)
Criterion based on Eö=1 17.1 5.3 4.7 4.3
Criterion based on Co=0.5 5.4 1.7 1.5 1.4
Criterion based on Eö=100 1.71 0.53 0.47 0.43
Criterion based on Bo=0.3 0.81 0.25 0.23 0.20
In addition to the above, there is also inconsistency on the identification of flow
patterns. Some flow maps sketched by different researchers may be dissimilar even
though they used similar tubes under similar conditions. Figure 1 compares the
vertical upward flow maps by Oya [6], Barnea et al. [7], Fukano and Kariyasaki [8],
and Mishima and Hibiki [9]. The disagreements are obvious. For example, large
differences exist at the transition boundaries of dispersed bubble (or bubble) flow to
intermittent flow and the transition boundary of intermittent to annular flow predicted
by Barnea et al. and the rest of the researchers. Furthermore, the flow pattern
descriptions presented by different researchers show variations. Oya preferred a detail
classification. He reported simple bubble, granular-lumpy bubble, simple slug, fish-
scale type slug, piston, long piston, froth and annular in his experiments. From his
description and sketch, simple bubble and granular-lumpy bubble are bubble flow and
the other, except annular, are intermittent flow. In the flow map reported by Barnea et
al. the flow patterns were classed as dispersed bubble, elongated bubble, slug, churn
and annular. They grouped elongated bubble, slug and churn as intermittent flow.
Mishima and Hibiki’s classification is similar to that of Barnea et al.. They used
bubbly flow instead of the dispersed flow and elongated bubble in Barnea et al..
Fukano and Kariyasaki described only three flow patterns: dispersed bubble,
intermittent and annular flow. Therefore, the experimental results can hardly be

4
recognized or compared since there is no accepted benchmark among these
researchers.
Figure 1. Comparison of the air-water vertical upward flow maps at room condition.
The factors affecting flow patterns are numerous and complex. In addition, the
identification of flow patterns maybe greatly affected by the observer’s subjectivity
and the experimental technique employed. The transition from one flow pattern to
another may be abrupt but in most cases it is a gradual development process in which
case the transition boundary becomes a transition zone. Within the transition zone the
flow patterns possess characteristics of more than one of the flow patterns. Although
there are arguments on the classification of flow patterns, most researchers agreed to
categorise flow patterns into four main classes: stratified flow, intermittent flow,
annular flow and bubble flow. Each main class could be subdivided into subclasses.
Table 2 lists the typical descriptions for two-phase flow patterns in normal and small
tubes. Similar to normal size tubes, the observed flow patterns in small tubes in the
earlier studies could be placed in the abovementioned four main classes. However, on
close observation, the flow patterns in small tubes exhibit different characteristics. For
example, comparing with normal size tubes, stratified smooth flow is hardly observed
in small channels whilst confined bubble flow emerges gradually in small channels
5
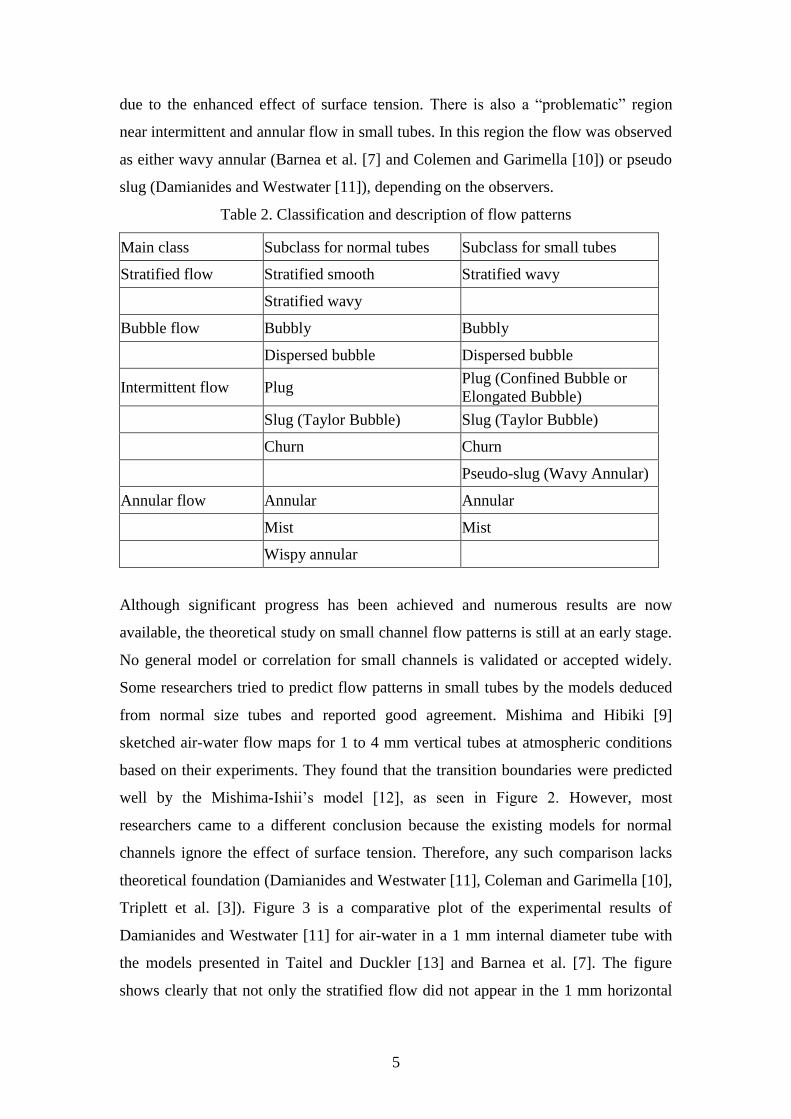
due to the enhanced effect of surface tension. There is also a “problematic” region
near intermittent and annular flow in small tubes. In this region the flow was observed
as either wavy annular (Barnea et al. [7] and Colemen and Garimella [10]) or pseudo
slug (Damianides and Westwater [11]), depending on the observers.
Table 2. Classification and description of flow patterns
Main class Subclass for normal tubes Subclass for small tubes
Stratified flow Stratified smooth Stratified wavy
Stratified wavy
Bubble flow Bubbly Bubbly
Dispersed bubble Dispersed bubble
Intermittent flow Plug Plug (Confined Bubble or
Elongated Bubble)
Slug (Taylor Bubble) Slug (Taylor Bubble)
Churn Churn
Pseudo-slug (Wavy Annular)
Annular flow Annular Annular
Mist Mist
Wispy annular
Although significant progress has been achieved and numerous results are now
available, the theoretical study on small channel flow patterns is still at an early stage.
No general model or correlation for small channels is validated or accepted widely.
Some researchers tried to predict flow patterns in small tubes by the models deduced
from normal size tubes and reported good agreement. Mishima and Hibiki [9]
sketched air-water flow maps for 1 to 4 mm vertical tubes at atmospheric conditions
based on their experiments. They found that the transition boundaries were predicted
well by the Mishima-Ishii’s model [12], as seen in Figure 2. However, most
researchers came to a different conclusion because the existing models for normal
channels ignore the effect of surface tension. Therefore, any such comparison lacks
theoretical foundation (Damianides and Westwater [11], Coleman and Garimella [10],
Triplett et al. [3]). Figure 3 is a comparative plot of the experimental results of
Damianides and Westwater [11] for air-water in a 1 mm internal diameter tube with
the models presented in Taitel and Duckler [13] and Barnea et al. [7]. The figure
shows clearly that not only the stratified flow did not appear in the 1 mm horizontal

6
tube but also all transition boundaries cannot be predicted properly by the Taitel-
Dukler model [13] and the Taitel modified model [7].
○ bubbly ● bubbly-slug ∆ slug □ churn ■ churn-annular ◇ annular
Figure 2. Comparison by Mishima and Hibiki [9] of their experimental results for
upward vertical flow with the model of Mishima-Ishii [12].
Figure 3. Comparison between the 1 mm horizontal air-water flow map at
atmospheric condition from Damianides and Westwater [11] and the models from
Taitel and Dukler [13] and Barnea et al. [7].

7
In traditional flow maps the transition boundaries are identified based on the gas-
liquid interface configuration. However, a few flow regimes for small tubes as well as
in experiments in microgravity were depicted based on force analysis in recent
reports. Akbar et al. [4] divided the entire flow map for small tubes into four regions:
(1) Surface tension-dominated region, which included bubbly, plug and slug (2)
Inertia-dominated zone 1, which included annular and wavy-annular regimes (3)
Inertia-dominated zone 2, for the dispersed flow regime (4) Transition zone. They
proposed semi-experimental correlations for regime predictions based on the above
criteria and the previous experimental data in small channels, see Table 3. The
correlations use the Weber Number, Wels= luls2D/ and Wegs= gugs
2D/ see also
nomenclature, as the reference parameter which represents the ratio of surface tension
and inertial force. The sketched transition boundaries agreed with the relevant data for
air-water like fluid in circular and near-circular small tubes with ~ 1 mm hydraulic
diameter at room conditions except the data of Mishima et al. [14]. The results are
compared in Figure 4. The authors suggested that the general applicability of the
correlation needed further validation.
Figure 4. The comparison between the correlations proposed by Akbar et al. [4] and
the experimental data for circular and near-circular channels with ~1 mm diameter.

8
Table 3. The semi-experiential correlations for small tubes, Akbar et al. [4].
Flow Regime Conditions and Equations
Surface tension dominated zone
315.011.0 lsgs WeWe ( 0.3lsWe )
0.1gsWe ( 0.3lsWe )
Inertia dominated zone 1 (annular flow zone) 14.00.11 lsgs WeWe
0.3lsWe
Inertia dominated zone 2 (froth - dispersed flow
zone)
0.1gsWe
0.3lsWe
The actual effect of diameter on the flow regimes is also a current topic of debate.
Theoretically, flow patterns are less affected by channel orientation in small channels
due to the relatively reduced effect of gravity as compared with large tubes.
Therefore, the effect of channel dimension on the transition boundaries should be
similar whether in vertical or in horizontal flow. However, researchers could not reach
agreement on it. Damianides and Westwater [11] studied the flow regimes using air–
water in horizontal tubes for the range of inside diameters 1, 2, 3, 4 and 5 mm. They
reported that surface tension becomes a very important factor when the tube diameter
is less than 5 mm at the experimental conditions (10-25 ºC and atmospheric pressure).
Some common tendencies of the transition boundaries were discovered in their
studies. For instance, the intermittent-dispersed bubble transition boundary moves to
the region of lower liquid flow rate with decreasing tube diameter; the intermittent-
annular transition boundary moves to regions of higher gas flow rate with decreasing
tube diameter, the stratified flow region gradually shrinks with decreasing tube
diameter until it vanishes completely in the 1 mm tube. However, Coleman and
Garimella [10] reported opposite trends. They too studied air-water in horizontal tubes
of diameters 1.3, 1.75, 2.6 and 5.5 mm at atmospheric conditions. The results show
clearly that the tube diameter has a significant effect on the transition boundaries. For
example, the transition boundary of intermittent to dispersed bubble flow changes
significantly as the tube diameter changes from 5.50 mm to 1.30 mm. However, the
tendency of intermittent-dispersed bubble boundary to move to higher liquid flow
rates with decreasing diameter contradicts the results of Damianides and Westwater
[11]. For vertical tubes similar disagreements were reported. For example, Lin et al.

9
[16] studied air-water flow patterns in 0.5-4.0 mm diameter tubes at the condition of
20 ºC and 1 bar. They observed that the transition boundaries for slug to churn and
churn to annular shift towards the region of lower gas flow rate as the tube diameter
decreases. However, contradictory conclusions were reported by Zhao and Bi [17].
They experimentally investigated the characteristics of co-current upward air-water
two-phase flow patterns in vertical equilateral triangular channels with hydraulic
diameters of 2.886, 1.443 and 0.866 mm. They reported that dispersed bubbly flow
shifted to higher liquid superficial velocity whilst churn and annular flow occurred at
higher gas superficial velocity as the channel size was reduced. This tendency
contradicts completely that reported by Lin et al. [16]. The results described above are
summarized in Table 4.
Table 4. The direction of boundary shift with reducing channel dimensions.
Researcher Orientation Diameter
(mm) Fluid
Intermittent
/ dispersed
Intermittent
/ annular
Stratified
flow
Damianides and
Westwater [11] horizontal 1, 2, 3, 4, 5 air-water lower uls higher ugs
lower ugs
lower uls
Coleman and
Garimella [10] horizontal
1.3, 1.75,
2.6, 5.5 air-water higher uls higher ugs
lower ugs
lower uls
Researcher Orientation Diameter
(mm) Fluid
To dispersed
bubble Slug / churn To annular
Lin et al. [16] vertical 0.5 - 4 air-water lower ugs lower ugs
Zhao and Bi [17] vertical 0.87, 1.44,
2.89 air-water higher uls higher ugs higher ugs
*: Intermittent flow: plug or slug for horizontal tube and bubbly or slug for vertical tube.
In this study, accurate flow visualization experiments on adiabatic R134a flow
patterns in small tubes were carried out. The main objectives of the work include: (i)
obtain flow pattern maps, (ii) identify the critical diameter at the current experimental
conditions, (iii) compare flow patterns with existing models and (iv) verify the effect
of tube diameter on flow patterns. Four different size tubes were studies, 1.10, 2.01,
2.88 and 4.26 mm which are expected to cover the range from normal to small size
tubes.
EXPERIMENTAL FACILTY

10
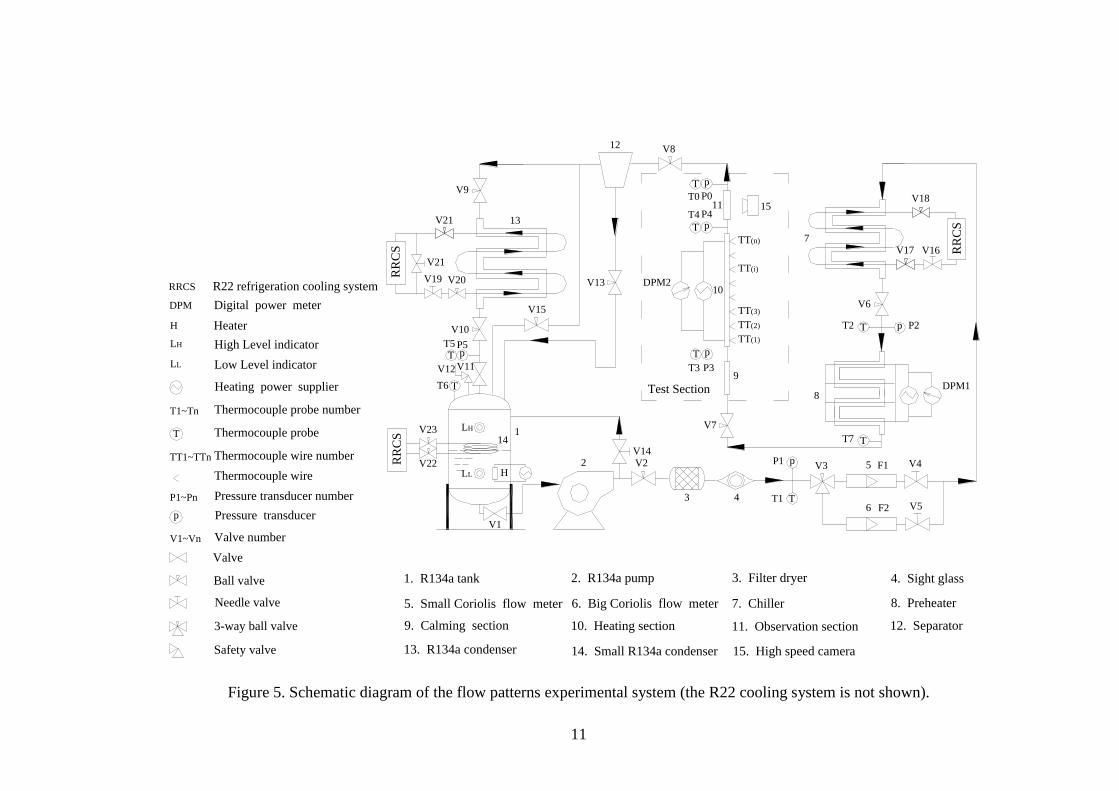
The experimental facility comprises three parts, i.e. the R22 cooling system, the
R134a experimental system, and the control and data acquisition system. Figure 5
shows the R134a experimental system. The facility is made of stainless steel, which is
also suitable for a wide range of fluids including water. The liquid and vapour
superficial velocity of R134a can reach 5 m/s and 10 m/s respectively. Details of the
experimental system can be found in Chen et al. [18].
Four test sections, see Figure 6, with internal diameter of 1.10, 2.01, 2.88 and 4.26
mm were examined. A test section is composed of a calming section, a heating section
and an observation section. Fully-developed single-phase liquid flow is formed in the
calming section. Two-phase flow is created by supplying electric current directly onto
the thin-wall steal tube – the heating section. The observation section, a Pyrex glass
tube with the same internal diameter as the steel heating tube, is directly connected to
the outlet of the heating section. Flow patterns were observed and recorded by a high-
speed digital camera (Phantom V4 B/W, 512x512 pixels resolution, 1000
pictures/second with full resolution and maximum 32000 pictures/second with
reduced resolution, minimum 10 microseconds exposure time).
The vital measurements in the flow pattern experiments are the temperatures (T3), the
pressures (P3, P4, P0), the flow rate (F1 or F2) and the heating power (DPM2) in the
test section, see Figures 5 and 6. The thermocouple T3 uses the water triple point as a
reference so as to improve the measuring accuracy. The same experimental facility
was used for a parallel heat transfer study [19]. Hence more thermocouples were
included in the rig and test section, e.g. TT(1)-TT(n). In the present study they were
used to estimate the heat loss and verify the condition at point 4, see Figure 5. This
data was also used to estimate the heat loss in the observation section. The system
pressure is controlled through a heater in the R134a tank. The heater power is
automatically adjusted by a PID controller based on the signal of the pressure at the
exit of the observation section, (P0).
11
1
2
3
5
6
7
8
10
12
13
DPM1
H
LH
T
p
T
T p
T p
1. R134a tank 4. Sight glass
6. Big Coriolis flow meter 7. Chiller 8. Preheater
9. Calming section 10. Heating section 11. Observation section
Heater
R22 refrigeration cooling system
Digital power meter
T
p
Thermocouple wire
Pressure transducer
Heating power supplier
2. R134a pump
Low Level indicator
3. Filter dryer
Needle valve
3-way ball valve
Ball valve
15
14. Small R134a condenser
Test Section
DPM2
Valve
Safety valve
9
11
13. R134a condenser
12. Separator
pT
LL
4
RR
CS
5. Small Coriolis flow meter
RR
CS
LL
RRCS
DPM
H
Thermocouple probe
High Level indicatorLH
V1
V2 V3 V4
V5
V6
V7
V8
V9
V10
V11V12
V13
V14
V21
V19 V20
V21
V18
V17 V16
T6
P1
T1
T2 P2
T3 P3
T4
P5T5
TT(n)
TT(i)
TT(3)
TT(2)
TT(1)
P4
T p
P0T0
pT
RR
CS 14
15. High speed camera
V15
V23
V22 F1
F2
T7 T
Thermocouple wire numberTT1~TTn
Thermocouple probe numberT1~Tn
Pressure transducer numberP1~Pn
Valve numberV1~Vn
Figure 5. Schematic diagram of the flow patterns experimental system (the R22 cooling system is not shown).

12
ID 2.01 mm
Heating section
(steel tube)
Pressure
transducer (P3)
Calming section
Flange
Pressure
transducer (P0)
Observation section
(glass tube)
Pressure
transducer (P4)
Flange
Flo
w d
irec
tio
nElectrode
Thermocouple (T3)
ID 2.01 mm
Thermocouple (T0)
Electrode (direct heating)
Thermocouple (T4)
ID 2.01 mm
Figure 6. Schematic diagram of the 2.01 mm test section.
All the instruments were carefully calibrated. Table 5 summarizes the uncertainties of
the key parameters in the current experiments. The overall system performance was
validated through single-phase experiments, e.g. the turbulent experimental friction
factor agreed with the Blasius equation within ± 5 % over the Reynolds range of 4000
to 110000. The experimental parameters at the observation point in the two-phase
flow patterns experiments were deduced from the inlet and outlet saturated pressures
and the assumption that the pressure drop along the observation section was linear.
The liquid and vapour superficial velocities were varied and calculated for each
diameter and pressure by changing the flow rate and heating power, see Chen et al.
[18]. The number of data points near the transition boundaries was higher than that at
other conditions in order to get more details at that zone. All the recorded data were
taken at steady state conditions. This was verified by plotting the temperature and
pressure at the inlet and exit of the test section against time and ensuring that they
were steady.

13
Table 5. Summary of the uncertainty of the key experimental parameters.
Item Measurement Range Uncertainty Range
Heating Section
(Stainless Steel Tube)
1.10 mm ID tube 1.31%
2.01 mm ID tube 0.59%
2.88 mm ID tube 0.38%
4.26 mm ID tube 0.26%
Observation Section
(Glass Tube)
1.10 mm ID tube 0.36%
2.01 mm ID tube 0.17%
2.88 mm ID tube 0.06%
4.26 mm ID tube 0.11%
Pressure
P3 6 - 14 bar 0.42%
P4 6 - 14 bar 0.26%
P0 6 - 14 bar 0.26%
Temperature T3, T4, T0 20 - 55
oC 0.16 K
TT1-TT15 > 20 oC 0.16 K
Flow Rate Small meter CMF010 0.5 - 25 kg/hr 0.15 - 0.54%
Large meter CMF025 25 - 500 kg/hr 0.15 - 0.22%
Heating Power Test section 2.68 - 1640 W 0.10 - 0.49 %
Differential Pressure 24% full scale 0 - 0.0608 bar 21.16 Pa
100% full scale 0.0608 - 0.2491 bar 77.43 Pa
Quality (absolute error)
1.10 mm test section 0 - 100% 0.14 - 1.37%
2.01 mm test section 0 - 100% 0.14 - 2.88%
2.88 mm test section 0 - 100% 0.14 - 3.33%
4.26 mm test section 0 - 100% 0.14 - 3.21%
Gas Superficial Velocity
1.10 mm 0.01 - 10 m/s 0.011 - 0.41 m/s
2.01 mm 0.01 - 10 m/s 0.006 - 0.34 m/s
2.88 mm 0.01 - 10 m/s 0.004 - 0.32 m/s
4.26 mm 0.01 - 10 m/s 0.002 - 0.32 m/s
Liquid Superficial Velocity
1.10 mm 0.04 - 5 m/s 0.0009 - 0.15 m/s
2.01 mm 0.04 - 5 m/s 0.0003 - 0.07 m/s
2.88 mm 0.04 - 5 m/s 0.0002 - 0.05 m/s
4.26 mm 0.04 - 5 m/s 0.0001 - 0.03 m/s
EXPERIMENTAL RESULTS
Dispersed bubble, bubbly, slug, churn and annular flow were observed in all four test
sections. Occasionally mist flow was observed in the bigger tubes at very high vapour
velocity whilst confined bubble flow was found in smaller tubes at lower vapour and
liquid velocity. The above-mentioned seven flow patterns are defined as follows:

14
Dispersed bubble: numerous small bubbles float in a continuous liquid phase.
Bubbly: bubble size is comparable to but not as large as the tube diameter.
Confined bubble: bubble size reaches the diameter of the tube and is confined by the
tube wall. They have regular vapour-liquid interface and spherical cap and bottom.
Slug: bubbles develop into bullet shape due to the tube wall restriction. Sometimes the
bullet bubble is followed by a stream of small bubbles creating a trail.
Churn: bullet bubbles start to distort and small bubbles in liquid slug coalesce into gas
clump with increase of gas velocity - a highly oscillatory flow with chaotic interface.
Annular: gas phase becomes a continuous flow in the core of tube.
Mist: liquid film is blown away from tube wall and numerous liquid droplets float in
high-speed vapour flow.
Figures 7-10 show the above flow patterns at 10 bar pressure. The flow patterns in
2.01 and 4.26 were first reported in Chen et al. [18] but are included here for
completeness. Overall the flow patterns in the four tubes are similar and could be
grouped into the above seven typical patterns – note that pure mist flow was obtained
in the 4.26 mm tube only. Annular–mist transition flow was observed in the 2.01, 2.88
and 4.26 mm tubes, i.e. liquid film sticks on the tube wall whilst the liquid droplets
pass through intermittently. This discontinuous liquid droplet flow may be the result
of the collapse of liquid slug in churn flow in the heating section. The high velocity
vapour current breaks up the liquid bridges and creates numerous liquid droplets.
After that, the experiments were stopped in the 2.01 and 2.88 mm tubes before
reaching critical heat flux. The 1.10 mm tube was not tested under very high fluid
velocity because the resulting excessive pressure drop caused system unsteadiness.
Similar results were obtained at the 6 and 14 bar pressures. As stated before, all the
flow patterns observed in the four tubes could be categorized in the above typical
regimes. However, on close observation, there are some differences among these
tubes. Confined bubble flow, similar to slug flow but with elongated spherical top and
bottom bubbles, was only observed in the 1.10 mm tube at 6.0 to 14.0 bar and the 2.01
mm tube at 6.0 bar. It indicates that surface tension was grown into the dominant
force in the smaller tubes at the lower fluid velocities. With the increase of fluid
velocities, as shown in Figure 7, the gas-liquid interface became irregular and chaotic.
Inertial force and friction gradually replace surface tension to become the important
factors in flow pattern transition.

15
Figure 7. Flow patterns observed in the 1.10 mm internal diameter tube at 10 bar.
Figure 8. Flow patterns observed in the 2.01 mm internal diameter tube at 10 bar.
Figure 9. Flow patterns observed in the 2.88 mm internal diameter tube at 10 bar.
Figure 10. Flow patterns observed in the 4.26 mm internal diameter tube at 10 bar.

16
The flow patterns in the 2.88 and 4.26 mm tubes do not exhibit any common
characteristics of the flow patterns in small tubes. Comparatively, the flow patterns in
the 2.01 mm tube show some “small tube characteristics”, which indicates the
increasing action of surface tension and tube confinement, e.g. the appearance of the
confined bubble flow, the slimmer vapour slug, the thinner liquid film around the
vapour slug, and the less chaotic vapour-liquid interface in churn flow. When tube
diameter decreases to 1.10 mm, the full small tube characteristics, as also described in
the previous studies (Oya [6], Damianides and Westwater [11], Fukano and
Kariyasaki [8], Mishima and Hibiki [9], Triplett et al. [3], Lin et al. [16]), are
exhibited. Therefore, the 2.01 mm tube possesses both characteristics of normal size
and small size tube. From this point of view, a tube diameter around 2.0 mm can be
regarded as the critical diameter for refrigerant R134a at the current experimental
conditions. This result agrees with the criterion by Kew and Cornwell [1], e.g. 1.7 to
1.4 mm at 6 -14 bar.
Twelve flow pattern maps were generated based on all the results obtained for the
1.10, 2.01, 2.88 and 4.26 mm tubes at 6, 10 and 14 bar pressure. The flow pattern
maps for the 2.01 and 4.26 mm tubes were compared with the existing models for
vertical upward flow in normal size tubes and showed poor agreement in Chen et al.
[18]. The models included the unified model summarized by Taitel [20] and the
models given by Taitel et al. [21], Mishima and Ishii [12] and McQuilian and Whalley
[22]. Comparatively the unified model matched the experimental data better for the
4.26 mm tube than the other models. Therefore, Figures 11-14 depict the comparison
of the experimental flow maps for the 1.10 to 4.26 mm tubes with the unified model
summarized by Taitel [20] to investigate its applicability for the smaller tubes. As
expected, the newly obtained flow maps for the 1.10 and 2.88 mm tubes cannot be
predicted by the models and the discrepancy is higher in the smaller tubes. For
example, the shaded region in which the predicted annular flow falls into the region of
slug flow increases and the disagreement on the transition boundary of dispersed
bubble to slug flow between our data and the predictions increases as the diameter
gets smaller.

17
Figure 11. Flow pattern map for R134a in the 4.26 mm tube at 10 bar and comparison
with the unified model (Taitel [20]).
Figure 12. Flow pattern map for R134a in the 2.88 mm tube at 10 bar and comparison
with the unified model (Taitel [20]).

18
Figure 13. Flow pattern map for R134a in the 2.01 mm tube at 10 bar and comparison
with the unified model (Taitel [20]).
Figure 14. Flow pattern map for R134a in the 1.10 mm tube at 10 bar and comparison
with the unified model (Taitel [20]).
19
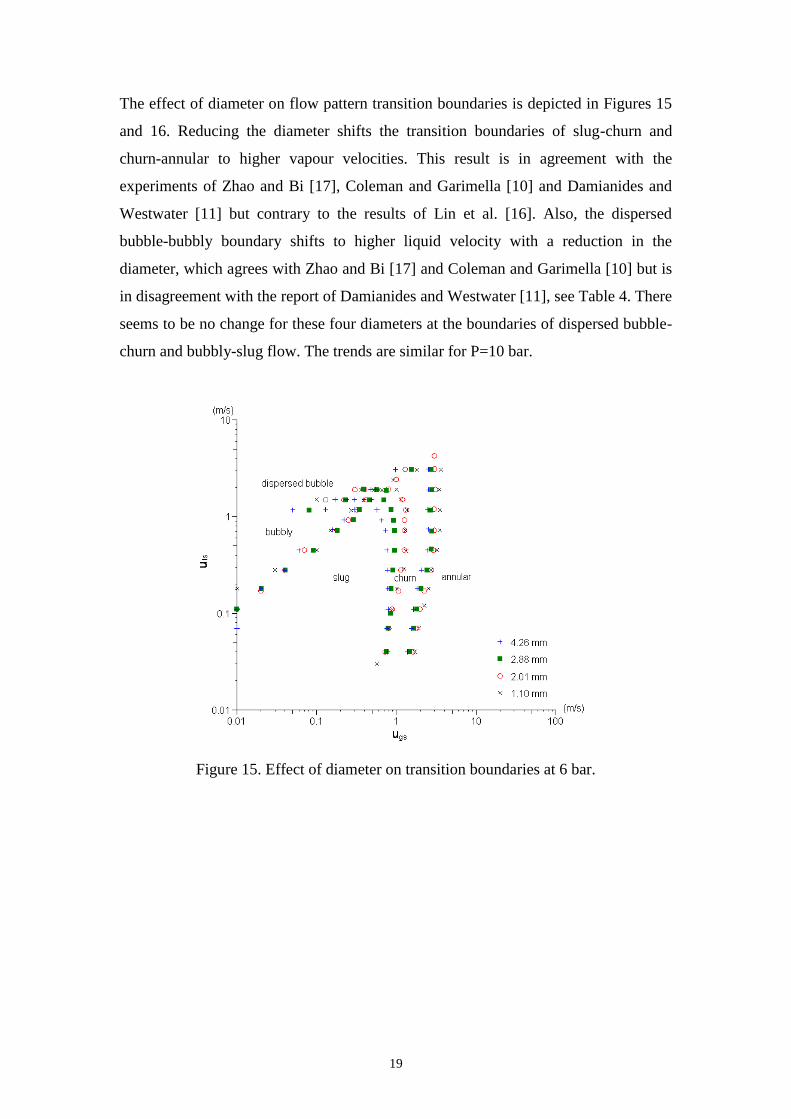
The effect of diameter on flow pattern transition boundaries is depicted in Figures 15
and 16. Reducing the diameter shifts the transition boundaries of slug-churn and
churn-annular to higher vapour velocities. This result is in agreement with the
experiments of Zhao and Bi [17], Coleman and Garimella [10] and Damianides and
Westwater [11] but contrary to the results of Lin et al. [16]. Also, the dispersed
bubble-bubbly boundary shifts to higher liquid velocity with a reduction in the
diameter, which agrees with Zhao and Bi [17] and Coleman and Garimella [10] but is
in disagreement with the report of Damianides and Westwater [11], see Table 4. There
seems to be no change for these four diameters at the boundaries of dispersed bubble-
churn and bubbly-slug flow. The trends are similar for P=10 bar.
Figure 15. Effect of diameter on transition boundaries at 6 bar.

20
Figure 16. Effect of diameter on transition boundaries at 14 bar.
The suitability of number of different parameters (17 in total listed in Chen [23]), as
coordinates in addition to the superficial velocities, were also examined in the present
project. An interim conclusion reached is that the use of the Weber number may be a
good choice, see Figures 17 and 18. As seen in the figures, almost all transition
boundaries, except bubble-dispersed bubble and slug-churn at the lower uls region, are
superimposed. There seems to be a perfect match for these transition boundaries for
all pressures. It seems to indicate that the effect of channel size is to a great extend
correctly represented by the Weber number and may be useful in deducing the flow
regimes for different size tubes from such maps. However, this needs further study
and validation.

21
Figure 17. R134a flow map in We coordinate system at 6 bar.

22
Figure 18. R134a flow map in We coordinate system at 14 bar.
Figure 19 compares the present experimental data at 10 bar and the semi-experimental
correlation for small tubes (Akbar et al. [4]). Obviously the results show poor
agreement. The transition boundaries predicted by the correlations (see Table 3) are
sketched in solid lines and the current observed flow patterns are labelled in brackets.
None of the flow patterns at the current experimental conditions are predicted well.
The same conclusion was obtained when the experimental results for 6 and 14 bar
were compared with the correlation of Akbar et al.. The possible explanation to such
discrepancy is (1) the proposed correlations were based on the experimental data

23
using air-water in horizontal tubes, (2) Akbar et al. suggested Bo=0.3 as the criterion
to define a small tube, i.e. the corresponding critical diameter is less than 0.25 mm at
the present experimental conditions, see Table 1. Therefore, the correlations proposed
by Akbar et al. [4] may not be applicable in this case. The development of a general
set of correlation equations needed to cover the range of small to micro diameters
calls for further research work.
Figure 19. The comparison between the correlations proposed by Akbar et al. [4] and
the present experimental data at 10 bar.
CONCLUSIONS
Seven typical flow patterns were observed in the present experimental conditions, i.e.
dispersed bubble, bubbly, confined bubble, slug, churn, annular and mist. The
experimental results indicate that the flow patterns for the larger diameters (2.88 and
4.26 mm) strongly resemble flow pattern characteristics found in normal size tubes.
When the tube diameter was reduced to 2.01 mm, the flow patterns exhibit some
“small tube characteristics” until the confined bubble flow appears in the 1.10 mm
tube at all experimental pressures which indicates that surface tension became the
dominant force. The critical diameter used to distinguish small and normal pipes
could be deduced from the above observations and is about 2 mm for the current

24
experimental conditions. Twelve flow pattern maps were drawn and compared with
the existing models for normal size tubes indicating significant differences in the 4.26
mm tube and more so for the smaller tubes. The boundaries of slug to churn and churn
to annular moved to higher vapour velocity whilst the dispersed bubble to bubbly
boundary moved to higher liquid velocity when the diameter changed from 4.26 to
1.10 mm. The diameter does not seem to affect the dispersed bubble to churn and
bubbly to slug. The current research and experimental data indicates that the Weber
number may be the right parameter to deduce general correlations to predict the
transition boundaries that include the effect of diameter. This can form the basis or
subject for further research in this area.
NOMENCLATURE
Bo Bond number, glgD2
Co Confinement number, glgD2/
D tube diameter, m
Eö Eötvös number, 22 Co)(2
Fr Froude number, gDu 2
G mass flux, kg/m2s
g gravitational acceleration, m/s2
m mass flow rate, kg/s
P pressure drop, Pa
Re Reynold number, GD
u velocity, m/s
We Weber number, /2Du
X Lockhart-Martinelli parameter, gsls pp
x quality
Y fluid coefficient
Greeks symbols
volume flow ratio, [ gll xxx 1 ]

25
dimensionless coefficient
dynamic viscosity, kg/m s
density, kg/m3
surface tension, N/m
specific volume, m3/kg
dimensionless coefficient
Subscripts
g saturated gas/vapour
gs based on superficial gas velocity
h homogeneous
i inside
l saturated liquid
ls based on superficial liquid velocity
ref reference fluid
REFERENCES
[1]. P.A. Kew and K. Cornwell, Correlations for the prediction of boiling heat
transfer in small-diameter channels, Applied Thermal Engineering, Vol.17,
Nos.8-10, pp.705-715, 1997.
[2]. N. Brauner and D. Moalem-Maron, Identification of the range of small diameter
conduits, regarding two-phase flow pattern transitions, Int. Commun. Heat Mass
Transfer, Vol. 19, pp. 29-39, 1992.
[3]. K. A. Triplett, S.M. Ghiaasiaan, S.I. Abdel-Khalik and D.L. Sadowski, Gas-
liquid two-phase flow in microchannels, Part I: Two-phase flow patterns,
International Journal of Multiphase Flow, Vol. 25, Elsevier Science Ltd., pp.
377-394, 1999.
[4]. M.K. Akbar, D.A. Plummer and S.M. Ghiaasiaan, On gas-liquid two-phase flow
regimes in microchannels, International Journal of Multiphase Flow, Vol. 29,
pp. 855-865, 2003.

26
[5]. S.G. Kandlikav, Fundamental issues related to flow boiling in minichannels and
microchannels, Experimental Thermal and Fluid Science, Vol. 26, pp.389-407,
2002.
[6]. T. Oya, Upward liquid Flow in small tube into which air streams (1st Report,
Experimental apparatus and flow patterns), Vol. 14, No. 78, pp. 1320-1329,
1971.
[7]. D. Barnea, Y. Luninski and Y. Taitel, Flow pattern in horizontal and vertical
two phase flow in small diameter pipes, The Canadian Journal of Chemical
Engineering, Vol. 61, No. 5, pp. 617-620, 1983.
[8]. T. Fukano and A. Kariyasaki, Characteristics of gas-liquid two-phase flow in a
capillary tube, Nuclear Engineering and Design, Vol. 141, pp. 59-68, 1993.
[9]. K. Mishima and T. Hibiki, Some characteristics of air-water two-phase flow in
small diameter vertical tubes, Int. J. Multiphase flow, Vol. 22, No. 4, pp. 703-
712, 1996.
[10]. J.W. Coleman and S. Garimella, Characterization of two-phase flow patterns in
small diameter round and rectangular tubes, International Journal of Heat and
Mass Transfer, Vol. 42, pp. 2869-2881, 1999.
[11]. D.A. Damianides and J.W. Westwater, Two-phase flow patterns in a compact
heat exchanger and in small tubes, Second UK National Conference on Heat
Transfer, Volume 11 Sessions 4A-6C, pp. 1257-1268, 1988.
[12]. K. Mishima and M. Ishii, Flow regime transition criteria for upward two-phase
flow in vertical tubes, Int. J. Heat Mass Transfer, Vol. 27, No. 5, pp. 723-737,
1984.
[13]. Y. Taitel and A. E. Dukler, A model for predicting flow regime transitions in
horizontal and near-horizontal flow, AIChE, Vol. 22, pp. 47-55, 1976.
[14]. K. Mishima, T. Hibiki and H. Nishihara, Some characteristics of air-water two-
phase flow in small diameter tubes, Proc 2nd Int. Conf. Multiphase Flow, Vol.
4, April 3-7, Tokyo, Japan, pp. 39-46, 1995.
[15]. C.Y. Yang and C.C. Shieh, Flow pattern of air-water and two-phase R-134a in
small circular tubes, International Journal of Multiphase Flow, Vol.27, pp.1163-
1177, 2001.
[16]. S. Lin, P.A. Kew and K. Cornwell, Two-phase flow regimes and heat transfer in
small tubes and channels, Heat Transfer1998, Proceedings of 11th IHTC, Vol. 2,
August 23-28, Kyongju, Korea, pp. 45-50, 1998.

27
[17]. T.S. Zhao and Q.C. Bi, Co-current air-water two-phase flow patterns invertical
triangular microchannels, International Journal of Multiphase Flow, Vol. 27, pp.
765-782, 2001.
[18]. L. Chen, Y. S. Tian and T. G. Karayiannis, R134a Flow Patterns in Small
Diameter Tubes, Journal of Process Mechanical Engineering, Proc. Of the Inst.
of Mechanical Engineers, Part E, Vol. 219, pp. 167-181, 2005.
[19]. X. Huo, Y. S. Tian and T. G. Karayiannis, R134a flow boiling heat transfer in
small diameter tubes, In press, International Journal Heat Exchangers, 2006.
[20]. Y. Taitel, Flow pattern transition in two phase flow, Keynote lecture, 9th
International Heat Transfer Conference, Jerusalem, Israel, 19-24 Aug., pp. 237-
254, 1990.
[21]. Y. Taitel, D. Barnea and A. E. Dukler, Modelling flow pattern transitions for
steady upward gas-liquid flow in vertical tubes, AIChE, Vol. 26, pp. 345-354,
1980.
[22]. K. W. McQuillan and P. B. Whalley, Flow patterns in vertical two-phase flow,
Int. J. Multiphase Flow, Vol. 11, No. 2, pp. 161-175, 1985.
[23]. L. Chen, Flow patterns in upward two-phase flow in small diameter tubes, PhD
thesis, Burnel University UK, Submitted 2006.