effect of charge diameter on explosive performance · effect of charge diameter on explosive...
TRANSCRIPT
EFFECT OF CHARGE DIAMETER ON EXPLOSIVE PERFORMANCE
By Harry R. Nicholls and Wilbur I. Duvall
,. ,. ,. • ,. ,. ,. ,. ,. • ,. report of investigations 6806
wv\IW.,Il.Rblast.osmre.QOV '
US Department of Interior Office of Surface Mining Reclamation and Enforcement
Kenneth K. Eltschlager
UNITED STATES DEPARTMENT OF THE INTERIOR Stewart L. Udall, Secretary
BUREAU OF MINES Walter R. Hibbard, Jr., Director
Mining/Explos·lves Engineer 3 Parkway Center
Pittsburgh, PA 15220 Office: 412.937.2169
Cell: 724.263.8143 [email protected]
This publication has been cataloged as follows:
Nicholls, Harry R Effect of charge diameter on explosive performance, by
Harry R. Nicholls and Wilbur I. Duvall. [Washington] U. S. Dept. of the Interior, Bureau of Mines [1966]
22 p. illus., tables. (U. S. Bureau of Mines. Report of investi .. gations 6806)
Includes bibliography.
'1. Explosives. I. Duvall, Wilbur Irving, 1915• Tide. (Series}
TN23.U7 no. 6806 622.06173
U. S. Dept. of the Int. Library
, jt. auth. II.

CONTENTS
Abstract ..... .......................................................... . Introduction .................................... ,. ................. , .... . Acknowledgntents . ........ , ...................... , ...•....... , .... , ...... . Test site ..... , ........... , ..................... , ................. , .... . Experimental procedure . ................................................ . Data and analysis . ..................................................... .
Explosive properties ...•.......•.•.....•.•..•..•...•••..•.....•.••• Shooting sequence . ................................................ . Pressure data ....................... ,., .............. , ............ . Strain data ........... ,, ............................. o •••• o •••• o •••
Average cavity size .......•.•.•..••.•....•.......•..•••.••.••••.•.• Data analysis ..•......•.•..•.•.•..•.••.••......•....•••..••.•.••...
Conclusions. o o o o ••• o. o o ••••• o ••• o o ••••• o •••• o. o ••••••• o •••• ••••• o. o o o o ••
References o •• o ••••••• o •••••• o •••• o. o •••••••••••• 0. 0 0 o • ••••••••••••••• 0 0.
Fig.
1. 2. 3. 4. 5. 6. 7. 8. 9.
10.
ILLUSTRATIONS
Plan view of test arrays .•••..•.........•..•...•..••...•....•••••.. Typical strain pulses ...•••....•.....•.•...••.••..••.••.•.•..••.... Rise time versus distance .. .. o o • •••••••••• 0 • ••••••••••• 0 ••• •• 0 •••••
Fall time versus distance ..••.•......••.••...•.•.•..•.••...•.•.••.. Peak compressive strain versus distance . .......... 0 ••••••••••••••••
Fall strain versus distance ..•..•••••...••••.••••.•••••.••.....•..• Compressive impulse versus distance .•.••••.•.••••••••••••.••••.•••. Total impulse versus distance ...••..••.••.••.••...•....•.••.••••.•. Compressive energy versus distance .•...••.•••••••••..••••.•••.••••• Total energy versus distance ....••..•....••..••.••.•••..••.••••..•.
TABLES
Page
1 1 2 2 3 5 5 6 6 6
15 16 19 22
3 8
15 15 16 17 17 19 20 21
1. Explosive properties............................................... 5 2. Order of shooting.................................................. 6 3. Pressure amplitudes. . . . . . • . . . . . . . . • . . . • . . . • . . . . • • . . . • • . . . • • . . • . . . • • 7 4. Arrival time and pulse shape data, pentolite....................... 9 5. Arrival time and pulse shape data, semigelatin dynamite............ 10 6. Arrival time and pulse shape data, AN-FO prills.................... 11 7. Strain amplitude, impulse, and energy data, pentolite.............. 12 8. Strain amplitude, impulse, and energy data, semigelatin dynamite... 13 9. Strain amplitude, impulse, and energy data, AN-FO prills........... 14
10. Average cavity size................................................ 16 11. Summary of intercepts and slopes................................... 18


EFFECT OF CHARGE DIAMETER ON EXPLOSIVE PERFORMANCE
by
Harry R. Nicholls 1 and Wilbur 1. Duvall 2
ABSTRACT
The Bureau of Mines studied the effect of varying the diameter of explosive charges on the generation and propagation of strain waves. The parameters compared were strain amplitude, impulse, energy, and pulse shape. Three different explosives were detonated in three different charge diameters. Charges of cast 50/50 pentolite-detonated at the same velocity in 5-, 2.5-, and 1.5-inch diameters, Charges of ammonium nitrate-fuel oil prills and 45-percent semigelatin dynamite showed a strong detonation rate-diameter dependency. Detonation of these two explosi-ves was considered nonidcal. Differences in the diameter of the charge caused less difference in the strain-generating abilities of pentolite than in those of the other two explosives. This was also true for impulse and energy. Rise and fall times of the strain pulses for all three explosives were proportional to detonation time and cavity volume, respectively.
INTRODUCTION
The detonation rate of most commercial explosives varies with charge diameter. As charge diameter increases, detonation rate increases until some optimum detonation rate is reached. This optimum rate is generally known as the ideal detonation rate. The diameter at which ideal detonation occurs varies with explosive. For a 50/50 pentolite, with mass density of 1.62, ideal detonation occurs at a diameter of about 1 em. For a 40 percent ammonia gelatin dynamite, the diameter is about 15 em (~). 3
1 Former Bureau of Mines research geophysicist, Applied Physics Laboratory, College Park, Md.; now with Environmental Science Service Administration, Rockville, Md.
2 Supervisory physicist, Denver Mining Research Center, Bureau of Mines, Denver, Colo.
3 Underlined numbers in parentheses refer to items in the list of references at the end of this report.
Work on manuscript completed December 1965.
2
In both quarry and underground operations, shothole diameter can be increased or decreased. If the type of explosive is unchanged, an increase in diameter may effectively increase the strength of an explosive charge through an increase in detonation rate. Similarly; a decrease in diameter may result in a less powerful explosive because of a decrease in detonation rate. Such changes in explosive performance due to detonation rate--diameter dependency would differ from attendant changes due to a change in charge volume and charge geometry.
To study charge diameter effects, three different explosives were detonated in each of three different charge diameters. The explosives used were a cast S0/50 pentolite, a semigelatin dynamite (45-percent bulk strength), and a premixed ammonium nitrate-fuel oil (AN-FO) prill. These explosives were expected to have very slight, moderate, and strong detonation rate-diameter dependencies, respectively.
A total of 19 shots were detonated, 2 of each explosive in charge diameters of 1.5, 2.5, and 5 inches. One shot misfired, necessitating an additional test. Strain amplitude, impulse, energy; and pulse shape were studied for effects of charge diameter.
ACKNOWLEDGMENTS
The authors wish to express their appreciation to the Consolidated Quarries Division of the Georgia Marble Co., Lithonia, Ga., and in particular to Nelson Severinghaus, vice-president, and W. B. Hawkins, quarry superintendent, for providing the test site and assistance during the field portion of the program.
TEST SITE
The tests were conducted in a granite quarry near Lithonia, Ga. The quarry is within the Lithonia belt of granite-gneiss in the Piedmont Plateau of north-central Georgia. In hand samples; the rock appears to be a hard, firm, close-textured, fine-grained biotite granite-gneiss. The rock contains aplitic dikes and quartz and feldspar crystals up to 2 inches in diameter; it is relatively free of joints and fractures. In the absence of weathering, jointing, or fracturing, the rock is subjected to a horizontal static stress of 1,000 to 2,000 psi ~). Laboratory measurements indicate a high degree of anisotropy, but this is primarily between properties measured in a direction corresponding to an in situ vertical direction and any other orientation. Anisotropic effects are not generally evident in the type of field tests conducted in this investigation, nor are static stress conditions considered to be a contributing factor in the results obtained.
The weight density of the Lithonia granite-gneiss is 164 lb/ft3 • The longitudinal propagation velocity as determined in these tests is 18,500 ft/sec. The characteristic impedance (product of weight density and velocity) is 55 lb/sec/in3 •
Array I • SH 6
Array 2 • SH6
Array 3 • SH6
SGH SGH 7 I
• eO 0 0 0 0 0 o• SH5 SH4 6 5 4 ~2 SH3
~t~ SGH
0
PGHI
SGH SGH 7 I
• •O 0 0 0 0 0 o• SH5 SH4 6~ 1 ~2 SH3
SGH/
0
PGH 2
SGH SGH 7 I
• •o o 0 0 0 o o• SH5 SH4 6~'- 1 ~2 SH3
SGH
e SHI-SH6 Shotholes
o SGH I-SGH7 Strain gage holes
o PGHI-PGH2 Pressure gage holes
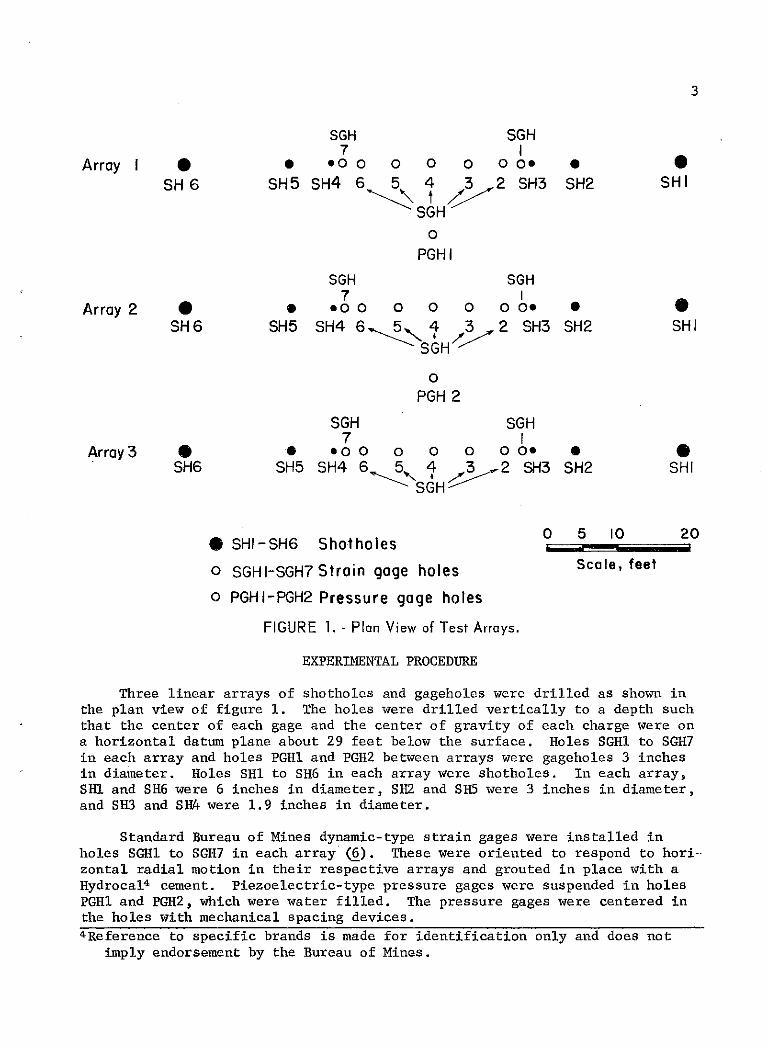
FIGURE 1.- Plan View of Test Arrays.
EXPERIMENTAL PROCEDURE
0
3
• • SH2 SHI
• • SH2 SHI
• • SH2 SHI
5 10 20
Seale, feet
Three linear arrays of shotholes and gageholes were drilled as shown in the plan view of figure 1. The holes were drilled vertically to a depth such that the center of each gage and the center of gravity of each charge were on a horizontal datum plane about 29 feet below the surface, Holes SGHl to SGH7 in each array and holes PGHl and PGH2 between arrays were gageholes 3 inches in diameter. Holes SHl to SH6 in each array were shotholes. In each array, SHl and SH6 were 6 inches in diameter, SH2 and SHS were 3 inches in diameter, and SH3 and SH4 were 1.9 inches in diameter.
Standard Bureau of Mines dynamic-type strain gages were installed in holes SGHl to SGH7 in each array (~). These were oriented to respond to horizontal radial motion in their respective arrays and grouted in place with a Hydrocal4 cement. Piezoelectric-type pressure gages were suspended in holes PGHl and PGH2, which were water filled, The pressure gages were centered in the holes with mechanical spacing devices. 4Reference to specific brands is made for identification only and does not
imply endorsement by the Bureau of Mines.

4
The output signals from all gages were carried by cable to a mobile laboratory which housed the recording equipment and accessory electronics. Gage output signals were amplified or attenuated as needed by a preamplifier system to deliver proper input voltages to a 14-channel FM magnetic tape recorder. The recordings were played back for analysis into a direct-writing oscillograph. The time scale of the final records for analysis was 625 ~sec/in. The overall frequency response of the instrumentation system, including gages, was flat (± 12 percent) from 5 to 10,000 cps.
All explosive charges were 30 inches long. In each array there were two 1.5-inch-diameter, two 2.5-inch-diameter, and two 5-inch-diameter charges to be shot in 1.9-inch-, 3-inch-, and 6-inch-diameter holes, respectively, so that the coupling for all shots .was nearly constant. Initiation for all shots was accomplished with an electric blasting cap and a 20-gram booster. Two shots of each diameter of each explosive were detonated for a total of 18 shots. The shots were randomized as much as possible to eliminate any systematic effects due to the rock or sequence of firing. The sequence of shooting in each array was from the outermost holes in towards the gageholes to preclude the propagation of energy through broken rock. After each shot, the resultant cavity was cleaned of crushed and broken material by directing a stream of compressed air of sufficient pressure and velocity to eject the crushed material from the drill hole. The cavity was then measured by adding known increments of sand and measuring the buildup in the hole.
The pentolite and semigelatin dynamite charges were encased in cardboard wrappers during their manufacture. To insure similarity in shooting conditions and to maintain constant coupling (80 to 83 percent), the AN-FO prills were packaged in similar cardboard containers at the site. This is not the condition under which prills are normally shot because confinement is usually complete. However, prills were chosen for use simply as an explosive which had a strong diameter effect, and the results should not be considered as an evaluation of the explosives themselves.
The detonation rate of each charge was measured. Two chronograph contactors were inserted in each charge, one 6 inches above the point of the detonation and the second 1.5 feet from the first. Contactors are simple make circuits with which appropriate electronic circuitry is used to operate the start-stop sections of a microsecond timer. The quotient of the distance interval divided by the time interval is the detonation rate. In addition, detonation rates were measured continuously. The continuous probe consists of 2-foot-long threaded nylon rod, wrapped with Nichrome resistance wire. The wire-wrapped nylon rod is encased in a thin-wall aluminum shell and inserted in the charge. The probe is powered by a constant current source. As detonation proceeds, the aluminum shell collapses and continuously shorts out the threaded wire. The resultant varying resistance causes a voltage drop across the gage. This voltage change is displayed versus time on an oscilloscope and photographed. The slope of the photographed trace is proportional to the detonation rate.
Zero times for shot-to-gage arrival time measurements were established by placing a chronograph contactor at the point of initiation in each charge.

The voltage output from the contactor make circuit was recorded on one of the FM tape channels.
A great deal of extraneous electrical noise was evident on the strain data from the first three shots in the test series. Such noise is often referred to as firing hash or shot noise because it originates at the instant of charge detonation. Many things were tried before each of the first three shots in an attempt to eliminate the electrical pickup, including additional grounding and isolation of signal and fire line cables. Prior to the fourth shot, the sand stemming and sides of the shothole were 'moistened with water. This completely eliminated the electrical noise problem and became standard procedure for the balance of the tests, However, data from shot Sl were completely unusable because of the noise, Only two data points from shot S3 were usable. All data from shot S2 were poor but usable. Gage SG3 in array 3 did not function properly for any shot in the array, and no data were obtained from that gage.
DATA AND ANALYSIS
Explosive Properties
Table 1 gives the explosive properties. The weight and detonation rates of each charge were measured in the field. Data from the two charges of each diameter were averaged. Detonation pressures were calculated using Brown's approximate formula (!):
P 2,16 x 10⁻⁴ Pg D2 [0.45/(1 + 0.0128 pg)],
where p detonation pressure, psi,
pg =weight density, lb/ft3,
and D =detonation velocity, ft/sec.
The decrease in weight density with decrease in charge diameter reflects the increase in relative percentage of weight that the wrapper represents for smaller diameter charges. The relative increase in percentage of voids in the pentolite charges to receive probes and contactors is also reflected by a decrease in weight density with decreased charge diameter.
. -TABLE 1 Explosive properties
5
Charge Charge Weight, Weight Detonation Detonation Explosive Symbol diam, volume, pounds dens it~, rate, pressure,
inches ft3 lb/ft ft/sec psi x 106
Cast 50/50 Pent 5 0.340 34.8 102 24,600 2.60 pentolite. 2.5 .0852 8.1 95.1 24' 700 2.54
1.5 .0307 2.8 91.3 24,500 2.46 Semigelatin dyna- SG45 5 .340 27.3 80.3 18,100 1.26 mite, 45-percent 2.5 .0852 6.6 77.5 16,200 .991 bulk strength. 1.5 .0307 2.3 75.0 15,600 .903
Premixed AN-FO AN-FO 5 .340 19.3 56.7 9,900 .313 prill. 2.5 .0852 4.6 54.0 8,100 .204
1.5 .0307 1.6 52.2 7,400 .167

6
Shooting Sequence
Table 2 gives the shooting sequence employed. The number preceding the explosive represents the order of the shot in the overall sequence. The coding for shot numbers in this report is, first, number of shot in sequence; second, array number; third, shothole number. Thus, the ninth shot in the test series was AN-FO prills in array 1 shothole SH3 and would be referred to as shot S9-Al-SH3.
TABLE 2. - Order of shooting
Hole Diameter, Array 1 Array 2 Array 3 inches Shot Explosive Shot Explosive Shot Explosive
SHl. ............ 5 87 SG45 814 AN-FO 81 Pent 8H2 ......•...... 2.5 ss Pent 815 8G45 83 AN-FO 8H3 ............. 1.5 89 AN-FO 819 Pent S6 SG45 8H4 ............. 1.5 Sl2 Pent 818 SG45 S5 AN-FO SH5 ............. 2.5 811 8G45 817 AN-FO 84 Pent 8H6 ............. 5 810 AN-FO 816 Pent S2 SG45
Pressure Data
The pressure gages in holes PGHl and PGH2 were used throughout the tests beginning with shot 84-A3-8H5. In a previous test series (5), large differences existed in strain amplitudes among arrays independent ;-f distance or explosive-type considerations-. The pressure gages used in these tests were nearly omnidirectional; therefore, they were expected to give similar amplitudes for identical charges from two shots of the same explosive for identical travel distances providing no real array effect existed. Table 3 shows all the pressure gage data. Of the direct comparisons available, only those from shots S5-A3-8H4 and 89-Al-SH3 show any significant difference (1.79 psi versus 0.98 psi and 5.86 psi versus 2.55 psi). This is presumably because of the generally poor quality of the data from these two shots. On the basis of these comparisons, no array effect was detected. None was evident in the strain data.
Strain Data
The tracings of strain pulses shown in figure 2 illustrate the measurements made on the strain pulses. The initial portion of the trace prior to the arrival of the pulse is the zero base line. Deflection above the baseline is compressive strain, deflection below is tensile strain, and time increases from left to right. Type a strain pulse was obtained most often in the test series. Type b typifies the strain pulse obtained at shot-to-gage distances of 15 feet or less where the rock experiences permanent compressive deformation. Type c illustrates the strain pulses obtained from the 2.5- and 1.5-inch-diameter AN-FO charges. The contribution due to the booster was an appreciable portion of the total strain pulses, To facilitate analysis, a smooth curve, shown as a dashed line, was drawn through type c pulses. The hatched portion, ~. was assumed to be a strain pulse produced by the booster and excluded from all calculations and analysis.

TABLE 3. - Pressure amplitudes, psi1
Shots wi t;h Pent : Sl6-A2-SH6 ...•................. S4-A3-SH5 .•..........•......... S8-Al-SH2 ....•.•.....••......•. Sl2-Al-SH4 ........••.....••.... Sl9-A2-SH3 .•................••.
Shots with SG45: S7-Al-SH1. .................... . Sl5-A2-SH2 ........••.•......... Sll-Al-SH5 .••.......•.......... S6-A3-SH3 .....•.•.......•...... Sl8-A2-SH4 ..........•.•.....•..
Shots with AN-FO: Sl0-Al-SH6 ...•...............•• Sl4-A2-SH1. ................... . Sl7-A2-SH5 .................... . S5-A3-SH4 ..................... . S9-Al-SH3 ...••..........•••...•
Gage PGl
30.1A 74.7 70.1B 62.1B
39.5 25.0C 33.7C
7.25 17.2D
19.0E 13.8E 4.48F 1.79G 2.55H
Gage PG2
71.4
33.1A 20.1 59.8B
25.9 23.1C 16.4 17 .lD 17.1D
13.6 13.1E
4.42F 5.86H
.98G ~A through H following numbers indicate that data are
directly comparable. For example the 30.1 psi registered by shot S4-A3-SH5 at gage PGl and the 33.1 psi
.registered by shot S8-Al-SH2 at gage PG2 both are followed by the letter A, indicating that travel distance, charge type, and geometry were the same. Gages PGl and PG2 were equidistant from all array 2 shotholes; thus, array 2 data for each shot are comparable.
In addition to direct measurement of the quantities shown in figure 2, all strain data were processed on a semiautomatic digitizing system for computer calculation of impulse and energy. Impulse is proportional to
7
the integral of the strain pulse with respect to time and was handled in two parts: compressive impulse, impulse of the compressive portion or first half cycle; and total impulse, impulse of the first cycle. Energy is proportional to the integral of strain squared as a function ·of time '!nd was also treated in two parts: compressive and total energy. Tensile strain was determined only as a step in determining fall strain (sum of compressive and tensile strain). The importance of fall strain in rock breakage was pointed out in a previous report (l).
Tables 4, 5, '!nd 6 give arrival times and times associated with various parts of the pulse as illustrated in figure 2. Tables 7, 8, and 9 give amplitude, impulse, and energy data from all the shots,

8
Type a
T •c
Type b
E
Type c
A Detonation of charge B Start of strain pulse c Peak compressive strain 0 End of fall strain E Portion due to booster
1A Arr iva I time of pulse
t, Rise time
fc Com press ion time ,, Fall time •c Peak compressive
"t Tensile strain
strain
The horizontal longitudinal propagation velocity determined statistically from arrival time-distance data was· 18,500 ±350 ft/sec. This was the common slope for all shots.
Figures 3 and 4 are plots of rise and fall time versus distance (R) respec-tively. The appropriate times are shown individually for each explosive. No statistical analysis has been made of these data. Figure 3 clearly indicates the dependency of rise time on the detonation rate or detonation time. For pentolite, which has a constant detonation rate within experimental error, a smooth curve coUld be drawn through the data. There is a slight incre?se in rise time with increased distance, which may indicate absorption. For semigelatin dynamite, more scatter is apparent. However, it is generally true that the rise time at any given distance is shorter from a large diameter shot, indicating the
FIGURE 2. · Typical Strain Pulses. rise time-detonation rate dependency. This effect is
most pronounced for the AN-FO prills which have the slowest detonation rate and the greatest detonation rate-diameter effect.
Plots of fall time versus distance for each explosive are shown in figure 4. These plots exhibit a different phenomenon. Fall time has been associated with the size of cavity created by the detonation of the charge (]).

9
TABLE 4. - Arrival time and pulse shape data, pentolite
Shot- to- gage Arrival Rise Compression Fall Gage distance, time, time, time, time,
R, TA ' t r '
t. , tr' feet msec msec msec msec
Shot Sl6-A2-SH6, 5-Inch DLameter
SGl ..•..•.....•• 95 5.181 0.151 0.445 0.529 SG2 .......•••.•• 90 4.907 .134 .462 .521 SG3 .••••..•••.•. 80 4.349 .151 .474 .576 SG4 .•.•••.••.•.. 70 3. 795 .139 .434 .578 SG5 .•.•.•••••... 60 3.257 .126 .441 .584 SG6 ...•••••••.•• 50 2.693 .117 .450 .517 SG 7 .•..•.••.••.• 45 2.404 .113 .411 .525
Shot S4-A3-SH5, 2.5-Inch Diameter
SGl. ...••.•••••. 65 3.500 0.129 0.306 0.335 SG2 .••••.•...... 60 3.216 .121 .322 .335 SG4 ......••.•.•. 40 2.135 .125 .305 .293 SG5 ...•..•••.... 30 1.606 .101 .281 .285 SG6 ...•..••...•• 20 1.044 .101 .302 .256 SG7 .•..•..••.•.• 15 .805 .096 .297 .287
Shot S8-Al-SH2, 2.5-Inch Diameter
SGl. •....••••••• 15 0.810 0.084 0.304 0.261 SG2 .••••••••••.• 20 1.096 .093 .257 .299 SG3 ..••..••••••. 30 1.615 .114 .278 .291 SG4 ••..•..•...•• 40 2.166 .118 .281 .294 SG5 •.•........•. 50 2.699 .139 • 298 .428 SG6 ......••.•.•• 60 3.232 .126 .319 .416
Shot Sl2-A1-SH4, 1.5-Inch Diameter
SG1 .•.••••••.••. 53 2.870 0.121 0.234 0.293 SG2 ••.•••.•..••• 48 2.594 .113 .23'4 .221 SG3 ••••..••••••• 38 2.068 .104 .230 .200 SG4 .•.••..••.••• 28 1.527 .092 .204 .192 SG5 •••.•..•..... 18 .996 .092 .229 .200 SG6 ....•.•••..•• 8 .446 .079 .354 -SG7 ....•.•••...• 3 .183 - - -
Shot S19-A2-SH3, 1.5-Inch Diameter
SGl. •.........•. 3 0.210 0.071 - -SG2 •..••.••.•••• 8 .461 .084 - -SG3 ...••..•••.•• 18 1.014 .096 0.222 0.272 SG4 ...•••.•..••• 28 1.532 .108 .212 .221 SG5 .•••.•....••• 38 2.088 .096 .222 .260 SG6 .•.•.••••.••• 48 2.612 .122 .256 .235 SG7 .•••....••..• 53 2.909 .113 .252 .231

10
TABLE 5. - Arrival time and pulse shape data, semigelatin dynamite
Shot-to-gage Arrival Rise Compression Fall Gage distance, time, time, time, time,
R, TA ' tr' t. ' tr ' feet msec msec msec msec
- - ', -Shot S2 A3 SH6 5 Inch Diameter SGl. .•••••.••.•• 95 5.206 0.171 0.338 0.488 SG2 •.•.••••..•.. 90 4.935 .138 .372 .522 SG4 ........••... 70 3.808 .163 .405 .367 SG5 ...••••.••••. 60 3.297 .180 .380 .347 SG6 ...•..••.•••. 50 2. 729 .138 .380 .380 SG7 .............. 45 2.487 .121 .380 .414
Shot S7-Al-SH1 5-Inch Diameter SGl. .•••••....•• 45 2.489 0.122 0.375 0.624 SG2 ...•.•••.••.• 50 2. 755 .131 .397 .557 SG3 ..•.•.••.•... 60 3.287 .156 .413 .603 SG4 •..••..•....• 70 3.830 .143 .400 .619 SG5 .....•....•.. 80 4.360 .144 .422 .608 SG6 ....•••..••.• 90 4.888 .160 .447 .570
- -' ' . -Shot Sll Al SHS 2 5 Inch Diameter
SGl. ..••...••••• 65 3.498 . 0.185 0.295 0.227 SG2 •.•••.•••.••• 60 3.237 .152 .257 .227 SG3 ...••.•..••.. 50 2.697 .152 .274 .227 SG4 ...•••.•.•..• 40 2.177 .118 .249 .232 SG5 ....•.•••..•• 30 1.637 .100 .263 .259
- - . , . -Shot Sl5 A2 SH2 2 5 Inch Diameter SGL •.•.•••••.•• 15 0.821 0.092 0.281 0.281 SG2 ..•.•••••.••. 20 1.076 .096 .289 .264 SG3 ..•••.••••••. 30 1.633 .142 .297 .251 SG4 ..••••••••••• 40 2.165 .130 .290 .218 SGS ..••••••.••.• 50 2. 711 .147 .290 .269 SG6 .......••.... 60 3.249 .160 .299 .307 SG7 •.•••••..••. • 65 3.544 .164 .303 .295
- ' -Shot S6 A3-SH3 1 5 Inch Diameter SGl . ............ 3 0.186 0.080 - -SG2 •.••••••.•..• 8 .440 .085 0.309 -SG4 ..••••••.•••• 28 1.481 .114 .275 0.216 SG5 .•••••••.••. • 38 2.052 .117 .269 .214 SG6 ••••••••.••.• 48 2.623 .113 .259 .234 SG7 •••••••••••.• 53 2.865 .159 .267 .171
- . -Shot Sl8 A2-SH4 1 5 Inch Diameter SGl •.••••••••••• 53 2.855 0.210 0.310 0.188 SGZ • •••••••••••• 48 2.595 .189 .281 .180 SG3 .•••••••••••• 38 2.071 .176 .272 .189 SG4 ••••••••••.•• 28 1.518 .105 .272 .235 SG5 .••.••••••••• 18 .951 .109 .278 .278 SG6 ...•••••••••. 8 .391 .097 - -SG7 . •••••••••••• 3 .114 .101 - -
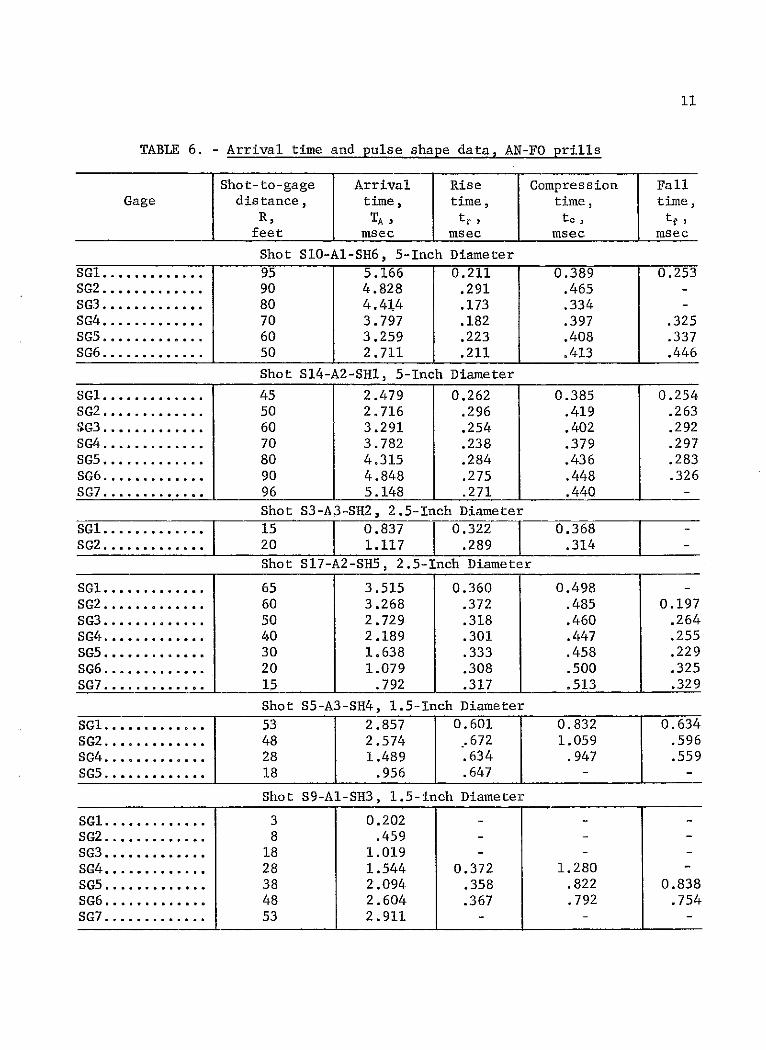
TABLE 6. - Arrival time and pulse shape data, AN-FO prills
Gage
SGl. .••••••••.•• SG2 .••••••.••••• SG3 •••••.••••••. SG4 •..•..••.•••• SGS .•••.••.••••. SG6 .....•.••....
SGl ..•.•••..•••. SG2 .•••.•.••..•. SG3 ..•.••••••••• SG4 .•••.•......• SGS ••••........• SG6 ...••......•• SG7 ........•••••
SGl. ...•.•••...• SG2 ...........••
SGl. •••••••.•••. SG2 •.••.••.••••• SG3 •.•••.••••••. SG4 ••••••••••••. SGS ••••...•.•••• SG6 ..•••••••.••. SG7 ..•..•.••.••.
SGl. .•••.••..... SG2 .•••..••••.•• SG4 ..••.•..•..•• SGS .•••.•••••.••
SGl. .•••...•.••. SG2 ..••••••••.•• SG3 •.••••••••••• SG4 ••••••.••••.• SGS ..••••••.•••• SG6 .••.•.••.•••• SG7 ....•...•.•..
Shot-to-gage Arrival Rise distance, time, time,
R, TA ' tr ' feet msec msec
Shot Sl0-Al-SH6, 5-Inch Diameter 95 5.166 0.211 90 4.828 .291 80 4.4],4 .173 70 3.797 .182 60 3.259 .223 50 2. 711 .211 Shot Sl4-A2-SH1, 5-Inch Diameter
45 so 60 70 80 90 96 Shot 15 20
2.479 0.262 2. 716 .296 3.291 .254 3.782 .238 4.315 .284 4.848 .275 5.148 .271
S3-A3-SH2, 2.5-Inch Diameter 0.837 0.322 1.117 .289
Compression time, tc,
msec
0.389 .465 .334 .397 .408 .413
0.385 .419 .402 .379 .436 .448 .440
0.368 .314
Shot Sl7-A2-SHS, 2.5-Inch Diameter
65 3.515 0.360 0.498 60 3.268 .372 .485 so 2. 729 .318 .460 40 2.189 .301 .447 30 1.638 .333 .458 20 1.079 .308 .500 15 . 792 .317 .513 Shot SS-A3-SH4, 1.5-Inch Diameter 53 2.857 0.601 0.832 48 2.574 .672 1.059 28 1.489 .634 .947 18 .956 .647 -
Shot S9-Al-SH3, 1.5-inch Diameter
3 0.202 - -8 .459 - -
18 1.019 - -28 1.544 0.372 1.280 38 2.094 .358 .822 48 2.604 .367 . 792 53 2.911 - -
11
Fall time, tf '
msec
0.253 --
.325
.337
.446
0.254 .263 .292 .297 .283 .326
-
-
0.197 .264 .255 .229 .325 .329
0.634 .596 .559
-
----
0.838 .754
-

12
TABLE 7. -Strain amplitude, impulse, and energy data, pentolite
Shot-to- Compressive Fall Compressive Total Compressive Total gage strain, strain, impulse, impulse, energy, energy,
Gage distance, E:c ' e, ' Ic' r, ' Ec' E., R, !Lin/in >Lin/in J.Lin sec/in J.Lin sec/in (11in/in)2 sec (>Lin/in)2 sec
feet X 104 X lo" X 10" X 106
Shot Sl6-A2-S6, 5-Inch Diameter
SGl 95 51.4 68.0 1.19 0.470 0.442 0.525 SG2 90 62.5 82.4 1.32 .444 .580 .692 SG3 80 60.4 76.6 1.31 .542 .544 .629 SG4 70 68.2 84.4 1.32 .395 .598 .708 SG5 60 107 130 2.12 1.00 1.62 1.78 SG6 50 135 160 2.66 2.03 2.46 2.54 SG7 45 150 183 2.65 - 2. 73 3.04
Shot S4-A3-SH5, 2.5-Inch Diameter
SG1 65 47.4 62.4 0. 726 0.195 0.253 0.695 SG2 60 58.9 75.4 .853 .233 .345 .961 SG4 40 99.0 126 1.59 .875 1.21 3.06 SG5 30 166 192 2.11 1.39 2.51 6.00 SG6 20 276 296 3.65 3.27 7.00 16.0 SG7 15 439 - - - - -
Shot S8-Al-SH2, 2.5-Inch Diameter
SGl 15 414 451 6.05 5.89 17.6 17.7 SG2 20 235 257 3.03 2.57 5.49 5.57 SG3 30 162 191 2.28 1.46 2.74 2.87 SG4 40 97.1 110 1.40 .999 1.02 1.05 SG5 50 78.4 97.5 1.09 .436 .651 .733 SG6 60 48.8 60.8 .723 .260 .261 .295
Shot S12-A1-SH4, 1.5-Inch Diameter SG1 53 32.5 47.0 0.404 0.154 0.0955 0.123 SG2 48 44.3 58.3 .476 .217 .145 .171 SG3 38 49.5 64.7 .566 .210 .206 .248 SG4 28 64.2 87.5 .714 .218 .339 .413 SG5 18 133 155 1.49 .827 1.41 1.52 SG6 8 270 - 4.12 - 7.90 -
Shot Sl9-A2-SH3, 1.5-Inch Diameter
SG1 3 1,180 - 13.8 - 126 -SG2 8 384 - 5.0 - 12.5 -SG3 18 121 136 1.33 0.928 1.18 3. 93
.
SG4 28 51.4 69.5 .579 - .224 -SG5 38 45.0 56.9 .515 .215 .171 .626 SG6 48 25.4 34.3 .313 .0890 .0589 .232 SG7 53 22.6 30.8 .289 .104 .0489 .188
13
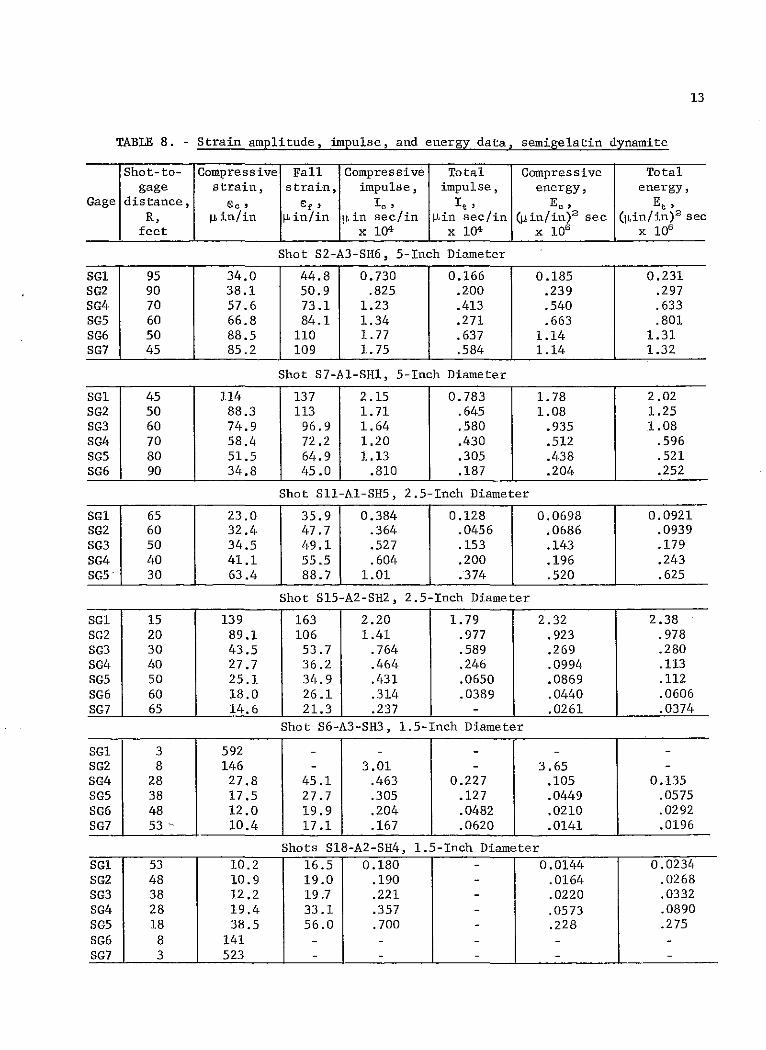
TABLE 8. - Strain amplitude, llnpulse, and energy data, semigelatin dynamite
Shot-to- Compressive Fall Compressive Total Compressive Total gage strain, strain, impulse, impulse, energy, energy,
Gage distance, ~c ' €r' Io' I,' E,' E,' R, f.' in/in f1 in/in 1-1 in sec/in !-Lin sec/in (f.Lin/in)2 sec (f.Lin/in) 2 sec
feet X 1()4 X 104 X 106 X 106
Shot S2-A3-SH6, 5-Inch Diameter
SGl 95 34,0 44.8 0.730 0.166 0.185 0.231 SG2 90 38.1 50.9 .825 .200 .239 .297 SG4 70 57.6 73.1 1.23 .413 .540 . 633 SG5 60 66.8 84.1 1.34 .271 .663 .801 SG6 50 88.5 no 1.77 .637 1.14 1.31 SG7 45 85.2 109 1. 75 .584 1.14 1.32
Shot S7-Al-SH1, 5-Inch Diameter
SGl 45 114 137 2.15 0.783 1. 78 2,02 SG2 50 88.3 ll3 1.71 .645 1.08 1.25 SG3 60 74.9 96.9 1.64 .580 .935 1.08 SG4 70 58.4 72.2 1.20 .430 .512 .596 SG5 80 51.5 64.9 1.13 .305 .438 .521 SG6 90 34,8 45.0 .810 .187 .204 .252
Shot Sll-Al-SH5, 2.5-Inch Diameter
SGl 65 23.0 35.9 0.384 0.128 0.0698 0.0921 SG2 60 32.4 47.7 .364 .0456 .0686 .0939 SG3 50 34.5 49.1 .527 .153 .143 .179 SG4 40 41.1 55.5 .604 .200 .196 .243 SG5 30 63.4 88.7 1.01 .374 .520 .625
Shot Sl5-A2-SH2, 2.5-Inch Diameter
SGl 15 139 163 2.20 1. 79 2.32 2.38 SG2 20 89.1 106 1.41 .977 .923 .978 SG3 30 43.5 53.7 .764 .589 .269 .280 SG4 40 27.7 36.2 .464 .246 .0994 .113 SG5 50 25.1 34.9 .431 .0650 .0869 .112 SG6 60 18.0 26.1 .314 .0389 .0440 .0606 SG7 65 14.6 21.3 .237 - .0261 .0374
Shot S6-A3-SH3, 1.5-Inch Diameter
SG1 3 592 - - - - -SG2 8 146 - 3.01 - 3.65 -SG4 28 27.8 45.1 .463 0.227 .105 0.135 SG5 38 17.5 27.7 .305 .127 .0449 .0575 SG6 48 12.0 19.9 .204 .0482 .0210 .0292 SG7 53~ 10.4 17.1 .167 .0620 .0141 .0196
Shots S18-A2-SH4, 1.5-Inch Diameter SGl 53 10.2 16.5 0.180 - 0.0144 0.0234 SG2 48 10.9 19.0 .190 - .0164 .0268 SG3 38 12,2 19.7 .221 - .0220 .0332 SG4 28 19.4 33.1 .357 - .0573 .0890 SG5 18 38.5 56.0 .700 - .228 .275 SG6 8 141 - - - - -SG7 3 523 - - - - -

14
Gage
SGl SG2 SG3 SG4 SG5 SG6
SG1 SG2 SG3 SG4 SG5 SG6 SG7
SG1 SG2
SGl SG2 SG3 SG4 SG5 SG6 SG7
SGl SG2 SG4 SGS
SG4 SG5 SG6
TABLE 9. - Strain amplitude, impulse, and energy data, AN-FO prills
Shot-to-gage
distance, R,
feet
95 90 80 70 60 50
45 50 60 70 80 90 95
15 20
65 60 50 40 30 20 15
53 48 28 18
28 38 48
Compressive Fall Compressive Total Compressive strain,
Ec' f>in/in
14.9 16.5 17.7 25.2 31.6 31.4
40.5 34.0 22.9 17.9 17.2 13.7 13.7
38.4 19.6
3.86 4.09 4.28 5.67
11.5 19.2 30.6
0.833 1.09 2.89 7.02
3.89 2.38 1. 81
strain, impulse, impulse, energy,
e, ' Ic ' I,' Ec' f'in/in JJ,in sec/in ~in sec/in (f>in/in)2 sec
x HJ' X lif X lif
Shot Sl0-Al-SH6, 5-Inch Diameter
21.5 0.354 0.0793 23.6 .397 .0748 31.6 .373 --34.1 .581 .141 42.7 .751 .192 40.8 .813 .311
Shot Sl4-A2-SHL, 5-Inch Diameter
55.5 0.938 0.193 46.9 . 793 .183 32.3 .521 -26.1 .398 -23.9 .411 .0981 19.4 .346 .104 19.8 .348 .0481
Shot S3-A3-SH2, 2.5-Inch Diameter
0.529 .297
0.0413 .0480 .0489 .110 .181 .201
0.287 .205 .0896 .0529 .0934 .0364 .0364
0.132 .0430
Shot S17-A2-SH5, 2.5-Inch Diameter
7.00 0.104 0.0268 0.00288 7.07 .110 .0374 .00325 7.40 .100 - .00312
10.2 .113 - .00475 17.1 .243 .138 .0204 24.6 .412 .330 .0565 40.8 .650 .493 .137
Shot S5-A3-SH4, 1.5-Inch Diameter
1.89 0.0261 - 0.000130 1.60 .0610 0.0410 .000546 4.33 .121 .0696 .00231 - - - -
Shot S9-Al-SH3, 1.5-Inch Diameter
2.91 0.197 0.0501 0. 00505 2.60 .0856 .0101 .00137 - .0591 - .000630
Total energy,
E, , (f>in/in)2 sec
X 106
0.0527 .0642 .128 .138 .225 .237
0.352 .256 .122 .0736 .0680 .0461 . 0501
0.00471 .00482 ,00508 ,00888 .0248 ,0595 .147
0.000443 .000658 .00282 -
0.00505 ,00153 .000847

u
'" ~ E
w <J)
"'
0
'" m E
w <J)
"'
u
'" m E
w ::;; t
w <J)
"'
0. 3 ,----,--,---,---., .. , ,,.--~--,.--,-,--,---,,---,-.-r..,.,
Penta lite -
0 0 6 A/\0 0
rf>. 6~>0 z; B -
0 .I 1-
0.3,--.,.--,,,.,.-,.,,---1 ----,----,-,-,-,.,,-,n
Semigelotin dynamite
.I 1- D 0 0
0 6 6
I. 0 .--------,--,.--,...-r--.TTr-1
----,-,---,--,-,,---,,-,TTl
0.1
AN-FO prills
0 5-inch diameter 8 2.5-inch diameter 0 1.5-inch diameter,
0 D 0
D
D 0 0 ~ 6
6 tl oa:, 0 0
0
0 0 0
L--~-~~~~~·_ui ______ L_,~ __ i_•i_~_u·u
2 10 100 DISTANCE, R, feet
FIGURE 3.- Rise Time Versus Distance.
Average Cavity Size
u
'" m E
u
'" m E
w
"' .... -' -'
"' u..
u
'" m E
w
"' ;::
15
I. 0 ,.----,,----,----,-,---,-.,-,,.,
Pentolite
0 0 0
' __l_L_l 0. I '-----.!--'-----'--'--'--'--'--'-'
1.0 ,-----,--,--,-,--,--,, ,.,. ,-,-, ''-
Semi gelatin dynamite
0
0. I '-----'---J.-'-L...J.-'-L..W'
1.0 .---.,----,---.,.--.,.-.,-,,,, AN-FO prills
0
0
0
0 0 0 0 00
6. o.9 o
o 5-inch diameter tJ. 2.5- inch diameter D 1.5-inch diameter
' ' 0. I ':---'---J.-L....JL..l--WL...L..J_ 10 100
DISTANCE, R, feet
FIGURE 4.- Fall Time Versus Distonce.
Table 10 gives the average cavity size (volume of rock broken) from each explosive in each diameter, Comparing cavity size from the table with relative fall times indicates that for a given explosive, longer fall times correlate with larger cavities. It is also true among explosives that larger cavity sizes may be correlated with longer fall times. The only exception is from the 1.5-inch-diameter charges of AN-FO prills which are probably subjected to the most error due to reflected wave arrivals.

16
TABLE 10. -Average cavity size, ft3
Explosive charge diameter, Pentolite Semigelatin AN-FO inches dynamite _prills
5 .....••......•........•......• 2. 75 1.84 1.01 2. 5 •••••••••••••••••••.••.••••• .53 .60 .27 1. 5 •••••••••••••••••••••••••••• .17 .11 .04
Data Analysis
All strain amplitude, impulse, and energy data were treated statistically to determine common slopes and individual intercepts for each parameter. Straight lines were fitted to the data by using an equation of the form
y = KR-n
where K = intercept at R = 1,
n = decay exponent or slope of regression curve,
and R = distance.
Y represents the parameter under study. Thus Y is one of the following: peak compressive strain (e 0 ), fall strain (er), compressive impulse (I
0) 2
total impulse (It), compressive energy (E0 ), and total energy (Et).
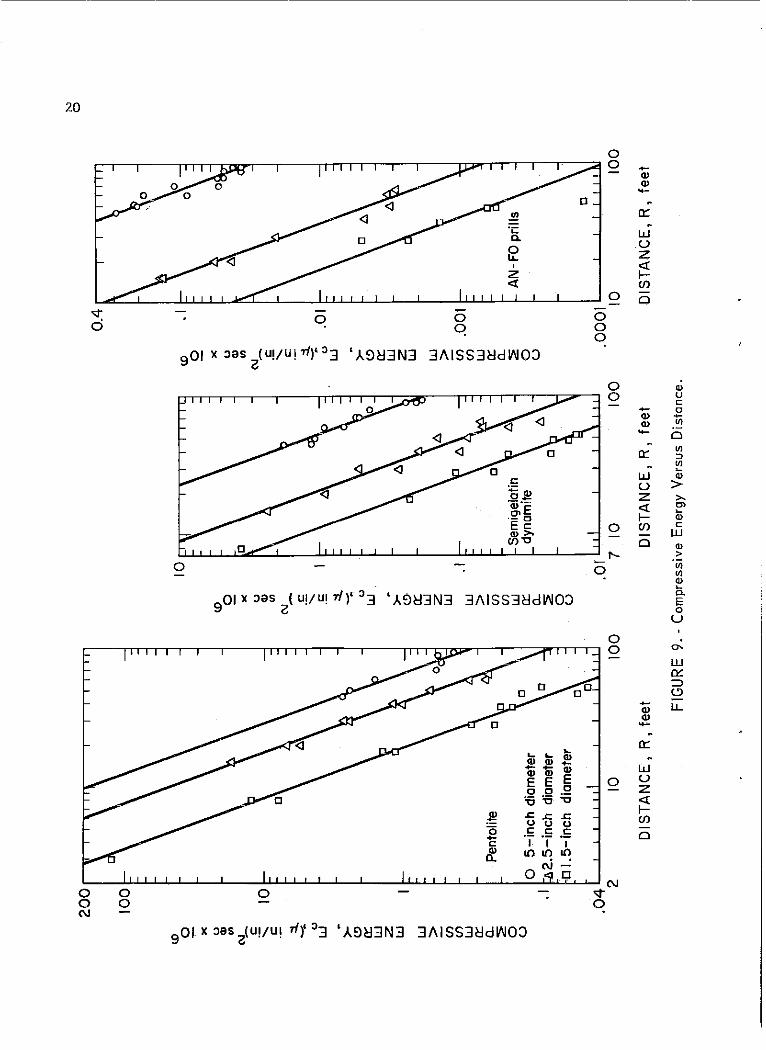
Figures 5 through 10 are plots of the data for each parameter versus distance. The data from each explosive type has been shown separately in each figure. Table 11 is a summary of intercept and slopes of the data shown in the previous figures. The missing values include data from shot 1 omitted because of noise. In other sets only two reliable data points existetl for a
~ 1,000
100 0 5-inch diameter 6 2.5-inch diameter [] 1.5-inch diameter
Pentolite
" 20L-~~~~LL--~--L-LL0~~ 2 10
DISTANCE, R, feet
100
c
' ~
~
z " ~ ~ ~
w > ~ ~ w ~ ~ ~ 0 u
< ~ w ~
' c
~ . z <i ~ ~ ~
100 w > ~ 00 w ~ ~
~ 0 u
< ~ w
Semigelotin dynamite ~
100 10~~~~~~--~-L~~~
2 10
DISTANCE, R, feet
FIGURE 5. • Peak Compressive Strain Versus Distance.
70
AN·FO " I prills " .7
10
DISTANCE, R, feet

• Q
" 10
w > "' "' w
"" a.
" 0 u
0 5-inch diameter ll 2.5- inch dlomeier 0 I. 5- inch diameter
DISTANCE, R, feet
100
600
·= ' c
"-; ., "' "" ,_ "' -' -'
"' ~
10
·= ' ·= "-; z
"' "" ,_ "' -' -' cc
Semigelalin dynamite
10 100
DISTANCE, A, feel
FIGURE 6. - Fall Strain Versus Distance.
Pentolite
0 5-inch diameter ll 2.5-inch diameter
C I . 5- inch diameter
10
DISTANCE, R, feet
D D
·100
• Q
" c
' u ~ c
~
:: w "' -' => a.
"' w
"' "' "' w oc a.
" 0 u
10
Semigelatin dynamite
.I 7 10 100
DISTANCE, R, feet
17
60
0 0
0 0
0
10 " "'
0
AN- FO prills
0
I \
10 100
DISTANCE, R, feet
" Q
c
' "a u
* c ~
~"
w .I "' -' => a.
" w
"' AN-FO prills
"' "' 0 w
"" a.
" 0 u
.01 10 100
DISTANCE, R, feet
FIGURE 7.- Compressive Impulse Versus Distance.
parameter for a given shot; the data points are shown in the figures but not included in the table because two data points cannot be treated statistically.

TABLE 11. - Summary of intercepts and slopes
Charge K x 104 ~in/in K x 106 ~in sec/in diame·ter, Peak 13 Fall Compressive Total
inches strain, strain, impulse, impulse, n = -1.40 ±0.02 n = -1.27 ±0.09 n = -1.37 ±0.03 n = -2.11 ±0.09
------------ ----
Pentolite 5 .•.••..... - - - -5 ........•. 3.12 2.24 5.49 6.42
Average. 3.12 2.24 5.49 6.42 2. 5 •••••.•. 1.85 1.37 2.29 1.65 2 . 5 •••.•••. 1. 75 1.29 2.20 1. 75
Average. 1.80 1.33 2.25 1. 70 1. 5 ....•... .764 .684 8.14 .458 1. 5 .......• .631 .513 6.81 .402
Average. .698 .599 .748 .430 Semige1atin Dynamite
5 •.••••.... 2.07 1.55 3.76 2.29 5 .••..••••. 2.24 1.64 4.11 2.85
Average. 2.16 1.60 3.94 2.57 2 . 5 ..•.•.•. .831 .720 . 936 .513 2 . 5 .••.•••• .559 .460 .905 .442
Average. . 695 .590 .921 .478 1. 5 .•....•. .284 .287 .443 .237 1. 5 •.•••••• .237 .235 .366 -
Average. ---- .260
' .260 .405 .237
AN-FO Frills 5 ••••.•...• 0.895 0. 730 1.83 1.12 5 •••••••••• • 787 .635 1.60 .842
Average. .841 • 683 1.72 .981 2 • 5 .••••••• - - - -2 . 5 •..•..•• .125 .122 .251 .180
Average. .125 .122 .251 .180 1. 5 .•••.•.• .0290 .0271 .096 -1. 5 ••.•.••• .0412 - .142 -
Average. .0351 .0271 .119 --·· -·
K X 108 (~in/in)2 sec Compressive Total
energy, energy, n = -2.74 ±0.06 n = -0.55 ±0.06
- -1 010 522 1,010 522
262 335 249 139 256 237 38.4 26.6 27.6 53.7 33.0 40.2 .•
494 270 581 310 538 290 52.3 32.1 31.0 18.9 41.7 25.5
8.99 5. 73 5.91 4.56 7.45 5.15
105 67.4 80.7 47.9 92.9 57.7
- -1.94 1.38 1.94 1 .• 38
.144 .124
.255 .185
.250 .155
,... "'

-' <( to 1-
0 5-inch diameter 6 2.5-inch diameter
0.1 D 1.5-inch diameter
" !e " '' ' u • " c
"-..:-w
"' -'
" a.
"' -' <( 1-0 1-
19
" Q
" c
' u • " c
"-~0.1
w
"' -' 0.1 " a.
"' -' <( 1-0 1-
.07 L_ _ _,_ _ _L_...J_.J.....]U-L.J...J .0 2 L_ _ _j _ _..J...---l.-l.._j_L..A_LJ .0 I '---'----'-'-..__..__._....._, 10 100 10 100 10
DISTANCE, R, feet DISTANCE, R, feet DISTANCE, R, feet
FIGURE 8. -Total Impulse Versus Distance.
Examination of table 11 indicates that an effect considerably greater than that expected from detonation rate-diameter dependency is present.
100
First, consider peak strain within and between explosives. Peak compressive strain is less by a factor of 4 from 1.5-inch-diameter shots than from 5-inchdiameter shots of pentolite. The detonation rate and pressure are virtually the same. Included, then, in the fourfold reduction are effects due to charge size and geometry. No scaling was applied to the data. Under similar conditions, reductions by factors of about 8 and 24 are evident in data from semigelatin dynamite and AN-FO prills, respectively, when charge diameter is reduced from 5 to 1.5 inches. The excess above the fourfold reduction observed in pentolite data indicates a significant decrease in straingenerating ability for small-diameter nonideal explosive charges. Also it should be noted that 5-inch-diameter charges of all these explosives show only a fourfold change in peak strain intercept for large changes in detonation rate and pressure. The lesser change in rate and pressure for the different diameter charges of semigelatin dynamite and AN-FO prills produce much larger changes in peak strain intercept. Similar comparisons are apparent in the various other parameters.
CONCLUSIONS
Small-diameter explosive charges which detonate under nonideal conditions are much less effective than larger diameter charges of the same explosive in producing strain waves in rock than would be predicted solely from the decreased detonation rate and pressure, The loss in efficiency is greater than effects due to charge size and geometry.
20
gOI X :Jas z(U!/U! Tf)' ~3 ',1,91:13N3 3AISS31:1dlo".IO::l
901 x :~as
21 U!/U! Tf)' ~3 ',1,91:13N3 3AISS31:1dlo".IO::l
-"' "' -0::
IJ.J .U z ~ (/)
0
-"' "' -0::
IJ.J u z <t 1-
0 (/) Cl
0
Q) u
" c 1ii 0 Ill ::> Ill :;; > >-"' :;; " UJ Q)
> Ill Ill Q) ~
0. E c
u
r---,.TTTO-r-r--r----nOTO>roro--~---.nn'"~~--.---~rrrrTO 0 ~
-"' "' -IJ.J u z ~ (/)
0
l!J 0:: => (.!)
LL
21
0 5- inch diameter
"' 2.5-inch diameter
0 1.5-inch diameter
30 3 <D .I Q
<D <D 0 0
X 10 X <.> <.> <D 00 <D
00
X <.> <D
"' N .s ' .!:
"' N .!: "
::t.
' ' " " w ::t. ::t.
>-"' a:
..... ..... w z
>- >- .I
"' "' a: a: ..... ..... z z w w
w
-' <l >-0 >-
-' -' <l <l >- >-0 0 >- >-
Penta lite Semlgelatin
.001
dynamite
.I .01 10 100 10 100 10 100
DISTANCE, R, feet DISTANCE, R, feet DISTANCE, R, feet
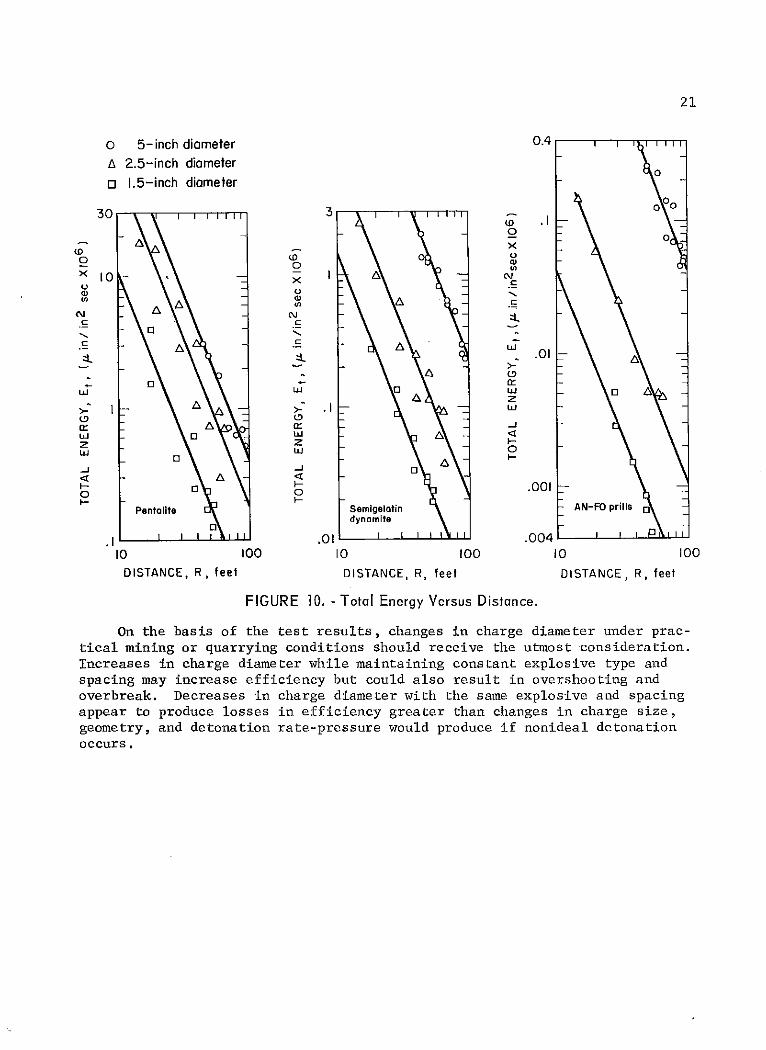
FIGURE 10.- Total Energy Versus Distance.
On the basis of the test results, changes in charge diameter under practical mining or quarrying conditions should receive the utmost consideration. Increases in charge diameter while maintaining constant explosive type and spacing may increase efficiency but could also result in overshooting and overbreak. Decreases in charge diameter with the same explosive and spacing appear to produce losses in efficiency greater than changes in charge size, geometry, and detonation rate-pressure would produce if nonideal detonation occurs.

22
REFERENCES
l. Brown, R. F. Determination of Basic Performance Properties of Blasting Explosives. Ch. in First Symposium on Rock Mechanics. Colorado Sch. Mines Quart., v. 51, No.3, July 1956, pp. 171-188.
2. Cook, Melvin A. The Science of High Explosives. Reinhold Publishing Corp., New York, 1958, pp. 44-59.
3. Duvall, Wilbur I., and Thomas C. Atchison. Rock Breakage By Explosives. BuMines Rept. of Inv. 5356, 1957, 52 pp.
4. Hooker, Verne E., Harry R. Nicholls and Wilbur I. Duvall. In Situ Stress Determinations in a Lithonia Gneiss Outcrop. Earthquake Notes, v. 35, Nos. 3-4, September-December 1964, p. 46.
5. Nicholls, Harry R., Lyle W. Colburn, Thomas R. Bur, and Thomas E.
6.
Slykhouse. Comparison of Two Methods for Studying Relative Performance of Explosives in Rock. BuMines Rept. of Inv. 6888 (in Press).
Obert, Leonard, and Wilbur I. Duvall. A Gage and Recording Equipment for Measuring Dynamic Strain in Rock. BuMines Rept. of Inv. 4581, 1949, 11 pp ..
7. Sharpe, J. A. The Production of Elastic Waves by Explosion Pressure, Part I. Theory and Empirical Field Observations. Geophysics, v. 7, No. 2, 1942, pp. 144-154.
INT,~BU,OF MINES,PGH.,PA. 9815