the effect of silicon on the electrochemical corrosion
TRANSCRIPT

The Effect of Silicon on the Electrochemical Corrosion Resistance of Carbon Steel
A Senior Project
Presented to
The Faculty of the Materials Engineering Department
California Polytechnic State University, San Luis Obispo
In Partial Fulfillment
Of the Requirements for the Degree
Bachelor of Science in Materials Engineering
By
Loan Faget and Michael Rouse
June, 2014
© Loan Faget and Michael Rouse


Approval Page Project Title: The Effect of Silicon on the Electrochemical Corrosion
Resistance of Carbon Steel
Author: Loan Faget, Michael Rouse
Date Submitted: June 9, 2014
Prof. Trevor Harding _____________________________ Faculty Advisor Signature Prof. Katherine Chen _____________________________ Department Chair Signature
CAL POLY STATE UNIVERSITY Materials Engineering Department
Since this project is a result of a class assignment, it has been graded and accepted as fulfillment of the course requirements. Acceptance does not imply technical accuracy or reliability. Any use of the information in this report, including numerical data, is done at the risk of the user. These risks may include catastrophic failure of the device or infringement of patent or copyright laws. The students, faculty, and staff of Cal Poly State University, San Luis Obispo cannot be held liable for any misuse of the project.

i
Abstract The purpose of this study was to investigate how the silicon (Si) content of carbon steels affects their electrochemical corrosion resistance. Tests were conducted using concentrated HCl and carbonated water on three carbon steels with different levels of silicon: 0.02, 0,19, and 0.94 weight percent. Like H2S, the prime concern of Chevron, HCl and CO2 are corrosive components in oil refinery. Electrochemical properties were measured using a potentiodynamic test outlined in Standard ASTM G59-97: Test Method for Conducting Potentiodynamic Polarization Resistance Measurements. Previous studies have determined that adding silicon to steel increases the corrosion resistance; however, results show that corrosion rates appear to increase with higher silicon content within HCl.

ii
Acknowledgments We wish to express our gratitude to everyone who has helped us completing this project: Jessica Salvatin and Matt Manges at Chevron for supplying samples, providing funding and advising us, Trevor Harding for supervising our project and his guidance and Lisa Rutherford for helping us acquire equipment and materials. We would also like to thank Tom Featherstone for helping dispose of hazardous waste, Christine Ghent for helping us with technical difficulties and James Smith of Metal Samples Company for sample manufacture.

iii
Table of contents
Abstract ............................................................................................................................. i List of Figures ................................................................................................................. iv List of Tables ................................................................................................................... v 1.0 Introduction ................................................................................................................ 1 1.1 Corrosion ................................................................................................................... 2 1.2 Forms of Corrosion Damage .................................................................................... 4 1.3 Prevention .................................................................................................................. 6 1.4 Testing ........................................................................................................................ 7 2.0 Experimental Procedure ......................................................................................... 10 2.1 Test Cell Preparation ............................................................................................... 10 2.2 Sample Preparation ................................................................................................. 11 2.3 Calculations ............................................................................................................. 12 3.0 Results ...................................................................................................................... 13 4.0 Discussion ............................................................................................................... 15 5.0 Conclusions ............................................................................................................. 17 References ..................................................................................................................... 18 Appendix ........................................................................................................................ 20

iv
List of Figures
FIGURE 1: POURBAIX DIAGRAM. .......................................................................................................... 3 FIGURE 2: ELECTROCHEMICAL CELL. .................................................................................................. 8 FIGURE 3: POTENTIOSTAT CELL. ........................................................................................................ 9 FIGURE 4: CORROSION RATES OF TESTED SAMPLES. ......................................................................... 13 FIGURE 5: SAMPLE WEIGHT LOSS. .................................................................................................... 14 FIGURE 6: SEM IMAGES OF SAMPLES. .............................................................................................. 14

v
List of Tables
TABLE I: DENSITY AND EQUIVALENT WEIGHT OF SAMPLES ................................................................... 12

1
1.0 Introduction
Steel has been an integral part of technological and industrial development since
antiquity, with the earliest known example of steel production dating back 4000
years.1 Since that time, steel production techniques and materials have
continually evolved. Steel was not seen in its modern form until the 18th century,
which brought advances in using the coal derivative coke instead of the
previously more common component charcoal.2
Modern steel is an alloy composed of iron and up to 2 weight percent carbon,
often with other alloying elements (e.g. Si, Mn, Cu) that can have a significant
impact on the properties and microstructures of the material. In 2010, the world
annual production of crude steel reached about 1.4 billion tonnes used in a
multitude of applications. Most steels are produced using one of two methods:
integration of raw materials (e.g. iron ore, limestone, coke) in a blast furnace or
basic oxygen furnace or recycling of scrap metal through an electric arc furnace.3
Carbon steel is the most commonly used material in the refining and petroleum
industry; in fact, up to 80% of the components are comprised of carbon steel.
This material is widely used because it is inexpensive, readily available, easily
fabricated, and can be heat-treated after welding. It is used in particular for large
pipelines, heat exchangers and pressure vessels in refining. Low alloys (C-Cr-
Mo) may also be used for furnace tubes, piping, heat exchanger shells, and
separator drums because they tend to have adequate strength retention and

2
resistance to sulfidic corrosion. In more corrosive environments, such as high-
temperature sulfidic and naphthenic acid, stainless steels are used.4
1.1 Corrosion
Corrosion is the chemical reaction of a material with its environment that causes
degradation of the material. The reaction can be classified in multiple ways
including by the nature of the corrodent of which there are two categories, wet
and dry.5 In this classification scheme, wet corrosion refers to the corrosion of a
material in an aqueous environment with an electrolyte, and dry corrosion refers
to the corrosion of a material in a gaseous environment, typically at high
temperatures. Appearance of the corroded metal (uniform or localized) is another
way to classify corrosion. Uniform corrosion occurs when the corrosion reaction
takes place over the entire surface of a material while localized corrosion occurs
at specific locations.6
Corrosion can also be classified by the mechanism of corrosion, which normally
falls under the categories of electrochemical and direct chemical. The most
common corrosion mechanism is electrochemical, taking place when two or more
electrochemical reactions occur, including at least one oxidation reaction and one
reduction reaction. To be classified as electrochemical corrosion, there are four
main requirements that the reaction must satisfy. There must be an anode and a
cathode to provide sites for oxidation and reduction, respectively. There must
also be paths for electrons to flow from the anode to cathode, and a path for the

3
movement of ions from cathode to anode. If any one of these four components is
removed, corrosion stops.5
Depending on the environment, metals will exhibit one of three responses to an
electrochemical reaction: immune, active, or passive. Materials that are
thermodynamically stable within an environment are immune and will not
corrode. Active metals undergo the corrosion reaction within certain environment
and form corrosion products. In passive behavior, corrosion initially occurs but
the reaction product is insoluble, acting as a protective film. This coating
significantly lowers the rate of corrosion but if broken, the metal reverts to active
behavior. In order to determine how a metal will act, the thermodynamics and
kinetics of the system need to be analyzed. Thermodynamics states that a
reaction will occur spontaneously if it lowers the free energy of the system.
Potential-pH diagrams, or Pourbaix diagrams (Figure 1), utilize the
thermodynamics in order to predict the behavior of a pure metal at 25 °C given
the pH and potential of an electrolytic solution.
Figure 1: Pourbaix diagram for iron in water.7

4
Steels are primarily composed of Fe; therefore, the potential-pH diagram of Fe is
used to predict the behavior of this material. The three main regions of the
diagram correspond to the three types of corrosion behavior: immunity,
passivation, and active corrosion. The region labeled "Fe" corresponds to
immune behavior; the iron's expected chemical state is solid, metallic iron. The
region labeled Fe2O3 corresponds to passive behavior, with the printed chemical
formula describing the protective oxide layer that forms. Finally, the region
labeled "Fe2+" corresponds to active behavior, showing that solid iron is being
converted to its ionic form.
1.2 Forms of Corrosion Damage
Metals or alloys can exhibit a variety of corrosive behaviors. Several forms of
corrosion relevant to the petrochemical industry are pitting corrosion and
hydrogen damage.
Every engineering metal or alloy is susceptible to pitting corrosion depending on
the environment. This highly localized form of corrosion features sharply-defined
holes, which may be small or large and can form closely together or are isolated.
Pitting corrosion can be difficult to detect because material failure can occur with
small weight loss as early as a few months to as long as several years. Causes
of pitting include: biological organisms, breaking of the protective oxide coating
via a mechanical or chemical process, and a local loss of passivity. In steels, Fe
5
can form shallow pits when immersed in soil or deep pits within a seawater
environment.5
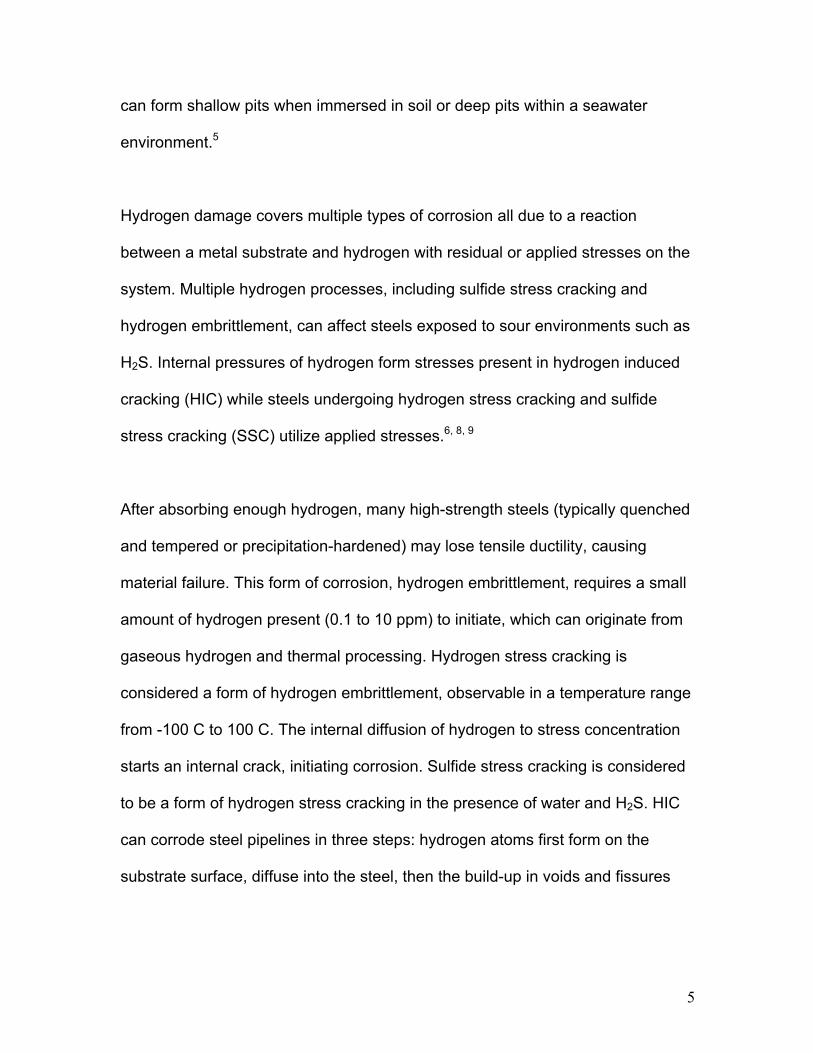
Hydrogen damage covers multiple types of corrosion all due to a reaction
between a metal substrate and hydrogen with residual or applied stresses on the
system. Multiple hydrogen processes, including sulfide stress cracking and
hydrogen embrittlement, can affect steels exposed to sour environments such as
H2S. Internal pressures of hydrogen form stresses present in hydrogen induced
cracking (HIC) while steels undergoing hydrogen stress cracking and sulfide
stress cracking (SSC) utilize applied stresses.6, 8, 9
After absorbing enough hydrogen, many high-strength steels (typically quenched
and tempered or precipitation-hardened) may lose tensile ductility, causing
material failure. This form of corrosion, hydrogen embrittlement, requires a small
amount of hydrogen present (0.1 to 10 ppm) to initiate, which can originate from
gaseous hydrogen and thermal processing. Hydrogen stress cracking is
considered a form of hydrogen embrittlement, observable in a temperature range
from -100 C to 100 C. The internal diffusion of hydrogen to stress concentration
starts an internal crack, initiating corrosion. Sulfide stress cracking is considered
to be a form of hydrogen stress cracking in the presence of water and H2S. HIC
can corrode steel pipelines in three steps: hydrogen atoms first form on the
substrate surface, diffuse into the steel, then the build-up in voids and fissures

6
forming blisters. Internal pressure increases eventually causing cracks that
connect the blisters.6, 8, 9
1.3 Prevention
Corrosion can be prevented using one or more of the following methods: alloy
additions and four others, including coatings and inhibitors. Si has been found to
have various effects when added to steels. For example, most steels contain a
small percentage of silicon as it makes it harder and stiffer by hardening the
ferritic phase. It also alters the electrical and thermal properties by increasing
resistivity. The addition of Si in steel removes oxygen, as it is an important
deoxidizer. At high temperatures, silicon can increase oxidation resistance of
steel.10
Serajzadeh and Taheri studied the effects of Si on the flow behavior of steel.11
The authors found that an increase in the Si content increased the strength of
austenite while decreasing the rate of dynamic recovery and recrystallization as
well as the diffusion rate of C. It was concluded that these factors led to an
increase in flow stress and consequently, higher activation energy for silicon
steel than of the self-diffusion energy for austenite.
Another study measured the effect of silicon coatings on the corrosion rates of
various steels by measuring the mass lost within each test environment. It was
concluded that the corrosion resistance of the steel containing higher silicon

7
contents increases with siliconizing time along with the carbon content of the
steel.12
Although limited data is available on the effects of Si on the corrosion resistance
of steels, it is known that if enough Si is added to steel, the stress corrosion
resistance of the material can increase. In one experiment, five 4340 steel
samples each containing different levels of Si (0.09 wt. % to 2.15 wt. %) were
placed under tensile stress, then NaCl solutions were dropped onto the samples.
It was observed that stress corrosion crack velocity decreased in the samples
containing higher amounts of Si although the threshold stress intensity parameter
did not increase.13
Because of these limited results, it may be beneficial to explore C-based steels
that contain Si.
1.4 Testing
There are multiple electrochemical methods of corrosion testing, all of which are
based on the mixed-potential theory. This theory provides information about
corrosion and can help to determine the corrosion rate or the corrosion behavior
of the metal (active, passive or immune).14
An elementary electrochemical cell (Figure 2) is composed of two half-cells. The
anodic site, where the metal is located, is linked to the cathodic site by a metallic

8
path. Net oxidation reaction occurs at the anode while net reduction takes place
at the cathode. The corrosion rate is equal to the anodic and cathodic rates.
During these reactions, there is a transfer of electrons and ions at the surface of
the anode and cathode and therefore a change in electrical potential. This
constitutes the electrochemical cell where electrons flow from the anode to the
cathode.14
Figure 2: Diagram of an electrochemical cell.15
Electrochemical corrosion is often tested using a potentiostat. A metal sample,
along with two different electrodes, is immersed within an electrolyte solution
(Figure 3). The potentiostat allows the user to adjust the potential of the sample
and measure the current between the working (sample) and the reference
electrode. Anodic and cathodic reactions take place at the working electrode
where the corroding metal is placed. The reference electrode has a constant
electrochemical potential while the counter electrode conducts the current from

9
the working electrode leaving the solution. For a potentiostatic experiment,
potential is constant and current is measured as a function of time. In a
potentiodynamic experiment, potential varies and current is now a function of
potential. Conversely, current can be controlled instead of the potential for a
galvanostatic or galvanodynamic experiment.14
Figure 3: A schematic potentiostat highlighting the different components.16
Employees of Chevron were interested in the corrosion behavior of carbon steel
in H2S at high temperatures. It was suspected that changing the Si alloy content
in carbon steel affects the electrochemical corrosion resistance of the material.
The corrosion resistance of multiple steels was to be measured using ASTM
G59-97: Standard Test Method for Conducting Potentiodynamic Polarization

10
Resistance Measurements. Similar to and containing references of ASTM G5-94,
this test describes how to take polarization resistance measurements of working
electrodes of various samples.17, 18
2.0 Experimental Procedure
Instead of hydrogen sulfide (H2S), a dangerous chemical, corrosion properties
were to be tested in hydrochloric acid (HCl) and aqueous carbon dioxide (CO2).
These two solutions are acidic gases known to cause corrosion problems in the
petrochemical industry. CO2 is corrosive, especially if hydrated (such as aqueous
CO2); however, corrosion can be prevented using an aqueous CO2 solution with
a pH value greater than 6. The solution chosen, carbonated water, contained a
pH of 7.2 (Appendix B). On the contrary, HCl is a strong acid and can be found in
refineries (in chlorine salts dissolved in water or suspended solids). A molarity of
12 M, the highest concentration at which HCl is thermodynamically stable, was
chosen for testing.19 The electrochemical properties of three steels, ASTM A516-
GR70, A106M, and C1020 (Appendix A) were measured using potentiodynamic
tests, outlined in Standard ASTM G59-97: Standard Test Method for Conducting
Potentiodynamic Polarization Resistance Measurements. Six different tests were
run, with each sample tested in each solution, three times for consistency.
2.1 Test Cell Preparation
900 mL of the desired solution was placed in the polarization cell. Both auxiliary
electrodes were rinsed with distilled water and placed into the glass adapters,

11
which were fit into the 24/40 joints of the cell. The salt-bridge probe and purge
tube were placed in the test cell as well, and after closing the center with a glass
stopper, the salt bridge was filled with test solution. Tests were conducted at
room temperature (between 21.8 and 22.0 °C).
2.2 Sample Preparation
Less than one hour before each test, a reference electrode was wet ground using
240 and 600 grit SiC paper, rinsed with distilled water and ethanol then dried.
The reference electrode was weighed and total surface area that would be
exposed to the solution was calculated using dimensions specified to the nearest
0.01 mm. Finally, the sample was mounted onto the electrode holder and placed
within the corrosion cell. Adjustments were made to the salt bridge so that the tip
was about 2 mm or 2 times the tip diameter (whichever was larger) from the
working electrode.18 Each electrode was connected to the potentiostat (Parstat
2273) via the cell connector: the working electrode lead and sense electrode lead
to the working electrode, the counter electrode lead to one auxiliary electrode,
reference electrode lead to the reference electrode (saturated KCl was used),
and ground cable to a metal surface. An alligator-alligator test lead was used to
connect the two auxiliary electrodes together. Tests were run using a
potentiodynamic linear sweep at a rate of 0.1660 mV/s.

12
2.3 Calculations
Density
The density of each steel was calculated as follows: samples that were not used
were weight and measured to calculate the density of each sample. These
values were then averaged to obtain the average densities (Table I).
Equivalent weight
The equivalent weight of an element is its atomic weight divided by its valence.
For an alloy, it is equal to the sum of the equivalent weight of the element greater
than 1 weight %.20 Equivalent weight of each sample was determined (Table I).
Table I: Calculated density and equivalent weight of samples
C1020 A516 A106 Density (g/cm3) 7.996 8.205 8.344 EW 27.67 27.65 27.28
Corrosion rate
Theoretical corrosion rates were calculated using Equation (1)20:
𝐶𝑅 = K × i!"##ρ ×𝐸𝑊
(1)
Where K is a constant, icorr is the corrosion current density from Tafel plots
(µA/cm2), ρ is the density of the working electrode (g/cm3), and EW is the
equivalent weight of the working electrode.

13
3.0 Results
Tafel plots provided the corrosion potential (Ecorr) and icorr of each test. From this
information, the corrosion rates of each test were determined and averaged
among those samples in carbonated water (Figure 4a) and those in HCl (Figure
4b).
Figure 4: Corrosion rates of steels immersed within a) carbonated water and b) 12M HCl for an hour. Note the difference in magnitude of corrosion rates between the two solutions.
Weights of samples were measured before and after potentiodynamic tests then
averaged (Figure 5). It is important to note that weight loss was much more
dramatic in HCl than in carbonated water.
0
20
40
60
80
100
120
0.0 0.2 0.4 0.6 0.8 1.0
Cor
rosi
on ra
te (m
py)
Weight % Silicon
Theoretical Experimental
a)
-2E+04
0E+00
2E+04
4E+04
6E+04
0.0 0.2 0.4 0.6 0.8 1.0 Cor
rosi
on ra
te (m
py)
Weight % Silicon
Theoretical
Experimental
b)

14
Figure 5: Average weight loss of samples due to corrosion.
Additionally, micrographs of each sample were taken with a scanning electron microscope (SEM) (Figure 6).
Figure 6: SEM images of a) A106 at 1500x, b) A516-GR70 at 1500x, and c) C1020 at 1500x, all after being immersed in 12M HCl for an hour.
0
0.1
0.2
0.3
0.4
0.5
0.02 0.19 0.94
Wei
ght l
oss
(g)
Weight % Silicon
HCl Carbonated water
a) b)
c)

15
4.0 Discussion
Results show that corrosion rates within carbonated water did not have a specific
trend based on Si content due to inconsistencies between theoretical and
experimental data. It was indicated that steel samples containing higher Si
contents had higher corrosion rates in HCl, supported by theoretical values.
Unfortunately, each level of Si in both solutions had high standard deviations,
sometimes larger than the averaged value.
Average weight loss of samples within HCl shows a decrease with increasing Si
content to the 0.19 level then increases at the 0.94 level. This contradicts the
corrosion rate trend; however, it is important to note that both corrosion rate and
weight loss were much more significant in HCl than in carbonated water.
Samples containing higher Si content had higher weight loss when immersed in
carbonated water, which was unexpected based on the results from corrosion
rates.
The small holes in Figure 6a, found over the entire surface, indicate the sample
went through pitting corrosion. Although no pits were found in either A516-GR70
or C1020, the cracks shown are another indication that corrosion has occurred.
A516-GR70 appeared to contain more cracks than C1020, meaning more
corrosion occurred in the former sample.

16
The conclusions were insufficient given the variability in the results may have
been due to several of the limitations encountered. It was initially determined that
three trials for each sample/solution combination would provide adequate results.
Unfortunately, high standard deviations of corrosion rates were obtained in both
HCl and carbonated water. Although results might have been different,
theoretical calculations of HCl support these results. It would still be beneficial to
run more tests to ensure the trends are what they appear to be. A second
limitation might have been due to the different sample geometries. Two metals,
A106M and C1020, were rectangular cuboids while A516 was cubic, shaped as
such for ease of manufacturing. No literature was found that explored differences
in results due to working electrode geometry, although different geometries have
been used across multiple experiments. Lastly, there were several ASTM
standards that could have been used, such as ASTM G1, which contains
procedures on test specimen preparation, removal of corrosion products, and
evaluation of the corrosion damage. This standard discussed three categories of
cleaning samples: mechanical, chemical, and electrolytic. Samples in this
experiment were mechanically cleaned using rough grind; other methods could
have provided more thorough cleaning.

17
5.0 Conclusions
1. Weight loss results showed that HCl is much more corrosive to low carbon
steel than carbonated water.
2. Corrosion rates in HCl appear to increase with increasing Si content.
3. While Si may reduce corrosion, there is no evidence that increased Si will
help more than less Si.

18
References
[1] Ironware piece unearthed from Turkey found to be oldest steel, The Hindu, Thursday, March 26, 2009 [2] A. Raistrick, A dynasty of Ironfounders, N. Cox, 'Imagination and innovation of an industrial pioneer: The first Abraham Darby' Industrial Archaeology Review 12, 1990, 127-144 [3] About steel. (n.d.). World Steel Association -. Retrieved December 10, 2013, from http://www.worldsteel.org/faq/about-steel.html [4] R.D. Kane, Corrosion in Petroleum Refining and Petrochemical Operations, Corrosion: Environments and Industries, Vol 13C, ASM Handbook, ASM International, 2006, p 967–1014 [5] Davis, Joseph R., ed. Corrosion: Understanding the basics. ASM International, 2000, p 22-25, 107, 114, 118, 122-126, 134, 149 [6] ASM International. Handbook Committee, ed. ASM handbook: Comprehensive index. Vol. 1. Asm Intl, 2000, p 3-5, 189, 367-380 [7] Fundamentals of Electrochemical Methods of Corrosion testing, ASM Handbooks, Volume 13A. [8] National Association of Corrosion Engineers, Robert Baboian, and R. S. Treseder. NACE Corrosion Engineer's Reference Book. NACE International, 2002, p 19-20, 23, 31 [9] Revie, R. Winston, ed. Uhlig's corrosion handbook. Vol. 51. John Wiley & Sons, 2011, p 183-185 [10] Silicon - The Great Influencer In Your Steel And In Your Machine Shop. (2010, October 19). Speaking of Precision Blog. Retrieved December 10, 2013, from http://pmpaspeakingofprecision.com/2010/10/19/silicon-the-great-influencer-in-your-steel-and-in-your-machine-shop/ [11] Serajzadeh, S., and A. Karimi Taheri. "An investigation on the effect of carbon and silicon on flow behavior of steel." Materials & design 23.3 (2002): 271-276. [12] Udovitskii, V. I. "Silicon coatings on carbon steels." Metal Science and Heat Treatment 13.2 (1971): 149-151. [13] Carter, C. S. The Effect Of Silicon On The Stress Corrosion Resistance Of Low-Alloy, High-Strength Steels. No. D6-23872. Boeing Commercial Airplane Co Renton Wa, 1969. [14] Introduction and Overview of Electrochemical Corrosion, ASM International, 2000. [15] Brondel, Denis, et al. "Corrosion in the Oil Industry." Journal of Petroleum Technology 39 (1987): 756-762. [16] “K0047 Corrosion Cell Kit.” Princeton Applied Research. Jpeg.

19
[17] Standard Reference Test Method for Making Potentiostatic and Potentiodynamic Anodic Polarization Measurements, ASTM G5-94, 2004. [18] Standard Test Method for Conducting Potentiodynamic Polarization Resistance Measurements, ASTM G59-97, 2009. [19] Garverick, Linda, ed. Corrosion in the Petrochemical Industry. Materials Park, Ohio: ASM International, 2000 [20] Standard Practice for Calculation of Corrosion Rates and Related Information from Electrochemical Measurements, ASTM G102-89, 1999.

20
Appendix A: Sample Compositions
Element (weight. %)
A106M A516-GR70 C1020
C 0.204 0.19 0.13
Mn 0.961 1.09 0.48
Si 0.94 0.19 0.02
Ni 0.02 0.13 0.02
Cr 0.02 0.17 0.04
Mo 0.02 0.05 <0.005
Ti - 0.015 -
V 0.001 0.005 <0.005
Al 0.026 0.026 0.03
S 0.005 0.002 0.017
P 0.011 0.010 0.015
Cu 0.02 0.25 0.06
B - 0.0001 -

21
Appendix B: Carbonated Water Quality Report of Inorganic Minerals and Metals Substance MRL MCL Level Found
Calcium 0.10 NR 161
Sodium 0.20 NR 11.7
Potassium 0.10 NR 1.4
Fluoride 0.100 2.0 (1.4 - 2.4) 0.16
Magnesium 0.020 NR 5.5
Bicarbonate 1.0 NR 335
Nitrate 0.010 10.00 1.5
Chloride 0.10 250.00 24.6
Copper 0.050 1 ND
pH (units) NA 6.5 - 8.5 7.2
Sulfate 0.10 250.00 49.9
Arsenic 0.014 0.010 ND
Lead 0.005 0.005 ND
Total Dissolved Solids 1.00 500 472
MCL Maximum Contaminant
Level MRL Minimum Reporting Limit NR Not Regulated ND Not Detected NA Not Applicable Source: Perrier Water Quality Report, December 2010

22
Appendix C: Potential vs. Current Density plots for each test
A106M, carbonated water
A106M, HCl

23
C1020, carbonated water
C1020, HCl

24
A516, carbonated water
A516, HCl