the effect of nitrogen addition on soil organic matter...
TRANSCRIPT

The effect of nitrogen addition on soil organic matterdynamics: a model analysis of the Harvard Forest ChronicNitrogen Amendment Study and soil carbon responseto anthropogenic N deposition
Christina Tonitto • Christine L. Goodale •
Marissa S. Weiss • Serita D. Frey •
Scott V. Ollinger
Received: 22 January 2013 / Accepted: 18 June 2013
� Springer Science+Business Media Dordrecht 2013
Abstract Recent observations indicate that long-term
N additions can slow decomposition, leading to C
accumulation in soils, but this process has received
limited consideration by models. To address this, we
developed a model of soil organic matter (SOM)
dynamics to be used with the PnET model and applied
it to simulate N addition effects on soil organic carbon
(SOC) stocks. We developed the model’s SOC turnover
times and responses to experimental N additions using
measurements from the Harvard Forest, Massachusetts.
We compared model outcomes to SOC stocks measured
during the 20th year of the Harvard Forest Chronic
Nitrogen Amendment Study, which includes control, low
(5 g N m-2 yr-1) and high (15 g N m-2 yr-1) N addi-
tion to hardwood and red pine stands. For unfertilized
stands, simulated SOC stocks were within 10 % of
measurements. Simulations that used measured changes
in decomposition rates in response to N accurately
captured SOC stocks in the hardwood low N and pine
high N treatment, but greatly underestimated SOC stocks
in the hardwood high N and the pine low N treatments.
Simulated total SOC response to experimental N
addition resulted in accumulation of 5.3–7.9 kg C per
kg N following N addition at 5 g N m-2 yr-1 and
4.1–5.3 kg C per kg N following N addition at
15 g N m-2 yr-1. Model simulations suggested that
ambient atmospheric N deposition at the Harvard Forest
(currently 0.8 g N m-2 yr-1) has led to an increase in
cumulative O, A, and B horizons C stocks of
211 g C m-2 (3.9 kg C per kg N) and 114 g C m-2
(2.1 kg C per kg N) for hardwood and pine stands,
respectively. Simulated SOC accumulation is primarily
driven by the modeled decrease in SOM decomposition
in the Oa horizon.
Keywords Soil organic matter � Soil organic
carbon � Decomposition � Carbon storage �Nitrogen cycle � Nitrogen deposition �Forest ecosystem � PnET model
Introduction
Human activities have increased the deposition of
biologically reactive N as a result of agricultural
C. Tonitto (&) � C. L. Goodale � M. S. Weiss
Department of Ecology and Evolutionary Biology,
Cornell University, Ithaca, NY 14853, USA
e-mail: [email protected]; [email protected]
C. Tonitto
Cornell International Institute for Food, Agriculture and
Development, Cornell University, Ithaca,
NY 14853, USA
S. D. Frey
Department of Natural Resources and the Environment,
University of New Hampshire, Durham, NH 03824, USA
S. V. Ollinger
Complex Systems Research Center, Institute for the Study
of Earth, Oceans and Space, University of New
Hampshire, Durham, NH 03820, USA
123
Biogeochemistry
DOI 10.1007/s10533-013-9887-4

activities and fossil fuel combustion (Gruber and
Galloway 2008). Although elevated N inputs have
important implications for terrestrial C cycling, atten-
tion has largely centered on the response of photosyn-
thesis and net primary production (e.g. Field et al.
1992; Townsend et al. 1996; Thomas et al. 2010).
More recently, meta-analyses of field studies have
identified the importance of N additions in suppressing
soil respiration and enhancing soil organic C (Knorr
et al. 2005; Nave et al. 2009; Janssens et al. 2010; Liu
and Greaver 2010). However, the effects of N
enrichment on the decomposition process have
received limited treatment to date by biogeochemical
modelers (cf. Whittinghill et al. 2012).
Early experimental work demonstrated that litter
quality strongly affects rates of litter mass loss, with
decomposition varying inversely with litter lignin:N
ratios (Aber and Melillo 1982; Melillo et al. 1982).
These results formed the basis for classifying litter
pools and decomposition rates in soil organic matter
(SOM) models such as CENTURY (Parton et al.
1987). Coupling of C and N cycles in soil models
generally represent gross N mineralization based on
the first-order decay of soil organic carbon (SOC) in
proportion to the C:N ratio of the SOM pool (e.g.
CENTURY (Parton et al. 1987), TEM (Raich et al.
1991), PnET-CN (Aber et al. 1997)), and include N
limitation on decomposition as a function of soil C:N
ratio. On its own, this produces the effect of acceler-
ated decomposition in response to N inputs from
deposition or N fertilization.
By contrast, a review of decomposition experi-
ments by Fog (1988) found that N addition generally
decreased, rather than increased, decomposition rates
in individual conifer litter pools, aggregated pools of
SOM, and pure lignin substrate. Contrary to expecta-
tion, Fog (1988) found that N addition generally
stimulated decomposition when added to easily
degraded litter and slowed it when added to organic
matter with a high C:N ratio or lignin content. These
outcomes and related subsequent studies by Berg and
colleagues (e.g. Berg et al. 1996; Berg and Matzner
1997; Berg 2000; Berg et al. 2010) indicate that litter
quality in terms of lignin, hemi-cellulose, and cellu-
lose composition is a defining characteristic of the
response of litter decomposition to N addition. Studies
elsewhere demonstrated that N addition can inhibit
decomposition of old SOM and humified material
(Neff et al. 2002; Hagedorn et al. 2003), and a recent
meta-analysis concluded that N additions slow het-
erotrophic respiration and total soil respiration result-
ing in increased SOC sequestration in temperate and
boreal forest soils (Janssens et al. 2010).
The mechanisms behind N-induced declines in
decomposition may include effects on the decompos-
ability of SOM (e.g. through stabilization of phenolic
compounds) as well as effects on microbial decom-
posers and plant C allocation. For example, N addition
may lead to decreased plant C allocation to mycorrhi-
zae or root exudates, a shift from fungal- to bacterial-
dominated microbial communities, and altered micro-
bial enzyme production. For example, many have
shown that N addition can stimulate microbial
production of cellulolytic enzymes, while suppressing
the production of lignin-degrading enzymes (e.g.
Carreiro et al. 2000; Sinsabaugh et al. 2002; Frey
et al. 2004; Waldrop et al. 2004; Keeler et al. 2009).
Still, the mechanisms responsible for observed N-
induced declines in decomposition remain elusive, and
until recently, few models have addressed this ques-
tion at all. When models include a coupled C and N
cycle, the most common C–N interaction considered is
limitation to decomposition due to low N availability
during decomposition of high C:N substrate (e.g.
Parton et al. 1987; Aber et al. 1997; Bonan et al. 2012).
Here, we present a new model of SOM dynamics
and use the model to examine long-term effects of N
addition on C accumulation in soils. The model was
designed to represent measurable SOM pools in soils
of northeastern U.S. forest ecosystems. Below, we
describe the SOM model, compare predictions with
observations from long-term N addition experiments
at Harvard Forest, Massachusetts, and simulate the
impact of anthropogenic N deposition on long-term
soil C storage.
Methods
We developed a SOM model as an alternative
decomposition model for Photosynthesis and Evapo-
transpiration (PnET), a model of forest C, water, and N
cycling (Aber and Federer 1992; Aber et al. 1997). The
PnET suite of ecosystem models were designed to
capture important physiological and biogeochemical
processes using relatively simple relationships derived
in large part from field observations. Prior model
development focused on aboveground responses to
Biogeochemistry
123

CO2 and O3 (e.g. Ollinger et al. 1997, 2002) and
assessing spatial and temporal patterns of forest C and
N cycling (Ollinger et al. 1998; Aber et al. 2002;
Goodale et al. 2002; Ollinger and Smith 2005). The
original PnET-CN model considered only two detrital
pools: dead wood and one SOM pool with a ~13 year
base turnover time. This single SOM pool contained
both leaf and root litter as well as relatively decom-
posable soil humus, while excluding the large pool of
slow-turnover SOM. Although this simple approach
can capture some decomposition processes, and
reduces the need for model parameterization, it is
inadequate for considering the differential sensitivity
of detrital C pools to variations in temperature or N
availability (e.g. Neff et al. 2002; Davidson et al.
2006). A multi-pool approach is supported by mea-
surements of soil respiration, whole-ecosystem respi-
ration, and soil 14C data (e.g. Townsend et al. 1996;
Trumbore 2000; Davidson et al. 2006; Davidson and
Janssens 2006; Trumbore 2006). Below, we describe a
SOM model with multiple litter and SOM pools based
on empirical C pools and turnover rates.
Study site
We developed our SOM model for application to
northeastern U.S. forests. We used field observations
from two sites, approximately 1 km apart, located
within the Harvard Forest (42�300 N, 72�100 W) in
Petersham, Massachusetts, USA for model develop-
ment and validation, and to simulate the effects of added
N on soil C accumulation. The Harvard Forest receives
1,120 mm yr-1 of precipitation distributed roughly
evenly across the year. Mean monthly temperatures
range from -5 �C in January to 19 �C in July (Boose
and Gould 1999). Annual wet and dry deposition of
inorganic N has been estimated at 0.8 g N m-2 yr-1
(Ollinger et al. 1993). The first site, the location of
intensive soil C characterizations by Gaudinski et al.
(2000), is on well-drained soils within 100 m of the
Harvard Forest’s long-term eddy flux tower. The second
site is the Harvard Forest Chronic Nitrogen Amendment
Study, where NH4NO3 has been applied since 1988 at
two rates, 5 and 15 g N m-2 yr-1, to a mixed hardwood
and a red pine stand (Magill and Aber 1998; Magill et al.
1997, 2000, 2004; Frey et al. in review). The hardwood
stand includes black and red oak (Quercus velutina and
Q. rubra), along with red maple (Acer rubrum),
American beech (Fagus grandifolia), and black cherry
(Prunus serotina). Table 1 summarizes the land-use
histories for these two stands. Soils are Typic Dystrocr-
epts composed of sandy and stony loam texture (see
Magill et al. 2004 for details).
Model structure
A challenge for models attempting to capture complex
ecosystem processes is striking a balance between
complexity and applicability. Models that include all
measurable pools or processes can maximize realism,
but this comes with additional costs of parameterization
and can limit the model’s relevance to other systems.
Here, we sought to simply capture important effects of N
on SOM dynamics while creating a model that could
eventually be applied to a range of ecosystems.
Our SOM model includes empirical representation of
litter decomposition, as well as SOM pools determined
using measurements of soil C stocks and 14C-defined
turnover rates. Litter decomposition was simulated for
six litter pools and four non-litter SOM pools (Fig. 1).
The litter pools include: (1) coarse woody debris
(CWD) parameterized to reflect advanced decay
classes; (2) fine root litter in the A and (3) B horizons;
as well as mixed foliar and fine root litter in the Oi ? Oe
horizon separated into (4) rapid, (5) slow, and (6)
recalcitrant decay pools (cf. Parton et al. 2007)
described in Appendix 1. Decomposition and N
mineralization-immobilization in the Oi ? Oe was
represented using equations derived in the 10-year,
cross-site, Long-term Intersite Decomposition Experi-
ment (LIDET) synthesis study (Parton et al. 2007). We
derived stand-specific decay parameters for the three
litter substrate classes using data from an in situ litterbag
study at the Harvard Forest, which include total mass
loss, as well as % lignin and % cellulose remaining for
control, 5 g N m-2 yr-1, and 15 g N m-2 yr-1 exper-
imental treatments (Magill and Aber 1998; Frey and
Ollinger 1999). We used these mass loss observations to
calculate substrate decay rates as a function of N
addition.
For the non-litter SOM pools, we explicitly repre-
sented humified and mineral-associated C pools as
measured by Gaudinski et al. (2000) near the eddy flux
tower at the Harvard Forest. These C pools were
measured by soil horizon using density-separation
(sodium polytungstate) of SOM into ‘light’ (humified)
and ‘heavy’ (mineral-associated) fractions. The
Biogeochemistry
123
turnover times were estimated using 14C measure-
ments. To balance model complexity and generality,
we combined the nine SOM pools identified by
Gaudinski et al. (2000) into four SOM pools
(Fig. 1). That is, we included their Oa humus pool
with its turnover rate of 40 years. We aggregated their
four A-horizon humic and mineral-associated pools
into two pools, one humified (137-year turnover) and
one mineral-associated (412-year turnover). We
merged the relatively shallow A (6–10 cm depth)
and Ap (10–16 cm depth) horizons into a single
modeled A horizon that represents the historic plough
layer. We also combined their four B-horizon humic-
and mineral-associated pools into a single mineral-
associated SOM pool with a 1727-year turnover;
humified SOC accounted for less than 3 % of the total
B-horizon SOC at Harvard Forest and had a similar
thousand-year turnover time as the B-horizon mineral-
associated SOC pool (Gaudinski et al. 2000). Decom-
position for all detrital pools was modeled using first-
order decay (Table 2, Appendix 1).
The fate of C loss during decomposition was divided
between respiration (CO2 fraction) and the organic C
byproducts that enter the next substrate decay class. The
CO2 fraction values were constrained using soil C stock
and turnover measurements. At steady state, the flux of
C out of each SOM pool must be balanced by the C flux
received from the preceding SOM pool. The C flux out
of (and into) each SOM pool was estimated as its C stock
divided by its 14C-derived turnover time; the CO2 loss
was estimated as the difference between the C flux into a
SOM pool and the C flux lost from the preceding SOM
pool. These estimates of CO2 fraction assume steady
state, as well as accurate estimation of SOM turnover
times and correctly structured sequential flows of SOM.
While these three assumptions are standard in studies
that apply first order decay to describe SOC dynamics,
they can contribute to differences between observed and
simulated SOC dynamics. Assuming SOC steady state
allows us to estimate a baseline CO2 fraction lost during
the decomposition of each substrate, our sensitivity
analysis (Appendix 2) bounds the error associated with
inaccurate parameter definition.
The SOM model runs at a daily time step and is
driven by daily climate inputs which include maxi-
mum and minimum temperature, precipitation, and
photosynthetically active radiation (PAR). This tem-
poral resolution allows for detailed simulation of the
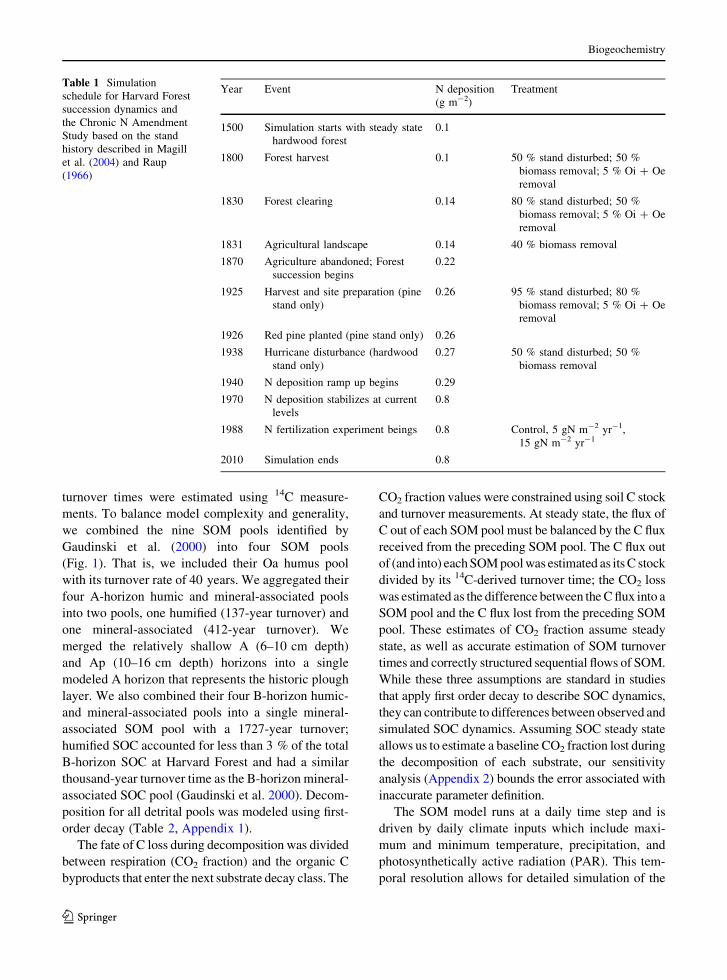
Table 1 Simulation
schedule for Harvard Forest
succession dynamics and
the Chronic N Amendment
Study based on the stand
history described in Magill
et al. (2004) and Raup
(1966)
Year Event N deposition
(g m-2)
Treatment
1500 Simulation starts with steady state
hardwood forest
0.1
1800 Forest harvest 0.1 50 % stand disturbed; 50 %
biomass removal; 5 % Oi ? Oe
removal
1830 Forest clearing 0.14 80 % stand disturbed; 50 %
biomass removal; 5 % Oi ? Oe
removal
1831 Agricultural landscape 0.14 40 % biomass removal
1870 Agriculture abandoned; Forest
succession begins
0.22
1925 Harvest and site preparation (pine
stand only)
0.26 95 % stand disturbed; 80 %
biomass removal; 5 % Oi ? Oe
removal
1926 Red pine planted (pine stand only) 0.26
1938 Hurricane disturbance (hardwood
stand only)
0.27 50 % stand disturbed; 50 %
biomass removal
1940 N deposition ramp up begins 0.29
1970 N deposition stabilizes at current
levels
0.8
1988 N fertilization experiment beings 0.8 Control, 5 gN m-2 yr-1,
15 gN m-2 yr-1
2010 Simulation ends 0.8
Biogeochemistry
123

seasonality of soil moisture and water stress. This
influences moisture limited decomposition processes
and plant growth in the coupled daily time-step PnET-
SOM model. All SOM model routines were coded in
Matlab (The MathWorks). Model description of the
change in C and N stocks through biogeochemical
processes are implemented in discrete time.
Soil organic matter dynamics of northeastern U.S.
forest soils have previously been simulated using
PnET-CN (Aber et al. 1997), TRACE (Currie et al.
1999, 2004), and PnET-BGC (Gbondo-Tugbawa et al.
2001) models. The SOM model increases the depth of
the modeled soil profile. The SOM model is most
similar in complexity to the TRACE model, but
Fig. 1 SOC, inorganic N,
and DOM pools tracked in
the SOM model. Each SOC
pool has a corresponding
SON pool. DOM is
explicitly modeled as DOC
and DON pools. The mixed
litter pool (Lm) is composed
of three substrate qualities:
(1) rapid, (2) slow, and (3)
recalcitrant
Table 2 Soil organic matter (SOM) properties used for model application to the Harvard Forest
SOM pool Model variable Initial C (g m-2) Decay constant (k) Turnover time (years) CO2 fraction
Coarse woody debris (CWD) Lc 5 -0.0513 19 0.80
Organic humified (Oa) Oh 1,410 -0.025 40 0.78
A-horizon humified Ah 2,570 -0.007305 137 0.96
A-horizon mineral associated Am 2,320 -0.002425 412 0.95
B-horizon mineral associated Bm 1,700 -0.000579 1,727 1.00
The table shows initial C distributions (g C m-2) and first-order decay constants (year-1) applied for each SOM class. Humified and
mineral associated C decay constants and corresponding CO2-loss fractions are derived from Gaudinski et al. (2000). Coarse woody
debris decay is based on mass loss rates applied in the TRACE model (Currie et al. 2004). Parameters are applied to hardwood and
pine stands
Biogeochemistry
123

differentiates hydrology and rhizosphere dynamics
across distinct forest floor, A, and B soil horizons.
Additionally, Oi ? Oe decomposition in the SOM
model is based on observations from the rigorous,
multi-biome LIDET experiment (see Appendix 1 for
decomposition description). The SOM model also
differs with respect to hydrology (Appendix 3),
including the non-linear dynamics of water flux and
evapotranspiration in unsaturated soils as a result of
soil matric potential, in contrast to the gravitational
potential model applied in previous PnET-derived
models.
Simulation scenarios
Simulations included the land-use history of the
Harvard Forest Little Prospect Hill tract where the
Chronic N Amendment study is located (Raup 1966;
Table 1). The baseline for all simulations started with
a 300-year, steady-state simulation of a mature
hardwood forest, followed by a conversion to agricul-
tural land use in 1830, and concludes with forest
succession starting in 1870. See Appendix 5 for details
regarding implementation of agriculture, climate, and
N deposition.
We simulated hardwood and pine stands using the
three treatments of the Harvard Forest N fertilization
experiment: (1) control, (2) low N fertilization treat-
ment of 5 g N m-2 year-1, and (3) high N fertiliza-
tion treatment of 15 g N m-2 year-1. We recognize
that an N addition rate of 5 g N m-2 year-1 is not low
relative to atmospheric inputs, but we use this
terminology for simplicity and consistency with
earlier publications. Following the field-experiment
protocol, modeled N fertilization occurred in six equal
doses from May to October. We explored the effect of
N additions on decomposition using four scenarios: (1)
N affects litter decomposition only, (2) N affects litter
as well as Oa- and A-horizon SOM decomposition, (3)
N affects litter, Oa- and A-horizon SOM, and CWD
decomposition, and (4) N affects litter, A-horizon, and
CWD decomposition, with complete shutdown of Oa
decomposition. The derivation of N effects on litter,
SOM, and CWD decay constants is described below.
To isolate the effect of N additions on decompo-
sition, we held all annual litter inputs constant
(Table 3). This assumption is consistent with obser-
vations by Magill et al. (2004) showing that N
fertilization did not significantly affect litter or fine
root production at Harvard Forest. For foliar litter
inputs, we used measurements by Magill et al. (2004).
Woody litter inputs were based on measurements by
Currie et al. (2004). For belowground inputs, we
maintained consistency with the approach used by the
PnET models, which estimate total belowground C
allocation (TBCA) as the difference between soil
respiration and litterfall (Raich and Nadelhoffer
1989). Bowden et al. (2004) report soil respiration
measurements for the Harvard Forest N Amendment
Study.
Nitrogen effects on litter, CWD, and SOM
decomposition
We simulated the effects of N addition (deposition or
fertilization) on litter decomposition by varying the
decay parameters of the Oi ? Oe horizon based on
observations from the Harvard Forest of mass, lignin,
and cellulose remaining in litter bags over a 6 year,
in situ litter decomposition experiment conducted in
control and N-fertilized stands (Magill and Aber 1998;
Frey and Ollinger 1999); these data cover only the first
6 years of the 20-year experiment. Lignin and cellulose
decay rates for control, low N, and high N treatments
were directly estimated from the observations; the labile
substrate decay rate was back-calculated using Eq. 4
(Appendix 1). We simulated the effects of N deposition
on CWD decomposition by assuming that the percent
change in CWD decay rates followed patterns observed
for lignin at the Harvard Forest (Magill and Aber 1998;
Frey and Ollinger 1999).
Table 3 Constant litter input rates (g m-2 year-1) used for
SOM model simulation of the Harvard Forest
Litter
class
Hardwood Pine Agriculture
C
added
N
added
C
added
N
added
C
added
N
added
Leaf 131 2.6 140 1.2 81 0.7
Root 188 5.0 158 4.2 47 0.4
Wood/
Stem
122 0.4 180 0.5 22 0.3
Total 440 8.0 478 5.9 149 1.3
Leaf litter enters the system in one event in the fall for
hardwood stand simulation and is equally distributed at daily
increments in pine stand simulation. Root and wood litter
inputs are equally distributed at daily increments
Biogeochemistry
123

We simulated the effects of N addition on humic and
mineral associated SOM decomposition using outcomes
from laboratory incubations conducted by Weiss
(2011). These studies used sieved, moisture-adjusted
organic soil (Oe ? Oa) and A-horizon mineral soil
(0-10 cm) collected from control and 5 g N m-2 yr-1 N
treatment stands of the Harvard Forest Chronic N
Amendment Study. CO2 loss was measured over a 1-
year laboratory incubation. We simulated the effect of N
addition on SOM decomposition by varying the decay
constants for these pools (Table 2) by the percent
change in decay rate calculated from the lab incubations.
Figure 2e, f shows the effect of N addition on O- and A-
horizon decomposition rates. Given the relatively short
duration and idealized conditions of the lab incubation
we expect a larger uncertainty in the decay rate change
quantified for SOM pools relative to decay rate param-
eters established for litter using long-term field studies.
Because the lab incubation data were limited to two data
points (the control and 5 g N m-2 yr-1 N treatments)
we simplistically extrapolated the rates observed to the
15 g N m-2 yr-1 stands assuming a linear relationship.
For the high N pine treatment this extrapolation resulted
in a virtual shutdown of Oa decay.
We modeled the effect of N addition on SOC stocks
using two approaches. In the first approach, we altered
decomposition rates with an instantaneous and constant
effect from N addition. That is, we used decomposition
rates based on control-plot values for simulations
through 1988, the start of the N addition experiment,
then imposed treatment-specific changes in substrate
decay rate (Fig. 2a, b) for the 20 year period following
the start of the experiment. The second approach varied
substrate decay rate based on the cumulative N added to
the system. In these simulations, we tracked the
cumulative amount of N exceeding pre-industrial
deposition of 0.1 g N m-2 yr-1, received through both
N deposition and fertilization. The decay rate in a given
time step was dynamically calculated in response to
cumulative N addition by fitting the observed decay
rates in response to cumulative N at the time of
experimental observation of 43, 78, and 138 g N m-2
for control, low N, and high N respectively (Fig. 2 c, d).
Exploring the effect of N additions on soil C
storage
The effects of N deposition on soil C storage were
modeled using the four scenarios previously outlined
in subsection ‘Simulation scenarios’. Simulation out-
comes were compared to observed C stocks measured
after 20 years of N fertilization at the Harvard Forest
Chronic N Amendment Study (Frey et al. in review).
We then selected the scenarios that best reproduced
observed results from the long-term N addition exper-
iment to simulate the effect of historic N deposition and
long-term N addition on C storage. The best fit to the N
addition experiment was modeled using k-values
altered to represent observed N effects on litter,
SOM, and CWD decomposition, with the Oa decom-
position parameter of both pine and hardwood stands
based on decay response to N observed in the pine
stand. We linearly extrapolated litter, Oa, and A-
horizon decay rates to pre-industrial conditions by
extending the observed differences between the control
and low N treatments. We focused our results on
simulations that applied an instantaneous change in
decomposition rate in response to N addition; simula-
tions using a cumulative approach to modeling the
effect of N addition produced similar results to the
instantaneous approach but overestimated SOC
increase in the high N pine simulations.
We simulated the period of 1800–2010 for a forest
experiencing a static, pre-industrial N deposition rate
of 0.1 g N m-2 yr-1 and compared these results to the
observed N deposition scenario which increased and
then stabilized at current-day deposition rates of
0.8 g N m-2 yr-1. We also used the SOM model to
estimate steady state SOC stocks under long-term N
addition. Simulations were conducted for 300 years
using annual N inputs of 0.1, 0.8, and 5 g N m-2,
representing pre-industrial conditions, current-day
rates measured for Harvard Forest, and current-day
rates applicable to parts of Europe (Holland et al.
2005) and China (Lu and Tian 2007; Liu et al. 2013),
respectively.
Results
We tested different approaches to modeling the
response of SOM decomposition to N addition. Model
outcomes most closely matched observations at the
Harvard Forest experiment under simulations that
included aggressive suppression of decomposition.
Depending on stand type and N addition level, two
simulation scenarios achieved the best results: (1)
simulations where N addition slowed litter, O-horizon
Biogeochemistry
123

a b
c d
e f
Biogeochemistry
123

and A-horizon SOM, and woody debris decomposition
based on experimental observations and (2) simula-
tions that also included the complete shutdown of Oa
decomposition, as detailed below.
Harvard forest N addition experiment
Control treatment C stocks
Both the Gaudinski et al. (2000) study used for model
parameterization and the N addition study used in
model testing were conducted in hardwood stands at
the Harvard Forest, but at separate sites. Simulation of
the hardwood stand under ambient deposition rates
demonstrates the model is generally able to capture the
A- and B-horizon SOC stocks observed at the Harvard
Forest (Gaudinski et al. 2000). Predicted SOC stocks
were within 9 % of measurements for A-horizon
humified SOC and within 3 % of observed A- and B-
horizon mineral associated SOC stocks. Predicted
forest floor SOC stocks were within 7 % of values
measured by Frey et al. (in review); in contrast,
simulated Oa SOC stocks were 37 % higher than
observed at this site, although these values are within
measurement uncertainty (standard error for the Oa
pool = 750 g C m-2, or 50 % of its size; Gaudinski
et al. 2000). Modeled inputs into the Oa pool were not
taken from the Gaudinski et al. (2000) data set, but
used values measured at the Chronic N Addition Study
(Table 3, described above). Divergence in simulated
versus observed Oa C stocks indicates that the litter
and Oi ? Oe data from the Harvard Forest Chronic N
Amendment Study does not exactly replicate the
assumptions used by Gaudinski et al. (2000) in
determining Oa turnover. Measurements of mineral
soil C stocks vary within the Harvard Forest, such that
A-horizon C stocks, observed by Gaudinski et al.
(2000) as the 0-10 cm mineral soil, are 18 % larger
than those measured in the top 10 cm of mineral soil in
the control plots at the Chronic N Amendment Study
(Frey et al. in review). Therefore, while modeled A-
horizon SOC roughly matches that observed by
Gaudinski et al. (2000), it exceeds that measured at
the control plots at the N-addition study, although
the difference between these observations is
within measurement uncertainty (standard error was
150–360 g C m-2 at the Chronic N study, Frey et al.
in review, and 660–820 g C m-2 for Gaudinski et al.
2000). Modeled soil CO2 flux was within the range
observed in hardwood stands at Harvard Forest by
Davidson et al. (2006). Mean simulated total soil
respiration across O, A, and B soil horizons was
590 g C m-2 yr-1 compared with a mean total soil
CO2 flux of 720 (with range of 503-864) and 833 (with
a range of 400-1,040) g C m-2 yr-1 for two measure-
ment chambers located near the site of the Gaudinski
et al. (2000) sampling (Davidson et al. 2006).
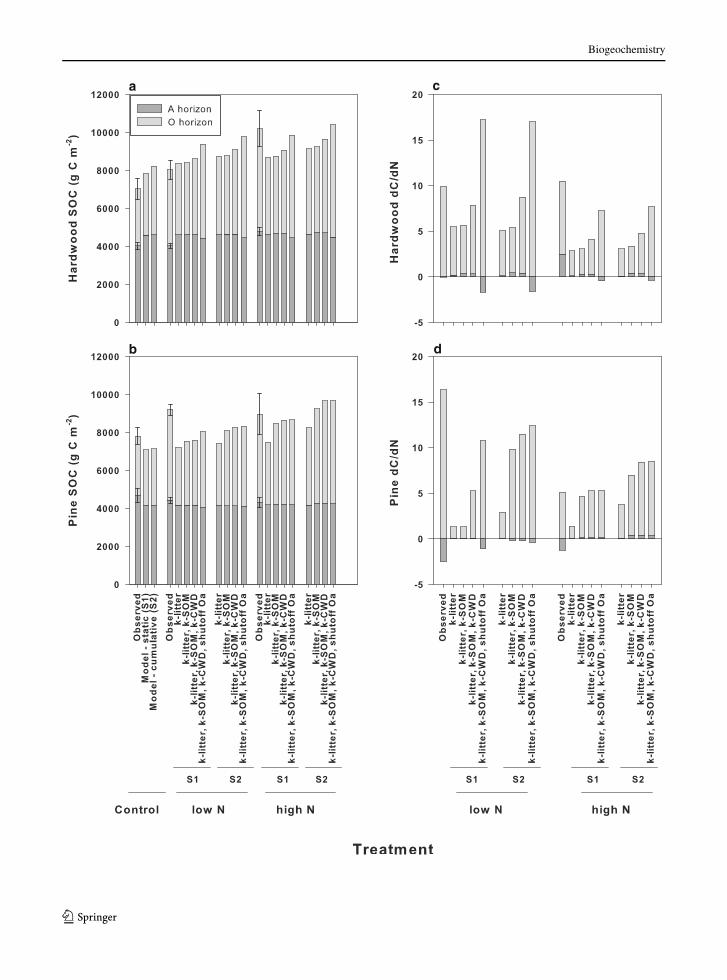
Soil carbon stocks under experimental N additions
Measurements of soil C at the Harvard Forest Chronic
N Amendment Study show that the largest effect of N
addition is increased C stocks in the O-horizon (Frey
et al. in review). These measurements show increased
O-horizon C stocks over 20 years of 988, 2,406, 1,634,
and 1,534 g C m-2 (33, 80, 52, and 49 %) relative to
control plots in the low N hardwood, high N
hardwood, low N pine, and high N pine stands
respectively. The model’s best fit to observations
differed depending on N treatment and forest type
(Fig. 3). Relative to the control plot, simulations
applying a reduction in all decomposition rates (litter,
O- and A-horizon SOM, and coarse woody debris) by
amounts observed in decomposition experiments,
increased O-horizon C stocks by 752, 1,154, 516 and
1,535 g C m-2 (23, 36, 18, and 53 %) over 20 years
for low N hardwood, high N hardwood, low N pine,
and high N pine stands respectively. Decomposition
rates based on observations provided the best fit to
observed percent changes in C stocks in the hardwood
low N treatment and pine high N treatment; however,
altering decomposition rates based purely on obser-
vations underpredicted the percent increase in SOC for
the hardwood high N treatment and the pine low N
treatment. Simulations applying an extreme reduction
Fig. 2 Rate of litter and SOM decomposition in response to N
addition. Static change in first-order decay constants (k) for
rapid (k1), slow (k2), and recalcitrant (k3) decay substrate pools
is shown for hardwood (a) and pine (b) stands. A cumulative
approach to litter decomposition is shown for hardwood (c) and
pine (d) stands. The change in SOM decomposition is shown for
hardwood (e) and pine (f) stands. Rates are derived from litter
decomposition experimental data from the Harvard Forest
LTER site (Frey and Ollinger 1999). Percent change in SOM
rates in response to the low N treatment are derived from
observations reported in Weiss (2011). Decay rate response to
high N deposition is derived as a linear extrapolation. CWD
decay rate variation follows the percent change in lignin decay
observed in the Harvard Forest N fertilization experiment
(Magill and Aber 1998; Frey and Ollinger 1999)
b
Biogeochemistry
123
a
b
c
d
Biogeochemistry
123

in decomposition rates, the complete shutdown of Oa
decomposition, resulted in increased SOC stocks over
20 years of 1,722, 2,176, 1,081, and 1,545 g C m-2
(53, 67, 37, and 53 %) relative to the control
simulation in the low N hardwood, high N hardwood,
low N pine, and high N pine stands respectively. This
extreme forcing of Oa decomposition better predicted
observed soil C stocks for the hardwood high N
treatment and the pine low N treatment, but overpre-
dicted the hardwood low N treatment.
Field observations of A-horizon response to N
addition were inconsistent. In the hardwood stand,
the low N treatment had no effect on A-horizon SOC
stocks, but the high N treatment increased SOC by
745 g C m-2 (18 %). In the pine stand, there was a
small (5–8 %), non-significant decrease in A-hori-
zon SOC storage under the N addition treatment
relative to the control stand. Our simulated response
of A-horizon SOM decomposition to N addition
using observation-based decay parameters resulted
in a slight (0.2–1.7 %) increase in the A-horizon C
pool across treatments.
Predicted C:N ratios are consistent with trends
reported at the Harvard Forest Chronic N Amendment
Study (Magill et al. 2004). Similar to observations,
C:N ratios simulated for the hardwood forest floor and
mineral soil remained stable under control, low N and
high N treatments. Pine simulations also reflected
observations, with stable to slightly increasing forest
floor C:N ratios and stable mineral soil C:N ratios with
increasing N addition. The SOM model preserves
PnET-CN immobilization-mineralization dynamics in
the soil profile (Eqs. 10–13, Appendix 1). Application
of immobilization-mineralization relationships
derived for fast cycling C substrate to slower turnover
C pools does not mechanistically capture the structural
constraints to C and N cycling from complexity such
as protection in soil aggregates or microbial cysts.
However, application of this immobilization-miner-
alization description throughout the soil profile results
in C:N ratios which reflect observations.
Carbon stock change relative to N addition rates
The effect of N addition on ecosystem C storage has been
compared across a range of sites using the ratio of the
change in C storage to the amount of N added (dC/dN)
(de Vries et al. 2009; Janssens et al. 2010). Comparing
dC/dN between simulations and measurements provides
another means of model comparison. As with the
comparison of soil C stocks, comparison of dC/dN
responses indicated that simulations that altered decay
parameters based on observations resulted in the closest
match to observations for the low N hardwood and high
Table 4 Trends in dC/dN relative to total N added to the system
Simulation scenarios Total N added relative to
comparison stand
N addition rate
(g m-2 yr-1)
Simulation
period (years)
Hardwood
dC/dN
Pine
dC/dN
HF control relative to pre-industrial 54.2 HF control* 210 3.9 2.1
HF low N relative to control treatment 100 5 210 7.9 5.3
Steady state 0.8 g relative to 0.1 g m-2 yr-1 210 0.8 300 1.4 0.8
HF high N relative to control treatment 300 15 210 2.6 5.3
Steady state 5 g relative to 0.1 g m-2 yr-1 1,470 5 300 2.6 1.2
Outcomes are for the 210 year simulation of the Harvard Forest (HF) Chronic N Amendment Study, HF succession assuming pre-
industrial N deposition, and the 300-year steady state simulations. (* see description in Appendix 5)
Fig. 3 Simulation of the Harvard Forest Chronic N Study SOC
pools and dC/dN. Total SOC in the O and A horizon is shown for
(a) hardwood and (b) pine stands. Observations (Frey et al. in
review) are compared to model simulations for the control, low
N, and high N treatments. Frey observations include error bars of
the standard error. The change in total SOC per unit N addition
(dC/dN) in the O and A horizon is shown in figures (c) hardwood
and (d) pine stands. Change in SOC pools for observations (Frey
et al. in review) is for SOC under N addition compared to control
observations; for model outcomes the change in SOC is for the N
addition simulation compared to the control simulation. The
low N treatment has 5 g N year-1 added and high N treatment
has 15 g N year-1 added. Model simulations apply two
approaches to ecosystem response to N addition. In the first
approach (S1), static decomposition rates are based on field
observations from the Harvard Forest Addition experiment. The
second approach to modeling N effects on decomposition rate
used a cumulative interpretation of the observations (S2). Both
static and cumulative approaches defining decomposition
parameters are shown for four assumptions of N addition effects
on decomposition. The four cases show N addition as affecting
decomposition rates of: (1) litter, (2) litter and SOM, (3) litter,
SOM, and woody debris, and (4) litter, A-horizon SOM, woody
debris, with total shutdown of Oa decomposition
b
Biogeochemistry
123

N pine stand O-horizons (low N hardwood total dC/dN
of 9.9 observed, 7.9 simulated; high N pine total dC/dN
of 3.9 observed, 5.3 simulated; Fig. 3c, d). Simulations
using observation-based decomposition parameters un-
derpredicted dC/dN in the hardwood high N treatment
and the pine low N treatment, which were both better
predicted by including complete shutdown of Oa
decomposition (high N hardwood total dC/dN of 10.5
observed, 6.8 simulated; low N pine total dC/dN of 13.8
observed, 9.2 simulated; Fig. 3c, d).
Simulated and observed dC/dN under the relatively
high N addition rates of the Chronic N Addition
experiment are about one-third to half the literature
average of 19 dC/dN reported in a meta-analysis by
Janssens et al. (2010). A comparison of dC/dN for a
range of total N addition amounts shows the non-linear
nature of the effects of N addition (Table 4). The C
accumulation per unit N added is highest for low to
intermediate rates of total N added, but saturates for
large cumulative amounts of N added. Given the
difficulty in predicting exact SOC stocks, dC/dN
trends are a useful quantitative comparison of the
long-term effects of N addition on C stocks.
Simulated forest SOC response to N deposition
Simulations of N deposition effects using experimen-
tally derived decomposition rates resulted in an
increase in the O-horizon C pool (Fig. 4). In the
hardwood stand, the simulated dC/dN in response to
anthropogenic N deposition between 1800 and 2010
was 3.9, an increase of 211 g C m-2; in the pine stand
the dC/dN was 2.1, an increase of 114 g C m-2.
Steady state simulations showed a gradual increase in
total profile SOC with increasing N addition (Fig. 5).
Carbon accumulation occurred mostly in the forest floor
and humified A-horizon stocks, with the C accumulation
trend driven by the decrease in Oa decay rate. Relative to
pre-industrial N deposition rates, a 300-year simulation
using current deposition (0.8 g N m-2 yr-1) increased
steady state total C stocks by 3.7 % (340 g C m-2 or
dC/dN = 1.4) in the hardwood stand and by 2.3 %
(200 g C m-2 or a dC/dN = 0.8) in the pine stand. For
the highest N deposition scenario tested (5 g N m-2
year-1), total C stocks increased by 3,920 g C m-2
(42 % or a dC/dN = 2.6) in the hardwood stand and by
1,860 g C m-2 (21 % or a dC/dN = 1.2) in the pine
stand.
Discussion
The SOM model was developed as an alternative
decomposition model for the PnET model of north-
eastern forests. It relies on empirical representations of
litter decomposition and soil C turnover rates, and
explicitly represents multiple soil horizons. The SOM
model was applied to the long-term Chronic N
Fig. 4 Carbon accumulation in response to N deposition.
Carbon stocks following succession are compared for Harvard
Forest hardwood and pine stands simulated under pre-industrial
N deposition rates (0.1 g N m-2 yr-1) and under a control N
deposition scenario (starting at 0.1 and stabilizing at
0.8 g N m-2 yr-1)
Biogeochemistry
123

Amendment Experiment at the Harvard Forest. Com-
parisons with measured soil C response to N addition
revealed that simulations required substantial sup-
pression of decomposition rates to match observed soil
C accumulation. Here, we discuss our assumptions
about model structure and parameterization, chal-
lenges of simulating the response to N addition, and
simulated implications of the impacts of N deposition
on soil C accumulation.
Model assumptions and sensitivity
We grounded SOM model development in observa-
tions of litter decomposition and soil C turnover times,
and structured the sequential flow of C substrate from
surface to deeper soil horizons. We applied common
assumptions of system steady state combined with14C-derived decay rates to calculate baseline CO2
fractions for substrate decomposition. Our sensitivity
analysis (Appendix 2) revealed that estimation of total
C stocks were most sensitive to accurate parameter-
ization of the CO2 fraction for the Oa-horizon.
Accurate estimation of this parameter is difficult, as
the Oa-horizon forms the interface between short- and
long-time-scale cycling processes, and observations
demonstrate that the observed size of the Oa C pool
can be highly variable. Accurate estimation of Oa
cycling is also challenging due to inconsistent
a
b
Fig. 5 Steady state SOC
pools in an N-enriched
environment. Simulations
show SOC projections after
300 years under N
deposition levels applicable
to the northeastern US (0.1–
0.8 g N m-2 year-1) and
under N deposition
applicable to parts of
Western Europe and China
(5 g N m-2). Outcomes
simulate a change of litter,
SOM, and CWD decay rates
in response to N deposition.
Simulations show outcomes
from non-disturbance
simulations for hardwood
(a) and pine (b) forests
Biogeochemistry
123

definitions of system litter inputs. We applied the
model using observed litter inputs and soil respiration
rates (Magill et al. 2004; Bowden et al. 2004), and our
modeled Oa pools stabilize at a higher value than
reported in Gaudinski et al. (2000). Despite inaccura-
cies in parameter definition, models that assume a
sequential flow of C substrate from surface to deeper
substrate pools and which apply steady state assump-
tions to define decay rates and the CO2 loss fraction are
able to simulate observed O-, A-, and B-horizon SOC
stocks and relative change in response to N addition.
Challenges to modeling N effects on C storage
Our new SOM model generally tracked measured
effects of N addition on C stocks, but it required
aggressive suppression of decomposition rates of litter
and Oa C pools, and the model still sometimes
underestimated observed soil C accumulation. Model
simulations that used decomposition rates based
purely on experiments roughly matched observations
in the hardwood low N and pine high N treatments, but
underpredicted forest floor C stocks of the hardwood
high N and pine low N treatments. The model’s
underestimation of forest floor C in these simulations
suggests that other factors are involved in the observed
increase in SOC stocks, such as: (1) greater suppres-
sion of litter decomposition rates in later years of the
study relative to rates observed in year 6; (2) additional
suppression of decomposition rates for non-litter
humus pools; (3) a shift to a greater proportion of C
transferred from litter pools to slower-cycling pools
rather than loss as CO2 (i.e. reduced CO2 fraction); and
(4) undetected enhancements of litter inputs. Bowden
et al. (2004) report much greater suppression of soil
respiration at the Harvard Forest in year 14 than during
year 1–2, providing support for the first factor, that N-
induced suppression of decomposition rates might
increase with experiment duration. The effects of N on
decomposition of non-litter humus were measured in
the experiment’s 20th year (Weiss 2011), but these
studies were conducted on sieved soils in the lab, and
might not have fully captured any additional effects of
N that might exist in the field (the second factor).
These soil incubations demonstrated a significant
decrease in Oa decomposition rate for pine stand
soils, but results for the hardwood stand were quite
variable and resulted in a small mean change in its Oa
decomposition rate (Fig. 2). Model simulations of the
hardwood stand better fit observations when suppress-
ing Oa decomposition using parameters derived from
the pine stand soils, suggesting that N addition has
likely suppressed Oa decomposition in both stands. A
substantial decrease in Oa decomposition rate was also
necessary to predict the observed soil C stocks at sites
receiving 15 g N m-2 yr-1 of N addition. The third
factor possibly influencing accumulation of C in the
forest floor is that N addition might have increased the
proportion of C transferred from litter to slower
cycling pools (a lower CO2 fraction), but current
simulation of N addition already results in reduced
limit values (described below). Fourth, C in the soil
profile depends on both litter inputs as well as
decomposition losses. Harvard Forest (Magill et al.
2004) and other closed-canopy N-addition studies
rarely show substantial increases in litterfall (Janssens
et al. 2010, Liu and Greaver 2010). In the case of
Harvard Forest, Magill et al. (2004) measured
increased litterfall and decreased fine root stock in
the N fertilized stand relative to the control stand, but
these differences were not statistically significant. If
these changes in litter input were real but simply too
small to detect against background variation, they
might contribute to SOC increase under N addition.
Our sensitivity analysis indicated that increased litter
input could theoretically yield up to 12 % more forest
floor C, an amount comparable to the underprediction
of C stock in hardwood and pine low N simulations.
Nitrogen addition can affect both the rate of litter
decomposition and its limit value, which is the
cumulative loss of litter mass at the point when
decomposition rates slow (Berg 2000; Whittinghill
et al. 2012). Here, litter decomposition was modeled
by applying the LIDET functional relationship using
discrete litter cohorts to link litter N content to litter
mass remaining. Each annual litter cohort was tracked
for seven years, after which the litter mass remaining
enters the Oa substrate pool. This approach did not
include parameterization of a specific limit value, but
this value could be calculated from the mass remaining
when litter was transferred to the Oa pool at year 7, and
it varied in response to changes in the decomposition
process. As a result of this discrete-time, disaggregat-
ed model structure, reducing the decomposition rate
without changing the duration a litter cohort is tracked
had the effect of greatly reducing the system limit
value. In hardwood stands, the limit value changed
from 80 % in the control to 67 % in the low N
Biogeochemistry
123
treatment and 59 % in the high N treatment. In the pine
stands the limit value changed from 83 % in the
control to 79 % in the low N treatment and 72 % in the
high N treatment. This range in limit value is
comparable to that observed by Berg et al. (1996).
As a result of the decreased limit value, a larger
proportion of Oi ? Oe substrate enters the Oa decom-
position class.
Our SOC and limit value simulation outcomes are
consistent with a data-model comparison of N addition
in northern hardwood forests of Michigan using the
TRACE model (Whittinghill et al. 2012). Whittinghill
et al. (2012) tested the TRACE model ability to
simulate organic soil response to N addition by (1)
simultaneously reducing the rate of lignin decompo-
sition by 30 % and increasing the rate of cellulose
decomposition 9 %, and (2) decreasing the system
limit value. Whittinghill et al. (2012) found that
changing decomposition rates in response to N
addition in the TRACE model underpredicted SOC
stocks. They concluded that decreasing the system
limit value results in a better simulation of observed
Oa SOC stocks. In our application of the SOM model,
decay parameters that result in the best fit to obser-
vations also result in a substantial decrease in limit
value.
In the field, much of the increase in forest floor C
storage by year 20 at the Harvard Forest occurred in
the Oe horizon (Frey et al. in review). Simulated
Oi ? Oe ? Oa can approximate observed dynamics
of the overall forest floor, but simulation of the
individual forest floor pools diverges from observa-
tions. Simulated Oi ? Oe pools were consistently
smaller than observed pools, largely because simulat-
ing the increase in the Oe pool was difficult due to the
nature of tracking individual litter cohorts to apply the
LIDET C and N mineralization relationships. The
overall effect of simulating a reduction in Oi ? Oe
decomposition rate, without changing model structure,
was to increase Oa stocks. Similar to our SOM model
simulations, the TRACE model also simulated little
change in the Oi ? Oe C stocks in response to N
addition (Whittinghill et al. 2012).
Effects of nitrogen addition on ecosystem carbon
The impact of increased N deposition on ecosystem
uptake of C has a long history of study, including long-
term N fertilization experiments and model analyses,
although both approaches initially focused on the
response of the vegetation C sink. Recent meta-
analyses of long-term N addition experiments have
highlighted the importance of soil C accumulation
(Janssens et al. 2010; Liu and Greaver 2010). At the
Harvard Forest, intensive sampling after 20 years of N
addition demonstrated that the soil, especially the
forest floor, accounted for the majority of C accumu-
lated in the system (Frey et al. in review). Mechanisms
responsible for this soil C accumulation include both
suppressed decomposability of SOM (Fog 1988) as
well as changes to microbial community composition
and enzyme production, which subsequently alters
rates of processing of cellulose and lignin (e.g.
Carreiro et al. 2000; Sinsabaugh et al. 2002; Frey
et al. 2004; Zak et al. 2008).
Trends in modeled dC/dN highlight the non-linear
impact of N addition, with C accumulation per unit N
increasing under intermediate rates of N addition, and
saturating for higher rates of N addition. Our simula-
tions of the long-term effects of historic N deposition
at Harvard Forest suggest a relatively modest effect on
total soil C stocks (1.3–2.3 %), with dC/dN values of
2.1–3.9. For steady state simulations of soil C response
to higher rates of N deposition (5 g N m-2 yr-1), dC/
dN values are smaller (1.2–2.6), but they yield
substantial (21–42 %) increases in total C stocks
reflecting their large cumulative inputs of N.
Conclusions
The model presented here, based largely on field
observations of forest soil C and N pools and decom-
position rates at the Harvard Forest, Massachusetts,
proved largely able to simulate soil C and N dynamics
at this site under control conditions. Accumulation of
soil C observed at the Harvard Forest Chronic N
Amendment Study was most accurately reproduced
when model simulation applied decreased decompo-
sition of litter, CWD, and SOM pools, using the
extreme suppression of Oa decay calculated from pine
stand experimental data. Field observations, mecha-
nistic experiments, and model simulations suggest that
addition of N to forest ecosystems could have a
substantial effect on forest soil carbon accumulation
via suppression of organic matter decomposition.
Biogeochemistry
123

Acknowledgments This modeling work was completed with
support from the Northeast Regional Center of the U.S.
Department of Energy’s National Institute for Climate Change
Research (NICCR), from the Northeastern States Research
Cooperative (NSRC), and the U.S. National Science Foundation
award # DEB 0614099. The Chronic Nitrogen Amendment
Experiment at Harvard Forest is maintained through support by
the Long-Term Ecological Research (LTER) Program.
Appendices
Appendix 1: Decomposition dynamics
Litter decomposition
We computed litter decomposition and N mineraliza-
tion-immobilization dynamics using relationships
derived in the LIDET experiment (Parton et al.
2007). Leaf and forest floor root litter is partitioned
into three decomposition classes (P1, P2, and P3)
based on substrate N, lignin and cellulose composition
(Eq. 1–3), where Lignin0 and N0 are the initial
concentration (%) of lignin and nitrogen in foliar
litter. The parameter E is a dimensionless scalar. For
evergreen stands E = 1. For deciduous stands E is
determined by the lignin:cellulose ratio of litter (Lci);
E = 5 (if Lci B 0.2), E = 2 ? (0.4 - Lci) 9 15 (if
0.2 \ Lci B 0.4), and E = 5 (if Lci [ 0.4).
P1 ¼ Rapid decay substrate
¼ 90� 1:4� Lignin0= N0 � Eð Þ ð1Þ
P2 ¼ Slow decay substrate ¼ 100� P1ð Þ � Lignin0
ð2ÞP3 ¼ Recalcitrant decay substrate ¼ Lignin0 ð3Þ
Equation 4 describes first order decay of litter mass
remaining after time (t).
Mass ðtÞ ¼ P1� e k1�tð Þ þ P2� e k2�tð Þ þ P3� e k3�tð Þ
ð4Þ
Substrate first-order decay rate parameters (k1, k2, and
k3) were derived from in situ litterbag decomposition
data collected at the Harvard Forest over 5 years
(Magill and Aber 1998; Frey and Ollinger 1999).
Lignin, cellulose, and total litter mass remaining were
reported for control, low N, and high N treatments in
the mixed-hardwood and pine plots. Lignin and
cellulose decay rates were directly estimated from
the observations; the labile substrate decay rate was
back-calculated using Eq. 4. Litter C and N (the forest
floor Oi ? Oe) is tracked for seven years, then
transferred to the humified organic SOM pool (Oa).
The ‘‘limit value’’ of decomposition refers to the
cumulative loss of litter mass when decomposition
rates slow (e.g. Berg 2000). The SOM model does not
include a limit value parameter, but the model can
effectively alter limit value by either changing decay
rate parameters or by changing the length of time a
cohort is tracked.
Net N mineralization is calculated using empirical
relationships derived in the LIDET study (Parton et al.
2007). The N mass remaining of a litter cohort is
calculated as a fraction of initial N mass (Eq. 5), where
a = 0.7, b = 98 9 (1 - e-1.569No), and F(x, a, b)
describes mineralization-immobilization dynamics
(Eq. 6).
N x;N0ð Þ ¼ F x; a; bð ÞF 100; a; bð Þ ð5Þ
F x; a; bð Þ ¼ x=bffiffiffiffiffiffiffiffiffiffiffiffiffiffiffiffiffiffiffiffiffiffiffiffiffiffiffiffiffiffiffiffiffiffiffiffiffiffiffiffiffiffiffiffiffiffiffiffiffiffiffiffiffiffiffiffiffiffiffiffiffiffi
2� a� x=bð Þ2þ 1� x=bð Þ2� �2
r ð6Þ
This concave functional form of net N mineralization-
immobilization dynamics evaluates to a fraction of N
remaining equal to 1 for fresh litter, greater than 1 for
net N immobilization, less than 1 for net mineraliza-
tion and cannot be negative.
SOM decomposition
For all four SOM pools the change in SOC is
determined based on first-order decay (Eq. 7), where
SOC(t) is the SOC of the current time step, SOC(t - 1)
is the SOC in the previous time step, Cin is the C
input in the previous time step, decay rate is derived
from Gaudinski et al. (2000) (Table 2), and Multi-
plierMoisture (Eq. 8) and MultiplierTemp (Eq. 9) are
unitless scalars describing the response of decompo-
sition rate to moisture status and temperature (�C)
(adopted from the PnET-CN model Aber et al. 1997),
and applied to each soil horizon simulated in the SOM
model.
Biogeochemistry
123

SOC ðtÞ ¼ Cin þ SOC t � 1ð Þ� edecay rate�MultiplierMoisture�MultiplierTemp ð7Þ
MultiplierMoisture ¼Soil moisture content
Water holding capacityð8Þ
MultiplierTemp ¼ e0:1� TemperatureAverage�7:1ð Þ � 0:68
ð9Þ
The flow of SOC follows the path outlined in Fig. 1,
with Oi and Oe litter decay serving as input to the
organic humified (Oa) SOC pool, Oa decay entering
both humified (75 %) and mineral-associated (25 %)
A-horizon SOC pools, and A-horizon decay serving as
input to the B-horizon mineral-associated SOC pool.
The SOM model uses the N mineralization-
immobilization dynamics applied in the PnET-CN
model for humified and mineral-associated SOM in
the O, A, and B soil horizons (Eq. A1.5, Aber et al.
1997). That is, gross N mineralization occurs
concurrent with decomposition, in proportion to
the C:N ratio of the SOM. The immobilization of N
during SOM decay (Eq. 10–13) is calculated as a
function of the percent organic nitrogen in SOM,
with the percent of N immobilized decreasing from
100 % at SOM N concentrations less than 1.5 %
(C:N of 30) to 0 % at soil N values greater than
4.3 % (C:N of 10). The calculated Nretention rate is
used to determine the fraction of gross N mineral-
ization (Eq. 11) that is immobilized during SOM
decomposition (Eq. 12). Net N mineralization is the
difference between gross N mineralization and gross
N immobilization (Eq. 13).
Nretention ¼151� 35�%Nð Þ
100ð10Þ
Gross Nmineralization ¼ SON� 1� edecay rate� �
ð11Þ
Gross Nimmobilization ¼ Nretention � Gross Nmineralization
ð12Þ
Net Nimmobilization ¼ Gross Nmineralization
� Gross Nimmobilization ð13Þ
Table 2 outlines initial C stocks and decay constants
used to apply the SOM model to the Harvard Forest.
Steady state C stocks were established from 300-year,
undisturbed simulations initialized with the C values
(Table 2) derived from observations by Gaudinski
et al. (2000). We initialized simulations with low
Oi ? Oe and CWD C values to allow stocks to
equilibrate to litter input for these more rapidly
cycling pools.
Appendix 2: Sensitivity analysis
Methods
Decomposition rates used here were derived from the
best-available data, yet there is uncertainty regarding
both the accuracy of the decomposition parameters
and the estimated fraction of C mass loss as CO2. Soil
C stocks also depend on litter inputs. We tested model
sensitivity to uncertainty in (1) the decay constants of
each substrate pool, (2) the CO2 loss fraction from
CWD, humified organic material, and the two A-
horizon SOM pools, and (3) litter input rates. Initial
SOC mass was set using values in Table 2. In each
sensitivity test, a single parameter was varied with all
other parameters held at default values; we did not
examine interdependencies among parameters.
Model sensitivity to values used for decay constants
and CO2 loss fractions were evaluated with 1000-year
simulations using constant litter inputs (Table 3) to
establish steady state SOC pools. Decay constants were
varied: (1a) to reflect potential ranges in Oi ? Oe decay
in response to N addition (Fig. 2 a, b), (1b) ± 20 % for
CWD and organic humified substrate, (1c) to reflect the
range of values observed for A-humified, A-mineral,
and B-mineral SOC at Harvard Forest (Gaudinski et al.
2000), corresponding to turnover times ranging from
100 to 220 years for A-humified, from 200 to 500 years
for A-mineral, and from 1250 to 2,000 years for B-
mineral SOC pools. The CO2 fraction was varied
(2a) ± 15 % of the default values for CWD and
organic humified SOM, and (2b) varying assumptions
about the relative contribution of A-humified and A-
mineral SOM to the B-mineral SOM pool (i.e., 100/0,
75/25, 50/50, 25/75, 0/100 percent relative contribution
from these two pools). The specific values of param-
eters tested are included in the figures presented in the
Results.
Model sensitivity to litter input rate was determined
from 100-year simulations using the same C starting
conditions. The range of litter inputs tested included (3a)
a 25 % decline in all litter inputs, (3b) a 25 % increase in
all litter inputs, (3c) a 25 % increase in leaf litter only,
(3d) a 25 % increase in root litter only, and (3e) a 25 %
increase in wood litter only. A 25 % increase in leaf
litter and a 25 % decrease in root litter is similar in
Biogeochemistry
123

magnitude to the non-significant variation in litter
observed at the Harvard Forest (Magill et al. 2004).
Results
Because model outcomes need to be viewed in the
context of the high variability of soil C measurements
and the uncertainty in parameter estimation, we include
model sensitivity to variation in key soil decomposition
parameters. Among the tests of decay parameter
sensitivity, uncertainty in the decay constants for the
A-horizon humified and mineral-associated SOM had
the greatest long-term effect on SOC storage (Fig. 6).
This range of responses results from varying the decay
constant of the A-horizon humified pool across a range
bounded by the slowest (0.0045 yr-1) and fastest
(0.01 yr-1) rate parameter values estimated by Gaud-
inski et al. (2000) using 14C measurements of A-horizon
soils; these values span an order of magnitude. Model
simulations using the slowest rate parameter resulted in
a 20 % increase (1,921 g C m-2) in total SOC storage
relative to simulations using the fastest parameter rate.
Similarly, simulations using the range of A-horizon
mineral-associated SOM decay rates estimated by
Gaudinski et al. (2000) resulted in a 15 % increase
(1,543 g C m-2) in total SOC storage for application of
the slowest (0.002 yr-1) relative to the fastest
(0.005 yr-1) rate parameter. The sensitivity analysis
bounds an extreme case, where the composition of the
A-horizon is skewed to being composed of entirely the
slowest decomposing A-horizon substrate or entirely the
fastest decomposing A-horizon substrate. The 55–60 %
decrease in rate across the slowest relative to the fastest
parameter values in the A-horizon combined with the
large A-horizon SOC pool drives the magnitude of SOC
change observed in the A-horizon sensitivity results.
The large range in A-horizon decay rates results from
the uncertainty in estimating decay rates using 14C
methods as well as an increased range of rates applicable
due to merging A-horizon pools. For all other C pools,
varying their decay constants produced a 1–8 % differ-
ence in total SOC storage across the range of values
tested.
We also examined model sensitivity to uncertain-
ties in our parameterization of the CO2 fraction, or the
fraction of mass loss during decomposition that is
released as CO2, rather than transferred to the next
SOM pool via physical mixing, DOC, or other
processes. Variation in the Oa CO2 fraction had the
greatest effect on total SOC storage relative to
uncertainties in the CO2 fractions for transfers
between other SOM pools (Fig. 7). We bounded
model error resulting from mis-parameterizing the
CO2 fraction by testing a ±15 % variation around the
default Oa and CWD CO2 fraction values. There was a
28 % increase in SOC storage (2,657 g C m-2) when
we decreased the Oa CO2 fraction from 0.9 to 0.65.
Decreasing the CWD CO2 fraction from 0.9 to 0.65
resulted in only a 5 % increase (497 g C m-2) in total
SOC storage. For the A-horizon, varying the CO2
fraction of the A-horizon humified and A-horizon
mineral-associated soil C was determined by assump-
tions about the relative contribution of these pools to
the B-mineral SOM pool and affected total SOC
storage by less than 13 % (1,146 g C m-2).
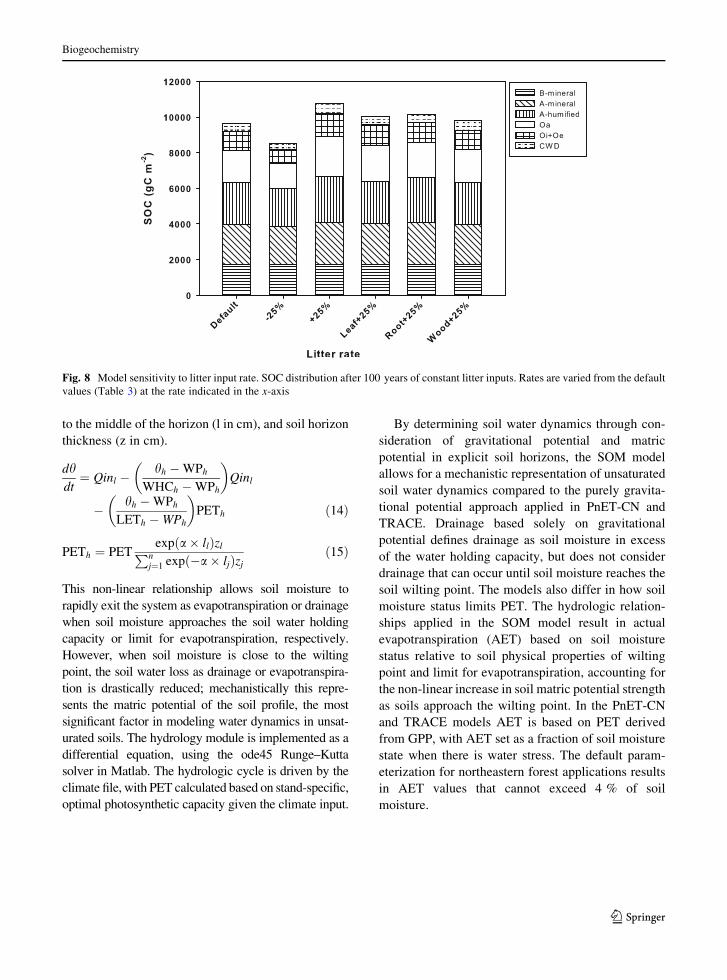
Varying litter inputs resulted in moderate differ-
ences in total SOC storage (Fig. 8). Increasing (or
decreasing) all litter input fluxes by 25 % resulted in a
corresponding 12 % increase (or decrease) in total
SOC storage. A 25 % increase in any single litter input
(with the other litter inputs at default values) resulted
in a 2–6 % increase in total SOC storage. Results from
substantially varying litter inputs demonstrate a mod-
erate magnitude feedback of litter mass on total SOC.
Appendix 3 Infiltration and solute transport
Simulated carbon and nitrogen cycles are coupled to
soil moisture and water flux dynamics in three soil
horizons (Oa, A, B). The drainage of water through
each soil horizon, and ultimately out of the ecosystem
controls solute transport (NO3-, NH4
?, DOC, and
DON).
Hydrology in the SOM model is based on the
PULSE model (Bergstrom et al. 1985; Carlsson et al.
1987), an approach similar to that developed in
FOREST-SAFE (Wallman et al. 2006). This algorithm
allows for a mechanistic representation of soil water
dynamics in unsaturated soils. Changes in soil mois-
ture (h, Eq. 14) result from water inputs (Qin) with
loss from drainage and potential evapotranspiration
(PET) based on the gradient defined by soil moisture
status relative to soil physical characteristics: wilting
point (WP), water holding capacity (WHC), and the
limit for evapotranspiration (LET) (Appendix 4).
Water inputs (Qin) are defined in the climate input
files while PET is determined based on potential gross
canopy photosynthesis as defined in PnET_CN (Aber
Biogeochemistry
123

et al. 1997). Soil moisture dynamics are calculated for
each soil horizon based on the horizon-specific soil
physical properties hh, PETh, WPh, WHCh, and LETh.
The distribution of PET across soil horizons (PETh,
Eq. 15) is derived from total ecosystem PET, a
coefficient to distribute PET with depth (a), the depth
Fig. 6 Model sensitivity to variation in decay rate. Steady state
SOC distribution after 1,000 years of decay with constant litter
inputs. All simulations are started with the same initial SOC
distribution. Decay constants are varied in isolation using the
value presented in the x-axis. Change in CWD (a) and Oa (c)
ranges over ±20 % of default model rate. Change in Oi ? Oe
(b) represents rate change in response to N deposition. Rates for
A-humified (d), A-mineral (e), and B-mineral (f) pools span the
range observed at Harvard Forest
Biogeochemistry
123

Fig. 7 Model sensitivity to
CO2 fraction of decomposed
organic C. Steady state SOC
distribution after
1,000 years of decay with
constant litter inputs is
shown for variation in (a)
CWD, (b) Oa, and (c) A-
horizon CO2 fraction. All
simulations are started with
the same initial SOC
distribution. CO2 fraction is
varied in isolation based on
the value displayed in the x-
axis. Note A-humified and
A-mineral CO2 fractions (c)
are varied in tandem to
represent different
assumptions about the
contribution of each pool to
the B-mineral SOC pools
Biogeochemistry
123
to the middle of the horizon (l in cm), and soil horizon
thickness (z in cm).
dhdt¼ Qinl �
hh �WPh
WHCh �WPh
� �
Qinl
� hh �WPh
LETh �WPh
� �
PETh ð14Þ
PETh ¼ PETexpða� llÞzl
Pnj¼1 expð�a� ljÞzj
ð15Þ
This non-linear relationship allows soil moisture to
rapidly exit the system as evapotranspiration or drainage
when soil moisture approaches the soil water holding
capacity or limit for evapotranspiration, respectively.
However, when soil moisture is close to the wilting
point, the soil water loss as drainage or evapotranspira-
tion is drastically reduced; mechanistically this repre-
sents the matric potential of the soil profile, the most
significant factor in modeling water dynamics in unsat-
urated soils. The hydrology module is implemented as a
differential equation, using the ode45 Runge–Kutta
solver in Matlab. The hydrologic cycle is driven by the
climate file, with PET calculated based on stand-specific,
optimal photosynthetic capacity given the climate input.
By determining soil water dynamics through con-
sideration of gravitational potential and matric
potential in explicit soil horizons, the SOM model
allows for a mechanistic representation of unsaturated
soil water dynamics compared to the purely gravita-
tional potential approach applied in PnET-CN and
TRACE. Drainage based solely on gravitational
potential defines drainage as soil moisture in excess
of the water holding capacity, but does not consider
drainage that can occur until soil moisture reaches the
soil wilting point. The models also differ in how soil
moisture status limits PET. The hydrologic relation-
ships applied in the SOM model result in actual
evapotranspiration (AET) based on soil moisture
status relative to soil physical properties of wilting
point and limit for evapotranspiration, accounting for
the non-linear increase in soil matric potential strength
as soils approach the wilting point. In the PnET-CN
and TRACE models AET is based on PET derived
from GPP, with AET set as a fraction of soil moisture
state when there is water stress. The default param-
eterization for northeastern forest applications results
in AET values that cannot exceed 4 % of soil
moisture.
Fig. 8 Model sensitivity to litter input rate. SOC distribution after 100 years of constant litter inputs. Rates are varied from the default
values (Table 3) at the rate indicated in the x-axis
Biogeochemistry
123

Appendix 4: Soil physical parameters
Symbol Value Units Soil physical properties
Definition
a 0.05 Unitless Coefficient distributing PET
across soil horizons
WPO 0.28 cm Oa wilting point
WPA 0.50 cm A-horizon wilting point
WPB 2.15 cm B-horizon wilting point
WHCO 1.20 cm Oa water holding capacity
WHCA 3.50 cm A-horizon water holding capacity
WHCB 19.35 cm B-horizon water holding capacity
LETO 0.34 cm Oa limit for evapotranspiration
LETA 0.60 cm A-horizon limit for
evapotranspiration
LETB 2.60 cm B-horizon limit for
evapotranspiration
ZO 4 cm Oa thickness
ZA 10 cm A-horizon thickness
ZB 43 cm B-horizon thickness
IO 2 cm Oa mid-horizon depth
IA 14 cm A mid-horizon depth
IB 43 cm B mid-horizon depth
Appendix 5: Simulation of stand history
We represented historical changes in N deposition
(Geschwandtner et al. 1988; Farrel et al. 1999) using a
linear increase (slope = 0.0012 g N m-2 yr-1) from
1800 until 1940, followed by a steeper linear increase
(slope = 0.018 g N m-2 yr-1) before stabilizing at
current levels by 1970 (Table 1). Because meteoro-
logical data was not available from 1800 until present
day, we generated climate inputs by repeating 1996
meteorological data from the Harvard Forest (Boose
and Gould 1999), a year with average mean and
variance of climatic observations.
The SOM model simulates agriculture using the
constant litter input rates defined in Table 3, which
assumes 40 % of biomass is harvested for use in the
food system, and represents soil disturbance at the start
of agricultural management as a 5 % loss of O-horizon
OM. See Table 1 for details of simulated forest
management and natural history.
References
Aber J, Federer C (1992) A generalized, lumped-parameter
model of photosynthesis, evapotranspiration and net pri-
mary production in temperate and boreal forest ecosys-
tems. Oecologia 92:463–474
Aber J, Melillo J (1982) Nitrogen immobilization in decaying
hardwood leaf litter as a function of initial nitrogen and
lignin content. Can J Botany-Revue Canadienne De Bot-
anique 60:2263–2269
Aber J, Ollinger S, Driscoll C (1997) Modeling nitrogen satu-
ration in forest ecosystems in response to land use and
atmospheric deposition. Ecol Model 101:61–78
Aber J, Ollinger S, Driscoll C, Likens G, Holmes R, Freuder R,
Goodale C (2002) Inorganic nitrogen losses from a forested
ecosystem in response to physical, chemical, biotic, and
climatic perturbations. Ecosystems 5:648–658
Berg B (2000) Initial rates and limit values for decomposition of
Scots pine and Norway spruce needle litter: a synthesis for
N-fertilized forest stands. Can J For Res-Revue Canadi-
enne De Recherche Forestiere 30:122–135
Berg B, Matzner E (1997) Effect of N deposition on decom-
position of plant litter and soil organic matter in forest
systems. Environ Rev 5:1–25
Berg B, Ekbohm G, Johansson M, McClaugherty C, Rutigliano
F, DeSanto A (1996) Maximum decomposition limits of
forest litter types: a synthesis. Can J Botany-Revue Cana-
dienne De Botanique 74:659–672
Berg B, Davey MP, De Marco A, Emmett B, Faituri M, Hobbie
SE, Johansson M-B, Liu C, McClaugherty C, Norell L,
Rutigliano FA, Vesterdal L, De Santo AV (2010) Factors
influencing limit values for pine needle litter decomposi-
tion: a synthesis for boreal and temperate pine forest sys-
tems. Biogeochemistry 100:57–73
Bergstrom S, Carlsson B, Sandberg G, Maxe L (1985) Inte-
grated modeling of runoff, alkalinity, and pH on a daily
basis. Nordic Hydrol 16:89–104
Bonan GB, Hartman MD, Parton WJ, Wieder WR (2012)
Evaluating litter decomposition in earth system models
with long-term litterbag experiments: an example using the
Community Land Model version 4 (CLM4). Glob Change
Biol 19:957–974
Boose E, Gould E (1999) Shaler meteorological station at
Harvard Forest 1964–2002. Harvard Forest Data Archive:
HF000
Bowden R, Davidson E, Savage K, Arabia C, Steudler P (2004)
Chronic nitrogen additions reduce total soil respiration and
microbial respiration in temperate forest soils at the Har-
vard Forest. For Ecol Manage 196:43–56
Carlsson B, Bergstrom S, Brandt M, Lindstrom G (1987) The
PULSE model: structure and applications. SMHI 8
Carreiro M, Sinsabaugh R, Repert D, Parkhurst D (2000)
Microbial enzyme shifts explain litter decay responses to
simulated nitrogen deposition. Ecology 81:2359–2365
Currie W, Nadelhoffer K, Aber J (1999) Soil detrital processes
controlling the movement of N-15 tracers to forest vege-
tation. Ecol Appl 9:87–102
Currie W, Nadelhoffer K, Aber J (2004) Redistributions of N-15
highlight turnover and replenishment of mineral soil
Biogeochemistry
123

organic N as a long-term control on forest C balance. For
Ecol Manage 196:109–127
Davidson E, Janssens I (2006) Temperature sensitivity of soil
carbon decomposition and feedbacks to climate change.
Nature 440:165–173
Davidson EA, Savage KE, Trumbore SE, Borken W (2006)
Vertical partitioning of CO2 production within a temperate
forest soil. Glob Change Biol 12:944–956
de Vries W, Solberg S, Dobbertin M, Sterba H, Laubhann D, van
Oijen M, Evans C, Gundersen P, Kros J, Wamelink GWW,
Reinds GJ, Sutton MA (2009) The impact of nitrogen
deposition on carbon sequestration by European forests and
heathlands. For Ecol Manage 258:1814–1823
Farrel A, Carter R, Raufer R (1999) The NOx budget: market-
based control of tropospheric ozone in the northeastern
United States. Resour Energy Econ 21:103–124
Field CB, Chapin FS, Matson PA, Mooney HA (1992) Response
of terrestrial ecosystems to the changing atmosphere – a
resource-based approach. Annu Rev Ecol Syst 23:201–235
Fog K (1988) The effect of added nitrogen on the rate of
decomposition of organic-matter. Biol Rev Camb Philos
Soc 63:433–462
Frey S, Ollinger S (1999) Chronic nitrogen amendment exper-
iment at Harvard Forest since 1988. Harvard Forest Data
Archive: HF008
Frey SD, Ollinger S, Nadelhoffer K, Bowden R, Brzostek E,
Burton A, Caldwell B, Crow S, Goodale C, Grandy S, Finzi
A, Kramer M, Lajtha K, Martin M, McDowell W, Minocha
R, Templer P, Wicking K (in review) Temperate forest
soils sequester as much carbon as trees in response to
nitrogen deposition. Nat Geosci
Frey S, Knorr M, Parrent J, Simpson R (2004) Chronic nitrogen
enrichment affects the structure and function of the soil
microbial community in temperate hardwood and pine
forests. For Ecol Manage 196:159–171
Gaudinski J, Trumbore S, Davidson E, Zheng S (2000) Soil
carbon cycling in a temperate forest: radiocarbon-based
estimates of residence times, sequestration rates and par-
titioning of fluxes. Biogeochemistry 51:33–69
Gbondo-Tugbawa S, Driscoll C, Aber J, Likens G (2001)
Evaluation of an integrated biogeochemical model (PnET-
BGC) at a northern hardwood forest ecosystem. Water
Resour Res 37:1057–1070
Geschwandtner G, Wagner JK, Husar RB (1988) Comparison of
historic SO2 and NOx emission data sets EPA/600/S7-88/
009
Goodale CL, Lajtha K, Nadelhoffer KJ, Boyer EW, Jaworski
NA (2002) Forest nitrogen sinks in large eastern U.S.
watersheds: estimates from forest inventory and an eco-
system model. Biogeochemistry 57(58):239–266
Gruber N, Galloway JN (2008) An earth-system perspective of
the global nitrogen cycle. Nature 451:293–296
Hagedorn F, Spinnler D, Siegwolf R (2003) Increased N depo-
sition retards mineralization of old soil organic matter. Soil
Biol Biochem 35:1683–1692
Holland EA, Braswell BH, Sulzman J, Lamarque JF (2005)
Nitrogen deposition onto the United States and Western
Europe: synthesis of observations and models. Ecol Appl
15:38–57
Janssens IA, Dieleman W, Luyssaert S, Subke J, Reichstein M,
Ceulemans R, Ciais P, Dolman AJ, Grace J, Matteucci G,
Papale D, Piao SL, Schulze E, Tang J, Law BE (2010)
Reduction of forest soil respiration in response to nitrogen
deposition. Nat Geosci 3:315–322
Keeler BL, Hobbie SE, Kellogg LE (2009) Effects of long-term
nitrogen addition on microbial enzyme activity in eight
forested and grassland sites: implications for litter and soil
organic matter decomposition. Ecosystems 12:1–15
Knorr M, Frey S, Curtis P (2005) Nitrogen additions and litter
decomposition: a meta-analysis. Ecology 86:3252–3257
Liu L, Greaver TL (2010) A global perspective on belowground
carbon dynamics under nitrogen enrichment. Ecol Lett
13:819–828
Liu X, Zhang Y, Han W, Tang A, Shen J, Cui Z, Vitousek P,
Erisman JW, Goulding K, Christie P, Fangmeier A, Zhang
F (2013) Enhanced nitrogen deposition over China. Nature
494:459–462
Lu C, Tian H (2007) Spatial and temporal patterns of nitrogen
deposition in China: synthesis of observational data. J
Geophys Res, 112, D22S05, doi:10.1029/2006JD007990
Magill A, Aber J (1998) Long-term effects of experimental
nitrogen additions on foliar litter decay and humus for-
mation in forest ecosystems. Plant Soil 203:301–311
Magill A, Aber J, Berntson G, McDowell W, Nadelhoffer K,
Melillo J, Steudler P (2000) Long-term nitrogen additions
and nitrogen saturation in two temperate forests. Ecosys-
tems 3:238–253
Magill A, Aber J, Currie W, Nadelhoffer K, Martin M, McDo-
well W, Melillo J, Steudler P (2004) Ecosystem response to
15 years of chronic nitrogen additions at the Harvard
Forest LTER, Massachusetts, USA. For Ecol Manage
196:7–28
Magill AH, Aber JD, Hendricks JJ, Bowden RD, Melillo JM,
Steudler PA (1997) Biogeochemical response of forest
ecosystems to simulated chronic nitrogen deposition. Ecol
Appl 7:402–415
Melillo J, Aber J, Muratore J (1982) Nitrogen and lignin control
of hardwood leaf litter decomposition dynamics. Ecology
63:621–626
Nave LE, Vance ED, Swanston CW, Curtis PS (2009) Impacts of
elevated N inputs on north temperate forest soil C storage,
C/N, and net N-mineralization. Geoderma 153:231–240
Neff J, Townsend A, Gleixner G, Lehman S, Turnbull J, Bow-
man W (2002) Variable effects of nitrogen additions on the
stability and turnover of soil carbon. Nature 419:915–917
Ollinger S, Smith M (2005) Net primary production and canopy
nitrogen in a temperate forest landscape: an analysis using
imaging spectroscopy, modeling and field data. Ecosys-
tems 8:760–778
Ollinger S, Aber J, Reich P (1997) Simulating ozone effects on
forest productivity: interactions among leaf-, canopy-, and
stand-level processes. Ecol Appl 7:1237–1251
Ollinger S, Aber J, Federer C (1998) Estimating regional forest
productivity and water yield using an ecosystem model
linked to a GIS. Landscape Ecol 13:323–334
Ollinger S, Aber J, Reich P, Freuder R (2002) Interactive effects
of nitrogen deposition, tropospheric ozone, elevated CO2
and land use history on the carbon dynamics of northern
hardwood forests. Glob Change Biol 8:545–562
Ollinger SV, Aber JD, Lovett GM, Millham SE, Lathrop RG,
Ellis JM (1993) A spatial model of atmospheric deposition
for the northeastern United States. Ecol Appl 3:459–472
Biogeochemistry
123

Parton W, Schimel D, Cole C, Ojima D (1987) Analysis of
factors controlling soil organic-matter levels in great-
plains grasslands. Soil Sci Soc Am J 51:1173–1179
Parton W, Silver WL, Burke IC, Grassens L, Harmon ME,
Currie WS, King JY, Adair EC, Brandt LA, Hart SC, Fasth
B (2007) Global-scale similarities in nitrogen release pat-
terns during long-term decomposition. Science 315:361–
364
Raich JW, Nadelhoffer KJ (1989) Belowground carbon alloca-
tion in forest ecosystems: global trends. Ecology 70:1346–
1354
Raich J, Rastetter E, Melillo J, Kicklighter D, Steudler P, Pet-
erson B, Grace A, Moore B, Vorosmarty C (1991) Potential
net primary productivity in South-America—application of
a global-model. Ecol Appl 1:399–429
Raup HM (1966) The view from John Sanderson’s Farm: a
perspective for the use of land. For Hist 10:2–11
Sinsabaugh R, Carreiro M, Repert D (2002) Allocation of
extracellular enzymatic activity in relation to litter com-
position, N deposition, and mass loss. Biogeochemistry
60:1–24
Thomas RQ, Canham CD, Weathers KC, Goodale CL (2010)
Increased tree carbon storage in response to nitrogen
deposition in the US. Nat Geosci 3:13–17
Townsend A, Braswell B, Holland E, Penner J (1996) Spatial
and temporal patterns in terrestrial carbon storage due to
deposition of fossil fuel nitrogen. Ecol Appl 6:806–814
Trumbore S (2000) Age of soil organic matter and soil respi-
ration: radiocarbon constraints on belowground C
dynamics. Ecol Appl 10:399–411
Trumbore SE (2006) Carbon respired by terrestrial ecosys-
tems—recent progress and challenges. Glob Change Biol
12(2):141–153
Waldrop M, Zak D, Sinsabaugh R (2004) Microbial community
response to nitrogen deposition in northern forest ecosys-
tems. Soil Biol Biochem 36:1443–1451
Wallman P, Belyazid S, Svensson M, Sverdrup H (2006) DE-
COMP—a semi-mechanistic model of litter decomposi-
tion. Environ Model Softw 21:33–44
Weiss M (2011) Short and long-term effects of nitrogen fertil-
ization on carbon and nitrogen cycles in northeastern for-
ests soils. PhD thesis, Cornell University, Ithaca, New
York, 127 pp
Whittinghill KA, Currie WS, Zak DR, Burton AJ, Pregitzer KS
(2012) Anthropogenic N deposition increases soil C stor-
age by decreasing the extent of litter decay: analysis of field
observations with an ecosystem model. Ecosystems
15:450–461
Zak DR, Holmes WE, Burton AJ, Pregitzer KS, Talhelm AF
(2008) Simulated atmospheric NO3-deposition increases
soil organic matter by slowing decomposition. Ecol Appl
18:2016–2027
Biogeochemistry
123