the effect of music on physiological responses and self
TRANSCRIPT

University of Central Florida University of Central Florida
STARS STARS
HIM 1990-2015
2012
The effect of music on physiological responses and self-The effect of music on physiological responses and self-
perceived mood perceived mood
Robert-Christian Sanchez University of Central Florida
Part of the Music Performance Commons
Find similar works at: https://stars.library.ucf.edu/honorstheses1990-2015
University of Central Florida Libraries http://library.ucf.edu
This Open Access is brought to you for free and open access by STARS. It has been accepted for inclusion in HIM
1990-2015 by an authorized administrator of STARS. For more information, please contact [email protected].
Recommended Citation Recommended Citation Sanchez, Robert-Christian, "The effect of music on physiological responses and self-perceived mood" (2012). HIM 1990-2015. 1299. https://stars.library.ucf.edu/honorstheses1990-2015/1299

THE EFFECT OF MUSIC ON PHYSIOLOGICAL RESPONSES
AND SELF-PERCEIVED MOOD
by
Robert-Christian Sanchez
A thesis submitted in partial fulfillment of the requirements
for the Honors in the Major Program in Music Performance
in the College of Arts and Humanities
and in The Burnett Honors College
at the University of Central Florida
Orlando, FL
Spring Term 2012
Thesis Chair: Dr. R. Joe Gennaro
ii
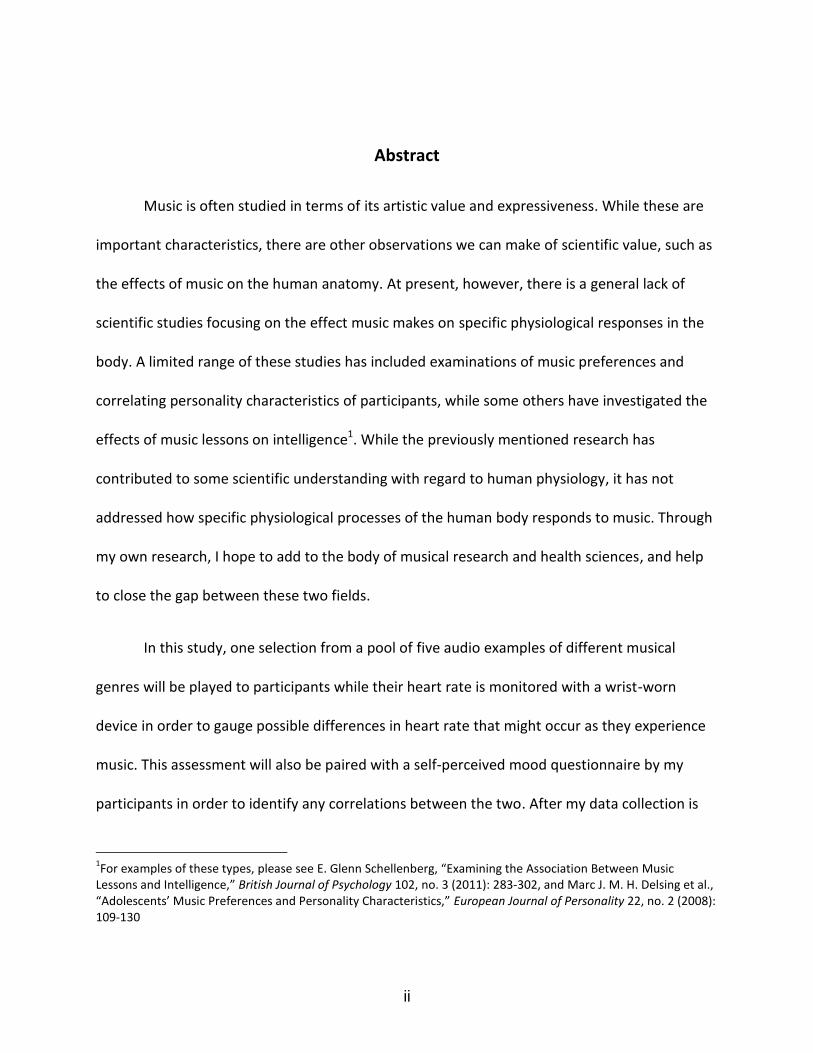
Abstract
Music is often studied in terms of its artistic value and expressiveness. While these are
important characteristics, there are other observations we can make of scientific value, such as
the effects of music on the human anatomy. At present, however, there is a general lack of
scientific studies focusing on the effect music makes on specific physiological responses in the
body. A limited range of these studies has included examinations of music preferences and
correlating personality characteristics of participants, while some others have investigated the
effects of music lessons on intelligence1. While the previously mentioned research has
contributed to some scientific understanding with regard to human physiology, it has not
addressed how specific physiological processes of the human body responds to music. Through
my own research, I hope to add to the body of musical research and health sciences, and help
to close the gap between these two fields.
In this study, one selection from a pool of five audio examples of different musical
genres will be played to participants while their heart rate is monitored with a wrist-worn
device in order to gauge possible differences in heart rate that might occur as they experience
music. This assessment will also be paired with a self-perceived mood questionnaire by my
participants in order to identify any correlations between the two. After my data collection is
1For examples of these types, please see E. Glenn Schellenberg, “Examining the Association Between Music
Lessons and Intelligence,” British Journal of Psychology 102, no. 3 (2011): 283-302, and Marc J. M. H. Delsing et al., “Adolescents’ Music Preferences and Personality Characteristics,” European Journal of Personality 22, no. 2 (2008): 109-130

iii
complete, I will statistically analyze the information and examine any parallels between the
musical selections, genre, heart rate, and self-perceived mood. By analyzing this data, I hope to
gain insight into possible human physiological responses as the subjects are exposed to
different musical examples from various genres. I also hope to investigate the psychological
realm of music, and determine its practical use in the medical field with regard to music
therapy, which can lead to various treatments in post-traumatic stress disorder, and
communicative diseases.

iv
Dedications
For my parents, who have fervently supported my imagination, curiosity, and education with an endless amount of love.
For my family, friends, and brothers of Phi Mu Alpha Sinfonia and Kappa Kappa Psi for truly letting me be myself.
And for my professors, who without their support, advice, and encouragement, none of this would be possible.

v
Acknowledgements
Words cannot describe the amount of gratitude I owe my committee members. They have
voluntarily given their time, energy, guidance, and knowledge to me, and I will never be able to
thank them enough. A special acknowledgement goes to Dr. Karen Large for getting this project
off the ground and making sure I always had someone to turn to. I also would like to give
special recognition to my thesis chair, Dr. R. Joe Gennaro, for fearlessly stepping into my
research at the halfway point and pushing me to do more than I thought myself capable of.
Thanks also to Mrs. Christine Hanlon and Dr. David Brunner for their continuous support during
my research.

vi
Table of Contents
Introduction .................................................................................................................................... 1
Methods .......................................................................................................................................... 9
Participants ................................................................................................................................. 9
Materials and Methods ............................................................................................................... 9
Procedure .................................................................................................................................... 9
Results and Discussion .................................................................................................................. 12
Heart Rate: ................................................................................................................................ 12
Silence (Control Group) ........................................................................................................ 13
Prelude from Suite No. 1 for Unaccompanied Cello (Johann Sebastian Bach) ..................... 15
Vox Balaenae (George Crumb) ............................................................................................. 17
“As Vesta Was Descending” (Thomas Weelkes) ................................................................... 19
Symphony No. 5, Op.67 (First Movement) (Ludwig van Beethoven) ................................... 21
Libertango (Astor Piazzolla) .................................................................................................. 24
Mood: ........................................................................................................................................ 26
Conclusions and Future Studies .................................................................................................... 29

vii
Appendix A: HRP-302a Adult Consent Form ................................................................................. 31
Appendix B: Participant Survey .................................................................................................... 35
Appendix C: Approval of Human Research ................................................................................... 39
Selected Bibliography ................................................................................................................... 41
viii
List of Figures
Figure 1: Silence Heart Rate Graph ............................................................................................... 13
Figure 2: Silence Data Table .......................................................................................................... 14
Figure 3: Bach Heart Rate Graph .................................................................................................. 15
Figure 4: Bach Data Table ............................................................................................................. 16
Figure 5: Crumb Heart Rate Graph ............................................................................................... 17
Figure 6: Crumb Data Table .......................................................................................................... 18
Figure 7: Weelkes Heart Rate Graph ............................................................................................ 19
Figure 8: Weelkes Data Table ....................................................................................................... 20
Figure 9: Beethoven Heart Rate Graph ......................................................................................... 21
Figure 10: Beethoven Data Table.................................................................................................. 22
Figure 11: Piazzolla Heart Rate Graph .......................................................................................... 24
Figure 12: Piazzolla Data Table ..................................................................................................... 25
Figure 13: Participant Demographics............................................................................................ 27

1
Introduction
It is surprising to see the existence of tempo in both nature and our everyday lives. The
rate at which we walk, breathe, talk, and even the rates in which our hearts beat varies from
person to person. Heart rate, one of the variables in my study, is an important response to
monitor because it can also be a crucial key in identifying certain medical symptoms and
conditions, from arrhythmias and hypertension, to palpitations.2
One might assume that the body of research, specifically physiological responses to
music, is tremendous; however, it is surprisingly limited. While some scientific fields (neurology
and psychology) have provided some foundations in this area, I intend to build upon the areas
that they have not addressed. My research seeks to connect the emotional and psychological
responses to music with specific physiological factors (mainly heart rate, with regard to this
study) as opposed to investigating each variable separately. By doing so, we may be able to
interpret other factors at play during the process of listening to music.
There are some studies that have dealt with physiological responses to music, and most
of them are found in the areas of neurology and psychology. In the field of sports medicine, the
Karageorghis, Jones, and Low (2006) study partially examined the correlation between heart
rate during exercise and musical tempo, and found that faster musical tempos (only during high
2 According to Hollinhead’s Textbook of Anatomy and Medical-Surgical Nursing – Critical Thinking of Collaborative
Care, the average resting heart rate in humans is typically anywhere in between 60-100 beats per minute (bpm). Lower than 60 bpm is usually classified as bradycardia, while over than 100 bpm is usually classified as tachycardia. Factors that can affect heart rate include sex, age, body temperature, digestion, pain, emotion, blood pressure, exercise, breathing, medications, illness, and heart disease.
2
intensity exercise) seemed to create an increase in participants’ heart rates. 3 During the
research phase, they found that musical tempo preference (whether the participant favored
faster or slower tempos) had some interaction with exercise intensity, but gender did not
correlate at all.
Another example, “Music and the Brain” by Robert J. Zatorre, examined a neurological
perspective to the study of music by exploring issues of musical imagery, music and emotion,
and absolute pitch. Zatorre’s research attempted to illustrate methods involved in assessing
subjective situations with objective techniques (like functional neuroimaging), examining the
neural systems associated with internal phenomena (for example, absolute pitch), and raised
questions about the broader role of music in the human experience.4 Zattorre addressed some
important notions, such as the difficult question of how to quantify something as subjective as
an emotional response to music. Zattorre found that the areas of the brain which produced
emotional responses in music seemed to be the same as those that produced emotions elicited
by other stimuli, including visual imagery. Furthermore, he found various correlations between
musical effects and areas of the brain that are epicenters for other major processes.
In terms of musical imagery, participants in Zatorre’s study were asked to judge the
pitch change between two syllables in a well-known song. They were able to do so with
3 Costas I. Karageorghis, Leighton Jones, and Daniel C. Low, “Relationship Between Exercise Heart Rate and Music
Tempo,” Research Quarterly for Exercise and Sport 77, no. 2 (2006): 248.
4 R. J. Zatorre, “Music and the Brain,” Annals of the New York Academy of Sciences 999, no.1 (2003): 4.

3
consistent accuracy, showing that they had an “internal representation of the pitch structure.”5
This served as an accurate response, giving an objective answer to a subjective question.
Zatorre modified his study by performing the same experiment while using a neuroimaging
device to monitor brain response and observe which areas of the brain seemed to be involved
with the activities. Zatorre also examined participants with brain lesions and attempted to
associate those lesions with auditory centers in the brain. He found that perception and
imagery suffered from poor performance in normal pitch-judgment tasks on both music that
was played and those that the participants were told to imagine after damage to the right
temporal lobe. The study concluded that imagery does depend on a partially shared neural
substrate that is part of the perceptual analysis mechanism. When we imagine an event, neural
systems that are involved in perception are activated.6
There are multiple factors that add to the difficulty of studying emotions and music in a
scientific context. Emotional responses can be influenced by educational, historical,
sociocultural, and contextual variables, making it difficult to establish a consistent experimental
protocol. The sheer difficulty of investigating emotion in a scientific manner makes it all the
more important to acknowledge this study. While Zatorre’s research examined responses to
dissonance, he did not consider the changes in the mood of the participants. This portion of his
work examined how people responded to dissonance through a trial where a tonal melody was
5 Ibid., 6.
6 Ibid., 7.

4
accompanied by chords with varying degrees of dissonance. By using this technique, the degree
of dissonance could be varied in order to measure changes in brain activity without having to
choose a baseline condition. This allowed any change noted to be related to the parameter
varied. For example, participants listened to this music while making judgments about their
pleasantness and generally confirmed that the more dissonant the example, the less pleasant
the experience.7 We might suggest that any changes noted in brain activity could be attributed
to the degree of dissonance.
In the field of music therapy, Aldridge, Gustorff, and Hannidge (1990) examined
improvised singing by a music therapist to a comatose patient, and related the variations in the
therapist’s music to the patient’s breathing and Electroencephalography (EEG) patterns.8 A
range of reactions were noted in the subjects, such as their breathing becoming slower and
deeper, grabbing movements of the hand, turning of the head and eyes opening, and finally to
their regaining of consciousness. Generally, when the therapist first began to sing the heart rate
of the patients slowed down. The heart rate then rose rapidly and continued at this elevated
level until the end of the therapy session.9 EEG measurements showed changes from theta
7 Ibid., 10.
8 D. Aldridge, D. Gustorff, and H-J Hannich, “Where Am I? Music Therapy Applied to Coma Patients,” Journal of the Royal Society of Medicine 83, (1990): 345.
9 The Aldridge study does not provide statistical information on increase in heart rate, and states this increase as
“rapidly.” Ibid., 345.

5
rhythms to alpha rhythms or beta rhythms; however, these effects dissipated after the sessions
stopped.10
In a project similar to the Aldridge study, Darcy D. Walworth’s research “Effect of Live
Music Therapy for Patients Undergoing Magnetic Resonance Imaging,” was the first published
study to use live music therapy during MRI scans.11 As one of the preliminary steps in their
experiment, a baseline score of the participants’ anxiety level was assessed with a statistical
tool used to obtain the means of multiple populations (known as MANOVA). A music therapist
examined musical preferences in the population and then played acoustic guitar, accompanied
by their voice to the pulse of the MRI machine. The result of the study was that participants
receiving the live music therapy had fewer scans repeated due to movement. Participants
receiving live music therapy also requested fewer breaks from the scan (one in the
experimental group versus eight in the control group). On average, people receiving the live
music required less time to complete the scans.12
Montag, Reuter, and Axmacher’s research, “How one’s favorite song activates the
reward circuitry of the brain: Personality matters!” was another project, like Walworth’s, that
involved the use of an MRI machine (more specifically, an fMRI device).13 This study compared
10
Ibid., 345.
11 Darcy D. Walworth, “Effect of Live Music Therapy for Patients Undergoing Magnetic Resonance Imaging.” Journal of Music Therapy 47, (2010): 335-350.
12 Ibid., 350.
13 fMRI is an acronym for Functional Magnetic Resonance Imaging. This procedure measures brain activity by
detecting associated changes in blood flow related to energy use by brain cells.

6
brain activity in participants as they listened to a song that they (the participants) selected as
their favorite. The researchers then compared that brain activity to measurements taken during
the playing of a song that they did not like (again, the selection was chosen by the participants).
Montag explained “This direct comparison is relevant because it directly modulates the
dimension of subjective pleasantness.”14 The results showed that people who reported
themselves as “easily getting absorbed by the arts” had less activity in the ventral striatum,
demonstrating a higher “self-forgetfulness trait.”15 The activation of the ventral striatum was
used as a method of quantifying the reaction to the participant’s chosen favorite song because
this area of the brain is strongly associated with emotional aspects of behavior. This study
presented another way that we can possibly document an emotional reaction to music, and
how to apply it to other situations.
Although the previous studies are important in their own right, they do not examine the
effects of music and how they may correlate to heart rate, self-perceived mood, or
physiological responses at any point. But by individually examining the relationship between
physiological and psychological responses, we might be able to investigate how both stand as
important factors to consider in how people respond to music. While these studies I have noted
do not examine the previously mentioned correlations, some of them do address variables that
are of use to this particular study.
14
C. Montag, M. Reuter, and N. Axmacher. “How One’s Favorite Song Activates the Reward Circuitry of the Brain: Personality Matters!” Behavioural Brain Research 225, (2011): 511.
15 Ibid., 511.

7
The Zatorre study relates to my research because each participant in my experiment will
have external circumstances that may affect the way they react to music, especially if they are
familiar with a particular piece. By observing the interaction between the outside factors and
neural processes, we might be able to quantify changes in mood by exploring certain variables I
will establish in my experiment. In order to investigate changes in heart rate with my study, we
must also look at what psychological processes may be occurring at the time, as also noted by
the Zatorre study.
While the Zatorre study examined the response to dissonance, it only investigated a
very small aspect of human awareness. As shown in the Aldridge, Gustorff, and Hannidge
research, the participants responded to music at differing levels of consciousness. Their results
relate especially to my work because the physiological responses they noted were quantified by
heart rate (a variable in my research) and EEG measurements. Although Aldridge, Gustorff, and
Hannidge were able to measure physiological response, they did not associate it with possible
emotional content of the music or change in mood, which is something I intend to explore in
my research.
If indeed there is a correlation between tempo, heart rate, and self-perceived mood,
practitioners of medicine will have yet another tool at their disposal to treat people, especially
in the field of music therapy. There may even be a possibility that music may be more powerful
in helping certain conditions, like depression and post-traumatic stress disorder, as opposed to
using pharmaceutical drugs as a singular remedy. By examining these correlations and

8
individual variables with respect to differing musical genres over a large population with varied
backgrounds, we may even be able to make current treatments for some disorders even more
effective.

9
Methods
Participants
By contacting former professors from other departments, I was able to obtain a group of
thirty volunteers to participate in this study. A total of nineteen men and eleven women,
ranging in age from eighteen to twenty-four took part in this research.
Materials and Methods
A New Balance “Heart Fit” wrist worn heart rate monitor was used in order to measure
heart rate.16 The survey (see Appendix B) contained both pre- and post-tests and was
administered to track self perceived mood changes, while examining the demographics of the
study population. A laptop with the five chosen musical selections loaded onto an iTunes library
and a set of Apple Earphones were used to play these selections to participants. Microsoft Excel
was used to record results and analyze data onto graphs and tables. Finally, alcohol wipes were
used to sanitize the heart monitor and earphones prior to each participant’s use.
Procedure
Six groups were created from the total research population: one for each musical
selection and one for a baseline reading of heart rate. Participants were asked to wait outside
of the room in which the project was administered so that their heart rates could return to a
resting rate before monitoring. An initial resting heart rate reading was measured by a wrist-
worn pulse monitor for all of the assigned groups. After the preliminary heart rate reading, the
pre-test portion of the self-perceived mood survey was administered. Once participants
16
This heart rate monitor was calibrated to manufacturer’s specifications.
10
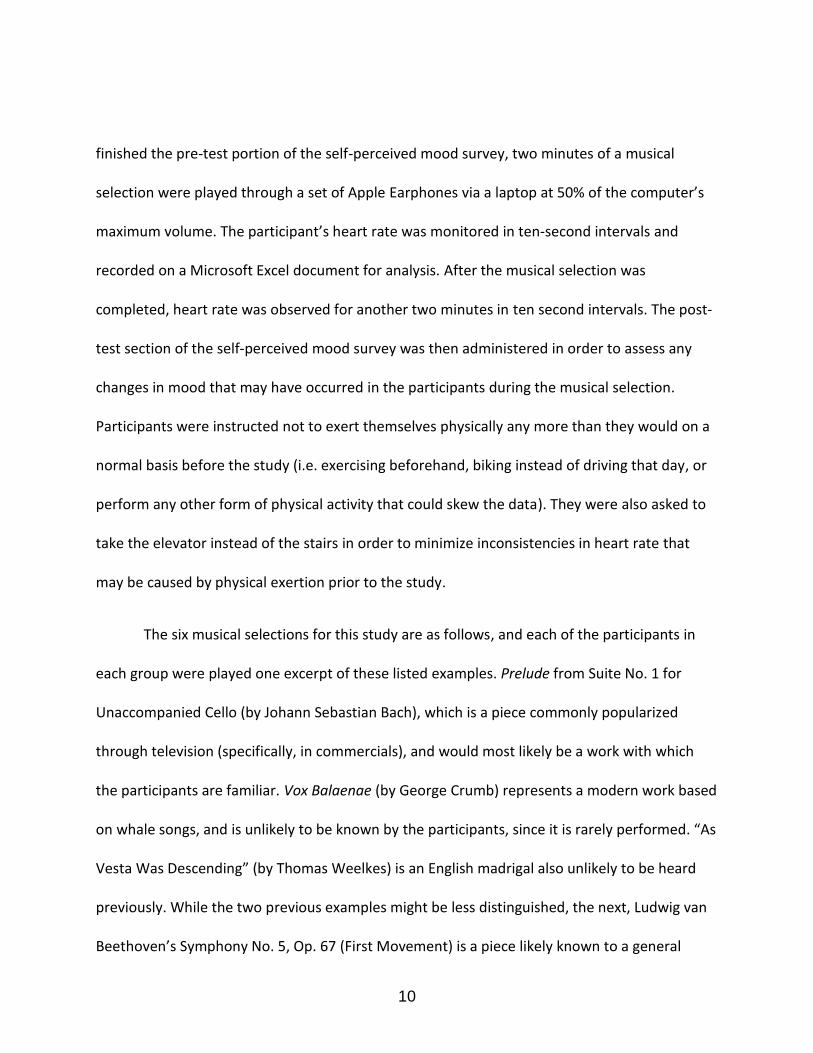
finished the pre-test portion of the self-perceived mood survey, two minutes of a musical
selection were played through a set of Apple Earphones via a laptop at 50% of the computer’s
maximum volume. The participant’s heart rate was monitored in ten-second intervals and
recorded on a Microsoft Excel document for analysis. After the musical selection was
completed, heart rate was observed for another two minutes in ten second intervals. The post-
test section of the self-perceived mood survey was then administered in order to assess any
changes in mood that may have occurred in the participants during the musical selection.
Participants were instructed not to exert themselves physically any more than they would on a
normal basis before the study (i.e. exercising beforehand, biking instead of driving that day, or
perform any other form of physical activity that could skew the data). They were also asked to
take the elevator instead of the stairs in order to minimize inconsistencies in heart rate that
may be caused by physical exertion prior to the study.
The six musical selections for this study are as follows, and each of the participants in
each group were played one excerpt of these listed examples. Prelude from Suite No. 1 for
Unaccompanied Cello (by Johann Sebastian Bach), which is a piece commonly popularized
through television (specifically, in commercials), and would most likely be a work with which
the participants are familiar. Vox Balaenae (by George Crumb) represents a modern work based
on whale songs, and is unlikely to be known by the participants, since it is rarely performed. “As
Vesta Was Descending” (by Thomas Weelkes) is an English madrigal also unlikely to be heard
previously. While the two previous examples might be less distinguished, the next, Ludwig van
Beethoven’s Symphony No. 5, Op. 67 (First Movement) is a piece likely known to a general

11
audience. The final musical selection, Libertango (by Astor Piazzolla) is a tango and is most likely
one that the participants would not have heard before. Additionally, a control group of silence
where no sound whatsoever was played through the headphones, stands as the sixth example.
All of these compositions have been selected ‘seemingly’ at random between pieces
that would perhaps be well known (i.e. Beethoven’s Fifth Symphony), and those that are not as
immediately known to the general population. Furthermore, I have attempted to select works
that cover a variety of genres, compositional periods, and instrumental/vocal combinations.
Each piece was chosen with variance in mind. Works that participants might know were
randomly assigned with those in which they might be unaware to avoid skewing the data. While
it would be difficult to find pieces of music that none of the participants would know, I have
attempted to vary the selections between “known” and “unknown” works in order to remove
as much bias as possible.

12
Results and Discussion
Heart Rate:
After data collection, the information from each of the six groups was plotted on a line
graph (based on time and heart rate) using Microsoft Excel. With the silence group serving as a
control, the other graphs were compared for general trends. The vertical axis is heart rate in
terms of beat per minute. The horizontal axis is time in minutes and seconds (with the P-time
being heart rate after music has stopped). The legend on the right for each line denotes each
participant.17
17
Lapses of data in this graph may occur due to an alteration in the amount of time in which heart rate was monitored. Initially, readings were intended to be a two-minute period. After consultation with a molecular biologist and further research, it was advised that heart rate could be monitored for another two-minute period after the musical selection had ended in order to observe any possible changes.

13
Silence (Control Group)
Figure 1: Silence Heart Rate Graph
P15 P21 P27
0:00 59 73 98
0:10 54 75 93
0:20 60 75 84
0:30 56 70 86
0:40 60 74 95
0:50 58 74 91
1:00 61 76 92
1:10 60 75 91
1:20 66 75 94
1:30 70 77 92
1:40 71 76 89
1:50 57 76 89
2:00 60 78 88
P0:10 72 91
P0:20 77 86
P0:30 72 92
0
20
40
60
80
100
120
0:0
0
0:1
0
0:2
0
0:3
0
0:4
0
0:5
0
1:0
0
1:1
0
1:2
0
1:3
0
1:4
0
1:5
0
2:0
0
P0
:10
P0
:20
P0
:30
P0
:40
P0
:50
P1
:00
P1
:10
P1
:20
P1
:30
P1
:40
P1
:50
P2
:00
P15
P21
P27

14
P0:40 82 95
P0:50 73 95
P1:00 76 93
P1:10 76 93
P1:20 77 95
P1:30 79 90
P1:40 78 92
P1:50 73 86
P2:00 70 93
Figure 2: Silence Data Table
With respect to heart rate, I will now compare the data from each musical selection side
by side with the silence control group. By looking at the heart rate of participants not listening
to a musical selection, we immediately see that heart rate has its own natural curvature and
inflections. Comparing the members in this group, no perceptible pattern seems to emerge.

15
Prelude from Suite No. 1 for Unaccompanied Cello (Johann Sebastian Bach)
Figure 3: Bach Heart Rate Graph
0
20
40
60
80
100
120
0:0
0
0:1
0
0:2
0
0:3
0
0:4
0
0:5
0
1:0
0
1:1
0
1:2
0
1:3
0
1:4
0
1:5
0
2:0
0
P0
:10
P0
:20
P0
:30
P0
:40
P0
:50
P1
:00
P1
:10
P1
:20
P1
:30
P1
:40
P1
:50
P2
:00
P2
P7
P12
P18
P24
P30

16
P2 P7 P12 P18 P24 P30
0:00 92 77 70 97 102 70
0:10 88 76 70 96 83 74
0:20 83 74 69 99 97 69
0:30 89 74 69 98 99 66
0:40 79 71 95 101 74
0:50 90 79 71 100 101 73
1:00 87 79 72 98 98 72
1:10 83 76 65 97 92 69
1:20 83 75 73 96 87 69
1:30 86 81 68 97 93 68
1:40 91 81 75 101 96 71
1:50 84 80 73 99 93 70
2:00 82 71 77 99 89 76
P0:10 106 92 77
P0:20 99 92 70
P0:30 99 93 74
P0:40 101 87 74
P0:50 98 92 72
P1:00 96 91 70
P1:10 98 92 70
P1:20 101 96 64
P1:30 97 100 64
P1:40 96 95 66
P1:50 98 92 69
P2:00 93 96 72
Figure 4: Bach Data Table
With regard to the control group, the first observation we can make between Figure 1
and Figure 3 is that the Bach graph is far more disjunct. A decrease in heart rate seems to
emerge around the 0:30-0:40 interval in Figure 3, while a general increase in heart rate seems
to occur around the 1:40-1:50 interval. After the two-minute musical selection had elapsed, the

17
graph in Figure 3 seems to move in a more conjunct way between the P0:40-P1:00 intervals.18
We might suggest that there are two factors in the Bach selection that could account for the
trend of increased heart rate at 1:40-1:50: a general crescendo (increase in performance
volume) and accelerando (increase in performance speed) that occurs during the span of these
particular time stamps.
Vox Balaenae (George Crumb)
Figure 5: Crumb Heart Rate Graph
18
P in this instance, and in all future instances refers to the heart rate reading after the musical selection has stopped playing.
0
20
40
60
80
100
120
0:0
0
0:1
0
0:2
0
0:3
0
0:4
0
0:5
0
1:0
0
1:1
0
1:2
0
1:3
0
1:4
0
1:5
0
2:0
0
P0
:10
P0
:20
P0
:30
P0
:40
P0
:50
P1
:00
P1
:10
P1
:20
P1
:30
P1
:40
P1
:50
P2
:00
P1
P6
P11
P17
P23
P29

18
P1 P6 P11 P17 P23 P29
0:00 61 86 107 84 55 61 0:10 61 89 90 89 56 66
0:20 60 81 92 86 51 68 0:30 59 80 92 80 50 59 0:40 88 90 80 52 64 0:50 61 88 94 84 51 62 1:00 60 88 94 81 49 63
1:10 58 86 95 82 53 63 1:20 59 92 97 85 53 63 1:30 55 85 98 90 56 66
1:40 63 84 94 76 54 64 1:50 63 83 97 80 52 64 2:00 58 87 98 70 52 65 P0:10 74 52 65
P0:20 75 53 65 P0:30 80 55 62
P0:40 85 56 65 P0:50 79 52 72 P1:00 80 53 65
P1:10 84 55 67 P1:20 83 57 74
P1:30 82 54 71
P1:40 80 54 69
P1:50 82 56 72 P2:00 83 54 70 Figure 6: Crumb Data Table
During Vox Balaenae, a general decrease in heart rate occurred within the first 20
seconds of the work. After the initial heart rate reading, the highest rate for the majority of
participants during the time monitored occurred between 1:20-1:30. This coincides with a flute
melody with cello pizzicato (plucking of strings) accompaniment occurring near the 1:10 mark.
The difference in timbre and texture might have evoked a different emotional response. This
change of musical and emotional affect could be a factor that may have caused a change in the
participants’ physiological response.
19
“As Vesta Was Descending” (Thomas Weelkes)
Figure 7: Weelkes Heart Rate Graph
0
20
40
60
80
100
120
0:0
0
0:1
0
0:2
0
0:3
0
0:4
0
0:5
0
1:0
0
1:1
0
1:2
0
1:3
0
1:4
0
1:5
0
2:0
0
P0
:10
P0
:20
P0
:30
P0
:40
P0
:50
P1
:00
P1
:10
P1
:20
P1
:30
P1
:40
P1
:50
P2
:00
P4
P9
P14
P20
P26
20
P4 P9 P14 P20 P26
0:00 72 81 68 96 78
0:10 80 77 67 94 70
0:20 75 75 67 91 65
0:30 72 76 65 92 66
0:40 72 76 65 95 70
0:50 74 67 92 70
1:00 72 76 68 92 66
1:10 74 75 61 100 69
1:20 76 77 59 96 68
1:30 76 75 69 95 70
1:40 75 73 68 94 73
1:50 75 76 63 92 66
2:00 76 73 61 93 66
P0:10 92 68
P0:20 92 66
P0:30 93 67
P0:40 100 61
P0:50 92 62
P1:00 89 66
P1:10 95 68
P1:20 95 64
P1:30 94 71
P1:40 94 77
P1:50 95 75
P2:00 91 73
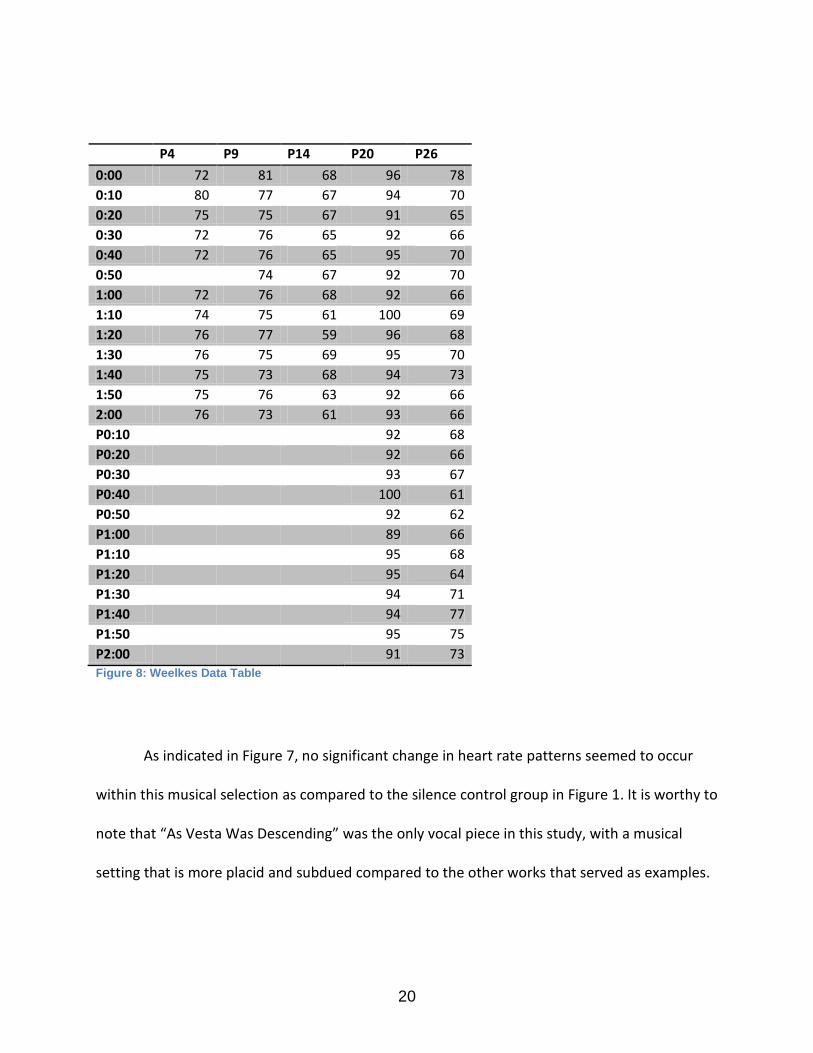
Figure 8: Weelkes Data Table
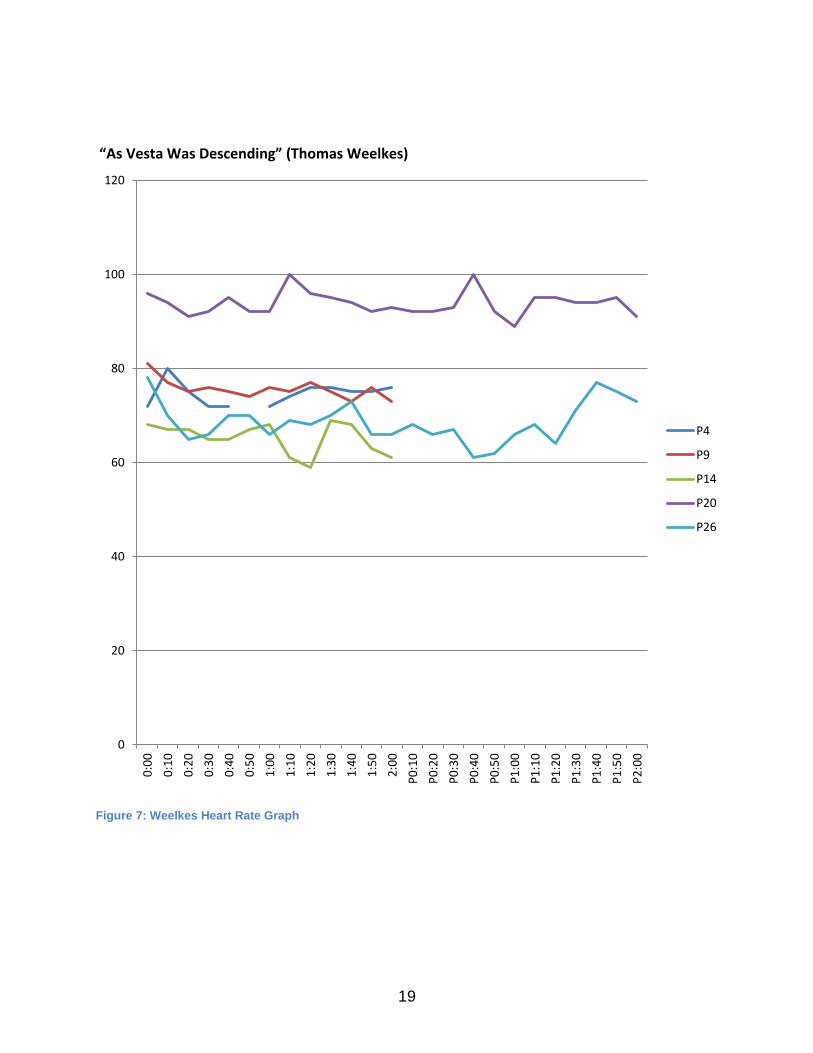
As indicated in Figure 7, no significant change in heart rate patterns seemed to occur
within this musical selection as compared to the silence control group in Figure 1. It is worthy to
note that “As Vesta Was Descending” was the only vocal piece in this study, with a musical
setting that is more placid and subdued compared to the other works that served as examples.
21
The graph in Figure 7 representing changes in heart rates for this piece is highly conjunct and
does not exhibit any leaps exceeding ten beats per minute per ten-second interval.
Symphony No. 5, Op.67 (First Movement) (Ludwig van Beethoven)
Figure 9: Beethoven Heart Rate Graph
0
20
40
60
80
100
120
0:0
0
0:1
0
0:2
0
0:3
0
0:4
0
0:5
0
1:0
0
1:1
0
1:2
0
1:3
0
1:4
0
1:5
0
2:0
0
P0
:10
P0
:20
P0
:30
P0
:40
P0
:50
P1
:00
P1
:10
P1
:20
P1
:30
P1
:40
P1
:50
P2
:00
P5
P10
P16
P22
P28

22
P5 P10 P16 P22 P28
0:00 91 74 80 73 93
0:10 79 70 72 72 90
0:20 87 80 72 74 91
0:30 85 81 72 74 90
0:40 84 76 75 93
0:50 88 63 75 73 96
1:00 82 67 75 75 91
1:10 90 71 73 74 95
1:20 86 73 75 74 95
1:30 83 79 78 86 96
1:40 101 78 76 72 95
1:50 89 80 76 72 93
2:00 95 80 81 75 96
P0:10 73 92
P0:20 72 96
P0:30 73 103
P0:40 74 101
P0:50 75 97
P1:00 73 92
P1:10 76 96
P1:20 74 95
P1:30 71 103
P1:40 72 98
P1:50 74 94
P2:00 71 94
Figure 10: Beethoven Data Table
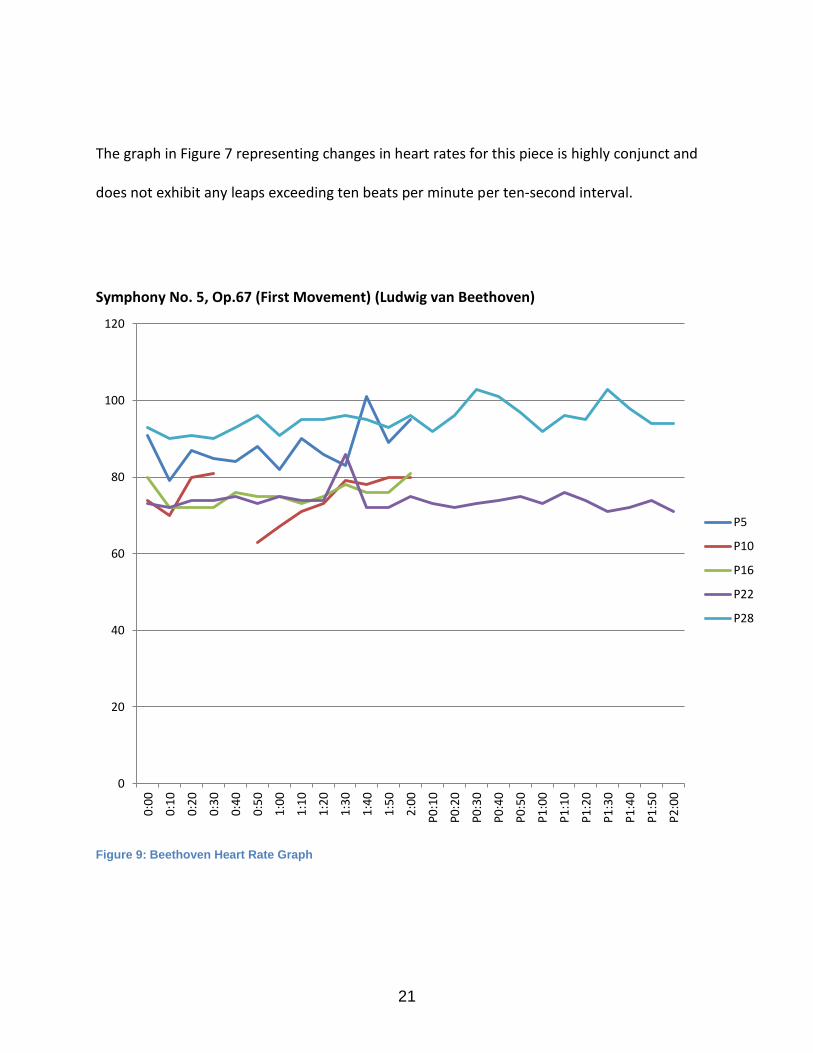
The general trend in participant heart rate for Beethoven’s Fifth Symphony (as noted in
Figure 9) tends to include peaks during the intervals at 0:40-0:50 and 1:30-1:40. During the
former interval at 0:40-0:50 in the recording, the brass enters with a forte accent (in a very loud
and abrupt manner) along with the timpani. This sudden change in musical texture could
account for the increase in heart rate at that interval. From the time period between 1:30-1:40,
a restatement of the original theme (the famous short-short-long motive) occurs. Because this

23
motive was previously stated at the beginning, the anticipation for the recognized material may
have caused the heart rate to rise to a higher level than it had previously peaked. However, we
must also consider that the “blind” nature of both my experimental design and the candidates
who were studied in my research could mean that this anticipatory effect may not account for
each of the participants, since we cannot assume that any of the individuals were previously
aware of this piece.
24
Libertango (Astor Piazzolla)
Figure 11: Piazzolla Heart Rate Graph
0
20
40
60
80
100
120
0:0
0
0:1
0
0:2
0
0:3
0
0:4
0
0:5
0
1:0
0
1:1
0
1:2
0
1:3
0
1:4
0
1:5
0
2:0
0
P0
:10
P0
:20
P0
:30
P0
:40
P0
:50
P1
:00
P1
:10
P1
:20
P1
:30
P1
:40
P1
:50
P2
:00
P3
P13
P19
P25

25
P3 P13 P19 P25
0:00 96 78 88 52
0:10 95 69 78 49
0:20 96 67 78 53
0:30 95 69 79 49
0:40 90 76 42 53
0:50 92 75 82 52
1:00 95 73 80 51
1:10 92 69 79 49
1:20 92 73 75 48
1:30 92 75 78 50
1:40 92 76 76 51
1:50 93 72 77 50
2:00 91 72 80 50
P0:10 79 52
P0:20 74 52
P0:30 83 51
P0:40 82 51
P0:50 85 52
P1:00 80 51
P1:10 79 49
P1:20 79 48
P1:30 81 49
P1:40 81 51
P1:50 77 50
P2:00 80 53
Figure 12: Piazzolla Data Table
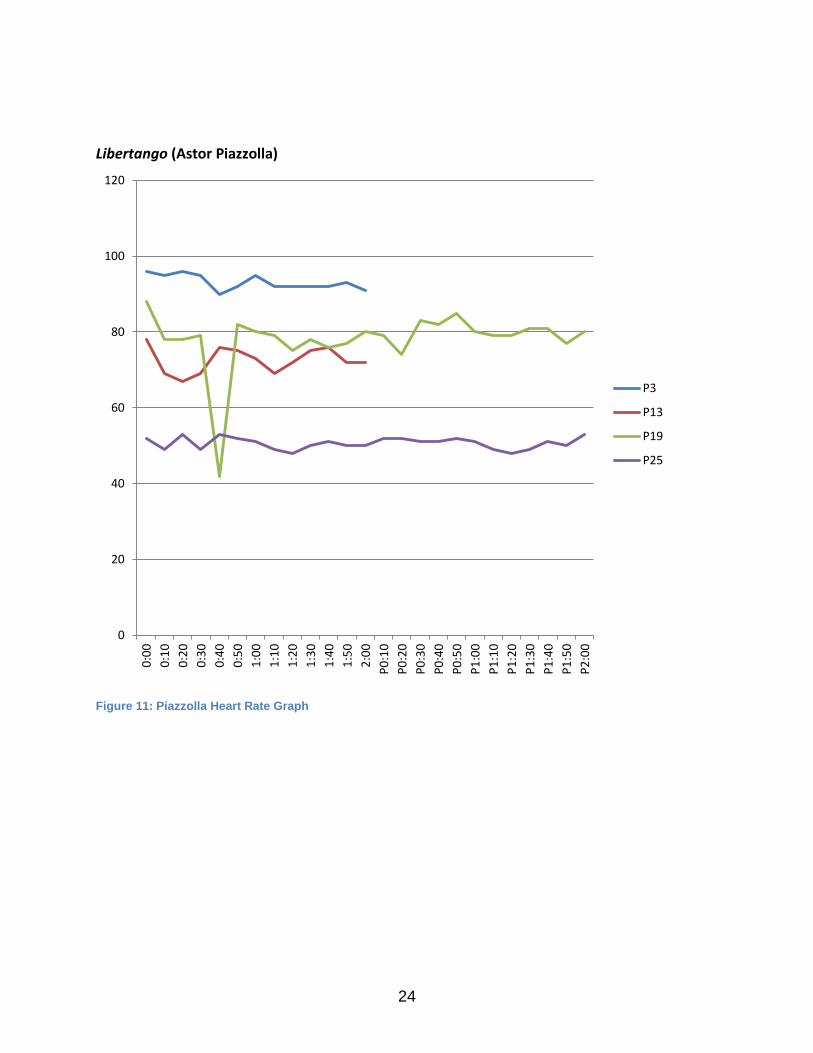
This work produced the least amount of heart rate deviation from the silence control
group (please compare Figures 1 and 11). The graph in Figure 11 was the most conjunct out of
any of the musical examples in this experiment, with the exception of one individual.
Participant 19 experienced a large drop in heart rate from 79 bpm to 42 bpm during the interval
between 0:30-0:40. While 79 bpm is still within the normal range of heart rate, 42 bpm would
be considered below normal (bradycardia). This may be due to a number of factors, including
26
illness, medication (participant 19 was on a birth control prescription called Generess19), or
perhaps another underlying medical condition that may have played into such a dramatic shift
in heart rate. It is also possible that the heart rate monitor may have misread this interval
leading to a variance in the data, although this notion is unlikely since the monitor produced
results that showed no other inconsistencies at any point in the experiment.
Mood:
The following table lists data in the order of participant, their acknowledged mood
before test (on a scale of -3 to 3), their acknowledged mood after test (on a scale of -3 to 3),
whether or not the participant found the music pleasing, gender, age, if the participant was
familiar with the piece, composer, and an adjective that they were asked to include to describe
the work.20
19
According to Access Pharmacy from McGraw-Hill, Side effects of Generess include: arterial thromboembolism, cerebral hemorrhage, cerebral thrombosis, hypertension, mesenteric thrombosis, MI, venous thrombosis (with or without embolism), gallbladder disease, hepatic adenomas, liver tumors (benign), thrombophlebitis, retinal thrombosis, impaired renal function, and pulmonary embolism. Please see http://www.accesspharmacy.com.ezproxy.lib.ucf.edu/drugContent.aspx?mid=6156§ion=5 (accessed 21 March 2012)
20
Because my questionnaire was modified near the end of my trials to examine other variables, some spaces in the Figure 13 have been left blank. Participants also had the option to leave certain responses unanswered.

27
Before After Pleasing Gender Age Familiar Composer Adjective
P1 3 3 F 19 N Crumb Mysterious
P2 1 2 M 18 N Bach Suspenseful
P3 0 1 F 19 N Piazzolla Upbeat
P4 3 3 F 18 N Weelkes
P5 2 2 M 20 Y Beethoven Alarmed
P6 0 1 F 21 N Crumb Disconcerting
P7 0 1 M 19 N Bach Peaceful
P8 2 3 F 18 N Piazzolla Parisian Tango
P9 3 2 M 19 N Weelkes Triumphant
P10 2 3 F 19 Y Beethoven Intense
P11 3 1 M 20 N Crumb Disjunct
P12 0 1 F 24 Y Bach Contrapuntal
P13 2 2 M 21 N Piazzolla Teasing
P14 2 2 M 18 N Weelkes Chilled
P15 -1 -1 M 19 Silence
P16 1 2 F 18 Y Beethoven Exhilarating
P17 1 2 Y F 19 N Crumb Suspicious
P18 1 1 M 18 Bach
P19 2 2 Y F 21 N Piazzolla Upbeat
P20 1 1 Y M 21 N Weelkes
P21 2 2 M 22 Silence
P22 2 2 Y M 21 Y Beethoven Progressing
P23 1 1 N M 21 N Crumb Oriental
P24 -1 3 Y M 21 N Bach Humorous
P25 3 1 Y M 18 Y Piazzolla Flexible
P26 0 2 Y M 18 N Weelkes Relaxed
P27 3 3 Y M 21 Silence
P28 1 2 Y F 22 Y Beethoven
P29 2 2 Y M 18 N Crumb Ritualistic
P30 1 1 Y M 23 Y Bach Exciting Figure 13: Participant Demographics
21
21
As previously mentioned, the experimental design (including self-perceived mood questionnaire) was modified to take into account other variables that may affect the results. Some fields, notably whether a participant found a song pleasing or displeasing, may be left blank, as that question was not posed on the original questionnaire.
28
Out of all thirty participants involved in this study, all but three people experienced
either no change in self-perceived mood, or an increase in self-perceived mood. Of the three
participants who experienced a decrease, all were male, and two out of the three were
unfamiliar with their musical selection. This could have been due to the extent of how much
each participant either cared for or did not care for the piece, how the participants interpreted
the emotional content of the recording in general, or whether they had ever heard their
selection before. Another factor at play could have been the participant’s desire to give the
results they believed I desired in the study questionnaire.
All but one of the participant responses indicated the music as “pleasing.” Participant 23
found the Crumb example displeasing. This work is a contemporary composition based on
whale calls, quite unorthodox in its approach, and does not possess many of the features that
one would “commonly” associate as a musical work. This piece exhibits percussive sounds
produced on the flute and other oddly extended musical effects on the instruments for which it
is scored. It is possible that this example would be more difficult for some to grasp. Participant
6 even used the word “disconcerting” to describe this recording.

29
Conclusions and Future Studies
From the pool of participants, observed changes in heart rate (generally in increase) and
self-perceived mood were noted. While the results of my study can not conclusively prove that
music effects heart rate and mood, the data has shown certain trends that deviate from the
normal pattern of heart rate observed during the silence control group. The majority of
participants’ self-perceived moods remained the same, or increased after the musical selection
as indicated by the pre and post-test questionnaire (Appendix B)
In terms of applications for my study, these results could have meaning in a variety of
ways. In terms of conditions like depression, musical selections may be the first approach a
doctor could use before prescribing pharmaceutical medicines. These results can also be
applied to less severe circumstances as simple as attempting to make one’s mood more
positive. Because the majority of participants experienced either no change or an increase in
self-perceived mood, the risk of lowering one’s mood is highly unlikely. Increases in heart rate
are typically not desired in medical applications, but in terms of exercise and general health,
music can be used as an aid to raise heart rate to a target level. This would be beneficial to
overweight populations attempting to gain the most from their exercise routines, or athletes
attempting to train for events. For populations suffering from heart disease, or coronary
damage from a stroke/heart attack would be able to use this data to avoid certain factors that
may cause an unwanted and dangerous increase in heart rate (possibly triggering another
cardiac event).

30
Future studies based on this research could include examining the musical factors that
contribute to the changes in physiological and psychological responses. Scans of the brain could
further detail what mechanisms are being triggered and when, in terms of changes observed
when listening to each musical example. By examining these characteristics of music that cause
certain physiological reactions in the body, an attempt might be made to compose music to
help remedy a number of medical conditions, including sleep disorders, by easing the patient
into a more relaxed state of mind.
Although my study examines only a narrow range of factors associated with human
response to music, I feel that it can serve as a basis of research for more extended studies. By
examining other factors in addition to the ones in this study, a greater understanding of the
physiological and psychological effects music has on humans can be obtained through practical
applications of music and the response(s) it can elicit. We hopefully will understand the exact
mechanisms in the body that contribute to the process of listening to music and whether or not
our ability to derive pleasure from music has any sort of medical implications for wellness.
Connections between certain musical characteristics and areas in the brain with previously
studied associations can be made, and a greater approach to physiological and psychological
understandings of music hopefully could lead to many other implications for modern medical
practice.

31
Appendix A: HRP-302a Adult Consent Form
32
The Effect of Music on Physiological Responses and Self-Perceived
Mood
Informed Consent
Principal Investigator: R. Joe Gennaro Ph.D. Co-Investigator: Robert-Christian Sanchez Sponsor: UCF Department of Music Investigational Site(s): UCF Department of Music Introduction: Researchers at the University of Central Florida (UCF) study many topics. To do this we need the help of people who agree to take part in research studies. You are being invited to take part in a research study which will include about 100 student and faculty members at UCF. You must be 18 years of age or older to be included in the research study. The person doing this research is R. Joe Gennaro Ph.D. of the UCF Department of Music. A UCF student learning about research is helping to do this study as part of the research team. His name is Robert-Christian Sanchez. What you should know about a research study:
Someone will explain this research study to you.
A research study is something you volunteer for.
Whether or not you take part is up to you.
You should take part in this study only because you want to.
You can choose not to take part in the research study.
You can agree to take part now and later change your mind.
Whatever you decide it will not be held against you.
Feel free to ask all the questions you want before you decide. Purpose of the research study: The purpose of this study is to investigate the physiological
responses and self-perceived mood in correlation to musical selections. By observing this
change, we can gain insight into the beneficial and therapeutic uses of music. This study could

33
potentially be useful in research dealing with cardiac conditions, circulatory problems, and even
depression.
What you will be asked to do in the study: The study will be simple, and non-invasive. Participants will be asked to wear a wrist-worn heart monitor that measures pulse, as well as give an initial survey rating their self-perceived mood. Participants will be randomly sorted into six groups prior to arrival, and will then either be asked to listen to a single musical selection drawn from a group of five musical works of varying styles and tempos, or they will be in a control group with no music, but heart rate will still be monitored for change. After each individual sound clip, participants will also be asked to complete a post-survey rating their self-perceived mood. All subjects will interact with Robert-Christian Sanchez, an undergraduate music major in a time-span of 15 minutes at maximum. These procedures will only be performed once, and will not require any follow-up tests. You do not have to answer every question or complete every task. You will not lose any benefits if you skip questions or tasks. Location: A room at the University of Central Florida Music Building will be rented out for this study.
Time required: We expect that you will be in this research study for 15 minutes
Funding for this study: This research study is unfunded. Risks: We are using headphones connected to a laptop at only 50% of its maximum volume in order to reduce the risk of hearing loss. You may notify the investigator if you would like the music turned up or down. Benefits: There are no expected benefits to you for taking part in this study. Compensation or payment: There is no direct compensation for taking part in this study. Confidentiality: We will limit your personal data collected in this study to people who have a need to review this information. We cannot promise complete secrecy. Study contact for questions about the study or to report a problem: If you have questions, concerns, or complaints, or think the research has hurt you, talk to: Dr. R. Joe Gennaro Ph.D., College of Arts and Humanities, by email at [email protected], or by phone at (407)823-4180.

34
IRB contact about your rights in the study or to report a complaint: Research at the
University of Central Florida involving human participants is carried out under the oversight of
the Institutional Review Board (UCF IRB). This research has been reviewed and approved by the
IRB. For information about the rights of people who take part in research, please contact:
Institutional Review Board, University of Central Florida, Office of Research &
Commercialization, 12201 Research Parkway, Suite 501, Orlando, FL 32826-3246 or by
telephone at (407) 823-2901. You may also talk to them for any of the following:
Your questions, concerns, or complaints are not being answered by the research team.
You cannot reach the research team.
You want to talk to someone besides the research team.
You want to get information or provide input about this research.

35
Appendix B: Participant Survey

36
The Effect of Music on Physiological Responses and Self-Perceived
Mood
Participant Survey
Age: __________________ Gender: __________________
Prior to test:
How do you feel today? (Circle one number)
-3 -2 -1 0 1 2 3
Negative Neutral Positive
Describe your mood in a few words below:
____________________________________________________________________________
____________________________________________________________________________
Are you on any specific medication? If so, please list below:
____________________________________________________________________________
37
____________________________________________________________________________
Have you ever been diagnosed with high blood pressure? (Circle)
Yes / No
Do you have any pre-existing respiratory conditions? If so, please list below:
____________________________________________________________________________
____________________________________________________________________________
Test Instructions:
In a few moments, a musical selection will be played for approximately two minutes. During
those two minutes, think of an adjective which you feel best describes the selection in the
space below.
________________________
After Test:
Have you heard this selection before?
____________________________________________
Do you find this song: (Circle one)
Pleasing / Displeasing

38
Did you have any disturbing events prior to this survey? (Circle one)
Yes / No
How do you feel now? (Circle one number)
-3 -2 -1 0 1 2 3
Negative Neutral Positive
Describe your mood in a few words below:
____________________________________________________________________________
____________________________________________________________________________

39
Appendix C: Approval of Human Research

40

41
Selected Bibliography
Aldridge, D., D. Gustorff, and H.J. Hannich. “Where am I? Music therapy applied to coma
patients.” Journal of the Royal Society of Medicine 83 (1990),
http://www.ncbi.nlm.nih.gov/pmc/articles/PMC1292679/ (accessed November 3,
2011).
Bernardi, L., C Porta, and P Sleight. “Cardiovascular, Cerebrovascular, and Respiratory Changes
Induced by Different Types of Music in Musicians and Non-musicians: The Importance of
Silence.” Heart and Education in Heart. 92 (2006): 445-452.
Ellis, Douglas S., and Gilbert Brighouse. “Effects of Music on Respiration and Heart Rate.” The
American Journal of Psychology. 65 (1952): 39-47
Frederick, Prince, Donna D. Ignatavicius, and M. Linda Workman. Medical-Surgical Nursing:
Critical Thinking for Collaborative Care (Single Volume). Philadelphia: W. B. Saunders
Company, 2002.
Iganawa, M. “Relationship between Heart Rate and Preference for Tempo of Music.” Perceptual
Motor Skills. 81 no. 2 (1995):435-440.
Karageorghis, Costas I., Leighton Jones, and Daniel C. Low. “Relationship between Exercise
Heart Rate and Music Tempo.” Research Quarterly for Exercise and Sport. 77 no. 2
(2006): 240-250.
McCraty, R., B. Barrios-Choplin, M. Atkinson, and D. Tomasino. “The Effects of Different Types
of Music on Mood, Tension, and Mental Clarity.” Alternative Therapies in Health and
Medicine. 4 (1998): 75-84.

42
Montag, C., M. Reuter and N. Axmacher. “How one’s favorite song activates the reward
circuitry of the brain: Personality matters!” Behavioural Brain Research 225 (2011): 511-
514.
Rosse, Cornelius, and Penelope Gaddum-Rosse. Hollinshead’s Textbook of Anatomy: Fifth
Edition. Philadelphia: Lippincott Williams & Wilkins, 1997.
Thompson, William F., E. Glenn Schellenberg, and Gabriela Husain. “Arousal, Mood, and the
Mozart Effect.” Psychological Science. 12 no. 3 (2001): 248-251.
Walworth, Darcy D. “Effect of Live Music Therapy for Patients Undergoing Magnetic Resonance
Imaging.” Journal of Music Therapy 47 (2010): 335-350
Weld, Harry P. “An Experimental Study of Musical Enjoyment.” The American Journal of
Psychology. 23 no. 2 (1912): 245-308.
Zatorre, R. J. (2003), Music and the Brain. Annals of the New York Academy of Sciences, 999: 4–
14. doi: 10.1196/annals.1284.001
Zimny, George H., and Edward W. Weidenfeller. “Effects of Music upon GSR and Heart Rate.”
The American Journal of Psychology. 76 no. 2 (1963): 311-314.