the effect of movement variability on putting proficiency
TRANSCRIPT
The University of San FranciscoUSF Scholarship: a digital repository @ Gleeson Library |Geschke Center
Kinesiology (Formerly Exercise and Sport Science) College of Arts and Sciences
2018
The Effect of Movement Variability on PuttingProficiency During the Golf Putting StrokeAshley K. Richardson
Andrew C.S. Mitchell
Gerwyn HughesUniversity of San Francisco, [email protected]
Follow this and additional works at: https://repository.usfca.edu/ess
Part of the Sports Sciences Commons, and the Sports Studies Commons
This Article is brought to you for free and open access by the College of Arts and Sciences at USF Scholarship: a digital repository @ Gleeson Library |Geschke Center. It has been accepted for inclusion in Kinesiology (Formerly Exercise and Sport Science) by an authorized administrator of USFScholarship: a digital repository @ Gleeson Library | Geschke Center. For more information, please contact [email protected].
Recommended CitationRichardson, Ashley K.; Mitchell, Andrew C.S.; and Hughes, Gerwyn, "The Effect of Movement Variability on Putting ProficiencyDuring the Golf Putting Stroke" (2018). Kinesiology (Formerly Exercise and Sport Science). 43.https://repository.usfca.edu/ess/43

The effect of movement variability on putting proficiency during the golf putting stroke
Ashley K. RichardsonAndrew C. S. MitchellGerwyn Hughes
Richardson, A.K., Mitchell, A.C.S. and Huhes. The effect of movement variability on putting proficiency during the putting stroke, International Journal of Sports Science and Coaching. © the authors 2018. Reprinted by permission of SAGE Publications.DOI: https://doi.org/10.1177/1747954118768234
The effect of movement variability on putting proficiency during the golf putting 1
stroke 2
Ashley K. Richardson1, Andrew C. S. Mitchell2, & Gerwyn Hughes33
1Division of Sport and Exercise Sciences, School of Social and Health Sciences, Abertay 4
University, UK. 2School of Sport Science and Physical Activity, Faculty of Education and 5
Sport, University of Bedfordshire, UK. 3Department of Kinesiology, College of Arts and 6
Sciences, University of San Francisco, USA. 7
KEYWORDS: golf putting, variability, performance, kinematics, dynamical systems, golf 8
coaching 9
10
11
12
13
14
15
16
17
18
19
Abstract 20
Movement variability has been considered important to execute an effective golf swing 21
yet is comparatively unexplored regarding the golf putt. Movement variability could 22
potentially be important considering the small margins of error between a successful and 23
a missed putt. The aim of this study was to assess whether variability of body segment 24
rotations influence putting performance (ball kinematic measures). Eight golfers 25
(handicap range 0 – 10) performed a 3.2 metre level putt wearing retro-reflective markers 26
which were tracked using a three-dimensional motion analysis system sampling at 120 27
Hz. Ball roll kinematics were recorded using Quintic Ball Roll launch monitor. Movement 28
(segment) variability was calculated based on a scalene ellipsoid volume concept and 29
correlated with the coefficient of variation of ball kinematics. Statistical analysis showed 30
no significant relationships between segment variability and putting proficiency. One 31
significant relationship was identified between left forearm variability and horizontal 32
launch angle but this did not result in deficits in putting success. Results show that 33
performance variability in the backswing and downswing is not related to putting 34
proficiency or the majority of ball roll measures. Differing strategies may exist where 35
certain golfers may have more fluid movement patterns thereby effectively utilising 36
variability of movement. Therefore, golf instructors should consider movement variability 37
when coaching the golf putt. 38
39
40
41

Introduction 42
The putting stroke accounted for 41% of all strokes during tournaments on the 43
Professional Golf Association (PGA) Tour in 2014. 1,2 Additionally putting is a key 44
determinate of earnings on the PGA Tour. 3,4 Recently movement variability has been 45
identified as an important biomechanical principle to research. 5–7 Currently to date 46
research of movement variability in the golf putt is scarce with more research needed in 47
the area to establish its effect on performance. 8 Movement variability has been stated as 48
important for successful performance and technique during the golf swing. 5,9 Considering 49
similar performance goals for golf putting movement variability may also be important for 50
this aspect of golf. 51
As outlined in dynamical systems theory, movement patterns arise, mature and develop 52
from synergistic organisation of the neuromuscular system adapting to environmental 53
factors exposed to, morphological factors and task constraints. 10 Different movement 54
patterns will develop between individuals with a unique set of different constraints, 55
allowing for different techniques to achieve the same performance outcome. 11,12 With the 56
golf swing being a complex and high velocity technique the existence of an invariant 57
movement pattern is unlikely. 5 Inter and intra-individual differences may also be apparent 58
for the golf putt, due to the smaller margins of error between a successful or missed shot. 59
13,14 The consensus amongst the literature with the full golf swing in regard to movement 60
variability is to reduce variability at key swing events for successful performance. 9,15,16 61
The authors however consider using a time-continuous data set for the calculation of 62
variability preferable to observing variability at specific points. 7 This is because the golf 63
swing or putting stroke is a continuous skill and doesn’t occur only at discrete points, 64
therefore it is more applicable to observe variability across the full movement. When 65
variability across the golf swing from the start of the movement to impact was considered 66
in the full golf swing, no relationship with an outcome measure (initial velocity of the golf 67
ball) was identified. 5 A limitation of the aforementioned study was ball direction or 68
accuracy was not considered a performance measure. Movement variability will likely 69
affect the swing trajectories and club head angle at impact (affecting shot direction) as 70
well as the speed of movement (affecting the ball flight velocity). Club head angle at 71
impact has previously shown variability for the golf swing and golf putt. 13,14,17 72
During putting it has been established that factors accounting for direction 73
consistency/variability – putter face angle (80 – 83%), the trajectory of the putter path 74
(17%) and horizontal impact point on the putter face (3%). 14,18 In principle if these task 75
criterion factors remain consistent with a low variability the initial launch angle of the golf 76
ball will remain consistent resulting in more putts that are successful. When considering 77
technique it should matter little as to whether a consistent technique with low variability, 78
or coordinated variability of body movement is utilised to achieve this. Therefore, 79
emphasis always being placed on a low variability movement may be incorrect when 80
considered from a dynamical systems approach and different strategies including variable 81
body movement patterns may be integral to successful putting performance. 5,19 82
Movement variability for some may be a key determining factor to the reduction in 83
variance of the task criterion putter face angle at impact and therefore performance. 84
Coaching and golf putting instruction manuals traditionally has focused on encouraging 85
techniques aiming to achieve low variability, where a linear stroke is desired. 18 Scientific 86
literature has however outlined this is biomechanically complicated and difficult with 87
reliance on compensatory muscle activity keeping the putter face square whilst the body 88
rotates. 14 This therefore may not be the best technique for golfers to adopt or coaches to 89
teach. 90
The aim of this study was to assess whether the variability of body segment rotations and 91
putter rotations influence the variance of performance measures (ball roll kinematics: 92
velocity, side spin, initial ball roll, forward rotation, vertical launch angle and horizontal 93
launch angle). It was hypothesised that significant relationships would exist between the 94
variability of body segments and performance measures. 95
Methods 96
Participants 97
A total of 8 right-handed golfers participated in the study (age 34 ± 11 years; handicap 98
6.0 ± 3.4 (handicap range 0 – 10); height 1.80 ± 0.06 metres; mass 83.4 ± 12.2 kg). All 99
golfers were free of musculoskeletal injury for a minimum period of 3 months and played 100
a minimum of once a week. During testing participants wore their own personal golfing 101
attire and suitable dark, tight fitting non-reflective shorts and short sleeved top. All 102
participants provided written informed consent and the study was approved by the 103
institutional ethics committee of University of Hertfordshire. 104
105
Experimental set-up 106
Testing was completed on a Huxley Golf (Huxley Golf., Hampshire, UK) artificial putting 107
green (3.66 x 4.27 metres) registering 11 on the stimpmeter (The United States Golf 108

Association., Far Hills, NJ, USA). A level, straight 3.2 metre putt was setup thus 109
minimising the effect of green reading and aim with a regulation 108 mm hole. 14,20 110
Participants used their own personal putter for the protocol. The rationale for this was the 111
participant would be using a putter they were already habituated to. This ensured the 112
body movement kinematics were a true reflection of their technique, whereas a 113
standardised putter not fitted to each of the participants could negatively influence this. 114
The golf ball for the protocol were Srixon Z-STAR (Srixon Sports Europe LTD., 115
Hampshire, UK) and each trial completed used the same ball. Body movement kinematics 116
were recorded using a ten camera motion analysis system (Motion Analysis Corporation., 117
Santa Rosa, CA, USA) sampling at 120 Hz. 118
Retro-reflective markers were attached to participants in accordance with a modified 119
whole body Helen Hayes marker set (total 31 markers; 14 mm) at the following anatomical 120
locations: top of head, front of head, rear head, acromion process (left and right), lateral 121
epicondyle of humerus (left and right), styloid process of the radius (left and right), on the 122
forearm intersecting the humeral epicondyle and styloid process of the radius (left and 123
right), anterior superior iliac spine (left and right), the sacrum, the thigh (intersecting the 124
plane between the hip and knee markers (left and right)), lateral aspect of the joint centre 125
of the knee (left and right), the shank (intersecting the plane between the knee and ankle 126
markers (left and right)), the lateral malleolus (left and right), the posterior aspect of the 127
calcaneus (left and right) and the third metatarsal (left and right). Markers were placed 128
directly on the skin using double sided tape, except the acromion process (pair of), 129
anterior superior iliac spine (pair of), sacrum, calcaneus (pair of) and third metatarsal (pair 130
of) which were placed on skin tight ‘under-armour’ clothing or shoes ensuring minimal 131

movement of markers relative to underlying body landmarks. Additionally, a marker was 132
placed on the left scapula for asymmetry and medial aspects of the knee (left and right) 133
and medial malleolus (left and right) so the joint centres of the knee and ankle could be 134
calculated. 135
Two retro-reflective markers were placed on the superior aspect of the putter face to 136
calculate putter face angle at impact and throughout the putting stroke. A retro-reflective 137
marker was also placed on the putting line. The capture volume was calibrated according 138
to manufacturer’s guidelines, resulting in an average residual for all cameras of < 0.2 mm. 139
The motion analysis system was calibrated where the positive movement along the X-140
axis was defined as movement towards the target (golf hole); positive movement along 141
the Y-axis was defined as movement anteriorly perpendicular to the target; and the Z-axis 142
perpendicular to the X, Y plane. 143
To record the ball roll kinematics, a Quintic (Quintic Consultancy Ltd., Coventry, UK) high 144
speed camera (UI-5220RE) sampling at 220 Hz was positioned perpendicular to the 145
putting line. The Quintic v2.4 launch monitor software was used to analyse the recorded 146
ball roll. Kinematic variables analysed were initial velocity (m·s-1, calculated across the 147
first 6 recorded frames), side spin (the amount of side spin (rpm) placed on the ball during 148
impact), vertical (whether the ball was launched in the air) and horizontal (the degree to 149
which the ball deviates from the original putting line) launch angle (º), initial ball roll 150
(whether the ball has positive rotation (topspin) or negative rotation (backspin) at the point 151
of impact (rpm)) and forward roll (the distance at which the ball starts positive rotation 152
(cm)). For a trial to be considered valid, the initial ball velocity had to be between 2.10 – 153
2.28 m·s-1. This was to eliminate participants’ preference of either putting to hole the ball 154

successfully at very low or high velocities which could alter movement variability 155
observed. Putts that did not meet the initial ball velocity requirements were eliminated 156
from analysis. Despite this only one putt was eliminated from analysis. 157
158
Procedure 159
Participants were allowed up to ten minutes to habituate themselves to the golf putt, to 160
ensure that the markers did not inhibit or alter their technique. Within the ten minute 161
habituation period, the investigator instructed the participant as to the velocity required 162
for a putt to be categorised successful. Once the participant was comfortable and ready 163
to proceed, they lined up the golf putt and approached the putt. The 3D motion analysis 164
system recorded the trial and the outcome of the putt was recorded (successful or 165
missed). This process was completed until 10 successful putts had been completed with 166
time between each trial for the participant to reline up the putt. All putts (successful and 167
unsuccessful) were included for analysis. 168
169
Data Processing 170
Three-dimensional coordinate data were processed using Cortex (Motion Analysis 171
Corportation; Santa Rosa, CA, USA) software with an Euler sequence of X, Y, Z. The 3D 172
coordinate data were filtered using a fourth-order low pass Butterworth filter, consistent 173
with previously published literature. 16,21,22 Cut off frequency was determined using 174
residual analysis with an r2 threshold of 0.85. 23 Cut off frequencies used for the markers 175
ranged from 6 – 8 Hz. Due to intra and inter subject differences in the duration of trials, 176
3D segmental coordinates and putter rotations were time-normalised to 101 data points 177
using a cubic spline algorithm. The section of the golf putt that was normalised was from 178
the first movement during the putt backswing until the point of impact with the golf ball, 179
the follow-through was not used for analysis. This allowed for accurate means and 180
variation to be calculated. Following this, kinematic data were processed into segments. 181
Performance variability was calculated for all body segments as outlined previously within 182
golf literature. 5 Rotations were normalised to the position at address one frame before 183
the trial started. Following this normalisation process, the standard deviation was 184
calculated for the 101 data points for all the trials of each participant’s X, Y and Z 185
coordinates. These were then combined via multiplication to have a single number 186
represent the 3D rotational variability. 5,24 The equation below was used to calculate a 187
scalene ellipsoid for each participant representing the 3D variability of the rotations for 188
the 101 data points. 5 This was then averaged to give a mean variability volume 189
(degrees3): 190
𝑉𝑉 = ∑
43
101𝑛=1 𝜋(𝑠𝑑𝑥𝑖∙𝑠𝑑𝑦𝑖∙𝑠𝑑𝑧𝑖)
101 191
where VV is the mean variability for each segments rotation, [sdxi, sdyi, sdzi] are the 192
standard deviations for all planes of movement at point i. When interpreting the mean 193
variability score (VV), it was important to consider the range of rotation for each of the 194
segments. Therefore, the mean variability score was standardised to the 3D rotations. 195
The calculation used to calculate the average 3D distance over the trials (degrees) were: 196
PD = (∑ 1
101
𝑖=1
√(𝑥𝑖+1 − 𝑥𝑖)2 + (𝑦𝑖+1 − 𝑦𝑖)2 + (𝑧𝑖+1 − 𝑧𝑖)2) 197
where PD is the performance distance of each segment, [xi, yi, zi] and [xi+1, yi+1, zi+1] are 198
the positions at a point i during the trial and point i+1. This was adapted from previous 199
literature that has calculated movement variability. 5 Performance variability was defined 200
as the mean variability volume divided by the performance distance: 201
PV =VV
PD 202
where PV is termed the performance variability. 5 This provided a volume per distance 203
measure (degrees3/degrees). The only segment that was analysed in a different fashion 204
was the putter segment where only Z rotations were recorded, therefore the standard 205
deviations were totalled and normalised by the Z rotations displacement. 206
207
Data Analysis 208
Segmental rotations (°) (X, Y and Z) were formulated for the pelvis, torso, left and right 209
upper arm and left and right lower arm. These segments were selected as they have 210
previously been analysed and are thought to contribute to the impulse being imparted on 211
the ball during the putt. 18,25,26 Ball kinematic variables measured were: velocity (velocity 212
(m/s) of the ball during the first 6 frames captured), side spin (cut or hook (the amount of 213
side spin (rpm) placed on the ball during impact)), initial ball roll (whether the golf ball had 214
positive rotation (topspin) or negative rotation (backspin) at the point of impact), forward 215
roll (the distance at which the ball is rolling in a positive direction), vertical launch angle 216
(the launch angle at the point of impact on the vertical axis) and the horizontal launch 217
angle (the launch angle at the point of impact on the horizontal axis). Associations 218
between performance variability for body segment rotation and outcome variability (ball 219
kinematic variables) were calculated and outcome variability was tested as a coefficient 220
of variation (%). 5 221
222
Data were exported to the statistical software package SPSS v23 (SPSS Inc, Chicago, 223
USA) for analysis. The data were analysed for normality using a Shapiro-Wilk test of 224
normality and assessment of kurtosis and skewness values. The data were found to be 225
non-parametric and therefore a Spearman’s rank correlation coefficient test was carried 226
out. The boundaries set for the coefficient statistics were; r = 0.8 – 1.0, very strong, r = 227
0.6 – 0.8, strong, r = 0.4 – 0.6, moderate, r = 0.2 – 0.4, weak, r = 0.0 – 0.2, no relationship. 228
Level of significance was set at α < 0.05. 229
Results 230
Individual performance variability for the segment rotations are presented in Figure 1. A 231
range of variability was observed, the largest being 0.74 degrees3/degrees for participant 232
one. Participant eight demonstrated virtually no segment variability suggesting a very 233
consistent movement pattern. 234
235
FIGURE ONE ABOUT HERE 236
237
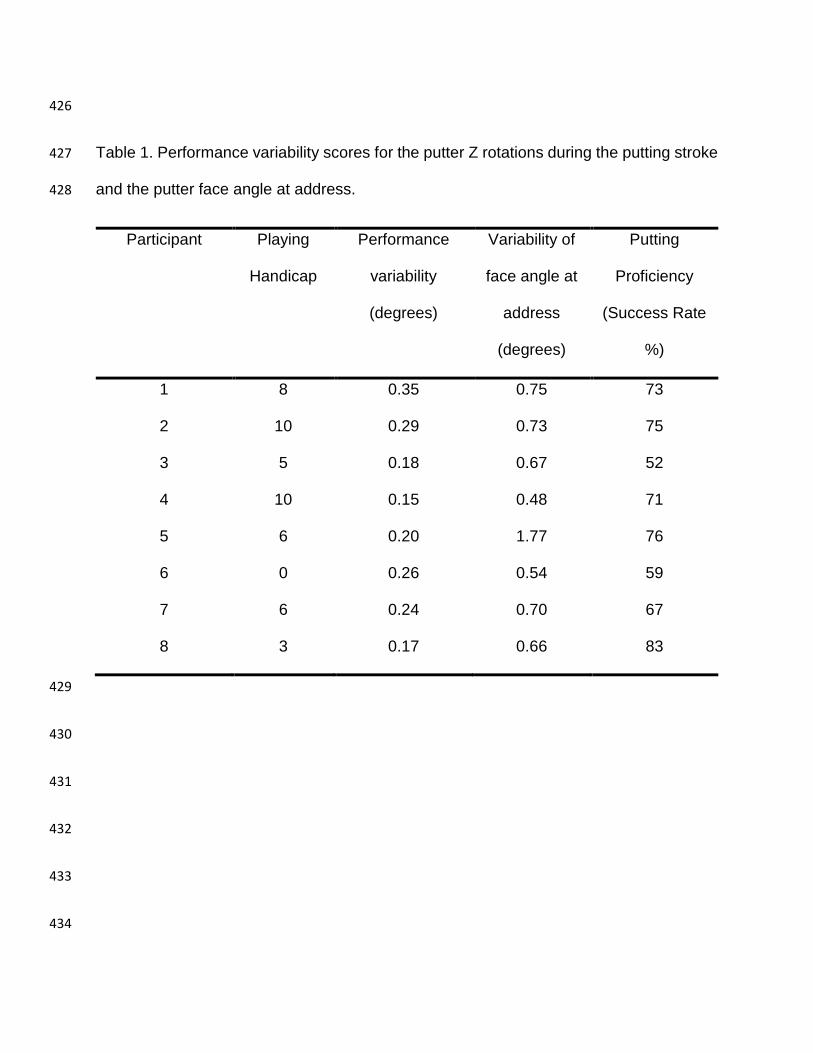
Putter variation, variation of putter face angle at address and putting proficiency are 238
presented in Table 1. Participant eight displayed the best putting proficiency (83%) this 239
was coupled with one of the lower performance variability scores for the putter (0.17 240

degrees3/degrees). A range of correlations were observed between segment variability, 241
putter face angle at address and putting proficiency (putter and putting proficiency; no 242
association, left forearm and putting proficiency; moderate association, right upper arm 243
and putting proficiency; strong association). However, all correlations were identified all 244
to be non-significant (Table 2). 245
246
TABLE 1 & 2 ABOUT HERE 247
248
Mean ball roll kinematic results are presented in Table 3 and correlation coefficients 249
between performance measurement variability (ball roll kinematics) and segment rotation 250
variability in Table 4. One significant correlation was identified between segment 251
variability of the left forearm and variability of the horizontal launch angle of the golf ball 252
(r = .92 (very strong association), p < .01). Additionally, near significant positive 253
relationship was identified for the variability of the pelvis and horizontal launch angle (r = 254
.65 (strong association), p = .08). 255
256
TABLE 3 & 4 ABOUT HERE 257
258
Discussion 259
This is one of the first studies to have considered body segment variability during the golf 260
putting stroke. It was hypothesised that significant relationships would exist between the 261

variability of body segments and variability of performance measures. This hypothesis 262
can predominantly be rejected with no significant relationships identified between 263
segment variability and putting proficiency and only one significant correlation identified 264
between the variability of the horizontal launch angle and variability of the left forearm 265
segment. 266
Within golf to date variability has only been considered for the full golf swing. 5,9,15,16 267
Despite this, the desired outcome for the putt is very similar to the full swing; a shot that 268
is accurate with the correct amount of power applied. Therefore, to obtain this sought 269
after outcome, theoretically, a movement system must be a balance of stable (persistent) 270
and flexible motor outputs, allowing the golfer to adapt to the requirements of the shot. 271
11,15 It was also found no relation between performance variability and ball velocity 272
variability, concluding that individual players use their own strategies to control 273
performance variability so it did not affect outcome variability. 5 The results of the current 274
study suggest this is also evident for the golf putt. With no significant correlations identified 275
between variability of segments and putting proficiency suggest some golfers within the 276
current study utilised or controlled performance variability to minimise output variability. 277
Therefore, less variability isn’t necessarily desirable for all golfers, with some golfers able 278
to still putt successfully despite demonstrating more variability than others. For example 279
participant one showed the second largest variability of the left forearm and largest 280
variability of the pelvis (Figure 1) and had a 73% success rate. Whereas, in comparison 281
participant seven demonstrated less segment variability and had a 67% rate, less than 282
that of participant one and participant three who demonstrated low performance variability 283
and was the worst performing golfer (52%). The most successful golfer (83%) participant 284

eight demonstrated virtually no movement variability, emphasising the individual 285
approaches observed in the current study. 286
It has been reported that a reduction in the variability of the hand trajectory from mid-287
downswing to impact improved performance for the full golf swing. 16 This however 288
contrasting evidence exists with increased variability observed during the downswing 289
phase. 5 Results from the current study (analysed to impact) shows that segment 290
variability of the left forearm increased the variability of the horizontal launch angle with a 291
very strong relationship observed (Table 4). This suggests that players that demonstrate 292
less variability will see better performances, as in the ball starts travel in the intended 293
direction. However, this did not translate to a positive relationship in variability of the left 294
forearm and putting proficiency with a non-significant moderate association observed. A 295
potential explanation for this may be the additional variability observed at address (0.48 296
– 1.77 degrees, Table 1). Previously, the putter face angle has been deemed to be 297
essential regarding the initial direction of the golf putt. 13,14,18 Across the studies a range 298
of 80-95% of the starting direction (horizontal launch angle) of a putt was accredited to 299
putter face angle. 13,14,18 It may be the case variability of the putter face angle may 300
accommodate some variability of the angle at address. Demonstrating that performance 301
variability may not be detrimental to performance, whereby a different combination of 302
rotations result in a square putter face at impact is equally as desirable as minimal 303
variability. Another factor that could have influenced results were the range of initial ball 304
velocity range the participants were instructed to follow. However, no participants 305
mentioned this as an issue or factor they considered when completing the protocol. 306

Previously it has been observed greater movement variability of the pelvis and trunk in 307
less proficient golfers (< 79% success rate) in comparison to more proficient golfers (> 308
79% success rate). 25 The current study’s results are in contrast to this. Golfers in the 309
current study demonstrated a consistent variability of the pelvis (0.01 – 0.74 310
degrees3/degrees) and trunk (0.00 – 0.09 degrees3/degrees). This includes participant 311
one who demonstrated increased variability of the pelvis in comparison to the other 312
participants and was not the worst performing golfer (Figure 1). Additionally, no significant 313
correlations were observed for performance variability of the pelvis (r = -.44; moderate 314
association) and trunk (r = -.38; weak association) with putting success rate (Table 2). 315
Differences between the two studies may be due to the analysis techniques, whereby 316
individual putting events during the stroke were assessed whereas the current study 317
totalled variation for all three planes and normalised the data by the rotational 318
displacement of each segment. It also may be due to the large intra and inter-subject 319
variability observed in both this study and the previous article that differences actually 320
existed between each study. 25 321
It is proposed by the authors of the current study that different styles of putting may be 322
employed by golfers. Whereby some utilise more stable motor outputs (participant eight) 323
whereas others utilise more flexible motor outputs (participant one). More research into 324
movement variability and putting is needed to confirm this however. This study 325
additionally provides support for previous biomechanical literature that it is beneficial for 326
individual based analysis within biomechanical golf analysis. 5,27 Future research needs 327
to test a larger number of highly skilled participants to determine whether different styles 328
of putting exist when considering movement variability. Based on the results of the current 329

study the practical implications of the study are golf coaches should aim to ascertain 330
whether the golfer utilises movement variability or has a consistent movement pattern and 331
refine their current technique. It may not be beneficial to teach a new consistent putting 332
style. 333
Conclusion 334
This is the one of the first studies to have considered movement variability effect on 335
performance measures in the golf putt. It was established that there was no relationship 336
between putting proficiency and performance (segment) variability. One significant 337
relationship was observed between left forearm variability and the horizontal launch angle 338
of the ball but this was not a detriment to performance, this may have been because of 339
the variability of the putter face angle at initial setup. Considering the statistically non-340
significant results it is postulated that different styles of golf putting may exist; one 341
whereby more stable motor outputs are utilised and secondly where more flexible motor 342
outputs are adopted. We emphasise the need to include individual based analysis in 343
future biomechanical golf studies. Golf coaches should aim to determine whether 344
movement variability is being utilised where output variability is not affected resulting in 345
equally effective performance as a golfer who demonstrates a highly consistent 346
movement pattern. 347
348
Acknowledgements 349
The authors would like to thank the University of Hertfordshire for providing facilities and 350
ethical approval to complete this research. 351

References 352
1. PGA Tour. 2014 PGA TOUR scoring average 353 (actual)http://www.pgatour.com/stats/stat.120.2014.html (2015, accessed 28 June 354 2015). 355
2. PGA Tour. 2014 PGA TOUR putts per 356 roundhttp://www.pgatour.com/stats/stat.119.html (2015, accessed 28 June 2015). 357
3. Alexander DL, Kern W. Drive for show and putt for dough? An analysis of the 358 earnings of PGA tour golfers. J Sports Econom 2005; 6: 46–60. 359
4. Dorsel TN, Rotunda RJ. Low scores top 10 finishes, and big money: An analysis 360 of Professional Golf Association Tour statistics and how these relate to overall 361 performance. Percept Mot Skills 2001; 92: 575–585. 362
5. Tucker CB, Anderson R, Kenny IC. Is outcome related to movement variability in 363 golf? Sport Biomech 2013; 12: 343–354. 364
6. Farrally MR, Cochran AJ, Crews DJ, et al. Golf science research at the beginning 365 of the twenty-first century. J Sports Sci 2003; 21: 753–765. 366
7. Glazier P. Movement Variability in the Golf Swing. Res Q Exerc Sport 2011; 82: 367
157–161. 368
8. Gryc T, Stastny P, Zahálka F, et al. Performance and Kinematic Differences in 369 Putting between Healthy and Disabled Elite Golfers. J Hum Kinet 2017; 60: 233–370
241. 371
9. Bradshaw EJ, Keogh JWL, Hume P a, et al. The effect of biological movement 372 variability on the performance of the golf swing in high- and low-handicapped 373 players. Res Q Exerc Sport 2009; 80: 185–196. 374
10. Kurz, M. J., & Stergiou N. Applied dynamical systems theory for the analysis of 375 movement. In: Stergiou N (ed) Innovative analyses of human movement. 376
Champaign, IL: Human Kinetics, 2004, pp. 98–119. 377
11. Davids K, Glazier P, Araújo D, et al. Movement systems as dynamical systems: 378 The functional role of variability and its implications for sports medicine. Sports 379 Medicine 2003; 33: 245–260. 380
12. Bradshaw EJ, Maulder PS, Keogh JWL. Biological movement variability during 381 the sprint start: performance enhancement or hindrance? Sports Biomech 2007; 382
6: 246–260. 383
13. Hurrion., & MacKay J. A Rolling Brief. Golf International, 2012, pp. 107–111. 384

14. Karlsen J, Smith G, Nilsson J. The stroke has only a minor influence on direction 385 consistency in golf putting among elite players. J Sports Sci 2008; 26: 243–250. 386
15. Langdown BL, Bridge M, Li F-X. Movement variability in the golf swing. Sport 387 Biomech 2012; 11: 273–287. 388
16. Horan SA, Evans K, Kavanagh JJ. Movement variability in the golf swing of male 389 and female skilled golfers. Med Sci Sports Exerc 2011; 43: 1474–1483. 390
17. Healy A, Moran KA, Dickson J, et al. Analysis of the 5 iron golf swing when hitting 391 for maximum distance. J Sports Sci 2011; 29: 1079–1088. 392
18. Pelz DT. Dave Pelz’s Putting Bible. New York: Random House, 2000. 393
19. Knight CA. Neuromotor issues in the learning and control of golf skill. Res Q 394 Exerc Sport 2004; 75: 9–15. 395
20. The R&A. Rules Of Golf 396 Definitionshttps://www.randa.org/RulesEquipment/Rules/Rules-Of-Golf-397 Definitions/#hole (2018, accessed 16 February 2018). 398
21. Coleman SGS, Rankin AJ. A three-dimensional examination of the planar nature 399 of the golf swing. J Sports Sci 2005; 23: 227–234. 400
22. Wheat JS, Vernon T, Milner CE. The measurement of upper body alignment 401 during the golf drive. J Sports Sci 2007; 25: 749–55. 402
23. Giakas G, Baltzopoulos V, Bartlett RM. Improved extrapolation techniques in 403 recursive digital filtering: A comparison of least squares and prediction. J Biomech 404
1997; 31: 87–91. 405
24. Lin WH, Liu YF, Hsieh CCC, et al. Ankle eversion to inversion strength ratio and 406 static balance control in the dominant and non-dominant limbs of young adults. J 407
Sci Med Sport 2009; 12: 42–49. 408
25. Delphinus EM, Sayers MGL. Putting proficiency: contributions of the pelvis and 409 trunk. Sport Biomech 2012; 11: 212–22. 410
26. McLaughlin P, Best R. Taxonomy of golf putting: do different golf putting 411 techniques exist? J Sports Sci 2013; 31: 1038–44. 412
27. Ball K, Best R. Centre of pressure patterns in the golf swing: individual-based 413 analysis. Sport Biomech 2012; 11: 175–189. 414
415

416
Figure 1. Scatterplot of performance variability scores for the segment rotations during 417
the putting stroke 418
419
420
421
422
423
424
425
426
Table 1. Performance variability scores for the putter Z rotations during the putting stroke 427
and the putter face angle at address. 428
Participant Playing
Handicap
Performance
variability
(degrees)
Variability of
face angle at
address
(degrees)
Putting
Proficiency
(Success Rate
%)
1 8 0.35 0.75 73
2 10 0.29 0.73 75
3 5 0.18 0.67 52
4 10 0.15 0.48 71
5 6 0.20 1.77 76
6 0 0.26 0.54 59
7 6 0.24 0.70 67
8 3 0.17 0.66 83
429
430
431
432
433
434

Table 2. Correlation coefficients (r (p)) between putting proficiency and segment rotation 435
variability. 436
Segment Variability
Left
Forearm
Right
Forearm
Left
Upper
Arm
Right
Upper
Arm
Pelvis Trunk Putter
Putter
Face
Angle
Putting
Proficiency
-.56
(.15)
.02
(.97)
-.27
(.52)
-.61
(.11)
-.44
(.28)
-.38
(.35)
.03
(.94)
.30
(.46)
437

Table 3. Ball roll kinematic variables for all participants (mean ± SD). 438
Participant Velocity (m·s-1) Spin (Cut (+),
Hook (-), rpm)
Initial Ball Roll
(rpm)
Forward
Rotation (cm)
Vertical
Launch Angle
(°)
Horizontal
Launch Angle (°)
Average 2.22 ± 0.09 1 ± 18 18 ± 39 3.0 ± 3.3 4.0 ± 2.1 1.0 ± 1.4
1 2.28 ± 0.09 19 ± 17 65 ± 14 0.0 ± 0.1 2.0 ± 1.1 1.9 ± 1.7
2 2.11 ± 0.09 -20 ± 11 10 ± 17 1.9 ± 2.3 4.3 ± 0.6 0.2 ± 0.7
3 2.08 ± 0.11 34 ± 10 38 ± 12 0.1 ± 0.2 3.1 ± 0.6 -1.3 ± 0.9
4 2.20 ± 0.15 -5 ± 11 -17 ± 14 5.2 ± 2.5 7.1 ± 3.0 2.9 ± 1.0
5 2.33 ± 0.13 4 ± 18 75 ± 17 0.0 ± 0.1 0.8 ± 0.5 0.6 ± 1.1
6 2.22 ± 0.08 -13 ± 8 -31 ± 10 9.0 ± 1.8 5.6 ± 0.8 1.4 ± 1.2
7 2.27 ± 0.16 -6 ± 17 16 ± 11 2.2 ± 2.8 3.5 ± 0.7 0.1 ± 1.1
8 2.26 ± 0.07 -4 ± 11 -16 ± 11 5.4 ± 4.5 5.5 ± 0.9 2.3 ± 1.2
Key: Cut Spin refers to clockwise rotation and Hook Spin anti-clockwise rotation; a positive Vertical Launch Angle refers the 439
the trajectory of the ball in the Z axis; a negative Horizontal Launch Angle refers to the trajectory of the ball moving left of 440

the intended target line and a positive Horizontal Launch Angle refers to the trajectory of the ball moving right of the intended 441
target line. 442
Table 4. Correlation coefficients (r (p)) between performance measures variability and segment rotation variability. 443
Left Forearm Right
Forearm
Left Upper
Arm
Right Upper
Arm Pelvis Trunk
Putter (Z
rotations)
Velocity .03 (.95) .29 (.48) -.31 (.45) -.13 (.77) -.02 (.95) -.16 (.71) -.38 (.35)
Side Spin -.45 (.26) .69 (.06) -.17 (.70) -.01 (.98) .10 (.82) .01 (.98) .33 (.42)
Initial Ball Roll -.45 (.27) -.04 (.93) -.51 (.20) .01 (.99) -.42 (.31) -.65 (.08) -.16 (.70)
Forward Roll -.54 (.17) .00 (1.0) -.48 (.23) -.05 (.91) -.32 (.44) -.68 (.06) -.20 (.63)
Vertical
Launch Angle .111 (.79) .23 (.58) .23 (.59) -.48 (.22) .07 (.86) .34 (.41) .10 (.82)
Horizontal
Launch Angle .92 (<.01)* -.09 (.83) .11 (.79) .16 (.70) .65 (.08) .42 (.30) -.10 (.98)
(Significant relationship *, p < .05). 444
445
446