the effect of information system quality, perceived
TRANSCRIPT
RPSEP-24
THE EFFECT OF INFORMATION SYSTEM QUALITY, PERCEIVEDUSEFULNESS AND INFORMATION QUALITY TO END USERS’
SATISFACTION OF ACCOUNTING DRY LAB PROGRAM AT OPENUNIVERSITY OF INDONESIA
Irma1, Rini Dwiyani Hadiwidjaja2
1,2 Universitas [email protected], [email protected]
Abstract
In implementing distance education, Universitas Terbuka (UT) utilizes numerous learningmaterials. Utilization of technology into the learning process also becomes a priority inimplementing distance education at UT that can help learners to study independently. One ofthe most important aspects in UT’s Accounting Department is the compliance of practicumsubjects in a distance learning system. This becomes a challenge for Accounting Departmentto carry out the practicum in the distance learning system. Accounting Department of UT hasdeveloped system that delivering accounting course in a distance education to carry out thepracticum. It’s called Accounting Dry Lab Program (ADLP). ADLP is accounting practicewith interactive computer-aided with interesting animation, images, audio and video to deliverthe knowledge from teachers to the students. In addition, ADLP can be accessed via UT’swebsite and facilitate students in understanding the knowledge.The purpose of this study is to evaluate implementation of ADLP by looking at users'perceptions of the system quality and information quality, associated with the perceivedusefulness and the satisfaction of user through Structural Equation Modeling (SEM).Respondents in this study were active college students in UT’s accounting department at theregistration period of 2014. The results of this study show that information system qualitystatistically significant affects the perceived of usefulness and end-user accounting softwaresatisfaction. Information quality statistically significant affects the perceived usefulness andend-user accounting software satisfaction. Perceived usefulness affects the end-useraccounting software satisfaction.
Keywords: accounting dry lab program, end user satisfaction, information system quality,information quality, perceived of usefulness.
1. Introduction
In 2010 UT’s Accounting department launches a practicum program that seeks to
cover the weaknesses experienced by students in the Online Tutorial (Tuton). Tuton has not
been able to satisfy and meet the needs and objectives of practicum. Students should continue
to monitor the initiation of material every week, and should be active in the discussion forum.
brought to you by COREView metadata, citation and similar papers at core.ac.uk
provided by Universitas Terbuka Repository

Besides interaction with tutors or lecturers every week should be exists. If students miss the
learning process within a week, it will not be able to repeat in the next week. In general,
Tuton can achieve cognitive objectives of the course Introduction to Accounting Laboratory,
but it can’t be used to improve student skills in working on accounting cases as in real
business practices.
Though the end goal of accounting practicum is improving students skills to resolve
the case of accounting transactions to the preparation of financial statements in various cases
and industry. This skills will appear on the student's ability to resolve the case of accounting
on the final exams. When students are not skilled, though diligent in following Tuton, surely
will not be able to resolve the case of accounting in the final exam because they’re not
accustomed to practicing accountancy. That's why UT’s Accounting Department makes a
practicum program called Dry Lab for accounting introduction course.
Dry lab is an abbreviation of Dry Laboratorium which is a lab with simulated via
computer and equipped with animation, images, audio, and video that developed to allow
students to carry out practical work with easy, fun and effective and efficient. To assist
students in conducting lab, UT’s Accounting Department provide a theoretical basis or
introductory on accounting concepts before students do the lab working. These concepts being
contained in the Dry Lab Introduction to Accounting module which is expected students will
not have difficulty in understanding the subject.
Dry Lab can be accessed easily via UT’s website, without the constraints of time and
place. In addition through the UT website, under certain circumstances dry lab program can
also be obtained by the student in the form of a compact disc and the practicum results can be
sent to either UT Accounting Department through the Internet (softcopy) or via mail
(hardcopy). The two main requirements to be able to follow the drylab program is: 1). You
have to be registered as a student lab course Introduction to Accounting and 2). having basic
computer skills such as excel programs, word, and simple navigation computer operation.
Dry Lab program has been launched, but until now the evaluation of the quality of
information and quality of information systems that affect the perception of usefulness and
user satisfaction levels itself has not been much done at the Open University. Meanwhile,
according to Janson and Subramanian (1996) and Lucas et al. (1998), stated that the problem
that usually occurs in the use of accounting drylab package is system incompatibility with the
information required by the end user. The discrepancy between the needs of the students
drylab applications as users could pose a significant problem for them. Technical difficulties
which interfere in drylab, interfacing problems in the system, and difficulty in hardware can
make a lower levels of satisfaction.
If students are not satisfied with the drylab program, they will no longer use it. EUCS (End
User Computer Satisfaction) can be used as a signal for the Open University in general and
specially for Accounting Department to overcome these difficulties and mismatches. Seddon
(1997) stated that by overcoming the weaknesses of the better measurement, end-user
satisfaction can be used to measure the gain or success of Dry Lab.
Departed from the reasoning and the empirical facts, this study try to evaluate the
application of drylab program. The evaluation is done by looking at students' perceptions of
the quality of information and quality of existing information systems in the Dry Lab,
associated with the perceived usefulness and the level of student satisfaction over the Dry
Lab through structural equation modeling. The use of this model is important because it is a
powerful way to overcome the problems that arise in information systems research and
understanding of emergence.
If the student does not accept or use the system effectively, the benefit of the Dry Lab
as a learning system based on e-learning can not be realized. It is therefore important to
investigate the factors and critical success drivers of Dry Lab to provide feedback to
designers and teachers to build systems that are useful and accepted by the end user, in this
case the student of UT’s accounting department. Departed from this facts and the
background research, the formulation of the problem in this study are: 1). how the influence
of the quality of the information system and the quality of information on user satisfaction
Dry Lab, 2).how the variables influence perceived usefulness as an intervening variable in
the relationship between the quality of information and quality of information system on
end-user satisfaction of Dry Lab, 3). how the structure and dimensionality, reliability and
validity of the instrument used to measure end-user computing satisfaction (EUCS) made by
Doll and Torkzadeh (1988). This study is also the response of Klenke's research (1992)
which stated the need for cross-validation MIS instruments and to re-examine the instrument
EUCS with new data.
Meanwhile the objective to be achieved in this study are: 1). To investigate the
influence of the quality of the information system and the quality of information on end-user

satisfaction drylab program, 2). To examine the effect of perceived usefulness as an
intervening variable in the relationship between the quality of information systems and
information quality and end user satisfaction drylab introductory accounting, 3). To examine
the structure and dimensionality, reliability and validity of the instrument used to measure
end-user computing satisfaction (EUCS).
Hopefully this study can achieve the benefits to:1). Those researchers and
practitioners of information systems based learning (e-learning) in assessing the quality of
cleaning lab to improve student satisfaction, 2). UT to develop innovations that fit the
students need in the future and improvement of the dry lab quality, 3). UT’s students in order
to create an ideal network-based lab.
Information Systems
According to O'Brien (2006), information system is a combination of people,
hardware, software, communication networks and data resources that collect, transform, and
provide information in an organization. According Mutyarini and Sembiring (2006), the
characteristics of information systems in higher education are as follows:
1. As a supporter of higher education institutions to achieve its objectives.
2. Having a purpose to:
a. Provide the necessary services to the satisfaction of the academic community, reliable
and affordable.
b. Improving the quality of service in accordance with the mission of higher education.
c. Providing accurate information into and out of institutions.
3. Consists of units of information systems that stand alone but in line with the vision and
mission of the institution.
4. Accessed by various academics communities with the needs, roles and different knowledge.
The role of computer-based information systems has expanded significantly over the past few
years. The widespread development of information systems also brings a change in the role of
the information system itself. Any changes have an impact on end users and managers in an
organization. As an example of an information system among others:
1. Academic Information System (AIS)-based Web. The purpose of making the Academic
Information System (AIS) is to support education, so that the college can provide better
information and effective to the community, both within and outside the university through
the Internet. Major features of Academic Information Systems (AIS) web based, among

others: the curriculum of the course, the semester KRS registration, registration KRS short
term, study sheets, profiles of faculty, staff profiles, job descriptions faculty, student
profiles, profiles of alumni, student enrollment new, structurally faculty, databases thesis /
final project, E-learning, academic calendars, announcements, event organizer, online
quizzes, news, articles, and online photo gallery.
2. Library Information System (SIP) Web-based.
SIP Web-based can be used by various groups, both libraries at educational institutions and
public libraries public or private. These applications and services facilitate access to
information and library data, such as makes it easy to book / catalog, system membership,
journal information, course material, borrow and return books and periodic reporting.
Thus, the efficiency will be obtained in the work of the library staff library book
management, presentation of information more easily and interactive, providing better
services to the users of library services. The main features of the library information
system (SIP)-based web include:
a. Catalog / book category, the program can divide the book / paper or other products to be
displayed at the library information system in separate categories, making it easier for
users to find what they need.
b. Detailed information books, complete information on the book / product, will be
displayed screenshots (pictures) of the book (if any), equipped with a library ID, title of
book, name of author, publisher, ISBN, number of pages of the book, the size, the type of
language, source books, stock books available as well as a brief resume of the book /
product.
c. Forms of borrowing, visitors can make a request to borrow this book, where after
selecting the desired book they will be asked to fill out a request form of borrowing.
Previous Research and Hypothesis Development
A. Information System Quality and End-User Satisfaction of information system
Information System Quality and End-User Satisfaction of information system is an inherent
characteristic of the system itself (DeLone and McLean (1992). Defined quality system also
Davis et al., (1989) and Chin and Todd (1995) as perceived ease of use that is how big the
perceived computer technology is relatively easy to understand and use. Perceived usefulness
is defined as the degree to which a person believes that using a particular system can improve
the performance (Davis, 1989). Research Adams et al. (1992), showed a positive relationship
between the usefulness and ease of use. Iqbaria, Guimaraes, and Davis (1995) in their study
using the technology acceptance model (TAM) showed the influence of perceived ease of use
on perceived usefulness. Test results Mao and Palvia (2006), as well as Simon and Paper
(2007), shows the influence of perceived ease of use on perceived usefulness.
Seddon (1997) conducted a study to see the relationship between the perceived
usefulness of information quality. The results of the study Seddon (1997) on the relationship
between these two variables, the results of research supported by Li (1997) and Rai et al.,
(2002). If the user is confident with the quality of drylab accounting system it uses, and feel
that the system is not difficult, then they will believe that the use of such a system would
provide greater benefits and will improve their performance. If the information generated
from the accounting drylab used increasingly accurate, timely, and has good reliability, the
more it will increase the confidence of users of the system. Increased user confidence in
information systems, is expected to further improve their performance.
Based on the above description of this study hypothesized that based on the perception of the
user, the higher the quality of accounting drylab, will further increase the perceived
usefulness. A second hypothesis is built higher quality accounting information produced
Sotware used, will further enhance user perceived usefulness, in terms of its perception.
H1: The quality of information systems a positive effect on Perceived Usefulness.
H2: Information quality positive effect on Perceived Usefulness.
B. The quality of information systems, information quality and user satisfaction of
information system.
Size of user satisfaction in a computer system is reflected by the quality system owned
(Guimaraes et al, 1992; Yoon et al, 1995). User satisfaction of an information system is how
users view information in a real system, not on the quality of the engineering system
(Guimaraes et al, 2003). In the research literature and in practice, user satisfaction is often
used as a surrogate measure of the effectiveness of information system (Melone, 1990). The
results obtained DeLone and McLean (1992), McKiney et al., (2002), Rai et al., (2002), and
Livari (2005) indicates that the quality of the information system has positive influence on the
wearer satisfaction.
The higher the quality of information produced by an information system, will further
enhance user satisfaction (DeLone and McLean, 1992). This opinion is supported by the

results of McKiney et al., (2002), Rai et al., (2002), and Livari (2005). If users believe that the
quality of information systems and quality system information generated from the system
used is good, they will be satisfied using the system.
This study hypothesized the third hypothesis that higher quality accounting
introduction drylab used, will increase user satisfaction according to their perception. For the
fourth hypothesis in this study is the higher quality of information produced by the
introduction of accounting used drylab will increase user satisfaction based on their
perceptions.
H3: The quality of information systems a positive effect on user satisfaction of information
system.
H4: The quality of information has a positive effect on user satisfaction of information
system.
C. Perceived Usefulness and User Satisfaction
DeLone and McLean Information System (1992), states that the impact of the use of
information systems on the performance of the individual to the level of user satisfaction (user
satisfaction) have a reciprocal relationship. While Seddon (1997) in his model hypothesizes
that the impact of the use of information systems in the form of increasing the performance of
the individual, will affect the level of user satisfaction.
Rai et al., (2002) examined the relationship between perceived usefulness to the user
satisfaction using three models of information systems success. All three models are models
of information systems success DeLone and McLean (1992), the model Seddon (1997), and
Model Seddon (1997) modified by adding the relationship between perceived usefulness with
system use. Research results indicate overall perceived usefulness affect user satisfaction.
Livari (2005), conduct research on the success of the new information system is applied to the
users of information systems in an organization which is mandatory. Research results for
perceived usefulness variable relationship with user satisfaction shows the influence of both
variables. If users feel the benefits of the information system of systems that are used, then
they will be satisfied using the system.
Based on the above description of this study hypothesized that the higher the perceived
usefulness, user satisfaction will increase drylab accounting, according to their perception.
H5: Perceived Usefulness has a positive effect on user satisfaction of information system.
Thought and the hypothesis can be stated in the following research framework.

Figure 1. Modified Model of DeLone and McLean (1992) and Seddon (1992, 1997)
Methods and Techniques of Data Collection
This study uses primary data that is obtained directly from the original sources
(Sekaran, 2003). The unit of analysis of this study is all respondents who use drylab
introductory accounting at UT’s Accounting Department. The data was collected through a
questionnaire and sent to the students of UT’s Accounting Department. Before being sent to
the respondents, we conducted a pretest on the questionnaire in advance, to ensure that the
sentences in the questionnaire can be correctly understood by the respondents. After the
pretest, the questionnaire is sent directly to the student via e-mail and online tutorial.
Questionnaires were sent, along with a cover letter containing instructions and explanations
charging research purposes. This sample selection method is purposive sampling and based
on certain criteria (Sekaran, 2003). Criteria for the selection of the sample respondents are
students who register and use drylab program at least since 2011 to 2014. The size of the
sample is determined by the number of respondents who return the questionnaire. The study
period is the period of deployment to the collection of questionnaires from respondents that
during the four months from February2014 until April 2014.
Research Model
This research uses a model form of Structural Equation Model and uses a modified model of
information system success model of DeLone and McLean (1992) and Seddon (1997), by
adding a confirmatory factor analysis (CFA) for latent variables user satisfaction. The
addition of this model is expected to give a better explanation on the validity and reliability of
each instrument in EUCS. The addition of this model is also based on research results
Somers, Nelson, and Karimi (2000).
H1 (+)
H2 (+)
H5 (+)
H3 (+)
H4 (+)
SYSQUA1 SYSQUA10 INDIM1 INDIM6
System
Quality
Information
Quality
User
Satisfaction
Perceived
Usefulnes
INQUA6INQUA1
Content Accuracy
Format
Ease of
Use
Timeliness
USAT1 USAT4
USAT9
USAT10
USAT11
USAT12
USAT5 USAT6
USAT7 USAT8
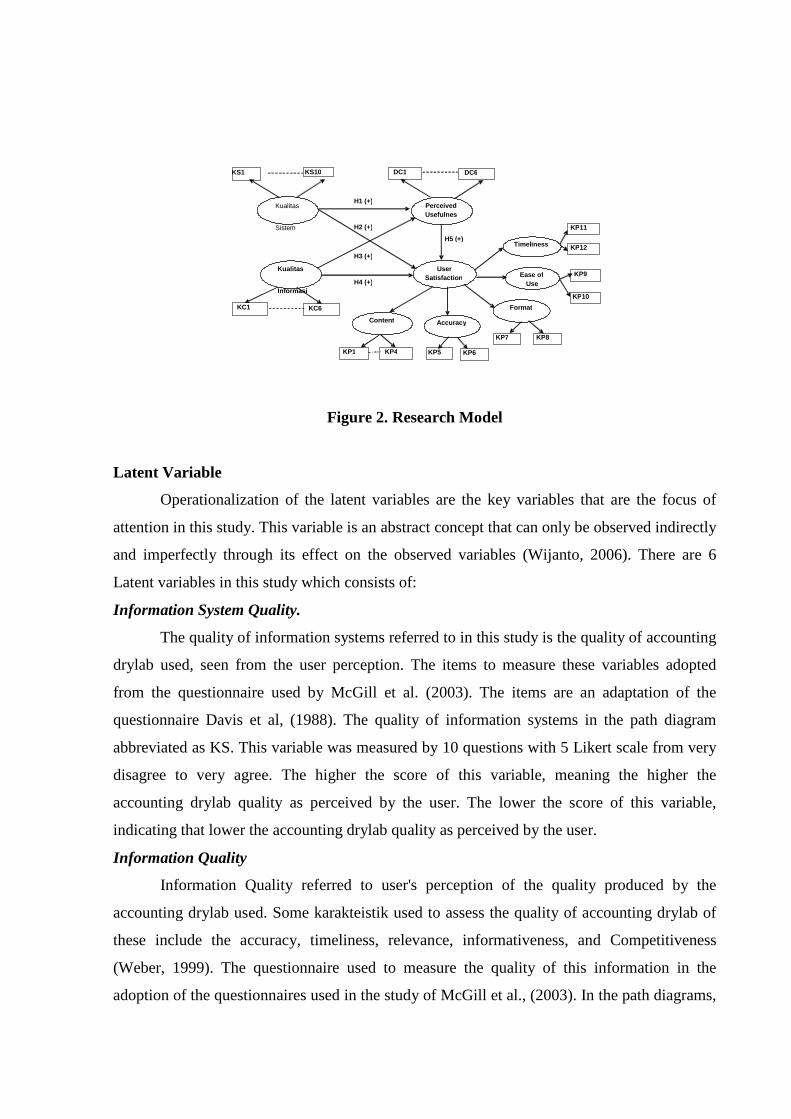
Figure 2. Research Model
Latent Variable
Operationalization of the latent variables are the key variables that are the focus of
attention in this study. This variable is an abstract concept that can only be observed indirectly
and imperfectly through its effect on the observed variables (Wijanto, 2006). There are 6
Latent variables in this study which consists of:
Information System Quality.
The quality of information systems referred to in this study is the quality of accounting
drylab used, seen from the user perception. The items to measure these variables adopted
from the questionnaire used by McGill et al. (2003). The items are an adaptation of the
questionnaire Davis et al, (1988). The quality of information systems in the path diagram
abbreviated as KS. This variable was measured by 10 questions with 5 Likert scale from very
disagree to very agree. The higher the score of this variable, meaning the higher the
accounting drylab quality as perceived by the user. The lower the score of this variable,
indicating that lower the accounting drylab quality as perceived by the user.
Information Quality
Information Quality referred to user's perception of the quality produced by the
accounting drylab used. Some karakteistik used to assess the quality of accounting drylab of
these include the accuracy, timeliness, relevance, informativeness, and Competitiveness
(Weber, 1999). The questionnaire used to measure the quality of this information in the
adoption of the questionnaires used in the study of McGill et al., (2003). In the path diagrams,
H1 (+)
H2 (+)
H5 (+)
H3 (+)
H4 (+)
KS1
1
KS10 DC1 DC6
Kualitas
Sistem
Kualitas
Informasi
User
Satisfaction
Perceived
Usefulnes
KC6KC1
Content Accuracy
Format
Ease of
Use
Timeliness
KP1 KP4
KP9
KP10
KP11
KP12
KP5 KP6
KP7 KP8
quality of the information is abbreviated as KS. This variable was measured with 5 Likert
scale from very disagree to very agree. The higher the score this variable, meaning the quality
of accounting information generated drylab higher perceived by the user. The lower the score
of this variable, indicating that the quality of accounting information produced drylab lower
perceived by the user.
Perceived of Usefulness
In this study, perceived of usefulness variable is the user's perception of the extent to
which the impact of the use of accounting drylab which may be influential in the increase
their performance later. The instrument used to measure these variables are taken from Davis
et al, (1988), with modifications of accounting drylab using. This questionnaire has also been
used in research Sandee (1984) and Goodhue (1995). In the path diagram of this study, the
perceived of usefulness variable abbreviated as DS. This variable was measured by 6
questions in 5 Likert scale from very disagree to very agree. The higher the score this
variable, meaning the impact of the use of accounting drylab in improving user performance
as perceived by the user is getting higher. The lower the score of this variable, indicating that
the impact of the use of accounting drylab user performance as perceived by the user is
getting lower.
User satisfaction
User Satisfaction in the study is the level of user satisfaction of using drylab
accounting and outputs produced by the drylab. Weber (1999) states that there are five
characteristics to assess user satisfaction is the content, accuracy, format, easy of use, and
timeliness. Questionnaire to measure user satisfaction of information system in this study was
adopted from a questionnaire compiled by Doll and Torkzadeh (1988), which has also been
used in studies of Kim and McHaney (2000).
In this study, variable user satisfaction is abbreviated as KP. Indicators for user
satisfactionconsists of 12 question items with a five Likert scale ranging from very disagree to
very agree. The higher the score of this variable, mean user satisfaction over the using of
accounting drylab the higher perceived by the user and vice versa.
Observed variables

Observed variables also called manifest variables or observed variables (Ghazali, 2005).
Unobserved variables are variables that can be observed or measured empirically which is
also often referred to as an indicator (Wijanto, 2006). The observed variable is the effect or
the size of the latent variables. Variable is observed in this study consisted of 34 baseline
variables that constitute the existing question items in the questionnaire.
KS.
For latent variable quality of information systems (KS) consists of ten observed variables.
Observed variables in the path diagram is abbreviated as KS, from KS1 to KS10.
KC
KC was observed variables as indicators of a latent variable quality of information. This
variable consists of six indicators in the path diagram of this study, written as KC1 up with
KC6.
DS
latent variables perceived usefulness had 6 observed variables, and in the path diagram is
written as DS1 up with DS6.
Latent Variable Scores
Special for latent variables user satisfaction of is a confirmatory factor analysis (CFA)
of five components: content, accuracy, format, ease of use and timeliness. Each of these
components in the initial model is a latent variable in the path diagram is written as Content,
Accuracy, Format, Ease and Time. Content have been observed by 4 variable, and written in
the path diagram KP 1 until KP4. Accuracy in this study has been observed by 2 variables
and written in the path diagram as KP 5 to KP6. Format in this study has 2 observed variables,
in the path diagram is written as KP7 to KP8. Ease of use in this study has 2 observed
variables, in the path diagram is written as KP9 until KP10. Time variables has 2 observable
variables, in the path diagram is written as KP11 until KP12. After calculating the scores for
the five latent variable content, accuracy, format, Ease and Time, then the five latent variables
and the observed variables into the research model will be simpler.
TEST ANALYSIS AND RESULTS
250 questionnaires was sent to respondents, but only 165 questionnaires returned. So
the response rate of the questionnaires was 66% of the total questionnaires sent. Of that
amount back, there are 20 questionnaires could not be included in the sample because it does
not meet the criteria for the selection of samples or incomplete filling. The number of samples
that can be obtained final test is included in the 145 questionnaires. The data collection period
is for four months from February 2014 until April 2014.
The number of respondents who are qualified to analyze as many as 145 people. The
total number of manifest variables (indicators) are 34 questions that represent the five
constructs which are system quality, information quality, perceived usefulness, and user
satisfaction. Testing is done by following the steps that apply in the SEM using the method of
maximum likelihood estimation (MLE). There is a two-step testing should be performed (Hair
et al., 1995) that is testing the suitability of the measurement model and structural model fit.
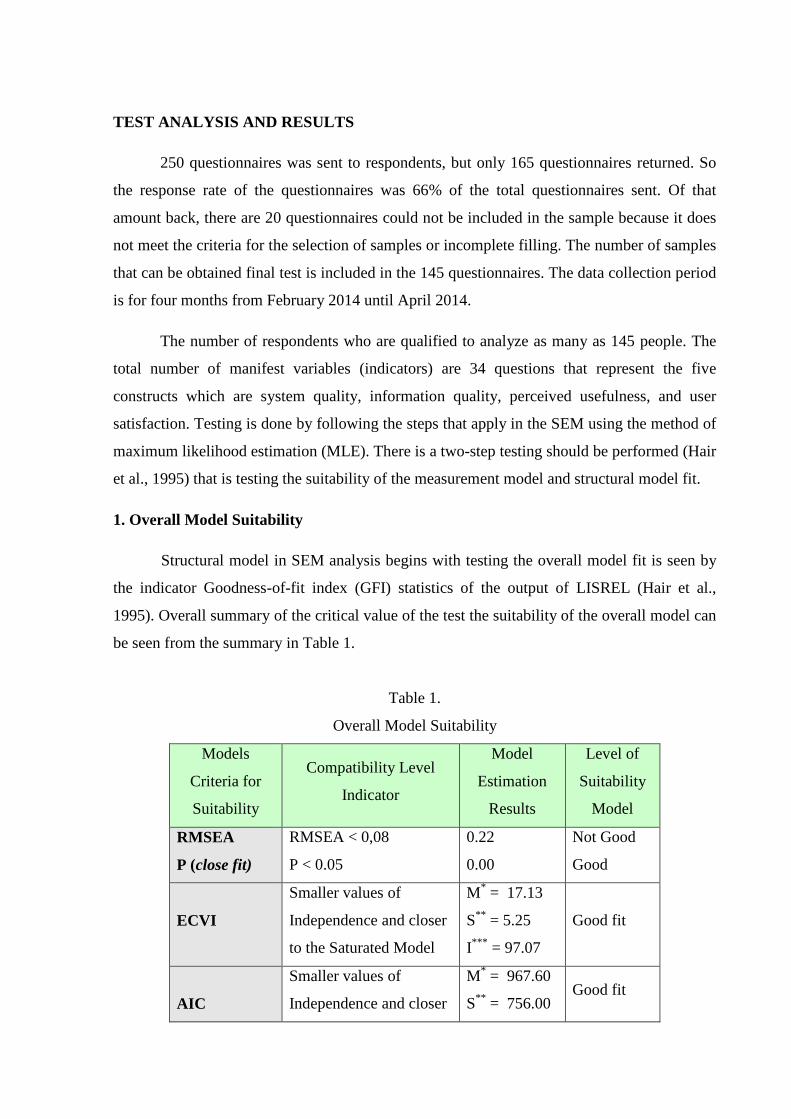
1. Overall Model Suitability
Structural model in SEM analysis begins with testing the overall model fit is seen by
the indicator Goodness-of-fit index (GFI) statistics of the output of LISREL (Hair et al.,
1995). Overall summary of the critical value of the test the suitability of the overall model can
be seen from the summary in Table 1.
Table 1.
Overall Model Suitability
Models
Criteria for
Suitability
Compatibility Level
Indicator
Model
Estimation
Results
Level of
Suitability
Model
RMSEA
P (close fit)
RMSEA < 0,08
P < 0.05
0.22
0.00
Not Good
Good
ECVI
Smaller values of
Independence and closer
to the Saturated Model
M* = 17.13
S** = 5.25
I*** = 97.07
Good fit
AIC
Smaller values of
Independence and closer
M* = 967.60
S** = 756.00Good fit

to the Saturated Model I*** =
13978.41
CAICSmaller values of
Independence and closer
to the Saturated Model
M* =
2806.20
S** =
2259.21
I*** =
14085.78
Good fit
NFI NFI > 0,90 0.95 Good fit
NNFI NNFI > 90 0,96 Good fit
CFI CFI > 0,90 0,97 Good fit
IFI IFI > 0,90 0,97 Good fit
RFI RFI > 0,90 0,94 Good fit
RMRStandardized RMR <
0.050.01 Good
GFI
GFI >0,90, good fit; 0.90
< GFI > 0.80, marginal
fit
0,84 Marginal fit
M* = Model S** = Saturated I*** = Independence
By looking at the overall results of the estimation based on existing criteria, the overall
values obtained are good. So from the results of an analysis of the reliability of the output for
testing the overall model, it can be concluded that the model is a good fit or good.
Validity Test
Tests on the validity of a grain of questions indicated by the value of t and the
standardized loading factor. For values of t must be above a critical value is 1.96 and the
standardized factor loading greater than 0.5 (Iqbaria et al., 1997). Question items that do not
meet the criteria for a valid test can not be included in the next. The load factor for each
indicator on its latent variable is presented in the form of the relationships depicted in the path
diagram obtained by running the LISREL program.
Variable User Satisfaction is a confirmatory analysis measured by two stages. First,
the latent variables measured using observable variables that second order of five dimensions

into the indicator. The second step is to calculate the scores for the five latent variables into
dimensions of user satisfaction variables. This score is used as an indicator of user satisfaction
through a fifth dimension that has become the observed variables. This variable has five
dimensions, namely the content, accuracy, format, ease of use, and timeliness.
Content is measured by 4 (four) of the observed variables KP1 to KP4. Accuracy is
measured with 2 (two) variables observed that KP5 and KP6. Format, is measured by two
observed variables from KP7 to KP8. Ease of use was measured by two observed variables,
namely KP9 and KP10. Timeliness was measured by two observed variables namely KP11
and KP12. From the results of running the program Lisrel for KP twelve variables, all
indicators have the t-value above the critical value of 1.96 and the value of the standardized
factor loading are above 0.5. This means that all indicators are valid, so there is no indicator
that should be discarded. These results are then used to calculate the latent variable scores of
user satisfaction which has five dimensions, namely Content, Accuracy, Format, Ease of use,
and timeliness. The results showed that the entire processing this indicator variable has a
value of standardized loading factor above 0.5. This means that the variable content, accuracy,
format, ease of use, and timeliness meet valid criteria to represent the construct being
measured which is user satisfaction.
For system quality variable, the results indicate that all standardized loading factor
values for KS1 to KS10 are more than 0.5. So, these variables can be used in the next test
because it does represent the construct of system quality. For the indicator variables of the
latent variable information quality, the results showed that no variable has a value of
standardized loading factor below 0.5. This means that all the observed variables of
information quality which is KC1 to KC6 can be used in subsequent testing. Meanwhile for
perceived usefulness variable, the overall value of the standardized loading factor is
significant, because from DS1 to DS6 has t-value above 0.5. So from the six variables was
observed for the latent variables, can be used for further testing because it represents the
construct being measured. Of the total 34 observed variables as indicators for each latent
variable in this study, all variables can be included in subsequent testing. LISREL output
processing results for each latent variable can be seen in the appendix.
Reliability test
Reliability test aims to test the consistency of the grains have a question or statement
in the questionnaire. To test the reliability of the variables, we have to calculate the construct

reliability (CR) and variance extracted (VE) from each of the observed variables (Hair et al.
(1995). If the calculation results of the construct reliability greater than 0.70, and the variance
extracted is greater than 0.50, it can be said that the construct had good reliability (Wijanto,
2008). The figures are used to calculate Reliabilty Construct and Variance Extracted taken
from the output Completely Standardized Solution of the data processing. The summary of
CR and VE calculations for each latent variable, are presented in Table 2.
Table 2.
Construct Reliability and Variance-Extracted Value of Each Latent Variable
Structural Model Suitability
The analysis is performed on the structural equation coefficients by specifying a
certain level of significance. Analysis of the structural model to test the hypotheses proposed
in this study. For a significance level of 0.05, the value t of structural equation must be greater
or equal to 1.96 or greater for practical equal to 2 (Wijanto, 2008). Of the overall hypothesis,
generate 3 equations which means there are three structural models proposed.
Structural Equation Model 1:
H1: System Quality has positive effect on Perceived of Usefulness
H2: Information Quality has positive effect on Perceived of Usefulness
Latent Variabel
CR
value
>=0.70
VE
Value
>= 0.50
Summary
System Quality (KS) 0.956 0.741 Good
Information Quality (KC) 0.962 0.809 Good
Perceived Usefulness
(DS)
0.932 0.700 Good
User Satisfaction (KP) 0.934 0.740 Good
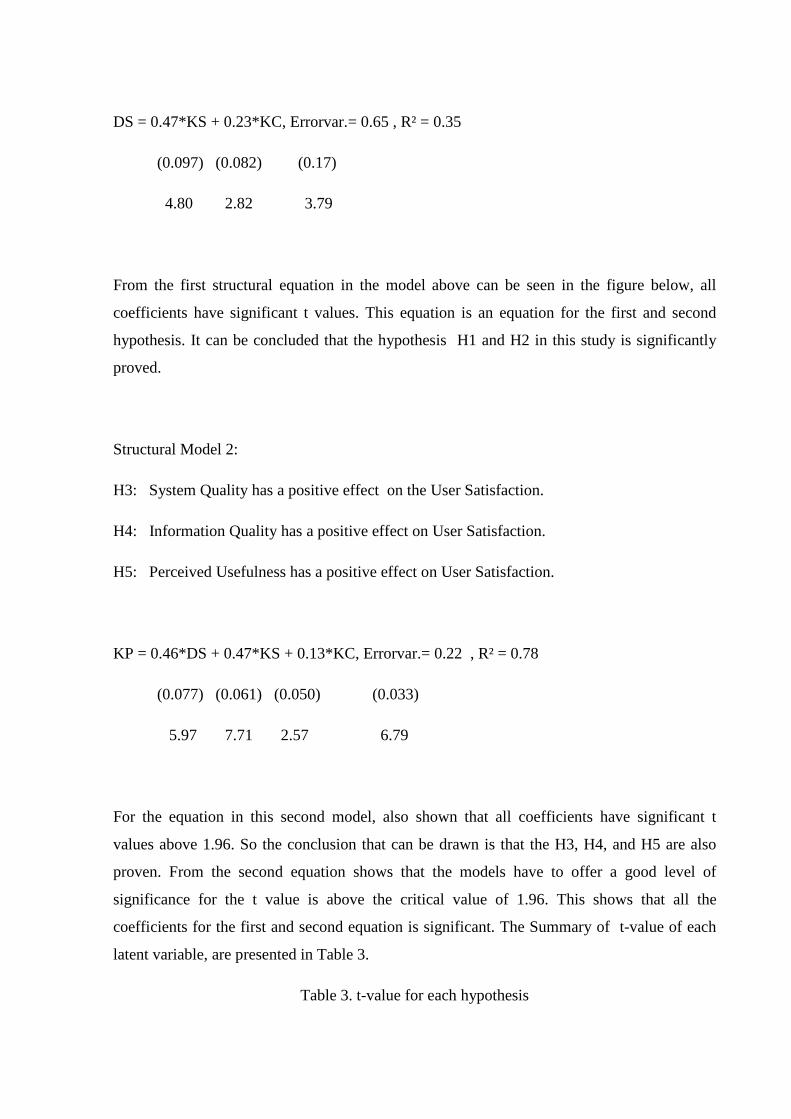
DS = 0.47*KS + 0.23*KC, Errorvar.= 0.65 , R² = 0.35
(0.097) (0.082) (0.17)
4.80 2.82 3.79
From the first structural equation in the model above can be seen in the figure below, all
coefficients have significant t values. This equation is an equation for the first and second
hypothesis. It can be concluded that the hypothesis H1 and H2 in this study is significantly
proved.
Structural Model 2:
H3: System Quality has a positive effect on the User Satisfaction.
H4: Information Quality has a positive effect on User Satisfaction.
H5: Perceived Usefulness has a positive effect on User Satisfaction.
KP = 0.46*DS + 0.47*KS + 0.13*KC, Errorvar.= 0.22 , R² = 0.78
(0.077) (0.061) (0.050) (0.033)
5.97 7.71 2.57 6.79
For the equation in this second model, also shown that all coefficients have significant t
values above 1.96. So the conclusion that can be drawn is that the H3, H4, and H5 are also
proven. From the second equation shows that the models have to offer a good level of
significance for the t value is above the critical value of 1.96. This shows that all the
coefficients for the first and second equation is significant. The Summary of t-value of each
latent variable, are presented in Table 3.
Table 3. t-value for each hypothesis
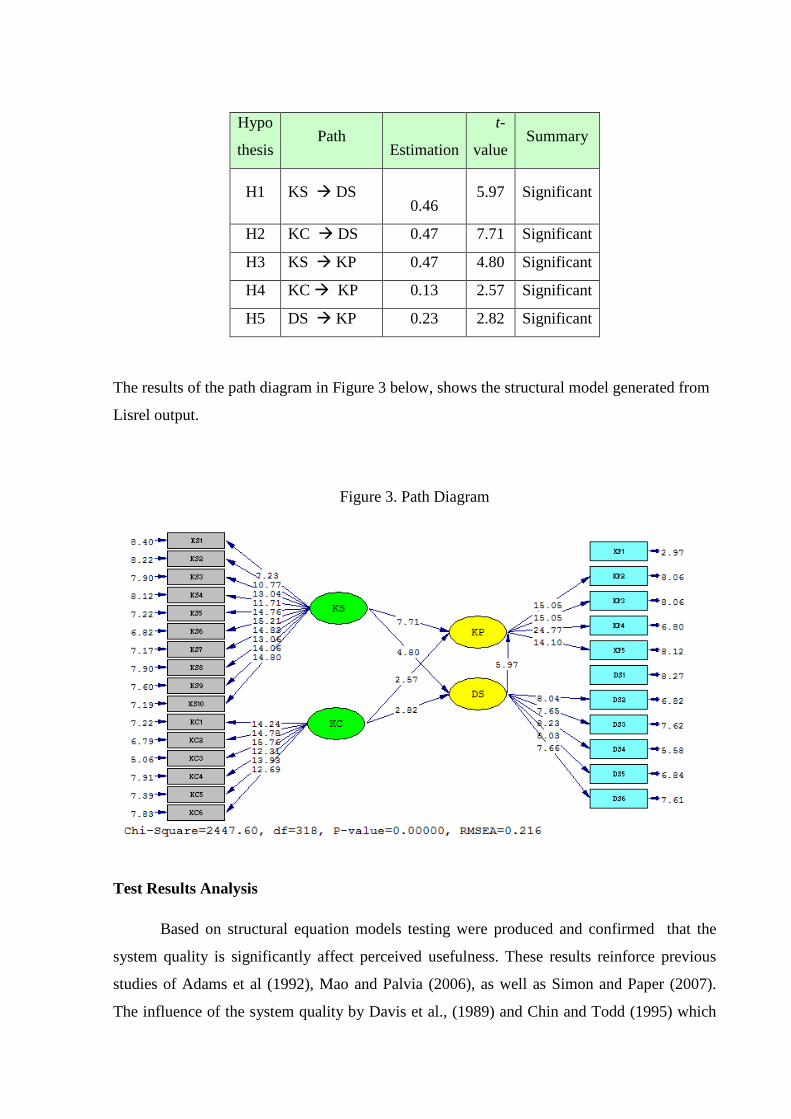
Hypo
thesisPath
Estimation
t-
valueSummary
H1 KS DS0.46
5.97 Significant
H2 KC DS 0.47 7.71 Significant
H3 KS KP 0.47 4.80 Significant
H4 KC KP 0.13 2.57 Significant
H5 DS KP 0.23 2.82 Significant
The results of the path diagram in Figure 3 below, shows the structural model generated from
Lisrel output.
Figure 3. Path Diagram
Test Results Analysis
Based on structural equation models testing were produced and confirmed that the
system quality is significantly affect perceived usefulness. These results reinforce previous
studies of Adams et al (1992), Mao and Palvia (2006), as well as Simon and Paper (2007).
The influence of the system quality by Davis et al., (1989) and Chin and Todd (1995) which
is defined as the ease of use is the perceived usefulness also supports the findings of Rai et al.,
(2002) and Gumaraes et al., (2007) .
The second hypothesis examines the effect of information quality on the perceived
usefulness of positive results also proved significant. These results also support the findings
of Seddon (1997), Li (1997) and Rai et al., (2002). This indicates that the higher the quality of
information produced by the accounting software used, will increase the perceived usefulness
views of user perception.
The third hypothesis regarding the effect of system quality on user satisfaction, the
results proved to be significantly positive. These results are consistent with the results
obtained by DeLone and McLean (1992), McKiney et al., (2002), Rai et al., (2002), and
Livari (2005). It can be concluded that based on the perception of the user, the higher the
quality of accounting software, will further enhance the software user satisfaction.
The fourth hypothesis testing on the effect of information quality on user satisfaction
results proved significant positive. These results support the results of previous studies that
DeLone and McLean (1992), and Livari (2005). With these results we can conclude that the
higher the quality of information produced by the accounting software used, will further
improve user satisfaction, according to their perception.
Test results on the effect of perceived usefulness H5 against user satisfaction also
proved significant, in line with the results of the research DeLone and McLean (1992). These
results also support the model of Seddon (1997), Rai et al., (2002) and also Livari (2005).
This gives the conclusion that the higher the level of perceived usefulness, user satisfaction
will increase accounting software, based on their perception.
This research is motivated by numerous previous studies conducted related to the model of
information system success. The purpose of this study is to see the extent of accounting
software in terms of the perception of the user by implementing information systems success
model of DeLone and McLean (1992) and Seddon (1997) modified by adding a variable
confirmatory factor analysis to the user satisfaction. This model is used to test the primary
data obtained via questionnaires 239 respondents.
This study contributes to the information systems success model of DeLone and
McLean (1992) and Seddon (1997) by adding a variable confirmatory factor analysis to the
user satisfaction. The addition of CFA will help identify the validity and reliability of each
indicator variable into user satisfaction instrument built by Doll and Torkzadeh (1988).
Conclusion
There are five hypotheses developed in this study which is a model of the
relationships that exist in the success of information systems of DeLone and McLean (1992)
and Seddon models (1997), and summarized by Rai et al., (2002). After testing the hypotheses
proposed in this study, it produced some conclusions which are System Quality proved to be
significantly positive effect on perceived usefulness. Information Quality proved to be
significantly positive effect on perceived usefulness. System Quality proved to be
significantly positive effect on user satisfaction.
Information Quality proved to be significantly positive influence on User Satisfaction.
Perceived usefulness proved to be significantly positive effect on User Satisfaction. The
results also lead to the conclusion that all the instruments of research into user satisfaction
indicators has a good validity and reliability.
References:
[1]. Adams, D.A., Nelson, R.R., and Todd, Peter, A., 1992, “Perceived Usefulness, Ease of
Use, and Usage of Information Technology A Replication” MIS Quarterly, June.
[2]. Almutairi, H. & Subramanian, Girish, H., 2005, “An Empirical of the DeLOne and
McLean Model in the Kuwaiti Private Sector”, The Journal of Computer Information System,
Spring, 45,3,pg.113.
Chin, Wynne. W., and Todd, Peter, A., 1995, “On the Use, Usefulness, and Ease of Use A
Structural Equation Modeling in MIS Research: A Note of Caution”, MIS Quarterly, June.
Davis, Fred D., (1989), “Perceived Usefulness, Perceived Ease of Use, and User Acceptance
of Information Technology”, MIS Quarterly, September, pp.319- 340
Davis, Fred D., Bagozzi, Richard P., dan Warshaw, Paul R., (1989), “User Acceptance Of
Computer Technology: A Comparison Two Theoretical Models” Management Science,
August, pp.982-1003
DeLone, W.H., (1988). “Determinants of Success for Computer Usage in Small Business”.
MIS Quarterly/March. Pp. 51-61.
DeLone, W.H., and Ephraim R. Mclean, 1992, “Information System Success: The Quest for
the Dependent Variable”. Information System Research, March, 60-95.
Doll, W.J., and Torkzadeh, G, 1988, “The Measurement of End User Computing
Satisfaction”, MIS Quarterly, 12, (2), 159-174.
Goodhue, D.L., and Thompson, R.L., 1995, “ Task-Technology Fit and Individual
Performance”, MIS Quarterly, 19 (2), 213-236.
Guimaraes, T., M. Igbaria, and M. Lu. 1992. “The determinants of DSS success: An
integrated model.” Decision Sciences 23, no. 2: 409-430.
Guimaraes, T., D. S. Staples, dan J. D. McKeen, 2003. “Empirically Testing Some Main
User-Related Factor for Systems Development Quality”. Quality Management Journal 10,
No. 4: 39- 54.
Hair, J.F. Jr., Anderson, R.E., Tathan, R.L., dan Black, W.C. 1998. “Multivariate Data
Analysis”. Fifth Edition. Prentice-Hall International Inc.
Imam Ghazali. (2005) “Model Persamaan Struktural” Badan Penerbit Universitas
Diponegoro.
Istianingsih and Setyo Hari Wijanto. (2008). Pengaruh Kualitas Sistem Informasi, Perceived
Usefulness, dan kualitas Informasi terhadap Kepuasan Pengguna Akhir Software Akuntansi.
Universitas Indonesia. Unpublish.
Iqbaria, M. and Tan, 1997, ”The Consequences Of Information Technology Acceptance On
Subsequent Individual Performance”
Janson, M. A., and Subramanian, A., 1996, “Packaged software: Selection and
Implementation Policies”.INFOR, 34(2), 133-151.
Kim, Sung & McHaney, Roger, 2000, “Validation of End-User Computing Satisfaction
Instrument in Case Tool Environments”, The Journal of Computer Information System,
vol.41.,Iss. 1: pg.49.
Klenke, K. (1992). Construct Measurement In Management Information System: A Review
And Critique Of User Satisfaction And User Involment Instruments. INFOR, 30(4), 325-348.
Lee, D.M., 1986, “Usage Pattern and Source of persistence for Personal Computer Users”,
MIS Quarterly, 10,4, 313-325.
Li, C. 1997. “ERP packages: What’s next?”,Information System Management, 16(3), 31–35.
Livari,Juhani, 2005, “An Empirical Test of the DeLone and McLean Model of Information
System Success”, Database for Advances in Information Systems, Spring,, 36,2.pg.8.
Mao, En and Prashant Palvia, 2006. ”Testing an Extended Model of IT Acceptance in the
Chinese Cultural Context.” The Database for Advances in Information System 37, Spring
2006.
McHaney, R., and Cronan, T. P., 2001, “ A Comparison of Surrogate Success Measures in
On-Going Representational Decision Support Systems: An Extension to Simulation
Technology”, Journal of End User Computing, 13, 2.
McKiney, V., Yoon, K., and Zahedi, Fatemeh, 2002, “ The Measurement of Web-Customer
Satisfaction: An Expectation and Disconfirmation Approach”, Information System Research,
13,3.
Melone N.P. 1990,”A Theoretical Assessment of The User Satisfaction Construct in
Information System Research”, Management Science. January.
McLeod, R. Jr., and Schell, George, (2001). “Management Information System,”. Eight
Edition, Prentice-Hall, Inc. Upper Saddle River, New Jersey.
McGill, Tanya, Hobbs, Valerie, & Klobas, Jane, 2003, “User-Developed Applications and
Information Systems Success: a Test of DeLone and McLean’s Model”, Information resource
Management Journal; Jan-Mar; 16.1.pg.24.
McHaney, R., and Cronan P.T., 2001,” A Comparison of Surrogate Success Measure in On-
Going Representational DSS: An Extension to Simulation Technology”, Journal of End-user
Computing; Apr-Jun; 13,2.
Rai, A., Lang, S.S. and Welker, R.B., 2002, ”Assessing the Validity of IS Success Models: An
Empirical Test and Theoretical Analysis”, Information System Research, Vol.13, No.1. pp.
29-34.
Sekaran, U., (2003). “Research Methods for Business : A Skill-Building Approach” (Fourth
Edition). John Willey & Sons, Inc.
Seddon.P.B. 1997,”A Respecification and Extension of The DeLone and McLean’s Model of
IS Success”, Information System Research.8.September. 240-250.
Simon, Steven J., and Paper, David, 2007., “ User Acceptance of Voice Recognition
Technology: An Empirical Extension of The Technology Acceptance Model” Journal of
Organizational and End-User Computing, 19(1), 24-50.
Staples, Sandy D. dan Seddon, 2004, “Testing the Technology-To-Performance Chain
Model”, Journal of Organizational and End User Computing, Oct-Dec. pp17- 35
Toni M Somers; Klara Nelson; Jahangir Karimi, 2003. ” Confirmatory Factor Analysis of the
End-User Computing Satisfaction Instrument: Replication within an ERP domain” Decision
Science, 34 (3) 595-621
Webber, Ron, 1999, Information System Control and Audit, First Edition, Upper Saddle
River, New Jersey: Prentice Hall Inc.
Wijanto, Setyo Hari, 2006, “ Structural Equation Model (SEM) dengan Lisrel 8.7”, Catatan
Kuliah, Pascasarjana Ilmu Manajemen, Universitas Indonesia.
Wijanto, Setyo Hari, 2008, “ Structural Equation Model (SEM) dengan Lisrel 8.8,Konsep dan
Tutorial”, Graha Ilmu.
Widjayanto, Nugroho, 2001, “Sistem Informasi Akuntansi”, Penerbit Erlangga.
Yoon, Y., T. Guimaraes, and Q. O’Neal. 1995, “Exploring the factors associated with expert
systems success”, MIS Quarterly 19, no. 1: 83-106.