the effect of gum arabic on the nano / microstructure and
TRANSCRIPT

This work is licensed under a Creative Commons Attribution 4.0 International License.
O R I G I N A L S C I E N T I F I C P A P E R
Croat. Chem. Acta 2017, 90(2), 135–143 Published online: July 3, 2017 DOI: 10.5562/cca3121
The Effect of Gum Arabic on the Nano / Microstructure and Optical Properties of
Precipitated ZnO
Željka Petrović,1 Mira Ristić,1,* Svetozar Musić,1,2 Martin Fabián3 1 Division of Materials Chemistry, Ruđer Bošković Institute, Bijenička cesta 54, HR-10002 Zagreb, Croatia 2 Croatian Academy of Sciences and Arts, Zrinski trg 11, HR-10002 Zagreb, Croatia 3 Institute of Geotechnics, Slovak Academy of Sciences, SK-04001 Košice, Slovakia * Corresponding author’s e-mail address: [email protected]
RECEIVED: March 10, 2017 REVISED: May 8, 2017 ACCEPTED: May 8, 2017
THIS PAPER IS DEDICATED TO PROF. MIRJANA METIKOŠ-HUKOVIĆ ON THE OCCASION OF HER BIRTHDAY
Abstract: The development of the nano/microstructure of ZnO particles precipitated from zinc acetylacetonate showed dependence on the presence of gum arabic. In the absence of gum arabic in near-neutral pH range ZnO rods, some of them hollow, precipitated, whereas in alkaline (NH4OH) medium the multipods (stars) were obtained. A strong effect of gum arabic was noticed both in the near-neutral pH range and in alkaline (NH4OH) medium. In both cases ZnO particles consisted of 1D subunits. The FT-IR spectra of ZnO particles precipitated in the presence of gum arabic showed the IR bands due to the residual content of this biopolymer. Gum arabic formed the corona on ZnO particles and played a key role in the precipitation process from nucleation to the final ZnO product. UV/Vis spectra were also recorded. The PL spectra of ZnO powders dispersed in pure ethanol were very similar. In the presence of ethanol characteristic peaks in the blue emission region were diminishing, thus softening the intrinsic defects responsible for this emission. It was assumed that this effect was due to the covering of oxygen vacancies (VO) at the interface ZnO/C2H5OH with the oxygen atoms present in ethanol. Keywords: ZnO, gum arabic, nano/microstructure, optical properties.
INTRODUCTION INC oxide (ZnO) is a semiconductor characterized by a wide direct band gap of 3.37 eV and a large exciton
binding energy of ~60 meV. In the last 15 years ZnO has received considerable attention of researchers as documented in numerous publications about the synthesis and properties of ZnO particles. The specific properties of ZnO particles (crystallites) strongly depend on their size and nano/microstructure. The size and nano/microstructure of ZnO particles (crystallites) can be tuned by changing the experimental conditions (parameters) of the synthesis route chosen. In this sense chemical conditions such as the type of Zn-salt or alkali, solvent and the presence of different organic ions and molecules play an important role in the formation of ZnO. These organic ions and molecules can be roughly divided into three groups. In the first group
are small synthetic organic ions. For example, a strong effect of citrate complexing agent on the formation of various ZnO nano/microstructures has been noticed.[1–3] The synthetic surface active agents are the second group of organic compounds which also influence the size, geometrical shape or aggregation of ZnO particles.[4–11] In the third group are natural organic compounds, for example biopolymers.[12–17] Spherical ZnO nanoparticles of narrow size distribution were synthesized in the presence of carboxylic curdlan (Cc), a versitale β-1,3-polyglucuronic acid derivative. The obtained Cc-ZnO nanoparticles showed a good ability of binding proteins. [18] Recently, we have noticed a very strong effect of sodium polyanethol sulfonate (SPAS) on the formation and properties of ZnO particles under the hydrothermal treatment of zinc acetylacetonate (Zn(acac)2) in aqueous medium.[19] Two types of hollow ZnO particles were
Z

136 Ž. PETROVIĆ et al.: The Effect of Gum Arabic on Nano / Microstructure …
Croat. Chem. Acta 2017, 90(2), 135–143 DOI: 10.5562/cca3121
obtained and this effect was explained with two different mechanisms of the formation of these ZnO particles. Zn(acac)2 easily undergoes rapid hydrolysis in contact with H2O and this reaction can be utilized to produce ZnO particles.[20] Zn(acac)2 was also used as a starting chemical in different synthesis conditions to produce ZnO nanoparticles.[21–23] In continue of our previous work[19] on the effect of synthetic polymer sodium polyanethol sulfonate, we have investigated the effect of natural biopolymer gum arabic (GA) on the precipitation from zinc acetylacetonate in the aqueous medium. Special focus was given to the monitoring the changes in nano/microstructural and optical properties of ZnO particles precipitated in the presence of gum arabic in relation to reference ZnO particles. Gum arabic is a natural biopolymer from the acacia tree with complex chemical composition containing a high fraction of polysaccharides (~ 97 %; D-galactose, L-arabinose, as well as L-rhamnose and D-glucuronic acid). A smaller amount (< 3 %) of glycoproteins is also present. In addition to that, small or trace amounts of inorganics such as Ca, K, Mg, Ca, Fe, Mn or Zn can be found in gum arabic. The actual presence of organics and inorganics in gum arabic depends on the geographic location of the acacia tree.
EXPERIMENTAL
Preparation of Samples Experimental conditions for the preparation of reference (Z samples) and those prepared in the presence of gum arabic (ZG samples) are given in Table 1. Reference samples Z1 to Z3 were prepared by adding 0.4 g Zn(acac)2∙H2O to H2O, whereas reference samples Z4 to Z6 were prepared by adding the same amount of Zn(acac)2∙H2O to the aqueous solution of NH4OH. Thus formed milky suspension was homogenized in an ultrasonic bath for 15 min, then autoclaved in a preheated oven at 160 °C for 2, 4 or 24h. When the required time elapsed the autoclave was left to cool at room temperature (RT). Then the precipitate was separated from the mother liquor by centrifugation and subsequently washed with H2O and C2H5OH. The isolated precipitates were dried in vacuum at RT. The procedure for the preparation of ZG samples was almost the same, but a proper amount of gum arabic was first added to H2O or the aqueous solution of NH4OH and then ultrasonicated for 5 min before adding Zn(acac)2∙H2O. A teflon-lined non-stirred vessel (autoclave) manufactured by Parr Instrument Company (model 4744) was used. The autoclaving vessel was heated in a DX300 gravity oven (Yamoto) with uniformity ± 1.9 °C at 100 °C or ± 3 °C at 200 °C. A Labogene centrifuge ScanSpeed 2236R was also used.
Characterization of Samples XRD patterns were recorded at 20 °C in the 2θ range from 20 to 70° using an APD 2000 diffractometer manufactured by ItalStructures (GNR-Analytical Instruments Group, Italy). The CuKα wavelength (λ = 0.15406 nm), 40 kV high voltage and 30 mA current were applied. The shape and size of particles were inspected with a thermal field emission scanning electron microscope (FE-SEM, model JSM 7000F, manufactured by Jeol Ltd.). A Fourier transform infrared (FT-IR) spectrometer (model ALPHA) manufactured by Bruker was used. The ultraviolet-visible (UV/Vis) spectra were recorded with a Shimadzu UV/Vis/NIR spectrometer (model UV-3600) connected to an integrating sphere. The photoluminescence (PL) spectra were recorded with PC1 (ISS, USA) spectrofluorometer using a 300W Xe lamp as an excitation source with wavelength λ = 325 nm. Samples were measured in the form of powder or ethanolic dispersion (approximately 2.5 × 10⁻⁵ mol dm–3 of powder was dispersed by ultrasonification in pure ethanol).
RESULTS AND DISCUSSION
XRD The XRD results revealed that all samples prepared (Table 1) were crystalline and can be assigned to the hexagonal ZnO phase (wűrtzite-type crystal structure, space group: P63mc (186), a = 0.3249 nm, c = 0.5206 nm, JCPDS card No. 36-1451). The XRD patterns of selected samples are shown in Figures 1 and 2. A small difference in the relative intensities of diffraction lines (100), (002) and (101) are noticed. Hexagonal ZnO crystals are characterized by specific properties. Two main properties of hexagonal ZnO are (a) tetrahedral coordination of zinc atoms resulting in a noncentral symmetric structure and (b) polar surfaces. The oppositely charged ions produce a positively charged Zn-(0001) plane (top surface) and a negatively charged O-( 0001 ) plane (bottom surface). As a result of these properties the normal dipole moment and spontaneous polarization appear along the c-axis. These specific physical properties of ZnO can be related to the formation of various nano/microstructures. This can be achieved by varying the route and conditions of ZnO synthesis. Changes in ZnO crystallite size of the prepared samples were estimated using the well-known Scherrer formula,
0.9cosΘ
λd =
β (1)
where d is the crystallite diameter, λ is the X-ray
Ž. PETROVIĆ et al.: The Effect of Gum Arabic on Nano / Microstructure … 137
DOI: 10.5562/cca3121 Croat. Chem. Acta 2017, 90(2), 135–143
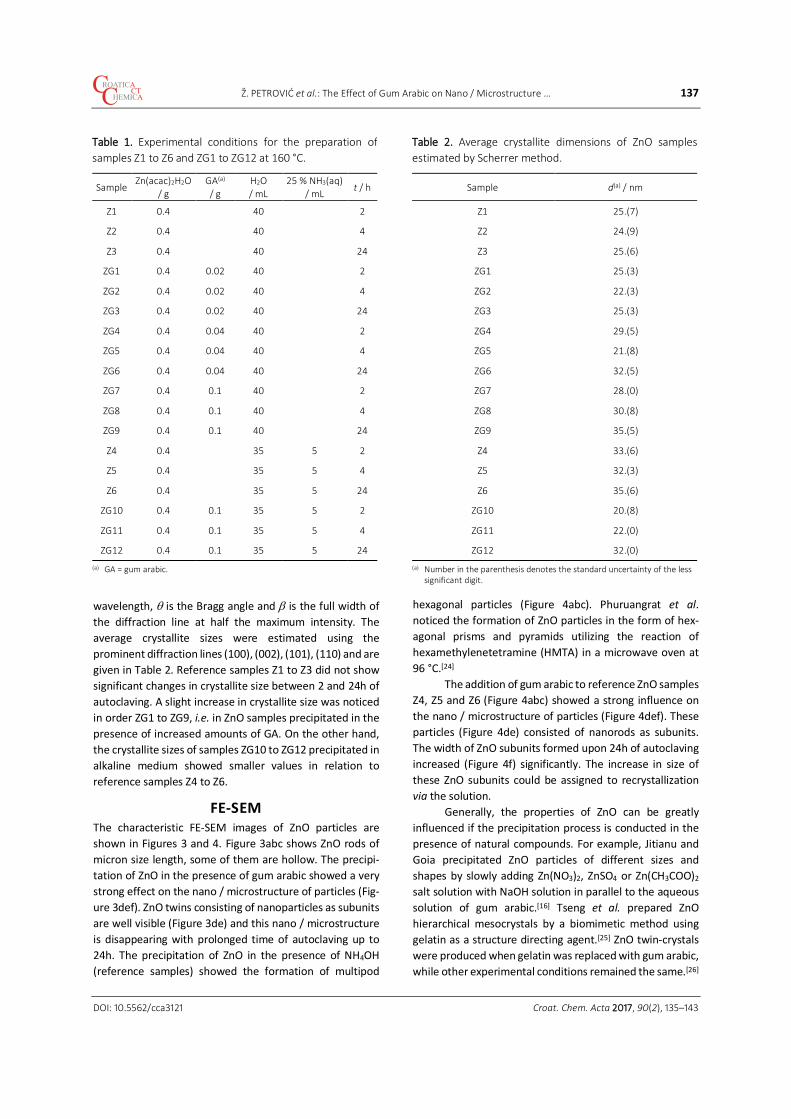
wavelength, θ is the Bragg angle and β is the full width of the diffraction line at half the maximum intensity. The average crystallite sizes were estimated using the prominent diffraction lines (100), (002), (101), (110) and are given in Table 2. Reference samples Z1 to Z3 did not show significant changes in crystallite size between 2 and 24h of autoclaving. A slight increase in crystallite size was noticed in order ZG1 to ZG9, i.e. in ZnO samples precipitated in the presence of increased amounts of GA. On the other hand, the crystallite sizes of samples ZG10 to ZG12 precipitated in alkaline medium showed smaller values in relation to reference samples Z4 to Z6.
FE-SEM The characteristic FE-SEM images of ZnO particles are shown in Figures 3 and 4. Figure 3abc shows ZnO rods of micron size length, some of them are hollow. The precipi-tation of ZnO in the presence of gum arabic showed a very strong effect on the nano / microstructure of particles (Fig-ure 3def). ZnO twins consisting of nanoparticles as subunits are well visible (Figure 3de) and this nano / microstructure is disappearing with prolonged time of autoclaving up to 24h. The precipitation of ZnO in the presence of NH4OH (reference samples) showed the formation of multipod
hexagonal particles (Figure 4abc). Phuruangrat et al. noticed the formation of ZnO particles in the form of hex-agonal prisms and pyramids utilizing the reaction of hexamethylenetetramine (HMTA) in a microwave oven at 96 °C.[24] The addition of gum arabic to reference ZnO samples Z4, Z5 and Z6 (Figure 4abc) showed a strong influence on the nano / microstructure of particles (Figure 4def). These particles (Figure 4de) consisted of nanorods as subunits. The width of ZnO subunits formed upon 24h of autoclaving increased (Figure 4f) significantly. The increase in size of these ZnO subunits could be assigned to recrystallization via the solution. Generally, the properties of ZnO can be greatly influenced if the precipitation process is conducted in the presence of natural compounds. For example, Jitianu and Goia precipitated ZnO particles of different sizes and shapes by slowly adding Zn(NO3)2, ZnSO4 or Zn(CH3COO)2 salt solution with NaOH solution in parallel to the aqueous solution of gum arabic.[16] Tseng et al. prepared ZnO hierarchical mesocrystals by a biomimetic method using gelatin as a structure directing agent.[25] ZnO twin-crystals were produced when gelatin was replaced with gum arabic, while other experimental conditions remained the same.[26]
Table 2. Average crystallite dimensions of ZnO samples estimated by Scherrer method.
Sample d(a) / nm
Z1 25.(7)
Z2 24.(9)
Z3 25.(6)
ZG1 25.(3)
ZG2 22.(3)
ZG3 25.(3)
ZG4 29.(5)
ZG5 21.(8)
ZG6 32.(5)
ZG7 28.(0)
ZG8 30.(8)
ZG9 35.(5)
Z4 33.(6)
Z5 32.(3)
Z6 35.(6)
ZG10 20.(8)
ZG11 22.(0)
ZG12 32.(0) (a) Number in the parenthesis denotes the standard uncertainty of the less
significant digit.
Table 1. Experimental conditions for the preparation of samples Z1 to Z6 and ZG1 to ZG12 at 160 °C.
Sample Zn(acac)2H2O
/ g GA(a) / g
H2O / mL
25 % NH3(aq) / mL t / h
Z1 0.4 40 2
Z2 0.4 40 4
Z3 0.4 40 24
ZG1 0.4 0.02 40 2
ZG2 0.4 0.02 40 4
ZG3 0.4 0.02 40 24
ZG4 0.4 0.04 40 2
ZG5 0.4 0.04 40 4
ZG6 0.4 0.04 40 24
ZG7 0.4 0.1 40 2
ZG8 0.4 0.1 40 4
ZG9 0.4 0.1 40 24
Z4 0.4 35 5 2
Z5 0.4 35 5 4
Z6 0.4 35 5 24
ZG10 0.4 0.1 35 5 2
ZG11 0.4 0.1 35 5 4
ZG12 0.4 0.1 35 5 24 (a) GA = gum arabic.

138 Ž. PETROVIĆ et al.: The Effect of Gum Arabic on Nano / Microstructure …
Croat. Chem. Acta 2017, 90(2), 135–143 DOI: 10.5562/cca3121
Different ZnO microstructures were obtained under hydrothermal conditions at 120 °C for 2h using zinc acetate, triethanolamine or saccharides (glucose, fructose, sucrose, dextran, starch or methylcellulose) as reactants.[12] The nature of saccharides and polysaccharides determined the shape of ZnO particles (rods, spindles and hollow or compact spheres). ZnO nanoparticles were synthesized by alkali precipitation from a Zn(NO3)2 solution containing chitosan.[27]
FT-IR Spectra The FT-IR spectra of selected ZnO samples are shown in Figures 5 and 6. In the spectra of reference samples Z1 to
Z3 the broad IR band at 3442 to 3444 cm–1 is due to adsorbed H2O molecules, whereas the two IR bands at 546 to 547 and 394 cm–1, respectively, can be assigned to ZnO. The IR spectrum of ZnO was discussed in reference literature. For example, Hayashi et al. proposed three distinct absorption peaks located between the bulk TO-phonon frequency (ωTII) and LO-phonon frequency (ωL┴).[28] The peaks shifted towards lower frequencies when the permittivity of the surrounding medium increased. The ZnO lattice vibration modes at 300 K: TO(A1) at 378 cm–1, LO(A1) at 574 cm–1, TO(E1) at 410 cm–1, LO (E1) at 590 cm–1, 2
highE at 438 cm–1 and 2
lowE at 99 cm–1 were reported.[29] The polar modes A1 and E1 are IR and Raman active. Non-polar
Figure 1. Selected XRD patterns of reference samples Z1, Z3 and samples ZG1, ZG3, ZG4, ZG6, ZG7 and ZG9 precipitated in the presence of gum arabic.
Figure 2. Selected XRD patterns of reference samples Z4, Z6 and samples ZG10, ZG12 precipitated in the presence of gum arabic.

Ž. PETROVIĆ et al.: The Effect of Gum Arabic on Nano / Microstructure … 139
DOI: 10.5562/cca3121 Croat. Chem. Acta 2017, 90(2), 135–143
modes E2 are only Raman active. The IR spectrum of ZnO was also investigated by Andrés-Vergés et al.[30,31] These authors showed that the IR spectrum of their ZnO samples could vary from a broad single band over the doublet up to
a three band superposition. The origin of a band at 493 cm–1, which sometimes can appear in the IR spectrum of ZnO, was also discussed.
Figure 3. FE-SEM images of samples (a) Z1, (b) Z2, (c) Z3 and the effect of gum arabic addition (samples (d) ZG7, (e) ZG8, (f) ZG9).
Figure 4. FE-SEM images of reference samples (a) Z4, (b) Z5, (c) Z6 and the effect of gum arabic addition (samples (d) ZG10, (e) ZG11, (f) ZG12).
Figure 5. FT-IR spectra of reference samples Z1, Z2, Z3 and those precipitated in the presence of gum arabic (samples ZG7, ZG8, ZG9).
Figure 6. FT-IR spectra of reference samples Z4, Z5, Z6 and those precipitated in the presence of gum arabic (samples ZG10, ZG11, ZG12; * parasitic line).

140 Ž. PETROVIĆ et al.: The Effect of Gum Arabic on Nano / Microstructure …
Croat. Chem. Acta 2017, 90(2), 135–143 DOI: 10.5562/cca3121
The addition of gum arabic to the precipitation system caused a significant change in the shape of the ZnO spectrum (IR spectra ZG7 to ZG9 in Figure 5). The IR bands at 3437 to 3467 cm–1 and 1636 cm–1 are due to H2O stretching and bending vibrations, respectively. The origin of these IR bands is related with hygroscopic nature of ZnO. A broad single IR band at 426 to 433 cm–1 was noticed, instead of two well-separated IR bands observed for samples Z1 to Z3. A similar effect was obtained for samples Z4 to Z6 versus samples ZG10 to ZG12, as shown in Figure 6. This effect can be mainly assigned to a great difference in the shape and size of ZnO particles (Figures 3 and 4) precipitated in the absence or presence of gum arabic in the precipitation system. The IR spectra of samples ZG7 to ZG9 and ZG10 to ZG12 showed additional IR bands, for example at 673, 891, 1070, 1134, and 1411 in the spectrum ZG7 which can be assigned to gum arabic in line with the FT-IR spectrum of gum arabic (Figure 7) used in our experiments. The characteristic functional groups of gum arabic are carboxylates, hydroxyls and amines. The assignments of IR bands corresponding to gum arabic are discussed in reference literature.[32–36] The functional groups of gum arabic are responsible for the formation of a corona on the particles consisting of more layers of this biopolymer. The mechanism of the corona formation includes the interactions of gum arabic from nucleation to the crystal growth of particles. From FE-SEM images in Figures 3 and 4 it is well visible that the formation of a gum arabic corona strongly suppressed ZnO particle growth. From the FT-IR spectra of ZnO samples ZG7 to ZG9 and ZG10 to ZG12 it is visible that the relative intensity of gum arabic bands decreased with the autoclaving time prolonged from 2 to 24 h. This release of gum arabic polymers is actuated by the recrystallization and crystal growth of ZnO subunits with a prolonged time of autoclaving.
UV/Vis and PL Spectra The UV/Vis spectra in the absorption mode of selected samples Z1 to Z3 and ZG7 to ZG9 are shown in Figure 8. The band gap values were calculated using the procedure introduced by Dharma and Pisal[37] and for selected ZnO samples are given in Table 3. From Table 3 it is visible that the E / eV values are higher for ZnO samples precipitated in the presence of gum arabic. This can be related to a change in the size of ZnO nanoparticles (crystallites) formed in the presence of gum arabic. The PL spectra of selected ZnO samples are shown in Figures 9 and 10. The spectra of reference samples Z1 and Z3 in Figure 9ab are recorded in powder form, whereas Figure 9cd shows the spectra of the same ZnO powders dispersed in pure ethanol. The spectrum of samples Z1 shows a series of peaks from 400 nm (~ 3.1 eV) to 532 nm
(~ 2.33 eV). A very strong near band-edge UV emission at 400 nm can be assigned to the direct recombination of free excitons.[38] The series of peaks in the visible spectral region shown in Figure 9ab is of a very complex nature. Generally, these peaks in the PL spectrum of ZnO can be considered as different intrinsic defects, such as oxygen vacancies VO, zinc
Figure 7. FT-IR spectrum of gum arabic.
Figure 8. UV/Vis spectra of reference samples Z1, Z2, Z3 and those precipitated in the presence of gum arabic (samples ZG7, ZG8, ZG9).

Ž. PETROVIĆ et al.: The Effect of Gum Arabic on Nano / Microstructure … 141
DOI: 10.5562/cca3121 Croat. Chem. Acta 2017, 90(2), 135–143
vacancies VZn, oxygen interstitials Oi, zinc interstitials Zni and oxygen antisites OZn. The appearance of these peaks can vary with the ZnO nano / microstructure, which is on the other hand strongly dependent on the route and conditions of the ZnO synthesis. The shoulders at 410/420 nm (~ 3.02 / 3.0 eV) in Figure 9a are due to the violet emission. Fan et al. recorded the PL spectrum of a ZnO film and noticed the violet emission peak between 424 and 413 nm (~ 2.92–3.00 eV).[39] The violet emission is assigned to the electron transition from the valence band to interstitial zinc (Zni) level under low-oxygen pressure (50–500 Pa). Under high oxygen pressure the characteristic emission at 2.53 to 2.30 eV was noticed. The defect concentration in a Zn-rich zinc oxide is three orders of magnitude greater than that in an O-rich zinc oxide, thus indicating that VO is more readily formed than VZn in the thermochemical treatment of ZnO. Brahma and Shivashankar measured the XPS spectra of ZnO samples and on the basis of these measurements concluded that oxygen vacancies play an important role in the PL behaviour of ZnO and that the concentration of VO could be related to the experimental conditions of ZnO synthesis.[40] The PL spectrum of reference sample Z3 (Figure 9b) showed almost the same spectral feature as for sample Z1. A small relative intensity and a broad band at 532 / 526 nm (~ 2.33 / 2.36 eV) observed for these samples can be related to the green emission. The PL spectra of ZnO powders (samples Z1 and Z3) dispersed in pure ethanol (Figure 9cd) showed the disappearance of characteristic peaks in the blue emission spectral region. The presence of ethanol produced a „healing“effect on ZnO particles, thus softening intrinsic
surface defects, which less affected the blue emission. It can be supposed that in this process the oxygen atom from C2H5OH played a key role by covering oxygen vacancies (VO) on the surface of ZnO particles. The PL band centred at 548 / 544 nm (~ 2.26/2.28 eV) can be assigned to the green emission. The nature of green luminescence emission was the subject of discussion in reference literature.[41,42] The PL spectra of reference ZnO powders Z4 to Z6 and ZnO powders ZG10 to ZG12, all dispersed in ethanol (Figure 10) showed spectral features very similar to those shown in Figure 9cd.
Figure 9. PL spectra of samples in powder form ((a) Z1, (b) Z3) and of the same powders dispersed in pure ethanol ((c) Z1, (d) Z3).
Figure 10. PL spectra of reference samples (Z4 to Z6 and ZG10 to ZG12) in powder form dispersed in pure ethanol.
Table 3. Band gap values of selected Z and ZG samples.
Sample λ(a) / nm E / ev
Z1 393 3.16
Z2 395 3.14
Z3 391 3.17
ZG7 387 3.20
ZG8 388 3.19
ZG9 385 3.22
ZG4 406 3.05
ZG5 402 3.08
ZG6 397 3.12
ZG10 396 3.13
ZG11 393 3.16
ZG12 389 3.19
(a) Intersection between spectrum slope line and base line.

142 Ž. PETROVIĆ et al.: The Effect of Gum Arabic on Nano / Microstructure …
Croat. Chem. Acta 2017, 90(2), 135–143 DOI: 10.5562/cca3121
CONCLUSION Gum arabic showed a strong effect on the nano / micro-structure of ZnO particles precipitated from zinc acetylacetonate. XRD of all samples corresponded only to the presence of wűrtzite-type ZnO crystal structure; how-ever, their nano/microstructures were very different. The hydrothermal treatment of Zn(acac)2 in H2O yielded ZnO rods of micron range length, and some rods were hollow. In the presence of gum arabic ZnO twin-brushes, consisting of nanoparticles, were noticed. The hydrothermal treat-ment of zinc acetylacetonate added to an alkaline (NH4OH) aqueous solution yielded ZnO particles in the form of multipods (stars). With gum arabic added to this precipita-tion system the particles consisted of laterally arrayed ZnO nanorods. The size of ZnO subunits increased with the prolonged time of autoclaving due to recrystallization via the solution. The variations in the recorded FT-IR spectra are predominantly due to changes in the ZnO nano / micro-structure. The FT-IR spectra of ZnO particles formed in the presence of gum arabic showed the residual IR bands of gum arabic in spite of subsequent washing of these particles. The corona formation played an important role in the development of the nano / microstructure from nucleation to the final ZnO product. UV/Vis spectra recorded for ZnO particles precipitated from Zn(acac)2 in the presence of gum arabic and the NH4OH solution showed higher band gap energies than reference samples, which can be related to the decreased size of ZnO nanocrystallites. The PL spectra of ZnO powders dispersed in pure ethanol were very similar. It was found that characteristic peaks in the blue emission region recorded for ZnO powders were disappearing. Evidently, the presence of ethanol had a ”healing” effect on ZnO particles, thus softening the intrinsic surface defects responsible for the blue emission. It was suggested that this effect was caused by oxygen atoms in C2H5OH covering oxygen vacancies (VO) at the ZnO / C2H5OH interface.
REFERENCES [1] T. Zhang, W. Dong, M. Keeter-Brewer, S. Konar, R. N.
Njabon, Z. R. Tian, J. Am. Chem. Soc. 2006, 128, 10960.
[2] S. Cho, J.-W. Jang, S.-H. Jung, B. R. Lee, E. Oh, K.-H. Lee, Langmuir 2009, 25, 3825.
[3] A. Šarić, S. Musić, M. Ivanda, J. Mol. Struct. 2011, 993, 219.
[4] L. Shen, N. Bao, K. Yanagisawa, K. Domen, C. A. Grimes, A. Gupta, J. Phys. Chem. C 2007, 111, 7280.
[5] F. Li, L. Hu, Z. Li, X. Huang, J. Alloys Compd. 2008, 465, L14.
[6] A. P. A Oliveira, J.-F. Hochepied, F. Grillon, M.-H. Berger, Chem. Mater. 2003, 15, 3202.
[7] L.-Z. Zhang, L. Xiang, Res. Chem. Intermed. 2011, 37, 218.
[8] T. T. Ha, T. D. Canh, N. V. Tuyen, ISRN Nanotechnol. 2013.
[9] A. E. Suliman, Y. Tang, Z. Xin, Z. Jia, Asian J. Appl. Sci. 2006, 6, 1298.
[10] D. Tao, W. Qian, Y. Huang, F. Wei, J. Cryst. Growth 2004, 271, 353.
[11] J. Duan, X. Huang, E. Wang, Mater. Lett. 2006, 60, 1918.
[12] A. Stan, C. Munteanu, A. M. Musuc, R. Birjega, R. Ene, A. Ianculescu, I. Raut, L. Jecu, M. B. Doni, E. M. Anghel, O. Carp, Dalton Trans. 2015, 44, 7844.
[13] Y. Gan, F. Gu, D. Han, Z. Wang, G. Guo, J. Nanomater. 2010.
[14] Y.-H. Tseng, M.-H. Liu, Y.-W. Kuo, P. Chen, C.-T. Chen, Y.-F. Chen, C.-Y. Mou, Chem. Commun. 2012, 48, 3215.
[15] O. Carp, A. Tirsoaga, B. Jurca, R. Ene, S. Somacescu, A. Ianculescu, Carbohydr. Polym. 2015, 115, 285.
[16] M. Jitianu, D. V. Goia, J. Colloid Interface Sci. 2007, 309, 78.
[17] M.-H. Liu, Y.-H. Tseng, H. F. Greer, W. Zhou, C.-Y. Mou, Chem. - A European Journal 2012, 18, 16104.
[18] J-K. Yan, Y-Y. Wang, L. Zhu, J-Y. Wu, RCS Adv, 2016, 6, 77752.
[19] Ž. Petrović, M. Ristić, S. Musić, J. Alloys Compd. 2017, 694, 1331.
[20] S. Musić, A. Šarić, Ceram. Int. 2012, 38, 6047. [21] Y. Inubushi, R. Takami, M. Iwasaki, H. Tada, S. Ito, J.
Colloid Interface Sci. 1998, 200, 220. [22] S. Brahma, K. J. Rao, S. Shivashankar, Bull. Mater. Sci.
2010, 333, 89. [23] G. Ambrožič, S. D. Škapin, M. Žigon, Z. Crnjak-Orel, J.
Colloid Interface Sci. 2010, 346, 317. [24] A. Phuruangrat, T. Thongtem, S. Thongtem, Ceram.
Int. 2014, 40, 9069. [25] Y.-H. Tseng, H.-Y. Lin, M.-H. Liu, Y.-F. Chen, C.-Y.
Mou, J. Phys. Chem. C 2009, 113, 18053. [26] H. F. Greer, W. Zhou, M.-H. Liu, Y.-H. Tseng, C.-Y.
Mou, CrystEngComm 2012, 14, 1247. [27] M. Thirumavalavan, K.-L. Huang, J.-F. Lee, Materials
2013, 6, 4198. [28] S. Hayashi, N. Nakamori, H. Kanamori, Y. Yodogawa,
K. Yamamoto, Surf. Sci. 1979, 86, 665. [29] B. K. Meyer, H. Alves, D. M. Hofmann, W. Kriegseis,
D. Forster, F. Bertram, J. Christen, A. Hoffmann, M. Strassburg, M. Dworzak, U. Haboeck, A. V. Rodina, Phys. Status Solidi B 2004, 241, 231.
[30] M. Andrés-Vergés, C. J. Serna, J. Mater. Sci. Lett. 1988, 7, 970.

Ž. PETROVIĆ et al.: The Effect of Gum Arabic on Nano / Microstructure … 143
DOI: 10.5562/cca3121 Croat. Chem. Acta 2017, 90(2), 135–143
[31] M. Andrés-Vergés, A. Mifsud, C. J. Serna, J. Chem. Soc. Faraday Trans. 1990, 86, 959.
[32] A. C. A Roque, A. Bicho, I. L. Batalha, A. S. Cardoso, A. Hussain, J. Biotechnol. 2009, 144, 313.
[33] P. Vanloot, N. Dupuy, M. Guiliano, J. Artaud, Food Chem. 2012, 135, 2554.
[34] C.-C. Wu, D.-H. Chen, Gold Bull. 2010, 43, 234. [35] Y. N. Rao, D. Banerjee, A. Datta, S. K. Das, R. Guin, A.
Saha, Radiat. Phys. Chem. 2010, 79, 1240. [36] S. S. Banerjee, D.-H. Chen, J. Hazard Mater. 2007,
147, 792. [37] J. Dharma, A. Pisal, Simple method of measuring the
band gap energy value of TiO2 in the powder form
using UV/Vis/NIR spectrometer, Application Note 935, Perkin- Elmer Inc., Shelton, CT., USA, 2009, pp. 1–4.
[38] S. K. Mishra, R. K. Srivastava, S. G. Prakash, R. S. Yadav, A. C. Pandey, Opto-Electron. Rev. 2010, 18, 467.
[39] X. M. Fan, J. S. Lian, L. Zhao, Y. H. Liu, Appl. Surf. Sci. 2005, 252, 420.
[40] S. Brahma, S. A. Shivashankar, J. Alloys Compd. 2014, 854, 331.
[41] S. C. Lyu, Y. Zhang, H. Ruh, H.-J. Lee, H.-W. Shim, E. K. Suh, C. J. Lee, Chem. Phys. Lett. 2002, 363, 134.
[42] P. A. Rodnyi, I. V. Khodyuk, Opt. Spectrosc. 2011, 111, 776.