the effect of exercise order on body fat loss during
TRANSCRIPT

University of South FloridaScholar Commons
Graduate Theses and Dissertations Graduate School
3-23-2016
The Effect of Exercise Order on Body Fat LossDuring Concurrent TrainingTonya Lee Davis-MillerUniversity of South Florida, [email protected]
Follow this and additional works at: http://scholarcommons.usf.edu/etd
Part of the Kinesiology Commons, Nutrition Commons, and the Other Education Commons
This Thesis is brought to you for free and open access by the Graduate School at Scholar Commons. It has been accepted for inclusion in GraduateTheses and Dissertations by an authorized administrator of Scholar Commons. For more information, please contact [email protected].
Scholar Commons CitationDavis-Miller, Tonya Lee, "The Effect of Exercise Order on Body Fat Loss During Concurrent Training" (2016). Graduate Theses andDissertations.http://scholarcommons.usf.edu/etd/6217

The Effect of Exercise Order on Body Fat Loss During Concurrent Training
by
Tonya Lee Davis-Miller
A thesis submitted in partial fulfillment of the requirements for the degree of
Master of Science with a concentration in Exercise Science
Department of Physical Education College of Education
University of South Florida
Major Professor: Bill Campbell, Ph.D., FISSN, CSCS Candi Ashley, Ph.D. Lauri Wright, Ph.D.
Date of Approval: March 23, 2016
Keywords: Weight Loss, Resistance Training, Cardiovascular Exercise, Diet
Copyright © 2016, Tonya L. Davis-Miller

DEDICATION
I would like to give a special thanks to my husband, Mike Miller, for all of the
encouragement and support that he has given me throughout my education. He has
been there for all of the late nights and early mornings of research and classes, helped
me with everything he possibly could, and been my rock when I did not think I could
make it through.
I would also like to thank my children, Dakota and Bobby, for being my inspiration
for going back to school in the first place. I hope that I have shown you that you truly
can do whatever you put your mind to and inspired you to live your dreams.
Finally, I want to dedicate this research to my mother, Judy Davis, and my
Grandmother, Beulah Wolf, for being my inspiration in learning how to prevent disease
through exercise and teaching me how to be a strong woman. I hope that my research
both now and in the future will not only find ways to prevent the illnesses that took you
from our family, but also teach other women to be as strong as you both were in life.

ACKNOWLEDGEMENTS
I would like to thank Dr. Campbell for all of his help with this research, the use of
the lab, the explanations of statistics, and the multiple reviews of my drafts. I could
have never done it without you!
I would also like to thank Dr. Ashley for being willing to go through this process of
being on my thesis committee and helping me to find the little details that I had
overlooked.
Additionally, I would like to thank Dr. Wright for taking the time to be on my thesis
committee and review the nutrition recommendations for all of the participants in the
study.
Finally, I would like to thank Melisa Pedula for all of the hard work in the lab with
day-to-day observation of the participants and the assistance with spotting and
assessing. I truly could not have done this research without all of the time you spent in
the lab.

i
TABLE OF CONTENTS
List of Tables ................................................................................................................... iii Abstract ........................................................................................................................... iv Chapter One: Introduction .............................................................................................. 1 Problem Statement ............................................................................................... 3 Study Variables .................................................................................................... 4 Hypotheses........................................................................................................... 4 Conceptual Model ................................................................................................. 5 Operational Definitions ......................................................................................... 6 Assumptions ......................................................................................................... 8 Limitations ............................................................................................................ 8 Delimitations ......................................................................................................... 9 Significance .......................................................................................................... 9 Chapter Two: Review of Literature ............................................................................... 11 Cardiovascular Training ...................................................................................... 11 The effects of cardiovascular exercise on fat metabolism........................ 11 Optimal cardiovascular intensity for achieving fat oxidation ..................... 13 Gender differences in maximal fat oxidation rates ................................... 14 Dietary considerations for weight loss with cardiovascular exercise .............................................................................................. 15 Resistance Training ............................................................................................ 16 The effects of resistance training on energy expenditure ......................... 17 The effects of resistance training on body composition ........................... 21 Dietary considerations for weight loss with resistance training ................................................................................................ 25 Concurrent Training ............................................................................................ 25 Effects of concurrent training on physiological and performance parameters .................................................................... 26 Effects of concurrent training on body composition ................................. 32 Gender differences in concurrent training research ................................. 38 Dietary considerations with concurrent training ....................................... 39 Effect of exercise order in concurrent training .......................................... 44 Research Implications for the Current Study ...................................................... 48

ii
Chapter Three: Methods .............................................................................................. 49 Participants ......................................................................................................... 49 Instrumentation ................................................................................................... 50 Equipment .......................................................................................................... 51 Procedures ......................................................................................................... 52 Baseline and post-intervention testing procedures .................................. 52 Nutritional procedures .............................................................................. 56 Exercise protocols.................................................................................... 58 Statistical Analyses ........................................................................................... 60 Chapter Four: Results .................................................................................................. 62 Baseline Differences ........................................................................................... 62 Nutritional Compliance ....................................................................................... 63 Body Composition Changes ............................................................................... 63 Maximal Strength Changes ................................................................................ 64 Aerobic Capacity Changes ................................................................................. 64 Chapter Five: Discussion ............................................................................................. 67 Population........................................................................................................... 67 Nutritional Analysis ............................................................................................. 68 Body Composition Changes ............................................................................... 69 Maximal Strength Changes ................................................................................ 70 Maximal Aerobic Capacity Changes ................................................................... 71 Conclusion .......................................................................................................... 72 References .................................................................................................................... 74 Appendices ................................................................................................................... 81 Appendix A: American Heart Association/American College of Sports Medicine Health/Fitness Facility Preparticipation Screening Questionnaire ............................................................................... 82 Appendix B: Demographics Questionnaire ........................................................ 84 Appendix C: Nutrition Log .................................................................................. 85 Appendix D: Physical Activity Log ..................................................................... 86 Appendix E: ARB Approval Letter ...................................................................... 88 About the Author ................................................................................................End Page
iii
LIST OF TABLES
Table 1: Baseline Characteristics by Group ................................................................ 62 Table 2: Nutritional Data ........................................................................................... 63 Table 3: Data Summary ........................................................................................... 65
iv
ABSTRACT
While the benefits of both cardiovascular exercise and resistance training have
been well documented, there is a lack of evidence for the order of exercise that is most
effective when both are done in the same day. This study was designed to look at two
groups of participants performing both resistance (R) and cardiovascular (C) training in
the same day to determine if their order, resistance before cardiovascular (R-C) or
cardiovascular before resistance (C-R), matter with regard to changes in body
composition, maximal strength, and maximal aerobic capacity. The participants were
17 women between the ages of 30 and 55 years, with a BMI of ≥25 or body fat
percentage ≥30% and no apparent risk of heart disease. They were randomly assigned
into two groups (R-C = 9; C-R = 8) performing 30 minutes of cardiovascular exercise at
60-70% of their estimated VO2MAX and 7 exercises for 3-4 sets of 6 repetitions at their 6-
repetition maximum with the R-C group performing the resistance training first and the
C-R group performing the cardiovascular training first. There were three days of testing
pre- and post-intervention for body weight, percent fat, fat mass, lean body mass,
maximal bench press, maximal deadlift, and VO2MAX. There were no significant
differences between groups in any of the variables, although there were trends toward
significance in the maximal deadlift (R-C +13.5±8.6kg, ES = 1.15; C-R +6.8±5.6kg, ES =
0.42) and VO2MAX (R-C +2.8±2.4 ml/kg/min, ES = 0.41; C-R +0.9±1.0 ml/kg/min, ES =
0.31). Neither group lost significant amounts of body weight. However, there were

v
significant pre- to post-intervention changes in percent fat, fat mass, lean body mass,
maximum deadlift, maximum bench press, and VO2MAX for the C-R group and percent
fat, fat mass, maximum deadlift, maximum bench press, and VO2MAX for the R-C group.
There were also practically significant between group differences with the C-R group
improving more in body fat percentage (ES = 0.89) and lean body mass (ES = 0.68) and
the R-C group improving more in 1RM deadlift (ES = 1.50) and VO2MAX (ES = 1.57).

1
CHAPTER ONE
INTRODUCTION
Obesity is a national epidemic in the United States. Various public health
agencies, professional organizations, and researchers have tried to find ways to lower
obesity rates by implementing weight loss programs, issuing statements regarding the
costs and risks of obesity, and researching the effectiveness of various programs in
order to empower individuals to lose weight and improve other health outcomes. The
Centers for Disease Control state that 35.7% of Americans are obese as of their 2009-
2010 report. 1 According to a systematic review by Dee et al., those with an elevated
body mass index (BMI) are at an increased risk for co-morbid conditions. 2 Finklestein
et al. state that as of 2006, the annual cost of obesity for full-time employees in the
United States was $73.1 billion, with 61% of those costs for those with a BMI of >35
kg/m2 (morbidly obese). 3 As part of their Obesity Education Initiative, the National
Institutes of Health (NIH) issued the Clinical Guidelines on the Identification, Evaluation,
and Treatment of Overweight and Obesity in Adults in 1998 to help physicians and
health professionals with caring for patients who are overweight or obese. They state
that being overweight or obese increases the morbidity of heart disease, diabetes,
hypertension, certain types of cancer, stroke, and other health issues. 4 Lowering the
prevalence of obesity could, theoretically, lower the costs of obesity-related diseases.
2
Lowering the prevalence of overweight and obesity can be done in numerous
ways. Some recommend dietary strategies alone, others physical activity alone, and
still others using medical or pharmaceutical interventions alone (or some combination of
the above). In the previously mentioned NIH guidelines, a combination of dietary
changes, increases in physical activity, and behavioral therapy seems to be the most
successful. 4 The research appears to back up the need for a combination of modalities
instead of just focusing on one intervention to lose weight. In their review of clinical
trials with a one-year follow up, Franz et al. showed that moderate weight loss can be
achieved via a combination of diet and exercise but long term maintenance can be
difficult. 5 Studies looking at the individuals on the National Weight Control Registry
have shown that those who maintain their weight loss over time have a tendency to use
both physical activity and dietary strategies in order to be successful in weight loss and
maintenance. 6 Successful weight loss maintenance also appears to be accomplished
by increasing physical activity, decreasing daily kilocalorie intake, decreasing dietary fat
intake, eating breakfast, self-monitoring of weight changes, and being consistent with
eating and exercise patterns.7
The NIH guidelines and the strategies used by those on the national weight loss
registry are not generally known by the average individual, however, since the popular
media does not promote them. Because they are not sure what works for weight loss,
Americans flock in droves to weight loss centers, diet programs, diet books, and other
weight loss businesses making weight loss a multi-billion dollar industry. While this can
be beneficial for the product manufacturers and weight loss centers, often the average
person is not successful in their weight loss because of being confused by what works

3
and what does not for achieving their weight loss goals. Should they try the current
popular diet program? What about the latest and greatest exercise programs promoted
nightly in infomercials? With each of these programs claiming to be the best,
consumers who are battling weight issues can often be confused about what to try.
They often give up on their weight loss goals because they are overwhelmed by the
options.
This confusion felt by consumers can be compounded when they go to the local
gym and hear different recommendations from strength and conditioning professionals,
personal trainers, group exercise instructors, and other gym staff. Also, there is a lack
of consistency among certification organizations about what exercise plan is best for
body fat loss. While recommendations exist for the ordering of aerobic and resistance
exercise for performance outcomes,8,9 current research on the ordering of these modes
of exercise for the purposes of improving body composition is lacking.
Problem Statement
Primarily, research on weight loss from exercise has focused on body fat loss
from cardiovascular exercise. More recently, the focus has changed and research has
shown10,11,12 that resistance training, circuit training, and high-intensity interval training
can also increase body fat loss, while possibly maintaining or even gaining lean body
mass. Research on training13,14 with both resistance and cardiovascular exercise in the
same session has focused primarily on the various performance outcomes of the
training such as changes in oxygen consumption or strength, with very few studies
including changes in body composition. When they do include body composition,

4
researchers have yet to show if the order of exercise matters with regard to body fat lost
through concurrent training. In order to find the most effective order of exercise for body
fat loss, the current study focused on utilizing protocols that have been shown to
decrease body fat mass and increase fat-free mass sequenced in a concurrent plan in
order to determine if there is a most effective order of exercise during concurrent
training for improving body composition.
Study Variables
The independent variable for the study is exercise order. One level completed
cardiovascular exercise before resistance exercise (C-R) and the other completed
resistance exercise before cardiovascular exercise (R-C). The dependent variables of
the study related to body composition were lean mass, fat mass, and body fat
percentage. The other primary dependent variables of the study were upper and lower
body maximal strength as measured through the one repetition maximum bench press
and one repetition maximum deadlift. The secondary dependent variable was aerobic
capacity.
Hypotheses
H01: There will be no difference in fat mass lost based on exercise order.
HR1: There will be a difference in fat mass lost based on exercise order.
H02: There will be no change in body fat percentage based on exercise order.
HR2: There will be a change in body fat percentage based on exercise order.
H03: There will be no difference in lean body mass based on exercise order.

5
HR3: There will be a difference in lean body mass based on exercise order.
H04: There will be no difference in the gains in upper body maximal strength (as
measured by bench press 1RM) based on exercise order.
HR4: There will be a difference in gains in of upper body maximal strength (as
measured by bench press 1RM) based on exercise order.
H05: There will be no difference in the gains in lower body maximal strength (as
measured by deadlift 1RM) based on exercise order.
HR5: There will be a difference in the gains in lower body maximal strength (as
measured by deadlift 1RM) based on exercise order.
H06: There will be no difference in the change in maximal aerobic capacity (as
estimated by 1.5 mile walk/run and calculation of VO2MAX) based on exercise order.
HR6: There will be a difference in the change in maximal aerobic capacity (as
estimated by 1.5 mile walk/run and calculation of VO2MAX) based on exercise order.
Conceptual Model
Exercise of all types uses a combination of macronutrients to fuel the movement.
The ratio of fat to carbohydrate used is determined by the intensity and duration of the
exercise. The lower the intensity and longer the duration of exercise, the higher the
percentage of fuel for the activity that is from fat. The higher the intensity and shorter
the duration of exercise, the higher the percentage of fuel for the activity that is from
carbohydrate. Depletion of carbohydrate in the form of glycogen available to fuel the
activities can lead to fatigue while utilizing primarily anaerobic metabolism, therefore
leading to more aerobic metabolic activity for continued exercise. According to the

6
National Strength and Conditioning Association (NSCA), “following the onset of activity,
as the intensity of the exercise increases, there is a shift in substrate preference from
fats to carbohydrates. During high-intensity aerobic exercise, almost 100% of the
energy is derived from carbohydrates if an adequate supply is available. However,
during prolonged, submaximal, steady-state work, there is a gradual shift from
carbohydrates back to fats and protein as energy substrates.” 9(p29) As resistance
training is primarily anaerobic, with depletion of muscle glycogen being a primary
limiting factor for further exercise,9(p33-34) it can be surmised that performing resistance
training prior to lower intensity cardiovascular exercise can cause the same effect,
shifting the metabolic processes from primarily anaerobic metabolism of carbohydrates
during the resistance training to primarily aerobic metabolism to break down fat for the
energy to complete the workout leading to greater body fat loss.
Operational Definitions
“Cardiovascular exercise” is defined as “any vigorous aerobic exercise, which
near-maxes the heart rate–eg, basketball, bicycling, cross-country skiing, dancing,
hiking, jogging, race-walking, racquetball, running, skating, soccer, stair-climbing,
volleyball.” 15 For the purpose of program design for this study, “cardiovascular
exercise” included exercise performed on a treadmill, elliptical machine, cycle
ergometer, or track at an intensity of 60-70% of VO2MAX as estimated via the 1.5 mile
walk/run with the MET level, speed, percent grade, and/or wattage for the specific piece
of equipment used determined by the ACSM metabolic equations. 8(p158),16

7
“Aerobic exercise” is defined as “a generic term for cardiorespiratory exercises—
e.g., rapid walking, jogging, running, bicycling, swimming, and dancing—which are
performed at 60–70% of maximum heart rate for 20 to 30 or more minutes.” 17 For the
purpose of program design for this study, the terms “aerobic exercise” and
“cardiovascular exercise” were used interchangeably following the above definition of
60-70% of VO2MAX as estimated via the 1.5 mile walk/run test.
“Resistance training” is defined as “a method of improving muscular strength by
gradually increasing the ability to resist force through the use of free weights, machines,
or the person's own body weight.” 18 For the purpose of program design for this study,
“resistance training” was completed at a workload of 3-4 sets of 6 repetitions at an
intensity of 100% of six repetition maximum (6-RM) as described in chapter 15 of
NSCA’s Essentials of Strength Training and Conditioning and consisted of 7 exercises
focused on large, multijoint exercises that were expected to result in increases in
maximal muscular strength, lean body mass, and a reduction in fat mass. 9(p332-411)
“Concurrent training” is defined as cardiovascular exercise and resistance
training performed either in the same exercise session or within hours of each other. 19
For the purposes of this study it did not include resistance training and cardiovascular
exercises that were done on different days or were alternated throughout the workout
such as circuit or interval training, but focused exclusively on training sessions where
resistance training and cardiovascular exercises are completed in a single bout with one
type of training preceding the other with a separation between the two of no more than
15 minutes.

8
Assumptions
Because the resistance training exercise bout was based on the 6-RM of the
participants, it was assumed that the participants gave their true maximum effort during
the initial 1-RM and 6-RM tests.
Because the cardiovascular exercise bout was based on the VO2MAX estimated
from the 1.5 Mile Walk/Run test, it was assumed that the participants gave their true
maximum effort during the 1.5 Mile Walk/Run test. It was also assumed that the1.5 Mile
Walk/Run test provides a valid estimate of VO2MAX.
Because the loss of body fat is also dependent on nutritional status, it was
assumed that the participants would follow the nutrition plans designed for them and log
their food intake accurately.
Limitations
A limitation of the present study was that measurement of expired gases and
thus calculation of respiratory exchange ratio and direct assessment of VO2MAX were not
undertaken during the actual exercise sessions, so we were unable to determine the
exact percentage of VO2MAX at which the participant was working or the substrate that
was predominately fueling the activity. Another limitation of this study was that the
VO2MAX was estimated from a 1.5 mile walk/run test on a treadmill instead of actually
being measured for the exercise prescription. The use of a treadmill for this test was
also a limitation because of not being as difficult as a 1.5 mile walk/run on a traditional
track where the participant would have to propel their body weight through space. The
study was also limited by the distance between the resistance training lab and the
9
cardiovascular equipment in the recreation complex, which might have allowed too
much rest between modalities of training. As the participants were not observed while
they were doing the cardiovascular workout, or while they were walking between the
two parts of the facility, the exact amount of rest between modalities is unknown.
Delimitations
While it is optimal to have a broad spectrum of participants without regard to age,
gender, or health status, for convenience purposes there were delimitations placed on
this study with regard to the subjects. The participation sample included only women
who were at low risk for cardiovascular events. Should one order of exercise prove to
be more effective, the study can then be repeated with a different group of participants
to see if the same is true across multiple populations for extrapolation to the general
public. The study participants may have some experience in training in a gym
environment, but may or may not have performed all of these tests, exercises, or food
tracking logs previously.
Significance
This study examines the question of whether there is an optimal order of exercise
to promote a greater loss in adipose tissue. While this is primarily a health issue for
those who are obese, even those with a normal BMI can struggle with excess adiposity.
“There is little question that substantial excess adiposity increases mortality. The
prevalence of overweight and obesity continues to rise and is reaching epidemic
proportions in developed and developing countries. Due to the strong association of

10
obesity and cardiovascular disease, type 2 diabetes, and other chronic diseases, this
trend suggests a substantial increase in obesity-related morbidity and mortality for the
future.” 20 Management of obesity as a disease requires a multifaceted approach to
improve weight loss results. Specifically, it should be a combined effort of the medical,
nutritional, psychological, and exercise science communities helping overweight or
obese patients in making healthy lifestyle changes that include not only modification of
eating habits but also increasing physical activity. 20 The role of exercise professionals
in this lifestyle change is to prescribe effective workout regimens that will elicit
reductions in adiposity. Looking at the order of exercise that will help to increase the
amount of weight loss that is coming from adipose tissues as opposed to lean tissue via
this study allows exercise professionals to better target their clients’ training protocols to
improve health outcomes by focusing on the order of exercise that increases fat burning
or improves other desired outcomes.

11
CHAPTER TWO
REVIEW OF LITERATURE
Cardiovascular Training
Historically, the research on the specific details of how and why exercise affects
the human body has been focused on single modality activities, primarily cardiovascular
exercise. Cardiovascular exercise has proven to have other benefits besides body fat
reduction, such as improved cardiac health, reduction of risk for cancer, diabetes
mellitus, etc. The purpose of this study, however, was to optimize fat metabolism to
reduce adiposity by implementing a cardiovascular program that will elicit the best
results in fat oxidation.
The effects of cardiovascular exercise on fat metabolism. In their study on
the effects of cycling exercise at varying intensities on fatty acid (FA) oxidation, Sahlin
et al. found “that whole body relative FA oxidation was correlated with that in isolated
mitochondria. The correlation was observed during exercise at 80 and 120 W and was
even stronger when interpolated to the same relative intensity (i.e., 35% VO2MAX). The
absence of a correlation at 40 W and at rest may be explained by the relatively low
contribution of muscle respiration to whole body respiration at these low rates of energy
expenditures.” 21 This shows that there is a link between increasing mitochondrial fat
oxidation rates through muscle movement during cardiovascular cycling exercise and

12
increasing total body fat oxidation. As the fatty acids utilized in fat oxidation while at
rest and during exercise are coming from the body’s adipose tissue,22 this can be
extrapolated to show that excess adipose tissue will be utilized during exercise at 80
and 120 watts on a cycle ergometer, leading to a reduction in body fat mass.
In their study “Exercise training increases intramyocellular lipid and oxidative
capacity in older adults,” Pruchnic et al. showed an increase in the lipid oxidative
capacity of muscle after a 12-week cycle exercise
intervention.23 While it did not examine the effect of increased mitochondrial oxidative
capacity on total body composition, it can be assumed based on the previously
mentioned Sahlin et al.21 article that increased oxidative capacity can lead to increased
body fat usage during exercise leading to lower body fat levels over time.
Van Aggel-Leijssen et al. looked at the effect of 12 weeks of different intensities
of cardiovascular exercise on fat metabolism in obese men and found that fat oxidation
at rest did not differ between high and low intensity groups. However, “during exercise,
after low-intensity exercise training, fat oxidation was increased by 40% (P < 0.05)
because of increased non-plasma fatty acid oxidation (P < 0.05). High-intensity
exercise training did not affect total fat oxidation during exercise.” 24 This could lead
one to wonder if performing lower intensity, longer duration cardiovascular exercise
prior to the short bursts of high intensity resistance training activities would also
increase fat oxidation during the time the participants were performing their resistance
training activities. In addition, while there were no significant changes in body
composition during this study, looking at the data shows that there was a slight
decrease in body fat percentage for the low intensity training group, a slight increase in

13
body fat percentage for the high intensity training group, and virtually no change in body
fat percentage for the control group. 24 While these were not statistically significant
changes, it does show a possibility that increasing fat oxidation during exercise
increases body fat loss over time, specifically in those who perform cardiovascular
exercises at lower intensities.
Optimal cardiovascular intensity for achieving maximal fat oxidation.
According to Asker E. Jeukendrup’s review article “Regulation of Fat Metabolism in
Skeletal Muscle”, published in the Annals of the New York Academy of Sciences, “At
rest and during exercise, skeletal muscle is the main site of oxidation of fatty acid (FA).
In resting conditions and especially after fasting, FAs are the predominant fuel used by
skeletal muscle. During low-intensity exercise, metabolism is elevated several fold
compared to resting conditions, and fat oxidation is increased. When the exercise
intensity increases, fat oxidation increases further, until exercise intensities of about
65% VO2MAX, after which a decline in the rate of fat oxidation is observed.” 22 Similar to
the Ronijn et al. study from 1993 that Jeukendrup referenced, a more recent Ronijn et
al. study measured the rate of appearance of free fatty acids (FFA Ra) in endurance
trained women working at 25, 65, and 85% of maximal oxygen uptake. They found that
“FFA Ra was significantly increased to the same extent in low- and moderate-intensity
exercise, during high-intensity exercise, FFA Ra was reduced compared with the other
exercise values.” 25 These two articles would seem to indicate an ideal intensity of
cardiovascular exercise to maximize fat oxidation would be 65% of VO2MAX. Therefore,
the current study utilized cardiovascular intensities between 60-70% of estimated

14
VO2MAX in order to elicit the highest rate of fatty acid oxidation from the cardiovascular
exercise modality.
In their study of male cyclists working at various percentages of their maximum
wattage on a cycle ergometer, van Loon et al. found that at intensities greater than 55%
of maximal workload the total body fat oxidation rate decreased while muscle glycogen
and plasma glucose oxidation rates increased. 26 Switching to a walking protocol for
cardiovascular exercise, Maffeis et al. found that the greatest fat oxidation rate in
prepubertal obese boys was at 4 kilometers per hour and that increasing the speed did
not improve fat oxidation any further. 27 These two studies in combination with the
Romijn et al.25 and Jeukendrup22 articles above seem to indicate that regardless of the
marker of intensity (VO2MAX, WMAX, or km/h), the intensity level of the exercise should be
kept in a low to moderate range in order to optimize fat oxidation rates. Therefore, the
current study utilized an intensity range of ±5% from the 65% of VO2MAX as indicated by
the Romijn et al.25 and Jeukendrup22 articles.
Gender differences in maximal fat oxidation rates. In their study of the
maximal fat oxidation rate and the intensity of exercise on the treadmill at which
maximal fat oxidation (MFO) was reached in a group of 300 healthy men and women,
Venables et al. found that “on average, MFO was 7.8 ± 0.13 mg • kg fat-free mass
(FFM)-1 • min-1 and occurred at 48.3 ± 0.9% maximal oxygen uptake (VO2MAX),
equivalent to 61.5 ± 0.6% maximal heart rate. MFO (7.4 ± 0.2 vs. 8.3 ± 0.2 mg • kg
FFM-1 • min-1; P < 0.01) and FatMAX (45 ± 1 vs. 52 ± 1% VO2MAX; P < 0.01) were
significantly lower in men compared with women. When corrected for FFM, MFO was
predicted by physical activity (self-reported physical activity level), VO2MAX, and gender

15
(R2 = 0.12) but not with fat mass. Men compared with women had lower rates of fat
oxidation and an earlier shift to using carbohydrate as the dominant fuel.”28 Melanson
et al. also showed that women have a greater capacity for fat oxidation in their study. 29
Instead of focusing on fat oxidation during exercise as in the Venables et al.28 study,
however, Melanson et al. looked at the overall fat oxidation for a full day. They reported
that women (as compared to men), “sustained slightly higher rates of 24-h fat oxidation
(mg • kg FFM-1 • min-1) and had a muscle enzymatic profile favoring fat oxidation.” 29
With the goal of this study to maximize fat burning in order to see the differences
between study groups, the studies by Venables et al.28 and Melanson et al.29 appear to
indicate that women were the ideal group of study subjects.
Dietary considerations for weight loss with cardiovascular exercise. When
looking at weight loss, cardiovascular exercise is often combined with dietary
modifications in order to see the best results. In their article examining the effects of 12
weeks of aerobic exercise combined with a reduced-calorie diet on older obese adults,
Solomon et al. divided their participants into two groups – a eucaloric group and a
hypocaloric group, both of which performed the same 60-minute aerobic workout at
approximately 75% of their VO2MAX. Both groups logged their food intake for 3 days
prior to the study to determine their normal caloric intake. The eucaloric group was
instructed to continue eating at their normal levels while the hypocaloric group was
instructed to decrease their intake by 500 kilocalories per day. They found that body
composition improved more in the group that combined cardiovascular exercise with a
hypocaloric diet (a loss of about 6kg fat mass) than with the eucaloric diet (a loss of
16
about 2kg fat mass). 30 As the goal of this study was to optimize body composition
improvements, a hypocaloric diet was recommended through the use of a diet based on
the participants resting metabolic rate with the kilocalories burned from the exercise
protocol added and 500 kilocalories subtracted from the total for the day.
Resistance Training
Research on the effects of resistance training on the human body has primarily
focused on the benefits for strength and power. Some of those studies31,32 have
included information on the changes in body composition from resistance training
programs, specifically increases in fat free mass. There are conflicting results with
regard to decreases in body fat mass, but there is evidence demonstrating that
resistance training does change body composition.
Regardless of whether the body composition changes are due to the resistance
training workouts increasing lean mass or the increase in energy expenditure from
adding resistance training to the normal activity of the participants causing decreases in
fat mass, the benefits in disease risk make strength training vital for the overall health of
the participants. For example, Makovey et al. studied 93 pairs of opposite gender twins
to determine the relationships between body composition and bone mineral density.
Their research showed that regardless of gender or age, those with greater lean mass
had greater bone mineral density, which decreases their risk of osteopenia and
osteoporosis. 33 As the current study utilized a female study sample and knowing that
women are at greater risk for osteoporosis and osteopenia than men, this shows that
17
even if the training itself does not cause body fat loss, it is advisable to include
resistance training for this study group to decrease their risk of osteoporosis.
Hakkinen et al. also looked at the benefits of resistance training for women
specifically suffering from fibromyalgia. They compared 21 women with fibromyalgia to
12 women without fibromyalgia doing resistance training twice a week for 21 weeks.
Both groups increased strength, but the group with fibromyalgia also decreased their
perceptions of pain and fatigue. 34 In addition to showing that resistance training is
beneficial for reducing symptoms in those with fibromyalgia, this study indicates that
resistance training is also safe for those with the disease should they wish to participate
in a concurrent training program as described in this study for body fat loss.
The effects of resistance training on energy expenditure. In 1993, Melby et
al. completed two different experiments looking at the post exercise metabolic rate of
men. The first experiment had participants perform six sets of 10 exercises at 70% of
1RM with failure coming between 8 and 12 repetitions and the full workout lasting
approximately 90 minutes. The second experiment followed the same protocol with the
exception of only using five sets instead of 6 as in the first experiment. Both groups had
elevated post-exercise metabolic rates during the 2-hour recovery period (approximately
34 kilocalories for both groups) and increased resting metabolic rates the day after their
exercise sessions (an average of 9.4% increase for group one and 4.7% increase for
group two).35
In 1994, Campbell et al. looked at the effects of resistance training on energy
expenditure in 12 men and women between the ages of 56 and 80 years old. In

18
addition to showing that the average increase of fat-free mass was approximately the
same as the decrease in fat mass causing weight to be stable, they showed that
resistance training caused a need to increase energy intake by approximately 15% in
order to maintain a stable body weight. Due to these results, Campbell et al. indicated
that resistance training should be added to programs for older adults in order to
increase energy expenditure, decrease body fat, and assist in weight control
programs.36
In 1997, Van Etten et al. looked at the effects of an 18-week resistance program
on men between the ages of 23 and 41 years. They used an exercise group of 18 men,
with a subgroup of 12 of those in the exercise group being tested for their average daily
metabolic rate in addition to the other testing parameters. The non-exercising control
group consisted of 8 men. In addition to changes in body composition, the exercising
group showed a significant increase in their average daily metabolic rate (AMDR). The
energy expenditure during exercise, however, only accounted for 40% of the increase in
AMDR, indicating that a portion of that increase was due to changes in resting
metabolic rate, possibly from changes in body composition.37
While looking at the effect of resistance training on energy expenditure in young
women, Poehlman et al. found that while those in an endurance training group
increased their VO2MAX by 18% and those in the resistance training group increased
their 1RM leg press by 29%, 1RM bench press by 39%, 1RM shoulder press by 29%,
and 1RM seated row by 27%, there were no significant changes in total daily energy
expenditure for either group. 38 They did show an increase in the absolute resting
metabolic rate of those in the resistance training group, but this was accounted for by

19
the increase in lean body mass in the resistance training group, which lead them to
believe that the energy enhancing benefits of resistance training are from the direct
energy cost of exercise and not a chronic elevation of the total daily energy
expenditure.38
Hunter et al. looked at 15 men and women between 61 and 77 years old doing a
resistance training program consisting of three 45 minute workouts a week for 26
weeks, and found that while resting energy expenditure increased by 6.8% and fat free
mass increased by approximately 2 kilograms, the increase in resting energy
expenditure was not fully accounted for by the increase in lean mass. In addition, they
found that even with the increase in fat free mass, the participants did not gain overall
body weight because of equivalent decreases in body fat mass. The participants also
had a decrease in the respiratory exchange ratio from 0.86 to 0.83 indicating a possible
shift toward greater fat oxidation during the exercise sessions.39
Ades et al. seem to have similar results to the Hunter et al. article in their study of
older women with coronary heart disease. Ades et al. studied 51 women averaging 72
years of age in either a resistance training group or a control group doing a yoga
workout. The resistance training group trained 3 days a week for 6 months doing 8
exercises to cover the total body with the intensity increasing from 1 set of 10 repetitions
at approximately 50% of their 1RM to 2 sets of 10 repetitions at approximately 80% of
their 1RM. The control group completed a 30-40 minute light yoga and stretching
workout 3 days per week for the 6 months of the study. The resistance training group
increased their total energy expenditure by 177 ± 213 kcal/day with 50 ± 74 kcal/day of
the increase coming from an increase in resting metabolic rate even without increases

20
in lean mass and a 123 ± 214 kcal/day of the increase coming from an increase in
physical activity energy expenditure. 40 While there were no differences in the body
composition changes between groups, this study shows the potential for weight loss
from a calorie balance perspective, especially if dietary interventions are also added to
produce a hypocaloric state. It also shows that resistance training is safe for those with
coronary heart disease so that they may be able to add resistance training to their
weight loss programs.
Kirk et al. studied the effect of a short, 1 set session of resistance training on
resting metabolic rate and respiratory quotient in young, sedentary, overweight adults.
They showed that one set of 3-6 RM for 9 exercises done 3 days per week for six
months increased the 24 hour energy expenditure, resting metabolic rate, and sleep
metabolic rate and that the change in respiratory quotient indicated that there was also
an increase in fat oxidation from the resistance training program. 41 This increase in fat
oxidation could explain why some of the research shows body fat losses equal to lean
mass increases resulting in changes in body composition but not in body weight.
Ormsbee et al. also showed an increase in energy expenditure and fat oxidation
for both groups in their study comparing sedentary lean and sedentary obese men even
though their exercise protocol was only one workout session. 42 This increase in fat
oxidation from resistance training appears to be similar to the increase in fat oxidation
from cardiovascular activities, which could lead to similar decreases in body fat mass
when using either resistance or cardiovascular exercise protocols.
DaSilva et al. compared two different protocols for resistance training to see if
there were differences in the excess post-exercise oxygen consumption (EPOC) based
21
on the order of the exercises in two groups. Each group used the same exercises at 3
sets of 12 reps at 50% of 1RM for the mono-articular exercises and 55% of 1RM for the
bi-articular exercises. The pre-fatigue group (PE) did the bi-articular exercises first
followed by the mono-articular exercises. The circuit group (CT) alternated primarily
upper body and primarily lower body exercises. Both groups increased EPOC but there
were no differences between groups. 43 While body fat percentage was not mentioned
specifically, this study would indicate that the increases in energy expenditure that can
be associated with losses of body fat mass do not vary based on the order of resistance
training exercises. Therefore, there was no indication of a need for a specific order of
the resistance training exercises for this study.
The effects of resistance training on body composition. The previously
mentioned Hunter et al. Van Etten et al. and Poehlman et al. studies also indicated
increases in fat free mass in addition to the changes in energy expenditure. 37,38,39 Both
the Hunter et al. study and the Van Etten et al. studies also indicated that with the
increase in fat free mass there was no change in total body weight, which would
indicate that there was a loss of fat mass equal to the increase in lean mass. 37,39
Marx et al. studied 34 healthy, untrained women to compare 24 weeks of single
set circuit training to a more traditional periodized high-volume multiple set training
program with regard to several factors. The single set circuit group completed 3 days a
week of training with failure coming between 8 and 12 reps. The multiple set group
completed 4 days a week of training split between heavy days (3-5RM), moderate days
(8-10RM), and light days (12-15RM). Both groups decreased body fat at the 12-week

22
mark, but the multiple set group saw a 3-fold decrease in body fat compared to the
single set group. The only change in lean body mass was also seen in the multiple set
group, with an increase showing at the 12-week mark. 10
In 2009, Kerksick et al. compared the effects of resistance training on college-
aged and middle-aged men. The groups completed two upper-body and two lower-
body workouts per week for 8 weeks. The first four weeks consisted of 3 to 6 sets at
the 10-repetition maximum with the second four weeks consisting of 3 to 6 sets at the 8-
repetition maximum. In addition to the increases in 1RM and lean mass in both groups,
the middle-aged men lost significantly more body fat than the college-aged men. 31
While these results were for men and not women as this study worked with, it does
indicate that an older population may be more favorable for seeing fat losses from
resistance training.
Candow et al. compared the results of 22 weeks of 3 days a week (3 sets of 10
repetitions at 70% 1RM) of resistance training in men between 60 and 71 years old to
measurements of the same factors in non-resistance trained men in their 20s and
showed how lean tissue can increase with a resistance training program. After 12
weeks of training, the older men still had significant deficits in lean tissue and strength
compared to the younger men. However, by the twenty-second week, the lean tissue
mass in the older men was similar to that in the younger men. 44 This shows that
adding resistance training at any age can be beneficial for increasing lean body mass.
In their study of 30 healthy, young men, Lo et al. compared the changes in body
composition from an endurance training program with those from a resistance training
program and a non-exercise control group. The resistance training group completed 3

23
workouts per week of 10 machine weight exercises. They began with 8 weeks of circuit
training, followed by 8 weeks of 1 set of 10 repetitions at 75% of 1RM, and the final 8
weeks of 2 sets of 4 repetitions at 90% of 1RM. The endurance training group ran on a
treadmill for 30 minutes at an intensity of 70-85% of heart rate reserve 3 times a week
for the full 24 weeks. Their results showed that there was no significant difference in
body fat percentage or body fat mass change between the exercise groups with both
decreasing in those groups while increasing in the control group. The resistance
training group, however, had a significant increase in total body lean mass and
specifically lean mass in the arms when compared to both the control group and the
endurance training group. After the 24 weeks of training, all three groups underwent a
24 week detraining period. At the end of the detraining period, the resistance training
group maintained a significant change in lean mass when compared to the control and
endurance training groups. 32 This would indicate that adding resistance training to this
study would help the participants maintain gains in lean body mass, and therefore any
possible increases in energy expenditure from those increases in lean body mass, even
if they decide to discontinue training after the study ends. This could help them
maintain body fat loss for a longer period of time than cardiovascular exercise or dietary
strategies alone.
Alcaraz et al. compared the effects of circuit-style training with traditional strength
training in men who were accustomed to resistance training. Both groups completed 8
weeks of training, 3 times per week, completing 3 to 6 sets at their 6-RM. The
traditional strength group completed all of the sets for each exercise before moving on
to the next exercise and had a rest period between sets of 3 minutes. The circuit-style
24
group completed only one set of each exercise before moving on to the next exercise
and had a rest period between sets of only 35 seconds. Once one set of each exercise
was completed, the circuit group repeated the whole group of exercises for the
remaining sets continuing with the alternating pattern. While both groups increased
their lean mass and decreased their fat mass, the only significant decrease in fat mass
was in the circuit training group. 45 As there did not appear to be a difference in the
EPOC based on exercise order in the DaSilva et al.43 study mentioned earlier, this
would seem to indicate that a decrease in rest periods between sets could be the factor
that helps improve fat loss. Another consideration when comparing these two studies
43,45 in relation to inducing fat loss was the energy expenditure, as differences in this
variable may explain some of the changes observed related to fat mass. DaSilva et al.43
reported that energy expenditure was equivalent in both groups, whereas the Alcaraz et
al.45 investigation did not report on energy expenditure values.
While looking at the effects of different types of resistance training on multiple
strength and body composition variables, Colado et al. compared groups of older
women training twice per week for 10 weeks using weight machines, elastic bands, or
aquatic devices designed to increase drag forces. Their findings included changes in
body composition with a significant increase in lean body mass for the weight machine
and elastic band groups and a significant loss of body fat for all three groups, with the
weight machines group losing the most body fat—a change of 5.15%—while the other
groups experienced less than half that loss of body fat. 46 This shows that even among
types of resistance training that heavier weight activity improves body composition
better than the lower weight, higher repetition activity that is often recommended.

25
Therefore, the current study focused on heavier weight training as previously described
in order to elicit a larger decrease in body fat percentage in the participants.
Dietary considerations for weight loss with resistance training. In the
review article, “Resistance Training Is an Effective Tool against Metabolic and Frailty
Syndromes” Jan Sundell states “Since resistance training increases muscle mass, it
does not result in weight loss without caloric restriction. However, resistance training,
even without caloric restriction, has favourable effect on body composition since it
decreases fat mass including abdominal fat.” 47 The lack of weight loss from resistance
training that Sundell mentions is due to the increases in lean mass while decreasing fat
mass that was previously mentioned while reviewing the Hunter et al. and Van Etten et
al. studies. 37,39 Caloric restriction, as was previously mentioned in the Solomon et al.30
study with cardiovascular exercise, can lead to increases in body fat loss, which may
lead to total body mass loss as well by exceeding the increases in lean body mass from
resistance training. This can be an additional benefit of the hypocaloric diet used in the
current study.
Concurrent Training
Few individuals participate in only one type of training such as cardiovascular
exercise or resistance training. Therefore, research on fat loss through exercise should
focus more on a combination of training types. A lot of this research has focused on
circuit or interval training workouts where resistance training and cardiovascular
exercise are alternated throughout the workout instead of the concurrent pattern that the
current study used where one modality is completed before the other. For example,

26
while studying the effects of concurrent training on elite male runners, Sedano et al.
called their training programs concurrent training when in reality the protocols described
are more focused on endurance, endurance resistance, or interval training. The three
experimental groups included Endurance Group (EG), using their standard strength
circuit that was normally done according to the point the athletes were in their season; a
Strength Group (SG), using barbell and weight machine resistance training for 3 sets of
7 repetitions with 70% of 1-RM alternated with plyometric exercises in an interval
format; and Endurance-Strength Group (ESG), using the same resistance training
exercises as the strength group minus the plyometrics but for 3 sets of 20 repetitions at
40% of 1RM. “Results did not reveal interaction effects for body mass or body fat
percentage.” 48 Without specific reporting of the changes in body composition after
training, it is hard to determine whether circuit or interval training is effective in
improving body composition from this study. However, this study does indicate that no
matter the format of circuit or interval training, the changes are equivocal when
compared to a lower resistance, more endurance based strength program. Whether the
same assumption of equality would hold true for a more traditional strength workout with
heavy resistance either preceded by or followed by a more traditional steady state
cardiovascular workout, however, remains to be seen.
Effects of concurrent training on physiological and performance
parameters. Primarily, research on concurrent training has been on the effects on
performance. While not specifically a performance marker, Wang et al. looked at the
mitochondrial changes in the body that can affect performance by adding resistance

27
training to an endurance program. With 10 healthy subjects performing either
endurance only (1 hour of cycling) or concurrent training of the same endurance
program followed by resistance training (6 sets of leg press at 70-80% of 1RM), they
found that adding resistance training after endurance training amplified the signaling
pathways for mitochondrial biogenesis. 49 Increasing the biogenesis of mitochondria in
the muscles can, theoretically, increase the ability of the muscle to aerobically produce
ATP by using excess adipose tissue, as well as improving cardiovascular measures of
performance like maximal aerobic capacity.
Davis et al. compared the effects of serial concurrent exercise, where the study
group completed resistance exercise before cardiovascular exercise, with a group they
labeled integrated concurrent exercise, where the study group completed alternating
sets of resistance training with brief aerobic cardioacceleration (increasing heart rate
between resistance sets with aerobic activity), on cardiovascular fitness measures.
Their results showed that while both groups saw improvements, integrated concurrent
training improved cardiovascular measures of fitness greater than serial concurrent
training. 50 The format of the integrated training workouts would make it more of an
interval workout that would not be convenient in a traditional gym setting. Therefore,
while that style of training shows greater cardiovascular improvements in this Davis et
al.50 study, the current study followed a method more closely resembling the serial
concurrent training workouts as they most closely resemble what might be done by the
average gym attendant.
In 2010, Wong et al. compared a control group of professional soccer players
doing their normal soccer training to that of an experimental group to see if there was

28
any detriment to their performance from the added exercise. The experimental group
added 4 sets of 6RM for strength and 16 high intensity intervals of 15-second sprints at
120% of their maximum aerobic speed alternated with 15 seconds of rest to their normal
soccer training. The experimental group increased in all measured parameters,
including 1RM strength tests, vertical jump height, 10-m and 30-m sprint times, and
maximal aerobic speed, leading them to conclude that adding high-intensity interval
training and heavy resistance training did not cause decreases in performance in
professional soccer players. 13
In 2010, Shaw and Shaw compared the effects of aerobic training, resistance
training, and concurrent training with a non-exercising control group on changes in
VO2MAX. The aerobic group completed a 45-minute workout, three times per week, at
approximately 60% of their age-predicted maximum heart rate. Exercise heart rate was
adjusted upward by 5% every four weeks for the duration of the 16 weeks of training.
The resistance group performed 3 sets of 15 repetitions of 6 different exercises at 60%
of their estimated 1RM with 60-90 seconds rest between sets and 3 sets of crunches at
60% of their 1 minute maximum repetitions. Their 1RM was reassessed every 4 weeks
in order to adjust the training weights. The resistance training workouts were also
approximately 45 minutes in duration. The concurrent training group completed 22
minutes of resistance training, consisting of 2 sets of 15 repetitions of the same
exercises as the resistance group also at 60% of their 1RM and 22 minutes of
cardiovascular activity at 60% of their age-predicted heart rate maximum. As with the
other groups, the intensity was increased every four weeks. The non-exercise control
group had a decrease in VO2MAX at the conclusion of the study. The three exercise

29
groups, however, all had improvements in their VO2MAX with the resistance training
group improving the least by ~13%. The concurrent group improved by ~30% and the
aerobic group improved by ~34%. While the aerobic group improved VO2MAX
significantly more than the resistance training group and the no exercise group, there
were no significant differences between the aerobic group and the concurrent group.
This finding indicates that concurrent training does not decrease cardiovascular
performance when compared to other types of aerobic training. 51
While the Davis et al.50 Wong et al.13 and Shaw & Shaw51 studies show that
concurrent training can improve performance on cardiovascular measures, there are
studies that contradict those findings. One such contradictory study is the 2009 study
done by Levin et al. looking at the effects of adding resistance training to the current
cycling program of well-trained male endurance cyclists. While the 1RM increased for
the group adding the resistance training, their performance for a 1-km final sprint
decreased compared to the control group who did not perform the resistance training in
conjunction with their normal endurance training. 52 This would indicate that adding
resistance training could have detrimental effects in cycling performance for well-trained
cyclists.
In addition to studying the effects of concurrent training on cardiovascular
performance, some research has also focused on the effect of concurrent training on
resistance performance. The 2013 study done by Jones et al. showed performance
decreases from combining training methods, but focused on the amount of
cardiovascular exercise that caused the impairments in strength. They looked at the
inhibition of strength and hypertrophy from various ratios of concurrent training. Their

30
training groups included one performing only strength training three times per week, one
performing strength training and endurance training three times per week, one
performing strength training three times per week with endurance training only one time
per week, and a control group performing no exercise. Their study found that “greater
frequencies of endurance training performed increased the magnitude of the
interference response on strength and limb girth responses after 6 weeks of 3 days a
week of training.” 14
Izquierdo et al. compared the effects of resistance training twice per week,
aerobic training twice per week, and concurrent training performing resistance training
once per week and aerobic training once per week on separate days. They showed
that the 1RM leg press was similar for the resistance training and concurrent training
groups at the 8-week mark, but that the resistance training group improved significantly
more than the concurrent group at the 16 week mark. Both the resistance and
concurrent groups were significantly stronger than the aerobic group at both the 8 and
16-week measurements. 53
As with the research on cardiovascular performance, there are contradictory
results in resistance performance research as well. Santos et al. looked at 42 young
boys completing either resistance alone or a resistance training program combined with
endurance training. Both groups completed their normal physical education classes in
addition to a strength/power routine of medicine ball throws and plyometric jumps for the
resistance program. The concurrent group also completed a 20-m shuttle run following
the strength/power routine as the endurance component. They found that there was no
impairment in strength by adding the endurance component. 54
31
Shaw et al. compared the effects of resistance training and concurrent training in
38 men with an average age of 25 years old. Their study showed “that resistance
training and concurrent resistance and endurance training both improved strength in all
of the 8 prescribed exercises and that concurrent resistance training and endurance
training was as effective in developing muscular strength initially or for general health as
resistance training alone in previously sedentary or untrained, healthy males.” 55
Unfortunately, their study did not mention the order in which the individual types of
exercise were performed for the concurrent training group, making it difficult to
determine if the order of exercise modalities had an effect on the results.
When looking at the effects of concurrent training with cardiovascular exercise
before resistance training on both endurance and strength factors, Cadore et al. found
that VO2PEAK and maximum aerobic workload increased significantly in the concurrent
group and the endurance group but not the strength group. Those same two groups
showed significant decreases in EMG activity in the rectus femoris compared to the
strength group. 56 This would indicate that the interference effect of concurrent training
would be dependent on the specific fitness component tested, although this cannot be
said for certain because of the lack of testing of the concurrent training group with
resistance training coming before cardiovascular exercise.
In a meta-analysis related to concurrent training, Wilson et al. seemed to sum up
the point that concurrent training was either better or worse than just strength or just
endurance depending on the variable measured. They showed that concurrent training
improved strength, power, and hypertrophy more than endurance alone, but not as
much as resistance training alone. They also showed that concurrent training improved

32
VO2MAX significantly more than resistance training alone but was not significantly
different than endurance training alone. 57 This would seem to indicate that improving
strength, hypertrophy, or power while maintaining maximal oxygen consumption ability
would require performing concurrent training.
Effect of concurrent training on body composition. When shifting to a focus
of the effects of concurrent training on body composition, specifically body fat loss, there
are several examples of the effectiveness of concurrent training. The previously
mentioned Wilson et al. study summarized the results of several studies, stating that the
average effect size for the changes in body fat mass were as follows: strength training -
0.62, endurance training -0.75, and concurrent training -0.95, showing that concurrent
training is the most effective for decreases in body fat mass when compared to
endurance or strength training alone. They found no significant differences between
groups. 57 Another previously mentioned study done by Santos et al. also showed large
decreases in body fat for both training groups, but no significant difference between the
training groups for the total body fat lost. In addition, Santos et al. showed that the
concurrent training group maintained the body fat loss after a detraining period. 54
While the differences between groups in body fat mass lost were not significant, the
study by Santos et al.54 and the analysis of Wilson et al.57 show a tendency toward the
possibility of concurrent training being more effective than resistance or endurance
training alone in reducing body fat mass and maintaining that loss.
In their study of thirty college age men doing either strength training, endurance
training, or concurrent training for 10 weeks, Dolezal et al. showed a significant body fat

33
loss in the concurrent training group over the other two groups. For this study, the
strength group used a combination of Olympic free weights and Universal machines, the
endurance group used a jogging or running program, and the concurrent training group
completed a combination of the exact same resistance and endurance plans as the
strength and endurance groups with the resistance training always coming first. Their
results showed that “body fat was reduced significantly more for the concurrent training
group (12.2 ± 3.5 to 8.7 ± 1.7%) when compared to the resistance training group (15.5 ±
2.7 to 14.0 ± 2.7%) and the endurance training group (11.8 ± 2.9 to 9.5 ± 1.7%).” 58
This study used similar resistance training protocols to the current study, so it is very
promising for the outcomes of both of the current intervention groups with regard to
body composition changes.
Nindl et al. tracked the body composition changes of 31 healthy women
performing strength training followed by cardiovascular endurance training 4 days a
week and backpacking 1 day a week over a 6 month period and compared them to
control groups of 5 women who were assessed before and after 6 months at their
normal activity level and 18 men who were assessed only once as a static control. The
training group experienced an average of 2.2% loss of total body mass, 10% loss of fat
mass, and 2.2% increase in soft tissue lean mass. When broken down by body region,
they had an average of 31% decrease in fat mass and no change in the lean mass in
the arms, an average of 5.5% increase in lean mass with no change in fat mass in the
legs, and an average 12% decrease in fat mass with no change in lean mass in the
trunk. 59

34
McCarthy et al. looked at the muscle hypertrophy of the thigh extensor and flexor
muscles before and after 10 weeks of strength training, cycle endurance training, or a
combination of strength and endurance training. The strength training group performed
one warm-up set and 3 sets of 6RM for 8 exercises 3 days a week with one day of rest
between workouts. The endurance training group performed a 5 minute warm-up and
then cycled at 70% of heart rate reserve for 45 minutes. The concurrent group
completed both training programs in the same session with the order being alternated
so that one session consisted of resistance before cycling and the next session
consisted of cycling before resistance. Both strength training and concurrent training
induced similar increases in size with the concurrent training group increasing the size
of thigh extensors by 14% and the thigh flexors by 6% and the strength training group
increasing the size of thigh extensors by 12% and thigh flexors by 7%. 60 Their findings
indicate that there are no impairments to hypertrophy by adding endurance training 3
days per week.
Balabinis et al. divided 26 male basketball players into four groups. The strength
group trained 4 times per week for 7 weeks and added plyometrics on weeks 4 and 5.
The endurance group also trained 4 times a week for 7 weeks while wearing a heart
rate monitor. The strength and endurance group completed 7 weeks of training while
completing identical programs to both the strength group and the endurance group with
the strength portion scheduled 7 hours after the endurance portion. The control group
did no training during the 7 weeks of the study. In addition to having greater gains in
VO2MAX than the endurance group and greater anaerobic power than the strength group,
the strength and endurance group had a greater reduction in body fat and body weight

35
than either the strength group or the endurance group, while the control group had
minor but not statistically significant increases in both body fat percentage and body
weight. 61
Glowacki et al. looked at men performing either endurance training, resistance
training, or concurrent training with the endurance training and resistance training
groups completing 2 or 3 sessions per week and the concurrent group completing 5
sessions per week of resistance or cardiovascular exercise alternated each day. Both
the resistance training and concurrent training groups increased total body weight and
lean body mass. Both the endurance training and concurrent training groups decreased
body fat percentage. 62 As the increase in lean body mass in the concurrent group was
greater than the loss of body fat, the result was an increase in total body mass. While
this outcome may be discouraging to participants of a concurrent training program, they
should be made aware of the positive health effects of increasing lean mass and
decreasing fat mass should they become discouraged during follow up assessments.
Davis et al. compared integrated concurrent exercise and serial concurrent
exercise, this time focusing on the effects on body composition, muscular strength, and
muscular endurance. The study was 11 weeks long and included 3 days per week of
vigorous concurrent exercise for approximately 1 hour and 50 minutes. Serial
concurrent exercise (CE) included sequential performance of resistance, aerobic, and
range of motion exercise in each training session. Integrated CE included the same
three modes of exercise alternated throughout each exercise session in a circuit or
interval fashion. Their results found that “Serial CE produced discernible (p < 0.05)
increases in lower- (17.2%) and upper- (19.0%) body muscle strength and fat-free mass
36
(FFM) (1.8%) and trends toward greater lower-body muscle endurance (18.2%) and
reduced upper-body flexibility (-160.4%). Integrated CE produced discernible increases
in lower- (23.3%) and upper- (17.8%) body muscle strength, lower-body muscle
endurance (27.8%), FFM (3.3%), and lower-body flexibility (8.4%) and a decline in fat
mass (-4.5%) and percent body fat (-5.7%).” There was, however, an extreme outlier
for body fat percentage in both groups with the outlier for the serial CE group having a
19% decrease in body fat percentage and the outlier for the integrated CE group having
a 13.1% increase in body fat percentage. 11
Sillanpaa et al. also compared groups doing either strength, endurance, or
concurrent training with the concurrent training group completing the full protocol for
both of the other groups, this time with 62 middle aged women. Both the endurance
group and the concurrent group significantly lost body fat, but there were no significant
differences between groups. 63
Arazi et al. compared two different concurrent training groups, a Concurrent
Distinct Endurance-Reistance (CDER) group doing resistance training two days per
week and endurance training two days per week for a total of 4 days per week of
exercise and a Concurrent Parallel Endurance-Resistance (CPER) group doing 2 total
days per week of exercise completing both the resistance and endurance protocols on
the same days, with a control group (C). Both groups progressed from 2 sets of 10
repetitions at 65% of 1RM and 20 minutes of running at 70% heart rate max in week
one to 3 sets of 4 reps at 90% of 1RM and 45 minutes of running at 95% of heart rate
max in week 12. While both groups lost body fat and increased lean mass, “body fat
percentage for CPER was significantly lower than for CDER and C.” 64 While the study

37
did not mention the order of the exercises, the concurrent protocol where both
resistance and endurance are performed in the same day seems to produce greater
results for body fat loss. Therefore, completing both protocols in the same training
session is the ideal format for the current study.
Willis et al. studied 119 sedentary overweight or obese adults performing either a
resistance training program, an aerobic training program, or a concurrent training
program consisting of both the resistance and aerobic programs. The aerobic training
group and the concurrent training group lost significantly more body fat than the
resistance training group. The resistance training group and the concurrent training
group significantly increased lean body mass more than the aerobic training group.
There were, however, no significant differences between the concurrent training group
and the aerobic training group for fat loss or between the concurrent training group and
the resistance training group for lean mass gains. 65
Hunter et al. looked at changes in energy expenditure in women between 60 and
74 years of age completing either 1 day a week of aerobic and 1 day a week of
resistance training, 2 days a week of aerobic and 2 days a week of resistance training,
or 3 days a week of aerobic and 3 days a week of resistance training. While all three
groups lost body fat mass and increased fat free mass, only the group completing 2
days a week of each modality saw a significant increase in total energy expenditure and
activity related thermogenesis. While the 1+1 group saw a trend toward increasing non-
exercise training activity related thermogenesis, the 3+3 group actually saw a decrease
in non-exercise training activity related thermogenesis. 66 This would lead to

38
speculation that concurrent training for more than 4 days per week could have a
negative impact on energy expenditure over time.
Fisher et al. also studied the effect of 1+1, 2+2, and 3+3 groups on various
outcomes for older women. While all three groups increased lean mass and decreased
fat mass, there was a significant decrease in the fat mass in the 3+3 group compared to
the 1+1 group. 67 While the previous Hunter et al.66 study of similar exercise indicates a
decrease in non-exercise (not total) energy expenditure with the 3+3 protocol, the loss
of body mass shown by Fisher et al.67 could be the primary factor for the decreased
energy expenditure.
Gender differences in concurrent training research. While the previously
mentioned Nindl et al. study did not include a male training group, they did show that
there were significant differences between the genders for overall body mass, lean
mass, fat mass, and percentages of fat and lean between genders. Men had
significantly more total body mass and lean mass while women had significantly more
fat mass and percent body fat. 59
Sanal et al. compared an aerobic exercise (AE) group of 15 men and 18 women
with an aerobic and resistance exercise (ARE) group of 16 men and 16 women. All four
groups had significant improvements in whole body fat percentage with the two groups
adding resistance to their aerobic programs having the greatest change in whole body
fat. The male ARE group started with a baseline of approximately 30 kg of fat mass and
ended the intervention with 24 kg of fat mass, whereas their male AE counterparts
began with a baseline of 25 kg of fat mass and ended the intervention with 24 kg fat
39
mass. The female ARE group started with a baseline 37 kg of fat mass and ended with
32 kg of fat mass, whereas their female AE counterparts began with a baseline of 34 kg
of fat mass and ended the intervention with 31 kg of fat mass. In addition, men had
excellent results for increasing fat free mass in the whole body and decreasing body fat
percentage in the trunk by adding resistance training to their aerobic programs and
women had excellent results for decreasing fat mass in the legs by adding resistance
training to their aerobic programs. 68
Dietary considerations with concurrent training. There have been several
published studies on the Curves model of training in relation to dietary strategies and
disease risk in obese women. The first study by Kerksick et al. in 2009 included 161
sedentary, obese, pre-menopausal women doing the Curves circuit program and
following one of four diet programs [High Energy, High Carbohydrate, Low Protein Diet
(HED), Very Low Carbohydrate, High Protein Diet (VLCHP), Low Carbohydrate,
Moderate Protein Diet (LCMP), or High Carbohydrate, Low Protein Diet (HCLP)], or in a
No Diet, just exercise (ND), or a non-exercise, no diet control (CON). It should be noted
that the HED group food intake consisted of approximately 2600 kilocalories per day,
while the other three plans were only approximately 1200 kilocalories per day for the
first 2 weeks and moved up to 1600 kilocalories per day for the next 8 weeks and a
maintenance level of 2600 kilocalories for the last 4 weeks. In this study Kerksick et al.
found that while all groups lost body fat, both the VLCHP and HCLP group had a mean
change of -2.0% body fat and the LCMP group had a mean change of -1.7% body fat.
Both the HED and ND groups had a mean change of -0.6% body fat, while the CON
40
group had a mean change of 0.0% body fat. 69 This article shows that regardless of the
dietary protocol, a restricted calorie diet in conjunction with circuit style resistance
training produces reductions in fat mass.
A similar study published the next year by Kerksick et al. divided 141 sedentary,
obese women into the same groups as the previously mentioned study. This time,
however, the VLCHP, LCMP, and HCLP groups were only limited to 1200 kilocalories
per day for one week before moving up to 1600 kilocalories per day for the next 9
weeks. At the 10 week mark, all groups began consuming 2600 kilocalories per day
with the macronutrient composition being changed to a more standardized pattern
among all groups. This time the changes in body composition showed that after the 14
weeks of intervention the VLCHP had a change of - 3.7 kg fat mass, the LCMP group
had a change of -3.5 kg fat mass, and the HCLP group had a change of -2.9 kg fat
mass. 70
When looking at the body fat change from a percentage perspective, they found
that the VLCHP group had a change of -2.2 % body fat, the LCMP group had a change
of -1.9 % body fat, and the HCLP group had a change of -1.6 % body fat. 70 These
losses show similarities in body fat loss to the first study, even with the differences in
the diet macronutrient distributions for the last 4 weeks of the interventions, with the
groups who were following hypocaloric diets for the majority of the study losing
significantly more body fat than the control groups. Since the Curves model uses 30
seconds to one minute of exercise on hydraulic resistance machines alternated with 30
seconds to one minute doing cardiovascular movements such as marching in place on
a padded square between machines, this type of workout would be considered circuit

41
training and does not meet the requirements for concurrent training that the current
study followed. However, because of the focus on the nutritional programs used by
Kerksick et al.69,70 these studies provide further evidence that the current study needed
to induce a hypocaloric state in order to achieve the body fat loss that was the goal of
the study.
In 1994, Whatley et al. compared the effect of multiple protocols of concurrent
training while on a very low kilocalorie diet to determine the effects on metabolic rate
and body composition in 23 obese women between the ages of 25 and 45 years old.
Eight women were in the large activity group (LA) doing 400 minutes per week of
endurance training along with 3 days per week of resistance training. Eight women
were in the moderate activity group (MA) doing 200 minutes per week of endurance
training along with 3 days per week of resistance training. Seven women were in the
control group (C) completing only the diet portion of the program. All three groups
followed the same nutritional program consisting of approximately 800 kilocalories per
day, 100 grams of carbohydrate, 70 grams of protein, and 13 grams of fat. “All groups
showed signifcant decreases in body weight, percent body fat, fat mass, and fat free
mass from baseline to week 12. The LA group demonstrated signifcantly greater
decreases for body weight, percent body fat, and fat mass as compared to the C group.
There were no differences between the groups for decreases in fat free mass. The
percentage of body weight lost as fat free mass was approximately 29%, 18%, and 20%
for the C, MA, and LA groups, respectively. 71 When looking at the actual body fat lost,
the control group lost 9 kg, the MA group lost 13 kg, and the LA group lost 16 kg. 71
This shows the significant difference between the LA group and the C group and the

42
lack of significance for the difference between the fat lost in the MA group and the LA
group, indicating that a very low kilocalorie diet combined with either type of concurrent
training will be effective for fat loss.
In 1998, Kraemer et al. looked at the effect of diet only, diet combined with
endurance training, diet combined with concurrent training, and a control group to
determine the effects of each modality when combined with diet on body composition.
The control group continued with their normal diet and activity program. The diet group
did not follow an exercise program. Both exercise groups completed whole body
aerobic activity at 70-80% of functional capacity increasing from 30 minutes at the
beginning of the study to 50 minutes at the end. The diet plus concurrent training also
completed a resistance training program after their endurance training consisting of
approximately 10 exercises alternated between a heavy day of 5-7 RM and a moderate
day of 8-10 RM for 1-3 sets. All three study groups attended weekly group meetings
with a registered dietitian where they were given information about healthy eating and
the nutritional supplements they were to include in their nutrition plans. The diet only
group averaged an intake of 1551 kilocalories per day. The diet plus endurance training
group averaged an intake of 1430 kilocalories per day. The diet plus concurrent training
group averaged an intake of 1449 kilocalories per day. After 12 weeks of the
intervention, all groups lost significant amounts of body weight. Of the total body weight
lost, fat mass accounted for 69% in the diet only group, 78% in the diet plus endurance
group, and 97% in the diet plus concurrent training group. 72 This shows that following a
concurrent training program while dieting will prevent some of the fat free mass loss
associated with diet alone or diet combined with endurance training alone.
43
In their 2009 study, Davis et al. compared a control group with 3 groups using a
nutritional counseling intervention that aimed to reduce the overall dietary intake of
sugar by >10%. The first of those three groups only received nutritional counseling.
The second group received the same nutritional counseling as the first group, but also
participated in strength training two times per week for approximately 60 minutes per
session. The third group received the same nutritional counseling as the first and
second group, but also participated in a concurrent training program where they
alternated every two minutes between resistance and cardiovascular exercise for a total
of 30 minutes each modality or 60 total minutes of activity twice per week. The nutrition
counseling only group reduced their overall kilocalorie intake by about 200 kilocalories
per day. The nutrition plus strength training group reduced their overall kilocalorie
intake by about 340 kilocalories per day. The nutrition plus concurrent training group
reduced their overall kilocalorie intake by 86 kilocalories per day. While there was no
significant difference between the groups, the trend seemed to favor the nutrition plus
strength group for having the greatest decrease in kilocalorie intake (P ≤ 0.10).
However, when looking at the body composition changes, the nutrition plus concurrent
group clearly had the larger changes in fat mass, losing 1.4 kilograms of body fat in the
16-week study period. The nutrition alone group also reduced body fat by 0.1
kilograms. The nutrition plus strength group and the control group both increased body
fat mass at 0.6 kilograms and 0.4 kilograms respectfully. 73 Therefore, it appears that
even without the full decrease in kilocalorie intake that was achieved through the
nutritional intervention in the other groups, concurrent training is more effective at
decreasing adipose tissue in the body. Had the nutrition plus concurrent training group

44
also achieved a significant decrease in daily kilocalorie intake, it could be assumed that
they would see even greater losses in adipose tissue. Therefore, the current
implemented a more specific recommendation in kilocalorie intake to insure a
hypocaloric state during the training in order to achieve a statistically significant loss in
body fat mass.
Effect of exercise order in concurrent training. While it is often debated in the
gym whether cardiovascular training or resistance training should be performed first in
order to elicit the best results, there is actually very little research on the possible
outcomes based on exercise order. Vilaca, et at, performed a meta-analysis in 2011 to
determine if exercise order influenced energy expenditure. Based on their report, which
included several articles previously mentioned here, concurrent training will decrease
body fat and increase energy expenditure regardless of the order in which it is
performed.74
In their review article Kang and Ratamess reviewed several studies to determine
the best order for performing concurrent training. They concluded that cardiovascular
exercise should be first in order to increase maximum aerobic power and post exercise
energy expenditure while resistance should be first in order to increase strength, power,
and hypertrophy. They also state that resistance first can increase maximum aerobic
power in the elderly, plus the increased intensity can potentiate energy expenditure and
favors fat utilization in the subsequent aerobic session.75
Kang and Ratamess75 referenced the 2005 study by Chtara et al. that compared
endurance training alone, circuit style strength training alone, and concurrent programs

45
of the endurance and circuit style strength training in both orders, which concluded that
endurance parameters such as the 4-km time trial and VO2MAX were significantly
improved by performing endurance training prior to circuit style resistance training. 76
Chtara et al. published another study in 2008 with similar study groups showing that the
circuit training group increased strength and power the most, with both concurrent
groups having no difference in strength and power increases based on order but that
both groups had less improvement than the circuit training alone. 77
Rosa et al.78 in 2011 and Cadore et al.79 in 2012 looked at the effects of exercise
order in concurrent training on hormone levels within the body. Rosa et al. compared a
control group doing no exercise with two different concurrent groups, one doing aerobic
exercise before resistance and the second doing resistance training before aerobic
exercise. The two concurrent training groups followed the same protocols for their
workouts except for the order of the modalities. They found that leptin and cortisol were
decreased in both concurrent training groups with no significant difference based on
order.78 As leptin and cortisol are both increased in those with excess adiposity,
decreasing these hormones could possibly be one of the factors leading to decreased
adiposity in those performing concurrent training. However, as this was an acute study,
there is no data indicating body composition changes over time.
The Cadore et al. study of the effects of concurrent training on cortisol and
testosterone was also an acute study. They had 10 recreationally trained young men
perform 30 minutes of cycling at 75% of their age predicted maximum heart rate for
endurance with it either preceded or followed by 3 sets of 8 reps at 75% of 1RM in 4
strength exercises. Cortisol levels were elevated after the first modality and returned to
46
baseline after the second modality regardless of order. Testosterone was elevated after
the first modality regardless of order but remained elevated after the second modality
only when the aerobic component was performed first. 79 These elevations of cortisol
contradict the Rosa et al. article. 78 This would lead one to wonder if the acute effect of
exercise on cortisol has any overall effect on adiposity or if elevated cortisol can be a
symptom of stress regardless of whether that stress is the exercise activity or simply the
body being stressed by excess adiposity instead of a cause of adiposity. The elevations
in testosterone level, however, do show a possible cause for increases in lean tissue
from concurrent training and lead one to speculate that if resistance training is
performed after cardiovascular training then it may enhance the increases in lean mass.
Whether that possible increase in lean mass has an effect on the loss of fat mass,
however, remains to be seen, especially in women since they were not included in this
study.
In a study investigating aerobic and strength exercise sequence in the same
session and their effect on the oxygen uptake during and post exercise, Alves et al.
reported that there was no significant difference in the overall oxygen consumption of
participants based on the order in which the exercises were performed during the
sessions. 80 While their research was performed on acute sessions and not of a long
enough duration to determine differences in body composition between training
programs, their readings of respiratory exchange ratio during the strength training
aspects of their sessions showed a significant decrease in RER values during the
second half of the strength training segments of the exercise sessions. This indicates
that there is a shift toward more fat burning during the resistance portion of a concurrent

47
training workout. This could lead to an overall greater amount of fat burning in
concurrent training sessions when resistance training is completed first.
Davitt et al. recently published their study on the effect of exercise order in
concurrent training with regard to changes in body composition and other physiologic
parameters. They studied 23 inactive college aged females with 13 in an endurance
before resistance group and 10 in a resistance before endurance group. The
endurance portion of their workout was 30 minutes at 70-80% of HRR. The resistance
portion of their workout was a 3 way split routine using 3 sets of 8-12 repetitions for 5-6
exercises at 90-100% of their 10RM. They completed their workouts 4 days per week
for 8 weeks. Both groups increased strength, VO2MAX, and lean body mass. Total mass
increased for both groups. While there was no significant change in body fat
percentage in either group, the data indicate that the average change in body fat
percentage was an increase of 0.64% for the endurance before resistance group and a
decrease of 2.99% for the resistance before endurance group.81
It is possible that the trend toward more fat loss for the resistance training before
cardiovascular endurance training group was there, but the study was not of sufficient
power to see the full effects of the training protocols. Another possible reason why the
body fat percentage changes were not significant could be that this study did not
account for dietary factors that could assist with body fat loss, which were included in
the current study.

48
Research Implications for the Current Study
While the Davitt et al.81 study came close, no study was found that examined the
effects of exercise order on body composition changes during concurrent training as
they were performed during the current study. The previously listed research, however,
appears to show a positive effect of concurrent exercise on body fat loss. Specifically
looking at the protocols for achieving the greatest losses in body fat, the previously
listed research indicates that cardiovascular exercise should be performed at
approximately 65% of VO2MAX and resistance exercise should be sufficiently heavy
enough to induce increases in lean body mass. It also shows that women appear to
have a greater capacity for fat oxidation, therefore making them the ideal group to study
to see the largest impact of the training.

49
CHAPTER THREE
METHODS
Participants
Utilizing convenience sampling, participants were chosen from around the
University of South Florida. Female participants between the ages of 30 and 55 with a
BMI > 25 or a body fat percentage ≥ 30% were recruited for the study. Since body fat
percentage was not able to be obtained until the assessment meeting, those who did
not meet the BMI requirement but wanted to participate in the study were taken through
the sign up process and scheduled for the initial assessment to see if they could
participate based on body fat percentage. Study staff met with each potential
participant and went over in detail the informed consent and processes of the study. If
they chose to participate in the study, the participants were screened and excluded if
they checked any statements in the first section or more than two statements in the
second section of the AHA/ACSM Health/Fitness Facility Preparticipation Screening
Questionnaire (with the exception of the statement regarding being overweight) in order
to decrease the risk of a cardiovascular event during training. In order to achieve
adequate power, approximately 30 participants were estimated to be needed. Although
34 participants were recruited and began the training program, only 17 participants
completed the entire 8 weeks of training to be included in the final analysis. The
50
reasons given for the dropping out of the study were generally related to scheduling due
to the supervision requirement for the workouts.
Instrumentation
All participants were screened for health status using the AHA/ACSM
Health/Fitness Facility Preparticipation Screening Questionnaire as presented in
appendix A and on page 538 of ACSM’s Resource Manual for Guidelines for Exercise
Testing and Prescription Sixth Edition and on page 21 of ACSM’s Guidelines for
Exercise Testing and Prescription Eighth Edition. 8,82 In order to ensure that the
participants were healthy and at low-risk for cardiovascular disease, any affirmative
answer in section one or more than two affirmative answers in section two (not counting
being more than 20 pounds overweight) on this questionnaire excluded the participants
from participation in the study. Participants also completed a demographics
questionnaire to verify age and for possible future statistical analysis based on race or
ethnicity.
Caloric expenditure for the assigned resistance exercise during the study was
estimated using the 2011 Compendium of Physical Activities: a second update of codes
and MET values. 83,84 We classified the resistance training as “weight lifting (free
weight, nautilus or universal-type), light or moderate effort (Taylor Code 210)” 84 with a
MET level of 3.0.

51
Equipment
Assessing obesity for research purposes has primarily been done through the
use of the Body Mass Index scale. This form of assessment is easy to complete, as it
requires simply a height and weight to either perform the calculation or consult a chart
where the computations have already been completed. Therefore, it can be done
simply in a doctor’s office or by any individual regardless of their level of training. Body
Mass Index is not, however, a direct measure of body fatness. The Centers for Disease
Control states,
“It is important to remember, however, that BMI is not a direct measure of
body fatness and that BMI is calculated from an individual's weight which
includes both muscle and fat. As a result, some individuals may have a
high BMI but not have a high percentage of body fat. For example, highly
trained athletes may have a high BMI because of increased muscularity
rather than increased body fatness.” 85
Therefore, due to the desire for a more accurate measure of the change in body
composition from the interventions, this study utilized body composition analysis instead
of body mass index to determine the changes in body fatness.
Height and weight measurements were taken using a Health O Meter™
Professional scale. Body composition was determined using the BodyMetrix™
ultrasound machine. An additional measurement of body fat was taken using Lange®
skinfold calipers. Resting metabolic rate was measured using the Cosmed FitMate
ProTM.
52
For the resistance training portion of the workouts, the participants utilized
Olympic free weights and weight benches. For the cardiovascular exercise portion of
the workouts, the participants utilized TrackMaster™, Woodway™, and TechnoGym™
treadmills, elliptical machines, standard exercise cycles, and recumbent cycles.
Procedures
After initial recruitment, participants were randomly assigned to one of two
groups based on when they joined the study: For the initial participant joining and if
multiple participants joined at the same time, they were randomized by the flip of a coin,
with heads representing going into the C-R group and tails representing going into the
R-C group. Whenever someone would drop from the study, the next participant to join
was placed in the group that had just lost a participant so that the study groups could
remain relatively equal. All participants were screened with the AHA/ACSM
Health/Fitness Facility Preparticipation Screening Questionnaire and demographics
questionnaire and given forms for three days of physical activity logging to be used to
determine the physical activity factor for nutritional planning prior to their assessment
appointments. Participants were then scheduled to come in to the lab for three baseline
assessment appointments.
Baseline and post-intervention testing procedures. The first appointment
consisted of body weight, body composition, and RMR assessment. Prior to arriving to
the research laboratory for RMR assessment, participants were instructed to fast for the
prior 10 hours. Testing sessions occurred between the hours of 5am and 11am. Upon
53
arrival at the testing location, the participant was encouraged to use the restroom to
empty their bladders. Next, the participant had their body weight measured (Health O
MeterTM) and the BodyMetrixTM ultrasound system was used to assess body
composition. The seven anatomical sites that were measured include the chest,
midaxillary (about 4 inches below the armpit), triceps, subscapular (below the shoulder
blade), abdomen, suprailiac (above the hip bone), and thigh. To conduct this body
composition assessment, the researcher applied a small amount of ultrasound gel to the
hand-held ultrasound wand, then applied the wand to the appropriate anatomical
landmark, and then moved the wand back and forth over the area of the skin across a
range of about 5cm. The BodyMetrixTM works by using ultrasound. When ultrasound
waves penetrate tissue, reflections occur at different tissue boundaries. For example,
there are strong ultrasound reflections at fat-muscle and muscle-bone boundaries.
Ultrasound allows the BodyMetrixTM to detect the true fat thickness at each
measurement point. Fat thickness measurements were made in millimeters. The
software provided with the Body MetrixTM was used to determine the percentage of body
fat for each participant. A second assessment of body composition was completed
using Lange® skinfold calipers at the same seven anatomical sites. To conduct a
skinfold assessment, the researcher pinched the skin with their thumb and index finger
and then measured the thickness of this fold using a Lange® caliper. Measurements
were made in millimeters. The principle behind this technique is that the amount of
subcutaneous fat is proportional to the total amount of body fat. Various regression
equations have been developed to predict percent body fat from skinfold
54
measurements. For the skinfold assessment, the American College of Sports Medicine
7-site formula was used to predict body composition.8,16,85,86
After completing the body composition analysis, the participant then sat in a
reclined position with her feet elevated for a 5-minute period. During that 5-minute
period, the participant was familiarized with the Cosmed FitMate ProTM via an
explanation by the researcher. Following the 5-minute familiarization and rest period,
the participant had the facemask placed on their head and the 15-minute RMR
assessment period began. During this time, the participant was encouraged to breathe
normally and to relax. After the 15-minute data collection period, the facemask was
removed but the participant remained seated in the reclined position. After a 2-minute
rest period, a second 15-minute RMR test was conducted. The lowest of the two RMR
tests was used for determining the calorie needs of the participant for the study. During
these RMR tests, there were two participants who had problems maintaining a steady
breath which caused an unusually low RMR reading. For those participants, a third
RMR test was completed and the lowest of the three was thrown out as an outlier.
At the second assessment appointment, the participants completed a 1.5 mile
walk/run test to estimate their VO2MAX. This test was performed on a treadmill. The
participant was instructed to walk, run, jog, or any combination of walking, jogging, or
running for the full 1.5 miles. The time to complete the allotted distance was recorded in
minutes and seconds and then converted into the decimal form of minutes. The VO2MAX
was determined using the equation “VO2MAX (mL•kg-1•min-1) = 3.5 + 483/1.5 mile time
(min)” from page 114 of ACSM’s Health-Related Physical Fitness Assessment Manual.
16
55
At the third assessment appointment, the participants completed strength testing
for both upper and lower body. One repetition maximum can be used for determining
an individual's maximum strength. The one repetition maximum is the maximum amount
of weight one can lift in a single repetition for a given exercise. The upper body strength
test was the One Repetition Maximum Bench Press.
• Equipment
1. A barbell (45lbs), variety of weight plates (2.5lbs, 5lbs, 10lbs, 25lbs, 45lbs)
and two safety locks; enough total weight to accommodate the maximal load
for the participant.
2. A sturdy bench press bench with integral bar rack.
• Personnel
1. Two study staff members (one spotter, one data recorder).
• Procedure
1. A member of the study staff instructed the participant on the proper technique for
the flat barbell bench prior to the participant attempting the lift.
2. The spotter stood at the head of the bench throughout the test to help in raising
the bar on a failed attempt and to help the participant place the barbell back on
the rack.
3. As with all maximal testing, the participant first performed a bench press warm-
up set of 5 to 10 repetitions with a light to moderate load.
4. Participants were encouraged to attempt their 1RM within 3 to 5 attempts after
the warm-up; otherwise fatigue may compromise the final result.

56
Participants’ lower body strength was determined using a One Repetition Maximum
Deadlift.
• Equipment
1. A barbell (45lbs), variety of weight plates (2.5lbs, 5lbs, 10lbs, 25lbs, 45lbs)
and two safety locks; enough total weight to accommodate the maximal load
for the participant.
• Personnel
1. One study staff member
• Procedure
1. A member of the study staff instructed the participant on the proper technique
for the deadlift prior to the participant attempting the lift.
2. As with all maximal testing, the participant first performed a deadlift warm-up
set of 5 to 10 repetitions with a light to moderate load. During this set, the
participant was allowed to complete a partial deadlift, where the bar had to
come to below the knee but not to the floor, for each of the repetitions.
3. Participants were encouraged to attempt their 1RM within 3 to 5 attempts
after the warm-up; otherwise fatigue may compromise the final result.
Nutritional procedures. Each individual met with the study coordinator to be
given her individual caloric recommendations to follow throughout the study. These
caloric goals were determined by following the recommendations of a registered
dietitian who supervised the nutritional aspects of the study. Resting metabolic rate was
estimated through the use of an indirect calorimeter, the Cosmed Fitmate Pro™, in a
57
fasted, non-exercise state. This estimation was then multiplied by a physical activity
coefficient based on the participants physical activity level in order to determine their
total daily energy expenditure (TDEE) not counting the exercise associated with this
study.87-92 The physical activity coefficient was determined based on the three days of
physical activity logs that were given to the participants prior to this appointment. Those
logs were reviewed and compared to the 2011 Compendium of Physical Activities: a
second update of codes and MET values83,84 to estimate the activity level to be used.87-
92 The physical activity coefficients were:
• Sedentary—1.25—For those who spend their entire day sitting
• Low Active—1.5—For those who spend most of their day sitting and only
walking to perform tasks of daily living
• Active—1.75—For those with active vocations equivalent to walking 6-8
miles per day
• Very Active—2.2—For those who engage in several hours of vigorous
physical activity daily87-92
An estimation of caloric expenditure for the workouts in this study was calculated
using the 2011 Compendium of Physical Activities: a second update of codes and MET
values83,84 to estimate the number of kilocalories to be added to compute the new TDEE
for the days the individuals were exercising as part of the study. The total daily energy
expenditure recommendations for both the exercise days and the non-exercise days
were reduced by 500 kilocalories per day in order to induce a hypocaloric state.
Participants were given separate recommendations for kilocalorie intake for exercise
days and non-exercise days. If the total daily energy expenditure ever be below 1200
58
kilocalories from these calculations, the participant was instructed to consume 1200
kilocalories with the difference between the 1200 kilocalorie recommendation and their
estimated total daily energy expenditure noted.
Participants were given nutrition journals at their initial baseline assessment
meeting so that they could record their daily nutritional intake to stay within their
recommended ranges. Three days (2 week days and 1 weekend day) of the nutrition
logs were requested to be evaluated during weeks 1, 4, and 8 to insure dietary
compliance. The dietary tracking was an issue for some participants, causing not all of
them to complete the dietary logs at all time points. In trying to gain greater compliance,
the participants were told that they could use the MyFitnessPal application to track their
dietary intake as well. Several of the participants utilized this tracking method, which
allowed the researcher to log in and print the food logs from the MyFitnessPal.com
website for comparison and lessen the burden on the participants.
Exercise protocols. The exercise groups met with the training team three times
per week. Exercise protocols were the same for each group with the exception of order
of modalities. Both groups were given their workout plans so that they could begin their
workout in either the cardiovascular machine area of the fitness facility or the weight
room depending on the order of exercise they were assigned to do. They began their
workout with a 5-minute warm up of dynamic movement, consisting of 10 repetitions
each of forward and backward bends, arm circles, figure-four leg standing leg lifts,
forward lunges with a twist toward the front leg, backward leg circles, and low crawls.
The resistance training portion of the workout consisted of a weight lifting routine at a
59
work load of 3-4 sets of 6 repetitions at an intensity of 100% of Six Repetition Maximum
consisting of squat, deadlift, bench press, bent-over row, shoulder press, biceps curls
and triceps extensions exercises.9 The initial workout was used to determine the 6RM
for exercises other than the bench press and deadlift, which were skipped for that initial
workout. In order to assess the 6RM for each exercise other than the bench press and
deadlift, the participants were instructed to perform a warm up set of a weight that easily
allowed them to complete 5 to 10 repetitions. While the participant rested, the weight
was adjusted in order to attempt a set where only 6 repetitions could be completed. If
the participant could complete more than 6 repetitions, the weight was adjusted
upwards for the next 6 repetition maximum attempt. If the participant was unable to
complete 6 repetitions, the weight was adjusted downwards for the next 6 repetition
maximum attempt. This process was repeated until the 6 repetition maximum was
found but with no more than five 6 repetition maximum sets. The process was then
repeated for the next exercise.9 The training weight for the bench press and deadlift
were estimated from the baseline 1RM testing. Therefore, the weight used for the
bench press and deadlift for the 8 weeks of training was 85% of the participants weight
lifted during 1 repetition maximum testing.9, 93-96 For the remainder of their workouts,
participants completed 3 sets of 6 repetitions for weeks 1-4 and 4 sets of 6 repetitions
for weeks 5-8 at the 6RM as estimated from the baseline testing and initial workout.
The cardiovascular exercise portion of the workouts was approximately 30
minutes of exercise done on a treadmill, elliptical machine, stair stepper, exercise cycle,
or track at an intensity of 60% to 70% of estimated VO2MAX. Estimation of speed,
percent grade, steps per minute, and work rate in order to achieve the desired

60
percentage of estimated VO2max were completed using the equations on page 158 of the
ACSM’s Guidelines for Exercise Testing and Prescription book.8 These formulas are
traditionally used to determine the VO2MAX based on the parameters of the exercise.
For this study, the formulas were used algebraically to extrapolate those parameters
from the VO2 desired for the exercise. Therefore, the estimated VO2MAX for each
participant was multiplied by 60% and 70% and those figures used as the VO2 for the
formula so that the speed, percent grade, steps per minute, or work rate could be
determined. These were then listed on a workout card for the participants so that they
could determine the intensity to use on the equipment while performing the exercise.
The participants were allowed to perform their cardiovascular exercise unsupervised
and were trusted to read the monitors on the equipment to stay within the intensity
levels they were given. The participants listed what activity they did each training day
on their workout card, but did not specifically have to list the intensity level at which they
worked.
Regardless of the order of exercise that they were assigned, the participants
were instructed to complete the first portion and then move to the other part of the
building and begin the second portion of their workout within 15 minutes of completing
the initial portion. Both groups completed a cool-down consisting of 3 repetitions of 9
static stretches for each major muscle group held for 15 to 30 seconds each.
Statistical Analyses
Data analysis was conducted utilizing the SPSS statistical software package.
Effect sizes (ES) were calculated via Cohen’s d. Within group changes over time were
analyzed via a paired-samples t-test. Descriptive statistics are presented as mean ±

61
standard deviation. The magnitude of change for each dependent variable produced by
training in the two groups was compared by using a 2 x 2 between-within (mixed)
factorial ANOVA. The alpha or significance criterion was set at 0.05.

62
CHAPTER FOUR
RESULTS
Baseline Differences
When looking at the two different groups, there appear to be no significant
differences between the groups at baseline. The baseline characteristics for each
group are listed in Table 1.
Table 1: Baseline Characteristics by Group
Gro
up
Age
Heig
ht (c
m)
Wei
ght (
kg)
RMR
(kca
l/day
)
Body
Fat
%
Fat M
ass
(kg)
Lean
Bod
y M
ass
(kg)
VO2M
AX (
ml/k
g/m
in)
1 RM
Ben
ch P
ress
(kg)
1 RM
Dea
dlift
(kg)
C-R
n=8
46.8
±6.3
160.7
±8.0
74.5
±10.3
1310.6
±180.6
37.0
±5.4
27.9
±7.0
46.7
±5.5
21.7
±2.8
31.0
±9.6
56.2
±15.4
R-C
n=9
42.4
±6.3
164.5
±8.1
83.4
±20.6
1491.4
±372.4
36.9
±6.5
31.7
±12.6
51.7
±9.0
25.1
±7.0
36.4
±7.9
68.1
±8.5
All data listed as mean ± standard deviation

63
Nutritional Compliance
Of the 17 participants, only 7 (C-R = 5; R-C = 2) completed all three of the
nutritional checks requested. Five participants (C-R = 1; R-C = 4) did not complete any
of the nutritional logs requested. In total 28 of 51 nutritional logs were completed (C-R =
18; R-C = 10). Table 2 shows the average plus or minus the standard deviation for the
recommended kilocalorie intake and the reported kilocalorie intake for each group.
Table 2: Nutritional Data
Recommended Week 1 Week 4 Week 8
C-R 1435 ±431 kcal 1401±176 kcal 1361±274 kcal 1286±685
R-C 1744±446 kcal 1995 ±412 kcal 1896±563 kcal 1693±409 kcal
All data listed as mean ± standard deviation. Recommended is based on the whole group. Weekly data is based on the reported data, which does not include all group members.
Body Composition Changes
Although each group lost marginal amounts of total body weight (C-R = -0.18
±1.8kg, ES = 0.02; R-C = -0.33±1.6kg, ES = 0.02; p=0.866), there were no statistically
significant differences between the groups with regard to the amount of total body
weight lost. There was no statistically significant difference (p=0.318) in the percentage
of body fat lost between the groups, with the C-R group losing an average of 3.2±1.6%
(ES = 0.59) and the R-C group losing an average of 2.3±2.2% (ES = 0.35) body fat.
These losses also did not show statistical significance (p=0.689) with regard to fat mass
lost, with the C-R group losing an average of 2.5±0.9kg (ES = 0.35) and the R-C group
losing an average of 2.0±2.6kg (ES = 0.29) of fat mass. The lean body mass changes

64
between the groups also did not differ significantly (p=0.305) with the C-R group gaining
an average of 2.3±2.1kg (ES = 0.39) and the R-C group gaining an average of
1.7±1.7kg (ES = 0.06) of lean body mass.
When calculating the effect size between the groups, the following were seen:
Body Mass Change: ES = 0.08
Body Fat Percentage Change: ES = 0.89
Body Fat Mass Change: ES = 0.30
Lean Body Mass Change: ES = 0.68
Maximal Strength Changes
When looking at maximal strength, there were no statistically significant
(p=0.741) differences in the change in 1RM bench press between groups. The C-R
group had an average increase in 1RM bench press of 8.0±3.4kg (ES = 0.71) and the
R-C group had an average increase in 1RM bench press of 8.6±4.2kg (ES = 1.05). The
deadlift, however, did show a trend toward a statistically significant (p=0.083) difference,
with the R-C group increasing strength more than the C-R group (R-C +13.5±8.6kg, ES
= 1.15; C-R +6.8±5.6kg, ES = 0.42).
When looking at the effect size between groups, the change in maximal deadlift
had an effect size of 1.50 and the change in bench press had an effect size of 0.30.
Aerobic Capacity Changes
Surprisingly, there was also a trend toward statistical significance (p=0.057) with
regard to the difference in the change in VO2MAX, with the R-C group improving more

65
than the C-R group (R-C +2.8±2.4 ml/kg/min, ES = 0.41; C-R +0.9±1.0 ml/kg/min, ES =
0.31). The between group effect size was calculated at 1.57.
A summary of the mean data and P-values for the changes in each group can be
seen in Table 3.
Table 3: Data Summary
C-R:
Pre-Test C-R: Post-Test
R-C:
Pre-Test
R-C: Post-
Test
P-value: Interaction
Effect
Total Body Mass 74.5 ± 10.3
kg 74.3 ± 10.5 kg
83.4 ± 20.6
kg
83.0 ± 21.4
kg 0.866
Body Fat
Percentage
37.0 ±
5.4 % 33.8 ± 5.6 % *
36.9 ±
6.5 %
34.7 ± 6.2 %
* 0.318
Body Fat Mass 27.9 ± 7.0
kg 25.5 ± 6.9 kg *
31.7 ± 12.6
kg
29.7 ± 12.2
kg * 0.689
Lean Body Mass 46.7 ± 5.5
kg 48.9 ± 6.2 kg *
51.7 ± 9.0
kg
52.2 ± 10.5
kg 0.305
Bench Press
1RM
31.0 ± 9.6
kg 38.9 ± 12.6 kg *
36.4 ± 7.9
kg
45.0 ± 8.4
kg * 0.741

66
Table 3: Data Summary (Continued)
C-R:
Pre-Test
C-R: Post-Test R-C:
Pre-Test
R-C: Post-
Test
P-value:
Interaction Effect
Deadlift
1RM 56.2 ± 15.4 kg 63.1 ± 17.5 kg * 68.1 ± 8.5 kg 81.6 ± 15.0 kg * 0.083
VO2MAX 21.7 ±2.8
ml/kg/min
22.6 ± 2.9
ml/kg/min *
25.1 ± 7.0
ml/kg/min
27.8 ± 6.4
ml/kg/min * 0.057
C-R = Cardiovascular exercise before resistance training group; R-C = Resistance training before cardiovascular exercise group; 1RM = 1 Repetition Maximum; VO2MAX = maximum aerobic capacity; ml/kg/min = milliliters of oxygen per kilogram of bodyweight per minute; * Indicates significant within group changes from pre to post testing (p<0.05)

67
CHAPTER FIVE
DISCUSSION
When looking at the effect sizes within the groups, there is a definite trend toward
practical significance for the protocols used. While neither group showed practical
significance for total body mass lost (R-C ES = 0.02; C-R ES = 0.02) and the R-C group
did not show practical significance for increasing lean body mass (ES = 0.06), all of the
other variables showed at least a small, if not very large, practical significance for
improvement within the 8 week time frame of the study. This would indicate that
regardless of the order chosen by potential exercisers choosing to follow the exercise
plans used, they can expect to see improvements in body composition, maximal
strength, and maximal aerobic capacity.
Population
Unfortunately, this study had a dropout rate of 50%, leaving a small sample size
that did not produce the power the researcher had hoped to achieve. There were 10
participants who dropped from the C-R group and only 7 participants who dropped from
the R-C group. As the participants dropped out of the study, they cited reasons such as
moving or the workout times not fitting into their schedules to justify dropping from the
study. However, one tends to wonder if the participants were trying to be kind to the
researcher when dropping out and might have left due to the delayed onset muscle

68
soreness that is often associated with six-repetition maximum lifting or not caring for the
requirement of indoor cardiovascular exercise as opposed to more enjoyable outdoor
activities.
Nutritional Analysis
While the researcher had hoped to use a dietary analysis to determine the
specifics of the hypocaloric diet that the participants were following to show possible
significance with regard to diet, total body mass and fat mass losses, this was not
achievable due to a lack of subject compliance in completing the dietary logs. With 17
participants, comparing diet logs at weeks one, four, and eight, the study design would
have resulted in analyses of 51 diet logs. Due to subject non-compliance, only 28
complete diet logs were received, a return rate of only 55%. However, when looking at
the compliance rate, 5 of the 7 participants who completed all three of the nutritional
check ins used the MyFitnessPal cell phone app to track their nutritional intake. This
could be because of the fact that the app is primarily used by people who are already
more conscientious about their dietary habits. Hopefully, however, as more and more
people are moving toward more use of technology, this might be a way of improving
compliance with dietary logging in future studies. Regardless, both study groups
combined had a mean loss of total body weight (-0.26 ± 1.7 kg), body fat percentage (-
2.7 ± 1.9 kg), and body fat mass (-2.2 ±1.9 kg), with a gain of lean body mass (+2.0 ±
1.9 kg) and according to the returned logs the average kilocalorie intake of the study
groups declined over the course of the study.
69
Body Composition Changes
When looking at the body composition changes, compared to the previously
mentioned Davitt et al. study, which most closely matched this study’s goals, there were
both similarities and differences. One of the major differences was the age of the
participants with Davitt and colleagues using a traditional college aged population with
an average age of approximately19 years old while the current study used an older
study group with an average age of approximately 46 years old. The Davitt et al. study
showed small but significant increases in total body weight for both their resistance
before endurance (R-E) and endurance before resistance (E-R) groups81, while the
current study showed small but statistically insignificant decreases in total body weight
for both groups. Based on the baseline mean and the body fat percentage changes in
the Davitt et al. article that showed an increase in body fat percentage of 0.64% in the
E-R group and a decrease in body fat percentage of 2.99% in the R-E group, the E-R
group gained ≈0.4kg of fat mass while the R-E group lost ≈1.8kg of fat mass with no
significant difference between the two groups81. The current study also showed no
significant difference between the two groups in either body fat mass or body fat
percentage. Unlike the Davitt et al. E-R group who gained body fat81, the current
study’s C-R group lost an average of 3.2% body fat (C-R -2.5 ± 0.9 kg of fat mass). The
R-C group did not lose as much body fat at only 2.2% (R-C -2.0 ± 2.6 kg fat mass) as
the Davitt et al. R-E group who lost 2.99% body fat81. When looking at lean body mass,
the Davitt. et al. study indicated that both groups had significant increases with the E-R
group increasing 1.2 ± 0.3 kg and the R-E group increasing 0.6 ± 0.6 kg81. While the
current study did not show significance with the increase in lean body mass as the
70
Davitt et al. study did, it also showed increases in both groups for lean body mass (R-C
+1.7 ± 1.7 kg; C-R +2.3 ± 2.1 kg), similarly to the Davitt et al. study. The differences
seen in the changes in body composition between the current study and the Davitt et al.
study seem to indicate that there needs to be further research comparing the two
protocols and various age groups with larger sample sizes to determine which is the
most effective for body composition changes.
While there were no statistically significant changes in any of the body
composition variables when comparing the two groups, calculating the effect size
between the groups shows that there is a practical significance for loss of body fat
percentage (ES = 0.89) and increase of lean body mass (ES = 0.68) with the C-R group
improving more than the R-C group in both cases. Having a Cohen’s d of 0.89 for loss
of body fat percentage would indicate that with this protocol there is a large practical
significance in C-R in order to improve body fat percentage lost. This is regardless of
the fact that there were not enough participants in the study to see statistical
significance. For personal trainers or individual exercisers who are planning a fat loss
program, following this type of protocol in the cardiovascular exercise prior to resistance
training order could improve their results.
Maximal Strength Changes
When looking at the strength changes, the significant change with regard to the
1RM deadlift were not surprising. As was shown in the previously mentioned Kang and
Ratamess review article, performing resistance training prior to cardiovascular training
has been shown to increase strength, power, and hypertrophy75 so increases in 1RM
71
strength should have been expected with both the deadlift and bench press. Wong et
al. 2010 also showed that adding resistance to a cardiovascular program would
increase 1RM tests13, as did Levin et al. 200952. However, the current study does
contradict the results of the Chtara et al. 2008 study showing that there was no
difference in strength or power based on the order of concurrent training77 with regard to
the 1RM deadlift. Perhaps the conflicting results with regard to strength shows that
there are further differences that need to be explored based on the intensity of the
resistance training.
With all of this evidence that strength should have increased in more in both the
1RM deadlift and the 1RM bench press for the R-C group, it is surprising to see that the
between group practical significance for the 1RM bench press was small (ES = 0.30)
while the 1RM deadlift was very large (ES = 1.50). One could wonder if this is related to
the demographics of the current study being only female and older than the traditional
college aged population seen in exercise science research. This should be explored in
future research. Regardless, within group practical significance shows that R-C
increases strength more than C-R in both the 1RM deadlift (R-C ES = 1.15; C-R ES =
0.42) and the 1RM bench press (R-C ES = 1.05; C-R ES = 0.71), showing that if
increased strength is the goal R-C is the better choice for those planning an exercise
program.
Maximal Aerobic Capacity Changes
What was surprising with the current study is that the VO2MAX improved more with
the R-C group than with the C-R group, both with a statistical trend (p = 0.057) and with
72
practical significance (ES = 1.57). While the Wang et al. 2011 study indicated that
performing endurance training prior to resistance training would increase mitochondrial
biogenesis, which could theoretically increase aerobic capacity, they did not include a
study group performing resistance training before cardiovascular training to see if there
is a difference between the order of exercise that could account for greater aerobic
capacity in a resistance before cardiovascular training group49. The previously
mentioned Chtara et al. 200576 and Kang and Ratamess, 201475 articles both stated
that cardiovascular exercise should be done first in order to elicit greater increases in
maximal aerobic power, which is contradictory to the current study results. Although,
Kang and Ratamess do mention that performing resistance exercise first can increase
VO2MAX in the elderly75, seeing their results in a younger population is unexpected since
it had not been seen in the previous research. Perhaps this would indicate that a
concurrent training protocol of resistance training before cardiovascular exercise would
have a shift toward improving aerobic capacity at some specific biological age. Further
research needs to be performed in order to determine if there is a specific time frame or
biological point in development (e.g., puberty, menopause, etc.) when there is a shift
toward an improvement in aerobic capacity from an R-C protocol over a C-R protocol.
Conclusion
In conclusion, while this study did not achieve a significant result with regard to
the research questions pertaining to body composition, the results for aerobic capacity
were very interesting. In the future, additional protocols need to be in place in order to
achieve better compliance with the dietary recommendations and decrease the dropout

73
rate of similar studies. This protocol should also be compared to the protocols of other
studies to see if there is a difference in the results. Finally, similar protocols for
resistance and cardiovascular training should be explored in other populations to see if
there is a difference in results based on gender or age.

74
REFERENCES
1. Ogden CL, Carroll MD, Kit BK, Flegal KM; for the Centers for Disease Control and Prevention. Prevalence of Obesity in the United States, 2009-2010. Hyattsville, MD: US Department of Health and Human Services; January 2012. http://www.cdc.gov/nchs/data/databriefs/db82.pdf. Accessed April 2013.
2. Dee A, Kearns K, O’Neill C, et al. The direct and indirect costs of both overweight and obesity: a systematic review. BMC Research Notes. 2014;7(242).
3. Finkelstein EA, DiBonaventura MD, Burgess SM, Hale BC. The Costs of Obesity in the Worksplace. J Occup Environ Med. October 2010;52(10):971-976.
4. National Institutes of Health, National Heart, Blood, and Lung Institute. Clinical Guidelineson the Identification, Evaluation, and Treatment of Overweight and Obesity in Adults. Bethesda, MD: National Institutes of Health; September 1998. http://www.nhlbi.nih.gov/guidelines/obesity/ob_gdlns.pdf
5. Franz MJ, VanWormer JJ, Crain AL, et al. Weight-Loss Outcomes: A Systematic Review and Meta-Analysis of Weight-Loss Clinical Trials with a Minimum 1-Year Follow-Up. J Am Diet Assoc. October 2007;107(10):1755-1767.
6. Klem ML, Wing RR, McGuire MT, Seagle HM, Hill JO. A descriptive study of individuals successful at long-term maintenance of substantial weight loss. Am J Clin Nutr. 1997;66:239-246.
7. Wing RR, Phelan S. Long-term weight loss maintenance. Am J Clin Nutr. 2005; 82(suppl):222S-225S.
8. Thompson WR, ed. ACSM’s Guidelines for Exercise Testing and Prescription. 8th ed. Baltimore, MD: Wolters Kluwer Lippincott Williams & Wilkins; 2010.
9. Baechle TR, Earle RW, eds. Essentials of Strength Training and Conditioning. 3rd ed. Champaign, IL: Human Kinetics; 2008.
10. Marx JO, Ratamess NA, Nindl BC, et al. Low-volume circuit versus high-volume periodized resistance training in women. Med Sci Sport Exer. April 2001; 33(4):635-643.
11. Davis WJ, Wood DT, Andrews RG, Elkind LM, Davis WB. Concurrent Training Enhances Athletes Strength, Muscle Endurance, and Other Measures. J Strength Cond Res. 2008; 22(5):1487-1502.
12. Talanian JL, Galloway SD, Heigenhauser GJ, Bonen A, Spriet LL. Two weeks of high-intensity aerobic interval training increases the capacity for fat oxidation during exercise in women. J Appl Physiol. 2007; 102:1439-1447.
13. Wong PL, Chaouachi A, Chamari K, Dellal A, Wisloff U. Effect of Preseason Concurrent Muscular Strength and High-Intensity Interval Training in Professional Soccer Players. J Strength Cond Res. 2010; 24(3):653-660.
14. Jones TW, Howatson G, Russell M, French DN. Performance and Neuromuscular Adaptations Following Different Ratios of Concurrent Strength and Endurance Training. J Strength Cond Res. 2013; 27(12):3342-3351.

75
15. Farlex, Inc. Medical Dictionary, Cardiovascular Exercise [Web Page]. 2013. The Free Dictionary Web Site. http://medical-dictionary.thefreedictionary.com/cardiovascular+exercise.
16. Kaminski LA, ed. ACSM’s Health-Related Physical Fitness Assessment Manual. 3rd ed. Baltimore, MD: Wolters Kluwer Lippincott Williams & Wilkins; 2010.
17. Farlex, Inc. Medical Dictionary, Aerobic Exercise [Web Page]. 2013. The Free Dictionary Web Site. http://medical-dictionary.thefreedictionary.com/aerobic+exercise.
18. Farlex, Inc. Medical Dictionary, Strength Training [Web Page]. 2013. The Free Dictionary Web Site. http://medical-dictionary.thefreedictionary.com/strength+training.
19. Kravitz L. The Effect of Concurrent Training [Web Page]. 2013. IDEA Health & Fitness Association. http://www.ideafit.com/fitness-library/concurrent-training.
20. Wilborn C, Beckham J, Campbell B, et al. Obesity: Prevalence, Theories, Medical Consequences, Management, & Research Directions. Journal of the International Society of Sports Nutrition. 2005; 2(2):4-31.
21. Sahlin K, Mogensen M, Bagger M, Fernstrom M, Pedersen PK. The Potential for mitochondrial fat oxidation in human skeletal muscle influences whole body fat oxidation during low-intensity exercise. Am J Physiol Endocrinol Metab. 2007; 292:E223-E230.
22. Jeukendrup AE. Regulation of Fat Metabolism in Skeletal Muscle. Ann NY Acad Sci. 2002; 967:217-235.
23. Pruchnic R, Katsiaras A, He J, Kelley DE, Winters C, Goodpaster BH. Exercise training increases intramyocellular lipid and oxidative capacity in older adults. Am J Physiol Endocrinol Metab. June 29, 2004; 287:E857-E862.
24. Van Aggel-Leijssen DP, Saris WH, Wagenmakers AJ, Senden JM, VanBaak MA. Effect of exercise training at different intensities on fat metabolism of obese men. J Appl Physiol. 2002; 92:1300-1309.
25. Romijn JA, Coyle EF, Sidossis LS, Rosenblatt J, Wolfe RR. Substrate metabolism during different exercise intensities in endurance trained women. J Appl Pysiol. 2000; 88:1707-1714.
26. VanLoon LJ, Greenhaff PL, Constantin-Teodosiu D, Saris WH, Wagenmakers AJ. The effects of increasing exercise intensity on muscle fuel utilization in humans. J Physiol. 2001; 536(1):295-304.
27. Maffeis C, Zaffanello M, Pellegrino M, et al. Nutrient Oxidation during Moderately Intense Exercise in Obese Prepubertal Boys. J Clin Endocr Metab. 2005; 90(1):231-236.
28. Venables MC, Achten J, Jeukendrup AE. Determinants of fat oxidation during exercise in healthy men and women: a cross-sectional study. J Appl Physiol. 2005; 98:160-167.
29. Melanson EL, Sharp TA, Seagle HM, et al. Effect of exercise intensity on 24-h energy expenditure and nutrient oxidation. J Appl Physiol. 2002; 92:1045-1052.
76
30. Soloman TP, Sistrun SN, Krishnan RK, et al. Exercise and diet enhance fat oxidation and reduce insulin resistance in older obese adults. J Appl Physiol. 2008; 104:1313-1319.
31. Kerksick CM, Wilborn CD, Campbell BI, et al. Early-Phase Adaptations to a Split-Body, Linear Periodized Resistance Training Program in College-Aged and Middle-Aged Men. J Strength Cond Res. 2009; 23(3):962-971.
32. Lo MS, Lin LL, Yao WJ, Ma MC. Training and Detraining Effects of the Resistance vs. Endurance Program on Body Composition, Body Size, and Physical Performance in Young Men. J Strength Cond Res. 2011; 25(8):2246-2254.
33. Makovey J, Naganathan V, Sambrook P. Gender differences in relationships between body composition components, their distribution, and bone mineral density: a cross-sectional opposite sex twin study. Osteoporos Int. 2005; 16:1495-1505.
34. Hakkinen A, Hakkinen K, Hannonen P, Alen M. Strength training induced adaptations in neuromuscular function of premenopausal women with fibromyalgia: comparison with healthy women. Ann Rheum Dis. 2001; 60:21-26.
35. Melby C, Scholl C, Edwards G, Bullough R. Effect of acute resistance exercise on postexercise energy expenditure and resting metabolic rate. J Appl Physiol. October 1993; 75(4):1847-1853.
36. Campbell WW, Crim MC, Young VR, Evans WJ. Increased energy requirements and changes to body composition with resistance training in older adults. Am J Clin Nutr. 1994; 60:167-175.
37. VanEtten LM, Westerterp KR, Verstappen FT, Boon BJ, Saris WH. Effect of an 18-wk weight-training program on energy expenditure and physical activity. J Appl Physiol. 1997; 82:298-304.
38. Poehlman ET, Denino WF, Beckett T, et al. Effects of Endurance and Resistance Training on Total Daily Energy Expenditure in Young Women: A Controlled Randomized Trial. J Clin Endocr Metab. 2002; 87(3):1004-1009.
39. Hunter GR, Wetzstein CJ, Fields DA, Brown A, Bamman MM. Resistance training increases total energy expenditure and free-living physical activity in older adults. J Appl Physiol. 2000; 89:977-984.
40. Ades PA, Savage PD, Brochu M, Tischler MD, Lee NM, Poehlman ET. Resistance training increases total daily energy expenditure in disabled older women with coronary heart disease. J Appl Physio. 2005; 98:1280-1285.
41. Kirk EP, Donnelly JE, Smith BK, et al. Minimal resistance training improves daily energy expenditure and fat oxidation. Med Sci Sport Exer. May 2009; 41(5):1122-1129.
42. Ormsbee MJ, Choi MD, Medlin JK, et al. Regulation of fat metabolism during resistance exercise in sedentary lean and obese men. J Appl Physiol. 2009; 106:1529-1537.
43. DaSilva RL, Brentano MA, Kruel LF. Effects of Different Strength Training Methods on Postexercise Energetic Expenditure. J Strength Cond Res. 2010; 24(8):2255-2260.
44. Candow DG, Chilibeck PD, Abeysekara S, Zello GA. Short-Term Heavy Resistance Training Eliminates Age-Related Deficits in Muscle Mass and Strength in Healthy Older Males. J Strength Cond Res. 2011; 25(2):326-333.

77
45. Alcaraz PE, Perez-Gomez J, Chavarrias M, Blazevich AJ. Similarity in Adaptations to High-Resistance Circuit vs. Traditional Strength Training in Resistance Trained Men. J Strength Cond Res. 2011; 25(9):2519-2527.
46. Colado JC, Garcia-Masso X, Rogers ME, Tella V, Benavent J, Dantas EH. Effects of Aquatic and Dry Land Resistance Training Devices on Body Composition and Physical Capacity in Postmenopausal Women. J Hum Kinet. 2012; 32:185-195.
47. Sundell J. Resistance Training Is An Effective Tool Against Metabolic and Frailty Syndromes. Advances in Preventive Medicine. 2011; 2011:1-7. http://www.ncbi.nlm.nih.gov/pmc/articles/PMC3168930/pdf/AMP2011-984683.pdf. Accessed 2013.
48. Sedano S, Marin PJ, Cuadrado G, Redondo JC. Concurrent Training in Elite Male Runners: The Influence of Strength Versus Muscular Endurance Training on Performance Outcomes. J Strength Cond Res. 2013; 27(9):2433-2443.
49. Wang L, Mascher H, Psilander N, Blomstrand E, Sahlin K. Resistance exercise enhances the molecular signaling of mitochondrial biogenesis induced by endurance exercise in human skeletal muscle. J Appl Physiol. 2011; 111:1335-1344.
50. Davis WJ, Wood DT, Andrews RG, Elkind LM, Davis WB. Concurrent Training Enhances Athletes Cardiovascular and Cardiorespiratory Measures. J Strength Cond Res. 2008; 22(5):1503-1514.
51. Shaw BS, Shaw I. Compatibility of concurrent aerobic and resistance training on maximal aerobic capacity in sedentary males. Cardiovasc J Afr. April 2009; 20(2):104-106.
52. Levin GT, McGuigan MR, Laursen PB. Effect of Concurrent Resistance and Endurance Training on Physiologic and Performance Parameters of Well-Trained Endurance Cyclists. J Strength Cond Res. 2009; 23(8):2280-2286.
53. Izquierdo M, Hakkinen K, Ibanez J, Kraemer WJ, Gorostiaga EM. Effects of combined resistance and cardiovascular training on strength, power, muscle cross-sectional area, and endurance markers in middle-aged men. Eur J Appl Physiol. 2004; 94:70-75.
54. Santos AP, Marinho DA, Costa AM, Izquierdo M, Marques MC. The Effects of Concurrent Resistance and Endurance Training Follow a Detraining Period in Elementary School Students. J Strength Cond Res. 2012; 26(6):1708-1716.
55. Shaw BS, Shaw I, Brown GA. Comparison of Resistance and Concurrent Resistance and Endurance Training Regimes in the Development of Strength. J Strength Cond Res. December 2009; 23(9):2507-2514.
56. Cadore EL, Pinto RS, Pinto SS, et al. Effects of Strength, Endurance, and Concurrent Training on Aerobic Power and Dynamic Muscular Economy in Elderly Men. J Strength Cond Res. 2011; 25(3):758-766.
57. Wilson JM, Marin PJ, Rhea MR, Wilson SM, Loenneke JP, Anderson JC. Concurrent Training: A Meta-Analysis Examining Interference of Aerobic and Resistance Exercise. J Strength Cond Res. 2012; 26(8):2293-2307.
58. Dolezal BA, Potteiger JA. Concurrent resistance and endurance training influence basal metabolic rate in nondieting individuals. J Appl Physiol. 1998; 85(2):695-700.
59. Nindl BC, Harman EA, Marx JO, et al. Regional body composition changes in women after 6 months of periodized physical training. J Appl Physiol. 2000; 88:2251-2259.

78
60. McCarthy JP, Pozniak MA, Agre JC. Neuromuscular adaptations to concurrent strength and endurance training. Med Sci Sport Exer. March 2002; 34(3):511-519.
61. Balabinis CP, Psarakis CH, Moukas M, Vassiliou MP, Behrakis PK. Early Phase Changes by Concurrent Endurance and Strength Training. J Strength Cond Res. 2003; 17(2):393-401.
62. Glowacki SP, Martin SE, Maurer A, Baek W, Green JS, Crouse SF. Effects of Resistance, Endurance, and Concurrent Exercise Training Outcomes in Men. Med Sci Sport Exer. December 2004; 36(12):2119-2127.
63. Sillanpaa E, Laaksonen DE, Hakkinen A, et al. Body composition, fitness, and metabolic health during strength and endurance training and their combination in middle-aged and older women. Eur J Appl Physiol. 2009; 106:285-296.
64. Arazi H, Faraji H, Moghadam MG, Samadi A. Effects of Concurrent Exercise Protocols on Strength Aerobic Power, Flexibility, and Body Composition. Kinesiology. 2011; 43(2):155-162.
65. Willis LH, Slentz CA, Bateman LA, et al. Effects of aerobic and/or resistance training on body mass and fat mass in overweight or obese adults. J Appl Physiol. December 15, 2012; 113(12):1831-1837.
66. Hunter GR, Bickel CS, Fisher G, Neumeier WH, McCarthy JP. Combined Aerobic and Strength Training and Energy Expenditure in Older Women. Med Sci Sport Exer. July 2013; 45(7):1386-1393.
67. Fisher G, McCarthy JP, Zuckerman PA, Bryan DR, Bickel CS, Hunter GR. Frequency of Combined Resistance and Aerobic Training in Older Women. J Strength Cond Res. 2013; 27(7):1868-1876.
68. Sanal E, Ardic F, Kirac S. Effects of aerobic or combined aerobic resistance exercise on body composition in overweight and obese adults: gender differences. A randomized intervention study. Eur J Phys Rehabil Med. 2013; 49(1):1-11.
69. Kerksick C, Thomas A, Campbell B, et al. Effects of a popular exercise and weight loss program on weight loss, body composition, energy expenditure, and health in obese women. Nutr Metabolism. May 14, 2009; 6:23.
70. Kerksick CM, Wismann-Bunn J, Fogt D, et al. Changes in weight loss, body composition, and cardiovascular disease risk after altering macronutrient distributions during a regular exercise program in obese women. Nutr J. November 22, 2010; 9:59.

79
71. Whatley JE, Gillespie WJ, Honig J, Walsh MJ, Blackburn AL, Blackburn GL. Does the amount of endurance exercise in combination with weight training and a very-low energy diet affect resting metabolic rate and body composition? Am J Clin Nutr. 1994; 59:1088-1092.
72. Kraemer WJ, Volek JS, Clark KL, et al. Influence of exercise training on physiological and performance changes with weight loss in men. Med Sci Sport Exer. September 1999; 31(9):1320-1329.
73. Davis JN, Tung A, Chak SS, et al. Aerobic and Strength Training Reduces Adiposity in Overweight Latina Adolescents. Med Sci Sport Exer. July 2009; 41(7):1494-1503.
74. Vilaca J, Bottaro M, Santos C. Energy Expenditure Combining Strength and Aerobic Training. J Hum Kinet. 2011; Special Issue:21-25.
75. Kang J, Ratamess N. Which Comes First? Resistance Before Aerobic Exercise or Vice Versa? ACSMS Health Fit J. 2014;18(1):9-14.
76. Chtara M, Chamari K, Chaouachi M, et al. Effects of intra-session concurrent endurance and strength training sequence on aerobic performance and capacity. Br J Sports Med. 2005; 39:555-560.
77. Chtara, M, Chaouachi A, Levin GT, et al. Effect of Concurrent Endurance and Circuit Resistance Training Sequence on Muscular Strength and Power Development. J Strength Cond Res. 2008; 22(4):1037-1045.
78. Rosa G, Dantas EH, Braga de Mello D. The Response of serum leptin, cortisol, and zinc concentrations to concurrent training. Hormones. 2011; 10(3):215-221.
79. Cadore EL, Izquierdo M, Gonclaves dos Santos M, et al. Hormonal Responses to Concurrent Strength and Endurance Training with Different Exercise Orders. J Strength Cond Res. 2012; 26(12):3281-3288.
80. Alves JV, Saavedra F, Simao R, et al. Does Aerobic and Strength Exercise Sequence in the Same Session Affect the Oxygen Uptake During and Postexercise? J Strength Cond Res. 2012; 26(7):1872-1878.
81. Davitt PM, Pellegrino JK, Schanzer JR, Tjionas H, Arent SM. The Effects of a Combined Resistance Training and Endurance Program in Inactive College Female Subjects: Does Order Matter? J Strength Cond Res. 2014; 28(7):1937-1945.
82. Ehrman JK, ed. ACSM’s Resource Manual for Guidelines for Exercise Testing and Prescription. 6th ed. Baltimore, MD: Wolters Kluwer Lippincott Williams & Wilkins; 2010.
83. Ainsworth BE, Haskell WL, Herrmann SD, et al. 2011 Compendium of Physical Activities: a second update of codes and MET values. Med Sci Sports Exerc. 2011; 43(8):1575-1581.
84. Ainsworth BE, Haskell WL, Herrmann SD, et al. The Compendium of Physical Activities Tracking Guide. [Web Page] Healthy Lifestyles Research Center, College of Nursing & Health Innovation, Arizona State University. Retrieved November 19, 2014. https://sites.google.com/site/compendiumofphysicalactivities/home
85. Jackson AS, Pollock ML. Practical assessment of body composition. Phys Sport Med. 1985; 13:76-90
86. Pollock ML, Schmidt DH, Jackson AH. Measurement of cardiorespiratory fitness and body composition in the clinical setting. Comp Ther. 1980; 6:7-12.

80
87. Centers for Disease Control. Healthy Weight—it’s not a diet it’s a lifestyle! http://www.cdc.gov/healthyweight/assessing/bmi/adult_bmi/index.html#Other%20Ways.
88. Rosenbloom CA, ed. Sports Nutrition A Practice Manual for Professionals. 5th ed. Chicago, IL: Academy of Nutrition and Dietetics; 2012.
89. Williams, MH. Nutrition for Health, Fitness, & Sport. 9th ed. New York, NY: McGraw Hill Higher Education; 2010.
90. Bouchard C, Blair SN, Haskell WL, eds. Physical Activity and Health. 2nd ed. Champaign, IL: Human Kinetics; 2012.
91. Brooks GA, Butte NF, Rand WM, Flatt JP, Caballero B. Chronicle of the Institute of Medicine physical activity recommendation: how a physical activity recommendation came to be among dietary recommendations. Am J Clin Nutr. 2004; 79(suppl):921S-930S.
92. Institute of Medicine. Dietary Reference Intakes: energy, carbohydrate, fiber, fat, fatty acids, cholesterol, protein, and amino acids. Washington, DC: National Academy Press, 2002. http://www.nap.edu/books/0309085373/html
93. Chapman PP, Whitehead JR, Binkerrt RH. The 225-lb reps-to-fatigue test as a submaximal estimate of 1RM bench press performance in college football players. J Strength Cond Res. 2012; 12(4):258-261.
94. Lander J. Maximum based on reps. NSCA J. 1984; 6(6):60-61. 95. Mayhew JL, Ball TE, Arnold ME, Bowen JC. Relative muscular endurance
performance as a predictor of bench press strength in college men and women. J Appl Sport Sci Res. 1992; 6(4):200-206.
96. Morales J, Sobonya S. Use of submaximal repetition tests for predicting 1-RM strength in class athletes. J Strength Cond Res. 1996; 10(3):186-189.

81
APPENDICES
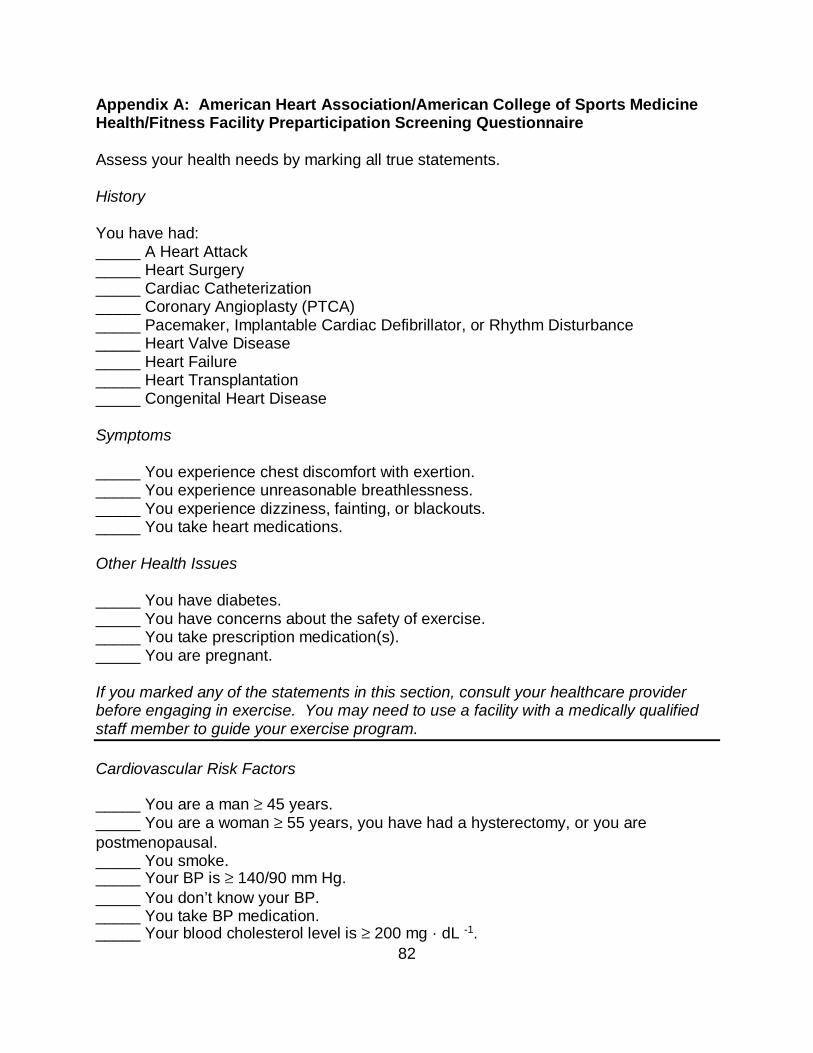
82
Appendix A: American Heart Association/American College of Sports Medicine Health/Fitness Facility Preparticipation Screening Questionnaire Assess your health needs by marking all true statements. History You have had: _____ A Heart Attack _____ Heart Surgery _____ Cardiac Catheterization _____ Coronary Angioplasty (PTCA) _____ Pacemaker, Implantable Cardiac Defibrillator, or Rhythm Disturbance _____ Heart Valve Disease _____ Heart Failure _____ Heart Transplantation _____ Congenital Heart Disease Symptoms _____ You experience chest discomfort with exertion. _____ You experience unreasonable breathlessness. _____ You experience dizziness, fainting, or blackouts. _____ You take heart medications. Other Health Issues _____ You have diabetes. _____ You have concerns about the safety of exercise. _____ You take prescription medication(s). _____ You are pregnant. If you marked any of the statements in this section, consult your healthcare provider before engaging in exercise. You may need to use a facility with a medically qualified staff member to guide your exercise program. Cardiovascular Risk Factors _____ You are a man ≥ 45 years. _____ You are a woman ≥ 55 years, you have had a hysterectomy, or you are postmenopausal. _____ You smoke. _____ Your BP is ≥ 140/90 mm Hg. _____ You don’t know your BP. _____ You take BP medication. _____ Your blood cholesterol level is ≥ 200 mg · dL -1.
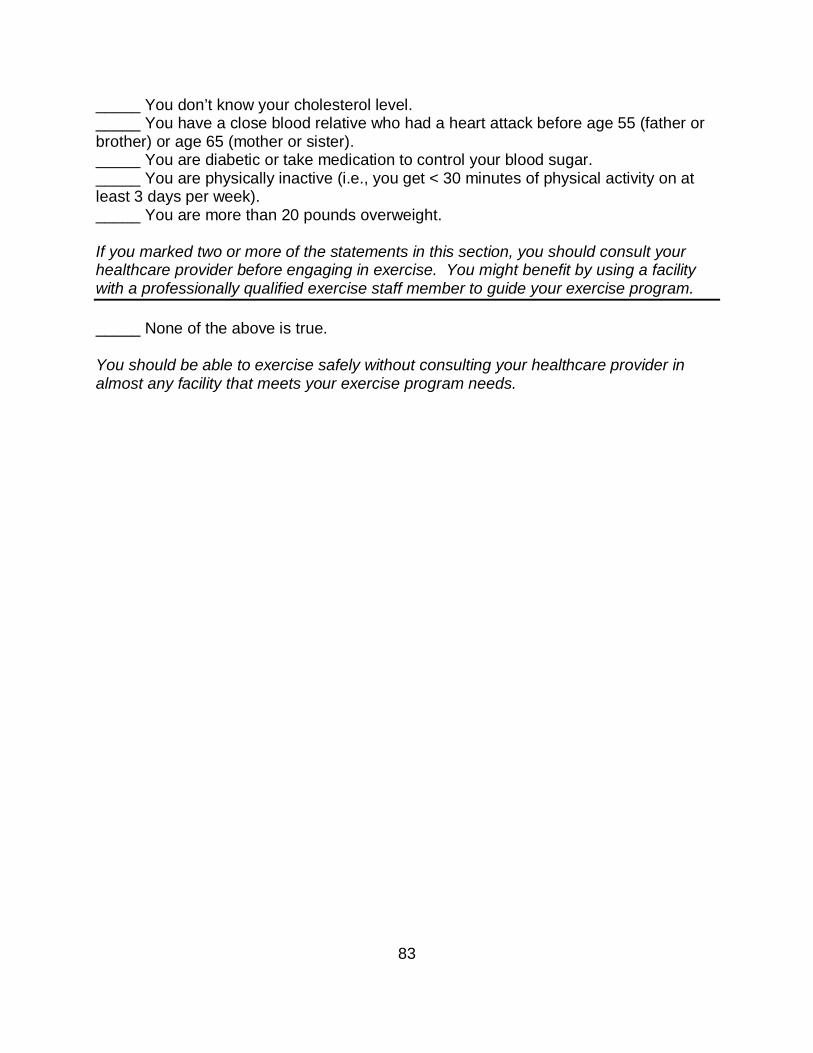
83
_____ You don’t know your cholesterol level. _____ You have a close blood relative who had a heart attack before age 55 (father or brother) or age 65 (mother or sister). _____ You are diabetic or take medication to control your blood sugar. _____ You are physically inactive (i.e., you get < 30 minutes of physical activity on at least 3 days per week). _____ You are more than 20 pounds overweight. If you marked two or more of the statements in this section, you should consult your healthcare provider before engaging in exercise. You might benefit by using a facility with a professionally qualified exercise staff member to guide your exercise program. _____ None of the above is true. You should be able to exercise safely without consulting your healthcare provider in almost any facility that meets your exercise program needs.

84
Appendix B: Demographics Questionnaire Personal Information Name: ________________________________________________________ Address: ______________________________________________________ City: ____________________ State: ____ Zip Code: _______________ Home Phone: (___) _______________ Work Phone: (___) ______________ Cell Phone: (___) _______________ Email address: _________________________________________________ Birth date: ___ /___ /____ Age: ____ Height: _____ Weight: ______ Race: ________________ Highest Education Level: ______________ Previous Diet History: ___________________________________________ ______________________________________________________________ Exercise History/Activity Questionnaire 1. Describe your typical recreational activities: _________________________ ______________________________________________________________ ______________________________________________________________ ______________________________________________________________ 2. Describe any exercise training that you routinely participate: ___________ ______________________________________________________________ ______________________________________________________________ ______________________________________________________________ 3. How many days per week do you exercise/participate in these activities? ______________________________________________________________ 4. How many hours per week do you train? __________________________ 5. How long (years/months) have you been consistently training? _________ ______________________________________________________________
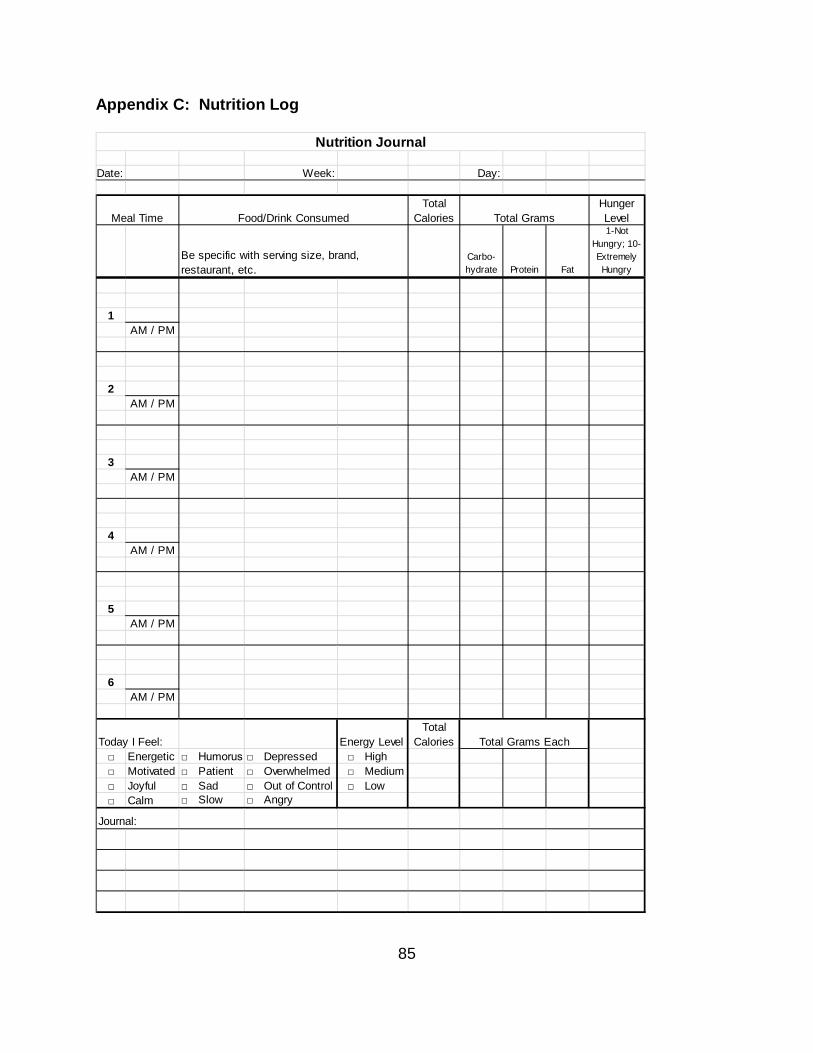
85
Appendix C: Nutrition Log
Date: Week: Day:
Total Calories
Hunger Level
Carbo-hydrate Protein Fat
1-Not Hungry; 10-Extremely Hungry
1AM / PM
2AM / PM
3AM / PM
4AM / PM
5AM / PM
6AM / PM
Today I Feel: Energy LevelTotal
Calories□ Energetic □ Humorus □ Depressed □ High□ Motivated □ Patient □ Overwhelmed □ Medium□ Joyful □ Sad □ Out of Control □ Low□ Calm □ Slow □ Angry
Journal:
Total Grams Each
Meal Time Total Grams
Nutrition Journal
Food/Drink Consumed
Be specific with serving size, brand, restaurant, etc.
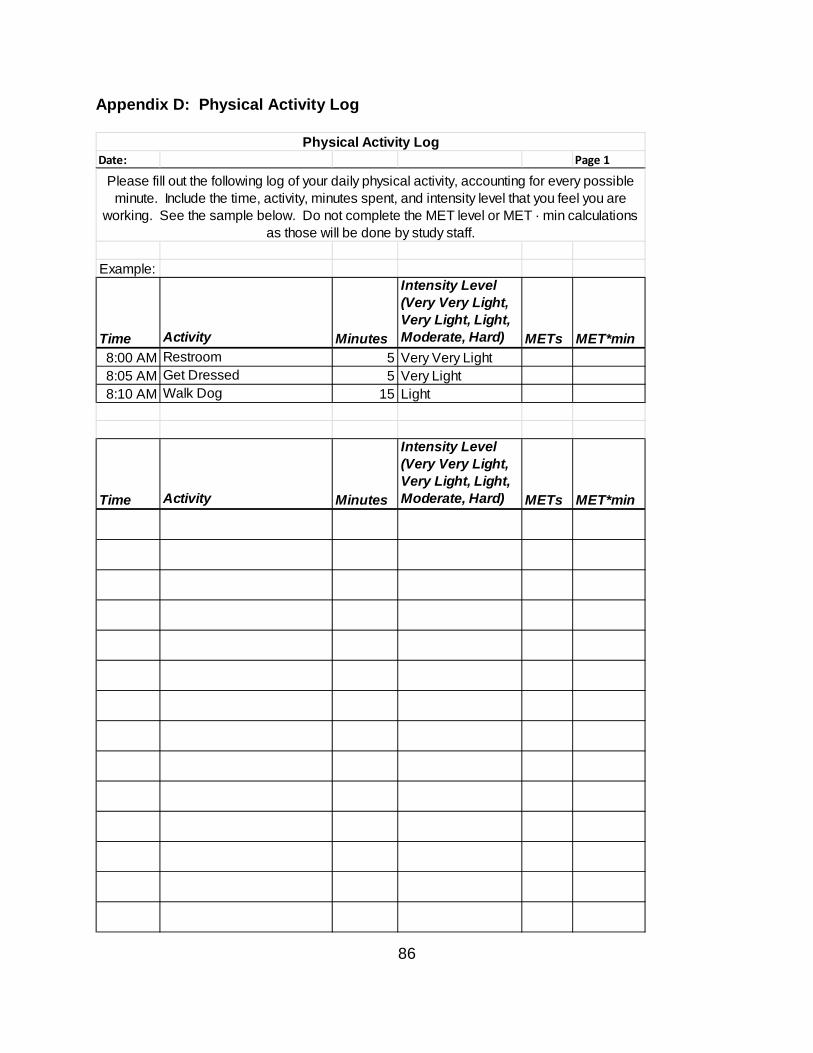
86
Appendix D: Physical Activity Log
Date: Page 1
Example:
Time Activity Minutes
Intensity Level (Very Very Light, Very Light, Light, Moderate, Hard) METs MET*min
8:00 AM Restroom 5 Very Very Light8:05 AM Get Dressed 5 Very Light8:10 AM Walk Dog 15 Light
Time Activity Minutes
Intensity Level (Very Very Light, Very Light, Light, Moderate, Hard) METs MET*min
Please fill out the following log of your daily physical activity, accounting for every possible minute. Include the time, activity, minutes spent, and intensity level that you feel you are
working. See the sample below. Do not complete the MET level or MET · min calculations as those will be done by study staff.
Physical Activity Log
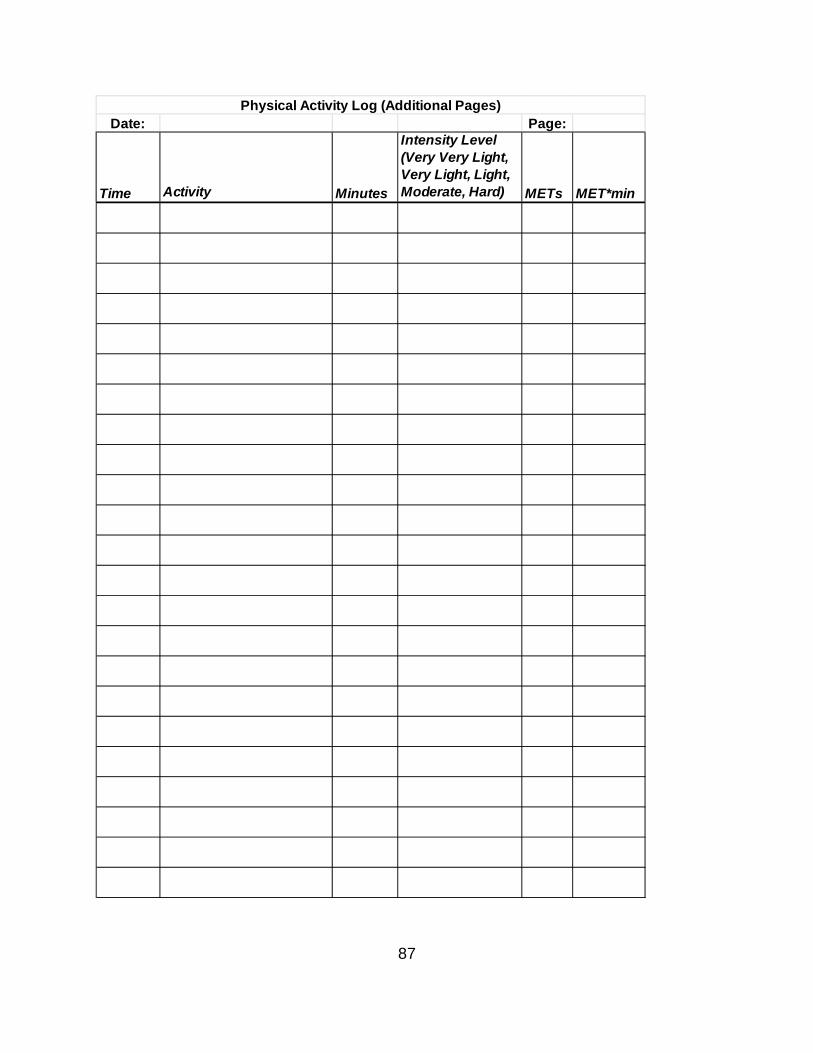
87
Date: Page:
Time Activity Minutes
Intensity Level (Very Very Light, Very Light, Light, Moderate, Hard) METs MET*min
Physical Activity Log (Additional Pages)

88
Appendix E: IRB Approval Letter
Dear Dr. Davis-Miller: On 2/17/2015, the Institutional Review Board (IRB) reviewed and APPROVED the above application and all documents outlined below.
Approved Item(s): Protocol Document(s): AHA/ACSM Health/Fitness Facility Preparticipation Screening Questionnaire
Assessment Log.xlsx
Daily Nutritional Recommendations.xlsx
Demographics Questionnaire
Research Proposal
Research Proposal with Track Changes
Workout Record.xlsx
Consent/Assent Document(s)*: Informed Consent .pdf
*Please use only the official IRB stamped informed consent/assent document(s) found under the "Attachments" tab. Please note, these consent/assent document(s) are only valid during the approval period indicated at the top of the form(s). At the convened meeting, the IRB determined the review type of this minimal risk study be changed from full board to expedited category 9 (Continuing review of research, not conducted under an investigational new drug application or investigational device exemption where categories two (2) through eight (8) do not apply but the IRB has determined and documented at a convened meeting that the research involves no greater than minimal risk and no additional risks have been identified.).
As the principal investigator of this study, it is your responsibility to conduct this study in accordance with IRB policies and procedures and as approved by the IRB. Any changes to the approved research must be submitted to the IRB for review and approval by an amendment. We appreciate your dedication to the ethical conduct of human subject research at the University of South Florida and your continued commitment to human research protections. If you have any questions regarding this matter, please call 813-974-5638.

89
Sincerely,
E. Verena Jorgensen, M.D., Chairperson USF Institutional Review Board
ABOUT THE AUTHOR
Tonya Davis-Miller has been a certified personal trainer since May of 1996. After
that first personal training certification, she was hooked on exercise and went back for
multiple certifications in group exercise, aquatic exercise, Pilates, yoga, and nutrition, as
well as continuing education courses in many other modalities of exercise. After years
of working her way up to managing local gyms and seeing the trend toward more and
more people with illnesses, injuries, and diseases needing more training then she was
educated to give, she opted to go back to college so that she could continue to grow as
a trainer. She obtained her Associate of Science in Allied Health with a concentration in
Sports Medicine and Bachelor of Science in Exercise Physiology with a minor in
Nutritional Science. As part of her college education, she obtained certification from the
American College of Sports Medicine as a Certified Clinical Exercise Physiologist and
from the National Strength and Conditioning Association as a Certified Strength and
Conditioning Specialist. In addition to working toward her Masters, she also works as
an adjunct professor of weight training, personal trainer, group exercise instructor, and
certification workshop instructor.