the effect of entry by wal-mart …ageconsearch.umn.edu/bitstream/21101/1/sp06ma03.pdfthe effect of...
TRANSCRIPT
THE EFFECT OF ENTRY BY WAL-MART SUPERCENTERS ON RETAIL
GROCERY CONCENTRATION
Bobby J. Martensa,*
, Frank Dooleyb, and Sounghun Kim
c
a Bobby J. Martens is an assistant professor of logistics and supply chain management, College of Business and Institute for Food Safety and Security; Iowa State University. b Frank Dooley is a professor, Department of Agricultural Economics, Purdue University. c Sounghun Kim is a Ph.D. candidate, Department of Agricultural Economics- Purdue University.
* Telephone: 515-294-5007; Email: [email protected], Address: Iowa State University, 2340 Gerdin Business Building, Ames, IA 50010.
Selected Paper prepared for presentation at the
2006 America Agricultural Economics Association Annual Meeting, Long Beach, CA
Copyright 2006 by Martens, Dooley, and Kim. All rights reserved. Readers may make
verbatim copies of this document for non-commercial purposes by any means, provided
that this copyright notice appears on such copies.

2
ABSTRACT
The U.S. retail grocery industry shifted from an industry dominated by small
grocers serving local markets to one characterized by large retailers present in
international markets. Average retail grocery concentration as measured by CR4
increased from 17.8 in 1982 to 43.0 in 1999 (U.S. Census Bureau, 1982; Trade
Dimensions Marketing Guidebook, 2000). Wal-Mart’s tremendous growth is the catalyst
to this change. Although Wal-Mart has been studied from multiple perspectives, little is
known about Wal-Mart’s effect on market concentration. Understanding Wal-Mart’s
influence on market concentration is important because an extensive literature shows a
pattern linking retail grocery market concentration to increases in retail grocery prices.
The objective of this analysis is to evaluate the effects of de novo entry by Wal-
Mart Supercenters on retail grocery concentration (CR4). Using a panel dataset complied
from Trade Dimensions Marketing Guidebook and Market Scope publications, the effect
of Wal-Mart Supercenters on changes in retail grocery concentration was estimated. The
results show that existing Wal-Mart Supercenter operations and entry by Wal-Mart
Supercenters significantly increase the rate of change in retail grocery concentration as
measured by CR4.
INTRODUCTION
During the past two decades, the U.S. retail grocery industry has seen a
contraction of small “Mom and Pop” retailers,1 mergers and acquisitions among large
retailers, and the emergence of a new, large supercenters stores (Wal-Mart, Target, K-
1 The number of small supermarkets decreased by 15.5 percent from 1999 to 2002 (U.S. Bureau of Census, 2005).
3
Mart) (Kaufman, 2002). In addition, average retail grocery concentration as measured by
CR4 increased from 17.8 in 1982 to 43.0 in 1999 (U.S. Census Bureau, 1982; Trade
Dimensions Marketing Guidebook, 2000).2 Grocery shifted from an industry dominated
by small grocers serving local markets to one characterized by large retailers present in
international markets. The growth of Wal-Mart Supercenters is explained by many
factors, including supply chain management and logistics strategies which drastically
lower costs compared with traditional grocers, fewer weekly trips to supermarkets by
consumers, and evolving store formats. These larger retailers enjoy a lower cost
structure, combined with expertise in marketing, store design, and shelf space allocations.
Concerns have arisen that large grocers are using these advantages to reduce
consumer access to local groceries (Blanchard and Lyson, 2002), increase retailer market
power (Foer, 1999), and discourage competition (FTC Report, 2001). Wal-Mart is often
at the heart of the media’s reporting of the grocery industry’s changes, due in part to its
rapid growth and size.3
Wal-Mart’s tremendous growth is the catalyst to this change. In 1987 Wal-Mart
did not sell a full line of groceries. By 2002, the company surpassed Kroger Foods to
become the largest retail grocer in the United States. This rapid growth is expected to
continue, with one prediction that Wal-Mart will control 35 percent of the U.S. retail
grocery sales for many consumer products by 2010 (Clarke, 2005). Although Wal-Mart
has been studied from multiple perspectives, little is known about Wal-Mart’s effect on
2 CR4 is the market share of the top 4 retail grocery firms. CR4 in the grocery marketing areas (GMAs) used in this
study increased 6 points from 1999 to 2002, from 59.8 to 65.8 (Trade Dimensions, 1999-2000 and 2002-2003). 3 A few of the hundreds of newspaper articles, radio commentaries, television documentaries, and news stories include
National Public Radio’s series “Is Wal-Mart Good for America?” (Smith, 2004), The Los Angeles Times’ Pulitzer
Prize winning series of articles on Wal-Mart (Cleeland and Goldman, 2003), and The Economist’s “How Big Can It
Grow” article (2004). These reports, although often based on inferential analysis and anecdotes, identify important
changes occurring in the grocery industry.
4
market concentration. Understanding Wal-Mart’s influence on market concentration is
important because an extensive literature shows a pattern linking retail grocery market
concentration to increases in retail grocery prices.
Yu and Connor (2002) note that only the banking and airline industries have
received more empirical price-concentration analysis than the retail grocery industry. Of
the many published price-concentration studies in the grocery industry (Marion et al.,
1979; Lamm, 1981; Cotterill, 1986; Kaufman and Handy, 1989; Weiss, 1989; Anderson,
1990; Newmark, 1990; Cotterill and Harper, 1995; Binkley and Connor, 1998; Cotterill,
1999), only two (Kaufman and Handy, 1989 and Newmark, 1990) did not find a positive
relationship between market concentration and price. Moreover, the findings in both of
those studies have been refuted by Cotterill (1993) and Yu and Connor (2002). Since
high concentration levels increase retail grocery prices, understanding the determinants of
retail grocery concentration is important.
Contrary to the findings of traditional retail grocery concentration-price literature,
Wal-Mart entry is associated with reduced retail grocery prices, not increasing prices.
There has been research evaluating whether efficiency gains associated with large stores
offset the higher mark-ups resulting from increased market concentration in the retail
grocery industry. Dobson and Waterson (1997) found that higher mark-ups are offset by
discounts arising from greater efficiency. They conclude that the effects from changes in
market structure depend on the relationship between market power and scale economies.
Aalto-Setala (2002) evaluated increasing returns, concentration, and market power in the
Finnish retail grocery industry. “There is no need to constrain directly the growth of
larger stores (in Finland) from an anti-trust perspective as long as there is sufficient

5
competition” (Aalto-Setala, 2002). Therefore, although cost efficiencies from scale
economies appear to off-set at least part of the mark-up resulting from increased market
concentration, competition remains important.
In the US, the Robinson-Patman Act, which is concerned with large buyers
harming smaller buyers by eliciting large discounts from suppliers, adds to the
importance of understanding market concentration in the grocery industry. The reality of
or even the consideration of enforcement of the Robinson-Patman Act began in 1999
when the American Antitrust Agency (AAI) and Wakefern Food Corporation petitioned
the Federal Trade Commission to recognize that retail grocery concentration is high
enough to trigger the use of the Robinson-Patman Act. As of 2006, the Robinson-Patman
Act has not been used to discourage modern retail concentration levels.
Understanding the primary causes of retail grocery market concentration is
important because of the strong relationship between concentration and price. The
popular media often blames Wal-Mart for putting small grocery retailers out of business,
but a literature review found no studies that clearly link Wal-Mart and market
concentration. Therefore, the objective of this analysis is to evaluate the effects of de
novo entry by Wal-Mart Supercenters on retail grocery concentration (CR4).
This work is unique because it is the first known study to evaluate the
determinants of changes in market concentration in the retail grocery industry, although
such studies are rather common in the manufacturing sectors. One key aspect of a retail
grocery concentration study that differs from a manufacturing concentration study is
market scope or geographical market size. While the retail grocery market concentration
for the entire US may not be considered high, local markets are typically much more

6
concentrated. “Local market concentration measures the ability of supermarkets to
exercise market power and raise retail price” (Cotterill, 1999).4
LITERATURE
Relevant literature includes theory from location literature and empirical works
from the market concentration and retail grocery industry literature.5 First, the only study
found in a literature search evaluating Wal-Mart’s effects on retail grocery concentration
will be discussed. Franklin (2001) evaluated Wal-Mart’s effects on supermarket
concentration by examining the largest 100 metropolitan statistical areas (MSAs) using
Trade Dimension’s Market Scope data.
Franklin’s first step was to discuss descriptive statistics based the Market Scope
data. From the descriptive statistics, Franklin concluded that “Wal-Mart Supercenter
entry had little impact on food seller concentration in 19 major metropolitan areas
between 1993 and 1998.” In addition, Franklin concluded that Wal-Mart entry into a
MSA initially results in a decrease in CR4 followed either by competitor retaliation
(increasing concentration), an exodus of fringe firms (increasing concentration), or
nothing (decreasing concentration).
Then Franklin estimated univariate and multivariate econometric models to
determine whether Wal-Mart entry and market share are related to median household
income, metropolitan size as measured by total population, or time since Wal-Mart
entered a MSA. Both a univariate and a multivariate logit model suggested a negative
4 Cotterill went on to discuss how four firm concentration levels (CR4) changed from 1992 to 1998. In California, CR4
increased from 50.1 to 69.8 percent, while in Florida the local CR4 levels increased from 77.7 to 87.7 percent.
Cotterill attributes much of this increase in concentration to mergers and acquisitions by large grocery retailers. 5 The market concentration studies primarily relate to the manufacturing sectors. Therefore, those sectors will be
reviewed, noting that not all aspects of the studies will be related to retail concentration.
7
relationship between median household income and Wal-Mart’s presence.6 Finally,
Franklin used two univariate and one multivariate ordinary least squares models to
conclude that a negative relationship exists between median household income and Wal-
Mart’s market share and that a positive relationship exists between the time since
entering a MSA and Wal-Mart’s market share.7
Franklin’s work begins to evaluate the effects of Wal-Mart on retail grocery
concentration, but three key differences exist between Franklin’s work and this research.
First, Franklin’s data are expanded from 19 MSAs to contiguous grocery marketing areas
(GMAs) containing both metropolitan and non-metropolitan areas. Second, by drawing
upon additional theory, additional explanatory variables are added to evaluate the effects
of de novo entry by Wal-Mart Supercenters on the change in retail grocery concentration.
Third, the empirical model gives econometric coefficients specifically describing how
both existing operation of and new entry by Wal-Mart Supercenters affects changes in
retail grocery concentration. A discussion of the theory and empirical works used to
develop our model follows.
Location Theory
Location theory explains the geographical concentration of firms on the basis of
competition and economic efficiency.8 Location theory brings together three related
strands of literature, neo-classical theory (NCT), new trade theory (NTT) and new
economic geography (NEG). In NCT, location determinants are technological
6 Two variables were used in the multivariate logit model; median household income and total MSA population. A
univariate logit model was used to evaluate the effect of total MSA population on Wal-Mart presence, but the result
was insignificant. 7 Three variables were used in the multivariate OLS model; median household income, total MSA population, and time
since Wal-Mart entry into the MSA. 8 Geographical concentration is defined as the number of firms within a defined geographic area, not as the
concentration of market share (Krugman, 1980).
8
differences, natural resource endowments, and factor endowments and intensities
(Brulhart, 1998). In NTT, additional determinants of location include the degree of plant-
level increasing returns and the size of the home market, and NEG extends the first two
strands by adding externalities and additional trade costs measures as determinants.
The economic benefits described by location theory do not necessarily mean that
locating next to a competitor is advantageous. Economic theory would suggest that
competition exists when two parties compete for the same set of resources and that
additional room for entry exists in a growing market. Therefore, heterogeneity in
founding rates, not low failure rates, maybe the drivers of agglomeration (Sorenson and
Audia, 2000). This is important when explaining changes in retailing and localized
markets.
Empirical Manufacturing Concentration Studies
Concentration studies from the manufacturing sector include several variables
common to agglomeration and location theory. In general, early concentration studies
often examined the determinants of concentration levels, but more recent studies
recognize the importance of explaining the drivers of change in market concentration.
Therefore, change in retail concentration is most often used as the dependent variable
(Curry and George, 1983).
Curry and George (1983) identified variables that predicted change in market
concentration in seventeen studies between 1960 and 1980. Table 1 compares the
variables identified by Curry and George with the variables important to agglomeration
and location theory. In the manufacturing concentration and concentration-price studies,
initial concentration and industry growth were identified as the most important variables

9
influencing concentration, which is consistent with agglomeration and location theory.
An important variable in the concentration research not present in the agglomeration and
location theory is the concept of entry barriers, which is often difficult to measure (Curry
and George, 1983). Entry barriers are certainly important to manufacturing industries,
but are less important to retailing because it is more difficult for retailers to hold excess
capacity and easier for retailers to enter markets because of their typically lower fixed
cost structure.
Table 1: Key Independent Variables for Location and Concentration Analyses
Variable Location Theory Manufacturing Concentration
Initial Concentration / Beginning location
density
Hannan and Freeman, 1977 Curry and George, 1983; Rogers, 2001; Connor et al., 1996
Initial market size Krugman, 1980, 1981 Curry and George, 1983; Rogers, 2000; Connor et al., 1996
Market growth Hannan and Freeman, 1977 Curry and George, 1983; Levy, 1985; Connor et al., 1996
Trade costs Fujita, Krugman, and Venables, 1999
Proximity to Resources Brulhart, 1998; Harris, 1954
Change in Number of Firms
Curry and George, 1983; Rogers, 2001
SPECIFICATION AND DATA
Past works evaluated in the literature review were the basis for specifying a model
to determine the effects of de novo entry by Wal-Mart supercenter stores on retail grocery
concentration. Variables included in our models include those variables used in previous
studies, and variables that tie directly back to agglomeration and location theory.
Therefore, the following model was specified.
10
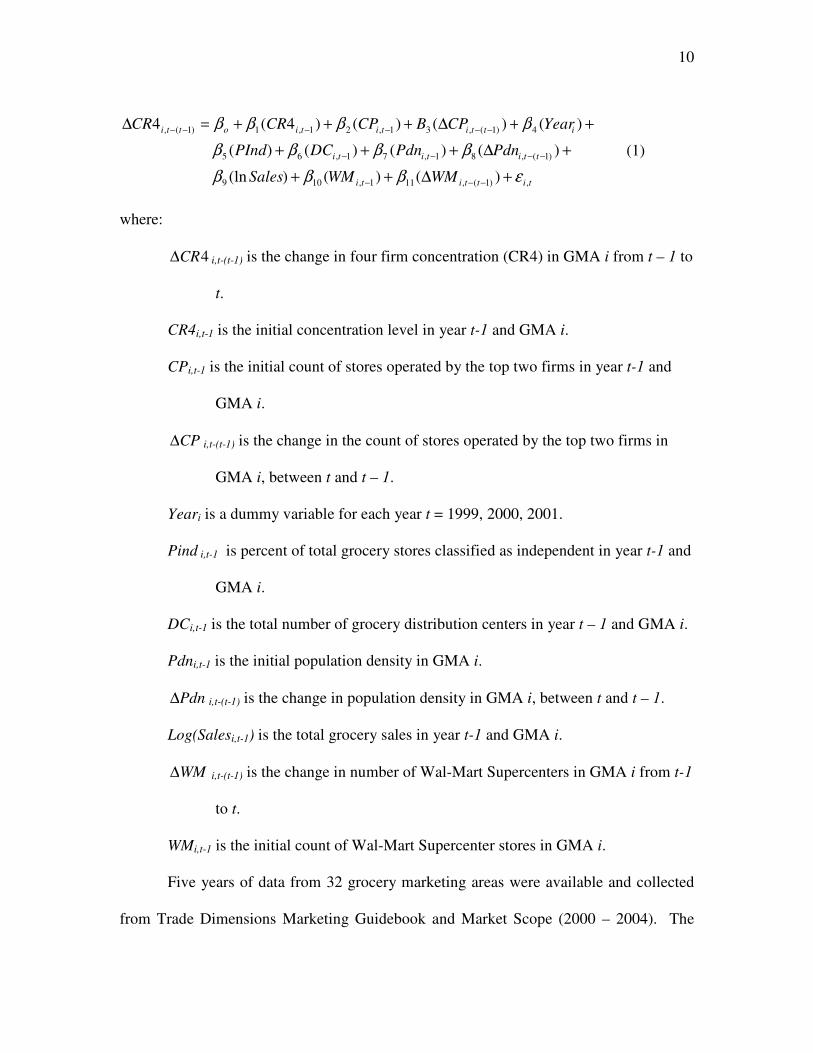
tittiti
ttititi
ittititiotti
WMWMSales
PdnPdnDCPInd
YearCPBCPCRCR
,)1(,111,109
)1(,81,71,65
4)1(,31,21,1)1(,
)()()(ln
)()()()(
)()()()4(4
εβββ
ββββ
ββββ
+∆++
+∆+++
++∆+++=∆
−−−
−−−−
−−−−−−
(1)
where:
4CR∆ i,t-(t-1) is the change in four firm concentration (CR4) in GMA i from t – 1 to
t.
CR4i,t-1 is the initial concentration level in year t-1 and GMA i.
CPi,t-1 is the initial count of stores operated by the top two firms in year t-1 and
GMA i.
CP∆ i,t-(t-1) is the change in the count of stores operated by the top two firms in
GMA i, between t and t – 1.
Yeari is a dummy variable for each year t = 1999, 2000, 2001.
Pind i,t-1 is percent of total grocery stores classified as independent in year t-1 and
GMA i.
DCi,t-1 is the total number of grocery distribution centers in year t – 1 and GMA i.
Pdni,t-1 is the initial population density in GMA i.
Pdn∆ i,t-(t-1) is the change in population density in GMA i, between t and t – 1.
Log(Salesi,t-1) is the total grocery sales in year t-1 and GMA i.
WM∆ i,t-(t-1) is the change in number of Wal-Mart Supercenters in GMA i from t-1
to t.
WMi,t-1 is the initial count of Wal-Mart Supercenter stores in GMA i.
Five years of data from 32 grocery marketing areas were available and collected
from Trade Dimensions Marketing Guidebook and Market Scope (2000 – 2004). The

11
spatial unit is a grocery marketing area (GMA), defined and monitored by Trade
Dimensions on the basis of distribution center locations, transportation flows, and
physical boundaries. Over time, GMA boundaries change because grocery retailing
changes. The geographical size of each of the 50 GMAs vary, but most are
approximately the size of an average U.S. state. Although GMAs follow county
boundaries, they do not follow state boundaries.
Of the fifty total GMAs, seventeen East and West coast GMAs underwent some
type of boundary change between 1999 and 2003. In addition, the “Fargo GMA” data
contained inconsistencies, so it was excluded from the data set. Therefore, 32 of the fifty
GMAs had usable data for the years 1999 through 2003. Figure 1 shows the GMAs used
in the dataset (shaded areas). Earlier data were not available because Trade Dimensions
Marketing Guidebook did not publish GMA level market share data for all retailers
before 1999. After annual changes were calculated, four years of observations remained
for each of the 32 GMAs.
Possible implications from omitting the East and West coast GMAs should be
discussed. First, the omitted GMAs are among the most populated areas of the U.S.
Therefore, the GMAs included in the data set are on average more rural and might not
representative a sample of the U.S. Second, the coastal GMAs have a lower CR4 level.
Third, Wal-Mart operates fewer stores in the coastal GMAs, on average. Combined, the
three implications of omitting the East and West coast GMAs may mean that this sample
of GMAs does not geographically representative the entire U.S. But, even if the sample
does not represent all of the omitted coastal GMAs, it represents parts of the more rural
areas of the coasts such as parts of Virginia, New York, Maine, Vermont, Oregon, and

12
Washington. The sample also represents the majority of the U.S. land area and is useful
to understand the effects of Wal-Mart Supercenters on retail grocery concentration,
especially in the areas where most Wal-Mart Supercenters are located.
Figure 1: GMAs Included in the Dataset
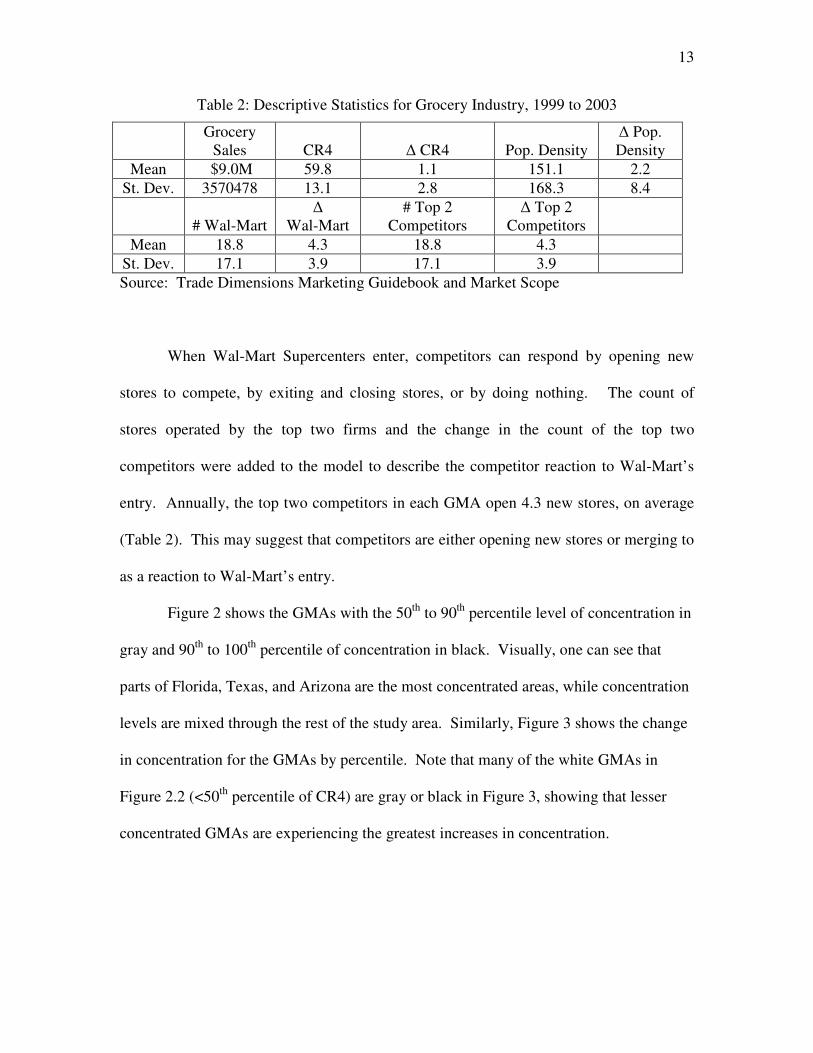
The sample of 32 GMAs had an average CR4 level of 59.8, and the average
change in CR4 was 1.1 from 1999 to 2003 (Table 2). The GMAs had an average of 18.8
initial Wal-Mart Supercenters, ranging from 0 in the Detroit GMA to 41 in the Tampa
GMA, and, on average, 4.3 new Wal-Mart Supercenters were added to each GMA over
the four years. The standard deviation of the change in Wal-Mart Supercenters was high;
3.9. The change in the number of Wal-Mart Supercenters ranged from zero in the Detroit
GMA to eighteen in Memphis GMA.
13
Table 2: Descriptive Statistics for Grocery Industry, 1999 to 2003
Grocery
Sales CR4 ∆ CR4 Pop. Density ∆ Pop. Density
Mean $9.0M 59.8 1.1 151.1 2.2
St. Dev. 3570478 13.1 2.8 168.3 8.4
# Wal-Mart
∆ Wal-Mart
# Top 2 Competitors
∆ Top 2 Competitors
Mean 18.8 4.3 18.8 4.3
St. Dev. 17.1 3.9 17.1 3.9
Source: Trade Dimensions Marketing Guidebook and Market Scope
When Wal-Mart Supercenters enter, competitors can respond by opening new
stores to compete, by exiting and closing stores, or by doing nothing. The count of
stores operated by the top two firms and the change in the count of the top two
competitors were added to the model to describe the competitor reaction to Wal-Mart’s
entry. Annually, the top two competitors in each GMA open 4.3 new stores, on average
(Table 2). This may suggest that competitors are either opening new stores or merging to
as a reaction to Wal-Mart’s entry.
Figure 2 shows the GMAs with the 50th to 90th percentile level of concentration in
gray and 90th to 100th percentile of concentration in black. Visually, one can see that
parts of Florida, Texas, and Arizona are the most concentrated areas, while concentration
levels are mixed through the rest of the study area. Similarly, Figure 3 shows the change
in concentration for the GMAs by percentile. Note that many of the white GMAs in
Figure 2.2 (<50th percentile of CR4) are gray or black in Figure 3, showing that lesser
concentrated GMAs are experiencing the greatest increases in concentration.

14
Figure 2: Percentile Map CR4 by GMA
Figure 3: Percentile Map of ∆CR4 by GMA
> 90th % CR4
50th – 90th % CR4
<50th % CR4
> 90th % Change CR4 50th – 90th % Change CR4 <50th % Change CR4
15
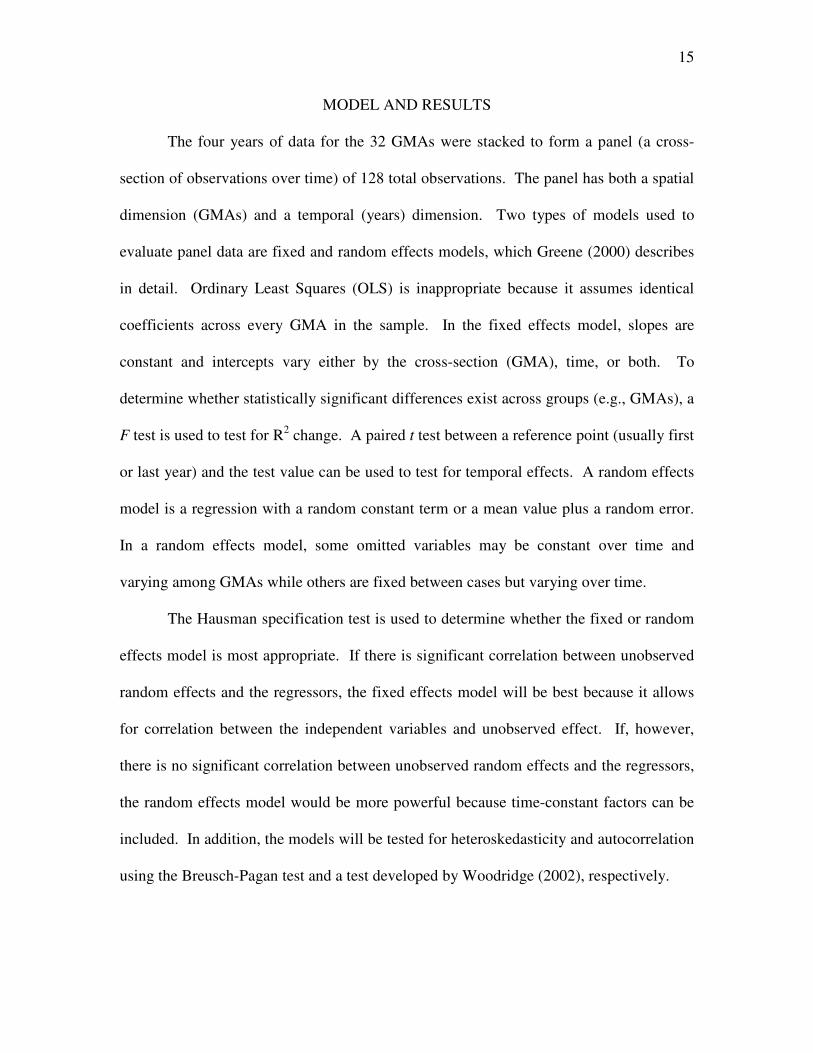
MODEL AND RESULTS
The four years of data for the 32 GMAs were stacked to form a panel (a cross-
section of observations over time) of 128 total observations. The panel has both a spatial
dimension (GMAs) and a temporal (years) dimension. Two types of models used to
evaluate panel data are fixed and random effects models, which Greene (2000) describes
in detail. Ordinary Least Squares (OLS) is inappropriate because it assumes identical
coefficients across every GMA in the sample. In the fixed effects model, slopes are
constant and intercepts vary either by the cross-section (GMA), time, or both. To
determine whether statistically significant differences exist across groups (e.g., GMAs), a
F test is used to test for R2 change. A paired t test between a reference point (usually first
or last year) and the test value can be used to test for temporal effects. A random effects
model is a regression with a random constant term or a mean value plus a random error.
In a random effects model, some omitted variables may be constant over time and
varying among GMAs while others are fixed between cases but varying over time.
The Hausman specification test is used to determine whether the fixed or random
effects model is most appropriate. If there is significant correlation between unobserved
random effects and the regressors, the fixed effects model will be best because it allows
for correlation between the independent variables and unobserved effect. If, however,
there is no significant correlation between unobserved random effects and the regressors,
the random effects model would be more powerful because time-constant factors can be
included. In addition, the models will be tested for heteroskedasticity and autocorrelation
using the Breusch-Pagan test and a test developed by Woodridge (2002), respectively.

16
Empirical Results
The panel data were run in both fixed and random effect models, and the
Hausman test resulted in a P-value of 0.000. Therefore, the fixed effects model, which
allows for correlation between the independent variables and unobserved effects, was
used for the results shown in Table 3. The Breusch-Pagan and Woodridge (2002) tests
found no causes of inefficiency from heteroskedasticity or autocorrelation. The F test
shows that the fixed effect is the result of significantly statistical different GMAs.
Table 3: Results from the Fixed Effects Model on Change in Concentration
Group variable (i): GMA No. of observations = 128
R2 Within = 0.4314 Number of groups = 32
R2 Between = 0.0404 sigma_u = 13.53
R2 Overall = 0.0282 sigma_e = 2.19
Prob > F = 0.000 Rho (var. due to u_i) 0.97
F(13,83) = 4.84 that all u_i=0; Prob > F = 0.000
Coeff. Std Err t P > |t| [95% Conf. Interval]
CR4 -0.5554 0.0958 -5.80 0.000 -0.746 -0.365
CP 0.0261 0.0250 1.04 0.301 -0.024 0.076
∆CP 0.0431 0.0216 2.00 0.049 0.000 0.086
Y99 0.4477 1.1238 0.40 0.691 -1.788 2.683
Y00 -0.0082 0.8389 -0.01 0.992 -1.677 1.660
Y01 -0.9314 0.6500 -1.43 0.156 -2.224 0.361
PIND -9.5768 6.5008 -1.47 0.144 -22.507 3.353
DC 0.0228 0.4088 0.06 0.956 -0.790 0.836
PDN -0.0689 0.0453 -1.52 0.132 -0.159 0.021
CPDN -0.0080 0.0527 -0.15 0.880 -0.113 0.097
LnSALES 4.5939 4.6311 0.99 0.324 -4.617 13.805
WM 0.1343 0.0616 2.18 0.032 0.012 0.257
∆Wal 0.1621 0.0899 1.80 0.075 -0.017 0.341
F test that all u_i=0; F(13,83) = 4.84 Prob > F = 0.000
17
Four variables (CR4, WM, ∆WM, and ∆CP) had statistically significant
relationship with the change in CR4. The result from CR4 (the beginning level of CR4)
was significant at the 1 percent level with a negative sign, as expected. In this study and
in past manufacturing market concentration studies, higher initial market concentration
means future changes in market concentration are smaller. This describes how the
market is converging to a new, higher level of concentration.
Wal-Mart has a significant positive affect on the change in CR4, with the initial
number of Wal-Mart supercenter stores (WM) variable significant at the 5 percent level
and the change in the number of Wal-Mart Supercenter stores (∆WM) variable significant
at the 10 percent level. The WM coefficient was 0.1343, which, by itself, shows that the
existing operation of an individual Wal-Mart Supercenter has a relatively small affect on
the rate of market concentration change. However, Wal-Mart operates multiple stores in
geographical areas which, combined, have a significant affect on the rate of market
concentration change. For example, on average about 19 Wal-Mart Supercenters
operated in each GMA annually, meaning the typical GMA would expect an increase in
the change in CR4 of about 2.5 points annually due to the presence of Wal-Mart
Supercenters (Table 4).
The coefficient for the change in the number of Wal-Mart Supercenters (∆WM) is
0.1621. Annually, about 4 new Wal-Mart Supercenters entered the average GMA.
Therefore, the average GMA experienced an increase in change in concentration of about
0.69 points due to Wal-Mart Supercenter expansion (Table 4). Individual GMAs
experienced a greater expansion of Wal-Mart Supercenters. For example, in the
Memphis GMA, the average annual effect of entry by Wal-Mart Supercenters was 2.19

18
Table 4: Effect of Wal-Mart and Competitor son Average Annual ∆CR4 (1999-2003)
Effect of Wal-Mart on Average Annual ∆CR4 (1999-2003)
GMA Name
1999 CR4
Average Annual ∆CR4
Effect of Competitor Reaction on
Average Annual ∆CR4
Existing Wal-Mart
Supercenters (WM)
Wal-Mart Supercenter Store Entry
(∆WM)
Total Wal-Mart Effect
(WM + ∆WM)
Albuquerque 48.6 1.18 -0.34 3.32 0.53 3.85
Atlanta 63.1 2.00 0.86 2.65 0.73 3.38
Billings 62.6 -0.18 -0.11 0.40 0.32 0.73
Chicago 61.7 -1.80 0.02 1.18 0.16 1.34
Cincinnati 58.9 0.83 -0.01 2.05 0.77 2.82
Cleveland 42.5 2.43 -0.26 0.97 0.16 1.14
Dallas 54.6 1.40 0.71 7.66 1.70 9.36
Denver 77.8 0.60 0.32 2.25 0.97 3.22
Des Moines 68.5 1.20 0.05 1.78 0.85 2.63
Detroit 51.3 3.20 0.03 0.10 0.08 0.18
Grand Rapids 39.5 2.83 0.08 0.20 0.45 0.65
Houston 62.7 1.28 0.29 2.75 1.46 4.21
Indianapolis 56.4 3.18 0.33 2.85 0.81 3.66
Jacksonville 75.4 -0.08 0.25 2.59 0.49 3.07
Kansas City 46.1 2.13 0.10 3.73 0.81 4.54
Louisville 66.2 1.68 0.05 2.42 0.65 3.07
Memphis 54.9 0.18 -0.16 8.76 2.19 10.95
Miami 88.2 -0.60 0.13 0.57 0.24 0.81
Milwaukee 32.4 -0.80 0.09 0.87 0.69 1.56
Minneapolis 43.3 -0.58 0.13 0.20 0.28 0.49
Nashville 53.4 1.98 -0.16 5.88 0.85 6.73
New Orleans 53.4 2.43 -0.58 3.89 0.45 4.34
Oklahoma 41.8 2.98 -0.25 4.53 1.05 5.59
Omaha 42.9 1.53 0.19 0.94 0.32 1.26
Phoenix 69.6 2.85 0.40 0.91 0.61 1.51
Salt Lake City 57.7 -0.33 0.00 0.97 1.09 2.07
San Antonio 79.8 1.50 0.14 3.19 0.77 3.96
Seattle 65.3 -0.60 0.44 0.03 0.12 0.16
Spokane 57.6 -1.50 0.12 0.13 0.20 0.34
Springfield 47.4 3.68 0.05 4.30 0.57 4.86
St. Louis 49.7 1.25 -0.09 4.73 0.73 5.46
Tampa 83.6 -0.13 0.33 4.13 1.09 5.22
Average 58.0 1.11 0.10 2.53 0.69 3.22
points, a high number considering that the mean change in concentration was only 1.11
points.
19
Finally, the change in the count of stores operated by the top two firms in each
GMA (∆CP) was negative and significant at the 5 percent level. Whether the top two
competitors are expanding and merging due to Wal-Mart or not, their expansion and
mergers are increasing the annual change in CR4 by 0.10 units, on average. The Atlanta
GMA experienced the greatest average annual change in concentration due to ∆CP (0.86
units), while the average annual change in concentration in New Orleans fell by 0.58
units due to ∆CP.
Conclusions and Future Work
The effects of de novo entry by Wal-Mart supercenters on retail grocery
concentration were evaluated for 32 relatively large GMAs, covering most of the United
States. The results support the hypothesis that Wal-Mart is increasing retail grocery
concentration. Existing Wal-Mart stores increased the change in concentration by 0.1343
points per store and entry by new Wal-Mart Supercenters further increased the change in
concentration by 0.1621 points per store. In our sample, the regression results show the
combined effects of existing Wal-Mart Supercenters and entry by Wal-Mart Supercenters
increased concentration from 0.16 points in the Seattle GMA to 10.95 points in the
Memphis GMA (Table 4).
Wal-Mart is on-target to open 370 new supercenters in 2006 and “plans to open
more than 1,500 stores in the United States in the coming years (Associated Press, 2006).
If the new 2006 stores are equally distributed between the 50 GMAs, each GMA would
experience an increase in the change in CR4 of more than 1 point. However, the
distribution of the new supercenters will likely not be equal across all GMAs. Wal-Mart
will likely open 20 or more new supercenters in some GMAs, and none or few in other

20
GMAs. The 2006 store openings are few compared to Wal-Mart’s future expansion plans
of opening an average of 30 new stores in each GMA. Therefore, with Wal-Mart’s future
current expansion plans, the combined effects of Wal-Mart Supercenters will continue to
increase retail grocery concentration levels, especially in geographical areas targeted by
Wal-Mart for expansion. Even without factoring in competitor response, Wal-Mart will
likely increase concentration by 10 points or more in some areas.
This study evaluates the effects of Wal-Mart Supercenters on concentration at the
GMA level. However, retail grocery markets are much smaller Trade Dimension’s
GMAs. Within certain local markets, the effects of Wal-Mart Supercenters on grocery
concentration could be much greater; especially true in small, rural towns. In order to
understand the effects of entry by Wal-Mart Supercenters on grocery markets, future
research should reduce the spatial scale of this study from the GMA level to a county or
zip code level. By reducing the spatial scale, spatial effects could be incorporated into
the modeling, and the effects of Wal-Mart could be evaluated separately between rural
and urban areas. Finally, this study could be extended as additional years of data are
published by Trade Dimensions. Additional years of data could be used to evaluate
whether Wal-Mart is beginning to saturate any markets or whether any lag effects exist
between Wal-Mart Supercenter entry and concentration changes. In addition, addition
years of data could be used to better understand the effects of entry by Wal-Mart on
competitors.

21
REFERENCES
Aalto-Setala, V. 2002. “The Effect of Concentration and Market Power on Food Prices: Evidence from Finland.” Journal of Retailing. 78(3)207-16.
Associated Press, 2006. Retrieved from MSNBC site. http://www.msnbc.msn.com
/id/11233081/. Binkley, J.K., and J.M. Connor. 1998. “Market Competition and Metropolitan-area Food
Prices.” Journal of Retailing. 74:273-293. Blanchard, T., and T. Lyson. 2002. “Access to Low Cost Groceries in Nonmetropolitan
Counties: Large Retailers and the Creation of Food Deserts.” Proceedings Paper at the Measuring Rural Diversity Conference, Washington, D.C., November 21-22.
Brulhart, M. 1998. “Economic Geography, Industry Location, and Trade: The Evidence.”
World Economy. 21(6):775-801. Clarke, K. 2005. Twenty Trends for 2010: Retailing in an Age of Uncertainty. A
Special Report by Retail Forward available at www.retailforward.com. Cleeland, N. and A. Goldman. 2003. “The Wal-Mart Effect.” Los Angles Times
latimes.com. November 23. Retrieved from http://www.latimes.com/business/la- walmart-sg,1,1534896.storygallery.
Connor, J.M., R. Rogers, and V. Bhagavan. 1996. “Concentration and Countervailing
Power in the US Food Manufacturing Industries.” Review of Industrial
Organization. Vol.11(S):473-492. Cotterill, R.W. 1986. “Market Power in the Retail Rood Industry: Evidence from
Vermont.” Review of Economic Statistics. 68:379-386. Cotterill, R.W. Ed. 1993. “Competitive Strategy Analysis in the Food System.” Boulder
CO: Westview Press. Cotterill, R.W. 1999. “Market Power and the Demsetz Quality Critique: An Evaluation
of Food Retailing.” Agribusiness: An International Journal. 15:101-118. Cotterill, R.W. and D.C. Harper. 1995. “Market Power and the Demsetz Quality
Critique: An Evaluation for Food Retailing.” Res. Report No. 29. Storrs, CN: Food Marketing Policy Center, Univ. of Connecticut.
Curry, B. and K.D. George. 1983. “Industrial Concentration: A Survey.” Journal of
Industrial Economics. 31:203-255.
22
Dobson, P.W. and Waterson, M. 1997. "Countervailing Power and Consumer Prices." Economic Journal. 107:418-430.
Economist. 2004. “How Big Can it Grow?” April 15. Retrieved from http://www.
economist.com/printedition/displayStory.cfm?Story_ID=2593089. Federal Trade Commission. 2001. “Report on the Federal Trade Commission Workshop
on Slotting Allowances and Other Marketing Practices in the Grocery Industry.” Washington D.C.
Foer, A.A. 1999. Mergers in the Food Industry: Ahold/Pathmark. A letter to Robert
Pitofsky, Chairman, Federal Trade Commission, June 18. Franklin, A.W., 2001. “The Impact of Wal-Mart Supercenters on Supermarket
Concentration in U.S. Metropolitan Areas.” Agribusiness. 17(1):104-114. Fujita, M., P. Krugman and A.J. Venables. 1999. The Spatial Economy: Cities, Regions
and International Trade. Cambridge, MA: MIT Press. Hannan, M.T., and J. Freeman. 1977. “The Population Ecology of Organizations.”
American Journal of Sociology. 82:929–64. Harris, C.D. 1954. “The Market as a Factor in the Localization of Industry in the United
States.” Annals of the Association of American Geographers. 44:315-348. Kaufman, P.R. 2002. “Food Retailing.” U.S. Food Marketing System. Economic
Research Service Agricultural Economic Report No. (AER811) 98:21-33. Kaufman, P.R. and C.R. Handy. 1989. “Supermarket Prices and Price Differences: City,
Firm, and Store-level Determinants.” Technical Bulletin No. 1776. Washington, DC: Commodity Economics Division, Economic Research Service, U.S. Department of Agriculture.
Krugman, P.R. 1980. “Scale Economies, Product Differentiation, and the Pattern of
Trade.” American Economic Review. 70:950-959. Krugman, P.R. 1981. “Intraindustry Specialization and the Gains from Trade.”
Journal of Political Economy. 5:959-73. Levy, D. 1985. “Specifying the Dynamics of Industry Concentration.” Journal of
Industrial Economics. 34(1), September:55–68. Marion, B.W. 1998. “Competition in Grocery Retailing: The Impact of a New Strategic
Group on BLS Price Increases.” Review of Industrial Organization 13:381-399.

23
Marion, B.W., W.F. Mueller, R.W. Cotterill, R.W., F.E. Geithman, and J.R. Schmelzer. 1979. “The Price and Profits Performance of Leading Food Chains.” American
Journal of Agricultural Economics. 61:420- 433. Newmark, C.M. 1990. “A New Test of the Price-concentration Relationship in Grocery
Retailing.” Economic Letters. 33:369-373. Rogers, R.T. 2001. “Structural Change in U.S. Food Manufacturing, 1958-1997.”
Agribusiness: An International Journal. 17: 3-32. Smith, H. 2004. “Is Wal-Mart Good for America?” PBS.org. http://www.pbs.org/
wgbh/pages/frontline/shows/walmart/secrets/. Trade Dimensions. 1999-2000, 2002-2003. Marketing Guidebook, Interactive Market
Systems, Inc.: Wilton, CT. U.S. Census Bureau. Various Years. “County Business Patterns.” Retrieved from
http://www.census.gov /epcd/cbp/view/cbpview.html Woolridge, J. 2002. Economic Analysis of Cross-Section and Panel Data. MIT Press,
pp. 130, 279, 420-449. Yu, C. and J.M. Connor. 2002. “The Price-concentration Relationship in
Grocery Retailing: Retesting Newmark.” Agribusiness. 18(4):413-426.