the effect of audit quality with earning management as an...
TRANSCRIPT

The Effect of Audit Quality with Earning Management as an Intervening
Variable on Earning Quality
(Study on Service Company Listed in Indonesia Stock Exchange year 2013-
2015)
Undergraduate Thesis
By:
Melinda Octaviani
1113082100008
ACCOUNTING DEPARTMENT
INTERNATIONAL CLASS PROGRAM
THE FACULTY OF ECONOMICS AND BUSINESSES
SYARIF HIDAYATULLAH STATE ISLAMIC UNIVERSITY
JAKARTA
1437 H /2017 AD


i
CIRCULUM VITAE
DAFTAR RIWAYAT HIDUP
I. PERSONAL IDENTITY
1. Name : Melinda Octaviani
2. Place and Date of Birth : Bogor, 1 October 1995
3. Address : Jl. Ciomas I RT 001/ RW 011 No.14
Kecamatan Ciomas, Kelurahan Ciomas,
Kabupaten Bogor, 16610
4. Phone : 081296151539
5. Email : [email protected]
II. EDUCATION
1. TK Miftahul Salam Bogor 2000-2001
2. SD Rimba Putra Bogor 2001-2006
3. SMP Insan Kamil Bogor 2006-2009
4. SMAS Insan Kamil Bogor 2009-2012
5. S1 Ekonomi Akuntansi UIN Syarif Hidayatullah 2013-2017
III. SEMINAR AND WORKSHOP
1. Seminar by Pusat Pembinaan Profesi Keuangan (PPPK) Sekretariat
Jenderal Kementrian Keuangan and FEB UIN Syarif Hidayatullah
Jakarta. “Sosialisasi Perkembangan Terkini Profesi di Bidang

ii
Akuntansi dan Ujian Sertifikasi Akuntan (CA) dan Akuntan Publik
(CPA)”. 2015.
2. Training “Forensic Audit to Enhance Accountability in the Public
Sector” by The 16th
ATV FEB University of Indonesia.
3. Company Visit “Forensic Audit to Enhance Accountability in the
Public Sector” by The 16th
ATV FEB University of Indonesia.
4. Seminar by U.S. Embassy Jakarta and FEB UIN Syarif Hidayatullah
Jakarta, “Future Business Opportunities in the Global Islamic
Economy”. 2017.
IV. FAMILY BACKGROUND
1. Father : (PURN) Letkol TNI-AD Achmad Ramli (Alm)
2. Mother : Sundus Saleh Sanad
3. Child : 7 from 7 siblings

iii
Pengaruh Kualitas Audit dengan Manajemen Laba sebagai Variabel Intervening
terhadap Kualitas Laba
(Studi pada Perusahaan Jasa yang terdaftar di Bursa Efek Indonesia tahun 2013-
2015)
ABSTRAK
Tujuan penelitian ini adalah untuk memberikan bukti seberapa besar
pengaruh kualitas audit terhadap kualitas laba dengan menggunakan manajemen
laba sebagai variabel intervening. Populasi penelitian adalah perusahaan yang
tercatat di Bursa Efek Indonesia. Sampel penelitian adalah perusahaan jasa yang
tercatat di Bursa Efek Indonesia. Teknik Pengambilan sampel menggunakan metode
purposive sampling dengan sampel sebanyak 30 perusahaan untuk periode 2013
sampai dengan 2015.
Metode analisis data menggunakan analisis jalur dengan menggunakan SPSS
Versi 20. Variabel independen dalam penelitian ini adalah Kualitas Audit yang
diproksikan oleh fee audit, variable dependen adalah kualitas laba dan variabel
intervening adalah manajemen laba.
Hasil penelitian menunjukkan bahwa nilai signifikan 0,652 atas pengaruh
kualitas audit terhadap manajemen laba yang membuktikan tidak ada pengaruh
kualitas audit pada manajemen laba. Dan hasil pengujian hubungan langsung
kualitas audit terhadap kualitas laba menunjukkan hasil lebih besar yaitu 0,330 atau
33% dibandingkan dengan pengaruh tidak langsung melalui manajemen laba yaitu
sebesar -0,014 atau -1,4%, sehingga manajemen laba tidak bisa dijadikan sebagai
variable untuk kualitas audit terhadap kualitas laba.
Keyword: kualitas audit, manajemen laba, kualitas laba.

iv
The Effect of Audit Quality with Earning Management as an Intervening
Variable on Earning Quality
(Study on Service Company Listed in Indonesia Stock Exchange year 2013-2015)
ABSTRACT
The purpose of this study is to provide evidence of how much the effect of
audit quality on earning quality by using earning management as an intervening
variable. The population of the research is Company listed on Indonesian Stock
Exchange. The sample is service companies listed in Indonesian Stock Exchange. The
sampling method is purposive sampling that were sampled are 30 companies for the
period from 2013 to 2015.
A method used of data analysis was path analysis using SPSS version 20.
Independent Variable of the research is audit quality proxies by audit fees, dependent
variable is earning quality and intervening variable is earning management.
The results showed that significant value is 0,652 on the effect of audit quality
towards earning management which proved there is no effect of audit quality on
earning management. And test results direct effect of audit quality on earning quality
is larger result that is 0,330 or 33% compared with the indirect effect of audit quality
on earning quality through earning management which is -0,014 or -1,4%, so earning
management is not an intervening variable for audit quality on earning quality.
Keywords: audit quality, earning management, and earning quality.

v
FOREWORD
Assalamualaikum Wr.Wb
All praise to Allah SWT, the most merciful, seer, hearer, and all above
abundance of grace, for given me your gifts and blessings, so I can finish this thesis.
And also shalawat and salam always gives to our beloved prophet Muhammad SAW
and all his families and friends who always helped him in establishing Dinullah in
this earth. With patience, intelligence, and strong desire from Allah SWT, I am able
to finish this thesis as requirement for bachelor degree in State Islamic University
Syarif Hidayatullah Jakarta.
My very special thanks for my beloved daddy (alm) Achmad Ramli. Thank
you dad for given me your time, attention, prays, support and your patience in
educate me, even now you’re not here anymore for me, but you always be my best
hero ever lived in this world.
And I would like to extend my gratitude for my mom, for your all attention
and prays for me. You’re the one that always have your time to pray for me, devotes
all your love, you always patience facing your annoying and stubborn daughter.
Thanks a lot mom, thank you for being my mother, I always grateful to have you. I
hope I can be the reason of your both, mom and dad, smiles and proud.
On this occasion, with all my humility to thank for all helps, guidance, support,
pray, and spirit both directly and indirectly in completion of this mini thesis, to:
1. For my relatives family. All my brothers and sisters for the support and pray
for my success. Thank you for your all attention and loves for me.
2. Mr. Dr. Arief Mufraini, Lc., M.Si as Dean of Economic Faculty.
3. Mrs. Yessi Fitri, SE., M.Si., Ak., CA as Head of Accounting Major.
4. Mr. Hepi Prayudiawan, SE., MM., Ak., CA as Secretary of Accounting
Major.

vi
5. Mrs. Yulianti SE., M.Si as thesis supervisor. You have given me your time to
guide me to compile this thesis and share your knowledge to me. Thank you
very much for all attention and advice for me, so I can finish this thesis.
You’re the best mentor I’ve ever had.
6. Mr. Hepi Prayudiawan, SE., MM., Ak., CA as academic supervisor for given
me all information and help during lectures and all the support and pray.
7. All lecturers who have taught me patiently, may they have given are recorded
in Allah SWT almighty and all staff UIN Syarif Hidayatullah Jakarta,
8. Special thanks to Mr. Bonik. Thanks a lot for your provided information and
official stuffs that I needed in UIN Syarif Hidayatullah.
9. All my best friends (almh) Indriyanti, Banan , Wulan, Fita, Sisi, Yuli, Denisa,
Tari, Rani, Lia and Disa. Thank you for all time, support, and prays for me.
You’re all the best.
10. All friends in Accounting International Program 2013, Panji, Putra, Raisa,
Aji, Syarah, Ryan, Riski dan Afri. Thank you for every support and pray for
me and all story that we.ve been trough together. I’m really glad to be part of
you all.
11. All friends in International Program.
I am fully aware this mini thesis is still has a lot of flaws and far from
perfect due to many reasons including limited experience and knowledge I
have. Therefore, I expect all suggestion and also criticism from various
parties.
Wassalamu’alaikum Wr.Wb.
Bogor, June 2017
Melinda Octaviani

vii
TABLE OF CONTENTS
Curriculum Vitae ........................................................................................................ i
Abstrak........................................................................................................................ iii
Abstract ..................................................................................................................... iv
Foreword .................................................................................................................... v
Table of Content ...................................................................................................... vii
List of Tables ............................................................................................................. xi
List of Figures .......................................................................................................... xii
List of Appendixes .................................................................................................. xiii
CHAPTER I INTRODUCTION
A. Background ...................................................................................................... 1
B. Problem Formulation ..................................................................................... 15
C. Purpose and Benefit of Research ................................................................... 16
1. Purposes of Research ......................................................................... 16
2. Benefits of Research .......................................................................... 16
CHAPTER II STUDY LITERATURE
A. Literature …………………………….……………………………............... 19
1. Agency Theory……..…….…………….…………………............... 19
2. Audit Quality ..................................................................................... 21
3. Earning Management ......................................................................... 27

viii
4. Earning Quality .................................................................................. 31
B. Previous Research .......................................................................................... 33
C. Conceptual Framework ……………………..……………………………… 42
1. Variable Interrelation ………………………..……………………... 42
a. Audit Quality and Earning Quality …………………………….. 42
b. Audit Quality and Earning Management …………………..…... 43
c. Earning Management and Earning Quality ……………………. 44
d. Audit Quality and Earning Quality through Earning
Management ……………….…………………………………... 46
2. Research Model ................................................................................. 48
D. Hypotheses ..................................................................................................... 48
CHAPTER III Research Methodology
A. Scope of Research .......................................................................................... 49
B. Sampling Method ........................................................................................... 49
C. Collection Data Method ................................................................................. 50
D. Data Analysis Method ................................................................................... 51
1. Descriptive Statistic ........................................................................... 51
2. Classic Assumption Test .................................................................... 52
3. Coefficient of Determination ............................................................. 55
4. Hypothesis Test ................................................................................. 56
E. Research Variables Operationalization .......................................................... 57
1. Earning Quality (Dependent Variable) .............................................. 57

ix
2. Earning Management (Intervening Variable) .................................... 59
3. Audit Quality (Independent Variable) ............................................... 63
CHAPTER IV FINDING AND ANALAYSIS
A. General Description of Research Object………........................................... 67
1. Research Object Description ............................................................. 67
2. Research Sample Description ............................................................ 68
B. Analysis and Discussion ................................................................................ 70
1. Descriptive Statistic Analysis ............................................................ 70
2. Classic Assumption Test Results ....................................................... 71
a. Normality Test Result .................................................................. 71
b. Multicollonearity Test Result ....................................................... 72
c. Heterocedasticity Test Result ....................................................... 73
d. Autocorrelation Test Result ......................................................... 74
3. Determination Coefficient Test Result .............................................. 75
4. Hypothesis Test Result ...................................................................... 77
a. Significant Partial Test (t-test) ...................................................... 77
5. Interpretation ...................................................................................... 82
a. Effect of Audit Quality on Earning Quality ................................ 82
b. Effect of Audit Quality on Earning Management ........................ 83
c. Effect of Earning Management on Earning Quality.................... 84
d. Effect of Audit Quality on Earning Quality through
Earning Management ................................................................... 84

x
CHAPTER V CONCLUSIONS
A. Conclusions .................................................................................................... 87
B. Implication ..................................................................................................... 88
C. Recommendation ........................................................................................... 89
Reference ................................................................................................................... 91
Appendixes ................................................................................................................ 98

xi
LIST OF TABLES
No. Description Page
2.1 Previous Research .......................................................................................... 34
3.1. Variable Operationalization ........................................................................... 66
4.1. Detail of Research Sample ............................................................................. 67
4.2. Research Sample............................................................................................ 69
4.3. Research Sample Distribution ………………………………………..……. 70
4.4. Descriptive Statistic Analysis in Period 2013-2015...................................... 70
4.5. Klomogorov-Smirnov Test Result................................................................. 72
4.6 Multicollonearity Test Result ........................................................................ 73
4.7. Autocorrelation Test Result........................................................................... 75
4.8. Coefficient of Determination Equation I Test Result.................................... 76
4.9. Coefficient of Determination Equation II Test Result ………………...…… 76
4.10. Direct Regression Test Result ....................................................................... 79
4.11. Regression I Test Result ……........................................................................ 80
4.12. Regression II Test Result ............................................................................... 81

xii
LIST OF FIGURES
No. Description Page
2.1. Research Model ............................................................................................. 48
4.1. Scatterplot Graphic........................................................................................ 74
4.2. Path Analysis Result...................................................................................... 82

xiii
LIST OF APPENDIXES
No. Description Page
1. Sample Data Description ..................................................................................... 98
2. Raw Data Description ………………………………………………………….. 98
3. SPSS Output Result ........................................................................................... 104

1
CHAPTER I
INTRODUCTION
A. Background
A company’s number one goal is to make money. Not only have
profit at the end of every accounting period, but they also want the
company financial statements to look as good as they can. The main
purpose of a company when it’s established is to gain revenue or earning
as much as possible. The earnings of a company can be seen from the
financial statement of the company. Public companies have an obligation
to submit periodic financial statements, namely annual reports and mid
financial statements or quarterly financial report which is in Indonesia is
every 4 months (divided into quarterly 1, 2, and 3). The annual financial
statement submitted to Badan Pengawas Pasar Modal (Bapepam) and
should be announced to the public. Financial statement is a tool to deliver
financial information regarding the management’s responsibility of their
performance (Novianti, 2012).However, because of many interests of
individuals within the company, cannot be ensured if the financial
statement made is truly what is happened. So it becomes a doubt for users
of financial statements, especially investors, the quality of the financial
statements which in this case is the earnings. Thus, it’s necessary to have

2
evidence that can ensure the quality of earnings of the company to be
reliable, this is called earnings quality.
Because of management actions which reported earnings that do
not describe the actual condition of the company resulted in profit
generated becomes questionable quality. This phenomenon can be
detrimental to many users of financial statements. Each party has their
own interest from the financial statement (Novianti, 2012). In accordance
with Schipper and Vincent (2003) mentioned, that earning quality in
particular and quality of financial statement in general is important for
those who use the financial statement due to contract purposes and
investments decision making. Novianti (2012) stated the importance of
earning information has expressly mentioned in Statement of Financial
Accounting Concept (SAFC) No. 1 which states that in addition to
assessing the performance of management, earnings also help estimate the
earnings capacity representatively, as well as to assess the risks in the
investment or credit (FASB, 1985). Earnings information reported by the
company’s management will be used by investors to take decision whether
to invests their money or not, also forecasting the future earnings.
Investors buy shares when they believe that earning in the future can
increase the share price (Libby, et al., 2008).
With the importance of earning quality that exists in the financial
statement, then it is necessary to ensure that financial statement presented
fairly by management. But on the other hand if the company is in bad

3
condition and the financial statements is worst, to keep the company and
the investors, the management is required to always produce the
interesting financial statements for shareholders and it could make the
management acted dishonestly and manipulate the results of financial
statement. In addition to the company's interests in order not to lose the
trust of shareholders, also for the benefit of themselves in order to
complete their task. The idea that the management can take action only
provides benefits for himself based on an assumption that states everyone
has the behavior of selfish or self-interested behavior. The desire,
motivation and utilities are not the same between management and
shareholders raises the possibility of management acts detrimental to
shareholders, among others behave unethically and tend to do the
accounting fraud. This conflict can result in the nature of management
which reporting profits opportunistically to maximize his personal gain. If
this occurs would resulting poor quality of earnings (Rachmawati and
Triatmoko, 2007).
Taruno (2013) mentioned that reporting financial scandal have
been a lot going on, in abroad there are a lot of accounting scandals by
doing management earnings, among others Enron, Merck, World Com and
majority other companies in the United States. Some of the cases occurred
in Indonesia such as PT. Lippo Tbk and PT. Kimia Farma Tbk also
involves financial reporting originated from detected manipulation. PT
Kimia Farma Tbk case proved overstated their net income from the initial

4
reported 132 billion Indonesian Rupiahs and that report was audited by
Hans Tuanakotta & Mustofa (HTM). But Ministry of State-Owned
Enterprise of Republic of Indonesia (BUMN) and Bapepam assessed that
net earnings is too large and contains elements of manipulating act. The
real earnings were only 99.56 billion Indonesian Rupiahs or 24.7% lower
than initial profit. Cases like this that make the shareholders doubted the
quality of presented earnings. It is made should there is third party who
can ensure the financial statement is presented fairly (Media: Kompasiana,
2015).
Trusted party that is able to ensure the financial statement is an
independent party that is auditor. Auditors are expected to provide
information stating that the report made by the management has been
fairly presented or not. Because, according to government regulations from
Finance Ministry of Indonesia No: KEP-346/BL/2011 announced that
public company in Indonesia should report periodic financial statement
and annual reports to Badan Pengawas Pasar Modal (Bapepam) which
must be accompanied by an opinion of public accountants who audited the
financial statements. Auditors with carry out a series of audit process, if
found any material misstatement in the financial statement, the auditor
have a right to give justification recommendations.This makes the
company requires the services of a public accountant (now called as an
auditor). An auditor provides audit services on the client's financial
statements to provide assurance to users of financial statements that the

5
financial statements have been prepared in accordance with accounting
standards so that financial statements can be relied upon in making
decisions. The decision makers of course expect the best results of the
audit so as to make them believe the decision they should take. Audit
services is a means of monitoring the possibility of conflict of interest
between the owner and managers and the shareholders with a number of
different ownership and can reduce the information asymmetry between
managers and stakeholders of the company to allow outsiders to check the
validity of financial statements (Jensen and Meckling, 1976).
In principle, an audit is supposed to improve earnings quality.
However, it is unclear which earnings attributes are considered by auditors
as being indicative of high earnings quality and it is unclear which
financial statement users benefit the most from having an audit (Lenox
et.al. 2015).High quality information is important in making good
judgments and decisions. It’s important for many participants in the
financial reporting process: investors (e.g., where and how much to invest,
what is the investment risk), regulators (e.g., what is the quality of
financial reporting standards), auditors (e.g., what is the quality of
financial statements and audit performed), lenders (e.g., what is the credit
quality of an entity), etc. It’s used in many investment decision and
valuation models. There is no single definition of the quality of earnings,
as well as there is no single measure of this concept. According to the
Statement of Financial Accounting Concepts No.1, higher earning quality

6
provide more information about the features of a firm’s financial
performance that are relevant to a specific decision made by a specific
decision-maker.
In general, the earnings quality can be looked at as the quality of
information. High quality information is precise (accurate), relevant,
comparable, unbiased, and timely. The concept of the quality of
information is especially applicable in the context of capital markets. For
example, from the precision perspective, the quality of earnings is high
when earnings precisely reflect the underlying (i.e., true) operating risk
and environment, business performance, and reporting quality of an entity.
Dechow et.al. (2010) define the high-quality earnings number is one that
accurately reflects the company’s current operating performance, is a good
indicator of future operating performance, and is a useful summary
measure for assessing firm value. From that, Dechow et.al. (2010) define
earnings to be of high quality when the earnings number accurately
annuitizes the intrinsic value of the firm. Interest of knowing the quality of
earning is not only for investors but also to regulators, standard setters,
credit rating agencies, analysts, accounting researchers, and many other
participants in the financial reporting process. As the result, there are
numerous benchmarks and views used to measure the quality of earnings.
Earnings quality can be viewed from such perspectives as (but this
is not an exhaustive list):

7
1. Analyst expertise
2. Auditor independence
3. Balance sheet
4. Decision usefulness
5. Earnings management
6. Financial analysis/reporting
7. International Measurement
For instance, from the decision usefulness perspective, the quality
of earnings is how precisely the earnings reflect the changes in the wealth
of a company. From the financial analysis perspective, the earnings quality
is how precisely the earnings measure the value of the company and how
accurately they (earnings) represent the firm’s current and future
performance. Determining earnings quality and its implications for firm
value is complex. Understanding a company’s quality of earnings requires
expertise in finance, accounting, and corporate strategy and a strong
knowledge of the industry in which the company operates and the
governance mechanisms monitoring and rewarding employees and
managers.
As a result of failures occurred to business organizations and the
subsequent collapse and bankruptcy of large and multinational firms, such
as Enron, WorldCom, and other firms, and based on the clear relationship
of these collapses with manipulating the accounts of these firms, doubts
emerged among users of financial information regarding the credibility of

8
this announced information, where they depend on, in decision making.
This incredibility and unreliability raise many questions, including the
managements of these firms, and the effectiveness of accounting
standards, and the applied procedures in firms. Auditors' responsibility and
credibility, audit process, and audit quality, became questionable directly
next to these collapses (Almomani, et al., 2015). Because of increasing
number of collapsed firms, and losses incurred by investors and creditors,
the issue of earnings quality became the focus of different interested
groups of people. The issue of earnings quality stems its importance from
the quality of reported earnings by business organizations in the financial
and investments decisions that investors, creditors, and other users depend
on, in taking decisions. Eisa (2008) in Almomani (2015) stated that
earnings quality is used in performance evaluation of firms, and in
determining the fair value of these firms. Moreover earnings quality is
important in future estimations and contracting. Dechow and Schrand
(2004) explained that earnings quality is strongly associated with quality
of financial reports, where this quality of earnings can be achieved when
firms adhere to the legal, professional, and control standards. Business
organizations are required to issue reliable, free of errors and misstatement
information, to provide a good base for the evaluation of current operating
performance of firms, and to be appropriate for the estimation of its future
operating performance, and for the determinations of the fair value of
firms. Penman (2003), demonstrated that earnings quality is associated

9
with accounting profits, realized cash flows, so quality of earnings is
achieved when the reported income reflects the actual profits, where future
expected profits can be accurately estimated.
Nowadays, auditors encounter several types of pressure by users of
accounting information in order to improve the quality of audit, because of
several financial problems exist in periodic financial reports. Audit
profession is required these days to concentrate on efficient and qualified
work force, to provide audit services with high quality, and to be able to
reveal any incorrect practices that managements take to affect the
accounting measurement. Audit report is considered one among the most
important inputs for the decision making process. In addition, audit quality
is a primary requirement for different groups of users. Actually, audit
quality is difficult because of its difference in nature, to provide trust with
audit reports and financial statements (Scott and Pitman, 2005). Audit
quality means that audit profession has the ability to detect the significant
errors, and limits information inconsistency between managements and
shareholders, so it can protect the behalves of shareholders. Audit
profession is expected to provide highly efficient services and to keep the
trust of its services in minds of interested people (Eisa, 2008 in Almomani
2015).
After all, the financial statements are what potential investors and
creditors look at when they make the decision whether or not to lend the
company money or to become an investor. This is where the concept of

10
earnings management comes into play. As a result, these effects of
management interventions are reflected in the reported income, and led to
a situation where income does not represent the actual situation, especially
when managements' awards depend on the reported income. Earnings
quality means that the reported income is actual and not overstated or
manipulated, and at the same time reflects the actual economic events
occurred in the entity during the accounting period (Bellovary et al.,
2005). And because of that there is a potential action that maybe done by
the management to arrange the earning based on their own interest or
usually called as earning management. The definition of earnings
management in a nutshell, is the creative use of different accounting
techniques to make financial statements look better. Earnings management
is a global phenomenon in financial reporting or reporting of information
related to profits. The purpose of earnings management is to demonstrate
reasonable earnings quality that meets either the shareholders’
expectations, or the requirement of obtaining relevant authorization from
regulators (Ahmadpour and Shahsavari, 2016). But a lot of case proved
that management acts opportunistic earning management by increasing or
decreasing the accrual number of income statement which causes earning
information is not appropriate with actual company’s performance (Azhar,
2013).
Thus, earnings management has much in common with earnings
quality (represented by accruals quality, earnings persistence, earnings

11
predictability, and earnings smoothness in our study). For instance, highly
managed earnings can yield low quality earnings (Lo, 2008), as the
“artificial” information may lead to an incorrect decision. However, the
absence of earnings management is insufficient to guarantee high quality
earnings, because other factors (such as capital market and management
compensation) contribute to the quality of earnings (Lo, 2008). Earning
management is the use of accounting techniques to produce financial
reports that present an overly positive view of a company’s business
activities and financial position. Healy and Wahlen (1999) describe
earnings management (EM) as an action of managers to adjust financial
reports using their judgment in order to influence contractual outcomes
that based upon reported accounting data or to mislead stakeholder about
firm’s performance.
The influence of audit quality towards the earning quality and
earning management is also important to know because audit quality needs
to be in accordance with certain accounting rules and it adds value if the
quality enables financial statements to reflect the economic performance
position of a firm and ensure that good performing firms can be
distinguished from bad performing firms. In theory, a firm should select
accounting methods and make estimations which best reflects the
economical position. In practice this means that audit firms must be
independent from the client, due to the liability and disciplinary sanctions.
Because there is room for subjectivity when expressing an opinion on a

12
financial statement, the probability that an audit firm discovers a material
error or the risk that the audit firm will report these errors and signals are a
couple of the many contributing factors when it comes to audit quality
(DeAngelo, 1981).
As Velury & Jenkins (2008) states, earnings quality is influenced
by the audit quality, because a high level of audit quality leads to a higher
degree of earnings quality. But other research that is Pupperhart (2012)
provided evidence that high audit quality is not significant associated with
high earnings quality. Also research done by Gerayli et al. (2011) which
use discretionary accruals as a measure of earning management reveal that
discretionary accruals are negatively related to auditor size and auditor
industry specialization which are the measurement of audit quality. Their
findings also support our hypothesis of the negative association between
auditor independence and discretionary accruals. Overall, this study
provides evidence that firms which are audited by high quality auditors are
more likely to have less discretionary accruals. Other research that tested
the influences between audit quality, earning management and earning
quality is the main reference of this study it’s Almomani (2015) also tested
the quality of audit to earning quality, He stated that audit quality have
significant relations with quality of earnings. And also there are some
researches that tested the quality of audit on earning managements.
Research done by Nawaiseh (2016) stated that the audit quality which is
used audit tenure, audit fees and international big auditing firms as proxies

13
have significant relations with earning management. But founded that are
no relationship is found between leverage, return of asset (ROA), cash
flow/total assets (CFO) towards earning management.
As there has been a collection of massive accounting fraud, for
example: Enron (special purpose entities to hide debt), WorldCom (of
misstatements) and Parmalat (for cash balance overstatements), critics
conclude that there was a correlation of various factors which have
contributed to these accounting scandals. A few of the factors that
contributed to the collapse of these firms included poor corporate
governance, management compensation packages and also a decline in
audit quality, with the adverse consequences of poor earnings quality. This
has been the subject of significant debate among academics, practitioners
and regulators. However, the empirical evidence on earnings quality is
sparse and controversial. Examining one factor of lower earnings quality
that has an impact on information asymmetry (e.g. a decline in audit
quality) is one of the focuses in this research. Lower earnings quality
increases the adverse selection risk and lowers liquidity in financial
markets, especially for public firms where earnings represent the principal
source of information for market participants (Pupperhart, 2012).
Based on the above, researchers are motivated to do this study
because the first quality of earnings of a company plays a very important
for shareholders and creditors for decision making. With the good quality
of earnings they can easily made decision whether to make investment for

14
investor or give loan for the creditors. Second, this study also test about is
the earning management effect earning quality or not because earning
management can change the value of confident of this quality of earning if
don’t done fairly. And last, earning management can influenced (based on
the previous researches) the quality of audit if the auditor doesn’t know
nor can’t find that the management do the illegal or unfairly earning
management. Based on those reasons, the researchers conducted a study
entitled “The Effects of Audit Quality with Earning Management as an
Intervening Variable on Earning Quality.”
This research is an extension of the previous research done by
Taruno (2013), Almomani (2015), and Nawaiseh (2016). The differences
of this study with the previous research are as follows:
1. The variable used in previous research is audit quality
which is influenced the earning quality. Moreover, in this
study, the researcher add one variable its earning
management as an intervening variable to expand the scope
of discussion and get more complex (Almomani, 2016). In
addition, the management manages the earnings to profit-
motivated, and implies earnings management reduces the
information content of accounting items. On the other hand,
some researchers have informative look-out earnings
management, and these are considered as a way to raise
awareness of favorable financial conditions to shareholders,

15
that it is done by management involvement in the process
of income determination (Subramanyam, 1996, pp.249–
281). So it should be expected that earnings management
not only does not reduce the income information content,
but it also helps investors in the better interpretation of
reported items (Ahmadpour and Shahsavari, 2016).
2. The population of this study is Services Company Listed in
Indonesia Stock Exchange at the period 2014-2015
suggested by previous research to study in other countries.
Meanwhile, the study population before is the entire
industry in Amman, Jordan.
B. Problem Formulation
From the background above, the problem formulation that will
identify in this research are:
1. How much audit quality effect the earning quality?
2. How much audit quality effect the earning management?
3. How much earning management effect the earning quality?
4. How much audit quality effect the earning quality through
earning management?

16
C. Purposes and Benefits
1. Purposes of Research
Based on the problems formulation above, the purposes of
the research are:
a. To test and analyze the effects of audit quality
towards earning quality.
b. To test and analyze the effects of audit quality
towards the earning management.
c. To test and analyze the effects of earning
management towards the earning quality.
d. To test and analyze the effects of audit quality
towards the earning quality through the earning
management.
2. Benefits of Research
a. Theoretical Contributions
1) Student Accounting Department, this study is useful
as reference material for future research and
comparative increase knowledge.
2) Society, as information facilities about the earning
management, audit quality and the earning quality
and also to add the knowledge about auditing which
may be useful in the future.

17
3) Subsequent researchers, as a reference for those
parties who will carry out further research on this
topic.
4) The author, as a means to broaden insight and make
reference to auditing, especially on the earning
management, audit quality and also about the
earning quality which is expected to be useful for
writers in the future.
b. Practical contribution
1) Auditor and Public Accountant Office (KAP), a
review which is expected to be used as information
to improve the audit quality so can influence the
earning quality of the client’s company.
2) Company or User, expected to be useful in
assessing the quality of audit and that influence to
the earning quality of company.
3) Indonesian Institute of Accountants (IAI), the
research is expected to contribute positively so that
it can be used as a basis for considering audit
activity especially about the audit quality and the
effect to earning quality and earning management.
4) Indonesian Institute of Certified Public Accountants
(Certified), as additional information about audit

18
quality and earning management and their influence
to the earning quality of company.

19
CHAPTER II
STUDY LITERATURE
A. Literature
1. Agency Theory
Agency theory explains the existence of a contract between
the agent (management) and the principal (shareholders) which the
agent received a mandate to manage the company of the principal.
Jensen and Meckling (1976) an agency relationship as a contract
under which one or more persons (the principal(s)) engage another
person (the agent) to perform some service on their behalf which
involves delegating some decision making authority to the agent. If
both parties to the relationship are utility maximizers, there is good
reason to believe that the agent will not always act in the best
interests of the principal.
The principal can limit divergences from his interest by
establishing appropriate incentives for the agent and by incurring
monitoring costs designed to limit the aberrant activities of the
agent. In addition in some situations it will pay the agent to expend
resources (bonding costs) to guarantee that he will not take certain
actions which would harm the principal or to ensure that the
principal will be compensated if he does take such actions.

20
However, it is generally impossible for the principal or the agent at
zero cost to ensure that the agent will make optimal decisions from
the principal’s viewpoint. In most agency relationships the
principal and the agent will incur positive monitoring and bonding
costs (non-pecuniary as well as pecuniary), and in addition there
will be some divergence between the agent’s decisions and those
decisions which would maximize the welfare of the principal
(Jensen & Meckling, 1976).
Agency costs arise in any situation involving cooperative
effort by two or more people even though there is no clear-cut
principal-agent relationship. Viewed in this light it is clear that our
definition of agency costs and their importance to the theory of the
firm bears a close relationship to the problem of shirking and
monitoring of team production. Since the relationship between the
stockholders and the managers of a corporation fits the definition
of a pure agency relationship, it should come as no surprise to
discover that the issues associated with the “separation of
ownership and control” in the modern diffuse ownership
corporation are intimately associated with the general problem of
agency (Jensen & Meckling, 1976).
Because of this potential conflict of agency, an agent
(management) who knows more internal information about the
company than the principal must provide information about the

21
condition of the company, especially which is mandatory and also
voluntary as specified minimum additional disclosures.
Information asymmetry occurs between management by the
owners provide the opportunity for the manager to act
opportunistically that for sake of personal gain. Under such
circumstances the manager can use the information learned to
manipulate financial reporting by way of earnings management
(Azhar, 2013) or as Subramanyam (1996) called as opportunistic
earnings management which means managers apply it to maximize
their own interests and not the interests of the company and the
investors.
Therefore necessary to have an independent party that can
be trusted entirely by the principal and the party is the auditors.
Auditors are expected to ascertain whether the financial statements
presented by management was fair or not because the principal
interest in this case is the profits from the company so that the
auditor is expected or even to be able to ensure the quality of the
profit generated by the management.
2. Audit Quality
Audit quality now is no longer a new concept under the
scope of auditing. Not only the complete all procedures of audit
that can guarantee that the audit have a good quality but also other
factors. The important thing to know first is the definition of audit

22
quality. There are many different definitions but none of them has
achieved universal acceptance. It can even be argued that quality
itself is a concept that cannot be comprehensively defined
(Pitkänen, 2016). Probably the most used definition of audit quality
is created by DeAngelo (1981) which defines audit quality to be
the market-assessed joint probability of discovering an error in the
financial statements and reporting it to the stakeholders. In this
definition quality requires both competence and independence from
the auditor. Without adequate competence the auditor might not be
able to detect the error so irregularities and without high level of
independence auditor might not be willing to report his findings
truthfully. With adequate independence and competence the
auditor should be able to find the material misstatements and report
them, thus completing the audit with high quality.
Malihi et al. (2012) provides further explanation that audit
quality could be a function of the auditor’s ability to detect material
misstatements and reporting the errors. Together with other similar
definitions, they all emphasize on two of the most important
aspects of audit quality, namely auditor ability or auditor effort,
and auditor independence. Therefore, this stream of definitions is
mainly about the auditors’ quality. Another stream of defining
audit quality focuses on the accuracy of the information reported
by the auditors. Titman and Trueman (1986) suggest that high

23
audit quality would improve the reliability of financial statement
information and allows investors to make more precise estimate of
the firm’s value. Schauer (2002) also advises that “a higher quality
audit increases the probability that the financial statements more
accurately reflect the financial position and results of operations of
the entity being audited”. In other words, audit quality is part of the
quality of accounting information disclosed (Clinch et al., 2010).
The audit process is considered a key important element in
the structure of financial statements because it tests whether the
financial information is in an independent and objective form, in
order to increase the credibility of this information. The most
important factor of audit quality is the ability of an auditor to detect
errors and other significant misstatements and reducing the level of
accounting information inconsistency between shareholders and
management (Almomani, 2015).Quality auditor is when the auditor
can give accurate information. Accurate information is information
that can pin point the value of the company. DeAngelo (1981)
defines quality audit as the probability that an auditor discovered
and reported about the existence of a breach in the accounting
system of its clients. Qualified auditors should provide proper
information, not only wore a higher fee so the choice was really
reflects the information contained in the company. In Indonesia

24
there are called as Big4 audit firms. Here is a list of the firm that
belongs to the group Big Four in Indonesia:
a) Public Accountant Firm of Osman Bing Satrio and
Partners affiliated with Deloitte.
b) Public Accountant Firm of Tanudiredja, Wibisana,
and Fellow affiliated with Price Waterhouse
Coopers (PWC).
c) Public Accountant Firm of Purwanto, Suherman,
Surja affiliated with Ernst & Young (EY).
d) Public Accountant Firm of Siddharta and Widjaja
affiliated with KPMG.
There are a lot of proxies’ uses to measure the audit quality.
Which is in DeAngelo (1981) stated audit firm size as a
measurement of audit quality. Research did by Almomani (2015)
use several measurements which are audit office size, auditors’
fees, period of customer retention, type of auditor’s opinion, and
the specialization in client’s industry. The study finds that auditor
fees have most important significant effect on earning quality,
followed by auditors’ opinion, where others factors has no
significant effect on earning quality. Ahmed (2012) in Almomani
(2015) used audit fees, audit office size, client's retention period,
association with international audit fees and professional
qualification of audit office employees, as features of audit quality.

25
The features of audit quality that used by Hamdan (2012) in
Nawaiseh (2016) include audit office size, audit fees, client's
retention period, audit office specialization with the industry of the
client, and association between audit office and the international
offices of auditing.
From that several proxies of measuring the audit quality,
this research will use the auditor fees as a measurement of audit
quality. Besides of many research done using the auditor fees as a
measurement or proxy of audit quality (Ahmed, 2012 in
Almomani, 2015, Hamdan and Ijaela 2012, and Nawaiseh 2016),
already proved that auditor fees as a measurement of audit quality
is significantly influence the earning quality. Hamdan and Ijaela
(2012) in Nawaiseh (2016) investigate the existence of earnings
management practices and earnings quality in the industrial public
companies listed in Amman Stock Exchange (ASE), and tests the
impact of auditing quality characteristics (the audit office size, the
connection with global offices, client retention period, auditing
fees, and specialty in client’s industry) on reducing earnings
management practices, and enhancement earnings quality. Data of
45 companies of the industrial sector for the period 2001-2006
were arranged. The most important conclusion of that study was;
the industrial public companies listed in (ASE) have practiced
earnings management each year during the study period, the study

26
itself cannot prove the earnings quality in the companies of the
industrial sector.
Beatty (1989) argued that the nature and extent of agency
costs vary across organizations and this variation may lead CPA
firms to differentiate the quality of their services. Auditing firms
which have relatively greater investments in reputation capital have
greater incentives to maintain this reputation. Beatty (1989) further
proposed that the accounting information disclosed in the financial
statements audited by high reputation firms would be more precise
than that audited by firms with lower investments in reputation, as
this is one manner in which such firms can protect their reputation
capital. Copley (1991) stated that it seems reasonable that
differences in audit quality would be reflected in audit fees.
Specifically, independent-audit consumers, seeking higher levels of
audit quality, will be required to pay a premium price. Audit fees
were regressed against variables intended to measure the marginal
cost of performing the audit. Beatty (1989) argued that the residual
reflects the price paid to a particular audit firm above or below the
average price paid for auditor reputation. Beatty also stated that
financial reports audited by high reputation firms are more precise,
allowing investors to reduce risk by more precisely estimating the
distribution of firm value.

27
3. Earning Management
Scott (2000: 296) states that the selection of accounting
policies done by manager for a particular purpose is called earnings
management. Related to earning information, Statement of
Financial Accounting Concept (SFAC) No.1 states that such
information is a major concern for assessing the performance or
accountability of management. Besides earnings information also
helps users of financial statements in assessing the company's
earnings power in the future. Therefore, management has a
tendency to take action to provide an attractive financial statement
(Guna and Herawati, 2010). Kitiwong et.al. (2012) stated there are
several definitions of earning management and most widely used
definitions of earnings management are Schipper’s (1989) and
Healy and Wahlen’s (1999) definitions. The definitions indicate
that a management’s incentive to exercise earnings management,
its intent to influence reported earnings, and its use of judgment in
the financial reporting process are the main criteria for defining an
activity as earnings management. However, these two definitions
do not indicate how earnings management is associated with
generally accepted accounting principles (hereafter GAAP),
especially whether it is allowed by GAAP. Therefore it is difficult
to distinguish earnings management from a misstatement resulting
from error and/or fraud. Dechow and Skinner (2000) opines that

28
earnings management is the use of accounting choices which are
allowed by GAAP; conversely, fraudulent accounting is those
which do not comply with GAAP. Managed earnings are earnings
which do not result from a neutral treatment but from the use of
aggressive accounting or conservative accounting. In doing so, a
management has to alter real events or to choose accounting
choices. Kitiwong et.al., (2012) states adopting conservative or
aggressive accounting practices through purposely selecting
accounting estimations and assumptions is far preferable to through
structuring real transactions because, as remarked by Goncharov
(2005), operating earnings management is more costly than
accounting earnings management since it affects real cash flows.
Earnings management techniques are also divided into real
operating decisions and pure financial reporting decisions
(Schipper 1989, Peasnell, Pope and Young 2000, Ewert and
Wagenhofer 2005, and Kitiwong et al., 2012). Schipper (1989)
points out that real earnings management is designed to manage the
timing of decision-making on a company’s investments and
production while accounting earnings management is designed to
select accounting techniques allowed by GAAP. Ewert and
Wagenhofer (2005) explain that the management’s interpretation of
accounting standards with intent to make existing standards apply
to existing accounting events and transactions and/or with intent to
29
shift partial earnings between periods is one form of earnings
management. In terms of real earnings management, manager is
required to organize transactions or alter the timing of transactions
to help him/her transform bad news into good news.
The direction of earnings management can be in two
directions, income-increasing earnings management and income-
decreasing earnings management. These depend on a
management’s purpose in managing earnings. Empirical studies
document that management incentive to achieve high rewards, to
take advantage of specific circumstances and to report desirable
numbers are the major causes of earnings management. For
example, in order to maximize bonuses, management’s decision-
making to manage reported earnings upwards or downwards
depends on bonus conditions and the level of pre-managed
earnings. However he/she tends to reduce reported earnings in
order to maximize compensation in the future or to boost future
earnings. A management is likely to use income-decreasing
earnings management with the aim of gaining a government
assistance and protection, deferring earnings to the lower tax rate
period, writing all accruals off before a management’s leaving and
decreasing stock price before a management buyout. He/she
however attempts to report earnings upwards so as to increase
stock prices before stock-to-stock mergers. Smoothing reported
30
earnings is one form of earnings management; it occurs when a
management intentionally fights to smooth a fluctuation of
reported earnings. It leads a management to use income-increasing
and/or income-decreasing accruals. Avoiding reporting losses or
earnings drops and achieving analysts’ forecasts are also key
drivers that induce a management to engage in income-increasing
earnings management (Kitiwong et al., 2012).
Earnings management have been considered as one of the
methods used by the business leaders to mislead their stakeholders
to report unrealistic numbers, despite the various check and
balances (e.g. corporate governance code) on the process.
Nawaiseh (2016) stated that Investors in a company have vital
interest in the earnings reports, and company managers used
earnings management as a strategy to deliberately manipulate
company earnings to match a predetermined target and involves the
planning and execution of certain activities that manipulate or
smooth income, achieve high earnings level and sway the
company’s stock price. That is why “the position” of earning
management is between legal and illegal because if the
management do earning management for only their own interest
but not do it rightly, that earning management is done illegally and
influence the earning reports of a company.

31
In sum, earnings management occurs when management
intends to alter the neutral reporting process in order to report what
he/she wants, rather than to report neutral earnings. However,
neutral earnings (Dechow and Skinner, 2000) or un-managed
earnings (Burgstahler and Dichev, 1997) or real/true earnings
(Copeland, 1968) are difficult to measure and define. This leads to
the problem of how managed earnings are distinguished from
neutral earnings. In essence, discretionary accruals, abnormal
accruals or managed accruals are used to estimate managed
earnings (Kitiwong et al., 2012).
4. Earning Quality
Earnings quality is a central topic in financial accounting
research. Dechow et.al (2010) define earning quality is higher
quality earnings provide more information about the features of a
firm’s financial performance that are relevant to a specific decision
made by a specific decision-maker. And recording to Schipper and
Vincent (2003) the definition of earning quality is an expansion,
where income statement was reported appropriately and in which
there a change of economic assets out of the transactions with the
owner. The terms “quality of earnings” and “earnings quality” have
no single, agreed-upon meaning. Both terms are used when making
accounting choices; considering the business cycle, including
timing of transactions; and discussing earnings management. Some

32
use “quality of earnings” to mean the degree to which
management’s choices of accounting estimates can affect reported
income (these choices occur every period). Some who refer to
“earnings quality” suspect that manager usually will make choices
that enhance current earnings and present the firm in the best light,
regardless of the firm’s ability to generate future, similar earnings
(Weil, 2009).
Dechow and Schrand (2004) stated that the objectives of
financial analysis are to evaluate the performance of the company,
to assess the extent to which current performance is indicative of
future performance, and based on this analysis, to determine
whether the current stock price reflects intrinsic firm value. From
this perspective, a high-quality earnings number is one that
accurately reflects the company’s current operating performance, is
a good indicator of future operating performance, and is a useful
summary measure for assessing firm value. We define earnings to
be of high quality when the earnings number accurately annuitizes
the intrinsic value of the firm. Such earnings are referred to as
“permanent earnings” in the accounting literature (e.g., Black
1980; Beaver 1998; Ohlson and Zhang 1998). Another way to
think about this concept is that earnings are of high quality when
return on equity is a good measure of the internal rate of return on
the company’s current portfolio of projects. An earnings number

33
that represents the annuity of expected future cash flows is likely to
be both persistent and predictable. Persistence and predictability in
earnings alone, however, are not sufficient to indicate that earnings
are high quality. Managers often want earnings to be highly
persistent and predictable because these characteristics can
improve their reputations with analysts and investors. If such
earnings do not annuitize the intrinsic value of the firm, however,
the earnings are low quality. Earnings quality can vary among
companies as a function of accruals even in the absence of
intentional earnings manipulation. Unlike the determination of cash
flows, the determination of earnings requires estimations and
judgments, and some companies require more forecasts and
estimates than others (Dechow and Schrand, 2004).
B. Previous Research
Below are the results from several researches from several
researchers which became the references of this study. The results can be
seen in Table.2.1 below:

34
Table.2.1
Previous Research
No Title
(Researcher,
year)
Research Methodology Research Results
Differentiation Similarities
1 The Impact of
Audit Quality
Features on
Enhancing
Earnings
Quality: The
Evidence of
Listed
Manufacturing
Firms at Amman
Stock Exchange
(Mohammad
Abdallah
Almomani,
2015)
Not use earning
management as
an intervening
variable and
evidence is not
from Indonesia
Stock
Exchange. The
study use
indicators of
quality of audit,
audit office
size, period of
customer's
retention, type
of auditor's
opinion, and the
specialization in
client's industry,
were used to
measure audit
quality
Use audit
quality and
earning
quality as
variables,
used audit
fees as an
audit quality
measurement
and also use
earning of
continuity as a
measurement
of earning
quality and
also used
hypotheses
testing
The study finds
that the earnings of
listed
manufacturing
firms at Amman
Stock Exchange
are with good
quality, and that
there is a linear
relationship
between external
audit quality and
the quality of
reported earnings.
Auditors' fees have
most important
significant effect
on earnings
quality, followed
by auditors'
opinion, where
others factors has
no significant
effect on earnings
quality.
2 Impact of
External Audit
Quality on
Earnings
Management by
Banking Firms:
Evidence from
Jordan
(Mohammad
Ebrahim
Nawaiseh, 2016)
Not use earning
quality as
dependent
variable and not
use earning
management as
an intervening
variable, used
Audit tenure
(AT) and the
international big
audit firms
(INT) as audit
quality
Use audit
quality and
earning
management
as variables,
used audit
fees as audit
quality
measurement
and used
discretionary
accruals as a
measurement
of earning
Audit tenure (AT),
audit fees (AF),
and the
international big
audit firms (INT)
have significant
relations with
earning
management. It
means, future
earning
management
forecast is
predictable based
Continue on the next page

35
Table.2.1 (Continuous)
No Title
(Researcher,
year)
Research Methodology Research Results
Differentiation Similarities
measurements management on audit quality
leading indicators
(audit tenure, audit
fee, and
international big
audit firms). In
addition to
company size, that
is, when external
auditing is
conducted, earning
management
mitigates.
Moreover, no
relationship is
found between
Leverage, ROA,
CFO, and Earning
management
3 The effect of
Audit Quality on
Earning Quality
provided by
Dutch public and
private firms
(Mariska
Pupperhart,
2012)
Not use earning
management as
an intervening
variable, used
utilizing
conservatism as
a measure of
earnings quality
and auditor size
as a measure of
audit quality
Use audit
quality and
earning
quality as
variables also
use public
companies as
sample of
study
High audit quality
enhances
confidence in the
integrity of the
financial reporting
and reduces the
risk attached,
which lead to high
earnings quality
4 Impact of Audit
Quality on
Earnings
Management:
Evidence from
Iran
(Mahdi Safari
Gerayli,
Abolfazl
Earning quality
is not use as
variables and
use earning
management
not as
intervening
variable, used
auditor size,
Use audit
quality and
earning
management
as variables,
used
discretionary
accruals as a
measurement
The results reveal
that discretionary
accruals are
negatively related
to auditor size and
auditor industry
specialization The
study also findings
the negative
Continue on the next page

36
Table.2.1 (Continuous)
No Title
(Researcher,
year)
Research Methodology Research Results
Differentiation Similarities
Momeni
Yanesari, and
Ali Reza
Ma'atoofi, 2011)
auditor industry
specialization
and auditor
Independence
as measurement
of audit quality
of earning
management
association
between auditor
independence and Discretionary
Accruals. Overall,
this study provides
evidence that firms
which are audited
by high quality
auditors are more
likely to have less
Discretionary
accruals
5 Earnings
management and
the effect of
earnings quality
in relation to
stress level and
bankruptcy level
of Chinese listed
firms
(Feng Li, Indra
Abeysekera, and
Shiguang Ma,
2011)
Not use audit
quality as
variable and not
use earning
management as
intervening
variable, used
measurements
of earning
quality by four
separate
earnings
attributes:
accruals quality,
earnings
persistence,
earnings
predictability,
and earnings
smoothness
Use earning
management
and earning
quality as
variables and
using
Discretionary
Accruals as a
measurement
of earning
management
The study finds
that the stressed/
bankrupt firms
prefer
opportunistic
earnings
management; the
non-stressed /non-
bankrupt firms are
more likely to
choose more
efficient earnings
management than
the stressed/ non-
Bankrupt firms.
They find that
earnings
management
performs better
than earnings
quality in
predicting future
profitability. And
they also find that
the earnings
quality has
deteriorated over
Continue on the next page
37
Table.2.1 (Continuous)
No Title Research Methodology Research
Results Differentiation Similarities
the sample
period; the
number of
stressed/
bankrupt firms
increased and the
number of non-
stressed/non-
bankrupt firms
decreased
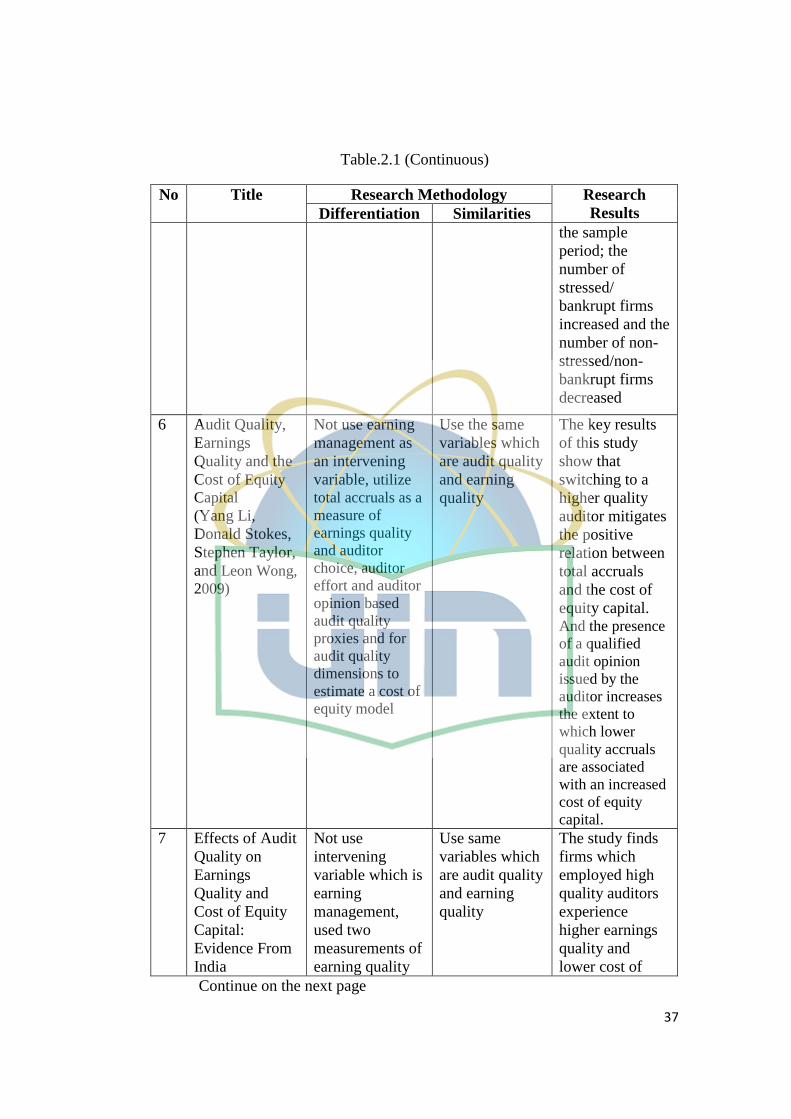
6 Audit Quality,
Earnings
Quality and the
Cost of Equity
Capital
(Yang Li,
Donald Stokes,
Stephen Taylor,
and Leon Wong,
2009)
Not use earning
management as
an intervening
variable, utilize
total accruals as a
measure of
earnings quality
and auditor
choice, auditor
effort and auditor
opinion based
audit quality
proxies and for
audit quality
dimensions to
estimate a cost of
equity model
Use the same
variables which
are audit quality
and earning
quality
The key results
of this study
show that
switching to a
higher quality
auditor mitigates
the positive
relation between
total accruals
and the cost of
equity capital. And the presence
of a qualified
audit opinion
issued by the
auditor increases
the extent to
which lower
quality accruals
are associated
with an increased
cost of equity
capital.
7 Effects of Audit
Quality on
Earnings
Quality and
Cost of Equity
Capital:
Evidence From
India
Not use
intervening
variable which is
earning
management,
used two
measurements of
earning quality
Use same
variables which
are audit quality
and earning
quality
The study finds
firms which
employed high
quality auditors
experience
higher earnings
quality and
lower cost of
Continue on the next page

38
Table.2.1 (Continuous)
No Title
(Researcher,
year)
Research Methodology Research
Results Differentiation Similarities
(Noor Houqe,
Kamran
Ahmed, and
Tony Van, )
which one is
income
smoothing,
using
discretionary
accruals as a
measurement of
earning quality,
and also use cost
of equity capital
as variable
equity capital.
The study result
show that audit
quality will have
a positive effect
on earnings
quality (reducing
discretionary
accruals) and
income
smoothing.
8 The influence
of Corporate
Governance
towards Earning
Quality:
Earning
Management as
an Intervening
Variable
(Singgih Aji
Taruno, 2013)
Not use audit
quality as a
variable, using
corporate
governance
mechanism
(proportion of
independent
board
commissaries
and institutional
ownerships) as
variable
Use earning
quality as
independent
variable and
also use earning
management as
an intervening
variable, use
annual report as
sample, using
same collection
data method
through
documentary
method and also
use path
analysis as an
analysis method
Partial test
results shows
that corporate
governance
mechanisms
affect the quality
of earnings but
do not affect the
earnings
management.
The test results
of path analysis
showed that
earnings
management is
not an
intervening
variable between
corporate
governance
mechanisms on
the quality of
earnings,
because the
direct effect is
greater than the
indirect effects
through earning
management
Continue on the next page

39
Table.2.1 (Continuous)
No Title
(Researcher,
year)
Research Methodology Research
Results Differentiation Similarities
9 Earnings
Management,
Audit Quality
and Legal
Environment:
An International
Comparison
(Mehmet Ünsal
Memiş & Emin
Hüseyin
Çetenak, 2012)
Not use earning
quality as
variable, not use
earning
management as
an intervening
variable, and
using Big4 and
non-Big4 audit
firms as audit
quality proxy
Use audit
quality and
earning
management as
variables, using
discretionary
accruals as a
measurement of
earning
management
From 8 emerging
countries as
samples, only for
Brazilian and
Mexican
companies, there
is significant
relationship
between the
discretionary
accruals and
audit quality. For
the other
countries there is
not significant
relationship.
Along with
results, the big
four auditors do
not constrain the
earnings
management
incentives in
every emerging
Country
10 Earnings
management
and the effect of
earnings quality
in relation to
bankruptcy
level: Firms
listed at the
Tehran stock
exchange
(Ahmad
Ahmadpour and
Masoumeh
Shavsavari,
2016)
Use earning
management as
dependent
variable not as
an intervening
variable and not
use audit quality
as variable,
the earnings
quality is
measured by
four separate
accounting-
based earnings
attributes:
Use earning
management
and earning
quality as
variables, using
discretionary
accruals as
earning
management’s
measurement
Result using
regression
analysis shows
that earnings
management
performs better
than earnings
quality in
predicting future
profitability.
Meanwhile, the
non-
discretionary
earnings more
effectively than
Continue on the next page

40
Table.2.1 (Continuous)
No Title
(Researcher,
year)
Research Methodology Research
Results Differentiation Similarities
accruals quality,
earnings
persistence,
earnings
predictability,
and relate the
study to the
bankruptcy level
future change of
earnings and
future cash flow
from operation
for providing a
future
profitability’s
picture of the
firm.
11 The Effect of
Information
Asymmetry of
Earnings
Quality to
Earnings
Management as
an Intervening
Variable
(Syahrul Azhar,
2013)
Use information
asymmetry as
independent
variable and use
earning response
coefficient as a
measurement of
earning quality
Use earning
quality as
dependent
variable,
earning
management as
an intervening
variable, and
using
discretionary
accruals as a
measurement of
earning
management
The result show
positive
significant result
between
information
asymmetry on
earning
management that
proved high
information
asymmetry will
increase earning
management
acts. And
research result
proved that
information
asymmetry was
not predictor to
earnings quality.
In conclusion,
earnings
management
become
intervening
variable between
information
asymmetry and
earnings quality.
Continue on the next page

41
Table.2.1 (Continuous)
No Title
(Researcher,
year)
Research Methodology Research
Results Differentiation Similarities
12 The Relationship
among Audit
Quality, Earnings
Management, and
Financial
Performance of
Malaysian Public
Listed
Companies
(Cheoing Pei
Ching, Boon
Heng Teh, Ong
Tze San, and
Hong Yong Hoe,
2015)
Use financial
performance as
dependent
variable and not
only use audit as
proxy of audit
quality but also
audit firm size
and audit partner
tenure. Also
earning
management not
only use
discretionary
accruals as proxy
but also absolute
of discretionary
accruals
Use audit
quality as
independent
variable and
use audit fee
as proxy of
audit quality.
And also use
earning
management
as mediating
variable
The findings
indicate that
audit quality
does not actually
constrain
earnings
management
practices and
high audit
quality can
contribute to
better company
financial
performance,
since large-scale
audit firms are
always perceived
to have higher
audit quality that
can increase the
confidence of
investors. And
also, when
earnings
management is
added as a
mediating
variable, it
mediates the
relationship
between audit
quality and
financial
performance

42
C. Conceptual Framework
1. Variable Interrelation
a. Audit Quality and Earning Quality
As a result of failures occurred to business
organizations and the subsequent collapse and bankruptcy
of large and multinational firms, such as Enron,
WorldCom, and other firms, and based on the clear
relationship of these collapses with manipulating the
accounts of these firms, doubts emerged among users of
financial information regarding the credibility of this
announced information, where they depend on, in decision
making. This incredibility and unreliability raise many
questions, including the managements of these firms, and
the effectiveness of accounting standards, and the applied
procedures in firms. Auditors' responsibility and credibility,
audit process, and audit quality, became questionable
directly next to these collapses (Almomani, 2015).
Nowadays, auditors encounter several types of
pressure by users of accounting information in order to
improve the quality of audit, because of several financial
problems exist in periodic financial reports. Audit
profession is required these days to concentrate on efficient
and qualified work force, to provide audit services with

43
high quality, and to be able to reveal any incorrect practices
that managements take to affect the accounting
measurement. Audit report is considered one among the
most important inputs for the decision making process. In
addition, audit quality is a primary requirement for different
groups of users. Actually, audit quality is difficult because
of its difference in nature, to provide trust with audit reports
and financial statements (Scott and Pitman, 2005).
Therefore some parties hope that good quality of
audit can make sure the quality of earnings. Taruno (2013)
used quality of income as variable measurement of earning
quality. And Almomani (2015) used audit office size,
auditors' fees, period of customer's retention, type of
auditor's opinion, and the specialization in client's industry
as measurement of audit quality. He found Auditors' fees
have most important significant effect on earnings quality.
So the hypothesis is:
H1 = Audit quality effect Earning Quality
b. Audit Quality and Earning Management
Every audit process done by auditor wishes by user
to have a good quality so they can believe the financial
report of the company is done correctly or fairly. Several
researches done by a lot of researcher that used the audit

44
quality and the relation with the earning management. A lot
of research done and some from that are done by Almomani
(2015), Nawaiseh (2016) and Li and Lin (2005). Those
researches are using the audit fees as an indicator
measurement of audit quality and using some
measurements to measure the earning management. Audit
fees as a measurement of audit quality here there are some
research proved that audit fees influence the earning
management. Li and Lin (2005) provide evidence that total
fees and audit fees are positively associated with earnings
restatements (as a measurement of earning management).
Other research done by Nawaiseh (2016) finds that audit
fees have significant influence of earning management. So
the hypothesis is as follows:
H2 = audit quality effect earning management
c. Earning Management and Earning Quality
Earning management is an act of managers to
influence the earnings report to become more interesting to
the investors and creditors. Earning management acts will
negatively influence the earning quality that is because the
earning management will not report the actual earning’s
condition (Taruno, 2013). That means the quality of that
earning is in doubt. Generally, about the relationship

45
between earnings management and earnings quality there
are two points of view; in one of them, earnings
management has a useful aspect, and earnings quality is
improved, and the other approach is due to the
opportunistic nature and should improve earnings quality
(Ahmadpour and Shavsavari, 2016). A lot of study done
proved that earning management is better from earning
quality in prediction future profitability. One of the study
from Ahmadpour and Shavsavari (2016) which using four
separate accounting-based earnings attributes: accruals
quality, earnings persistence, earnings predictability;
earnings and is also examined by testing the relationship
between discretionary accruals as a measure of earnings
management, being opportunistic or efficient earnings
management, finds that earnings management performs
better than earnings quality in predicting future
profitability. Other research done by Rosner (2003) also
showed that bankrupt firms manage their earnings in a
continuing way. Also, the results showed that the quality of
earnings have not as much potential at predicting future
profitability. In other words, in the prediction of future
profitability, earnings management, that is better earnings
quality. That means earning management have better

46
performance in predict future probability rather than
earning quality, but there is no found that proved the
earning management effect the earning quality even from
some perspectives shows indirectly that earning
management effect the earning quality. Then the hypothesis
is as follows:
H3 = earning management effect the earning quality
d. Audit Quality and Earning Quality through Earning
Management
Several researches that has been done by many
researchers proved that the audit quality influence the
earning management and also influence the earning quality
with several measurement. And that are also many research
that done (many of) which is proved that earning
management has effect on the earning quality. Then in the
opinion of the researcher that maybe there is some
measurement that will be done in this research that can
proved that earning management can also be a
reinforcement (strengthen) or weakening when the audit
quality affects the quality of earnings.
Almomani (2015) finds audit fees as a measurement
of audit quality have most significant effect earning quality,
followed by type of auditor’s opinion. And Nawaiseh

47
(2016) proved that the audit fees as a measurement of audit
quality have significant relations to the earning
management. High audit quality can contribute to better
company financial performance, since large-scale audit
firms are always perceived to have higher audit quality that
can increase the confidence of investors. However, when
earnings management is added as a mediating variable, it
mediates the relationship between audit quality and
financial performance (Ching et al., 2015). Which are the
earnings also part of financial statement that represents
financial performance. Other research done by Li and Lin
(2005) stated contrary to the concerns of many in
accounting practice and research, as well as the results in
prior research, this study finds no statistically significant
relationship between earnings restatements and non-audit
fees. This does not support the claim that non-audit fees
paid to the auditor are the primary reason for auditor
independence impairment that results in lower audit and
earnings quality. Therefore the hypothesis is as follows:
H4 = audit quality effect the earning quality through
earning management.

48
2. Research Model
Based from the variable interrelation explained above, the
relations between independent, dependent, and intervening variable
in this study can be described as follows:
Figure.2.1
Research Model
Source: Data Processed
D. Hypotheses
Based on the conceptual framework that has been put forward
before, it can be concluded hypotheses of this study as follows:
1. H1 = audit quality effect earning quality
2. H2 = audit quality effect earning management
3. H3 = earning management effect the earning quality
4. H4 = audit quality effect the earning quality through earning
management.
Audit Quality Earning
Management
Earning
Quality

49
CHAPTER III
RESEARCH METHODOLOGY
A. Scope of Research
This research purposes to analyze the causality relation between
independent variable, audit quality towards dependent variable, earning
quality with earning management as an intervening variable. The
population of this research is Services Company listed in Indonesia Stock
Exchange (IDX) in period of time 2013-2015.
B. Sampling Method
Samples of this research are the audited financial report of the
services company listed in Indonesia Stock Exchange (IDX) in period of
time 2013-2015. The method that used in the selection of research sample
is the selection of the sample aiming (purposive sampling), with
techniques based on the consideration (judgment sampling) which is a type
of sample selection is not random that the information obtained by using
certain considerations (generally adapted to the purpose or issue research)
(Nur Indriantoro and Bambang Supomo, 2002: 131). The criteria of
samples for this research are as follows:
1. The sample is a company engaged in services that have
gone public and listed in Indonesia Stock Exchange.

50
2. The sample is the company that report audited financial
statements and annual reports on the time period 2013,
2014 and 2015.
3. The financial statements used are expressed in Rupiahs.
4. Stated professional fees account in financial statement.
C. Collection Data Method
In obtaining the data in this study, researchers used two ways,
library research and documentations research.
1. Library Research
Library Research Studies conducted by processing the
data, journals, articles, and other written media related to the
topic of discussion of this study. Researchers obtain data
relating to the issues being researched through books, journals,
thesis, internet, and other devices related to the title of the
study.
2. Documentation Research
Documentation Research study documentation is a
method of data collection by collecting secondary data used for
settlement in this study. The main data of this research is
secondary data. Researchers obtained data from the Indonesia
Stock Exchange website. In this study, which became the
subject of research is the annual report and audited financial

51
statements. Researchers obtained data by downloading
financial statement on the official website of the Indonesian
stock exchange that is www.idx.co.id and websites of each
company.
D. Data Analysis Method
The analytical tool used in this research is multiple linear regressions
using SPSS, where the regression equation contains elements of
interaction (Multiplication of two or more independent variables). This
interaction test used to determine the extents of interaction between
variables which are audit quality, earning management and earning
quality.
1. Descriptive Statistic
Descriptive statistics provide an overview or description of
the data seen from the mean, standard deviation, variance,
maximum, minimum, sum, range, kurtosis, and skewness (Ghozali,
2012).
Descriptive statistics are based on data that has been
collected and then analyzed. This analysis is used to provide a
description of the research variables (audit quality, earnings
management, and earning quality) which can be seen from the
amount of data, maximum, minimum, average number, range, and
standard deviation.

52
2. Classic Assumption Test
Classic assumption test aims to obtain regression results can
be accounted for and have results that are not biased or Best Linear
Unbiased Estimator (BLUE). Assumptions that must be met are the
normality test, multicollinearity test, heterocedasticity test, and
autocorrelation test.
a. Normality Test
The test will be conducted to audit quality, earning
management, and earning quality. Normality test aims to
test whether the regression model, the independent variable,
dependent variable or both have a normal distribution or
not. The regression model that has a data distribution is
normal or near-normal regression model is said to be good
(Ghozali, 2011). There are two ways to detect whether or
not residual normal distribution, namely by looking at the
analysis graph normal probability plot and statistical tests.
But this research will perform the process of normality tests
for the data with Kolmogorov-Smirnov (K-S) test.
K-S test done by looking the probability number
under the condition:
1) Significant value or probability value is <
0,05; the distribution is not normal.

53
2) Significant value or probability value is >
0,05; the distribution is normal.
Beside of K-S test, the normality of data can also
detect through histogram graph plot, it’s just that the graph
sometimes can mislead because it looks that the
distribution is normal but statistically is not normal
(Ghozali, 2012).
b.Multicollinearity test
Multicoloniarity test aims to test whether the
regression model found a correlation between independent
variables (Ghozali, 2012). To test the multicollinearity, can
be done by using Variance Inflation Factor(VIF) test with
conditions, namely:
1) If VIF (variance inflation factor) is < 10;
2) Have Tolerance value close to > 0,10; and
3) If both criteria above are fulfilled, so can be
concluded that independent variables is not
have multicollinearity problem.
Good regression model should not occur correlation
between independent variable (Ghozali, 2012).
c. Heterocedasticity Test
Heterocedasticity test aims to test whether the
regression model occurred inequalities residual variance

54
from one observation to another observation. If the variance
of the residuals of the observations to other observations
remains, then called Homoscedasticity, and if different
called Heterocedasticity. Good regression model are
homoscedasticity and not occurs the heterocedasticity
(Ghozali, 2012).
This test can be done by looking at the graph plot
between the predicted values of the variable (ZPRED) with
residual value (SREID). A good regression model is if the
residual variance from one observation to another
permanent, so that there is no identifiable heterocedasticity
(Ghozali, 2011).
d. Autocorrelation Test
This test aims to test whether in linear regression
model there is a correlation between confounding error on
period t with confounding error on period t-1 (previous
year). This symptoms cause consequences that confidence
interval becomes wider and also the variance and standard
error will be interpreted too low. Autocorrelation test done
in this research is using Run test. This test is aims to test
whether there is a high correlation between residuals. There
is an autocorrelation between residuals is when the value of
Asymp. Sig (2-tailed) is significant or below 0.05. If more
55
than 0.05 or not significant, it’s mean that there is no
autocorrelation between residuals (Janie, 2012).
3. Coefficient of Determination Test
To test how far the ability of research model in explaining
dependent variable, by calculating coefficient of determination
(R²). The greater adjusted R² of independent variable, so the
more dominant influence of independent variable on dependent
variable.
The adjusted R² value is between zero and up to one. The
R² value which is close to one means the ability of independent
variables gives almost all the information needed to predict the
dependent variable (Ghozali, 2011). The small or under 0,5 of
R² value, means that the ability of independent variables in
explaining dependent variable is very small. And according to
Ghozali (2011), if in the empirical test obtained negative
adjusted R² value, then the value is considered to be zero.
4. Hypothesis Test
In accordance with the data already obtained the
appropriate approach in this study is a quantitative approach, the
approach that emphasizes the figures in the research. From the data
that has been obtained, the number is expected to provide the
appropriate conclusions. This study used samples which are the
services company listed in Indonesia Stock Exchange that report

56
the audited financial statement and annual report and published it
at Indonesia Stock Exchange In the period of time 2013-2015.
If a dependent variable depends on more than one
independent variable, the relation between both variable is called
multiple regression analysis. The test results will provide result
from rejection or acceptance of research hypotheses.
Multiple regression analysis using path analysis is used to
test the hypotheses in this research. Path analysis is the expansion
from multiple regression analysis, or in other words path analysis
is the use of regression analysis to interpret the causality relations
between predefined variables based on theory. The regression
model for this research is as follow:
EQit = β0 + β1LNFEEit + β2EDAit + e
Where:
EQ = Earning Quality
LNFEE = Audit fee as proxy of audit quality
EDA = Estimate discretionary accruals as proxy of earning
management
β1, β2 = each variable coefficient
e = error
To know the truth of prediction from regression testing
done, then carried search value of the coefficient of determination.
And also this study did a testing to support the hypothesis which is
57
t test. T test done to know how far the effect of the independent
variable on dependent variable. And below will explain how to
measure of each variable.
E. Research Variables Operationalization
In this section will describe the definition of each variable used
along with operations and measures.
1. Earning Quality (Dependent Variable)
Dependent variable in this study is earning quality,
which is a quality of company’s earning to determine
whether the company has a “good quality” of earning or
not. Quality of Income is used in the study as a proxy
variable to represent quality of earnings. Based on the
literature, one method for measuring earnings quality is
through the quality of income which is determine whether
the earnings quality has a high quality or low quality
(Taruno, 2013). In accounting, accruals earnings do not
necessary reflect cash flow. Then logic behind the quality
of income ratios is high quality of earnings should reflect
the cash flow (from operation) of the organization or in
other words, the quality of income is how accurately the net
income reflects the operating performance of an entity. This
concepts related to the concepts of earnings quality that

58
usually indicates how precisely the earnings measure the
value of an entity and reflect the entity’s current and future
performance.
First variable measure is earning quality. Based on
the literature, there is a lot of method for measuring
earnings quality, such as earning continuity or earning
persistence, income smoothing, quality of income and etc.
Whether this study used the quality of income ratios which
is in accordance with previous research done by Taruno
(2013). The formula is as follows:
Quality of Income =
If the results is higher than 1 it’s usually indicates
high quality of earnings, while the ratio is lower than 1 is
considered to indicate low quality of earnings. This
research used the quality of income ratios as a measurement
of an earnings quality.
2. Earning Management (Intervening Variable)
Intervening variable is a variable that can strengthen
or weaknesses the other variable. Intervening variable in
this study is an earning management. Earning management
is an act of managers to adjust financial reports using their
judgment in order to influence contractual outcomes that
based upon reported accounting data or to mislead

59
stakeholder about firm’s performance (Nawaiseh, 2016).
This variable is using estimate discretionary accruals
(EDA) as a variable measurement. Earning management
can occur because in preparing the financial statement
using accrual basis. Accounting with accrual basis using the
accrual procedure, deferral, allocation aimed to connect the
earning, expense, gains and losses to describe the
company’s performance during the period, although cash
has not been received and expanded (Sulistyanto, 2008).
And according to Healy (1985) accrual concept has two
components, and one of them is discretionary accruals.
Discretionary accrual is an accrual component which can be
arranged and manipulated in accordance with the
managerial policy. Manager will conduct earnings
management by manipulating the accruals to achieve the
desired level of earnings.
Second variable in this study is earning
management, which researcher used estimate discretionary
accruals to measure earnings management. Discretionary
accruals are used in many earnings management studies
such as Jones (1991), Subramanyam (1996) and also
Memiş and Çetenak (2012). Basically, discretionary
accruals are equal to difference between total accruals and

60
non discretionary accruals so following equation has been
used to find the discretionary accruals. The formula that
use for looking total accruals is as follows:
TAt = DAt + NDAt
TAt = Total Accruals
DAt = Discretionary Accruals
NDAt = Nondiscretionary Accruals
At = Total Assets in year t
Which is to finds discretionary accrual is as follows
(Christiani and Nugrahanti, 2014):
DAt = (TAt - NDAt)/At
The empirical estimation of modified Jones model
required to compute total accruals. Along the lines of prior
research (Healy, 1985; Jones, 1991; and Memiş and
Çetenak 2012), this study uses the cash flow approach to
compute total accruals as follows:
TAi,t = NIBEi,t- CFOi,t
NIBEi,t = company i’s net income before extraordinary
items in year t.
CFOi,t = company i’s net cash flow from operations in year
t.

61
Dechow et al., (1996) provides evidence that the modified
Jones model is the most powerful to detect earnings
management among the alternative models to measure
discretionary accruals. Thus the study used a modified
version of the Jones model to obtain discretionary accruals
from regressions of total accruals on changes in sales and
on property, plant, and equipment within industries. Jones
model attempts to control for the effects of changes in a
firm's economic circumstances on nondiscretionary
accruals. The Jones Model for nondiscretionary accruals in
the event year is:
NDAt = β1 (1/At-1) + β2 (ΔREVt- ΔRECt/ At-1) + β3
(ΔPPEt/At-1)
Where:
NDAt = the nondiscretionary accruals in year t
scaled by lagged total assets;
∆REVt = revenues in year t less revenues in year
t−1,
∆RECt = net receivables in year t less net
receivables in year t−1,
PPEt = gross property plant and equipment at the
end of year t;
At−1 = total assets at the end of year t−1; and

62
β1, β2, β3 are company-sector parameters for each
company.
Estimates of the industry-specific parameters, β1, β2 and
β3, are obtained by using the following model in the
estimation period for each sector of company:
TAt/At-1 = NDAt = β1 (1/At-1) + β2 (ΔREVt- ΔRECt/ At-1) + β3
(ΔPPEt/At-1) + Ԑ t
Where: β1, β2 and β3, denote the company-sector specific
OLS parameters, and TAt is total accruals in year t, εt is the
residual, which represents the discretionary portion of total
accruals.
Because of this study using estimate of
discretionary accruals as measurement of earning
management which is in accordance with previous research
done by Taruno (2013) and also Syarifah and Bandi (2010).
Then the formula to measure estimate discretionary
accruals is using Healy model and the following is formula
of measuring estimate of discretionary accruals.
EDAit = TAit: Ait-1
Where:
EDA = estimate discretionary accruals
TA = total accruals
A = Total assets

63
it = current year
3. Audit Quality (Independent Variable)
Independent variables are variables that affect the
dependent variable, either positively or negatively. If there
is a dependent variable, the independent variables must also
be present, and in each unit increase in the independent
variable nature there will be also an increase or decrease in
the dependent variable. Independent variable in this study is
audit quality. Audit quality is how the quality of the audit
done by auditor. Malihi et al. (2012) provides further
explanation that audit quality could be a function of the
auditor’s ability to detect material misstatements and
reporting the errors. From the explanation conclude that
good quality of audit is guarantee that the audited financial
statement has already free from material misstatement. The
audit quality as an independent variable using audit fee as a
variable measurement. As Copley (1991) and Nawaiseh
(2016) proved that the audit fees can used as a variable
measurement, because independent-audit consumers,
seeking higher levels of audit quality, will be required to
pay a premium price.
The audit fee is amount that independent auditor
earn from the company. Copley (1991) stated that the

64
financial statements audited by high reputation firms would
be more precise than that audited by firms with lower
investments in reputation, as this is one manner in which
such firms can protect their reputation capital, which shows
differences in audit quality would be reflected in audit fees.
Specifically, independent-audit consumers, seeking higher
levels of audit quality, will be required to pay a premium
price. That’s mean the quality of audit is can be reasonably
to use audit fees as a measurement. Picconi and Reynolds
(2013) regressing the natural logarithm of fees on a set of
predictor variables, including the natural logarithm of
assets, which has become the de facto standard functional
form for estimating audit fees. They demonstrate, this
represents a multiplicative model of fees in which all the
predictor variables interact and where predicted coefficients
represent elasticities; constant elasticity between fees and
assets, and linearly increasing elasticity between fees and
the other predictors. They also showed that the actual
elasticities do not exhibited these properties, but that
regressing by year and size partitions improves the
estimation, greatly increases the explanatory power of the
model, and produces residuals uncorrelated with size.

65
Based on Pambudi and Ghozali (2013) an audit fee
was measured by natural logarithm professional fees
contained in the financial statements. Using professional
fees as proxy for audit fees because in Indonesia still few
company disclose their audit fees on their financial
statements. The use of measurement with professional fees
also based on research done by Herawaty (2011) that stated
the used of other services also effect audit fees. Below is
the variable operationalization of this study:

66
Table.3.1
Variable Operationalization
No Variable Type of
Variable
Indicator Measurement
Scale
1 (X1)
Audit Quality
(Herawaty, 2011,
Hartadi, 2009)
Independent LNFEE = LN
Professional Fee
Ratio
2 (X2)
Earning
Management
(Nawaiseh, 2016,
Christiani and
Nugrahanti, 2014)
Intervening EDA = TAt/At-1 Ratio
3 (Y)
Earning Quality
(Taruno, 2013)
Dependent EQ = Net Cash
Flow from
Operations/EBIT
Ratio

67
CHAPTER IV
FINDING AND ANALYSIS
A. General Description of Research Object
1. Research Object Description
The population of this research is go public service
company listed in Indonesia Stock Exchange (IDX) in period
2013-2015. The services company has listed in IDX before January
first 2013 and during the research period the company does not get
out from IDX or delisting. Service industry is chosen because in
Indonesia, service sector is very developing either in construction,
transportations, etc. In addition to avoid the existence of industrial
effect, namely the risk of different industries between one industry
sector to another.
Table.4.1
Detail of Research Sample
No Details Amount
1 Service Company Listed in Indonesia Stock
Exchange
103
2 Not published financial statement in period
between 2013-2105
10
3 Reported the financial statement besides in
Rupiahs unit
41
4 Not stated professional fees 22
The amount of company being sample 30
Observation period (2013-2015) 3
Total of Sample during study period 90
Source: Processed Data
68
The table above is present the amount of research sample
which appropriate with predefined criteria. The number of service
companies that being sampled in this research are 30 companies.
The company being sample in this research has been met with
predefined criteria before in previous chapter of this research. The
length of the study period is 3 years, i.e. from 2013-2015. So the
total of sample in this research is 90 sample observations. The
focus of this research is to see the effect of audit quality on earning
quality with earning management as intervening variable on
service industry.
2. Research Sample Description
The samples used in this research were selected by
purposive sampling method using criteria that have been
determined. Samples are selected for companies that present
required data in this study, such as professional fees account, some
accounts required to calculate estimate discretionary accruals as
proxy of earning management, and also some accounts required to
calculate quality of income as a proxy of earning quality. Summary
of study sample is presented in the following table.

69
Table.4.2
Research Sample
No Type of Business Year 2013 Year 2014 Year 2015
1 Advertising
Printing Media
1 1 1
2 Bank 3 3 3
3 Insurance 2 2 2
4 Hotel, Restaurant,
and Tourism
1 1 1
5 Property& Real
Estate
13 13 13
6 Construction &
Development
1 1 1
7 Energy 1 1 1
8 Toll Road, Airport,
Harbour and etc
1 1 1
9 Telecommunication 2 2 2
10 Transportation 3 3 3
11 Non Building
Construction
2 2 2
Total 30 30 30
Accumulation 90
Source: Processed Data
Table 4.3 below shows that selected sample is randomly
distributed in 11 service industry sectors. Most companies come
from property and real estate sector which is 13 companies or
43,33%, followed by transportation and also bank sector with 10%
and the remainder sector of other type of business. Below is the
distribution of research sample.

70
Table.4.3
Research Sample Distribution
No Type of Business Frequency Percentage
(%)
1 Advertising Printing Media 1 3,33
2 Bank 3 10
3 Insurance 2 6,67
4 Hotel, Restaurant, and Tourism 1 3,33
5 Property& Real Estate 13 43,33
6 Construction & Development 1 3,33
7 Energy 1 3,33
8 Toll Road, Airport, Harbour
and etc
1 3,33
9 Telecommunication 2 6,67
10 Transportation 3 10
11 Non Building Construction 2 6,67
Total 30 100
Source: Processed Data
B. Analysis and Discussion
1. Descriptive Statistics Analysis
Descriptive statistic analysis done by comparing minimum,
maximum and mean values of each variable. Descriptive statistic
analysis on table 4.4 is a descriptive analysis for variable used in
this study which is (audit quality, earning management and earning
quality.

71
Table.4.4
Descriptive Statistic Analysis in Period 2013-2015
N Minimum Maximum Mean Std.
Deviation
LNFEE 90 18.83 28.64 22.2494 1.97576
EDA 90 -.41 1.50 .0287 .19049
EQ 90 -3.14 5.97 .4819 1.31652
Valid N
(listwise)
90
Source: Processed Data
Based on the table 4.4, from 30 companies being sample,
the mean value of LNFEE that represent audit quality is 22,2494
and maximum and minimum value is 28,64 and 18,83. LNFEE
variable have mean value bigger than standard deviation which
means that distribution data of variable is good. EDA or estimate
discretionary accrual represent earning management variable have
mean value 0,0287, minimum -0,41 and maximum 1,50. And for
earning quality variable which represent by EQ have mean value
0,4819. And the minimum and maximum value is -3,41 and 5,97.
EDA and EQ variable has mean value smaller than standard
deviation which means the distribution data of both variables is not
quite good.
2. Classic Assumption Test Result
a. Normality Test Result
Normality test aims to test whether in regression model,
independent variable, dependent variable, or both has normal
distribution or not. Good regression model has normal

72
distribution of data or close to normal (Ghozali, 2012). Data
normality tests in this research done by klomogorov-Smirnov
(K-S) test.
Table.4.5
Klomogorov-Smirnov Test Result
Unstandardized
Residual
N 90
Normal Parametersa,b
Mean 0E-7
Std. Deviation 1.18493141
Most Extreme
Differences
Absolute .134
Positive .134
Negative -.094
Kolmogorov-Smirnov Z 1.267
Asymp. Sig. (2-tailed) .081
Source: SPSS Output
Asymp. Sig (2-tailed) on klomogorov-Smirnov test result is
0,081 which is more than 0,05. From the result can be
concluding that the distribution of data in this research is
normal.
b. Multicollonearity Test Results
This test aims to examine whether regression model found
correlation between independent variable. Multicollonearity test
done by using Tolerance value or Variance Inflation Factor
(VIF).To know the existence or absence of multicollonearity by

73
looking a tolerance value or Variance Inflation Factor (VIF).
General Cut Off value use to show the existence of
multicollonearity is tolerance value ≤ 0,10 or equal to VIF value
≥ 10. If tolerance value is under 0.10 or VIF value above 10
then there is a multicollonearity. Multicollonearity test result is
on the table below.
Table.4.6
Multicollonearity Test Result
Model Collinearity Statistics
Tolerance VIF
1 (Constant)
LNFEE
EDA
.998
.998
1.002
1.002
Source: SPSS Output
The table above show that there is no independent variable
has tolerance value less than 0,10 or tolerance value > 0,10. VIF
result is 1,002 shows that there is no independent variable more
than 10 or VIF < 10. So can be concluding that there is no
multicollinearity in this regression model.
c. Heteroscedasticity Test Result
Heteroscedasticity test aims to test whether in regression
model there is an inequality variance of the residual of one
observation to others. If variance of residual one observation to
another observation fixed or same, then it is called
homocedasticity and if different it is called heteroscedasticity.

74
Good regression model is homoscedasticity or does not occur
heteroscedasticity (Ghozali, 2012).
Figure 4.1
Scatterplot Graphic
From the scatterplot chart above shows that the spots are
randomly distributed either above or below 0 (zero) on Y axis
and do not form certain pattern dominantly. This result shows
the regression model is not experiencing heteroscedasticity
disturbance or called homoscedasticity.
d. Autocorrelation Test Result
Autocorrelation test is used to determine and detect the
presence of autocorrelation. The autocorrelation test aims to test
whether in the linear regression model there is a correlation
between confounding error in period t and period t-1 (previous

75
year). A good model is a regression model that is free from
autocorrelation (Ghozali, 2012). Autocorrelation in this research
is using Run Test to see there is an autocorrelation between
residuals.
From the run test result below shows that Asymp. Sig. (2-
tailed) is 0,396 which is more than 0,05. Its means that
regression model in this research is free from autocorrelation
problem or the other words, there is no autocorrelation. (Janie,
2014)
Table.4.7
Run Test Result
Unstandardized
Residual
Test Valuea -.08546
Cases < Test Value 45
Cases >= Test Value 45
Total Cases 90
Number of Runs 50
Z .848
Asymp. Sig. (2-tailed) .396
Source: SPSS Output
3. Coefficient of Determination Test Result
The coefficient of determination (R²) essentially measures
how far the model’s ability to explain the variation of dependent
variable. The value of coefficient of determination is between
zero and one. Small R² value means the ability of independent

76
variables in explaining dependent variable variation is limited
(Ghozali, 2012).
a. The Coefficient of Determination Equation I
Table.4.8
Coefficient of Determination Equation I Test Result
Model R R
Square
Adjusted
R Square
Std. Error of
the Estimate
1 .048a .002 -.009 .19135
Source: SPSS Output
The table above is known R² value is 0,002.
This means 0,2% earning management variation can
be explained by independent variable variation which
is audit quality. While the remainder are (100% -
0,2% = 99,8%) explained by other causes beyond
model such as company size, leverage, audit
committee, independence commissioner, and etc.
e1 = √ = √ = √ = 0,999
b. The Coefficient of Determination Equation II
Table.4.9
Coefficient of Determination Equation II Test Result
Model R R Square Adjusted R
Square
Std. Error of
the Estimate
1 .436a .190 .171 1.19847
Source: SPSS Output
From the table above, known the R² value is
0,190 or 19%. This means 19% of earning quality
variation can be explained by the variation of

77
independent variable which is audit quality and
earning management. While the remainder is 81%
(100% - 19%) explained by other variable that not
include in regression model, such as information
asymmetry, audit adjustment, and etc.
e2 = √ = √ = √ =
0,900
c. Coefficient of Determination Total
R² = 1 – (e1)2 x (e2)
2
= 1- 0,998 x 0,810
= 0,192
Based on the calculation above, total
coefficient of determination is 0,192. This means
that earning quality variable can be explained by
audit quality variable with earning management as
intervening variable is 19,2%. While the remainder
is 80,8% explained by other variable outside the
regression model, such as inflation, asymmetry
information, audit tenure, audit committee, and
others variable that may influence earning quality.
4. Hypothesis Test Result
The hypotheses test in this research is using path analysis.
According to Sarwono (2007) there is several definition of path

78
analysis which first by Robert D. Rutherford and Minja Kim Chloe
(1993) defines path analysis as a technique to analyze the causality
relation that happens on multiple regressions if independent
variables influence the dependent variable not only directly or
indirectly. And according to Paul Webley (1997) path analysis is
the direct development of multiple regression forms with the aim
of providing an estimate of the level of magnitude significance
hypothetical causality relation in asset of variables. So based on
several definitions above, path analysis is used to analyze the
pattern of relationship between variables with the aim to determine
the direct and indirect influence of a set of independent variables to
the dependent variable.
a. Significant Partial Test (t-test)
Individual parameter significance test is (t statistics test)
used to see partially effect of independent variable on dependent
variable. To interpret coefficient of independent variable can
used unstandardized coefficients or standardized coefficients.
This study used standardized coefficients so there is no the
constant. The benefit of using standardized beta is that able to
eliminate the different of size unit on independent variable
(Ghozali, 2012).

79
1) Direct Regression
Table.4.10
Direct Regression Test Result
Coefficientsa
Model Unstandardized
Coefficients
Standardized
Coefficients
t Sig.
B Std. Error Beta
1 (Constant) -4.408 1.498 -2.943 .004
LNFEE .220 .067 .330 3.278 .001
Source: SPSS Output
Based on the result on the table above, known that
standardized coefficient of LNFEE is 0,330 or 33%, which
explain that effect of LNFEE to EQ is 33% ant the rest 67%
is effect from other variable that not include in this study.
And Sig. value shows 0,001 which is less than 0,005 or
0,001<0,005. From the Sig. value can conclude that audit
quality (LNFEE) is positive and significant effect the
earning quality (EQ).
H1 = Audit quality effect earning quality is
accepted.

80
2) Regression I
Table.4.11
Regression I Test Result
Coefficientsa
Model Unstandardized
Coefficients
Standardized
Coefficients
t Sig.
B Std. Error Beta
1 (Constant) -.075 .229 -.326 .745
LNFEE .005 .010 .048 .453 .652
Source: SPSS Output
Based on the regression on table above, audit
quality (LNFEE) statistically show standardized coefficient
value is 0,048 and Sig. 0,652. LNFEE variable show
positive and insignificant result on α=0,005, it’s 0,652. So it
can be concluded that audit quality (LNFEE) to earning
management (EDA) is rejected. Therefore, audit quality is
not effect earning management.
H2: Audit quality effect earnings management is
rejected.
3) Regression II
The table below shows LNFEE and EDA variable
has Standardized Coefficient Beta value are 0,344 and -
0,285. LNFEE variable has positive result 0,344 and
significant result 0,001 which is less than α 0,005. But EDA

81
variable shows negative and significant result which is -
0,285 and 0,004.
Table.4.12
Regression II Test Result
Coefficientsa
Model Unstandardized
Coefficients
Standardized
Coefficients
t Sig.
B Std.
Error
Beta
(Constant) -4.555 1.437 -3.170 .002
LNFEE → EDA .005 .010 .048 .453 .652
LNFEE → EQ .229 .064 .344 3.556 .001
EDA → EQ -1.971 .668 -.285 -2.952 .004
Source: SPSS Output
The indirect effect of audit quality to earning quality
(which is through earning management) is 0,048 x -0,285 =
-0,014. Therefore, direct effect of audit quality to earning
quality is bigger than indirect effect through earning
management (0,330 > -0,014). So it can be concluded that
earning management as intervening variable is rejected.
And the value of e1=0,999 and e2=0,900.
H3: earning management effect earning quality
is accepted.
H4: audit quality effect earning quality through
earning management is rejected.

82
Figure.4.2
Path Analysis Result
0,990 0,330
0,048 -0,285
0,900
5. Interpretation
a. Effect of Audit Quality on Earning Quality
From the results above, audit quality has effect to earning
quality. This result is appropriate with the previous research
done by Almomani (2015), on research title The Impact of
Audit Quality Features on Enhancing Earnings Quality: The
Evidence of Listed Manufacturing Firms at Amman Stock
Exchange.
From t-test results show that audit quality on earning
quality has significant value 0.001. This significant value
indicates that audit quality has effect on earning quality. And
standardized coefficient result is 0,330 which mean the effect of
audit quality is 33% on the earning quality. Because of the
association exists between audit quality and quality of financial
information, and since these statements had been audited by
professional, qualified, and independent auditors, the financial
Audit
Quality
e1
Earning
Quality
Earning
Management
e2

83
information is assumed to be of high quality, and this is the base
to enhance trust among different interested parties with the firm.
So, on the other words, the client who is the principal will
believe the earnings information stated after audited (Almomani,
2015).
b. Effect of Audit Quality on Management Earning
Hypothesis testing results shows that audit quality is not
effect the earning management. This not appropriate with
previous research done by Nawaiseh (2016) on his research title
Impact of External Audit Quality on Earning Management by
Banking Firms: Evidence from Jordan which stated that audit
quality with audit fee as a proxy is effect earning management.
However this results appropriate with research done by
Ananthanarayan (2008) that audit fee is not effect earning
management. This is because the data of audit quality which use
audit fee as proxy in this research is used professional fee which
is general, maybe it will be different if using the accurate data of
audit fee especially not general like professional fee (Herawaty,
2011).
Beatty (1986) stated that company especially large
company tends to pay audit fee more to get best quality of audit
from the public accountant. With big audit fee gives by the
client, they expect to get fair result on their earnings. So the

84
earnings on financial statement is can be trusted the validity and
the quality. Therefore, expected that auditor cannot be affected
act of management and report whatever happened and done by
management including management of the company’s earnings.
So audit result will show real and fair result.
c. Effect of Earning Management on Earning Quality
This research gives result that earning management is
negative significant influence on earning quality. Test result
show negative result and negative sign on path coefficient
indicate that improvement of earnings management have an
effect on the decrease of earning quality. This result is
appropriate with previous research done by Azhar (2013) which
stated negative significant result on the effect of earning
management towards the earning quality.
But, this result is opposite with the result done by Taruno
(2013) which shows that earning management have positive and
significant result on earning quality. According to him, earning
management effect earning quality based on the path analysis
results done.
d. Effect of Audit Quality on Earning Quality through Earning
Management as an Intervening Variable
The result showed that audit quality on earning quality has
a direct relationship. Therefore, indirect relationships between

85
audit quality on earning quality towards earning management as
intervening variable is rejected. Because t-test results indicate
that direct relation audit quality on earning quality is bigger than
indirect. This test result proved earning management is not
effect earning quality and according to Ahmadpour and
Shavsavari (2016) earning management is performs better than
earning quality in predicting future probability than earning
quality.
The research that also found the relation between audit
quality on earning quality is research done by Almomani (2015),
which is in accordance with this study result. This because of
good audit quality can help the principals to believe on earnings
result stated in financial statement presented by management
with no manipulation or other illegal act that can decrease
quality of the earnings.
Analysis test results also indicate that direct relations has
bigger results (0,330 > -0,014) compare with indirect result
through the earning management. This because effect of earning
management on earning quality is negative significant which
means that increasing of earning management will decrease
quality of earnings (Azhar, 2013). And the other side audit
quality has positive insignificant result on the effect of earning
management. And that so principals ask help from auditor to

86
audit the earnings on financial statement is to ensure that
management not done illegal earning management that will
affect quality of the earnings. But the other side with high level
of audit quality (with audit fee as proxy) expects that auditor
will not influence act by management. Therefore there is no
relation between audit fees on earning management.
This result is consistent with previous research done by
Taruno (2013) that also proved earning management variable
cannot be intervening variable of earning quality.

87
CHAPTER V
CONCLUSIONS
A. Conclusions
Based on collected data and tests that have been done to the problems
by using multiple regression analysis model which is path analysis, so can
be concluded as follows:
1. Test result proved earning quality has direct effect on earning
quality and from standardized coefficient result from t test result,
the effect of audit quality on earning quality is as much as 33%,
and the remainder is from other variable which not include in this
study. This result appropriate with previous research done by
Almomani (2015) which stated audit quality with audit fee as a
proxy is effect the earning quality.
2. There is no direct effect of audit quality on earning management
based on the test results which show significant value is 0,652.
This result is consistent with the research result done by
Ananthanarayanan (2008) which stated audit quality not effect
earning management.
3. The test results show there is negative effect of earning
management on earning quality with sig. value 0,004 and
standardized coefficient is -0,285 or -28,5%. This result is

88
consistent with research done by Azhar (2013) which stated
increase of earning management will decrease quality of earning.
4. Indirect effect of audit quality on earning quality through earning
management as an intervening variable is rejected, because based
on the result already explained before that direct effect of audit
quality on earning quality is bigger than indirect effect through
earning management. Therefore, earning management as
intervening variable of audit quality to earning quality is rejected
so the earning management is not intervening variable of audit
quality and earning quality. This result consistent with the previous
research done by Taruno (2013).
B. Implications
Conclusions above stated that the quality of audit is positively
effect on earning quality through the earning management. Therefore,
these things need to be concern for all parties, namely:
1. For company, it is expected this research results can give an idea
that earning management practices effect the earning quality that
can cause unexpected things for the company. So the company will
be more thorough and tighten rules for employee even its top,
middle and bottom to minimize the probability to do the harmful
actions or behavior in the future.

89
2. For auditor, it is expected that this research results can be a special
concern so auditor can increase their level of independency and
quality of their audit. Auditor should increase their integrity so
they can limits the earning management practices for internal
auditor and for external auditor it is expected that they can
successfully detect the earning management practices that can
influence the quality of earnings of the client's financial statement
so they can give correct and complete information for their client
and not influence by the other parties even they paid for high audit
fee.
3. For external parties, such as shareholder and investors, it’s better to
not simply believe that audited company can limit the practice of
earning management. Investor control should also be increased so
as to minimize the practice of earnings management so cannot
effect or manipulate the quality of the resulting earnings.
C. Recommendation
In the future, this research expected can present better quality of
research results with some input on several things, including:
1. For future research, it is expected to add research variables such as
information asymmetry, financial status, leverage, inflations, one-
time events, liberal accounting practices and other economic

90
conditions that may affect earning quality or other variables that
are still rarely used in research until the present period.
2. For future research, expect can consider to use all of company
listed in Indonesia Stock Exchange as research population. Because
the sample size in this study is considered too little which is limited
only to service companies in some subsectors of service industry
that listed on the Indonesia Stock Exchange.
3. Next research is expected to expand or extend the research period
so can get more research results and accurate conclusions which
describe the relation between audit quality and earning
management on earning quality.
91
REFFERENCES
Ahmadpour, A. and Shahsavari M. 2016. Earnings Management and the Effect of
Earnings Quality in Relation to Bankruptcy Level (Firms Listed at the
Tehran Stock Exchange). Iranian Journal of Management Studies (IJMS),
Vol. 9, No.1: pp. 77-99.
Aljabr, Y. 2011. The Role of Non Executive Members of the Board of Directors
in the Auditor Choice: Evidence from Saudi Arabia. Journal of King Saud
University- Business Administration, Vol.22 No.1, pp. 19-28.
Almomani, M.A. 2015. The Impact of Audit Quality Features on Enhancing
Earnings Quality: The Evidence of Listed Manufacturing Firms at Amman
Stock Exchange. Asian Journal of Finance & Accounting, Vol.7, No.2.
Ananthanarayan, U. 2008. The association between auditors' fees and earnings
management in New Zealand. Master of Business Thesis of Auckland
University of Technology.
AU Section 339. Audit Documentation. Statement of Auditing Standards No.93.
Azhar, S. 2013. The Effect of Information Asymmetry on Earnings Quality to
Earnings Management as an Intervening Variable. Journal of Economic
Faculty of Surabaya State University.
Beatty, R.P. 1989. Auditor Reputation and the Pricing of Initial Public Offerings.
The Accounting Review Vol.64 No.4, pp. 693-709.
Becker, C.L., et.al. 1998. The Effect of Audit Quality on Earnings Management.
Contemporary Accounting Research, Vol. 15 No. 1 (Spring 1998) pp. 1-
24.
Bellovary, J.L., et.al. 2005. Earning Quality: It’s Time to Measure and Report.
The CPA Journal, pp. 32-37.
Burgstahler, D. and Dichev I. 1997.Earning Management to Avoid Earning
Decreases and Losses. Journal of Accounting and Economics, Vol. 24 (1):
pp. 99-126
Copeland, R.M. 1968. Income Smoothing. Journal of Accounting Research,
Vol.6, Empirical Research in Accounting Selected Studies pp. 101-116.
Copley, P.A. 1991. The Association between Municipal Disclosure Practices and
Audit Quality. Journal of Accounting and Public Policy, 10, 245-266.

92
Chen, F., et al., 2011.Financial Reporting Quality and Investment Efficiency of
Private Firms in Emerging Markets. The Accounting Review, Vol.86 No.4,
pp. 1255-1288.
Chen, K. Y., Lin K., and Zhou J. 2005. Audit Quality and Earnings Management
for Taiwan IPO firms. Managerial Auditing Journal, Vol. 20 No.1, pp. 86-
104.
Ching, C.P., et.al. 2015. The Relationship among Audit Quality, Earnings
Management, and Financial Performance of Malaysian Public Listed
Companies. International Journal of Economics and Management, Vol.9
No.1, pp. 211 – 229.
Christiani, I. and Nugrahanti Y.W. 2014. Pengaruh Kualitas Audit terhadap
Manajemen Laba. Jurnal Akuntansi dan Keuangan, Vol. 16, No. 1, pp. 52-
62.
Clinch, G., Fuller D.L., Govendir B., and Wells P. 2010. The Accrual Anomaly:
Australian Evidence. Accounting and Finance, Vol.52 No.2, pp. 377-394.
DeAngelo, L.E. 1981. Auditor Size and Audit Quality. Journal of Accounting and
Economics Vol.3, pp. 183-199. North-Holland Publishing Company.
Dechow P.M. and Schrand C.M. 2004. Earning Quality. Research Foundation of
CFA Institute.
Dechow, P.M. and Skinner, D. J. 2000. Earnings Management: Reconciling the
Views of Accounting Academics, Practitioners, and Regulators.
Accounting Horizons Vol.14 No.2, pp. 235-250.
Dechow, P. M., et al. 2010. Detecting Earnings Management: A New Approach.
Berkeley: University of California.
Dechow, P.M., et.al. 2010. Understanding Earnings Quality: A Review of The
Proxies, Their Determinants and Their Consequences. Journal of
Accounting and Economics Vol.50, pp. 344–401.
Ewert, R. and Wagenhofer A. 2005. Economic Effects of Tightening Accounting
Standards to Restrict Earnings Management. The Accounting Review
Vol.80 No.4, pp. 1101-1124.
Francis, J.R., Maydew, E.L. and Sparks H.C. 1999. The Role of Big 6 Auditors in
the Credible Reporting of Accruals. Auditing: A Journal of Practice &
Theory Vol.18 No.2, pp. 17-34.
93
Francis, J., Lafond, R., Olsson, P., & Schipper, K. 2004. Costs of equity and
earnings attributes. The Accounting Review Vol.79 No.4, pp. 967-1010.
Francis, J., Huang Z., Rajgopal, S., & Zang A.Y. 2008. CEO Reputation and
Earnings Quality. Contemporary Accounting Research Vol.25 No.1
(Spring 2008), pp. 109-147.
Gerayli, M.S., et.al. 2011. Impact of Audit Quality on Earnings Management:
Evidence from Iran. International Research Journal of Finance and
Economics, Issue Vol.66, Euro Journals Publishing, Inc.
Ghozali, Imam. 2011. Aplikasi Analisis Multivariate dengan Menggunakan
Program SPSS. Univertitas Diponegoro, Semarang.
Goncharov, I. Earnings Management and Its Determinants: Closing Gaps in
Empirical Accounting Research. Frankfurt: Peter Lang GmbH.2005.
Guna, W.I. and Herawaty A. 2010. Pengaruh Mekanisme Good Corporate
Governance, Independensi Auditor, Kualitas audit dan Faktor Lainnya
terhadap Kualitas Laba. Jurnal Bisnis dan Akuntansi Vol. 12 No.1, Hlm.
53-68.
Hartadi, Bambang. 2009. Pengaruh Fee Audit, Rotasi KAP, dan Reputasi Auditor
Terhadap Kualitas Audit di Bursa Efek Indonesia. Jurnal Ekonomi dan
Keuangan.
Healy, P. 1985. The Effect of Bonus Schemes on Accounting Decisions. Journal
of Accounting and Economics Vol. 7, pp. 85-107.
Healy, P. M. and Wahlen, J. M. 1999.A Review of the Earnings Management
Literature and Its Implications for Standard Setting. Accounting Horizons
Vol.13 No.4, pp. 365-383.
Herawaty, N. 2011. Pengaruh Pengendalian Intern dan Lamanya Waktu Audit
terhadap Fee Audit (Studi Kasus pada KAP Kota Jambi dan Palembang).
Jurnal Penelitian Universitas Jambi Seri Humaniora, Vol.13 No.1, page
07-12.
Houqe, N., et al. 2015. Effects of Audit Quality on Earnings Quality and Cost of
Equity Capital: Evidence from India. Working Paper No. 95, Centre for
Accounting, Governance and Taxation Research, New Zealand.
Indriantoro N. and Supomo B. Metodologi Penelitian Bisnis untuk Akuntansi dan
Manajemen. BPFE, Yogyakarta, 2002.
94
Janie, Dyah N.A. Statistik Deskriptif & Regresi Linier Berganda dengan SPSS.
Semarang University Press, 2012.
Jenkins, D.S. and Velury U. 2008. Does Auditor Tenure Influence the Reporting
of Conservative Earnings?. Journal of Accounting and Public Policy
Vol.27, pp. 115-132.
Jensen M.C., and Meckling W.H. 1976. Theory of the Firm: Managerial Behavior,
Agency Costs and Ownership Structure. Journal of Financial Economics
Vol.3 No.4, pp. 305-360.
Jones, J.J. 1991. Earnings Management during Import Relief Investigations.
Journal of Accounting Research, Vol.29 No.2, pp. 193–228.
Kheirollahi, F., et al. 2014.Survey of the Relationship between Audit Quality and
Earnings Quality. Indian Journal of Fundamental and Applied Life
Sciences Vol.4.
Kitiwong, W. et al., 2012. Earnings Management and Audit Quality: Evidence
from Southeast Asia. PhD Thesis of University of York.
Krishnan, G.V. 2003. Audit Quality and the Pricing of Discretionary Accruals.
Auditing: A Journal of Practice & Theory, Vol.22 No.1, pp.109-126.
Lennox, C.S. 1999. Audit Quality and Auditor Size: An Evaluation of Reputation
and Deep Pockets Hypothesis. Journal of Business Finance and
Accounting, Vol.26 No.7&8, pp. 779-805.
Lennox, C., Wu, X. and Zhang, T. 2015. The Effect of Audit Adjustments on
Earning Quality: Evidence from China. Journal of Accounting and
Economics Vol.61, Issues 2-3, pp. 545-562.
Li F., et al. 2011. Earnings Management and The Effect of Earnings Quality in
Relation to Stress Level and Bankruptcy Level of Chinese listed firms.
Research Journal Online of Repository for the University of Wollongong,
Australia, Corporate Ownership and Control, Vol.9 No.1, pp. 366-391.
Li J., and Lin J.W. 2005. The Relation between Earnings Management and Audit
Quality. Journal of Accounting and Finance Research Vol.12, No.1 pp. 1-
11.
Li, Y., et.al. 2009. Audit Quality, Earnings Quality and the Cost of Equity Capital.
Accounting and Audit Quality Research, Capital Markets Co-Operative
Research Centre of Australia Government.

95
Lo, K. 2008. Earnings Management and Earnings Quality. Journal of Accounting
& Economics Vol.45, pp. 350-357.
Malihi, S.A., Mahdavikouv M. and Khontalou M. 2012. An Investigation into the
Relationship between Audit Committee and Audit Quality. Australian
Journal of Basic and Applied Sciences, Vol. 6 No. 10, pp. 409-416.
Memiş, M.U. and Çetenak E.H. 2012. Earnings Management, Audit Quality and
Legal Environment: An International Comparison. International Journal
of Economics and Financial Issues Vol. 2 No. 4, pp.460-469.
Nawaiseh, M.E. 2016. Impact of External Audit Quality on Earnings Management
by Banking Firms: Evidence from Jordan. British Journal of Applied
Science & Technology Vol.12 No.2, pp. 1-14.
Nuraini and Sumarno Zain.2007. Analisis Pengaruh Kepemilikan Institusional dan
Kualitas Audit terhadap Manajemen Laba. Jurnal Maksi, Vol.7 No.1, pp:
19-32.
Novianti, R. 2012. Kajian Kualitas Laba pada Perusahaan Manufaktur yang
Terdaftar di BEI. Accounting Analysis Journal Vol.1 No.2.
Palmrose, Z.V. 1986. Audit Fees and Auditor Size: Further Evidence. Journal of
Accounting Research Vol.24 No.1.
Pamudji, S. and Trihartati A. 2010. Pengaruh Independensi dan Efektivitas
Komite Audit terhadap Manajemen Laba. Jurnal Dinamika Akuntansi
(JDA) Vol.2 No.1, pp. 21-29.
Peasnell, K. V., Pope, P. F. and Young, S. 2000. Accrual Management to Meet
Earnings Targets: UK Evidence Pre-and Post- Cadbury. British
Accounting Review Vol.32, pp. 415–445.
Penman, S.H. 2003. The Quality of Financial Statements: Perspective from the
Recent Stock Market Bubble. Accounting Horizons Vol.9 No.2,
Supplement, pp. 77-96.
Picconi, M and Reynolds, J.K. 2013.Audit Fee Theory and Estimation: A
Consideration of the Logarithmic Audit Fee Model. Indiana University
and Louisiana State University
Pitkänen, J. 2016. Audit Quality: The Effect of Prior Experience. Master’s Thesis
of Jyväskylä University School of Business and Economics.

96
Purperhart, M. 2012. The Effect of Audit Quality on Earning Quality provided by
Dutch Public and Private Firms. Thesis Master of Science in Economics,
Amsterdam Business School.
Rachmawati A. and Triatmoko H. 2007. Analisis Faktor-Faktor yang
Mempengaruhi Kualitas Laba dan Nilai Perusahaan. Simposium Nasional
Akuntansi X Unhas Makassar 26-28 july 2007.
Richardson, S., Sloan, R., Sulaiman, M., & Tuna, I. 2005. Accrual Reliability,
Earnings Persistence and Stock Prices. Journal of Accounting and
Economics Vol.39 No.3, pp. 473-485.
Libby, R., et al. Fundamental of Financial Accounting. McGraw-Hill/Irwin.2008.
Retherford, R.D. and Choe M.K. 1993. Statistical Models for Causal Analysis.
John Wiley & Sons, Inc.
Retherford D.R. and Choe M.K. Statistical Models for Causal Analysis. John
Wiley & Sons .Inc. 1993.
Rosner, R., 2003. Earnings Manipulation in Failing Firms. Contemporary
Accounting Research Vol.20 No.2, pp. 361–408.
Sarwono, J. Analisis Jalur untuk Riset Bisnis dengan SPSS, Yogyakarta : Andi.
2007.
Schauer, P.C. 2002. The Effect of Industry Specialization on Audit Quality: An
Examination Using Bid-ask Spreads. Journal of Accounting and Finance
Research, Vol.10, No.1, pp. 76-86.
Schipper, K. 1989. Commentary on Earnings Management. Accounting Horizons,
Vol.3 No.4, pp. 91-102.
Schipper, A. & Vincent, L. 2003. Earnings Quality. Accounting Horizons,
Supplement, pp. 97-110.
Scott, B. & Pitman, M. 2005.Auditors and Earnings Management, Available on
Line at:www.nysscpa.org.
Simunic, D.A. 1980. The Pricing of Audit Services: Theory and Evidence.
Journal of Accounting Research Vol.18 No.1, Spring.
Subramanyam, K.R. 1996. The Pricing of Discretionary Accruals. Journal of
Accounting and Economics, Vol.22, pp.249–281.

97
Suhardianto N. and Harymawan I. 2011. A Decade of Earnings Management
Researches in Indonesia. Asia Pacific Journal of Accounting and Finance
Volume 2 No.1.
Statement of Financial Concept (SFAC) No.1.
Taruno, S.A. 2013. Pengaruh Corporate Governance terhadap Kualitas Laba:
Manajemen Laba sebagai Variabel Intervening. Accounting Analysis
Journal of Semarang State University Indonesia Vol.2 No.3.
Teoh, S.H, and Wong T.J. 1993. Perceived Auditor Quality and the Earnings
Response Coefficient. Accounting Review, Vol.68 No.2, pp. 346–367.
Titman, S. and Trueman B. 1986. Information Quality and Valuation of New
Issues. Journal of Accounting and Economics Vol.9, pp. 159-172.
Weil, R.L. 2009.Quality of Earnings and Earnings Management. The American
Institute of Certified Public Accountants.
Zhou, J. and Elder R. 2003. Audit Firm Size, Industry Specialization and
Earnings Management by Initial Public Offering Firms. Working Paper,
Syracuse University.
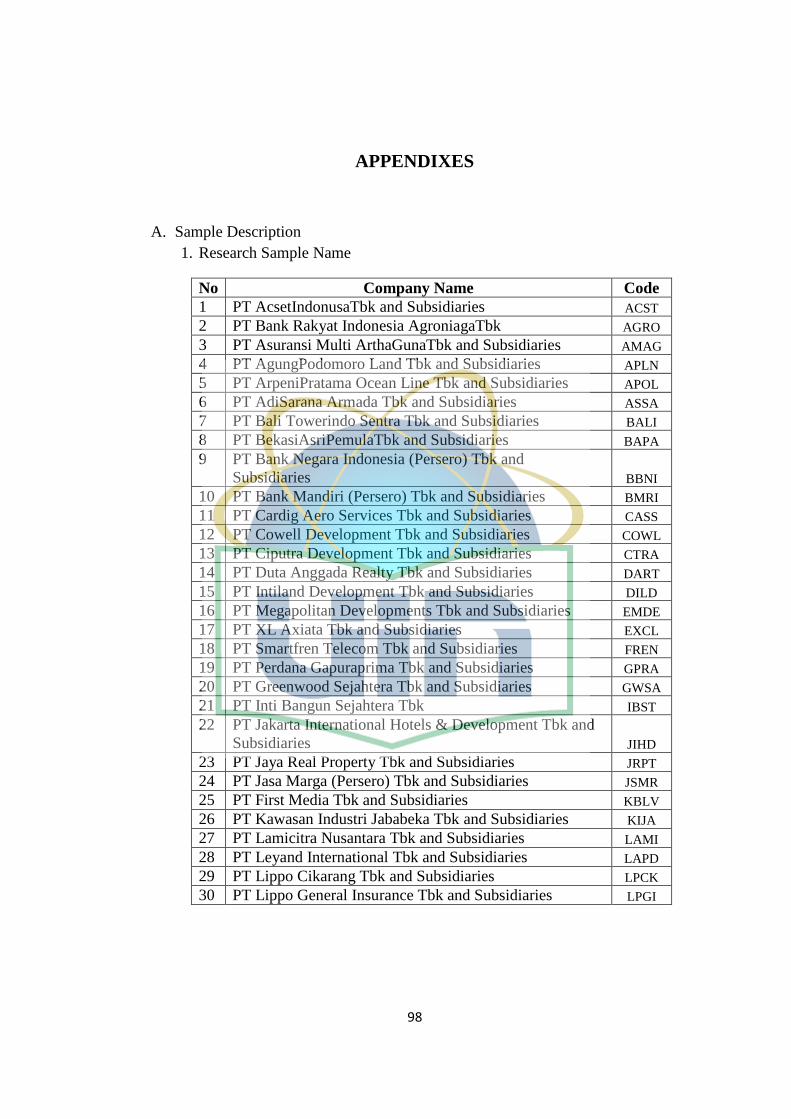
98
APPENDIXES
A. Sample Description
1. Research Sample Name
No Company Name Code
1 PT AcsetIndonusaTbk and Subsidiaries ACST
2 PT Bank Rakyat Indonesia AgroniagaTbk AGRO
3 PT Asuransi Multi ArthaGunaTbk and Subsidiaries AMAG
4 PT AgungPodomoro Land Tbk and Subsidiaries APLN
5 PT ArpeniPratama Ocean Line Tbk and Subsidiaries APOL
6 PT AdiSarana Armada Tbk and Subsidiaries ASSA
7 PT Bali Towerindo Sentra Tbk and Subsidiaries BALI
8 PT BekasiAsriPemulaTbk and Subsidiaries BAPA
9 PT Bank Negara Indonesia (Persero) Tbk and
Subsidiaries BBNI
10 PT Bank Mandiri (Persero) Tbk and Subsidiaries BMRI
11 PT Cardig Aero Services Tbk and Subsidiaries CASS
12 PT Cowell Development Tbk and Subsidiaries COWL
13 PT Ciputra Development Tbk and Subsidiaries CTRA
14 PT Duta Anggada Realty Tbk and Subsidiaries DART
15 PT Intiland Development Tbk and Subsidiaries DILD
16 PT Megapolitan Developments Tbk and Subsidiaries EMDE
17 PT XL Axiata Tbk and Subsidiaries EXCL
18 PT Smartfren Telecom Tbk and Subsidiaries FREN
19 PT Perdana Gapuraprima Tbk and Subsidiaries GPRA
20 PT Greenwood Sejahtera Tbk and Subsidiaries GWSA
21 PT Inti Bangun Sejahtera Tbk IBST
22 PT Jakarta International Hotels & Development Tbk and
Subsidiaries JIHD
23 PT Jaya Real Property Tbk and Subsidiaries JRPT
24 PT Jasa Marga (Persero) Tbk and Subsidiaries JSMR
25 PT First Media Tbk and Subsidiaries KBLV
26 PT Kawasan Industri Jababeka Tbk and Subsidiaries KIJA
27 PT Lamicitra Nusantara Tbk and Subsidiaries LAMI
28 PT Leyand International Tbk and Subsidiaries LAPD
29 PT Lippo Cikarang Tbk and Subsidiaries LPCK
30 PT Lippo General Insurance Tbk and Subsidiaries LPGI

99
B. Raw Data Description
1. Audit Quality (X1)
Code 2013 2014 2015
PF LNF
EE
PF LNF
EE
PF LNF
EE
ACST 1,031,852,781 20.75 2,464,000,000 21.63 2,065,000,000 21.45
AGRO 3,459,477,000 21.96 3,877,450,000 22.08 3,632,747,000 22.01
AMAG 1,619,571,000 21.21 3,961,630,000 22.10 3,644,764,000 22.02
APLN 8,824,863,000 22.90 11,009,926,000 23.12 9,734,222,000 23.00
APOL 11,435,805,540 23.16 6,949,899,771 22.66 17,873,458,626 23.61
ASSA 438,000,000 19.90 373,000,000 19.74 1,383,137,748 21.05
BALI 538,205,300 20.10 564,754,195 20.15 945,958,404 20.67
BAPA 941,847,448 20.66 382,989,186 19.76 480,589,409 19.99
BBNI 68,112,000,000 24.94 51,376,000,000 24.66 47,904,000,000 24.59
BMRI 1,978,886,000,000 28.31 2,380,440,000,000 28.50 2,750,772,000,000 28.64
CASS 2,762,389,000 21.74 3,470,581,000 21.97 3,174,589,000 21.88
COWL 175,000,000 18.98 11,111,941,189 23.13 5,553,087,970 22.44
CTRA 12,712,032,584 23.27 4,431,472,704 22.21 12,712,032,584 23.27
DART 2,280,000,000 21.55 1,110,000,000 20.83 2,275,000,000 21.55
DILD 6,736,515,120 22.63 8,906,064,879 22.91 15,885,968,697 23.49
EMDE 817,290,528 20.52 808,746,428 20.51 1,877,760,603 21.35
EXCL 141,503,000,000 25.68 148,567,000,000 25.72 184,629,000,000 25.94
FREN 4,380,858,661 22.20 9,559,153,996 22.98 3,924,636,677 22.09
GPRA 2,322,854,493 21.57 2,387,738,404 21.59 7,048,356,490 22.68
GWSA 5,034,216,219 22.34 3,647,344,547 22.02 4,535,655,066 22.24
IBST 1,662,354,837 21.23 937,487,992 20.66 2,781,293,839 21.75
JIHD 1,081,175,000 20.80 1,348,129,000 21.02 1,068,392,000 20.79
JRPT 10,338,874,000 23.06 19,345,140,000 23.69 22,812,719,000 23.85
JSMR 35,483,080,000 24.29 10,338,874,000 23.06 10,338,874,000 23.06
KBLV 46,037,000,000 24.55 108,064,000,000 25.41 63,872,000,000 24.88
KIJA 4,664,120,071 22.26 14,558,742,608 23.40 22,058,454,388 23.82
LAMI 404,780,000 19.82 437,180,000 19.90 499,877,000 20.03
LAPD 234,872,000 19.27 253,563,000 19.35 151,293,000 18.83
LPCK 1,949,660,396 21.39 3,041,055,129 21.84 989,508,103 20.71
LPGI 1,596,859,215 21.19 1,217,285,700 20.92 1,348,862,200 21.02

100
2. Earning Management (X2)
Code Year TAC Ait-1 EDA
ACST 2013 (13,002,354,706) 754,771,051,363 -0.02
AGRO 2013 330,952,821,000 4,040,140,235,000 0.08
AMAG 2013 56,167,786,000 1,349,457,388,000 0.04
APLN 2013 (558,807,415,000) 15,195,642,352,000 -0.04
APOL 2013 (920,227,365,657) 3,008,036,943,936 -0.31
ASSA 2013 204,119,245,470 2,108,998,307,963 0.10
BALI 2013 (9,156,121,796) 453,500,503,264 -0.02
BAPA 2013 12,997,344,610 159,093,151,873 0.08
BBNI 2013 (714,376,000,000) 333,303,000,000,000 0.00
BMRI 2013 1,296,962,000,000 635,618,708,000,000 0.00
CASS 2013 7,844,585,000 795,015,458,000 0.01
COWL 2013 37,153,217,853 1,778,428,912,031 0.02
CTRA 2013 (1,329,242,092,656) 15,023,391,727,244 -0.09
DART 2013 266,344,487,000 4,293,161,447,000 0.06
DILD 2013 83,916,707,556 6,091,751,240,542 0.01
EMDE 2013 (41,191,817,111) 886,378,756,878 -0.05
EXCL 2013 (6,134,094,000,000) 35,455,705,000,000 -0.17
FREN 2013 (1,676,926,352,175) 14,339,809,990,815 -0.12
GPRA 2013 84,905,797,970 1,310,251,294,004 0.06
GWSA 2013 207,737,041,191 2,074,853,325,402 0.10
IBST 2013 468,867,527,101 2,155,203,153,294 0.22
JIHD 2013 315,399,887,000 4,454,535,086,000 0.07
JRPT 2013 194,084,932,000 4,998,260,900,000 0.04
JSMR 2013 (1,157,043,783,000) 24,753,551,441,000 -0.05
KBLV 2013 (365,235,000,000) 4,306,576,000,000 -0.08
KIJA 2013 (844,318,157,370) 7,077,817,870,077 -0.12
LAMI 2013 12,184,978,000 598,919,130,000 0.02
LAPD 2013 (374,827,504,000) 1,155,885,012,000 -0.32
LPCK 2013 576,985,329,247 2,832,000,551,101 0.20
LPGI 2013 60,367,324,025 1,447,602,269,216 0.04
ACST 2014 60,610,000,000 1,298,358,202,545 0.05
AGRO 2014 (57,354,397,000) 5,124,070,015,000 -0.01
AMAG 2014 145,116,623,000 2,154,132,214,000 0.07
APLN 2014 359,776,141,000 19,679,415,197,000 0.02
APOL 2014 125,923,967,771 2,577,604,342,335 0.05
ASSA 2014 141,389,137,785 2,172,247,370,275 0.07
BALI 2014 (41,169,932,149) 658,360,482,153 -0.06
BAPA 2014 14,184,592,731 175,635,233,972 0.08
BBNI 2014 380,220,000,000 386,654,815,000,000 0.00
BMRI 2014 (436,908,000,000) 733,099,762,000,000 0.00
CASS 2014 11,220,905,000 91,675,213,300 0.12
COWL 2014 113,068,496,985 1,944,913,754,306 0.06
CTRA 2014 (189,739,517,276) 20,245,534,912,143 -0.01
DART 2014 6,391,719,000 4,768,449,638,000 0.00
DILD 2014 1,173,468,891,386 7,536,320,166,520 0.16
EMDE 2014 (38,887,530,839) 938,536,950,089 -0.04
EXCL 2014 (9,343,830,000,000) 40,277,626,000,000 -0.23
FREN 2014 (1,001,563,075,466) 15,850,435,440,807 -0.06
GPRA 2014 17,225,678,660 1,332,646,538,409 0.01
Continue on the next page

101
Earning Management (Continuous)
Code Year TAC Ait-1 EDA
GWSA 2014 837,220,884,708 4,688,677,189,263 0.18
IBST 2014 (52,381,147,793) 2,874,873,089,584 -0.02
JIHD 2014 62,907,738,000 6,463,220,155,000 0.01
JRPT 2014 613,686,212,000 6,163,177,865,000 0.10
JSMR 2014 (522,371,523,000) 28,064,480,458,000 -0.02
KBLV 2014 7,846,216,000,000 5,242,465,000,000 1.50
KIJA 2014 107,829,465,626 8,257,711,872,648 0.01
LAMI 2014 6,994,634,000 611,947,289,000 0.01
LAPD 2014 (94,758,263,000) 1,017,147,148,000 -0.09
LPCK 2014 827,969,538,236 3,854,166,345,345 0.21
LPGI 2014 262,286,578,440 1,714,825,405,214 0.15
ACST 2015 17,254,000,000 1,473,649,000,000 0.01
AGRO 2015 (65,462,061,000) 6,388,305,061,000 -0.01
AMAG 2015 164,635,273,000 2,490,388,023,000 0.07
APLN 2015 1,591,516,757,000 23,685,737,844,000 0.07
APOL 2015 (762,044,618,034) 1,858,227,455,118 -0.41
ASSA 2015 127,667,274,104 2,507,277,315,256 0.05
BALI 2015 36,511,734,613 808,759,668,656 0.05
BAPA 2015 5,501,676,003 176,171,620,663 0.03
BBNI 2015 (4,956,829,000,000) 416,573,708,000,000 -0.01
BMRI 2015 10,950,944,000,000 855,039,673,000,000 0.01
CASS 2015 63,544,786,000 1,085,103,430,000 0.06
COWL 2015 (142,944,306,068) 3,682,393,492,170 -0.04
CTRA 2015 288,030,144,540 23,538,715,238,878 0.01
DART 2015 171,048,019,000 5,114,273,658,000 0.03
DILD 2015 1,476,993,741,399 9,007,692,918,375 0.16
EMDE 2015 (39,854,407,843) 1,179,018,690,672 -0.03
EXCL 2015 (7,531,745,000,000) 63,630,884,000,000 -0.12
FREN 2015 258,009,127,808 17,743,607,008,364 0.01
GPRA 2015 108,283,572,094 1,517,576,344,888 0.07
GWSA 2015 1,354,448,779,856 5,340,991,746,366 0.25
IBST 2015 48,073,784,523 3,832,398,770,295 0.01
JIHD 2015 (370,389,775,000) 6,486,495,861,000 -0.06
JRPT 2015 767,972,544,000 6,684,613,561,000 0.11
JSMR 2015 (394,342,483,000) 31,859,962,643,000 -0.01
KBLV 2015 (506,732,000,000) 12,951,946,000,000 -0.04
KIJA 2015 (7,347,358,043) 8,508,937,032,120 0.00
LAMI 2015 125,128,361,000 631,282,689,000 0.20
LAPD 2015 (122,791,645,000) 937,789,696,000 -0.13
LPCK 2015 565,932,455,545 4,390,498,820,383 0.13
LPGI 2015 69,698,431,616 2,189,245,744,968 0.03

102
3. Earning Quality (Y)
Code Year CFFO EBIT EQ
ACST 2013 112,217,697,097 130,038,161,878 0.86
AGRO 2013 (278,513,113,000) 267,070,994,000 -1.04
AMAG 2013 96,601,830,000 175,973,057,000 0.55
APLN 2013 1,489,047,912,000 1,506,125,256,000 0.99
APOL 2013 (45,445,581,526) (947,126,766,364) 0.05
ASSA 2013 (112,076,444,306) 106,423,635,309 -1.05
BALI 2013 94,759,081,110 120,309,996,125 0.79
BAPA 2013 (7,971,607,459) 11,342,947,580 -0.70
BBNI 2013 9,772,317,000,000 11,278,165,000,000 0.87
BMRI 2013 17,532,972,000,000 24,061,837,000,000 0.73
CASS 2013 242,172,511,000 324,678,760,000 0.75
COWL 2013 11,558,703,530 76,611,799,917 0.15
CTRA 2013 2,742,630,542,979 1,709,491,785,185 1.60
DART 2013 (85,544,196,000) 241,451,997,000 -0.35
DILD 2013 245,691,834,305 473,627,877,489 0.52
EMDE 2013 75,194,293,493 57,111,977,571 1.32
EXCL 2013 7,166,911,000,000 1,374,898,000,000 2.47
FREN 2013 (857,536,876,544) (2,331,537,789,373) 0.37
GPRA 2013 21,605,667,371 154,676,683,511 0.14
GWSA 2013 (63,376,730,735) 110,444,665,494 -0.57
IBST 2013 401,523,281,959 924,190,446,338 0.43
JIHD 2013 1,451,077,829,000 1,922,652,624,000 0.75
JRPT 2013 352,184,687,000 631,664,497,000 0.56
JSMR 2013 2,085,831,530,000 1,310,638,031,000 1.59
KBLV 2013 385,172,000,000 81,011,000,000 4.75
KIJA 2013 945,214,157,370 200,583,572,897 4.71
LAMI 2013 42,155,041,000 62,255,431,000 0.68
LAPD 2013 110,827,504,000 (262,960,954,000) -0.42
LPCK 2013 13,631,600,894 665,682,618,221 0.02
LPGI 2013 20,544,679,366 102,130,756,901 0.20
ACST 2014 43,287,000,000 103,490,075,000 0.42
AGRO 2014 116,762,331,000 421,048,287,000 0.28
AMAG 2014 57,458,049,000 222,549,661,000 0.26
APLN 2014 621,187,784,000 1,416,819,217,000 0.44
APOL 2014 (105,746,227,441) 31,000,514,617 -3.41
ASSA 2014 (98,398,141,231) 56,375,711,826 -1.75
BALI 2014 130,221,584,966 122,542,645,628 1.06
BAPA 2014 (7,138,086,935) 11,831,170,501 -0.60
BBNI 2014 10,449,159,000,000 33,524,310,000,000 0.31
BMRI 2014 21,091,691,000,000 26,008,015,000,000 0.81
CASS 2014 260,393,578,000 356,052,341,000 0.73
COWL 2014 51,567,383,375 206,079,263,977 0.25
CTRA 2014 1,984,333,277,303 2,205,398,300,573 0.90
DART 2014 401,634,080,000 495,034,985,000 0.81
DILD 2014 (740,690,472,062) 614,737,721,730 -1.20
EMDE 2014 83,983,094,030 71,357,934,284 1.18
EXCL 2014 8,540,116,000,000 (1,003,427,000,000) 5.13
FREN 2014 (380,920,995,342) (1,078,422,491,479) 0.35
GPRA 2014 75,002,346,091 122,707,626,199 0.61
Continue on the next page

103
Earning Quality (Continuous)
Code Year CFFO EBIT EQ
GWSA 2014 (266,959,239,883) 563,563,459,113 -0.47
IBST 2014 241,939,143,570 194,529,120,441 1.24
JIHD 2014 74,580,178,000 232,560,230,000 0.32
JRPT 2014 113,990,308,000 835,742,168,000 0.14
JSMR 2014 1,759,385,695,000 1,850,661,310,000 0.95
KBLV 2014 39,936,000,000 8,193,598,000,000 0.00
KIJA 2014 290,997,155,681 565,062,658,699 0.51
LAMI 2014 31,392,034,000 39,251,761,000 0.80
LAPD 2014 22,767,899,000 (72,140,814,000) -0.32
LPCK 2014 18,002,279,281 861,026,179,916 0.02
LPGI 2014 (134,298,752,859) 143,039,485,050 -0.94
ACST 2015 24,968,000,000 84,013,000,000 0.30
AGRO 2015 145,953,941,000 541,733,697,000 0.27
AMAG 2015 29,114,979,000 211,949,051,000 0.14
APLN 2015 (474,753,310,000) 1,554,857,910,000 -0.31
APOL 2015 (24,114,285,602) (776,382,357,754) 0.03
ASSA 2015 (93,490,934,465) 56,854,925,672 -1.64
BALI 2015 84,285,422,707 164,162,731,641 0.51
BAPA 2015 (4,297,033,029) 6,352,004,735 -0.68
BBNI 2015 14,097,361,000,000 11,466,148,000,000 1.23
BMRI 2015 10,201,454,000,000 26,369,430,000,000 0.39
CASS 2015 230,026,726,000 386,828,206,000 0.59
COWL 2015 (35,747,880,656) (137,598,547,081) 0.26
CTRA 2015 1,452,270,017,886 2,223,233,525,626 0.65
DART 2015 6,717,789,000 240,176,803,000 0.03
DILD 2015 (1,057,949,545,935) 603,434,004,139 -1.75
EMDE 2015 101,122,686,777 107,339,738,899 0.94
EXCL 2015 7,506,407,000,000 (453,892,000,000) 5.97
FREN 2015 (1,823,419,290,017) (1,626,441,544,034) 1.12
GPRA 2015 (35,390,247,927) 100,481,493,717 -0.35
GWSA 2015 (90,584,303,847) 1,286,634,256,104 -0.07
IBST 2015 266,821,154,499 356,549,572,052 0.75
JIHD 2015 462,219,278,000 230,527,916,000 2.01
JRPT 2015 101,804,634,000 991,884,792,000 0.10
JSMR 2015 1,713,543,029,000 2,068,304,233,000 0.83
KBLV 2015 (1,006,982,000,000) (1,933,397,000,000) 0.52
KIJA 2015 338,790,021,204 408,234,038,859 0.83
LAMI 2015 28,410,090,000 154,122,174,000 0.18
LAPD 2015 40,393,811,000 (82,550,456,000) -0.49
LPCK 2015 349,056,823,669 930,517,532,765 0.38
LPGI 2015 7,959,770,865 94,803,867,025 0.08

104
C. Results of Research
Normality Test Result using K-S Test
One-Sample Kolmogorov-Smirnov Test
Unstandardized
Residual
N 90
Normal Parametersa,b
Mean 0E-7
Std. Deviation 1.18493141
Most Extreme Differences
Absolute .134
Positive .134
Negative -.094
Kolmogorov-Smirnov Z 1.267
Asymp. Sig. (2-tailed) .081
a. Test distribution is Normal.
b. Calculated from data.
Normality Test using Histogram Graphic

105
Normality Test using P-Plot Graphic
Multicollonearity Test Result
Coefficientsa
Model Unstandardized
Coefficients
Standardized
Coefficients
t Sig. Collinearity Statistics
B Std. Error Beta Tolerance VIF
1
(Constant) -4.555 1.437 -3.170 .002
LNFEE .229 .064 .344 3.556 .001 .998 1.002
EDA -1.971 .668 -.285 -2.952 .004 .998 1.002
a. Dependent Variable: EQ

106
Heterocedasticity Test
Autocorrelation Test using Run
Test
Runs Test
Unstandardized
Residual
Test Valuea -.08546
Cases < Test Value 45
Cases >= Test Value 45
Total Cases 90
Number of Runs 50
Z .848
Asymp. Sig. (2-tailed) .396
a. Median

107
Regression Result of Direct Relation between Audit Quality on Earning
Quality
Variables Entered/Removeda
Model Variables
Entered
Variables
Removed
Method
1 LNFEEb . Enter
a. Dependent Variable: EQ
b. All requested variables entered.
Model Summaryb
Model R R Square Adjusted R
Square
Std. Error of the
Estimate
1 .330a .109 .099 1.24988
a. Predictors: (Constant), LNFEE
b. Dependent Variable: EQ
ANOVAa
Model Sum of Squares df Mean Square F Sig.
1
Regression 16.782 1 16.782 10.742 .001b
Residual 137.475 88 1.562
Total 154.257 89
a. Dependent Variable: EQ
b. Predictors: (Constant), LNFEE
Coefficientsa
Model Unstandardized Coefficients Standardized
Coefficients
t Sig.
B Std. Error Beta
1 (Constant) -4.408 1.498 -2.943 .004
LNFEE .220 .067 .330 3.278 .001
a. Dependent Variable: EQ

108
Regression I Results
Variables Entered/Removeda
Model Variables
Entered
Variables
Removed
Method
1 LNFEEb . Enter
a. Dependent Variable: EDA
b. All requested variables entered.
Model Summary
Model R R Square Adjusted R
Square
Std. Error of the
Estimate
1 .048a .002 -.009 .19135
a. Predictors: (Constant), LNFEE
ANOVAa
Model Sum of Squares df Mean Square F Sig.
1
Regression .008 1 .008 .205 .652b
Residual 3.222 88 .037
Total 3.230 89
a. Dependent Variable: EDA
b. Predictors: (Constant), LNFEE
Coefficientsa
Model Unstandardized Coefficients Standardized
Coefficients
t Sig.
B Std. Error Beta
1 (Constant) -.075 .229 -.326 .745
LNFEE .005 .010 .048 .453 .652
a. Dependent Variable: EDA
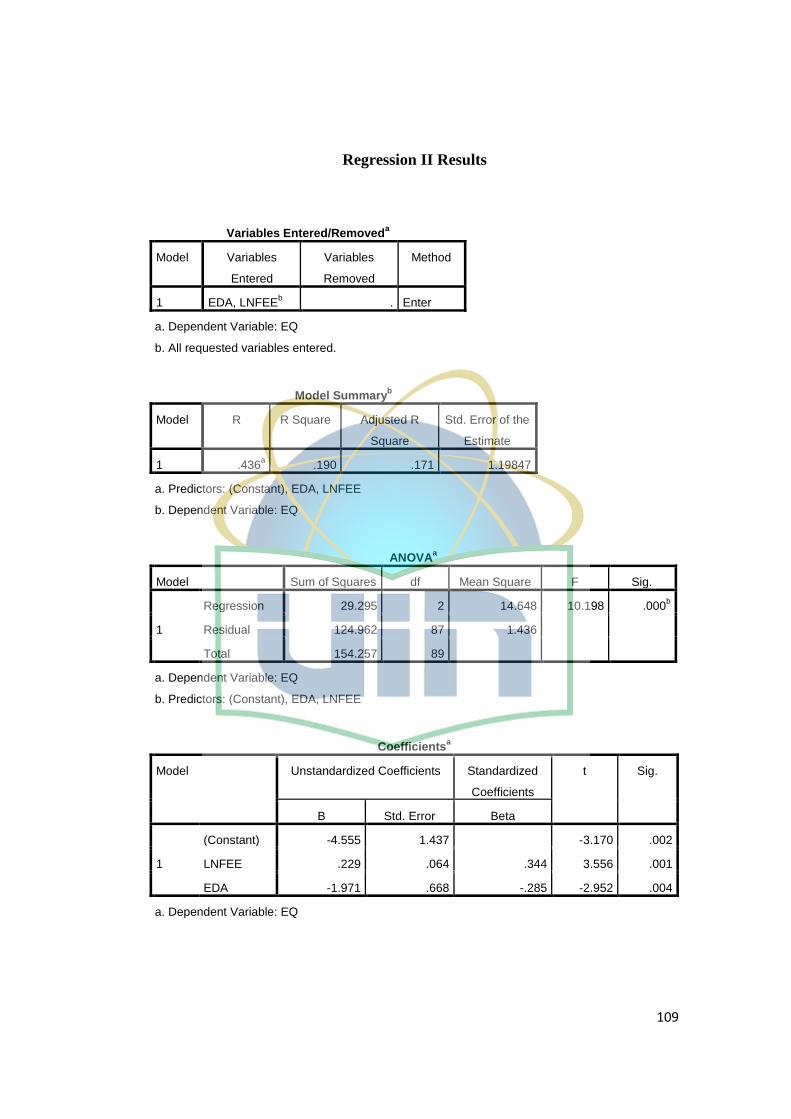
109
Regression II Results
Variables Entered/Removeda
Model Variables
Entered
Variables
Removed
Method
1 EDA, LNFEEb . Enter
a. Dependent Variable: EQ
b. All requested variables entered.
Model Summaryb
Model R R Square Adjusted R
Square
Std. Error of the
Estimate
1 .436a .190 .171 1.19847
a. Predictors: (Constant), EDA, LNFEE
b. Dependent Variable: EQ
ANOVAa
Model Sum of Squares df Mean Square F Sig.
1
Regression 29.295 2 14.648 10.198 .000b
Residual 124.962 87 1.436
Total 154.257 89
a. Dependent Variable: EQ
b. Predictors: (Constant), EDA, LNFEE
Coefficientsa
Model Unstandardized Coefficients Standardized
Coefficients
t Sig.
B Std. Error Beta
1
(Constant) -4.555 1.437 -3.170 .002
LNFEE .229 .064 .344 3.556 .001
EDA -1.971 .668 -.285 -2.952 .004
a. Dependent Variable: EQ