the effect of allowing minibus taxis to …...the effect of allowing minibus taxis to use bus lanes...
TRANSCRIPT

THE EFFECT OF ALLOWING MINIBUSTAXIS TO USE BUS LANES ON RAPID
TRANSPORT ROUTES
N.D. Fowkes∗, D. Fanucchi†, D. Raphulu‡, S. Simelane‡,M. Sejeso‡ and R. Kgatle‡
Study group participant
D.P. Mason
Industry Representative
P. Hlahla
Abstract
In order to facilitate the flow of traffic in Gauteng province, SouthAfrica, during peak hours the transport authority is investigating theeffect of allowing minibus taxis to use the lanes presently reserved forbuses either throughout the day or just during peak hours. One wouldexpect the reduction of flow in the normal lane to result in increasedcar speeds in this lane and also increased speeds for the minibus taxis inthe bus lane, however bus speeds may be reduced and therefore timeta-bles not adhered to. The results obtained show that for initial trafficdensities exceeding a critical value the flux through the system will beincreased if switching is allowed. Inevitably disruptions will be causedby lane changes which will propagate through the system and also intothe oncoming stream. Such dynamics issues are also briefly discussed.
∗Mathematics Department, University of Western Australia, Crawley, WA 6009, Aus-tralia email: [email protected]†School of Computational and Applied Mathematics, University of the Witwatersrand,
Johannesburg, Private Bag 3, Wits 2050, South Africa. email: [email protected]‡School of Computational and Applied Mathematics, University of the Witwatersrand,
Johannesburg, South Africa
19

20 The effect of allowing minibus taxis to use bus lanes on rapid transport routes
Figure 1: Competing transport modes in Gauteng: minibus taxis, cars andcabs, and buses
1 Introduction
Gauteng is the smallest (1.5% of the land area) but most populous (12.3 mil-lion) province in South Africa and is highly urbanised, containing Johannes-burg, Pretoria and large industrial areas. About 65% of Gauteng populationuse minibus taxis as their mode of transport. The minibus taxi (or sharetaxi) is a mode of transport which falls between a taxicab (in future called acab) and a bus; each minibus taxi (in future called a taxi) takes about 8 –15 people. These taxis are for hire and usually take passengers on fixed orsemi-fixed routes without timetables, but instead departing when all seats arefilled. They may stop anywhere to pick up or drop off passengers. There areover 100,000 taxis in Gauteng Province. The competing transport modes areprimarily taxis, cars and cabs, and buses, see Figure ??. Buses have seatingfor 50 to 100 passengers.
Gauteng recently introduced the bus rapid transport (BRT or Rea Vaya)to provide a modern public transport service to support urban development.The BRT ensures that passengers have safe, fast and affordable urban mobilitywith dedicated right-of-way infrastructure. The present arrangement on theBRT system is shown in Figure ??. Bus stops are 10 -15 minutes apart withstations located between the two bus lanes and with passenger access suchthat the normal and bus lanes are effectively separated. This arrangementensures that buses are unhindered so that the timetable is reliable even inpeak traffic flow conditions. This system also tries to reduce passenger traveltimes in that the centre of roadway keeps buses away from the busy curb-side.However, the down side of this system is that these new bus lanes are oftenempty during peak hours and that the bus lanes were built where the lanesused to be available to other vehicles.

N.D. Fowkes, D Fannucchi and D.P. Mason 21
Figure 2: The arrangement of normal and bus lanes in the BRT. Barriersseparate the normal and bus lanes.
Figure 3: Advantages and disadvantages of maintaining separation of the busand normal lanes.
The Province is investigating the effect of allowing taxis to share the buslanes on certain routes and perhaps only during peak hours, and has asked theMathematics-in-Industry-Study-Group (MISG) to examine the issues. Thethought is that by allowing taxis access to the bus lane one might increasethe total flow rate without compromising the bus timetable. The BRT setupenvisaged is one in which taxis will only be permitted to change lanes atprescribed locations also coinciding with bus stations, see Figure ??. A listof the advantages and disadvantages of the present arrangement is shown inFigure ??.
If access of taxis to the bus lane is allowed then the traffic authorities mayeither choose to enforce the taxis to use the bus lane, or allow taxis to make achoice between taking the normal lane or the bus lane. Moving the most peoplein the shortest time in the roads is the primary objective. One might hope that

22 The effect of allowing minibus taxis to use bus lanes on rapid transport routes
allowing taxi drivers to freely choose between the two options might increaseflow, but this could well result in instabilities in the normal lanes spreadingto the bus lanes. Things to consider when developing a model can includethe need to maximize the number of people transported per unit time, taxisstopping to pick up passengers, as well as bus stops, robots and intersections.
However, the general situation is complicated because:
1. The flow on all lanes is traffic robot controlled. Bus priority is often pro-vided at signalized intersections to reduce delays by extending the greenphase or reducing the red phase in the required direction compared tothe normal sequence. By modifying the timing to suit the circumstancesone may optimize the flow.
2. The presence of petrol stations and shopping centres will affect the flow.The best option is likely to be specific to the particular local situationand the time of day.
3. Under close to maximum flux circumstances the flow of traffic is stronglyaffected by disruptions (accidents etc) so that dynamic considerationsmay be of primary importance.
4. The long term (weeks) effect of modifying the present arrangement oflanes is likely to be very different to the immediate (days) response in thatcommuters may change their mode of travel. For example car drivers maychoose to become taxi customers because of the reduced travel times, andbus passengers may also choose the taxi option because of the decreasedreliability of the bus service.
Lighthill and Whitham [?] (1955) developed a continuum model for theflow of traffic along a single lane under crowded conditions. Following onfrom this work a variety of gas-kinetic continuum models have been developedto describe multi-lane traffic flow, see Helbing and Greiner [?], Helbing [?],Shvetsov and Helbing [?], and Helbing [?]. These Boltzmann equation modelstake into account local velocity distributions and overtaking and lane changingmanoeuvres, and are more relevant for the flow of traffic under less crowdedconditions where such velocity variations and manoeuvres are possible. Ourconcern here is with flow under crowded conditions so that the simple Lighthilland Whitham model will be used.
In Section 2 we review the important results of single lane flow. Then inSection ?? we go on to determine the effect of allowing taxis to switch lanes onthe total flow under steady conditions. Switching will however cause dynamicchanges in both traffic streams. Such effects can effect the total through flowlocally and may also cause major disruptions in the traffic streams which can

N.D. Fowkes, D Fannucchi and D.P. Mason 23
be of concern for passenger safety. These issues will also be addressed inSection ??. Conclusions and recommendations for further work are presentedin Section ??.
2 The Single Lane Model
We first review the important results for single lane unidirectional traffic flowaccording to the Lighthill and Whitham model. A more complete, but simple,account of this material can be found in Fowkes and Mahony [?] and Haber-man [?]. Also related work on road blocks was done at the MISG 2009, seeOckendon et al [?].
2.1 Steady state
For traffic flow in a single lane the continuum model introduces the variables:
N : the number of vehicles per km [1/km],
V : the velocity of vehicles [km/hr],
F = NV : the flux of vehicles past a location [1/hr]. (1)
In the simplest model, the driver (or traffic) behaviour is described by
V = V (N), or equivalently F = F (N), (2)
and often the linear relationship
V (N) = Vmax(1−N/Nmax) (3)
is adopted, where (Nmax, Vmax) are the maximum density and speed on thelane. The associated flux is given by (the parabolic model)
F = VmaxN(1−N/Nmax), (4)
see Figure ??.Note that there exists a maximum possible flux Fmax along the lane, given
by Fmax = NmaxVmax/4 when N = Nmax/2.Note also that for flux levels F 0 less than this maximum there are two
possible solutions: a small density/high speed solution (N0A, V
0A), and a large
density/low speed solution (N0B, V
0B). Passengers and traffic engineers would
much prefer the high speed solution, however, without external intervention,they do not have the choice. Under normal circumstances if the flow starts fromrest (with vehicles initially behind a red traffic light that then turns green) then

24 The effect of allowing minibus taxis to use bus lanes on rapid transport routes
V = V 0B
V = V 0A
Nmax
F = F 0
F = Fmax
F (N)V = Vmax
V (N)
Nmax12NmaxN0
BN0A
N0A N0
B
Figure 4: Single Lane Traffic Flow: Left: V (N) Right: F (N). Note there aretwo solutions for prescribed F 0 < Fmax
the high speed (low density) solution is initially chosen. However if at somelater stage flux levels approach Fmax then the flow can switch between the twosolutions or can become stuck in the the low speed solution. Normally vehiclesinter the BRT system after passing through traffic robots so the high speedsolution will be initially chosen, but under peak flow conditions difficulties canarise.
2.2 Dynamics
Under dynamic conditions, and in the absence of inflow or outflow, car con-servation requires that
∂N
∂t+∂F
∂x= 0, (5)
and if we assume that drivers adjust immediately to their local density envi-ronment, then the steady-state flux relation (??) applies and we obtain the‘traffic equation’
∂N
∂t+ F ′(N)
∂N
∂x= 0, (6)
for N(x, t). This equation normally requires that the initial condition densityN(x, 0) be specified, and that a road entry condition on the flux F (0, t) beprescribed.

N.D. Fowkes, D Fannucchi and D.P. Mason 25
Solutions to this hyperbolic equation can be obtained by noting thatN(x, t)remains constant along curves X(t) = F ′(N) in the (x, t) plane referred toas characteristics. Since N remains fixed along such a characteristic F ′(N)also remains fixed so that the characteristic curves are in fact straight linesin the (x, t) plane. Explicitly if x = ξ denotes the intersection of a specificcharacteristic on the t = 0 axis, so X(0) = ξ, then
N(X(t), t) = N(ξ, 0), along X(t) = ξ + F ′(N(ξ, 0))t. (7)
By plotting out all such characteristics one can determine the solution for all
Figure 5: (a) The characteristic curves in the (x, t) plane (increasing densitycase) and (b) Density profiles at times t = t0, t1, t2. Note the steepeningof the density profile with increasing time and the eventual overlapping ofcharacteristics and discontinuity after t = t2.
cases in which cars are travelling into lower density road conditions.If cars are heading into more dense conditions then the density profile will
steepen and the characteristics will eventually overlap so the procedure fails toproduce a unique result, see Figure ??. Under such circumstances there will bea density and velocity discontinuity across a travelling shock wave. The trafficequation (??), (which requires continuity of Nx), needs to be abandoned infavour of a simple flux continuity condition across the moving shock whichuniquely determines the shock speed as
XS =F r − F l
N r −N l, (8)

26 The effect of allowing minibus taxis to use bus lanes on rapid transport routes
where (N l, F l) and (N r, F r) denote conditions on the left and right sides ofthe moving shock; a result referred to as the Rankine-Hugoniot condition. Oneither side of the shock the normal characteristic solution applies, so that thesolution process is complete.
3 Lane Switching Models
We return to the lane switching problem and examine the simple scenariodepicted in Figure ??. Taxis travelling in the normal lane switch to the buslane at a switching point which coincides with the bus passenger stop. Undersuch circumstances the total density of vehicles (cars, buses and taxis) acrossthe two lanes at the stop remains unaltered, but the taxis will now all betravelling in the bus lane. After the switching point all vehicles are requiredto remain in their designated lanes. The speed of cars in the normal lane willnormally increase because of the smaller density while the speed of vehiclesin the bus lane will decrease. The question of interest is: will the net fluxof vehicles increase as a result of the switch and what will happen to thepassengers travel times? A second issue involves the dynamics: will the localdisruption caused by switching be serious?
Figure 6: A simple lane changing scenario: taxis travelling in the normal laneswitch to the bus lane at a switching point, normally a bus stop.
3.1 Steady state
We assume that vehicles do not stop at the switching point and (for the present)assume that there is no disruption as a result of the lane switching. In practiceit will take time and distance for drivers to adjust to the changed circumstancesbut one would expect the new steady state to be realised in a short distance.The dynamics will be addressed later.

N.D. Fowkes, D Fannucchi and D.P. Mason 27
In the work to follow we will use superscripts to refer to lanes: ‘b’ for busand ‘n’ for normal. Subscripts (where necessary) will be used to distinguishvehicle types: ‘c’ for cars, ‘t’ for taxis, ‘b’ for buses. Thus (N b
b , Nbt ) are the
densities of buses and taxis in the bus lane respectively. After switching bothbuses and taxis share the bus lane, and the total number of vehicles in the buslane, denoted by N b, is given by N b = N b
b +N bt .
In order to simplify the calculations we will assume that the density, veloc-ity and flux in both the normal and bus lanes is dependent only on the totalvehicle numbers in the specified lane. Explicitly we model the flow in the busand normal lanes using
F n = F n(Nn), V n = V n(Nn), and Fb = Fb(Nb), Vb = Vb(Nb) (9)
where Nn is the total number of vehicles (cars and taxis) travelling in thenormal lane, and (V n, F n) are the associated (shared) vehicle speeds and (to-tal) vehicle fluxes in this lane. The single lane flux function F (N) is againappropriate however the bus and car lanes will normally differ in capacity andin particular the maximum vehicle flux levels will be different in the two lanes.
Taxis may or may not occupy the normal lane (sharing with cars), or thebus lane (sharing with buses) so we have:
Nn = Nnt +Nn
c , N b = N bb +N b
t , (10)
F n = F nt + F n
c , F b = F bb + F b
t , (11)
and using (??) the vehicle velocities in the two lanes are given by
V n =F n(Nn
t +Nnc )
(Nnt +Nn
c ), V b =
F b(N bt +N b
b )
(N bb +N b
t ). (12)
Of particular interest is the total flux of vehicles given by
F total = F n + F b. (13)
Also of interest is the average travel speed for all passengers which can beobtained by taking into account the average occupancy of cars, buses andtaxis (nc, nb, nt):
V p =[ncN
nc + ntN
nt )]V n +
[nbN
bb + ntN
bt )]V b[
ncNnc + ntNn
t + nbN bb + ntN b
t
] . (14)
The required results are now in place and various scenarios can be examined.

28 The effect of allowing minibus taxis to use bus lanes on rapid transport routes
For the scenario depicted in Figure ?? we have pre-switching conditionsgiven by
N bt = 0, Nn
t = N nt and with Nn
c = N nc , N
bb = N b
b ,
with the N ’s prescribed. The post-switching conditions (if all taxis switchlanes) are given by
N bt = N n
t , Nnt = 0, and with Nn
c = N nc , N
bb = N b
b .
3.2 Results
The status of the system before and after lane switching is best presented ona scaled flux/scaled density plot. We scale the densities:
Nn = Nnmaxρ
n, Nnt = Nn
maxρnt , N
nc = Nn
maxρnc , (15)
N b = N bmaxρ
n, N bt = N b
maxρnt , N
bc = N b
maxρnc , (16)
where (Nnmax, N
bmax) are the maximum densities in the two lanes respectively,
which will normally be different. With this choice of scale the range of scaleddensities in both lanes is 0 to 1, with maximum flux conditions realised whenρ = 1/2. We will use Nn
max as a scale for specifying the total density
N total = Nn +N b = Nnmax(ρtotal) = Nn
max(ρn +Rρb) where R =N b
max
Nnmax
.
The maximum density ratio, R, is an important dimensionless group for theproblem.
The maximum speeds in the two lanes are likely to be the same (Vmax say),but (because of the different maximum densities) the maximum flux levels(F n
max, Fbmax) will normally be different. For the linear model case the maximum
flux ratio F bmax/F
nmax = N b
max/Nnmax = R. For purposes of comparison it is
useful to use the same scale F nmax for both lanes. Thus we use the scaling:
F n = F nmaxf
n(ρn) F b = F nmaxf
b(ρb), (17)
and the net flux through both lanes is given by
F total = F nmax(fn +Rf b) ≡ F n
maxftotal. (18)
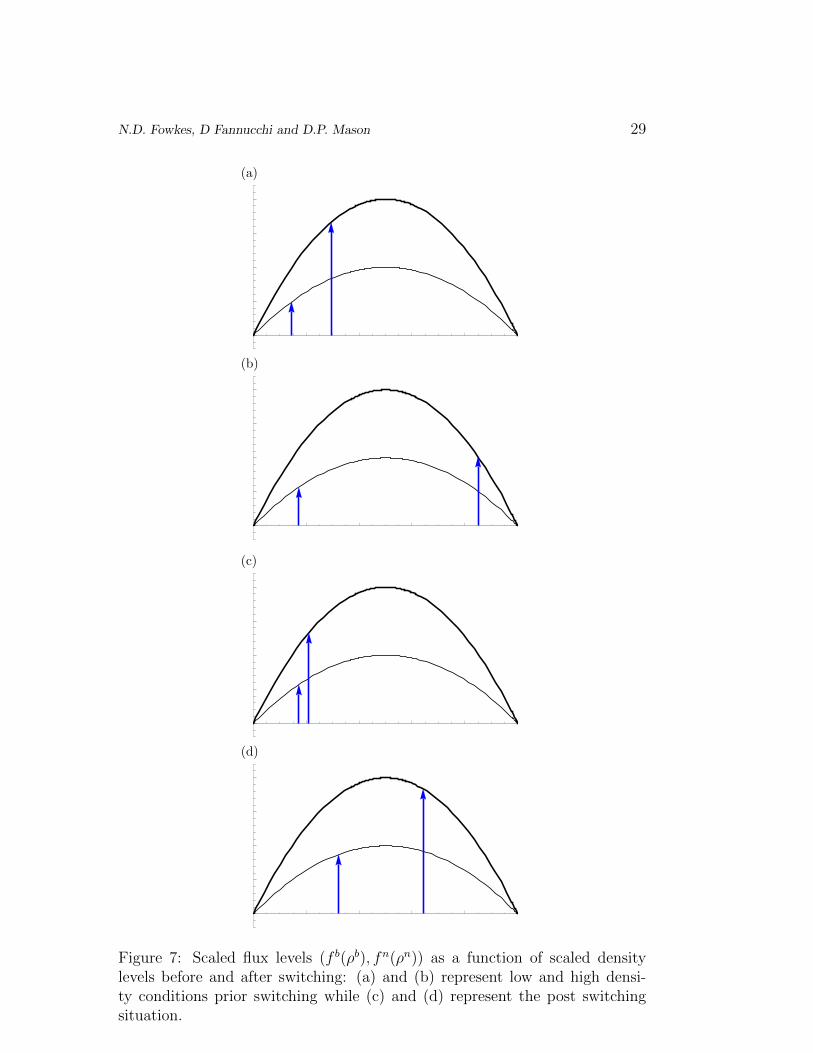
For the prescribed densities ρn, ρb the effect of shifting lanes is displayed intwo cases: a small initial traffic density case and a (peak hour) larger densitycase, see Figure ??. The total flux on the road is given by the sum of the
N.D. Fowkes, D Fannucchi and D.P. Mason 29
(a)
0.2 0.4 0.6 0.8 1.00.0
0.5
1.0
1.5
2.0NORMAL LANE
BUS LANE
(b)
0.2 0.4 0.6 0.8 1.00.0
0.5
1.0
1.5
2.0NORMAL LANE
BUS LANE
(c)
0.2 0.4 0.6 0.8 1.00.0
0.5
1.0
1.5
2.0NORMAL LANE
BUS LANE
(d)
0.2 0.4 0.6 0.8 1.00.0
0.5
1.0
1.5
2.0NORMAL LANE
BUS LANE
Figure 7: Scaled flux levels (f b(ρb), fn(ρn)) as a function of scaled densitylevels before and after switching: (a) and (b) represent low and high densi-ty conditions prior switching while (c) and (d) represent the post switchingsituation.

30 The effect of allowing minibus taxis to use bus lanes on rapid transport routes
two arrows and the result obtained as a function of total initial density isdisplayed in Figure ??. In the case of a low initial density the effect of laneswitching reduces the total vehicle flux, whereas for an initially high densitythe effect of lane switching is to increase the total vehicle flux. Evidentlythere is a critical traffic density ρtotalcrit above which lane shifting improves theoutcome; the intersection of the curves determines ρtotalcrit ; an explicit solutioncan be obtained for ρtotalcrit and the associated flux as a function of the maximumflux and maximum density on the two lanes. A knowledge of this value or theassociated initial flux levels can be usefully used to determine the appropriatetime to allow or enforce switching as peak hour is approached.
0 1
3with switching
withoutswitching
totalflux
totaldensity
Figure 8: Total (scaled) flux f total through the network as a function of theaverage initial traffic density ρtotal, (a) with (thick curve), or (b) without (thincurve) taxis switching into the bus lane. Note that switching produces a betteroutcome for initial density levels greater than ρtotalcrit .
ρtotalcrit
3.3 The dynamics
As indicated earlier steady state conditions will not be immediately establishedafter initiating switching, whether or not the process is initiated using trafficrobots. The flow situation can be determined using the method of character-istics as described in Section ??, see Figures ??, ??. If the flow of traffic isnot interrupted by a traffic robot, and a fixed proportion α of vehicles (thetaxis) travelling in the normal lane transfer into the bus lane, the appropriateconditions to impose across the switching point x = 0 are the flux transferconditions
F n(0+, t) = (1− α)F n(0−, t) and, F b(0+, t) = F b(0−, t) + αF n(0−, t). (19)

N.D. Fowkes, D Fannucchi and D.P. Mason 31
x
t
x
tt0
shockshock
Nn(x,t0)
Figure 9: Flow in the normal lane: the solution using characteristics.Left: Characteristics are shown as thin lines, contact discontinuities as dashedlines, shocks as continuous thick lines. Right: There is an immediate reduc-tion in density at the switching point (and cars immediately increase velocityacross a ‘contact surface’ (dashed)). Past the switching point there is a con-stant density region followed by a shock transition (and contact surface) backto the pre-switching solution.
x
t
x
t0
fan fanNb(x,t0)
Figure 10: Flow in the bus lane: Left: the solution using characteristics.Right: There is an immediate density transition across a ‘contact surface’ atthe switching point, followed by a constant density region, and then a centredfan transition back to the pre-switching state, again across a ‘contact surface’.

32 The effect of allowing minibus taxis to use bus lanes on rapid transport routes
As indicated earlier the simple single lane model assumes that after the switchthe drivers immediately adjust to the changed flux circumstances by adjustingthe spacing between vehicles and thus the lane density. Thus equations (??,??) determine the post-switch traffic densities (N b(0+, t), Nn(0+, t)), and theswitch location x = 0 corresponds to a contact discontinuity in the flow. (These(local) results correspond to the steady state solutions already obtained.) Theimplication of this result is that the switching process occurs smoothly. (Onemight expect the switching process to generate a shock wave in the bus lanetravelling back into the oncoming stream, but this does not happen.)
In the normal lane situation the transition to the constant pre-switch statesolution occurs across a shock with speed given by (??), whereas in the buslane this transition occurs via a centred rarefaction fan. Thus drivers in thenormal lane speed up after passing by the switching point and catch up (acrossa shock) with slower moving drivers ahead on the lane. In the bus lane driversslow down after the switch, but after travelling at constant speed for a while(until they hit the fan edge), then find they can gradually increase speed untilthey travel again at the pre-switch speed.
Aside The Lighthill and Whitham model assumes that drivers reaction timesare negligible and in context there is the assumption of a ‘perfect’ interchange.A more sophisticated model may be necessary to determine the effect of inter-change details on the local flow.
As can be seen in Figures ??, ?? Right, all the above dynamics effects travelout of the system, leaving behind the steady state situation with a discontinu-ous transition across the switching point. Subsequently dynamic changes willoccur as a result of changes in inflow (for example, as a result of increasingtraffic as peak hour is approached) or locally generated disruptions within thetraffic streams. All these disruptions will produce dynamic changes similarto those described above, with such changes travelling through the systemwith approximately the signal speed at the background traffic density. Thesedynamic effects become more pronounced for high traffic density situations,because of the decreasing signal speed. Under conditions close to maximumflux conditions the signal speed goes to zero so any disturbances are likely toremain within the system.
4 Conclusions/Suggestions
Using the Lighthill and Whitham single lane traffic flow model a simple sce-nario was examined to investigate the effect of lane switching on traffic flow.For traffic density levels greater than a critical level, the switching process willresult in increased flows. Explicit solutions were obtained for this ‘critical den-
N.D. Fowkes, D Fannucchi and D.P. Mason 33
sity’ in terms of the flow characteristics of the two lanes and this result maybe used to optimise the system’s performance. Dynamic fluctuations causedby disturbances can be of concern for safety and these effects are likely tobe more acute under switching circumstances. The effect of allowing taxis toswitch lanes in terms of the reliability of bus timetables can be assessed usingmodels of the above type but real data is necessary.
In order to apply the above work for the practical situation one needs:
• Information (data) about the flux verses density functions (bus, normalroutes)
• Information about the proportion of taxis, buses, cars travelling on routesand passenger occupancy
• Information about the suitable objectives
• Specific information about one experimental route. This route should bemonitored (fluxes, densities) before and after lane switching.
References
[1] M.J. Lighthill and G.B. Whitham. On kinematic waves: I Flood move-ment in long rivers: II Theory of traffic flow on long crowded roads.Proc. Roy. Soc. A, 229, (1955), 281 – 345.
[2] D. Helbing and A Greiner. Modelling and simulation of multilane trafficflow. Physical Review E, 55, (1997), 5498 – 5508.
[3] D Helbing. Derivation of non-local macroscopic traffic equations andconsistent traffic pressures from microscopic car-following models. Eur.Phys. J. B, 69, (2009) 539 - 548.
[4] V Shvetsov and A Helbing. Macroscopic dynamics of multilane traffic.Physical Review E, 59, (1998) 6328 – 6339.
[5] D Helbing. Traffic and related self-driven many-particle systems. Rev.Mod. Phys., 73, (2001), 1067 – 1141.
[6] N.D. Fowkes and J.J. Mahony. An Introduction to Mathematical Mod-elling. John Wiley and Sons, 1994, pp 383 – 411.
[7] R. Haberman. Mathematical Models: Mechanical Vibration, PopulationDynamics, and Traffic Flows. Prentice-Hall, New Jersey, 1977, pp 257 –289.

34 The effect of allowing minibus taxis to use bus lanes on rapid transport routes
[8] H Ockendon, D.P. Mason, D Fanuchi, T la Foy, T Oliphant and MKhalique. A mathematical model of a road block. Mathematics-in-Industry Case Studies Journal, 2, (2010), 134 – 154.