the economics of sovereign debt, bailouts and the … · i sovereign debt crisis: ... (rest of the...
TRANSCRIPT

The Economics of Sovereign Debt, Bailouts andthe Eurozone Crisis
Pierre-Olivier Gourinchas1 Philippe Martin2 Todd Messer3
1UC Berkeley, CEPR and NBER 2SciencesPo (Paris) and CEPR 3UC Berkeley
ECB, November 21 2017
1 / 28

Motivation
I No Bailout clause: art. 125 of Lisbon Treaty:”A Member State shall not be liable for or assume the commitmentsof central governments, regional, local or other public authorities, ...of another Member State”
I ECB Executive Board member, Jurgen Stark (January 2010):”The markets are deluding themselves when they think at a certainpoint the other member states will put their hands on their walletsto save Greece.”
I German finance minister Peer Steinbrueck (February 2009)”The euro-region treaties dont foresee any help for insolventcountries, but in reality the other states would have to rescue thoserunning into difficulty.”
I Economics Commissioner Joaquin Almunia (January 2010):”No, Greece will not default. Please. In the euro area, the defaultdoes not exist.”
2 / 28
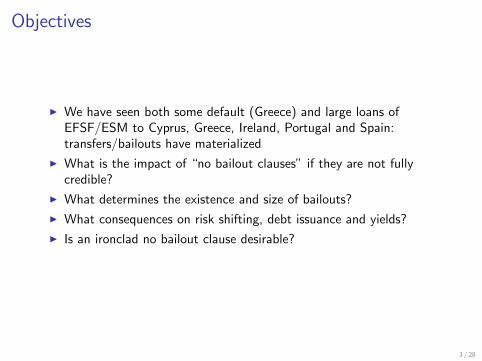
Objectives
I We have seen both some default (Greece) and large loans ofEFSF/ESM to Cyprus, Greece, Ireland, Portugal and Spain:transfers/bailouts have materialized
I What is the impact of “no bailout clauses” if they are not fullycredible?
I What determines the existence and size of bailouts?
I What consequences on risk shifting, debt issuance and yields?
I Is an ironclad no bailout clause desirable?
3 / 28
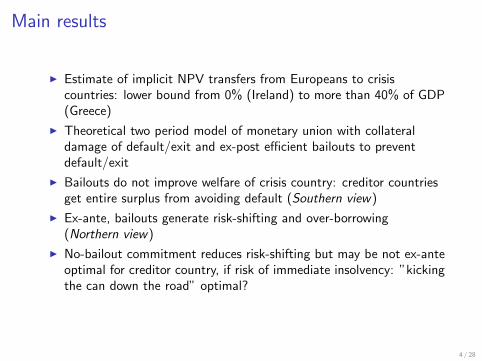
Main results
I Estimate of implicit NPV transfers from Europeans to crisiscountries: lower bound from 0% (Ireland) to more than 40% of GDP(Greece)
I Theoretical two period model of monetary union with collateraldamage of default/exit and ex-post efficient bailouts to preventdefault/exit
I Bailouts do not improve welfare of crisis country: creditor countriesget entire surplus from avoiding default (Southern view)
I Ex-ante, bailouts generate risk-shifting and over-borrowing(Northern view)
I No-bailout commitment reduces risk-shifting but may be not ex-anteoptimal for creditor country, if risk of immediate insolvency: ”kickingthe can down the road” optimal?
4 / 28

Relevant Literature – (just a few)
I Sovereign debt crisis: why do countries repay their debt ?I Eaton and Gersovitz (1981): reputationI Cohen and Sachs (1986), Bulow and Rogoff (1989): disruption costs
I Collateral damage of sovereign default in EMU (default + potentialexit)
I Bulow and Rogoff (1989)I Tirole (2014) and Farhi and Tirole (2016)
I Self-fulfilling expectations driven crisis (Calvo, 1988)I role of financial backstop and monetary policy: de Grauwe (2011),
Aguiar et al (2015), Corsetti & Dedola (2012)): financial backstopeliminates transfers
I no multiple equilibria but transfers in equilibrium in our paper
5 / 28
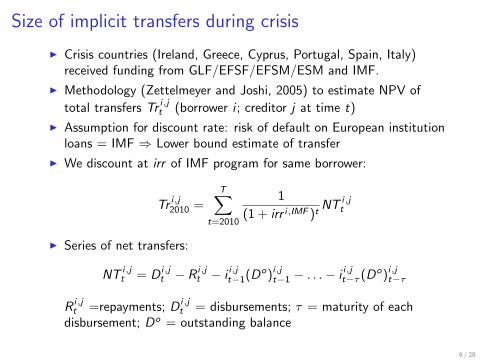
Size of implicit transfers during crisis
I Crisis countries (Ireland, Greece, Cyprus, Portugal, Spain, Italy)received funding from GLF/EFSF/EFSM/ESM and IMF.
I Methodology (Zettelmeyer and Joshi, 2005) to estimate NPV of
total transfers Tr i,jt (borrower i ; creditor j at time t)
I Assumption for discount rate: risk of default on European institutionloans = IMF ⇒ Lower bound estimate of transfer
I We discount at irr of IMF program for same borrower:
Tr i,j2010 =T∑
t=2010
1
(1 + irr i,IMF )tNT i,j
t
I Series of net transfers:
NT i,jt = D i,j
t − R i,jt − i i,jt−1(Do)i,jt−1 − . . .− i i,jt−τ (Do)i,jt−τ
R i,jt =repayments; D i,j
t = disbursements; τ = maturity of eachdisbursement; Do = outstanding balance
6 / 28
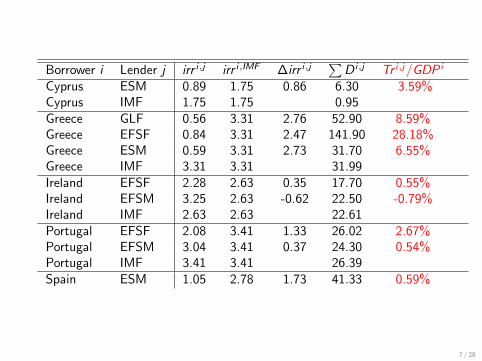
Borrower i Lender j irr i,j irr i,IMF ∆irr i,j∑
D i,j Tr i,j/GDP i
Cyprus ESM 0.89 1.75 0.86 6.30 3.59%Cyprus IMF 1.75 1.75 0.95Greece GLF 0.56 3.31 2.76 52.90 8.59%Greece EFSF 0.84 3.31 2.47 141.90 28.18%Greece ESM 0.59 3.31 2.73 31.70 6.55%Greece IMF 3.31 3.31 31.99Ireland EFSF 2.28 2.63 0.35 17.70 0.55%Ireland EFSM 3.25 2.63 -0.62 22.50 -0.79%Ireland IMF 2.63 2.63 22.61Portugal EFSF 2.08 3.41 1.33 26.02 2.67%Portugal EFSM 3.04 3.41 0.37 24.30 0.54%Portugal IMF 3.41 3.41 26.39Spain ESM 1.05 2.78 1.73 41.33 0.59%
7 / 28
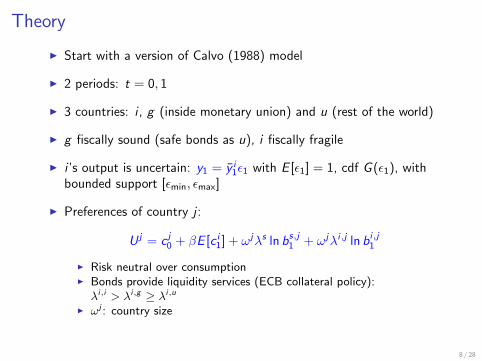
Theory
I Start with a version of Calvo (1988) model
I 2 periods: t = 0, 1
I 3 countries: i , g (inside monetary union) and u (rest of the world)
I g fiscally sound (safe bonds as u), i fiscally fragile
I i ’s output is uncertain: y1 = y i1ε1 with E [ε1] = 1, cdf G (ε1), with
bounded support [εmin, εmax]
I Preferences of country j :
U j = c j0 + βE [c i1] + ωjλs ln bs,j1 + ωjλi,j ln bi,j1
I Risk neutral over consumptionI Bonds provide liquidity services (ECB collateral policy):λi,i > λi,g ≥ λi,u
I ωj : country size
8 / 28
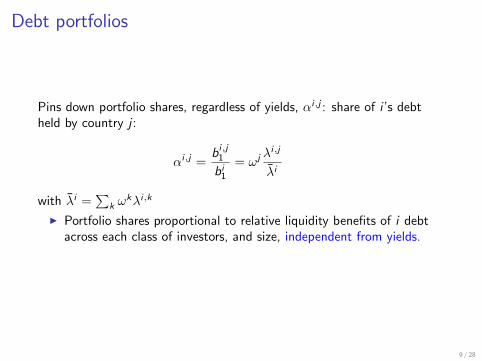
Debt portfolios
Pins down portfolio shares, regardless of yields, αi,j : share of i ’s debtheld by country j :
αi,j =bi,j1
bi1= ωj λ
i,j
λi
with λi =∑
k ωkλi,k
I Portfolio shares proportional to relative liquidity benefits of i debtacross each class of investors, and size, independent from yields.
9 / 28
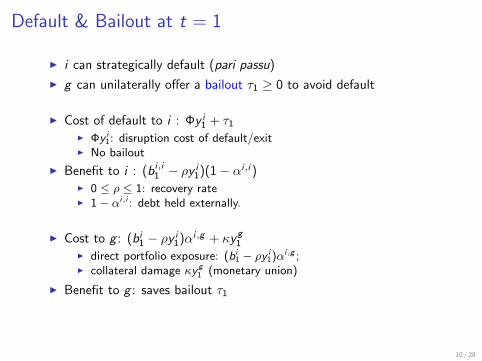
Default & Bailout at t = 1
I i can strategically default (pari passu)
I g can unilaterally offer a bailout τ1 ≥ 0 to avoid default
I Cost of default to i : Φy i1 + τ1
I Φy i1: disruption cost of default/exit
I No bailout
I Benefit to i : (bi,i1 − ρy i1)(1− αi,i )
I 0 ≤ ρ ≤ 1: recovery rateI 1 − αi,i : debt held externally.
I Cost to g : (bi1 − ρy i1)αi,g + κyg
1I direct portfolio exposure: (bi
1 − ρy i1)αi,g ;
I collateral damage κy g1 (monetary union)
I Benefit to g : saves bailout τ1
10 / 28

Default & Bailout at t = 1I i decision: repay if cost of default ≥ benefit of default, given τ1,
minimum transfer/bailout to avoid default:
τ1 ≥ bi1(1− αi,i )− y i1
[Φ + ρ(1− αi,i )
]≡ τ 1
I Threshold for no default without bailout (τ1 = 0):
ε ≡ (1 − αi,i )bi1/y
i1
Φ + ρ(1 − αi,i )≤ εi1
I if εi1 < ε, g prefers bailout if:
Φy i1 + κyg
1 ≥ αi,u1 (bi1 − ρy i
1)
I Threshold for bailout:
ε ≡ αi,ubi1/yi1 − κy
g1 /y
i1
Φ + ραi,u≤ εi1 < ε
I If εi1 < ε, g lets i default.
11 / 28
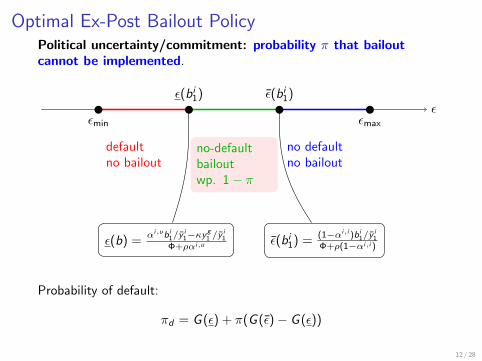
Optimal Ex-Post Bailout PolicyPolitical uncertainty/commitment: probability π that bailoutcannot be implemented.
εmin εmax
ε(bi1) ε(bi1)ε
defaultno bailout
no-defaultbailoutwp. 1− π
no defaultno bailout
ε(b) =αi,ubi
1/yi1−κy
g1 /y
i1
Φ+ραi,u ε(bi1) =(1−αi,i )bi
1/yi1
Φ+ρ(1−αi,i )
Probability of default:
πd = G (ε) + π(G (ε)− G (ε))
12 / 28

Ex-post efficiency gains
if εi1 < ε, g prefers bailout if :
Φy i1 + κyg
1 ≥ αi,u1 (bi1 − ρy i
1)
overall loss of default ≥ overall gain of default
I Bailout is ex-post efficient for i and g jointly
I g makes minimum bailout & captures all the surplus: Southern view
I If bailout conditional on reforms that improve i output: again, allsurplus captured by g
13 / 28
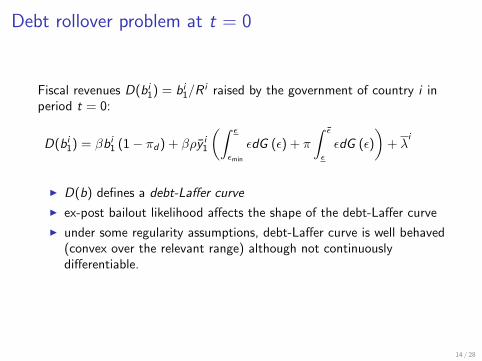
Debt rollover problem at t = 0
Fiscal revenues D(bi1) = bi1/Ri raised by the government of country i in
period t = 0:
D(bi1) = βbi1 (1− πd) + βρy i1
(∫ ε
εmin
εdG (ε) + π
∫ ε
ε
εdG (ε)
)+ λ
i
I D(b) defines a debt-Laffer curve
I ex-post bailout likelihood affects the shape of the debt-Laffer curve
I under some regularity assumptions, debt-Laffer curve is well behaved(convex over the relevant range) although not continuouslydifferentiable.
14 / 28

The Debt-Laffer Curve: D(b)
D(b) for π = 0 (max bailout), π = 0.5 and π = 1 (no bailout).[Uniform distribution with ρ = 0.6, Φ = 0.2, κ = 0.05, εmin = 0.5, β = 0.95, y i
1 = 1,
yg1 = 2, αi,i = 0.4, αi,g = αi,u = 0.3. b = 0.47, b = 0.97 and b = 1.4]
15 / 28

Yields: a Deauville effect (October 2010)?
Yields for π = 0 (expected bailout), π = 1 (no expected bailout) andπ = 0.2[Uniform distribution with ρ = 0.6, Φ = 0.2, κ = 0.05, εmin = 0.5, β = 0.95, y i
1 = 1,
yg1 = 2, αi,i = 0.4, αi,g = αi,u = 0.3. b = 0.47 and b = 0.97]
16 / 28
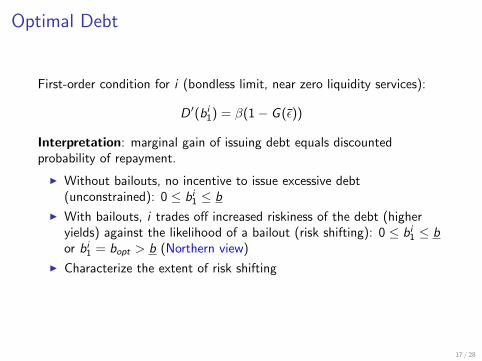
Optimal Debt
First-order condition for i (bondless limit, near zero liquidity services):
D ′(bi1) = β(1− G (ε))
Interpretation: marginal gain of issuing debt equals discountedprobability of repayment.
I Without bailouts, no incentive to issue excessive debt(unconstrained): 0 ≤ bi1 ≤ b
I With bailouts, i trades off increased riskiness of the debt (higheryields) against the likelihood of a bailout (risk shifting): 0 ≤ bi1 ≤ bor bi1 = bopt > b (Northern view)
I Characterize the extent of risk shifting
17 / 28
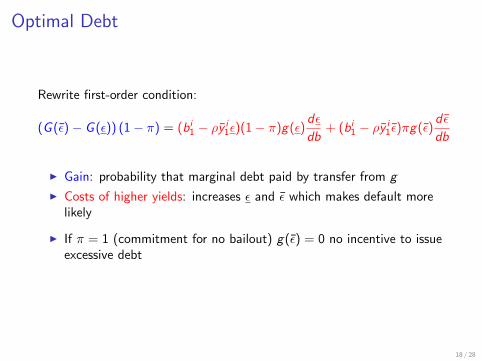
Optimal Debt
Rewrite first-order condition:
(G (ε)− G (ε)) (1− π) = (bi1 − ρy i1ε)(1− π)g(ε)
dε
db+ (bi1 − ρy i
1ε)πg(ε)d ε
db
I Gain: probability that marginal debt paid by transfer from g
I Costs of higher yields: increases ε and ε which makes default morelikely
I If π = 1 (commitment for no bailout) g(ε) = 0 no incentive to issueexcessive debt
18 / 28
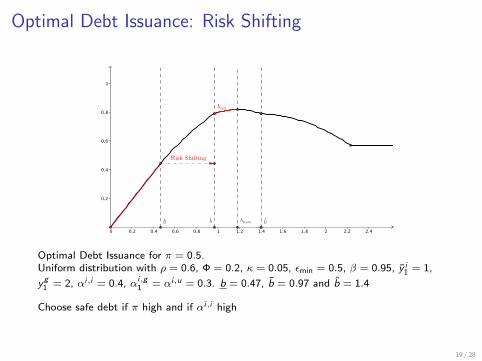
Optimal Debt Issuance: Risk Shifting
Optimal Debt Issuance for π = 0.5.Uniform distribution with ρ = 0.6, Φ = 0.2, κ = 0.05, εmin = 0.5, β = 0.95, y i
1 = 1,
yg1 = 2, αi,i = 0.4, αi,g
1 = αi,u = 0.3. b = 0.47, b = 0.97 and b = 1.4
Choose safe debt if π high and if αi,i high
19 / 28
Risk shifting and no bailout clauses
I Risk shifting increases with probability of bailout 1− π: if π verylow, bopt > b
I i chooses risky debt: risk shifting is maximal.
I Reconciles the ‘Northern’ and ‘Southern’ views: two sides of thesame coin.
I The possibility of a transfer induces risk shifting by i but g capturesall the surplus from the transfer.
20 / 28
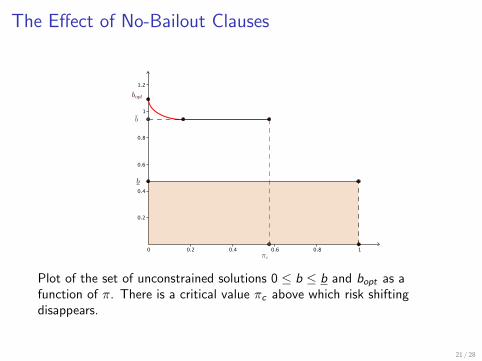
The Effect of No-Bailout Clauses
Plot of the set of unconstrained solutions 0 ≤ b ≤ b and bopt as afunction of π. There is a critical value πc above which risk shiftingdisappears.
21 / 28
Choosing No-Bailout Clauses Commitment level
I Legal institutions, international treaties... may increase π
I bopt decreases with π: g can eliminate risk-shifting by choosingπ ≥ πc
I Will g always choose high π (strong no bailout clause)?
I Not necessarily: higher π could force i to default in period 0 becauseit reduces resources available in period 0 if high initial debt in t = 0
I Option value to wait or ”kicking the can down the road” by g : whatif εi1 high?
I Optimal choice of π < πc if i has high initial level of debt
22 / 28
Default vs. Exit
I Greece defaulted in 2012, received a transfer and did not exit
I Extension: differentiateI default:
I i : cost : Φdyi1
I g : cost : κdyg1
I exit :I i : cost : Φdy
i1 and extra benefit: ∆bi1(1 − αii )
I g : cost: κdyg1 and extra cost: ∆bi1α
ig
I Possibility of transfer to avoid exit even with default
23 / 28

Figure: Optimal Ex-Post Bailout and Default vs. Exit Decisions: Ireland andGreece
24 / 28
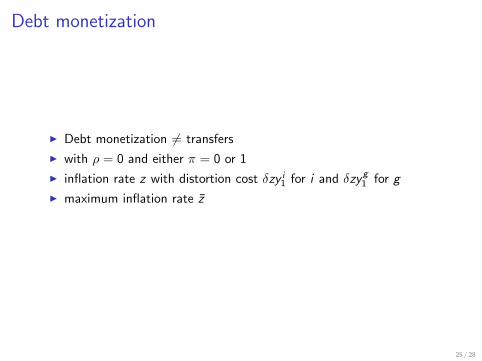
Debt monetization
I Debt monetization 6= transfers
I with ρ = 0 and either π = 0 or 1
I inflation rate z with distortion cost δzy i1 for i and δzyg
1 for g
I maximum inflation rate z
25 / 28

Pecking order of bailout and debt monetization
Transfers are possible:
εmin εmaxε′ ¯ε ε′ε
defaultno bailoutno inflation
no-defaultbailoutinflation
no-defaultbailoutno inflation
no defaultno bailoutno inflation
I debt monetization allows to reduce the transfer
I ECB debt monetization, if it takes place, reduces the likelihood ofdefault
I the whole benefit of debt monetization, if it occurs, is captured by g
26 / 28
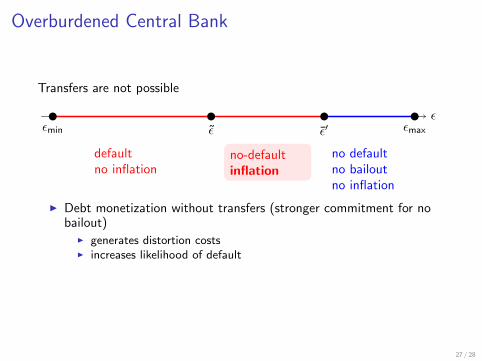
Overburdened Central Bank
Transfers are not possible
εmin εmaxε ε′ε
defaultno inflation
no-defaultinflation
no defaultno bailoutno inflation
I Debt monetization without transfers (stronger commitment for nobailout)
I generates distortion costsI increases likelihood of default
27 / 28
Conclusion
I Reconcile ”Northern” and ”Southern” views of crisis: two sides ofthe same coin
I Incentive to overborrow by fiscally fragile countries because ofimperfect commitment of no bailout clause
I Efficiency gains of transfers and debt monetization to prevent defaultentirely captured by creditor country (no solidarity)
I In our model, very large transfer to Greece (more than 40% of GDP)did not improve Greece welfare
I Current policy discussionsI Strengthening the no-bailout commitment should be done with
prudence:I may precipitate immediate insolvencyI may overburden ECB (debt monetization less efficient than transfers)
I Lowering the cost of default:I orderly restructuring in case of default (lower κ and Φ ): increases
likelihood of default and increase transfer size but reduces itslikelihood
I lower risk concentration of banks (doom loop): same effect as orderlyrestructuring
28 / 28