the economic rationale for devolving to yorkshire
TRANSCRIPT

Final Report
25 September 2018
The economic rationale for devolving to Yorkshire
Hull City Council, on behalf of 18 Yorkshire
Councils
Our ref: 233-352-01


Steer Economic Development has prepared this material for Hull City Council, on behalf of 18 Yorkshire Councils. This material may only be used within the context and scope for which Steer Economic Development has prepared it and may not be relied upon in part or whole by any third party or be used for any other purpose. Any person choosing to use any part of this material without the express and written permission of Steer Economic Development shall be deemed to confirm their agreement to indemnify Steer Economic Development for all loss or damage resulting therefrom. Steer Economic Development has prepared this material using professional practices and procedures using information available to it at the time and as such any new information could alter the validity of the results and conclusions made.
Final Report
25 September 2018
The economic rationale for devolving to Yorkshire
Prepared by:
Prepared for:
Steer Economic Development
61 Mosley Street
Manchester M2 3HZ
Hull City Council, on behalf of 18 Yorkshire Councils
The Guildhall,
Alfred Gelder Street,
Hull
HU1 2AA
+44 (0)161 261 9154
www.steer-ed.com
Our ref: 233-352-01

The economic rationale for devolving to Yorkshire | Final Report
25 September 2018
Contents
1 Executive Summary .................................................................................................... i
Headlines ............................................................................................................................. i
Raising GVA and performance in specific policy areas ........................................................ i
Key findings across the research .........................................................................................ii
Conclusions ......................................................................................................................... iv
2 Introduction .............................................................................................................. 1
Context ............................................................................................................................... 1
Defining the study area ...................................................................................................... 3
Methodology ...................................................................................................................... 7
Structure of this Report .................................................................................................... 13
3 Review of Strategic Economic Plans ......................................................................... 14
What do Strategic Economic Plans and emerging Local Industrial Strategies say about
the Yorkshire economy? ................................................................................................... 14
Conclusions and key messages ......................................................................................... 19
4 Findings from business engagement ........................................................................ 21
Conclusions and key messages ......................................................................................... 25
5 What role might Yorkshire ‘identity’ play? ............................................................... 26
Conclusions and key messages ......................................................................................... 28
6 Perspectives on the economy .................................................................................. 29
Economic coherence and sector specialisation................................................................ 30
R&D, Innovation, and Ideas .............................................................................................. 38
Headline data on GVA and earnings ................................................................................. 44
International Trade and Investment ................................................................................ 47
Skills and Ambition ........................................................................................................... 50
Business Start-ups, Deaths, Survival, Density, and Scale-up ............................................ 56
Transport and Connectivity .............................................................................................. 58
7 Closing the productivity gap .................................................................................... 66
The Yorkshire and Humber Productivity Gap ................................................................... 66
8 Conclusions ............................................................................................................. 76

The economic rationale for devolving to Yorkshire | Final Report
25 September 2018
Figures
Figure 2-1: Yorkshire’s Local Enterprise Partnerships Multiple Memberships ............................ 2
Figure 2-2: Map of Local Authority Districts in Yorkshire and Humber ........................................ 4
Figure 2-3: Components of a local/regional economic ecosystem .............................................. 7
Figure 6-1: Overview of correlations between employment LQs (2016) ................................... 31
Figure 6-2: Detailed employment LQ correlations for Yorkshire & Humberside (2016) ............ 32
Figure 6-3: Ranked employment LQ correlation coefficients for Yorkshire and Humber Councils
(2016) .......................................................................................................................................... 34
Figure 6-4: Ranked GVA for the One Yorkshire signatories in 2016 ........................................... 35
Figure 6-5: The relationship between employment LQ and GVA LQ for One Yorkshire
signatories, 2016 ......................................................................................................................... 36
Figure 6-6: Conceptualising innovation connectivity in and across places ................................ 40
Tables
Table 1-1: Summary of research findings ..................................................................................... iv
Table 1-2: Potential GVA uplift facilitated by Yorkshire level devolution by Policy Area ............. vi
Table 2-1: The three geographical configurations reviewed ........................................................ 5
Table 2-2: Strategic Added Value ................................................................................................. 8
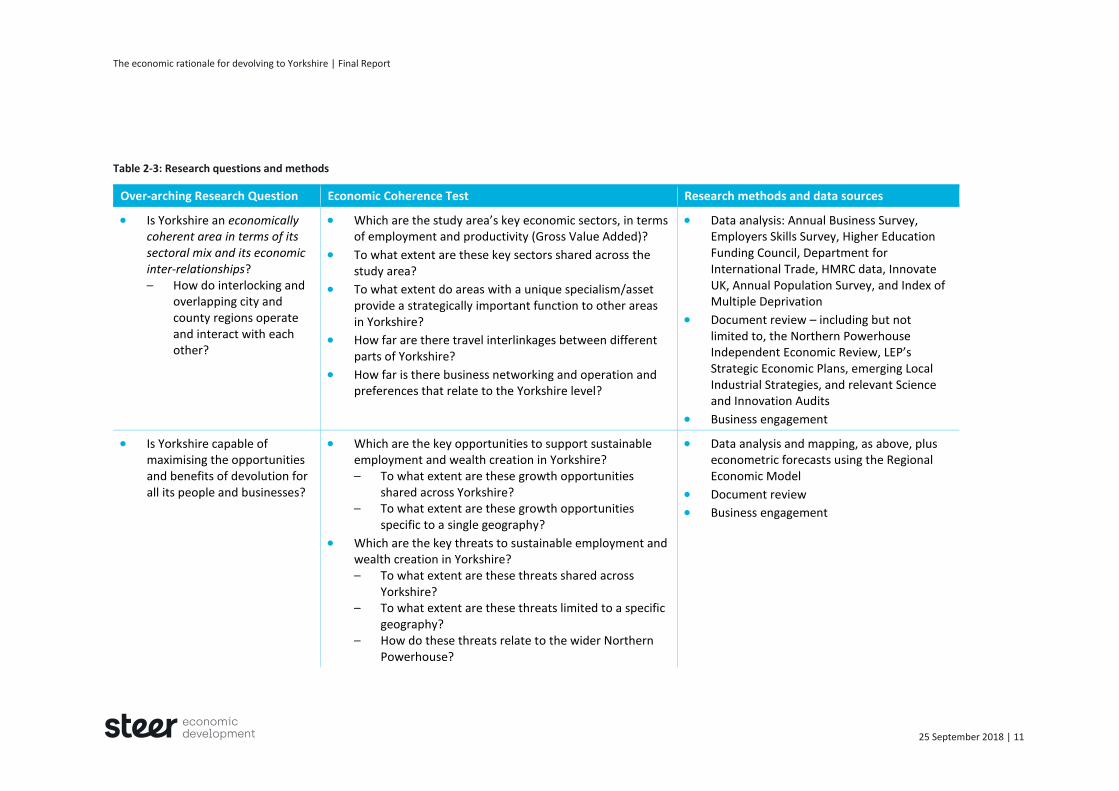
Table 2-3: Research questions and methods .............................................................................. 11
Table 3-1: Review of Strategic Economic Plans and associated documents .............................. 15
Table 6-1: Headline data on R&D expenditure, 2016 ................................................................. 41
Table 6-2: Yorkshire & Humberside LEP UK patenting application activity above 10 patents per
annum, 2005-2017...................................................................................................................... 42
Table 6-3: Correlations between patent application profiles, 2005-2017 ................................. 43
Table 6-4: Headline data on GVA and average weekly earnings ................................................ 46
Table 6-5: UK, Yorkshire and Humber and comparator Exports 2015-2017 .............................. 47
Table 6-6: Foreign Direct Investment data for Yorkshire and Humber and comparator areas . 48
Table 6-7: Headline data on employment, educational attainment and skills .......................... 53
Table 6-8: Headline from Employer Perspectives Survey ........................................................... 54
Table 6-9: Business base, births, deaths and survival rate, 2017 ............................................... 56
Table 6-10: Regional Commuting Flows ..................................................................................... 59
The economic rationale for devolving to Yorkshire | Final Report
25 September 2018
Table 6-11: Breakdown of Travel to Work patterns for selected boundary local authorities and
transport hubs ............................................................................................................................ 59
Table 6-12: Public expenditure per head on Transport by region, 2016/17 .............................. 60
Table 6-13: Ports – positioning and priorities in SEPs/emerging LIS content ............................ 61
Table 6-14: Assets, positioning and priorities in SEPs/ emerging LIS content ............................ 62
Table 6-15: Assets, positioning and priorities in SEPs/ emerging LIS content ............................ 63
Table 6-16: Assets, positioning and priorities in SEPs/ emerging LIS content ............................ 64
Table 6-17: Assets, positioning and priorities in SEPs/ emerging LIS content ............................ 65
Table 7-1: GVA for Yorkshire and Humber and comparator countries and regions, 2016 ........ 66
Table 7-2: Forecast GVA, Jobs and Productivity in Yorkshire in baseline and high growth
scenarios ..................................................................................................................................... 67
Table 7-3: Potential GVA uplift from improving export performance ........................................ 69
Table 7-4: Potential GVA uplift from improved performance in Inward Investment ................ 70
Table 7-5: Potential GVA uplift through improved performance in relation to R&D investment
.................................................................................................................................................... 71
Table 7-6: Skills and ambition ..................................................................................................... 72
Table 7-7: Business base ............................................................................................................. 73
Table 7-8:Transport .................................................................................................................... 74
Table 8-1: Key findings ................................................................................................................ 77
Appendices
A Review of Strategic Economic Plans
B Key sectors and employment levels in Yorkshire and Humber
C Areas for further study

The economic rationale for devolving to Yorkshire | Final Report
25 September 2018 | i
This study was commissioned in Summer 2018 on behalf of the 18 Yorkshire Councils which
work together under the banner of ‘One Yorkshire’. The work was delivered by Steer Economic
Development, supported by Les Newby Associates Ltd.
The work’s intent was twofold, namely to:
Assess the overall economic and strategic rationale for devolving (powers and budgets) to
the Yorkshire-level; and
Identify key opportunities and tangible benefits which could be secured by, and for, all
people and businesses in the region’s urban, rural, and coastal areas.
Headlines
Based on a wide range of data analyses, observations, document reviews, and business
engagement, there is strong evidence that Yorkshire (and Humber) is a coherent and
interconnected economic area. The overall geography includes several functional economic
areas, which have strong interconnections, and similar/shared issues, priorities, and networks.
Currently, the region’s GVA per head, at £20,678, is 27% below the UK average. The area’s
total GVA would rise to £144bn – £31bn more than currently – if it matched the UK average.
The study investigated how far, and in what ways, devolution could contribute to reducing this
gap. It concluded that:
Yorkshire-level devolution will create opportunities to reduce significantly the sizeable
gaps in productivity and Gross Value Added (GVA) which exist between Yorkshire (and
Humber) and the UK average; and
Depending on the levels of ambition and activity, total GVA uplift from devolution at the
Yorkshire-level could be as high as £9bn-£30bn a year over a 20-year timeframe. This
amounts to £1,600-£5,400 per head.
Raising GVA and performance in specific policy areas
The study took account of strategic issues and opportunities relevant across Yorkshire and
assessed what could be done better/collaboratively through Yorkshire-level devolution to
reduce GVA gaps in a mix of relevant policy areas such as Exports, Enterprise, and Skills – all of
which are essential for the development of effective responses to inequality, slow pay growth,
and the risks and opportunities associated with Brexit.
Table 1-2 presents findings for the contribution that each policy area might make to closing
the GVA gap between Yorkshire and the UK, based on three scenarios – cautious (30%), mid-
range (65%), or ambitious (100% closure). The results cannot be added together to produce a
‘total’ because of interrelationships and double-counting. However, subject to caveats and
assumptions on the degree of devolution and levels of investment, illustrative figures for
individual policy areas suggest that, over the long term, Yorkshire-level devolution could lead
to:
1 Executive Summary
The economic rationale for devolving to Yorkshire | Final Report
25 September 2018 | ii
Uplift in export value, equivalent to GVA of £3.1bn-£10.4bn;
Uplift in inward investment jobs, equivalent to GVA of £5.9m-£19.7m;
Uplift in R&D investment of £0.4bn-£1.35bn, with additional long-term GVA spillovers;
Improvement in skills to match the UK’s skills profile could deliver GVA uplift of c.£1.56bn
a year;
Increases in the size of the business base and the number of rapidly growing ‘Scale-Up’
businesses, equivalent to a GVA increase of £4.6bn-£15.4bn; and
Uplift in transport investment to the value of £39m-£130m (using latest year’s spending
data) or £0.5bn-£1.66bn (using data on the spending pipeline), with additional long-term
GVA benefit.
Key findings across the research
The study investigated how far Yorkshire (and Humber) demonstrates internal coherence
based on shared sector/industry specialisms, complementarities arising from economic
variety, and sufficient distinctiveness from the UK to warrant devolution. Key elements and
findings are as follows:
From the review of Strategic Economic Plans (SEPs) and Local Industrial Strategy . . .
The four SEPs are similar in terms of the issues they address and approaches adopted.
Five sector priorities are common to at least three LEP areas: Advanced Manufacturing;
Energy/Low Carbon; Food and Drink/Agri-Food; Health and/or Care; and Digital/Creative –
while other priority sectors are specific to certain LEP areas.
There are good opportunities to present complementary offers at the Yorkshire-level
which take advantage of shared strengths and distinctive assets as well as diversity.
For some functions, e.g., local regeneration, the value of local proximity or distinctive
need supports localised approaches, however, there are potential advantages in, joining-
up activities across localities on ‘higher level’ functions, e.g., specialist business support.
From the Business Engagement consultations . . .
There is strong business support for devolution of powers and budgets from central
government – this is in and of itself the priority for many businesses.
There is a range of views on the geography for devolution, but on balance, the majority
support devolution to the Yorkshire-level, provided local needs can still be met.
Reasons for supporting devolution include strong leadership, prioritisation, brand and
international business, as well as issues including strategic transport and labour markets.
Worries in relation to devolution include bureaucracy, uncertainty about functions to be
undertaken, risks of smaller areas losing out to larger ones, and locally-specific issues
(such as concerns about split governance in the Humber or a step-by-step approach to
devolution in South Yorkshire).
On Sector and Specialisms analyses . . .
There is a degree of coherence in terms of sectors and industries which provide significant
employment in multiple local authority districts in Yorkshire, suggesting arrangements at
this level could achieve economies-of-scale in supporting growth.
Manufacturing is relatively pronounced across all Yorkshire sub-regions, but (as in the UK
in general) only accounts for a modest proportion of overall jobs and GVA.
Service industries are more significant for employment and GVA across Yorkshire, and 13
such industries provide at least 2,500 jobs in three districts or more.

The economic rationale for devolving to Yorkshire | Final Report
25 September 2018 | iii
On Business Start-ups, Deaths, Survivals, density and Scale up . . .
Data on Business Density, Start-Ups, Survival Rates, and Scale-Ups suggest there is a
significant entrepreneurial challenge in Yorkshire. But, there is clearly scope for Yorkshire
to improve its Scale-Up performance, as Distribution, Manufacturing & Engineering, and
Food & Drink Processing, in which it has clear specialisms, are delivering significant
numbers of Scale-Ups elsewhere.
Variations in business performance across LEP areas and local districts within Yorkshire
point to opportunities for greater knowledge exchange/transfer, including on the
challenges shared by multiple districts (such as responding to the impacts of automation).
On R&D, Innovation and Ideas . . .
There is under-investment in R&D, and potential for greater innovation across the region.
There will be value in identifying and utilising strategic innovation assets that support
innovation across Yorkshire, working better with multi-national businesses, which act as
entry points for firms to global supply chains, and capitalising on the extensive Higher
Education provision and strengths across the region.
On International Trade and Investment . . .
Yorkshire and Humber has the lowest proportionate export levels of any UK region.
Devolution to the Yorkshire-level may improve the impact of efforts to promote exports
and foreign investment through intensification of activity, utilising Yorkshire’s positive
profile/identity and developing ambition related to it; and by capitalising on
complementary strategic assets, such as the Humber ports complex.
On Skills and Ambition . . .
The significant gap between Yorkshire and Humber and the UK in the percentage of the
workforce qualified to NVQ4 (or above) is acting as a drag on productivity and earnings.
The coordination of effort on higher-level skills (including Degree-level Apprenticeships) at
the level of Yorkshire can add value, and raise employers’ use of universities.
There is a need to improve attainment at NVQ3, but business engagement highlighted the
importance of local arrangements for delivery of most vocational skills.
On the Yorkshire Identity . . .
The Yorkshire ‘brand’ is well recognised.
Research by the BBC shows that 75% of people in Yorkshire feel ‘allegiance’ to their
county – more than anywhere else in England.
Yorkshire identity is associated with positive values: straight-talking, hard-working,
friendly, supportive.
Yorkshire identity is considered an asset by many businesses, both in terms of local and
national markets and in international/outward-focused activities, such as international
trade and investment, and in sectors such as tourism, food and cultural industries.
On Transport and Connectivity . . .
Commuting patterns in Yorkshire and Humber’s four main sub-regions suggest that these
areas are functional economic areas. However, there is significant commuting between
sub-regions from some districts (e.g. Harrogate and Selby to Leeds) and a case that
commuting levels between areas (e.g. Sheffield and Leeds) may be being suppressed by
fare structures and service offers. These could be addressed effectively at regional level.

The economic rationale for devolving to Yorkshire | Final Report
25 September 2018 | iv
Yorkshire has notable strategic transport assets, such as the Humber Ports. LEPs and SEPs
tend to focus their attention on local assets, which limits the potential for wider
promotion and development of strategic assets that are both regionally and nationally
significant.
Conclusions
The study identified opportunities across six policy domains where devolution to Yorkshire
could deliver significant economic impact (Table 1-2). However, the study does not present an
‘all or nothing’ case for Yorkshire-level devolution, suggesting some activities may be best-led
more locally (e.g. employment, inclusion, and place-based regeneration), while others (notably
strategic transport) are best covered at the wider Northern-level. But, there are potentially
considerable advantages from devolution to the Yorkshire-level in a significant number of
policy areas: higher-level economic functions such as Innovation, Exports, Higher-Level Skills,
specialised Business Support to enable Scale-Ups, and specific elements of Transport, such as
ports and ticketing. Table 1-1 summarises the key conclusions in relation to the main research
questions.
Table 1-1: Summary of research findings
Over-arching research question
Findings
Is Yorkshire an economically coherent area?
There is strong evidence that Yorkshire (and Humber) is a coherent economic area, based on a range of data and observations
The region includes several functional economic areas, which have strong interconnections, and often similar or shared issues, priorities and networks
There is a strong degree of similarity in priorities at broad sector level
Strategic assets, e.g. ports, HE, rail/road routes, serve Yorkshire-wide needs
While each LEP area is functional, there are significant travel flows across sub-regional boundaries
Sizeable business and HE networks operate at Yorkshire-level, and many businesses believe that Yorkshire identity is an asset e.g. in branding
Is the Yorkshire-level capable of maximising the opportunities and benefits of devolution?
Reviews of SEPs and emerging Local Industrial Strategy priorities in the four LEP areas show similar overall priorities. All cover productivity, business growth and support, skills and employment, and infrastructure
There are locally distinctive (but not contradictory) variations in visions
Similar challenges are identified in the majority of LEP areas and key assets/strengths cited by LEPs tend to be locally specific not strategic – indicating the potential to deliver greater benefit from devolution
How does and might Yorkshire fit within Northern Powerhouse arrangements?
Key sectors identified by LEPs overlap with the prime capabilities at Northern level, but not with the ‘enablers’ (e.g. finance & professional)
There are similarities between opportunities and threats for wealth generation and employment in Yorkshire (and Humber) and across the North
However, while there are shared issues, there are in practice few mechanisms for dealing with these collectively across the North
What might be the economic uplift from One Yorkshire Devolution?
An illustrative total uplift figure would be in the region of £9bn to £30bn per year over a 20-year time frame, subject to caveats and assumptions, and based on three scenarios for closing gaps with the UK
This amounts to £1,600-£5,400 per head

The economic rationale for devolving to Yorkshire | Final Report
25 September 2018 | v
Over-arching research question
Findings
Is there a case to establish a directly-elected Mayor (as enabled under the Cities and Local Government Devolution Act 2016)?
There are similarities in economic structure across Yorkshire (and Humber) and shared challenges/opportunities/ approaches present potential economies of scale in some (but not all) of these areas at Yorkshire-level
Yorkshire (and Humber) is different from the UK economy: it faces greater challenges on many economic indicators and its sectoral mix is different
Limited coordination of economic development activity because barriers often limit projects/activities to a single LEP area, even where there may be economies of scale/scope or greater impact from a coordinated approach

The economic rationale for devolving to Yorkshire | Final Report
25 September 2018 | vi
Table 1-2: Potential GVA uplift facilitated by Yorkshire level devolution by Policy Area
Strategic Case - what’s the issue/opportunity?
Data/Baseline How far is it a shared issue across LEP areas?
What could be done better/collaboratively via Yorkshire devolution?
Estimated Added Value/under-investment (based on extent to which gap to national average is closed)
Cautious 30%
Mid-range 65%
Ambitious 100%
Exports – are much lower than UK average per head
Yorkshire and Humber exports are £16.8bn, 5.1% of the UK total of £328bn A proportionate Y&H figure would be £27bn
All four LEPs identify exports as a priority and similar barriers exist in each LEP area
Better use of assets across Yorkshire (e.g. ports), capitalise on Yorkshire brand to raise ambitions and promote exports; more intensive and tailored promotion and business support
£3.1bn £6.8bn £10.4bn
Inward Investment – has improved but is below the UK average
4,600 Yorkshire and Humber FDI jobs in 2017 is 92% of the proportionate figure – a gap of 435 jobs This equates to GVA of £20m
Inward Investment is of interest to all LEPs and similar approaches are used – implying scope for joint work
Capitalise on strong and improving Yorkshire profile, intensify effort through further joint promotion and take advantage of international ‘Yorkshire alumni’ connections
£5.9m £12.8m £19.7m
Investment in R&D – per head is low: raising R&D and innovation will have a positive short-term impact and deliver long-term benefits
Yorkshire and Humber’s R&D investment per person is £258 – only slightly more than 50% of the UK average A proportionate Yorkshire and Humber figure would be £2.75bn
All LEPs see innovation as important, there is a regional HE network, and there are shared issues and assets which could benefit from coordinated leadership
Better connections to global supply chains and global innovation networks; work through Yorkshire Universities HEI network; specialised business support and signposting, and pooling of effort and influence to attract new expertise and assets
£0.41bn R&D
£0.88bn R&D
£1.35bn R&D
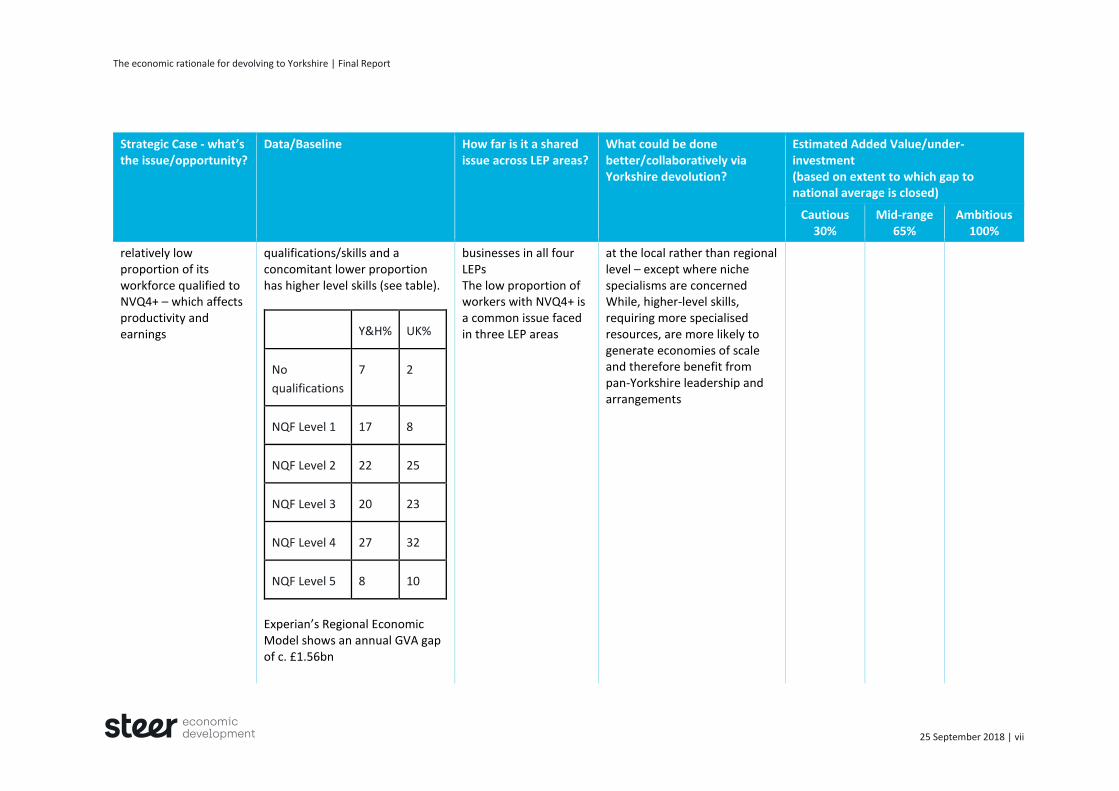
High level skills – Yorkshire (and Humber) has a
Yorkshire and Humber’s workforce is c. 2.5m a higher proportion has no or low
Skills are consistently highlighted as a significant issue by
Business engagement indicates lower-level and vocational skills are likely to be best addressed
£0.46bn £1bn £1.56bn
The economic rationale for devolving to Yorkshire | Final Report
25 September 2018 | vii
Strategic Case - what’s the issue/opportunity?
Data/Baseline How far is it a shared issue across LEP areas?
What could be done better/collaboratively via Yorkshire devolution?
Estimated Added Value/under-investment (based on extent to which gap to national average is closed)
Cautious 30%
Mid-range 65%
Ambitious 100%
relatively low proportion of its workforce qualified to NVQ4+ – which affects productivity and earnings
qualifications/skills and a concomitant lower proportion has higher level skills (see table).
Y&H% UK%
No
qualifications
7 2
NQF Level 1 17 8
NQF Level 2 22 25
NQF Level 3 20 23
NQF Level 4 27 32
NQF Level 5 8 10
Experian’s Regional Economic Model shows an annual GVA gap of c. £1.56bn
businesses in all four LEPs The low proportion of workers with NVQ4+ is a common issue faced in three LEP areas
at the local rather than regional level – except where niche specialisms are concerned While, higher-level skills, requiring more specialised resources, are more likely to generate economies of scale and therefore benefit from pan-Yorkshire leadership and arrangements

The economic rationale for devolving to Yorkshire | Final Report
25 September 2018 | viii
Strategic Case - what’s the issue/opportunity?
Data/Baseline How far is it a shared issue across LEP areas?
What could be done better/collaboratively via Yorkshire devolution?
Estimated Added Value/under-investment (based on extent to which gap to national average is closed)
Cautious 30%
Mid-range 65%
Ambitious 100%
Business base and scale ups – Yorkshire and Humber has a relatively low business density which limits employment and the flow of scale-up businesses
Yorkshire and Humber has 7.3% of the UK business population A shortfall of 56,700 businesses Given average business size and GVA per employee (£45,200) this equates to a GVA gap of c.£15.4bn
While there is variation in LEPs’ achievement in terms of business density and scale-ups, the issue is pan-regional
Supplement local support on enterprise formation with greater provision in relation to high-growth businesses, which may benefit from pan-Yorkshire leadership and coordination to spread understanding/best practice and provide expertise and specialisms that smaller geographies may be unable to provide
£4.6bn (17,000
businesses)
£10bn (36,900
businesses)
£15.4bn (56,700
businesses)
Transport – business consistently highlights transport as a barrier to growth, but investment per head is low
Based on the most recent year’s spend, investment in Yorkshire and Humber is £130m below a proportionate level; this rises to £1.66bn based on analysis of future transport spending plans
LEP strategies and investments have focus on local transport issues; there is a need for strategic leadership to identify strategic assets and cross-LTA issues (other issues are covered at northern level)
Strategic leadership and coordination to identify an intra-regional road network, simplify/reduce cost for cross-LTA rail journeys; prioritise local public transport and rail in spending decisions, in response to current under-investment; greater shared use of the Humber Ports asset
£39m (£0.50bn
using pipeline
data)
£84.5m (£1.08bn
using pipeline
data)
£130m (£1.66bn
using pipeline
data)

The economic rationale for devolving to Yorkshire | Final Report
25 September 2018 | 1
This study was commissioned by Hull City Council on behalf of the 18 Yorkshire Councils which
work together under the banner of ‘One Yorkshire’.1 Its purpose is to:
Assess the overall economic and strategic rationale for devolving (powers and budgets) to
the Yorkshire level; and
Identify key opportunities and tangible benefits which may be secured by and for all
people and businesses in the region’s urban, rural and coastal areas.
The study does not address in detail the issue of governance – but it does provide conclusions
on the economic rationale for devolution to specific geographic configurations and the issues
and opportunities that may be effectively addressed across Yorkshire. The study’s findings will
inform partners’ development of the case for devolution to Yorkshire.2
Context
Yorkshire and the Humber is a polycentric area with a large and diverse economy – a
population of 5.56m and a workforce of 2.5m. Current local governance arrangements for
economic development reflect this diversity and complexity, for example, a number of local
authority districts, currently, are in more than one Local Enterprise Partnership (LEP).
Figure 2-1 shows four local authority districts in both the Leeds City Region and the York,
North Yorkshire, East Riding LEP, one in the Leeds City Region LEP and the Sheffield City Region
LEP, one in the York, North Yorkshire, East Riding LEP and the Humber LEP, and two in both
the Humber and Greater Lincolnshire LEPs.3
1 Barnsley, Bradford, Calderdale, Craven, Doncaster, East Riding, Hambleton, Harrogate, Hull, Kirklees, Leeds, North Yorkshire, Richmondshire, Scarborough, Selby, Ryedale, Wakefield, and York.
2 The study began with an inception meeting to agree scope, 12 June 2018. This meeting was followed by a presentation of the proposed approach to the Chief Executives Devolution Sub-Group, 27 June 2018 and to Leaders, 12 July 2018. There was a detailed progress report to the client in 25 July 2018. The Chief Executives Devolution Sub-Group received a presentation of findings 28 August 2018. A draft report was shared for comment 31 August 2018, and comments were received 10 September. This report takes account of the feedback received.
3 During the study period, central government issued Strengthened Local Enterprise Partnerships, https://assets.publishing.service.gov.uk/government/uploads/system/uploads/attachment_data/file/728058/Strengthened_Local_Enterprise_Partnerships.pdf, which among other things calls for LEPs to avoid multiple membership.
2 Introduction

The economic rationale for devolving to Yorkshire | Final Report
25 September 2018 | 2
Figure 2-1: Yorkshire’s Local Enterprise Partnerships Multiple Memberships
Source: Steer-ED
The complexity of interactions between Yorkshire’s sub-regional economies and local political
and administrative boundaries have stymied efforts to establish governance arrangements in
Yorkshire that are as economic, efficient, and effective as they could be.
In Spring 2017, Yorkshire Council Leaders began to meet to discuss a range of shared issues
and the potential for deeper regional collaboration, including options for devolution of powers
and budgets. Eighteen of the 22 Yorkshire and Humber Council Leaders formed a cross-party
coalition, ‘One Yorkshire’, which covers the administrative areas of Barnsley, Bradford,
Calderdale, Craven, Doncaster, East Riding, Hambleton, Harrogate, Hull, Kirklees, Leeds, North
Yorkshire, Richmondshire, Scarborough, Selby, Ryedale, Wakefield, and York.
The then Secretary of State for Housing, Communities and Local Government (the SoS) met
Yorkshire Council Leaders, MPs, and other stakeholders at a meeting of the Yorkshire and
Northern Lincolnshire All Party Parliamentary Group in February 2018. At the meeting, the SoS
confirmed that the Government would not seek to prevent a One Yorkshire proposal (with a
Yorkshire Mayor and a Combined Authority from 2020) provided:
Proposals met statutory requirements;
There was widespread support for proposals in the county; and
Any or all South Yorkshire authorities were able to join the ‘One Yorkshire’ arrangements
from their inception, if they so wished.
One Yorkshire Leaders subsequently submitted a proposition to the SoS in March 2018. This
proposition outlined the potential scope of significant devolved powers including: adult skills;
business growth; unemployment; careers information, advice and guidance; enterprise
education; transport (including consolidated budgets and bus franchises); the power to levy a
Supplementary Business Rate; powers to bring forward strategic sites; a Gainshare Fund to

The economic rationale for devolving to Yorkshire | Final Report
25 September 2018 | 3
support economic growth; a Housing Investment Fund; and Enterprise Zone/Tax Increment
Financing for major sites/developments.
It should be noted, however, that a number of commentators, including Northern Powerhouse
Partnership board member Sir Jim O’Neill,4 have queried whether there is an economic case
for devolution to the ‘One Yorkshire’ level beyond the benefits of the Yorkshire ‘brand’ and
the lobbying and advocacy power of a large area.
In this report, we independently test the economic rationales for introducing devolved
Yorkshire-level powers and budgets for the proposed policy areas of: enterprise and business
support (including sectors, innovation and international trade and investment); employment
and skills; and transport and connectivity – building on arguments based on Yorkshire’s scale,
brand recognition, and shared sense of identity, and analysing the available evidence.
Defining the study area
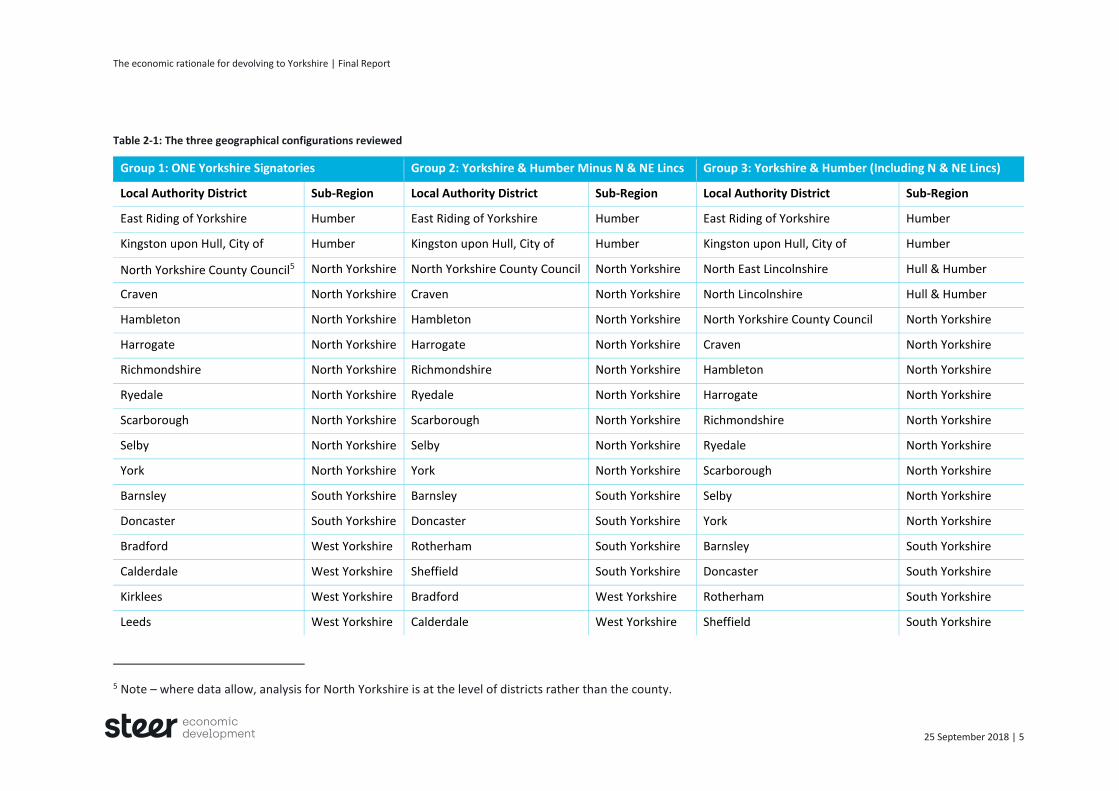
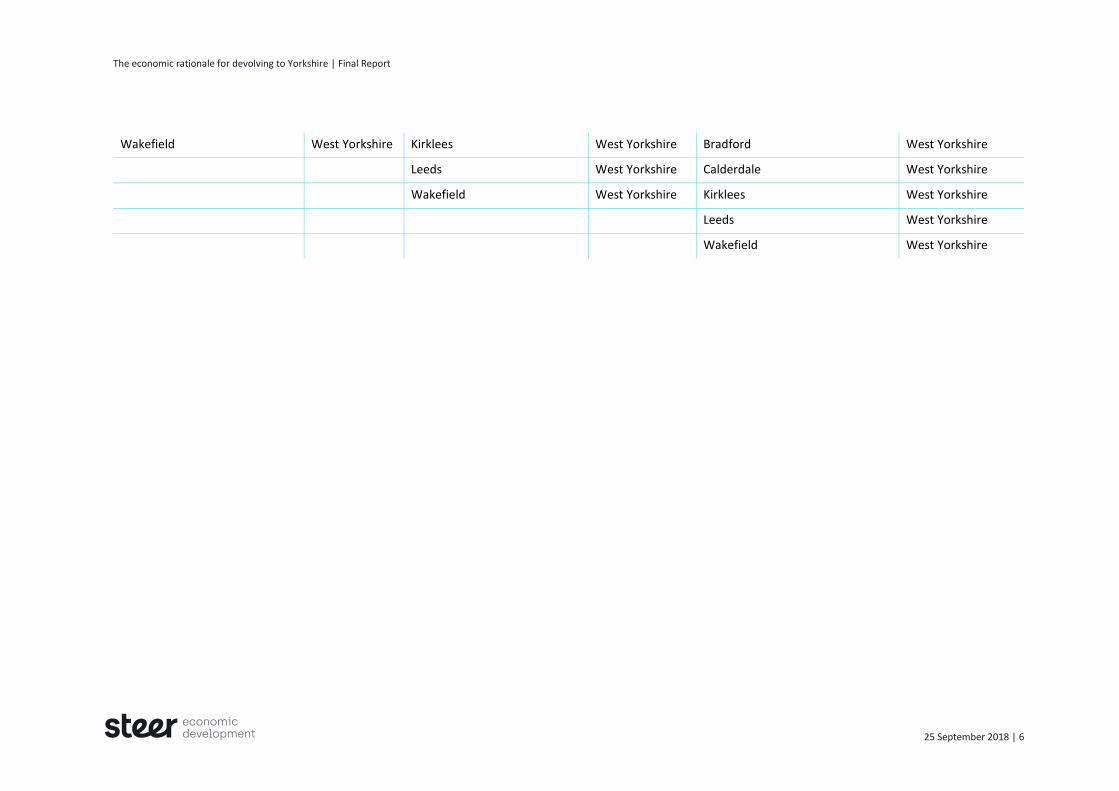
Given the possible geographies beyond the proposed One Yorkshire footprint, our analysis
reviews three geographical configurations (Table 2-1):
Group One covers the area of the 18 authorities operating under the auspices of ‘One
Yorkshire’;
Group Two includes the two additional South Yorkshire Authorities, Sheffield and
Rotherham, in line with the proposal that all South Yorkshire authorities be able to join
any Yorkshire-wide devolved arrangements from the start; and
Group Three adds North Lincolnshire and North East Lincolnshire, to the list of areas in
Group Two – these two districts form an integral part of the Humber Local Enterprise
Partnership, and complete the statistical region of Yorkshire & the Humber – which for
some economic data, such as exports and spending on R&D, is the level at which data are
available.
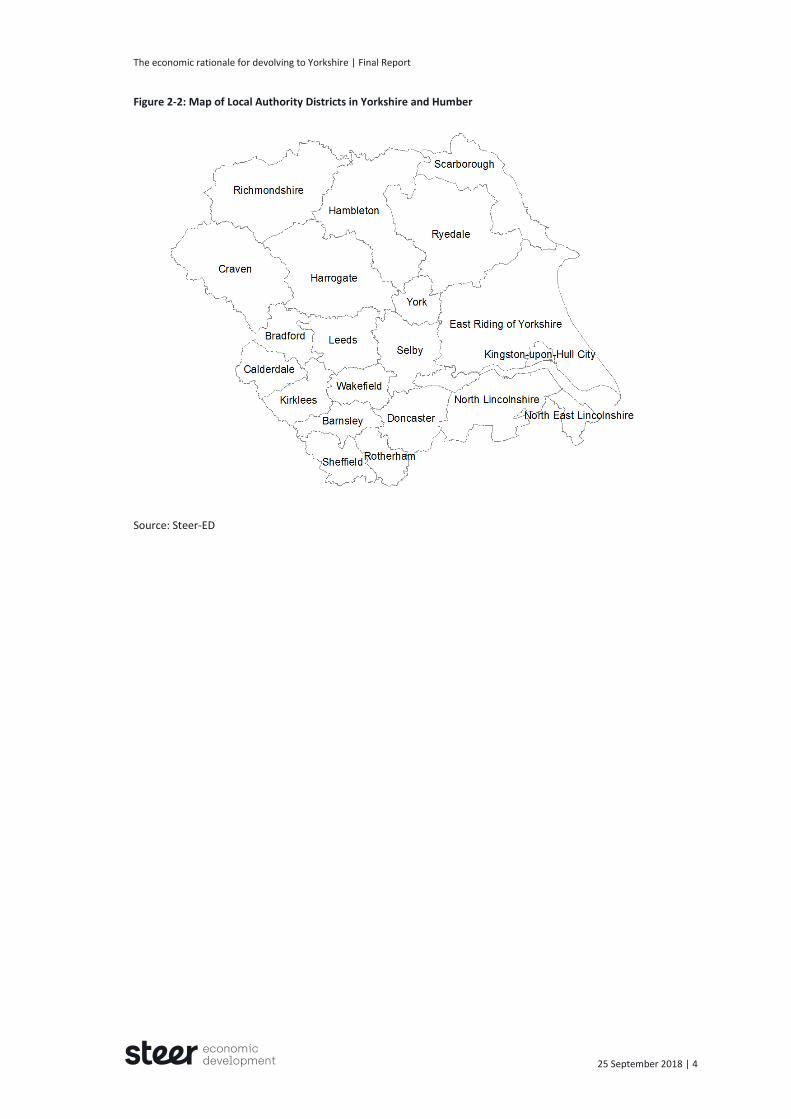
Figure 2-2 provides a map of the different local authority districts in Yorkshire and Humber for
ease of comparison. In the text we often refer to the ‘study area’ which refers to the primary
One Yorkshire geography (Group One) but where appropriate, and available data permits, we
draw distinctions between the three geographies.
4 https://www.yorkshirepost.co.uk/news/yorkshire-needs-more-than-chest-beating-slogans-to-win-powers-northern-powerhouse-architect-says-1-9159364
The economic rationale for devolving to Yorkshire | Final Report
25 September 2018 | 4
Figure 2-2: Map of Local Authority Districts in Yorkshire and Humber
Source: Steer-ED
The economic rationale for devolving to Yorkshire | Final Report
25 September 2018 | 5
Table 2-1: The three geographical configurations reviewed
Group 1: ONE Yorkshire Signatories Group 2: Yorkshire & Humber Minus N & NE Lincs Group 3: Yorkshire & Humber (Including N & NE Lincs)
Local Authority District Sub-Region Local Authority District Sub-Region Local Authority District Sub-Region
East Riding of Yorkshire Humber East Riding of Yorkshire Humber East Riding of Yorkshire Humber
Kingston upon Hull, City of Humber Kingston upon Hull, City of Humber Kingston upon Hull, City of Humber
North Yorkshire County Council5 North Yorkshire North Yorkshire County Council North Yorkshire North East Lincolnshire Hull & Humber
Craven North Yorkshire Craven North Yorkshire North Lincolnshire Hull & Humber
Hambleton North Yorkshire Hambleton North Yorkshire North Yorkshire County Council North Yorkshire
Harrogate North Yorkshire Harrogate North Yorkshire Craven North Yorkshire
Richmondshire North Yorkshire Richmondshire North Yorkshire Hambleton North Yorkshire
Ryedale North Yorkshire Ryedale North Yorkshire Harrogate North Yorkshire
Scarborough North Yorkshire Scarborough North Yorkshire Richmondshire North Yorkshire
Selby North Yorkshire Selby North Yorkshire Ryedale North Yorkshire
York North Yorkshire York North Yorkshire Scarborough North Yorkshire
Barnsley South Yorkshire Barnsley South Yorkshire Selby North Yorkshire
Doncaster South Yorkshire Doncaster South Yorkshire York North Yorkshire
Bradford West Yorkshire Rotherham South Yorkshire Barnsley South Yorkshire
Calderdale West Yorkshire Sheffield South Yorkshire Doncaster South Yorkshire
Kirklees West Yorkshire Bradford West Yorkshire Rotherham South Yorkshire
Leeds West Yorkshire Calderdale West Yorkshire Sheffield South Yorkshire
5 Note – where data allow, analysis for North Yorkshire is at the level of districts rather than the county.
The economic rationale for devolving to Yorkshire | Final Report
25 September 2018 | 6
Wakefield West Yorkshire Kirklees West Yorkshire Bradford West Yorkshire
Leeds West Yorkshire Calderdale West Yorkshire
Wakefield West Yorkshire Kirklees West Yorkshire
Leeds West Yorkshire
Wakefield West Yorkshire
The economic rationale for devolving to Yorkshire | Final Report
25 September 2018 | 7
Methodology
Research framework
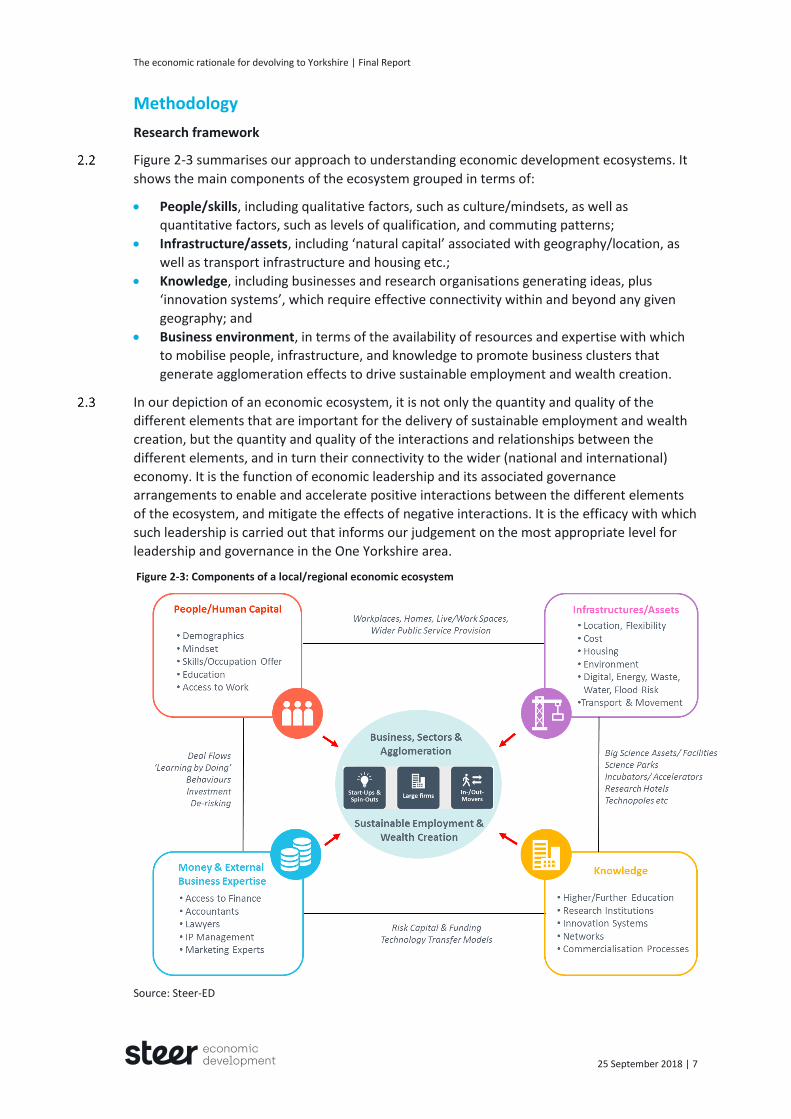
Figure 2-3 summarises our approach to understanding economic development ecosystems. It
shows the main components of the ecosystem grouped in terms of:
People/skills, including qualitative factors, such as culture/mindsets, as well as
quantitative factors, such as levels of qualification, and commuting patterns;
Infrastructure/assets, including ‘natural capital’ associated with geography/location, as
well as transport infrastructure and housing etc.;
Knowledge, including businesses and research organisations generating ideas, plus
‘innovation systems’, which require effective connectivity within and beyond any given
geography; and
Business environment, in terms of the availability of resources and expertise with which
to mobilise people, infrastructure, and knowledge to promote business clusters that
generate agglomeration effects to drive sustainable employment and wealth creation.
In our depiction of an economic ecosystem, it is not only the quantity and quality of the
different elements that are important for the delivery of sustainable employment and wealth
creation, but the quantity and quality of the interactions and relationships between the
different elements, and in turn their connectivity to the wider (national and international)
economy. It is the function of economic leadership and its associated governance
arrangements to enable and accelerate positive interactions between the different elements
of the ecosystem, and mitigate the effects of negative interactions. It is the efficacy with which
such leadership is carried out that informs our judgement on the most appropriate level for
leadership and governance in the One Yorkshire area.
Figure 2-3: Components of a local/regional economic ecosystem
Source: Steer-ED

The economic rationale for devolving to Yorkshire | Final Report
25 September 2018 | 8
Defining our terms
Before going any further, it is important that we define our terms, in particular, the terms:
Strategic Added Value (SAV);
Functional Economic Market Area (FEMA); and
Economically Coherent Area (ECA).
Strategic Added Value
The concept of SAV is useful in determining the rationale for, and assessing the effectiveness
of, a strategic office/organisation (Table 2-2). It draws on the need to understand whether a
strategic office, such as a Mayor, or strategic body, such as a Land Commission:
Offers more economic, efficient, and effective means of gathering, sharing and
interpreting information than alternative arrangements;
Enables the economic, efficient, and effective coordination of the activities of multiple
actors who each lack sufficient information about the potential or actual activities of
other actors to make the most economic, efficient, and effective decisions; and
Provides leadership and a vision.
Table 2-2: Strategic Added Value
SAV Category SAV Definition
Strategic leadership & catalyst
Articulating and communicating development needs, opportunities and solutions to partners and stakeholders.
Strategic influence Carrying-out or stimulating activity that gets strategic partners to commit to shared strategic objectives, and to allocate resources and behave accordingly.
Leverage Providing/securing financial and other incentives to mobilise partner and stakeholder resources e.g. equipment and people, as well as funding.
Synergy Using organisational capacity, knowledge and expertise to improve information exchange and knowledge transfer and coordination and/or integration of the design and delivery of activities between partners.
Engagement Setting-up the mechanisms and incentives for the more effective and deliberative engagement of stakeholders in the design and delivery of organisational priorities.
Source: SDG Economic Development adapted from: DTI Occasional Paper 2: Evaluating the Impact England’s Regional Development Agencies: Developing a Methodology and Evaluation Framework, 2006
Any rationale for devolution needs to demonstrate that the level to which powers and budgets
are to be devolved offers the opportunities to reduce diseconomies of scale and/or scope
associated with the ‘transaction costs’ of administering a given economic geography at a
higher (e.g. national) level, while providing economies of scale and/or scope relative to
operating those powers and budgets at a lower (local) level.
The economic rationale for devolving to Yorkshire | Final Report
25 September 2018 | 9
Functional Economic Market Area
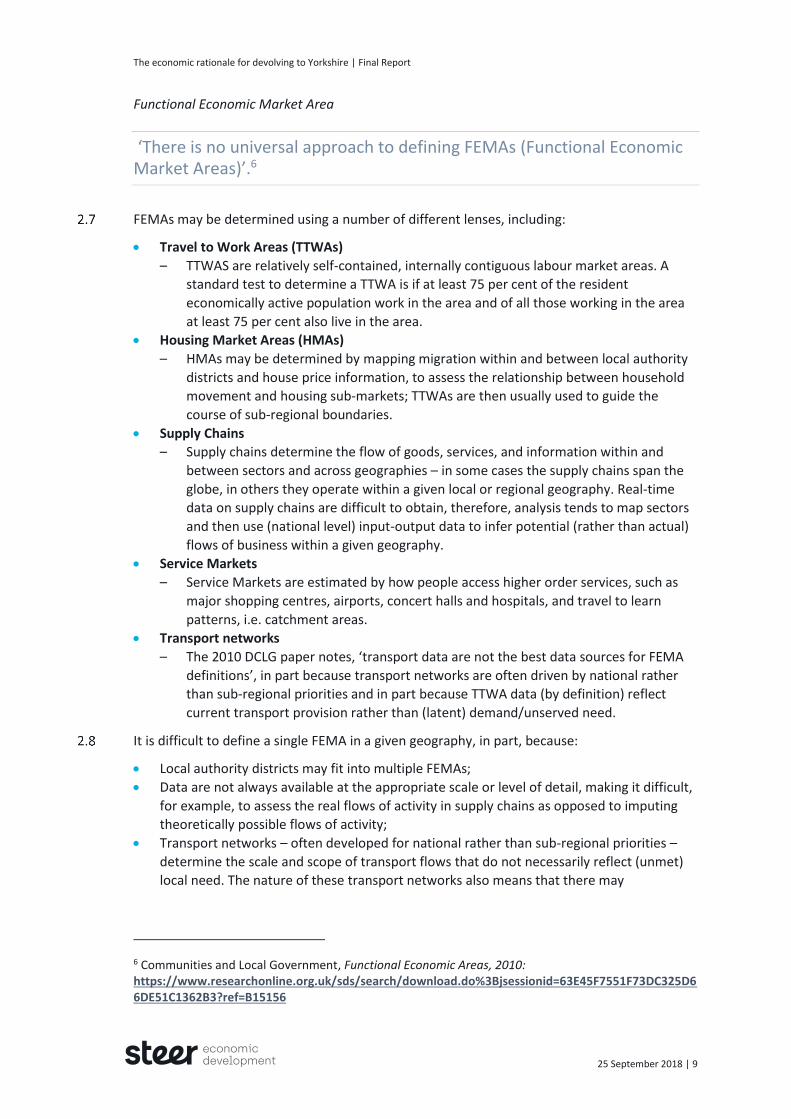
‘There is no universal approach to defining FEMAs (Functional Economic Market Areas)’.6
FEMAs may be determined using a number of different lenses, including:
Travel to Work Areas (TTWAs)
– TTWAS are relatively self-contained, internally contiguous labour market areas. A
standard test to determine a TTWA is if at least 75 per cent of the resident
economically active population work in the area and of all those working in the area
at least 75 per cent also live in the area.
Housing Market Areas (HMAs)
– HMAs may be determined by mapping migration within and between local authority
districts and house price information, to assess the relationship between household
movement and housing sub-markets; TTWAs are then usually used to guide the
course of sub-regional boundaries.
Supply Chains
– Supply chains determine the flow of goods, services, and information within and
between sectors and across geographies – in some cases the supply chains span the
globe, in others they operate within a given local or regional geography. Real-time
data on supply chains are difficult to obtain, therefore, analysis tends to map sectors
and then use (national level) input-output data to infer potential (rather than actual)
flows of business within a given geography.
Service Markets
– Service Markets are estimated by how people access higher order services, such as
major shopping centres, airports, concert halls and hospitals, and travel to learn
patterns, i.e. catchment areas.
Transport networks
– The 2010 DCLG paper notes, ‘transport data are not the best data sources for FEMA
definitions’, in part because transport networks are often driven by national rather
than sub-regional priorities and in part because TTWA data (by definition) reflect
current transport provision rather than (latent) demand/unserved need.
It is difficult to define a single FEMA in a given geography, in part, because:
Local authority districts may fit into multiple FEMAs;
Data are not always available at the appropriate scale or level of detail, making it difficult,
for example, to assess the real flows of activity in supply chains as opposed to imputing
theoretically possible flows of activity;
Transport networks – often developed for national rather than sub-regional priorities –
determine the scale and scope of transport flows that do not necessarily reflect (unmet)
local need. The nature of these transport networks also means that there may
6 Communities and Local Government, Functional Economic Areas, 2010: https://www.researchonline.org.uk/sds/search/download.do%3Bjsessionid=63E45F7551F73DC325D66DE51C1362B3?ref=B15156
The economic rationale for devolving to Yorkshire | Final Report
25 September 2018 | 10
simultaneously be strong links between two or more urban centres and only limited links
between their respective hinterlands.
Furthermore, as DCLG’s 2010 paper notes, strategies and services are developed and delivered
within Administrative Boundaries, it suggests a process of ‘best fitting’ FEMA boundaries to
local authority administrative areas as a pragmatic approach to fitting governance
arrangements to FEMAs.
Economically Coherent Area
The brief does not ask for an assessment of the study area as a FEMA, nor does it seek to
suggest that the sub-regions in the study area do not operate as FEMAs, rather it seeks to
determine the extent to which the study area, with its diversity and complexity, may be
considered an Economically Coherent Area (ECA), with a number of interlocking FEMAs, in the
same manner as Scotland or Wales.
As such, we devised the following tests to identify an ECA:
Are there shared sector specialisations within the study-area geography?
Are the shared specialisations in the study area of sufficient scale to establish economic,
efficient, and effective governance arrangements? In other words, are there potential
economies of scale for governance arrangements?
Is there sufficient economic diversity in the study area to offer economic resilience?
Is the diversity of sufficient scale to establish economic, efficient, and effective
governance arrangements? In other words, are there potential economies of scope for
governance arrangements?
Is the economic structure sufficiently different from that of the national economy to
warrant different policy priorities and development activities in the study areas? In other
words, does the operation of policy and strategy at national level lead to poor alignment
with the priorities and needs of the study area?
Are there significant barriers to the coordination of economic development activity at the
level of the study area to warrant devolved governance arrangements?
Research questions and methods
Table 2-3 lists the key research questions posed by the brief, the questions we asked in order
to test the rationale for devolving powers and budgets to the study-area geography, and the
approaches and sources we used to gather and analyse the evidence.
The economic rationale for devolving to Yorkshire | Final Report
25 September 2018 | 11
Table 2-3: Research questions and methods
Over-arching Research Question Economic Coherence Test Research methods and data sources
Is Yorkshire an economically coherent area in terms of its sectoral mix and its economic inter-relationships? – How do interlocking and
overlapping city and county regions operate and interact with each other?
Which are the study area’s key economic sectors, in terms of employment and productivity (Gross Value Added)?
To what extent are these key sectors shared across the study area?
To what extent do areas with a unique specialism/asset provide a strategically important function to other areas in Yorkshire?
How far are there travel interlinkages between different parts of Yorkshire?
How far is there business networking and operation and preferences that relate to the Yorkshire level?
Data analysis: Annual Business Survey, Employers Skills Survey, Higher Education Funding Council, Department for International Trade, HMRC data, Innovate UK, Annual Population Survey, and Index of Multiple Deprivation
Document review – including but not limited to, the Northern Powerhouse Independent Economic Review, LEP’s Strategic Economic Plans, emerging Local Industrial Strategies, and relevant Science and Innovation Audits
Business engagement
Is Yorkshire capable of maximising the opportunities and benefits of devolution for all its people and businesses?
Which are the key opportunities to support sustainable employment and wealth creation in Yorkshire? – To what extent are these growth opportunities
shared across Yorkshire? – To what extent are these growth opportunities
specific to a single geography?
Which are the key threats to sustainable employment and wealth creation in Yorkshire? – To what extent are these threats shared across
Yorkshire? – To what extent are these threats limited to a specific
geography? – How do these threats relate to the wider Northern
Powerhouse?
Data analysis and mapping, as above, plus econometric forecasts using the Regional Economic Model
Document review
Business engagement
The economic rationale for devolving to Yorkshire | Final Report
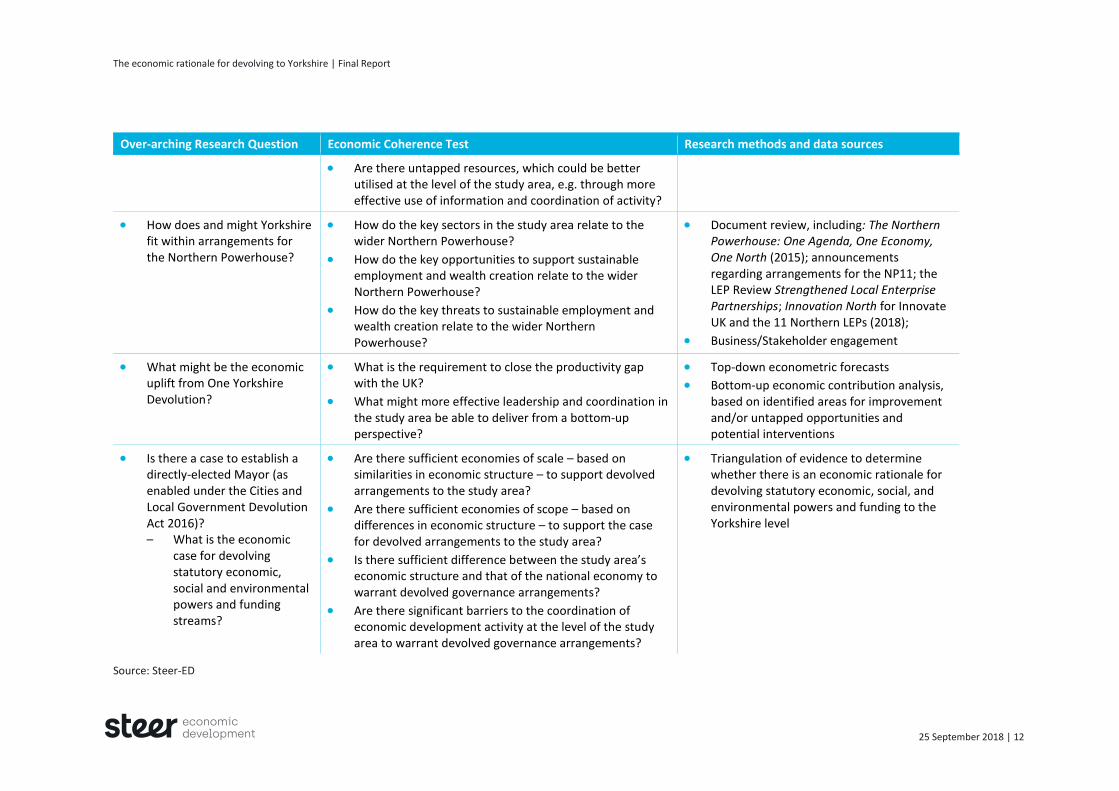
25 September 2018 | 12
Over-arching Research Question Economic Coherence Test Research methods and data sources
Are there untapped resources, which could be better utilised at the level of the study area, e.g. through more effective use of information and coordination of activity?
How does and might Yorkshire fit within arrangements for the Northern Powerhouse?
How do the key sectors in the study area relate to the wider Northern Powerhouse?
How do the key opportunities to support sustainable employment and wealth creation relate to the wider Northern Powerhouse?
How do the key threats to sustainable employment and wealth creation relate to the wider Northern Powerhouse?
Document review, including: The Northern Powerhouse: One Agenda, One Economy, One North (2015); announcements regarding arrangements for the NP11; the LEP Review Strengthened Local Enterprise Partnerships; Innovation North for Innovate UK and the 11 Northern LEPs (2018);
Business/Stakeholder engagement
What might be the economic uplift from One Yorkshire Devolution?
What is the requirement to close the productivity gap with the UK?
What might more effective leadership and coordination in the study area be able to deliver from a bottom-up perspective?
Top-down econometric forecasts
Bottom-up economic contribution analysis, based on identified areas for improvement and/or untapped opportunities and potential interventions
Is there a case to establish a directly-elected Mayor (as enabled under the Cities and Local Government Devolution Act 2016)? – What is the economic
case for devolving statutory economic, social and environmental powers and funding streams?
Are there sufficient economies of scale – based on similarities in economic structure – to support devolved arrangements to the study area?
Are there sufficient economies of scope – based on differences in economic structure – to support the case for devolved arrangements to the study area?
Is there sufficient difference between the study area’s economic structure and that of the national economy to warrant devolved governance arrangements?
Are there significant barriers to the coordination of economic development activity at the level of the study area to warrant devolved governance arrangements?
Triangulation of evidence to determine whether there is an economic rationale for devolving statutory economic, social, and environmental powers and funding to the Yorkshire level
Source: Steer-ED

The economic rationale for devolving to Yorkshire | Final Report
25 September 2018 | 13
Given the economic focus of the study, there are other avenues of research to be pursued in
assessing the case for devolution which are not pursued in this study – for example on the
advantages/disadvantages of Yorkshire-level devolution in other policy areas, such as health
and care, housing provision, service markets and catchment areas, flood prevention, green
infrastructure, and natural capital. Likewise, the study does not explore in detail the policy
priorities which may be pursued through devolved arrangements, e.g., policies to pursue
sustainable and inclusive growth.
Structure of this Report
The Report has the following sections:
Section 3: Review of Strategic Economic Plans – reports on the coherence/distinctiveness
of local economic strategies and plans in the region;
Section 4: Findings from business engagement – outlines views on devolution gathered
from discussions with representative business organisations and individual businesses;
Section 5: What role might Yorkshire ‘identity’ play? – provides an overview of evidence
on the current and potential role of Yorkshire identity in driving economic performance;
Section 6: Perspectives on the economy – discusses coherence/distinctiveness and
implications for devolution in terms of: (a) Key Sectors and Industries; (b) Business Base –
start-ups, survivals, and scaling; (c) Innovation and Ideas; International Trade and
Investment; (d) Skills and Ambition; and (e) Transport and Connectivity.
Section 7: Closing the productivity gap – discusses the outcome of ‘top-down’
econometric forecasts estimating the productivity gap with the UK, and bottom-up
estimates of additional GVA which may be anticipated as a result of more effective
leadership and coordination across Yorkshire, along with the additional resources and
powers associated with devolution.
Section 8: Conclusions – sets out our main conclusions, in relation to the research
questions and tests of economic coherence, and outlines areas for further study.

The economic rationale for devolving to Yorkshire | Final Report
25 September 2018 | 14
What do Strategic Economic Plans and emerging Local Industrial Strategies say about the Yorkshire economy?
We reviewed the most recent Strategic Economic Plans (SEPs) of each LEP/Combined
Authority as well as intelligence on preparatory work to develop Local Industrial Strategies, as
far as this was available, to:
Provide a strategic overview of each LEP area as a foundation for the study and to inform
our overall analysis of the extent to which Yorkshire is a connected economy;
Assess how far LEP areas have shared or complementary priorities, issues and
approaches, and in which policy areas; and
Provide a qualitative information source against which data-led analysis can be
triangulated.
The review used the following reports and information sources:
In the Humber: the 2014-2020 SEP, the July 2016 review of the SEP, the 2017 response to
the Industrial Strategy, and the June 2018 Blueprint for a Humber LIS;
In Leeds City Region: the 2016-2036 SEP and initial work on the Local Inclusive Industrial
Strategy (2018);
In Sheffield City Region: the 2015-2025 SEP and early work (2017) on the Local Inclusive
Industrial Strategy;
In York, North Yorkshire and East Riding: the 2014 SEP and the 2016 SEP Update
(supplemented by a meeting with LEP officers as part of this study); and
Collation of northern LEP Industrial Strategy Responses (2017) by WYCA.
The headlines from this review are summarised in Table 3-1. Appendix A provides a more
detailed analysis. It should be noted, that most SEPs made little or no explicit reference to the
Yorkshire level, but all of them show an openness to cross-border working on specific
issues/opportunities, and all refer to working at the level of the North. It should also be noted
that the YNYER SEP identified significant scope for working as Yorkshire, e.g., in relation to
international trade and investment, sector growth, and R&D.
3 Review of Strategic Economic Plans

The economic rationale for devolving to Yorkshire | Final Report
25 September 2018 | 15
Table 3-1: Review of Strategic Economic Plans and associated documents
Aspect reviewed Conclusions across the four LEP area SEPs/early LIS work
Overall Priorities The SEPs/emerging LIS priorities cover largely similar themes and objectives
The same three themes of business, skills and infrastructure are prominent in the SEPs of all four areas, while LIS work in all four areas focuses on business support/growth, skills (and employment), sectors, transport and productivity
Inclusive growth, innovation, trade and investment and energy are also picked up in multiple areas, although less often/less prominently
There are locally distinctive variations in visions and emphases (e.g. good/inclusive growth, Energy Estuary, a bigger private sector, the best place to grow a small business)
Energy and Environment/low carbon (potentially linked to bio-economy) and place-specific elements are prominent in some areas
This variety offers the scope to share lessons and develop complementary strategies
Key assets and Issues
Broadly similar challenges are identified in the majority of LEP areas: raising GVA, productivity and the size and strength of the business base; the need for more and better paid jobs; better broadband; and reducing flood risk were all noted by three or more LEPs
Other challenges noted by two or more LEPs include transport, housing, and low median incomes
Emerging LIS priorities are also often shared – at least three LEP areas each highlight: Deprivation/Inclusion; Innovation/R&D; productivity, skills and the impact of Brexit/business uncertainty
Key assets and strengths brought out in LEP areas tend to be more locally specific and distinctive – e.g. the Humber Estuary, research Centres of Excellence or major investments
There is potential to enhance the economic impact of strategic assets across a wider geography through better coordination of plans and investments
Sector priorities There is strong overlap between SEP priorities at a broad sector level, with Advanced Manufacturing, Energy and/or Low Carbon, and Food and Drink/Agri-food common to three LEP areas, and Creative/Digital (increasingly as an enabler) and Health and/or Care significant across areas
As is to be expected, specialisms within broad sectors vary more by LEP area
There are potential opportunities to support more rapid growth through collaboration and complementary specialisms and assets
There are a number of more localised and distinctive sectors/niches, e.g. visitor economy, financial services, chemicals, bio-economy
There is potential to develop complementary offers based on localised specialisms/niches

The economic rationale for devolving to Yorkshire | Final Report
25 September 2018 | 16
Aspect reviewed Conclusions across the four LEP area SEPs/early LIS work
Business growth, support and enterprise
There are similar models in all areas, with a Growth Hub or equivalent central function, plus a range of (similar) types of support for businesses
Activity to foster and/or support New Starts is identified in all four areas, as is Access to Finance and Innovation
Supply Chains, Exports and Investment are cited as priorities in three SEPs
Distinctive elements include a focus on connection to business support providers and on leadership and management in YNYER, and on resource efficiency in Leeds City Region
There are opportunities to exploit economies of scale and scope in the provision of enterprise and business support, e.g. access to finance, while ensuring local specialisms and requirements are served at the local level
Innovation Overall, innovation in initial SEPs was often less prominent than in other parts of the North, however, most or all LEPs now recognise this gap and are looking to strengthen Innovation
There are strong connections between innovation, business growth and priority sectors in all LEP areas
The importance of connections with local universities is noted in all LEP areas, if little reference to the Yorkshire Universities grouping which brings HE together and suggests appetite for joint working at a Yorkshire level
There may be opportunities to address information and coordination failures by developing complementarity offers and exploiting economies of scale in relation to innovation activity and use of innovation assets in key sectors – especially Advanced Manufacturing, Health/Care and Energy, plus potentially Food and Digital
Transport & connectivity
Transport and connectivity are prominent in all four SEPs
The need for improved Broadband/Digital provision is prominent in three SEPs; the absence of the issue in the fourth SEP is likely to be addressed in future LIS development
All SEPs include specific local transport schemes or mechanisms for them, for instance to connect people to jobs or provide access to sites
Three SEPs have an interest in High Speed Rail and its benefits
Airports are prominent in SCR, but SEPs treatment of this issue tend to have a local LEP-area focus, rather than a broader/strategic view
Sea Port content is only prominent in the Humber – which provides a national asset
All SEPs note transport schemes that cross LEP areas or Northern working
There is potential to make the most of economies of scope to join up LEP activity in relation to strategic assets which provide national and international connectivity to make better use of existing assets and identify and coordinate responses to needs and opportunities that arise at a larger scale than LEPs currently consider
Other Infrastructure
There is a good degree of similarity in the way SEPs address issues affecting housing and employment sites; the quality of places, energy and flood protection are specifically raised in in three SEPs

The economic rationale for devolving to Yorkshire | Final Report
25 September 2018 | 17
Aspect reviewed Conclusions across the four LEP area SEPs/early LIS work
Most Enterprise Zones and employment sites are local to one LEP area, but a good number are in dual LEP areas (e.g. in York, Selby, Barnsley)
Housing growth is important in all areas, and most areas also cite quality and affordability
Green infrastructure and/or environmental management is strong in two SEPs, linked to flood protection and cross-LEP catchments
While many infrastructure issues present as local concerns, common themes emerge across LEPs, suggesting both the possibility of more effective sharing of information on ‘what works’ and greater coordination in relation to procurement and commissioning
International trade & investment
Overall, LEPs have adopted a very similar approach in relation to the promotion of international trade and investment
It is mainly at the level of emphasis and subtleties of detail that SEPs vary, rather than the types of activity or ambitions set
There may be to opportunities to develop a collaborative approach as a means of generating economies of scale to generate greater impact, e.g., through increased utilisation of Yorkshire as a brand/identity
Skills & employment
Skills is an issue highlighted by all LEPs and there is much consistency in the areas to address and actions proposed
Core aspects include apprenticeships, employability, business skills needs (e.g. upskilling workforce, sector needs and skills shortages), and education-business links and related Careers Information, Advice and Guidance (IAG)
Issues noted in at least two areas, include, enterprise skills and the need to attract talent
One area has a strong focus on ‘ambition’
Three areas have a broadly similar skills profile
YNYER and its high skills levels stands out; it has distinctive points on ambition, talent, coastal employment) but also highlights the same issues as other LEP
LCR has a distinctive ‘more jobs, better jobs’ strand to its activity; the ‘inclusive growth’ focus in Sheffield City Region Local Industrial Strategy work covers similar issues
While many actions to address skills issues are best taken at the local level, the issues are common to all SEPs, furthermore, some LEP areas may be home to strategically significant provision that is not replicable in another LEP, which other LEPs need to ensure their residents can access
Culture & tourism
Culture, quality of place/life and tourism feature in most SEPs to some but not a great extent
The importance of culture to attracting and retaining skills and investment and expanding tourism is the driving rationale for activity
The issues figure most prominently in Humber and YNYER SEPs
Culture/place is becoming more prominent in strategy development; in 2017, Leeds City Region, with input from YNYER, undertook work related to the presentation of culture and quality of place at Yorkshire level

The economic rationale for devolving to Yorkshire | Final Report
25 September 2018 | 18
Aspect reviewed Conclusions across the four LEP area SEPs/early LIS work
The diversity of Yorkshire’s places and visitor destinations and attractions points to the opportunity to exploit economies of scope as well as scale
Other prominent themes
Each SEP has a at least one additional theme that is usually quite distinctive, and often linked to its overall Vision
In the Humber this is the Energy Estuary; in Leeds City Region it is Good Growth; in Sheffield City Region it is a Bigger, Stronger Private Sector; and in YNYER it is Rural/Coastal economy and Quality of Life
Social Inclusion and Environment/Low Carbon/Natural Capital also feature in some SEPs/LIS work as either core or a cross cutting themes
Distinctive SEP/LIS themes are sometimes focused on place-specific geography, and are usually complementary rather than conflicting

The economic rationale for devolving to Yorkshire | Final Report
25 September 2018 | 19
Conclusions and key messages
The key findings and implications from our review of SEPs are grouped in terms of:
Coherence relation to shared sectors;
Coherence in relation to economic priories/opportunities/threats; and
Relationship to pan-Northern working.
The Section ends with some general observations.
Coherence in relation to shared sectors
The following broad sectors are common to at least three of the four LEP areas:
– Advanced Manufacturing;
– Energy/Low Carbon; and
– Food and Drink/Agri-food.
Digital/Creative and Health and/or Care are significant across all areas with Creative and
Digital often cited as an enabler.
The Visitor Economy, Financial Services, Med-Tech, Chemicals, and the Bio-economy are
significant in one or two LEP areas.
Implications
There are potential economies of scale to be achieved in sector-based activity in Advanced
Manufacturing, Energy/Low Carbon, and Food and Drink/Agri-food.
There is potential to develop complementary ‘offers’, based on localised sector
specialisms/niches, to build economic resilience, strengthen cluster and supply-chain
development, and exploit potential economies of scope.
Coherence in relation to priorities/opportunities/threats
Priorities which are covered in every LEP area’s SEP/LIS work (based on their
understanding of the opportunities and threats that their areas face) are:
– Business support/growth;
– Skills (and employment);
– Sectors;
– Infrastructure/Transport/Connectivity; and
– Productivity.
Other priorities cited by two or three LEP areas in their SEPs/LIS work include:
– Inclusive/good growth;
– Providing the environment to support small business/private sector growth;
– Innovation;
– Trade and investment; and
– Energy.
Implications
There is potential to identify shared opportunities and threats, e.g., in terms of AI,
automation, develop common responses for sectors that are common among LEP areas
and local responses for localised specialist/niches sectors;
There is also potential for areas which have undertaken more research, e.g., in relation to
innovation, to share their learning to raise awareness among other LEPs.
The economic rationale for devolving to Yorkshire | Final Report
25 September 2018 | 20
Relationship to pan-Northern working
The Northern Powerhouse Independent Economic Review (2016)7 identified four Prime
Capabilities where the North was world class (Advanced Manufacturing and Materials;
Energy; Health Innovation; and Digital) and three ‘Enabling Capabilities’ (Financial and
Professional Services, Logistics, and Education), with Quality Life identified as a cross-
cutting enabling asset. Our review highlights Advanced Manufacturing and Energy as
significant at the level of Yorkshire, along with Health (not just Health Innovation) and
Digital/Creative.
Implications
Where arrangements for developing a sector, or tackling an issue, or seizing an
opportunity already exist, the added value of establishing parallel Yorkshire-level
arrangements needs to be tested to ensure it reduces rather than increases the
transaction costs of pan-Northern working where that is taking place or is likely to (e.g.
around transport).
Overall observations
Yorkshire is a coherent and interconnected economic area, if one that also has a number
of interlocking and overlapping functional economies and distinctive places within it.
The SEPs in Yorkshire have similarities in terms of the issues they address and approaches
adopted. There are opportunities for, and potential advantages in, joining up activities
across localities on higher level functions, as well as functions where the importance of
local proximity or distinctive needs supports more localised approaches.
There are good opportunities to present complementary offers at the Yorkshire level
which take advantage of shared strengths and distinctive assets.
7 https://www.transportforthenorth.com/wp-content/uploads/Northern-Powerhouse-Independent-Economic-Review-Executive-Summary.pdf

The economic rationale for devolving to Yorkshire | Final Report
25 September 2018 | 21
Approach and Consultees
The business perspective on devolution at the Yorkshire level is important for a number of
reasons, and specifically because it will help to identify:
Whether businesses – as the key players in and drivers of the economy – see Yorkshire as
a genuine, relevant and connected economy;
Businesses’ views on and preferences for devolution;
The reasons for these preferences; and
Potential advantages and disadvantages for business of Yorkshire-level devolution.
This study used a targeted consultation exercise to gain business perspectives, based on
interviews with business representative organisations across all areas of Yorkshire, as well as a
number of individual businesses nominated by business groups (chambers of commerce) and
LEP contacts. This approach fitted with the study’s needs and operational constraints and put
onus on representative organisations – who are best able to present a balanced and informed
view which takes into account views elicited through networks, member discussions and
business surveys.
Representatives from the following organisations were consulted, either as representative
groups or Chamber/LEP nominees, through individual interviews or a focus group:
Confederation of British Industry (Yorkshire and Humber);
Federation of Small Businesses (Yorkshire, the Humber and North East England);
EEF (Yorkshire and Humber);
NFU (North East region);
Yorkshire Universities;
Bradford Chamber of Commerce/Christeyns;
West and North Yorkshire Chamber of Commerce;
Doncaster Chamber of Commerce;
Leeds Chamber of Commerce/Shulmans;
Humber LEP;
Addleshaw Goddard;
WGN;
Leeds Civic Trust;
Carmel Harrison PR;
Make it York;
Harworth Group;
Associated British Ports (ABP).
4 Findings from business engagement

The economic rationale for devolving to Yorkshire | Final Report
25 September 2018 | 22
The discussions were semi-structured but focused on two questions:
How far, if at all, is the Yorkshire level relevant to and preferred by a business audience?
(compared to or in addition to other geographies)
What, if any, business or economic advantages would there be from devolution at this
level and how could these be maximised?
Additionally, two surveys of Chamber of Commerce members in different areas were
discovered through the consultation:
A survey of 847 member-businesses by West and North Yorkshire Chamber of Commerce;
and
A survey of 147 member-businesses by Doncaster Chamber of Commerce.
Here we set out the main points emerging in the interviews, backed by survey results where
relevant.
Results
Overall support for the principle of greater devolution
There was strong support for devolution per se. Every interviewee who expressed an opinion
was in support of moving more resources and powers from Whitehall toward a more local
level, regardless of their geographic preferences for devolution. There was a strong sentiment
that Yorkshire and areas within it were “being left behind” by not having a devolution deal and
that “we just need to get on with it”.
These pro-devolution views were echoed in survey results. West and North Yorkshire
Chamber’s survey showed 76% in favour of devolution (versus 12% against) and Doncaster
Chamber’s survey revealed 85% support (versus 12% against).
Geographic devolution preferences – Yorkshire or another level?
There were mixed views on whether Yorkshire was the best geography for devolution. The
option had a number of strong advocates, and of the devolution options available, it was the
most favoured overall amongst those who expressed a view. However, some businesses
preferred other options or were uncertain about the optimum level, and some were clear that
the geography was crucial in determining their position. For example, a large business
expressed the desire to ensure that leadership and governance in the Humber was not split in
two. It should be noted that because there is a range of views among business, the
representative organisations we consulted tended to say they would work with whichever
geography/geographies were eventually agreed.
The two Chamber surveys present a similar picture to the interviews, i.e., views are mixed, but
with Yorkshire level devolution the most common preference. In the Doncaster Chamber
survey, 52% said that working only for a Yorkshire devolution deal was their first preference
(of four options) compared to 19% who’s first preference was to focus only on securing
Sheffield City Region (SCR) level devolution. The remainder favoured SCR devolution as a
stepping stone to Yorkshire-level devolution (as did one of the businesses consulted) or no
devolution deal at all (11%). In the West and North Yorkshire survey, 51% of businesses
surveyed in West Yorkshire favoured Yorkshire-level devolution, compared to 30% who
preferred the West Yorkshire level and 19% who preferred a Leeds City Region settlement. In
North Yorkshire, 60% preferred Yorkshire-level devolution, with 19% favouring a YNYER level
deal and 17% opting for North Yorkshire level.
The economic rationale for devolving to Yorkshire | Final Report
25 September 2018 | 23
The other key factor that emerged across many of the business interviews was pragmatism.
For a good number of businesses and their representative organisation, the overriding priority
is to get devolution of any sort – and quickly – first, with the details of geography to follow.
These would generally prefer Yorkshire level if it was achievable and did not involve additional
delay, but would accept devolution on a different basis if it provided certainty and would be
achieved quicker.
Rationale, business benefits, and functions favoured for the Yorkshire Level
The reasons why businesses sought Yorkshire-level devolution often involved a combination of
overall benefits, gaining powers and functions in specific policy areas, rationales as to why the
Yorkshire level made sense, as well as, for some, a cultural affiliation to Yorkshire. The main
points were based around Yorkshire-level arrangements offering:
Strong leadership – it was suggested that a larger geographic footprint/electorate would
attract high-quality candidates to be mayor, with high-calibre leadership further
enhancing the area’s profile, influence, economy and ability to get things done.
A single voice, clear priorities and a large scale that heightens influence and impact –
this line of argument emerged repeatedly, with businesses:
– Supportive of the role of a Yorkshire mayor in agreeing common priorities that
partners could unite behind;
– Expectant that this would lead to more influence, more strategic prioritisation and
the ability to pool resources to deliver large scale investments.
A chance to build on Yorkshire identity/branding and its advantages for international
business – the consensus view was that, driven by the work of Welcome to Yorkshire, the
Yorkshire brand is now a powerful asset which “symbolises confidence, credibility and
getting things done”, as well as high quality of place. While this has so far been
concentrated on tourism and events, consultees stressed its wider business value,
especially in terms of attracting inward investment and growing exports. This was seen as
especially important in a post Brexit-era when growing wider export markets will be
crucial. The Yorkshire brand was also seen as more valuable to the food and drink and
tourism sectors than city-regional or LEP area brands.
More effective arrangements for transport – many of the businesses favouring Yorkshire-
level devolution saw improved transport arrangements as one of its advantages. The
reasons for this included the ability to deliver better ticketing arrangements that would
allow Oyster Card-type solutions and smoother fares structures to avoid price spikes at
sub-regional boundaries – thereby enhancing the efficiency of labour markets and
generating agglomeration benefits. Others suggested it would enable better rail services
and rolling stock and allow road and public transport investments to be focused on the
most important schemes, with less sharing out of the spoils between areas.
Improvements in skills and education provision – a number of businesses felt that key
skills and education challenges – and many of the solutions to them – were common to
many parts of Yorkshire and could be more effectively and efficiently addressed at this
level. However, others noted the localised nature of much education provision. While
others with an eye to the ongoing development of the apprenticeship offer suggested
there may be benefits in identifying unmet need in one area and seek to match it to
specialist provision in another area, e.g. specialist textile or food/catering training.
More efficient and effective coordination and access to business support – Yorkshire-
level devolution was seen as likely to be more cost-effective and lead to better
coordination of business support than was available through (currently four) separate LEP
The economic rationale for devolving to Yorkshire | Final Report
25 September 2018 | 24
structures, which at times involve duplication. For example, large businesses with multiple
sites in different LEP areas have to engage with more than one governance structure.
Furthermore, high-level/specialised business support was cited as an example, where a
larger geographic scale (and budget) would facilitate better quality and more specialised
business support than a single LEP area could not sustain, e.g., in fields such as leadership
and management development, exports, innovation, and access to finance.
Capitalising on complementary assets across Yorkshire – Examples were given of assets
in different parts of Yorkshire which are not fully capitalised upon by businesses outside
the immediate area, but which could present a powerful complementary offer – for
example the Humber Ports, Doncaster-Sheffield airport, Leeds City Centre and the AMRC
in Sheffield/Rotherham. Others stressed how the Yorkshire level could bring together
urban, rural and coastal assets to present a rounded offer and support business
opportunity and quality of life.
Potential to ensure a level playing fled for supplementary business rates – it was noted
that devolution of the power to raise a supplementary business rate would avoid the risk
of different business rates operating in neighbouring local authority areas in Yorkshire.
Reasons for not supporting Yorkshire level devolution
A number of reasons, which would need to be mitigated in any Yorkshire-wide devolution,
were given either for favouring devolution on a different geography or being uncertain about
the appropriateness of Yorkshire-level devolution. The main ones were:
Too many (public sector) layers – some consultees felt that the combination of a
Yorkshire level, a LEP level, plus local government structures would be confusing to
business and could increase rather than reduce bureaucracy and trigger further
restructuring.
Lack of a well-defined role – some businesses felt that there were too few clear functions
that would work best at Yorkshire level to warrant devolution. For example, some
consultees argued that transport could be covered between local and Northern levels
without a Yorkshire one too.
Pooled budgets favouring big ticket investments and reducing local provision – some
consultees feared that pooled budgets at the Yorkshire level, e.g. on transport, may lead
to a concentration of resources on bigger projects, and as a result reduce investment in
their local area and its needs
Which geography? Some consultees expressed strong views on the geography to be
covered, with particular concern expressed as to the economic risks associated with
splitting governance arrangements covering the Humber.
Potential risk that the value of other brands won’t be maximised – while Yorkshire level
activity was seen to potentially add value through offering a high level, umbrella brand, a
case was made that local places/destinations were crucial to the visitor economy and that
arrangements should reflect this. Similarly, should devolved arrangements cover the
Humber, it was argued that the value of the Lincolnshire brand to some markets should
not be lost.
Sticking with the Sheffield City Region Deal and a step-by-step approach – one consultee
saw advantages in Yorkshire as the best level for devolution in the long term, but felt that
it was better to first follow through on the SCR deal, and to take the ‘bird in the hand’
option first.
Potential to produce an uneven playing field with neighbouring economies if devolution
results in a Yorkshire-wide supplementary business rate.

The economic rationale for devolving to Yorkshire | Final Report
25 September 2018 | 25
Conclusions and key messages
Findings from business engagement point to the following:
There is strong business support for the principle of the devolution of powers and
budgets from central government to more local arrangements – provided this does not
lead to an increase in bureaucracy;
There are a range of views as to the most appropriate level for devolved arrangements –
with evidence indicating on balance majority support for devolution to the Yorkshire level,
provided concerns in relation to arrangements ensuring localised needs will still be met;
While many consultees were agnostic with regard to the geography of devolved
arrangements – with most business organisations consulted indicating that they would
work with whichever geography was agreed – consultees in the Humber LEP expressed
concern that any devolved arrangements should not split leadership and governance in
the Humber; and
Some consultees suggested a step-by-step approach to devolution – accepting local deals
where available building to Yorkshire level arrangements.
Overall observations
There is strong business support for devolution. Within the context of some mixed views
about how that can best be achieved and an onus on pragmatism and pace, the Yorkshire level
emerges as the most strongly supported first preference geography for devolution. Reasons
for this include advantages around leadership, prioritisation, brand and international business,
as well as issues including transport and labour markets.

The economic rationale for devolving to Yorkshire | Final Report
25 September 2018 | 26
The study explored the extent to which the Yorkshire identity/brand may be relevant to the
geography of devolution, for example in relation to economic coherence and benefits. In this
respect, it assessed how far the Yorkshire identity is salient in the region and any values or
perceptions that go with it; how far Yorkshire identity is used by and provides benefits to
business; and whether there are any wider of specific areas where the brand provides benefits
and/or opportunities.
Yorkshire identity and Values
The most statistically robust and recent evidence on county identity came through the ‘The
English Question’ survey of 20,000 people commissioned by the BBC, conducted by YouGov,
and reported in June 2018. As part of a wider survey on national identity it asked questions
about the extent to which people felt ‘allegiance’ to their county. The results showed that
three quarters of people in Yorkshire did, the highest for any English County. This does not
necessarily imply an economic value, but it does point to the Yorkshire identity being salient,
which may have implications for the levels of public and business support for leadership and
governance structures at the Yorkshire level.
The same survey also explored which attributes or values were associated with which county
identities. In Yorkshire’s case, these were described as “straight-talking, plain-speaking, hard-
working, friendly and supportive…the Yorkshire identity is rich with values of resilience and
community.” These perceptions point to brand values that potentially could be capitalised on
in a business context and which may influence trading or locational decisions, for example by a
potential inward investor looking to locate near a suitable workforce.
It is difficult to identify a notional economic value for the ‘Yorkshire Identity’ or ‘Yorkshire
Values’, just as it is difficult to place a monetary value on Britishness. It is also difficult to
identify how far these attributes are distinct from those of the North in general, or towns and
cities or LEP areas in Yorkshire. Nevertheless, the evidence suggests Yorkshire has a particular
and definable identity, which underpins its coherence as an entity, and which may be a
business and economic asset.
Businesses and the Yorkshire Brand
A survey by Premier Business Care8 looked at how frequently a county name formed part of
business names across the UK. It found that ‘entrepreneurs registered in Yorkshire cite their
county more than any other region in the UK, with 5,313 companies including ‘Yorkshire’
8 http://www.londonlovesbusiness.com/business-news/britains-bizarre-business-naming-habits/19870.article
5 What role might Yorkshire ‘identity’ play?
The economic rationale for devolving to Yorkshire | Final Report
25 September 2018 | 27
within their company name’. Comparison of how this compares to use of city, district or sub-
regional brands was not undertaken, but as with the BBC survey of county-based identity
across the population, the findings suggests that there is something about Yorkshire identity
that people and businesses connect with, are proud of, and is more pronounced than in other
English counties. It is beyond the remit of this study to quantify the economic return that the
use of Yorkshire branding may yield. Some businesses may well use the brand simply because
they like it, whereas others may realise a value from it in attracting or retaining customers,
based on the perceptions or affiliations that go with it. An article in Your BusinessVoice in
2017 supports this by setting out five Yorkshire values that are good for business: ‘straight
talking, down to earth, proud, friendly and sensible with money’.9
Wider use and benefit from the Yorkshire Brand
The highest-profile use of Yorkshire branding in recent years has been through Welcome to
Yorkshire and its work on tourism, profile raising and major events. The organisation’s five-
year strategy for how it would grow the Yorkshire brand (2012-2017) sought to ‘take the
Yorkshire brand to a new level, way beyond tourism’ and to develop a strong international
profile, leading to a step-change in inward investment and giving the County ‘the strength it
needs to punch well above its weight in an increasingly competitive global marketplace’. This
points to the intent to gain value from Yorkshire branding in supporting international business.
It is not easy to quantify the scale of this potential benefit or to assess its realisation and
causality with precision or certainty, however, there is some evidence of economic value from
use of the Yorkshire brand by Welcome to Yorkshire:
Sizeable increases in tourism, with a 14% increase (approx. £1 billion) in the value of
tourism and its supply chain to the County’s economy between 2011 and 2016;10
The hosting of major events such as the Tour de France and Tour de Yorkshire, which have
been broadcast to an international audience;
Resulting press and PR activity for Yorkshire which has been valued at £124 million, much
of it featuring local businesses and what they have to offer; and
A major rise in foreign direct investment jobs of 56% between 2015/16 and 2017/18
compared to falls of 12% in England (excluding London) and of 28% in London.
It is not possible to quantify how far these results are due to the projection of Yorkshire as an
entity and a brand, as opposed to other factors, but there is a certain logic whereby a higher
and more positive profile for Yorkshire has made it a more attractive destination to visitors
and businesses, which could in turn be expected to lead to greater tourism and inward
investment, and higher GVA than would otherwise be the case. This triangulates with
messages from the business consultation exercise, whereby many Yorkshire businesses appear
to value a positive Yorkshire-wide brand as an asset in international trade. It also
demonstrates the potential value of pooling resources to achieve a greater impact more
efficiently through a single voice/operation.
Beyond the activities of Welcome to Yorkshire, a number of other sectors and organisations
make explicit use of Yorkshire branding to further their economic objectives, including:
9 http://www.yourbusinessvoice.co.uk/5-yorkshire-values-that-are-good-for-business/
10 https://industry.yorkshire.com/about/our-achievements

The economic rationale for devolving to Yorkshire | Final Report
25 September 2018 | 28
Screen Yorkshire – which champions the film, TV, games and digital industries in Yorkshire
and the Humber and runs the £15m, ERDF-supported Yorkshire Content Fund. The scale
and identity of the region are integral to its activity and success.
Deliciously Yorkshire – promotes Yorkshire Food and Drink, and uses the region in its
branding to build profile and appeal to customers in a way that would be hard to envisage
with for example, LEP-area based brands.
Culture, sport and creative industries – where work by Leeds City Region in 2017 (with
the engagement of the YNYER LEP) highlighted the economic value of sport and culture,
and the benefits of mapping and presenting a complementary offer of assets across
Yorkshire.
Whilst it is not possible to be precise and definitive about the monetary or economic value of
the Yorkshire brand, taken in the round, the evidence in this section supports the arguments
that:
Yorkshire is widely recognised as a coherent economic entity;
The Yorkshire level can bring advantages of scale and critical mass that allow pooling of
resources and more ambitious activity than would otherwise be possible; and
The Yorkshire brand can have traction at national and international level among diverse
audiences, including tourists and investors.
Conclusions and key messages
Our review of evidence on the potential role of Yorkshire identity suggests:
The Yorkshire identity is well recognised inside and outside Yorkshire – which suggests a
strong degree of coherence and identification at the level of individuals, communities, and
businesses;
The Yorkshire brand is considered a significant asset by business, both in terms of local
and national markets and in international/outward-focused activities, such as
international trade and investment, and in sectors such as tourism, food and cultural
industries where place-based characteristics are important – which suggest the potential
to develop further the positive effects of the Yorkshire brand in growing Yorkshire’s
profile and activity in international markets.

The economic rationale for devolving to Yorkshire | Final Report
25 September 2018 | 29
We reviewed data from a range of sources and a number of different perspectives to test two
things:
The degree of economic coherence in the three geographic groupings; and
The extent to which there are distinct characteristics at the level of Yorkshire which might
warrant devolution of powers and budgets from the national level to promote economic
development in Yorkshire.
In seeking to establish the degree of coherence in the three geographies, we focus on data
related to the degree of shared sector and industry specialisation. We also interrogated these
data to identify economic diversity, and the extent to which some industries were specific to
one or two districts, thereby suggesting that a pan-Yorkshire approach might be sub-optimal.11
We then looked at LEP-level data on R&D and innovation, which is related to industrial
structure.
In seeking to establish the degree of Yorkshire’s distinctiveness from the national economy,
and therefore, the potential need for devolved leadership and governance to tackle particular
issues at the level of Yorkshire we reviewed data on entrepreneurial activity, international
trade and investment, and skills – key drivers of economic growth, which are likely to require
intervention, if Yorkshire is to raise its rate of productivity and level of earnings.12
The chapter concludes with a discussion of transport and connectivity issues – a major concern
highlighted by business that requires reflection on qualitative as well as quantitative data.
11 We did this in part because we believe that the main test of economic coherence at a pan-Yorkshire
level is the extent to which there are shared economic specialisms in the geography – in line with the
lessons learnt from the Northern Powerhouse Independent Economic Review. We acknowledge that
our analysis would benefit from further, more detailed studies, particularly in relation to value/supply
chains, but we believe that it provides a sufficient level of analysis to determine if there is a degree of
coherence at the pan-Yorkshire level. We should, however, also acknowledge the role that data
limitations play in our analysis. For example, some data, such as that on international trade and R&D
expenditure, are only available at the level of Yorkshire and Humber, and therefore while they can be
used to establish whether and how the Yorkshire economy is distinctive from the national economy,
they cannot be used directly to test economic coherence within Yorkshire. Further analyses to map
industrial structure and to estimate likely shares of exports or R&D spend would provide an additional
level of granularity to the analysis.
12 Our assessments are at a high level. Further research is required to identify the most significant factors driving performance in these policy domains, and the extent of local variation in Yorkshire.
6 Perspectives on the economy

The economic rationale for devolving to Yorkshire | Final Report
25 September 2018 | 30
Economic coherence and sector specialisation
How we identify key sectors
It has become increasingly common to assess patterns of industrial specialisation using a
metric known as a ‘location quotient’ (LQ). This measure calculates the ratio of a particular
industry’s activity (e.g. employment, gross value added or any other relevant data) in a region
over that region’s share of total activity. Thus, a ratio above 1.0 tells us that the region is
relatively specialised in a given industry, and a ratio below 1.0 that it is not. The higher the
ratio above 1.0 the greater the degree of industrial specialisation.
These patterns of industrial specialisation have important implications for inter-region and
intra-regional variations in employment and workforce participation, productivity, imports and
exports and region-specific rates of economic growth.
The first part of the following analysis considers patterns of industrial specialisation based on
employment LQs. The analysis then moves on to consider specialisation in both employment
and GVA. This is followed by a more detailed assessment of Yorkshire and Humberside’s
distribution of employment at the detailed industry (3-digit SIC) and individual Local Authority
level.
Testing for economic coherence on the basis of Employment Location Quotients
We calculated employment LQ coefficients for three groups identified in Table 2-1 together
with each relevant Council area using 2016 ONS data. We also calculated a limited set of
‘comparator’ employment LQs at the 3-digit SIC level for London, Scotland, and Wales which
have significant devolved powers, and the West Midlands, which is an English region of a
similar scale to Yorkshire with a mayor. The main focus here is to consider LQ profiles from the
perspective of cohesion in Yorkshire and Humber.
Figure 6-1 contains an overview of the correlations between employment LQs at the 2-digit SIC
level. To re-cap on interpreting this metric, a correlation coefficient of 1.0 indicates a perfect
match (industrial specialisation patterns are identical) and lower coefficients indicate
proportionally lower alignment (i.e. increasingly different patterns of industrial specialisation
between the regions being compared).13 The results are colour coded to ease interpretation
(green for higher correlations through yellow and then to red weaker or negative
correlations). The data clearly show that the three Groups exhibit similar patterns of industrial
specialisation with each other but are different from their comparators. For example, the West
Midlands has correlations with the three Groups ranging from 0.153 to 0.281, with the
strongest of these correlations being with Group 3 (Yorkshire & Humber (including N & NE
Lincolnshire) – the broadest selection of districts.
Our analysis of Employment LQ data suggest a degree of coherence within the geography and
an economic distinctiveness from the comparator geographies – suggesting a prima facie case
for Yorkshire-specific arrangements.
13 Negative correlation coefficients tell us the patterns of industrial specialisation are inversely related, i.e. one jurisdictions relative strengths are another’s relative weaknesses.
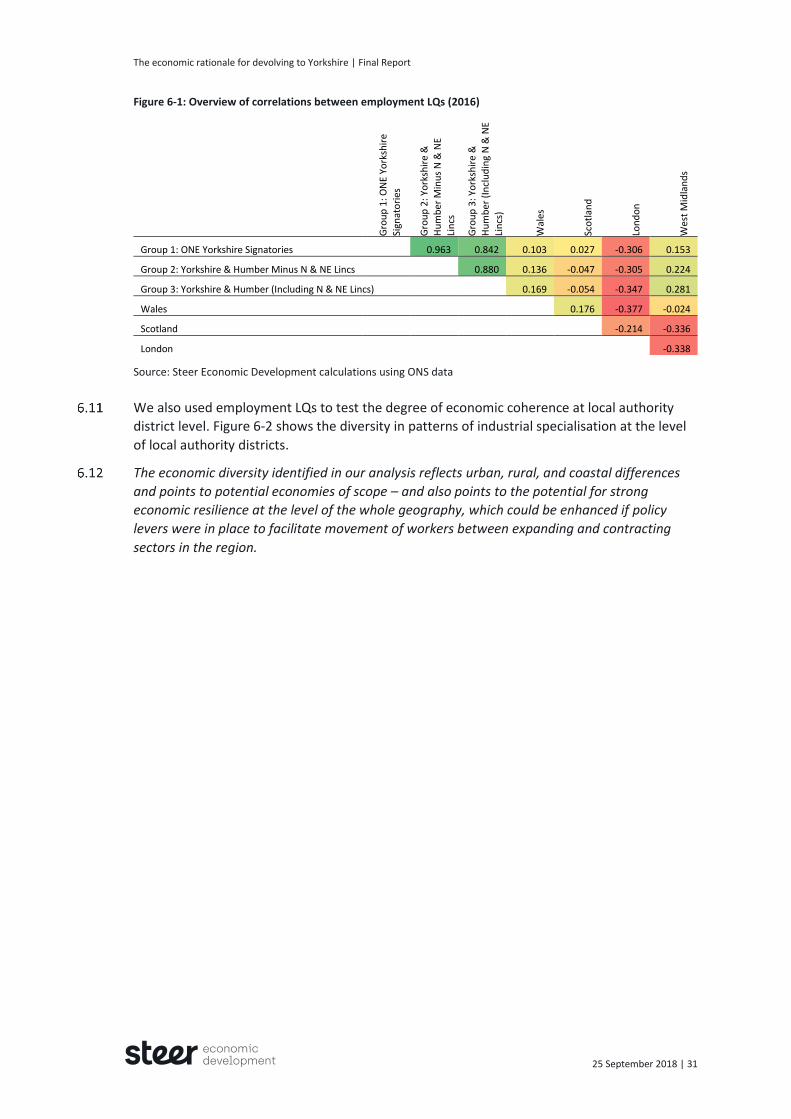
The economic rationale for devolving to Yorkshire | Final Report
25 September 2018 | 31
Figure 6-1: Overview of correlations between employment LQs (2016)
Gro
up
1: O
NE
York
shir
e
Sign
ato
ries
Gro
up
2: Y
ork
shir
e &
H
um
ber
Min
us
N &
NE
Lin
cs
Gro
up
3: Y
ork
shir
e &
H
um
ber
(In
clu
din
g N
& N
E
Lin
cs)
Wal
es
Sco
tlan
d
Lon
do
n
Wes
t M
idla
nd
s
Group 1: ONE Yorkshire Signatories 0.963 0.842 0.103 0.027 -0.306 0.153
Group 2: Yorkshire & Humber Minus N & NE Lincs 0.880 0.136 -0.047 -0.305 0.224
Group 3: Yorkshire & Humber (Including N & NE Lincs) 0.169 -0.054 -0.347 0.281
Wales 0.176 -0.377 -0.024
Scotland -0.214 -0.336
London -0.338
Source: Steer Economic Development calculations using ONS data
We also used employment LQs to test the degree of economic coherence at local authority
district level. Figure 6-2 shows the diversity in patterns of industrial specialisation at the level
of local authority districts.
The economic diversity identified in our analysis reflects urban, rural, and coastal differences
and points to potential economies of scope – and also points to the potential for strong
economic resilience at the level of the whole geography, which could be enhanced if policy
levers were in place to facilitate movement of workers between expanding and contracting
sectors in the region.
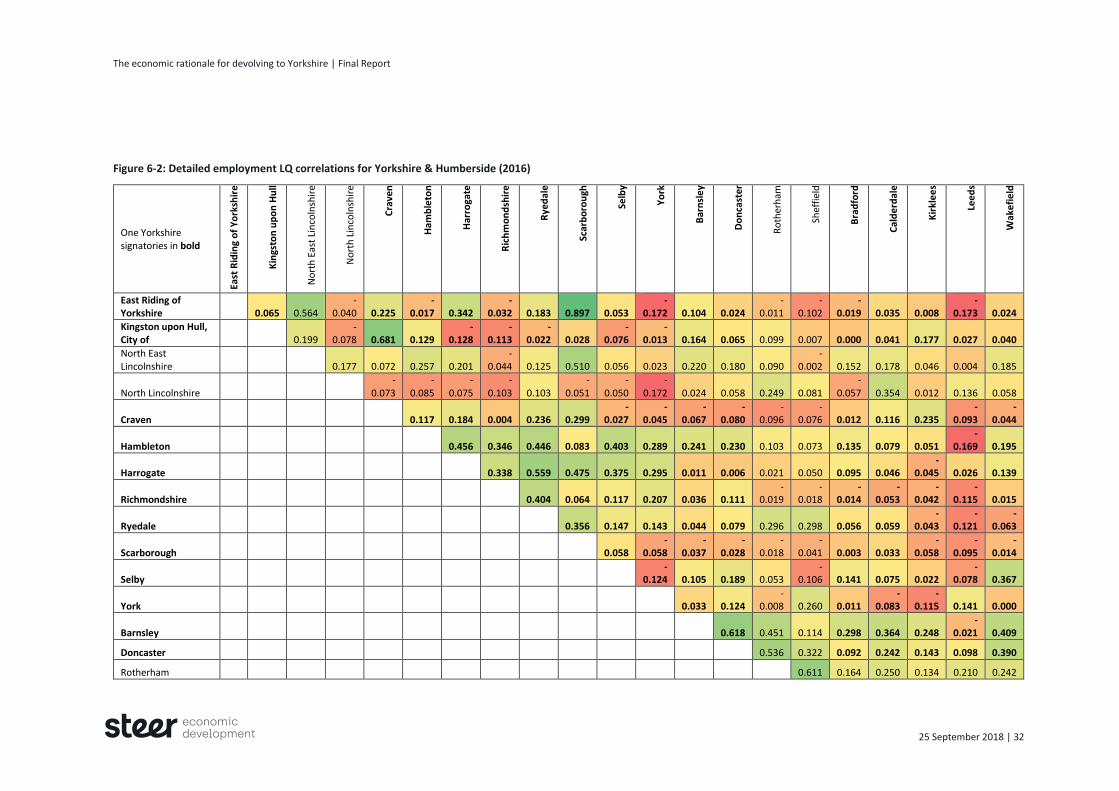
The economic rationale for devolving to Yorkshire | Final Report
25 September 2018 | 32
Figure 6-2: Detailed employment LQ correlations for Yorkshire & Humberside (2016)
One Yorkshire signatories in bold
East
Rid
ing
of
Yo
rksh
ire
Kin
gsto
n u
po
n H
ull
No
rth
Eas
t Li
nco
lnsh
ire
No
rth
Lin
coln
shir
e
Cra
ven
Ham
ble
ton
Har
roga
te
Ric
hm
on
dsh
ire
Rye
dal
e
Scar
bo
rou
gh
Selb
y
Yo
rk
Bar
nsl
ey
Do
nca
ster
Ro
ther
ham
Shef
fiel
d
Bra
dfo
rd
Cal
de
rdal
e
Kir
kle
es
Lee
ds
Wak
efi
eld
East Riding of Yorkshire 0.065 0.564
-0.040 0.225
-0.017 0.342
-0.032 0.183 0.897 0.053
-0.172 0.104 0.024
-0.011
-0.102
-0.019 0.035 0.008
-0.173 0.024
Kingston upon Hull, City of 0.199
-0.078 0.681 0.129
-0.128
-0.113
-0.022 0.028
-0.076
-0.013 0.164 0.065 0.099 0.007 0.000 0.041 0.177 0.027 0.040
North East Lincolnshire 0.177 0.072 0.257 0.201
-0.044 0.125 0.510 0.056 0.023 0.220 0.180 0.090
-0.002 0.152 0.178 0.046 0.004 0.185
North Lincolnshire
-0.073
-0.085
-0.075
-0.103 0.103
-0.051
-0.050
-0.172 0.024 0.058 0.249 0.081
-0.057 0.354 0.012 0.136 0.058
Craven 0.117 0.184 0.004 0.236 0.299 -
0.027 -
0.045 -
0.067 -
0.080 -
0.096 -
0.076 0.012 0.116 0.235 -
0.093 -
0.044
Hambleton 0.456 0.346 0.446 0.083 0.403 0.289 0.241 0.230 0.103 0.073 0.135 0.079 0.051 -
0.169 0.195
Harrogate 0.338 0.559 0.475 0.375 0.295 0.011 0.006 0.021 0.050 0.095 0.046 -
0.045 0.026 0.139
Richmondshire 0.404 0.064 0.117 0.207 0.036 0.111 -
0.019 -
0.018 -
0.014 -
0.053 -
0.042 -
0.115 0.015
Ryedale 0.356 0.147 0.143 0.044 0.079 0.296 0.298 0.056 0.059 -
0.043 -
0.121 -
0.063
Scarborough 0.058 -
0.058 -
0.037 -
0.028 -
0.018 -
0.041 0.003 0.033 -
0.058 -
0.095 -
0.014
Selby
-0.124 0.105 0.189 0.053
-0.106 0.141 0.075 0.022
-0.078 0.367
York 0.033 0.124 -
0.008 0.260 0.011 -
0.083 -
0.115 0.141 0.000
Barnsley 0.618 0.451 0.114 0.298 0.364 0.248 -
0.021 0.409
Doncaster 0.536 0.322 0.092 0.242 0.143 0.098 0.390
Rotherham 0.611 0.164 0.250 0.134 0.210 0.242
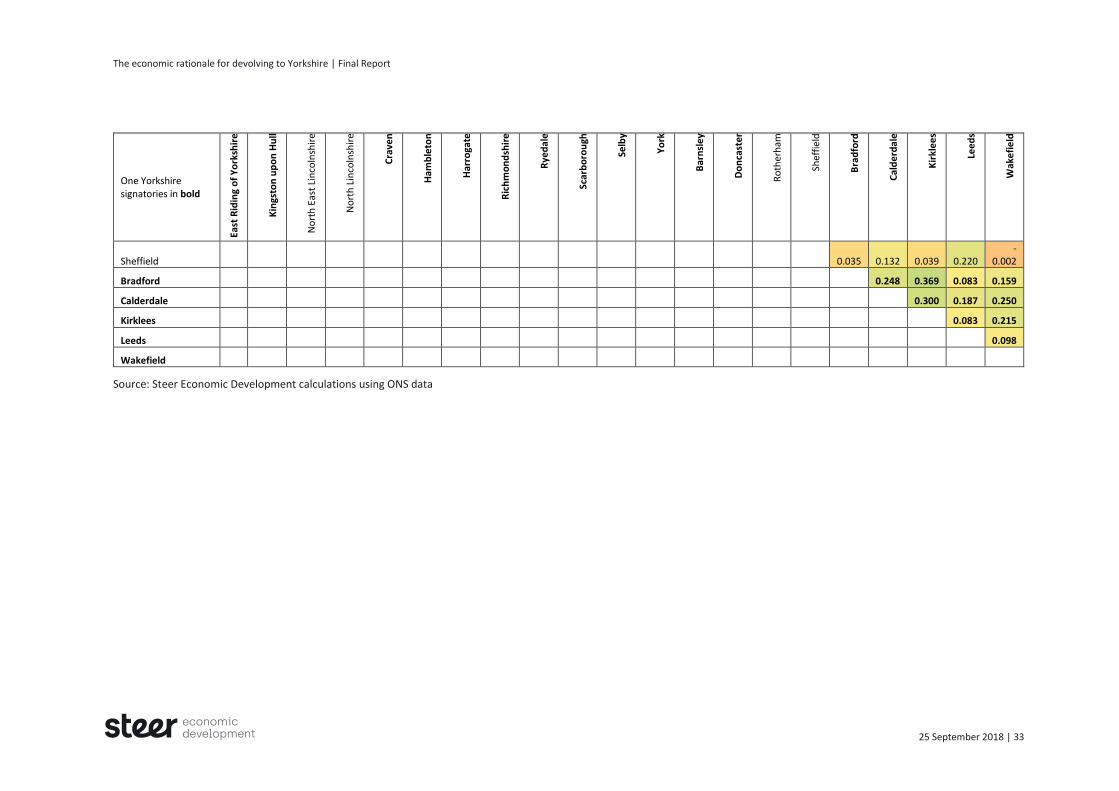
The economic rationale for devolving to Yorkshire | Final Report
25 September 2018 | 33
One Yorkshire signatories in bold
East
Rid
ing
of
Yo
rksh
ire
Kin
gsto
n u
po
n H
ull
No
rth
Eas
t Li
nco
lnsh
ire
No
rth
Lin
coln
shir
e
Cra
ven
Ham
ble
ton
Har
roga
te
Ric
hm
on
dsh
ire
Rye
dal
e
Scar
bo
rou
gh
Selb
y
Yo
rk
Bar
nsl
ey
Do
nca
ster
Ro
ther
ham
Shef
fiel
d
Bra
dfo
rd
Cal
de
rdal
e
Kir
kle
es
Lee
ds
Wak
efi
eld
Sheffield 0.035 0.132 0.039 0.220 -
0.002
Bradford 0.248 0.369 0.083 0.159
Calderdale 0.300 0.187 0.250
Kirklees 0.083 0.215
Leeds 0.098
Wakefield
Source: Steer Economic Development calculations using ONS data

The economic rationale for devolving to Yorkshire | Final Report
25 September 2018 | 34
A clearer analysis of the overall complexity at the level of the region can be found in Figure
6-3. This graph ranks the industrial specialisation pattern correlations (based on employment
LQs) between each Council and the One Yorkshire signatory Councils combined. The green
bars identify the One Yorkshire signatories Councils and the red bars those that have not
signed up to One Yorkshire. This graph tells us that North East Lincolnshire has the most
closely aligned industrial structure to the combined profile of One Yorkshire signatories (on
the basis of the employment LQ measure).14
It should be noted that in terms of establishing economic coherence, Sheffield and North
Lincolnshire exhibit particularly low degrees of alignment in terms of industrial specialisation –
therefore arguments for their inclusion in devolved arrangements need to relate to economies
of scope, the provision of support to diversify their economies (if so desired), and/or the
strategic importance of their specialisms to the wider geography.
Figure 6-3: Ranked employment LQ correlation coefficients for Yorkshire and Humber Councils (2016)
Source: Steer Economic Development calculations using ONS data
Adding GVA Location Quotients to the analysis
The ONS data for GVA published at the Local Authority level is far less granular than the
employment data. Whereas the latter is published at the 2-digit SIC level, GVA data are only
published at the 1 digit SIC level (i.e. for the manufacturing sector as a whole, not its
14 York has a very low employment LQ correlation with the One Yorkshire signatory Councils combined due to an unusual relationship between York’s employment LQ and GVA LQ profile. When measured in GVA LQ terms, and at the much higher level of sectoral groupings required for GVA LQs, York is far more closely aligned to the One Yorkshire signatory Councils combined. York’s distinctiveness in this LQ context results from labour productivity-related factors related to place-based industrial specialisms that may warrant further investigation.
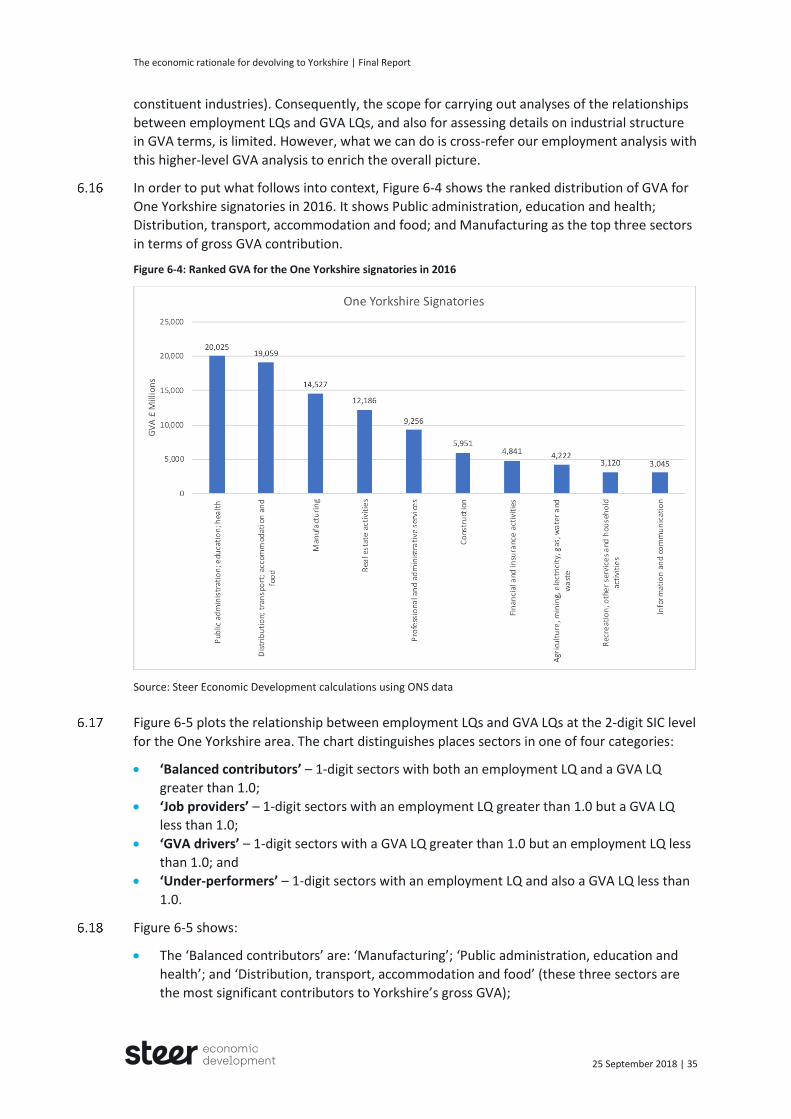
The economic rationale for devolving to Yorkshire | Final Report
25 September 2018 | 35
constituent industries). Consequently, the scope for carrying out analyses of the relationships
between employment LQs and GVA LQs, and also for assessing details on industrial structure
in GVA terms, is limited. However, what we can do is cross-refer our employment analysis with
this higher-level GVA analysis to enrich the overall picture.
In order to put what follows into context, Figure 6-4 shows the ranked distribution of GVA for
One Yorkshire signatories in 2016. It shows Public administration, education and health;
Distribution, transport, accommodation and food; and Manufacturing as the top three sectors
in terms of gross GVA contribution.
Figure 6-4: Ranked GVA for the One Yorkshire signatories in 2016
Source: Steer Economic Development calculations using ONS data
Figure 6-5 plots the relationship between employment LQs and GVA LQs at the 2-digit SIC level
for the One Yorkshire area. The chart distinguishes places sectors in one of four categories:
‘Balanced contributors’ – 1-digit sectors with both an employment LQ and a GVA LQ
greater than 1.0;
‘Job providers’ – 1-digit sectors with an employment LQ greater than 1.0 but a GVA LQ
less than 1.0;
‘GVA drivers’ – 1-digit sectors with a GVA LQ greater than 1.0 but an employment LQ less
than 1.0; and
‘Under-performers’ – 1-digit sectors with an employment LQ and also a GVA LQ less than
1.0.
Figure 6-5 shows:
The ‘Balanced contributors’ are: ‘Manufacturing’; ‘Public administration, education and
health’; and ‘Distribution, transport, accommodation and food’ (these three sectors are
the most significant contributors to Yorkshire’s gross GVA);

The economic rationale for devolving to Yorkshire | Final Report
25 September 2018 | 36
The only ‘GVA driver’ is ‘Agriculture, mining, electricity, gas, water and waste’;
The only ‘Job provider’ is the ‘Construction’ sector – and this is very close to an LQ of 1;
and
The ‘Under-performers’ include: ‘Information and communications’, ‘Professional and
administrative services’, ‘Financial and Insurance activities’, ‘Recreation, other services
and household activities’ and ‘Real Estate Services’.
In terms of the four non-signatories to One Yorkshire, the addition of North and North East
Lincolnshire, moves ‘Agriculture, mining, electricity, gas, water and waste’ to the ‘Balanced
Contributor’ category.
Figure 6-5: The relationship between employment LQ and GVA LQ for One Yorkshire signatories, 2016
Source: Steer Economic Development calculations using ONS data
The challenge for policymakers is to ensure that strategies and programmes help maintain the
leadership position in terms of sectors which are Balanced contributors. The One Yorkshire
geography has relatively low LQs in employment and GVA for the ‘Information and
communication’, ‘Professional and administrative services’, and Financial and Insurance
activities’. As these sectors are vital elements to the wider economic development ecosystem,
the challenge for policy makers is to identify ways to develop these sectors as strategic assets
for the region.
So which sectors are significant at the level of Yorkshire and Humber?
Given the limitations of GVA data at a Local Authority level, we carried out a detailed analysis
of Yorkshire and Humberside’s employment profiles to identify those industries with a
significant and pervasive employment impact across all Local Authorities in the region
(Appendix B). To strike a balance between significance and relevance, we identified all the
sectors where employment reached 2,500 employees or more in a given local authority district
and then sought to identify which sectors met this threshold in three or more local authority

The economic rationale for devolving to Yorkshire | Final Report
25 September 2018 | 37
districts as a test of whether it could be judged a local or a pan-Yorkshire concern. Twenty-five
industries meet these criteria.
At the level of Yorkshire and Humber three (3-digit SIC) manufacturing industries met the
threshold criteria: ‘Manufacture of food products’; ‘Manufacture of fabricated metal products,
except machinery and equipment’; and ‘Manufacture of machinery and equipment’. At the
level of the 18 One Yorkshire signatories, the only manufacturing industry which meets the
criteria is the ‘Manufacture of food products’.15
This analysis seems to suggest limited scope for pan-Yorkshire – as opposed to local or LEP-
level – activity in the majority of manufacturing industries; except if the industries are
strategically important as suppliers to other industries in Yorkshire, or where the challenges to
be addressed are common across industries, such as, promotion of STEM skills, management
and leadership development, and adoption of innovation, for example, digital technologies.
The analysis also raises the question as to the extent to which the ‘right’ balance is being
struck between manufacturing and services in Yorkshire and Humber and, if this is an issue of
concern, whether it is best addressed at the level of Yorkshire, as opposed to the LEP level.
On the other hand, our analysis highlights the importance of the service sector to the One
Yorkshire region. Industries which provide significant employment in many districts include:
Specialised construction activities;
Wholesale and retail trade and repair of motor vehicles and motorcycles;
Wholesale trade, except of motor vehicles and motorcycles;
Retail trade, except of motor vehicles and motorcycles;
Land transport and transport via pipelines;
Warehousing and support activities for transportation;
Food and beverage service activities;
Employment activities;
Public administration and defence; compulsory social security;
Education;
Human health activities;
Residential care activities; and
Social work activities without accommodation.
A point to note: Sheffield’s inclusion would add the following to the list of significant
industries: Construction of buildings, Activities auxiliary to financial services and insurance
activities, Legal and accounting activities, service to building and landscape activities, Sports
activities and amusement. The other three districts would not extend the list of industries.
Many of the industries identified as significant to many areas are not unique to Yorkshire and
Humber, but the question is, does the Yorkshire and Humber level offer economies of scale to
address the drivers of change in these industries, without incurring significant diseconomies of
scale?
What does this mean for devolution to Yorkshire?
The main points arising from this analysis are:
15 This approach maps current strengths and locations, it does not capture opportunities for sectors to grow in terms of either their geographic coverage or employment potential.

The economic rationale for devolving to Yorkshire | Final Report
25 September 2018 | 38
Employment LQ data suggest a degree of coherence within the geography and an
economic distinctiveness from the comparator geographies – suggesting a prima facie
case for Yorkshire-specific arrangements.
However, given the locally-specific nature of manufacturing industries, in order to add
value, pan-Yorkshire activity on manufacturing would need to:
– Address common challenges across the manufacturing sector, e.g., promotion of
STEM skills, management and leadership development, and adoption of innovation
rather than individual industries, which tend to be localised
– Provide strategic leadership in favour of manufacturing as part of a wider effort to re-
balance the economy.
The economic diversity identified in our analysis reflects urban, rural, and coastal
differences and points to potential economies of scope – and also points to the potential
for strong economic resilience at the level of the whole geography, which could be
enhanced if policy levers were in place to facilitate movement of workers between
expanding and contracting sectors in the region.
Sheffield and North Lincolnshire exhibit low degrees of alignment in terms of industrial
specialisation – therefore arguments for their inclusion in devolved arrangements need to
relate to economies of scope, the provision of support for diversification of their
economies, and/or the strategic importance of their specialisms to the wider geography.
The One Yorkshire geography has:
– Only one sector, ‘Distribution, transport, accommodation and food’, with high LQs in
employment and GVA.
The challenge for policymakers is to ensure that strategies and programmes help
maintain this leadership position.
– Low LQs in employment and GVA for the Information and communication sector, and
relatively low LQs for ‘Professional and administrative services’.
As these sectors are vital elements to the wider economic development
ecosystem, the challenge for policy makers is to identify ways to develop these
sectors as strategic assets for the region.
– Relatively strong GVA specialisation in Manufacturing; Agriculture, mining, electricity,
gas, water and waste; and Public administration, education and health.
The challenge for policy makers is can employment in these sectors be grown
without reducing productivity?
What further research is required?
Further research is required to identify:
Supply-chain linkages – both within the region and with national and global supply chains;
The role of strategic assets and/or sectors serving the whole of Yorkshire from one or two
locations; and
Sector/industry gaps, where leadership at the level of Yorkshire might add value to efforts
to re-balance the economy in terms of sectors as well as economic geography.
R&D, Innovation, and Ideas
In this section, we review data on R&D spending (which is only available at the full regional
level – i.e. Group 3) and data on patents (provided by the IPO at LEP-level). We do this to
provide a high-level snapshot of the region’s performance relative to the UK, in order to
determine if Yorkshire faces distinctive issues in relation to closing the productivity gap
through innovation. Before reviewing these data, however, we provide a brief explanation of

The economic rationale for devolving to Yorkshire | Final Report
25 September 2018 | 39
what we mean by innovation and what makes for effective innovation processes. We conclude
the section with a discussion on the need for pan-Yorkshire activity on innovation to focus on
facilitating connected innovation – both within Yorkshire and between Yorkshire and the wider
world.
What is Innovation?
There are different definitions of innovation and there are different lenses through which
innovation activity and processes may be viewed, calibrated and assessed. For the purposes of
this exercise, we draw on work that we recently completed for Innovate UK and the 11
Northern Powerhouse LEPs, which used the following definition of innovation:
Innovation is . . . the successful exploitation of new ideas, recognising that:
– Innovation need not derive from an advance in science or technology . . . but radical
innovation often does;
– Innovation that does derive from an advance in the science and technology base
needs more than this to achieve (commercial) success;
– Innovation applies equally to product, process, service, and business models; and
– Innovation is appropriate . . . and needed . . . equally in the private, public and
community/voluntary sectors.
What makes for effective innovation?
In the report, Innovation North we argued that effective innovation in places is always
connected to innovation in other places. Figure 6-6, illustrates this process of ‘connected
innovation’. It shows how innovation capability and capacity in LEP areas is lubricated by
knowledge spillovers within and between places, sectors, businesses and research institutions
and connectivity to Global Innovation Networks (often driven by university networks) and
participation in Global Value/Supply Chains (often driven by behaviours of large Tier 1
companies). In the report, we highlighted four different types of ‘innovation ecosystem’,
which support, enable and promote innovation within and between sectors and places:
‘Pragmatic’ & ‘Organised’ Ecosystems
– Networks/governance arrangements with internal and external connectivity, such as
the Northern Health Science Alliance, which has developed connectivity in the North,
via Academic Health Science Networks and between the North and the outside world,
trade missions etc.
Supporting Ecosystems
– Places/facilities with innovation skills, knowledge and expertise, and places with
clusters of enabling services, for example, legal expertise in relation to IP, and finance
and investment.
International ‘Portals’
– Places/companies from which to access Global Supply Chains.
Emergent Ecosystems
– Technologies and markets with the potential for greater connectivity.

The economic rationale for devolving to Yorkshire | Final Report
25 September 2018 | 40
Figure 6-6: Conceptualising innovation connectivity in and across places
Source: Source: Steer Economic Development, 2018
What do the data say about Yorkshire and Humber’s investment in R&D?
Table 6-1 provides a summary of data on R&D expenditure in Yorkshire and Humber against a
number of key metrics:
Total expenditure in R&D per person employed covers total public and private sector
spending on R&D relative to the number of employees, on this indicator businesses and
public sector employers in Yorkshire and Humber invests 48% less per worker than the UK
average, and lags the West Midlands and London by a similar figure. It is also lags
Scotland;
Business R&D Expenditure per person employed measures just private sector spending on
R&D, on this indicator Yorkshire and Humber businesses invest around 58% less per
employee than the national average and lags all the comparators except Wales; and
Business R&D expenditure per person employed in R&D allows a comparison of spending
based only on those working in R&D. This indicator shows investment per employee
working in R&D in Yorkshire is 29% below the national average – a smaller difference than
for the other metrics, but on this indicator, Yorkshire lags all the comparator regions,
including Wales.
These data look at the inputs into R&D in Yorkshire and Humber, rather than the outputs and
outcomes which flow from it, but at a headline level, it would appear that the Yorkshire and
Humber region is at a distinct disadvantage with regard to investment in R&D. Limiting not
only ideas generation and adoption but the local economic impact of R&D spending. While this
problem is not unique in the North, pan-Yorkshire arrangements or pan-Yorkshire
arrangements as part of a pan-Northern approach to driving investment in R&D could make a
difference in this area.

The economic rationale for devolving to Yorkshire | Final Report
25 September 2018 | 41
Table 6-1: Headline data on R&D expenditure, 2016
Indicator Yorkshire & Humber
GB/UK Wales Scotland West Midlands London
Total R&D Expenditure (£ per person employed)
564
1075
519
920
1071
1087
Business R&D Expenditure (£ per person employed)
302
721
315
423
887
509
Business R&D Expenditure (£ per person employed in R&D)
75000
105,829
87,000
89,333
121,211
114,800
Source: BERD

The economic rationale for devolving to Yorkshire | Final Report
25 September 2018 | 42
What do the data say about R&D output in Yorkshire and Humber?
Data on patent applications provides one (imperfect but readily available and easily
identifiable) indicator of innovation foci at a regional level. An analysis of UK patent
applications therefore helps to draw-out how similar (or different) the various parts of
Yorkshire and Humber are in this respect. The data presented here are based on UK patent
data organised by LEP rather than Local Authority District. Whilst it is possible to provide a
more granular profile this is both more complex and costly to do, and also increases the
severity of the limitations of geo-located patent data (mainly because larger firms are active in
many locations, while the patent application just uses one of these addresses).
Overall, significant patenting activity is concentrated in the Leeds and Sheffield City regions.
This is highlighted in Table 6-2, which presents data on patent applications by LEP and
technology field, but filters out average rates of patenting below 10 per year. The technology
fields have been developed to provide an indication of industry sector, hence such data can be
used to understand the industrial emphasis in regional patenting activity.
The areas of emphasis in patenting activity that stand out are in Civil engineering; Electrical
machinery, apparatus and energy; Furniture & games; Handling; Mechanical elements;
Medical technology; and Other consumer goods.
Table 6-2: Yorkshire & Humberside LEP UK patenting application activity above 10 patents per annum, 2005-2017
Humber Leeds City Region
Sheffield City Region
York, North Yorkshire and East Riding
Analysis of biological materials
Audio-visual technology 127
Basic communication processes
Basic materials chemistry
Biotechnology
Chemical engineering 162
Civil engineering 832 269
Computer technology 157
Control 134
Digital communication
Electrical machinery, apparatus, energy 216 193
Engines, pumps, turbines 276
Environmental technology
Food chemistry
Furniture, games 359 213
Handling 414
IT methods for management
Machine tools 139 122
Macromolecular chemistry, polymers
Materials, metallurgy
Measurement 167 133
Mechanical elements 237 327

The economic rationale for devolving to Yorkshire | Final Report
25 September 2018 | 43
Humber Leeds City Region
Sheffield City Region
York, North Yorkshire and East Riding
Medical technology 372 147
Micro-structural and nano-technology
Optics
Organic fine chemistry
Other consumer goods 295 140
Other special machines 193 139
Pharmaceuticals 122
Semiconductors
Surface technology, coating
Telecommunications 140
Textile and paper machines
Thermal processes and apparatus 146
Transport 232
Source: Steer-ED analysis of IPO data, 2018
Table 6-3 provides the correlation coefficients between the four LEPs – this gives a better
sense of how closely aligned patenting profiles are within Yorkshire and Humberside (note
these correlations are based on all rather than filtered patenting above 10 per year on
average). It shows relatively close correlation between Humber and Leeds and Leeds and
Sheffield LEP areas, but weak correlation between Humber and Sheffield LEP areas, and
between Humber and York, North Yorkshire and East Riding LEP areas; with a moderate
correlation between Leeds and York, North Yorkshire and East Riding LEP areas.
Table 6-3: Correlations between patent application profiles, 2005-2017
Humber Leeds City Region
Sheffield City Region
York, North Yorkshire and East Riding
Humber
Leeds City Region 0.77
Sheffield City Region 0.54 0.74
York, North Yorkshire and East Riding 0.58 0.65 0.73
Source: SDG-ED analysis of IPO data, 2018
Overall, the average correlation between the patent profiles of these four LEPs (at 0.67) is the
same as that between all English LEPs (0.66). This tells us that the within geography cohesion
in patenting emphases is no different from that of England as a whole – which is itself fairly
cohesive. For England as a whole, most LEPs have similar patenting profiles except for Greater
Cambridge and Greater Peterborough, Thames Valley Berkshire and Coventry and
The economic rationale for devolving to Yorkshire | Final Report
25 September 2018 | 44
Warwickshire, which have more distinctive emphases resulting from their industrial and
scientific specialisms.16
What does this mean for devolution to Yorkshire?
Headline data at the level of Yorkshire and Humber indicate significant under-investment in
R&D, the short-term and straightforward implications of this situation are that the region is
missing out on the local economic impact of R&D spending; but the long-term consequences
are more significant, in that because the region is not punching its weight in terms of R&D and
innovation activity it is not well-placed to reap the rewards of innovation and its firms are not
well-placed to adopt innovations and maintain their competitiveness in national and
international markets.
In developing interventions to promote innovation in and/or at the level of Yorkshire. Partners
need to be aware of these wider networks and identify to what extent:
Existing contributions from partners in Yorkshire to wider (e.g. pan-Northern networks)
may be boosted;
There are specific locations within Yorkshire which could acts strategic assets to support
innovation across the geography or alternative locations to which businesses in Yorkshire
need support to access in a timely and economic fashion;
Multi-national businesses may act as entry points for firms to join global supply chains
that will help to drive innovation; and
Yorkshire has emergent ecosystems which require early-stage support.
What further study is required?
Further research is required to unpack the drivers of under-investment in R&D in Yorkshire
and Humber (e.g., industrial structure, nature of the research base, relative to the research
priorities of funders and investors, and access to risk capital) to inform the development of
interventions and to determine their form and scale.
Headline data on GVA and earnings
Is Yorkshire different from the UK average in terms of GVA and earnings?
Table 6-4 shows that GVA per worker in each of the three geographic configurations is well
behind the national average. It also shows that average weekly earnings in each of the three
geographies is around 10 percentage points below the national average, and behind the
comparators.
What does this mean for devolution to Yorkshire?
The headline data on GVA per employee, per head, and earnings suggest that Yorkshire needs
to address relatively low productivity and earnings, if it and the Northern Powerhouse as a
whole is to narrow the productivity gap with the UK.
What further research is required?
Further research is required to analyse:
16 See Connected Innovation Strategies. Report prepared for the Smart Specialisation Hub by SDG Economic Development, 2018.

The economic rationale for devolving to Yorkshire | Final Report
25 September 2018 | 45
How the factors that the drive individuals’ and household earnings (and income) operate
in Yorkshire; and
The distribution of earnings (and income) in the region
To:
To determine the extent to which the factors are national, regional, sub-regional, local or
at the level of the individual/household
Identify which, if any, interventions need to be established and where Yorkshire-level
leadership and coordination would add value to existing arrangements.

The economic rationale for devolving to Yorkshire | Final Report
25 September 2018 | 46
Table 6-4: Headline data on GVA and average weekly earnings
Indicator Group One: One
Yorkshire
Signatories
Group Two Group
Three/Y&H
GB/UK Wales Scotland West Midlands London
Total GVA £m
89,253
£m
105,215
£m
112,195
£m
1,729,092
£m
59,586
£m
134,038
£m
126,591
£m
408,478
GVA per employee (£) £
45,764
£
45,058
£
45,200
£
56,124
£
43,200
£
52,927
£
48,732
£
90,642
GVA per head £
20,959
£
20,647
£
20,678
£
26,339
£
19,140
£
24,800
£
21,823
£
46,482
Average Weekly
Earnings (£) residents
£
500.4
£
501.3
£
500.3
£
550.4
£
505.9
£
547.7
£
517.4
£
654.6
Average Weekly
Earnings (£)
workplace
£
494.6
£
495.9
£
494.2
£
550.4
£
498.4
£
547.3
£
514.9
£
692.5
Source: Yorkshire & Humber Regional Economic Model

The economic rationale for devolving to Yorkshire | Final Report
25 September 2018 | 47
International Trade and Investment
Current Position – Exports
Official statistics collate export data for goods at the Yorkshire and Humber level. Data for the
region, as well as for Scotland, Wales and West Midlands comparators are presented in Table
6-5.
Table 6-5: UK, Yorkshire and Humber and comparator Exports 2015-2017
Exports Value (£m)
Area % of UK
population17
2015 2016 2017 % of UK
exports
% change
2015-17
UK 100% 275,414 290,999 328,296 100% 19.2%
Y&H 8.3% 14,582 14,756 16,820 5.1% 15.3%
Scotland 8.2% 23,863 24,184 28681 8.7% 20.2%
Wales 4.7% 13,253 14630 16485 5.0% 24.4%
West Midlands 8.8% 26,400 29733 33455 10.2% 26.7%
Source: https://www.uktradeinfo.com/Statistics/RTS/Pages/default.aspx
Yorkshire and Humber exports have been growing sharply since 2015, buoyed by the reduced
value of the pound since the Brexit vote. However, the region’s export growth has been slower
than the UK average and our comparator areas, and crucially, export levels are considerably
below what would be expected based on Yorkshire and Humber’s percentage of the UK
population. Moreover, despite an economy that has a greater proportion of manufacturing
than many other UK regions, Yorkshire and Humber has by far the lowest proportion of UK
exports as a proportion of population of any UK region – the next lowest is 74% (in the South
West).
Scotland, Wales and the West Midlands, each have a share of exports that is higher than their
share of UK population (106%, 106% and 115% respectively). Yorkshire and Humber’s exports,
on the other hand, are currently only 62% of the level that they would be (£27,249 million), if
its export share matched its share of the UK population – a shortfall of over £10 billion pa.
Thus, comparative statistics on export activity by UK region and population share suggest that,
despite a recent uplift in its export performance, Yorkshire and Humber is not achieving its full
potential.
Current position – Inward Investment
For inward investment (foreign direct investment), the available statistics18 are only available
at the Yorkshire and Humber level, with the most recent data shown in Table 6-6.
17 https://www.ons.gov.uk/peoplepopulationandcommunity/populationandmigration/populationestimates/bulletins/annualmidyearpopulationestimates/mid2017
18 https://www.gov.uk/government/statistics/department-for-international-trade-inward-investment-results-2017-to-2018

The economic rationale for devolving to Yorkshire | Final Report
25 September 2018 | 48
Table 6-6: Foreign Direct Investment data for Yorkshire and Humber and comparator areas
Area % of UK population19 FDI Jobs 2017 % of UK
FDI jobs
UK* 100% 60,939
Y&H 8.3% 4,623 7.6%
Scotland 8.2% 4,148 6.8%
Wales 4.7% 3,107 5.1%
West Midlands 8.8% 9,424 15.5%
(*UK figure is total FDI jobs attributed to specific UK nations and English Region in the data tables)
Following recent improvements in its performance in FDI (compared to falls elsewhere), in
2017 the number of FDI jobs created in Yorkshire and Humber was above that of most English
regions (except London, the West Midlands and the North East). The 4,623 jobs created in
Yorkshire and Humber was 92% of what the region would have gained based on its share of
the UK population, and if the impact of London (which gained nearly 30% of all UK FDI jobs in
2017) is excluded from the analysis, Yorkshire and Humber’s performance would be more than
a proportionate share of FDI jobs.
A case could be made that a higher profile for the region may have contributed to recent good
performance – although the ‘lumpiness’ of FDI data (which can vary sharply year to year)
means that it is difficult to draw firm conclusions in this regard.
Thus, while Yorkshire and Humber’s performance in attracting jobs from FDI is relatively
strong, particularly given recent uncertainties associated with Brexit and a proliferation of
trade restrictions in a number of major international markets, its share of employment related
to FDI does not match its population share and is only 50% of the yield achieved by the West
Midlands. Hence there is scope to improve Yorkshire and Humber’s performance in attracting
FDI.
What does this mean for devolution to Yorkshire?
As exports and investment statistics are not broken down by LEP area, it is not possible to
pinpoint how far exports and trade performance is similar or otherwise across different areas
of Yorkshire. However, our review of SEPs/LISs shows that export performance is certainly an
area of interest across multiple LEP areas: exports and inward investment are prominent
within the SEPs and emerging LIS work in the Humber, Leeds City Region and Sheffield City
Region as strands of activity to support business growth and productivity, and in YNYER export
potential and internationalisation is covered in relation to the Agri-food and Bio-economy
sectors and as part of business support. Based on this, it is clear that all LEP areas have a
shared interest in improving performance in these areas, and hence a basis for potential
collaboration at Yorkshire level.
The main current provision to support businesses in relation to international trade and
investment is via the Department for International Trade (DIT, previously UKTI), which helps
businesses export and grow into global markets, and overseas companies to locate and grow
in the UK. This national scale allows specialism and provides access to over 1,200 staff outside
19 https://www.ons.gov.uk/peoplepopulationandcommunity/populationandmigration/populationestimates/bulletins/annualmidyearpopulationestimates/mid2017

The economic rationale for devolving to Yorkshire | Final Report
25 September 2018 | 49
the UK. However, within the UK, DIT has around 500 staff in its London and Glasgow
headquarters, and 400 staff in its other 10 offices in Wales, Northern Ireland and the English
regions (including a Barnsley office in Yorkshire). There is also export support through LEP-
area Growth Hubs, which links to DIT, but this is not especially prominent.
The question that arises is; would devolution to the Yorkshire level, and associated
collaborative approaches, improve the impact of work to promote exports and inward
investment? There are a number of reasons why this might be the case:
Intensification for better impact. Yorkshire and Humber’s performance on exports is the
worst in the UK by some way and current arrangements are not working well for the
region and its areas. There is clearly potential to try something different and to intensify
work to promote exports (which devolution could allow) and the case for this is magnified
in a post-Brexit era. Devolution could seek a transfer and expansion of DIT resource
within Yorkshire to enable local control, while still allowing access to UK specialist and
overseas capacity, and signposting through LEP areas. Hence Yorkshire-level devolution
could provide an opportunity for more intensive, better quality, and proactive promotion
of, and support for, Yorkshire businesses on exporting.
Identity and Ambition. While the external promotion of Yorkshire as an attractive
destination and place to do business may be having a positive impact on international
investors, there is no equivalent activity to promote export and internationalisation to
businesses based in Yorkshire and Humber. Given that businesses tend to be very
supportive of the ambition and positivity associated with Welcome to Yorkshire’s
campaigns, there may be potential to use the Yorkshire identity in new ways to raise the
ambition of Yorkshire businesses and encourage them to export as part of a devolved
approach. This could also enable good links between inward investment and export,
including work to enhance perceptions of the region and its businesses abroad.
Additionally, as Yorkshire is a better known ‘place-based brand’ than that of any given
LEP-area, it will have advantages for profile building and inward investment.
Capitalising on complementary assets and networks. There are assets and networks
across the Yorkshire and Humber region that can support exporting activity, notably the
Humber Ports, as well as airports and road and rail links, and representative business
organisations. Some of these assets (e.g. the Humber Ports) are not always highlighted in
SEPs, which tend to focus on activity within the LEP area rather than the importance of,
and the opportunities generated by, connectivity to other LEP areas. Thus, there is
potential to promote place-specific assets, such as ports and airports, which enable
international trade and investment by business in the Yorkshire and Humber region.
What further study is required?
Further study is required:
To understand how arrangements to promote international trade and investment in
Yorkshire could improve upon – or extract more value from – current national and pan-
Northern arrangements;
On the potential to use the Yorkshire brand as a tool to engage business in exporting
activities; and
On the drivers of and barriers to businesses engaging in exports and/or international
supply chains – as these not only link to exports but also to innovation (as noted above).
The economic rationale for devolving to Yorkshire | Final Report
25 September 2018 | 50
Skills and Ambition
Headline employment statistics
The data in Table 6-7 show little difference between the three geographies in terms of
Working Age Population (WAP) as a percentage of total population: Group One is 62.3%,
Group 2 is 62.7% and Group Three is 62.6%, which is not too dissimilar from the national
average. To put these figures in perspective, London has the highest rate at 67.7% and the
South West has the lowest rate at 60.6%.
There is also little variation between the three Groups in relation to the Economic Activity
Rate20 around 77.5%, which is just below the national average of 78.2%. Employment Rates21
for the three geographies are also similar. These lag the national average by between 0.9 of a
percentage point and 1.3 percentage points. The data suggest there is some room for
improvement in Economic Activity and Employment Rates, particularly when compared to the
best performing region (the South East), which has an Economic Activity Rate of 81.4% and an
Employment Rate of 78.8%.
The number of jobs per head (job density) in the three geographies similar at 0.8, which is
below the national average of 0.84 – suggesting there is room for improvement in job density,
especially when the South East and South West have achieved 0.88 jobs per head.22
Headline education, qualifications and skills statistics
If the employment picture could be characterised as steady (if with room for improvement),
the situation in relation to skills is much less rosy. The percentage of the population educated
to NVQ4 or above is around 33%, which is more than five percentage points below the
national average – around 10 percentage points below that achieved in Scotland. The figure
for Yorkshire and Humber is below that of the North West (34.5%) and significantly below
rates achieved in the South West (39%), South East (41%), and, of course, London (52%).
In relation to the proportion of the population with no qualifications, the region is in a worse
position than the national average (of 8%), with around an additional 1.5% of the workforce in
Yorkshire and Humber with no qualifications. The South West and South East have rates that
are more than four percentage points better than the rate for Yorkshire and Humber – which
shows what can be achieved at the level of a region.
Across Yorkshire and Humber, West Yorkshire, South Yorkshire and the Humber all have
qualifications which vary by district, but are below national average overall – notably at NVQ
Level 4+ (30%-33% compared to UK average of 38%). North Yorkshire has much better
qualification levels (40% with NVQ level 4+), but still seeks to drive ambitions and skills higher.
In terms of graduate retention in the short term (i.e. within six months of graduation), the
region lags Scotland, Wales and London, it also lags the North East (71% retention) and North
West (72%) retention. Thus, there appears to be a region-wide graduate retention issue.
20 Percentage of the WAP in or actively seeking work.
21 Percentage of the WAP in work.
22 The figure for London is 0.99.
The economic rationale for devolving to Yorkshire | Final Report
25 September 2018 | 51
Data from HEFCE23 shows the longer-term position by LEP area. These data show that Humber
LEP retains around 47% of its graduates, Leeds City Region 46%, Sheffield City Region 37%, and
YNYER LEP 32%. To put these figures in context Greater Manchester retains 51%, the Black
Country LEP retains 41% and the Greater Birmingham and Solihull LEP retains 36.5%.
What do the data say about skill gaps and hard-to-fill vacancies?
Businesses frequently identify skills (gaps and shortages) as major constraints on their ability
to grow. The research on Scale-ups cited above reinforces this point, as do the findings from
business engagement undertaken as part of this study.
The Employers’ Skills Survey provides data on skills gaps and hard-to-fill vacancies; at the level
of Yorkshire and Humber, it found around 6% of employees are reported to have skills gaps
(i.e. do not have sufficient skills to do the job required). This figure is similar to the national
average – and is not particularly different from the comparator regions. To put the figure in
perspective, Northern Ireland has the lowest rate (3%) and the West Midlands and the South
East have the highest rate (7%). In terms of businesses reporting hard-to-fill vacancies, the
data show that Yorkshire and Humber (at 7%) is slightly below the national average (of 8%),
but is three percentage points above the West Midlands – indicating some room for
improvement in terms of overcoming this constraint.
What do the data say about employer perspectives on staff training and development?
The 2016 Employer Perspectives Survey provides a snapshot at LEP-level of employers’
approaches to recruitment and staff development; in other words, employers’ approaches to
tackling skills shortages and skills gaps. Table 6-8 provides selected data from the survey. It
shows employers in the four LEPS were:
Less likely to have experienced a vacancy in the preceding 12 months than the England
average;
Less likely to have filled a vacancy than the national average;
Less likely to have employed a young person; and
Less likely to have employed an older worker.
Employers in the region are around the national average in terms of offering work experience
and awareness of Government Traineeships – with Sheffield City Region the best performing
of the four Yorkshire and Humber LEPs. This performance is also apparent in responses in
relation to apprenticeships where Sheffield City Region’s figures are significantly above the
national average and the other three LEPs – suggesting there is potential for exchange of good
practice between LEPs, provided an economic, efficient, and effective mechanism for this can
be developed.
The data on staff development show relatively good performance with three of the four LEPs
bettering the national average for offering training in the past 12 months. The data show a
slightly greater propensity to use colleges of further education in Leeds, Sheffield and Humber
LEP areas than the national average, and an average propensity to use universities to conduct
training.
23 http://www.hefce.ac.uk/analysis/maps/mobility/mobdata/

The economic rationale for devolving to Yorkshire | Final Report
25 September 2018 | 52
What does this mean for devolution to Yorkshire?
The significant gap between each of the three geographies and the national average in relation
to the percentage of the workforce qualified to NVQ4 or above distinguishes the region from
the national average – and will act as a drag on productivity and earnings. This gap needs to be
closed if the productivity gap with the UK is to be reduced.
Coordination of effort at the level of Yorkshire for such higher-level skills – given provision is
usually centralised and higher-skilled/higher-paid workers are more likely to travel long
distances to work – may add value to current arrangements and raise employers’ use of
universities above the national average. Furthermore, the introduction of degree-level
apprenticeships offers an opportunity for concerted and coordinated action to drive up skills
across the region.
It should be noted, however, that the data on employers’ responses to skills gaps and
shortages does not suggest a particular ‘Yorkshire-level issue’, as opposed to a Northern or
national issue in relation to employers’ approach to skills and development. Furthermore, with
a few exceptions associated with very specialist vocational training provision, most consultees
highlighted the importance of local arrangements and provision for employers and staff alike,
and were unsure as to the benefits of pan-Yorkshire arrangements on vocational skills.
One sign of concern to be noted from the data – given an ageing workforce and potential
reductions in the availability of overseas workers as a result of Brexit – is that there may be
call for Yorkshire-wide action to improve employers’ ability to respond to labour market
change – as workers require new skills either to work in new sectors as they are displaced
from current industries undergoing automation or to work in the same industries applying
new processes.
What further study is required?
Further study is required in the following areas:
Future skill requirements which are significant and common across a range of key
sectors/industries in the geography;
How best to improve awareness of and access to significant specialist training assets, so
that it is easier for employers and staff to find and access provision outside their area;
Barriers to retraining, to test whether pan-Yorkshire interventions to tackle market
failures (fear of skilled staff being poached by rivals, opportunity costs of releasing staff
for training etc.) could add value to existing arrangements; and
Identify where pan-Yorkshire leadership and coordination can build on the Northern
Powerhouse research, Educating the North which highlighted:
– The importance of early years, career pathways, and the opportunity to use devolved
adult education and education budgets for those aged 16-18, to build world-leading
degree and higher-level apprenticeships; and
– The need to update the research in the Northern Powerhouse Independent Economic
Review to assess skill requirements in the four Primes (Advanced Manufacturing and
Materials, Energy, Health Innovation, and Digital) and the enabling sectors (Financial
and Professional Services, Logistics, and Education).24
24 http://www.northernpowerhousepartnership.co.uk/media/1208/npp-educating-the-north.pdf

The economic rationale for devolving to Yorkshire | Final Report
25 September 2018 | 53
Table 6-7: Headline data on employment, educational attainment and skills
Indicator Group One:
One
Yorkshire
Signatories
Group Two Group
Three
Yorkshire &
Humber
GB/UK Wales Scotland West
Midlands
London
Working-age Population (WAP) (%) 62.34% 62.68% 62.56% 62.91% 61.52% 64.42% 62.05% 67.68%
Total employment 1,950,300 2,335,100 2,482,200 30,808,500 1,379,300 2,532,500 2,597,700 4,506,500
Economic Activity Rate (WAP) 77.6% 77.4% 77.3% 78.2% 76.0% 77.5% 76.4% 78.2%
Employment Rate (WAP) 73.8% 73.4% 73.4% 74.7% 72.4% 74.3% 72.4% 74.0%
Claimant Count (%) 2.5% 2.5% 2.5%
2.2% 2.3% 2.6% 2.8% 2.2%
Proportion of residents retired (Of
Economically Inactive Population)
13.5% 12.9% 13.3% 13.1% 14.3% 15.3% 11.8% 6.3%
Jobs density 0.81 0.80 0.80 0.84 0.76 0.80 0.79 0.99
NVQ levels (% with L4+) 32.8% 33.5% 33.0% 38.4% 35.1% 43.9% 31.8% 51.8%
NVQ levels (% with no qualifications) 9.8% 9.6% 9.5% 8.0% 8.7% 8.7% 10.4% 6.8%
Employees with Skills Gaps (%) - - - 6% 6% 6% 6% 7% 6%
Employers with Hard-to-Fill Vacancies (%) - - - 7% 8% 7% 8% 4% 8%
% pupils at KS5 progressing into sustained
education at an HE institution
- - - 51% 51% - - 52% 61%
Graduate retention rates (%) - - - 65% - 69% 85% 64% 80%
Residents employed in STEM subjects (Prof
& Associate Prof %)
31.4% 31.7% 31.3%
34.5% 30.8% 34.3% 30.8% 43.0%
Sources: Annual Population Survey, 2o17; UKCES, Employer Skills Survey, 2015; ONS
Note: Date only available at the level of Yorkshire and Humber are provided in a separate column.

The economic rationale for devolving to Yorkshire | Final Report
25 September 2018 | 54
Table 6-8: Headline from Employer Perspectives Survey
Issue England Leeds City Region Sheffield City Region YNYER Humber
Recruitment
Had any vacancies for full or part-time staff in the past 12 months 53% 50% *46% 49% 47%
Proportion citing that candidates having Maths and English GCSE to at least level 2 or GCSE A*-C is
either a critical or significant factor when recruiting
56% 54% 59% 51% 51%
Recruited anyone in the last year 49% *44% *41% 45% 44%
Recruited any young person in the past 12 months 32% 31% 30% 30% 27%
Recruited anyone aged 50+ in the past 12 months 15% 14% 11% 15% 11%
Work experience
Had anyone in on work experience in the last 12 months 38% 36% 39% 37% 36%
Aware of Government Traineeships 48% 44% 52% 45% 51%
People Development
Whether offered any training in the last 12 months 73% 76% 76% 72% 76%
Proportion who had used FE Colleges to conduct their training 9% 10% *12% 8% 11%
Proportion who had used HEIs to conduct their training 5% 4% 5% 5% 6%
Proportion who had used commercial organisations to conduct their training 44% 45% 44% 45% 42%
Whether the establishment has worked with another employer to develop skills or expertise in the
workforce
14% 14% 14% 16% 18%
Offered vocational qualifications in the last 12 months 26% 27% 27% 29% 32%
Apprenticeships
Whether have or offer apprenticeships 19% 20% *25% 15% 20%
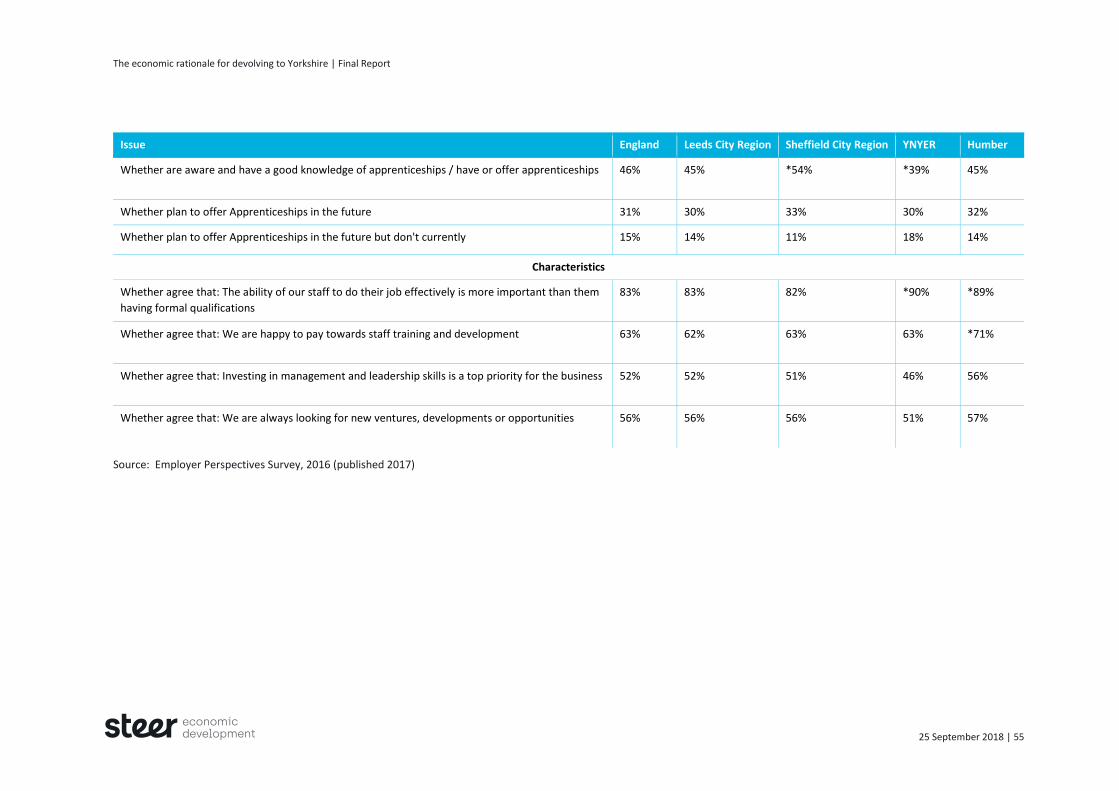
The economic rationale for devolving to Yorkshire | Final Report
25 September 2018 | 55
Issue England Leeds City Region Sheffield City Region YNYER Humber
Whether are aware and have a good knowledge of apprenticeships / have or offer apprenticeships 46% 45% *54% *39% 45%
Whether plan to offer Apprenticeships in the future 31% 30% 33% 30% 32%
Whether plan to offer Apprenticeships in the future but don't currently 15% 14% 11% 18% 14%
Characteristics
Whether agree that: The ability of our staff to do their job effectively is more important than them
having formal qualifications
83% 83% 82% *90% *89%
Whether agree that: We are happy to pay towards staff training and development 63% 62% 63% 63% *71%
Whether agree that: Investing in management and leadership skills is a top priority for the business 52% 52% 51% 46% 56%
Whether agree that: We are always looking for new ventures, developments or opportunities 56% 56% 56% 51% 57%
Source: Employer Perspectives Survey, 2016 (published 2017)

The economic rationale for devolving to Yorkshire | Final Report
25 September 2018 | 56
Business Start-ups, Deaths, Survival, Density, and Scale-up
Business start-ups, deaths and survival rates
Table 6-9 shows headline data on business start-ups, business deaths, and three-year survival
rates for the three geographies. It shows all three geographical groupings have the same
business start-up rate (14%) and death rate (11%) and that they lag the UK average by one
percentage point in terms of business births, and have a business death rate that is one
percentage point lower than the national average. Three-year business survival rates in the
region are the same as, or close to, the national average and most of the comparator areas,
with the exception of London, which has a lower three-year survival rate.
Thus, at a headline level, there is little to suggest that business start-ups, deaths, and survival
rates point to a distinctive set of concerns that need to be addressed at the Yorkshire level.
Business density
Data on business density, i.e. the number of businesses per 10,000 adults, show Yorkshire and
Humber has 953 businesses per 10,000 adults. While outperforming Scotland, Wales, the
North East, and the North West, the region’s average is well below that of England (1,119) and
the UK (1,069).25 It is also below the averages achieved in the East Midlands (962), West
Midlands (964), East of England (1,155), South West (1,170), South East (1,272), and London
(1,519).26
To put these figures in context, there were 5.674m businesses at the start of 2017, when the
data were compiled, with 419,215 in Yorkshire and Humber, this is 7.3% of the UK business
population; one percentage point below the region’s population share, implying a shortfall of
around 56,700 businesses.
Thus, while business density varies within regions, as it does within LEP areas, there appears to
be a need to raise the total business density at the level of Yorkshire and Humber to match the
UK average.
Table 6-9: Business base, births, deaths and survival rate, 2017
Indicator Group One
Group Two
Group
Three
GB/UK Wales Scotland West Midland
s
London
Business Birth Rate (business births as a proportion of active businesses)
14% 14% 14% 15% 12% 12% 16% 17%
Business Death Rate (business deaths as a
11% 11% 11% 12% 10% 12% 11% 14%
25 http://njs.analysisoncbas.co.uk/business/data/bpe_graphs.html Note: These data cover the total business population, including firms not registered for VAT.
26 Comparison of business population are affected by the share of businesses by size – the data show c. private sector 500 business in Yorkshire and Humber have >250 employees, around 7.8% of the UK total of 6,400 large-scale employers.

The economic rationale for devolving to Yorkshire | Final Report
25 September 2018 | 57
proportion of active businesses)
Business Survival Rate (% after 3 years)
61% 61% 60% 61% 61% 62% 61% 58%
Source: Business Demography, ONS
Scale-ups
What are Scale-ups and why are they important?
Recent research has highlighted the importance of Scale-up businesses (i.e. business which
achieve >20% annual growth in employee numbers and/or turnover in driving economic
growth) with Scale-ups accounting for only 1% of businesses but 3% of employment creation.27
Data are available on the distribution of Scale-up businesses, so it is possible to identify which
areas generate significant numbers of Scale-up businesses and which do not.
How does Yorkshire perform in terms of generating Scale-ups?
A recent study by the Scale-up Institute found 31,440 Scale-ups in the UK, in 2015.28 The study
reported Yorkshire and Humber was the second lowest performing region, with just 4% of
Scale-ups, (only Northern Ireland with 1% did worse). It analysed data by LEP area. It
highlighted the Humber LEP as one of nine ‘Scale-up cold spots’ and the Leeds City Region as
the fifth highest performer in the UK, with 144 Scale-ups. The city of Leeds itself was cited as
the highest performing local authority district outside London, with 68 Scale-ups relative to 50
in Birmingham, the next best-performing non-London district.
Which sectors generate Scale-ups?
All sectors can generate Scale-ups but, in 2017, Property and Land Development produced the
most Scale-ups (546), followed by Distribution (283), Miscellaneous Manufacturing and
Engineering (277), Builders (255), Food and Drink Processes (219).29
What are the drivers of and barriers to Scale-ups’ growth?
The Scale-up Institute’s 2017 survey highlights the following top-five challenges:
Access to (homegrown and overseas) talent, in terms, of both social and technical skills
required to drive business growth;
Access to (UK and international) markets, in particular, the requirements associated with
the procurement process of both the public sector and large-scale multi-nationals – and
linked to the first point access to people with the skills necessary to win work;
Business leadership capacity,
Access to finance, with 40% of Scale-ups planning to access equity finance as a means of
driving growth; and
Infrastructure, which is required as a complement to a supportive Scale-up ecosystem.
27 http://www.scaleupinstitute.org.uk/research/octopus-high-growth-small-business-report-2018/
28 http://www.scaleupinstitute.org.uk/wp-content/uploads/2017/11/ScaleUpInstitute_Review_2017_Chapter_1.pdf
29 http://www.scaleupinstitute.org.uk/wp-content/uploads/2017/11/ScaleUpInstitute_Review_2017_Chapter_1.pdf
The economic rationale for devolving to Yorkshire | Final Report
25 September 2018 | 58
These themes chime with those highlighted by business as issues that could benefit from
devolution to the Yorkshire level.
What does this mean for devolution to Yorkshire?
The data on business density, start-ups, three-year survival rates, and Scale-ups suggest there
is a significant entrepreneurial challenge in Yorkshire. But, there is clearly scope for Yorkshire
to improve its Scale-up performance, as Distribution, Manufacturing and Engineering, and
Food & Drink Processing, in which it has clear specialisms, are delivering significant numbers of
Scale-ups elsewhere.
The variation in the performance of LEPs and Local Authority Districts within Yorkshire
regarding these performance metrics points to opportunities for knowledge exchange/transfer
between LEPs – provided there is an economic, efficient, and effective means of doing so.
What further research is required?
Further research is required to:
Map the main the characteristics of the region’s business population (e.g. firm size,
businesses’ growth (by turnover and employment), legal structure/s, the patterns of
domestic and overseas ownership, firms’ involvement in international trade/supply/value
chains, and the scale of business investment in capital); to establish a more detailed
understanding of the drivers of and barriers to business growth and the extent to which
these are shared across Yorkshire; and
Understand the scale at which business support needs to be provided, e.g., start-up
advice at the local level and access to equity finance at a pan-Yorkshire or pan-Northern
level.
Transport and Connectivity
Headline data on commuting patterns
As noted in the Introduction to this report, Yorkshire and Humber is a polycentric region with
diverse geography, which means there are a number of interlocking functional economic areas
and LEP geographies, as well as multiple membership of TTWAs and (currently) LEPs. Table
6-10 shows that at a high level the four geographies of North, South, and West Yorkshire,
along with the Humber are relatively self-contained. Of the journeys to work undertaken just
under two-thirds are by car and the average commute is around 12.6km – to put these figures
in perspective:
The lowest percentage of travel to work by car is 28% (London) and the highest is 70%
(Wales); and
The longest average commute into a region 17.8km (London) and the shortest average
commute is 11.7km (North East).
Table 6-11 provides a more fine-grained view of commuting flows. It contains data on travel
from a home Local Authority District to a workplace Local Authority District for a selected
number of locations – for example immediate neighbours as well as significant flows to
commuter locations. It shows the importance of transport connections across the boundaries
of different LEP areas and Passenger Transport Executives.

The economic rationale for devolving to Yorkshire | Final Report
25 September 2018 | 59
Table 6-10: Regional Commuting Flows
Local Authority South
Yorkshire
Work
North
Yorkshire
Work
West
Yorkshire
Work
Humber Work Outside
Yorkshire
and Humber
South Yorkshire Home 426,951
85%
3,859
1%
26,420
5%
5,438
1%
41,967
8%
North Yorkshire Home 2,129
1%
250,038
79%
34,253
11%
6,308
2%
23,126
7%
West Yorkshire Home 15,116
1.75%
23,850
3%
783,428
91%
2,349
0.25%
35,392
5%
Humber Home 5,361
1.5%
12,874
4%
5,487
1.5%
314,440
89%
15,090
4%
Source: ONS (2011), Location of usual residence and place of work by method of travel to work (MSOA level)
Table 6-11: Breakdown of Travel to Work patterns for selected boundary local authorities and transport hubs
Resident Local
Authority
Travel to Work Patterns
Barnsley Barnsley’s most common commuting destinations are in the City Regions of Leeds and
Sheffield: Sheffield (10%), Rotherham (9%), Wakefield (8%), Leeds (4%) and Doncaster (4%).
Bradford Bradford has pronounced travel-to-work connections outward into Leeds (15%) with
Calderdale (3%) and Craven (2%).
Craven 19% of residents in Craven work in Bradford. The second highest travel-to-work flow is Leeds
(5%), even though Leeds is not an immediate neighbour.
Doncaster Doncaster has strong commuter flows to Sheffield City Region, Leeds City Region and
Humber LEP: 7% of Doncaster residents work in Rotherham, 4% in Sheffield, 3% in Wakefield,
2% in Leeds, 2% in Barnsley and 2% in North Lincolnshire.
Harrogate Leeds is the greatest commuter destination from Harrogate (13%) with the next being
Hambleton (3%) and York (3%).
Kirklees Kirklees has the strongest commuter flows within Leeds City Region in Leeds (12%),
Calderdale (6%), Bradford (5%), Wakefield (5%). Although Barnsley is a neighbouring local
authority it only has 1% of commuter flows.
Leeds Whilst Leeds has strong inward commuter flows from multiple destinations, its strongest
outward flows are to Bradford (6%), Wakefield (4%), Kirklees (2%) and Harrogate (2%).
North East
Lincolnshire
8% of commuter trips are to North Lincolnshire and 1% to East Riding of Yorkshire.
North
Lincolnshire
North East Lincolnshire employs 6% of residents from North Lincolnshire. The second highest
destination (4%) is Doncaster in the neighbouring LEP area.
Selby Selby’s most common commuting destinations are Leeds (18%), York (14%), Wakefield (9%)
and East Riding of Yorkshire (5%).
Wakefield There are strong commuter flows from Wakefield to Leeds (17%), Kirklees (5%), Barnsley
(2%) and Selby (2%)
York The largest travel to work connections from York are in York North Yorkshire & East Riding
LEP and Leeds City Region LEP: Leeds (6%), Hambleton (3%) and Harrogate (3%).
Source: ONS (2011), Location of usual residence and place of work by method of travel to work (MSOA level)

The economic rationale for devolving to Yorkshire | Final Report
25 September 2018 | 60
What does this mean for devolution to Yorkshire?
The headline data on commuting within and between the four main sub regions suggest, at
first glance, that the areas are relatively self-contained, and therefore may indicate there is
little advantage in pan-Yorkshire arrangements. Data on commuting between local authority
areas, however points to a greater degree of complexity in the patterns Furthermore, the
relatively weak commuting levels between some geographies, illustrates potential barriers to
cross-boundary commuting may be in operation. For example, commuter flows between
Leeds and Sheffield are not particularly significant. A point of comparison: the fastest journey
time between Leeds and Sheffield is 40 minutes and the trip costs £11.10 (the journey can be
made for £6.50 but the journey time is around 1 hour), while the journey between Ealing
Broadway and Liverpool Street in London takes around 40 minutes and costs £2.80 (off peak).
Headline data on transport spending per head
Two different sets of recent analysis on transport spending in England have found significant
disparities in funding per head by region. The first analysis30 provides a snapshot in time,
which shows that while spending per head in Yorkshire and Humber (£335) sits between the
extremes of London (£944) and the East Midlands (£220), it is less than 80% of the (mean)
average for England. Looking at the breakdown by type of infrastructure the region appears to
fare relatively well in terms of spending per head on local and national roads, but does not
fare well in terms of spending on local public transport and rail (Table 6-12).
To put these figures in perspective, total transport spending in England in 2016/17 was
£23.5bn and it was £1.82bn (7.75%) in Yorkshire and Humber. If the region had been allocated
8.3% of the budget – in line with population share – it would have received £1.95bn.
Table 6-12: Public expenditure per head on Transport by region, 2016/17
NE NW Y&H EM WM EoE London SE SW Eng
Total 291 370 335 220 314 333 944 370 305 425
National
roads
50 62 71 52 61 64 3 93 42 55
Local
roads
104 88 96 70 77 103 42 63 96 78
Local
public
transport
19 36 22 19 15 12 115 12 23 35
Rail 110 175 137 70 150 144 773 201 136 249
Other 8 9 10 9 12 9 10 1 7 8
Source: Tom Rutherford, Transport Spending by Region, House of Common Library, Briefing Paper No. 8130, February 2018
A separate analysis by IPPR North31 has looked at the pipeline of future transport investment
from 2016/17 onwards across England’s regions. This puts total England transport investment
at approximately £32.7 billion, with Yorkshire and Humber scheduled to receive approximately
30 https://researchbriefings.parliament.uk/ResearchBriefing/Summary/CBP-8130#fullreport
31 https://www.theguardian.com/uk-news/2017/feb/20/more-than-half-uk-investment-in-transport-is-in-london-says-study

The economic rationale for devolving to Yorkshire | Final Report
25 September 2018 | 61
£1.05 billion of this – 3.2% of the total (compared to its 8.3% of England’s population).
Yorkshire’s share of expenditure is set against 54.2% of transport expenditure going to London
and 15.1% to the North West. Under this analysis, Yorkshire and Humber’s proportionate
share of expenditure would have been £2.7 billion, £1.66 billion more than it is set to receive.
Strategic Connectivity – assets and interlinkages
All four LEP areas within Yorkshire and Humber identify transport and wider connectivity as a
priority and cite specific assets and highlight improvements required. This section reviews the
plans and priorities in each LEP area and the extent to which connectivity assets and priorities
are shared and connected across Yorkshire and Humber.
The analysis is primarily based on connectivity within Yorkshire and Humber, but also
considers how far assets are of importance to, and could be better utilised by, the whole of
the North. Likewise, while the onus is on transport connectivity, broadband/digital
connectivity is also considered.
The following subsections cover each main mode of transport, as well as digital connectivity,
and include tables that set out relevant connectivity priorities in each LEP area, based on SEPs
and/or emerging LIS content. Conclusions are drawn based upon this analysis, coupled with
wider strategic and labour market travel analysis to highlight areas where there may be
benefit from Yorkshire-level devolution.
Ports
Table 6-13: Ports – positioning and priorities in SEPs/emerging LIS content
Humber Leeds City Region Sheffield City Region YNYER
Humber Port infrastructure noted as a national asset Want Government to explore how ports policy can help UK to be competitive post-Brexit, e.g. free trade zone designations
Not covered Not covered Not covered
The Humber Ports complex comprises the ports of Hull, Immingham, Grimsby and Goole. It is
the UK’s largest, multi-purpose ports complex, and supports 33,000 jobs, contributes £2.2
billion pa to the UK economy,32 and handles more than 65 million tonnes of cargo. Immingham
is currently the UK's largest port by volume and Hull is home to one of the UK's largest port
developments; the £310 million Green Port Hull project with Siemens.
The Humber Ports were previously identified as a Yorkshire and Humber regional priority due
to their role as a key gateway for trade, and seen as of value to businesses in all four Yorkshire
areas. Our review of SEPs suggests that this level of prominence is no longer evident. Although
the value of the Humber Ports was noted by some business consultees in this study (and not
only in the Humber area), the ports are only a named as a priority in the Humber SEP and are
not noted in a significant way in SEPs/emergent LIS work elsewhere.
32 http://www.abports.co.uk/Our_Locations/Humber
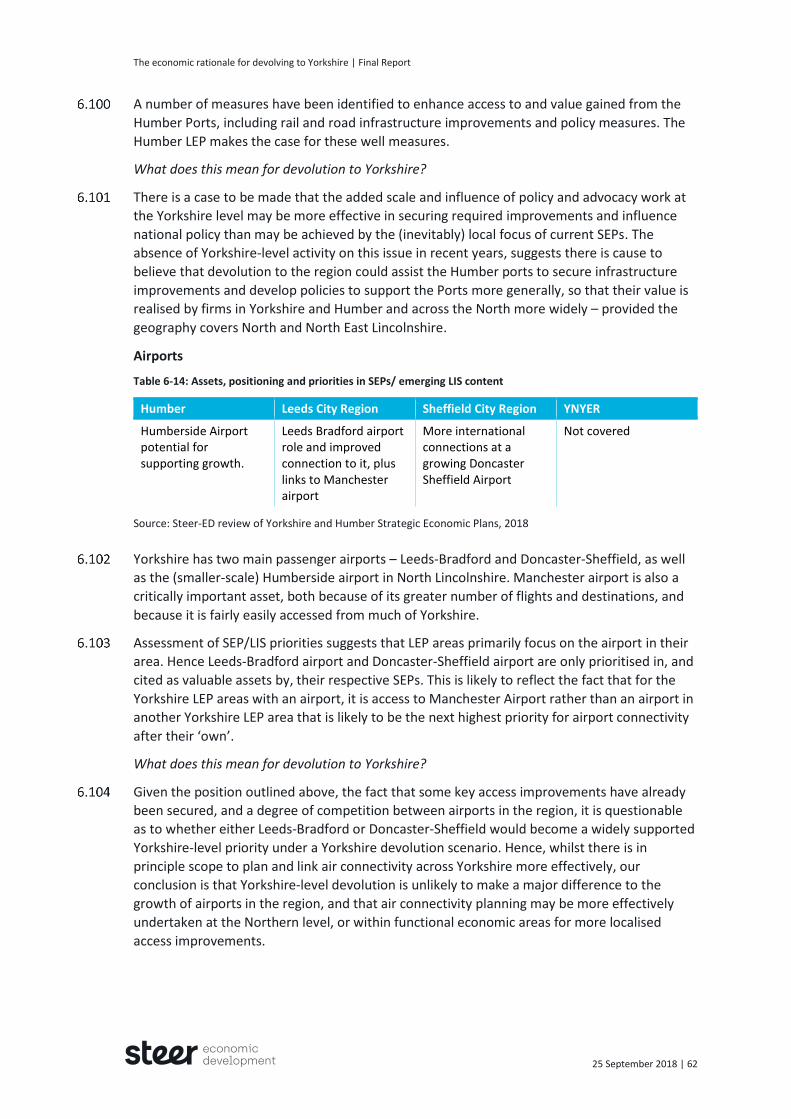
The economic rationale for devolving to Yorkshire | Final Report
25 September 2018 | 62
A number of measures have been identified to enhance access to and value gained from the
Humber Ports, including rail and road infrastructure improvements and policy measures. The
Humber LEP makes the case for these well measures.
What does this mean for devolution to Yorkshire?
There is a case to be made that the added scale and influence of policy and advocacy work at
the Yorkshire level may be more effective in securing required improvements and influence
national policy than may be achieved by the (inevitably) local focus of current SEPs. The
absence of Yorkshire-level activity on this issue in recent years, suggests there is cause to
believe that devolution to the region could assist the Humber ports to secure infrastructure
improvements and develop policies to support the Ports more generally, so that their value is
realised by firms in Yorkshire and Humber and across the North more widely – provided the
geography covers North and North East Lincolnshire.
Airports
Table 6-14: Assets, positioning and priorities in SEPs/ emerging LIS content
Humber Leeds City Region Sheffield City Region YNYER
Humberside Airport potential for supporting growth.
Leeds Bradford airport role and improved connection to it, plus links to Manchester airport
More international connections at a growing Doncaster Sheffield Airport
Not covered
Source: Steer-ED review of Yorkshire and Humber Strategic Economic Plans, 2018
Yorkshire has two main passenger airports – Leeds-Bradford and Doncaster-Sheffield, as well
as the (smaller-scale) Humberside airport in North Lincolnshire. Manchester airport is also a
critically important asset, both because of its greater number of flights and destinations, and
because it is fairly easily accessed from much of Yorkshire.
Assessment of SEP/LIS priorities suggests that LEP areas primarily focus on the airport in their
area. Hence Leeds-Bradford airport and Doncaster-Sheffield airport are only prioritised in, and
cited as valuable assets by, their respective SEPs. This is likely to reflect the fact that for the
Yorkshire LEP areas with an airport, it is access to Manchester Airport rather than an airport in
another Yorkshire LEP area that is likely to be the next highest priority for airport connectivity
after their ‘own’.
What does this mean for devolution to Yorkshire?
Given the position outlined above, the fact that some key access improvements have already
been secured, and a degree of competition between airports in the region, it is questionable
as to whether either Leeds-Bradford or Doncaster-Sheffield would become a widely supported
Yorkshire-level priority under a Yorkshire devolution scenario. Hence, whilst there is in
principle scope to plan and link air connectivity across Yorkshire more effectively, our
conclusion is that Yorkshire-level devolution is unlikely to make a major difference to the
growth of airports in the region, and that air connectivity planning may be more effectively
undertaken at the Northern level, or within functional economic areas for more localised
access improvements.
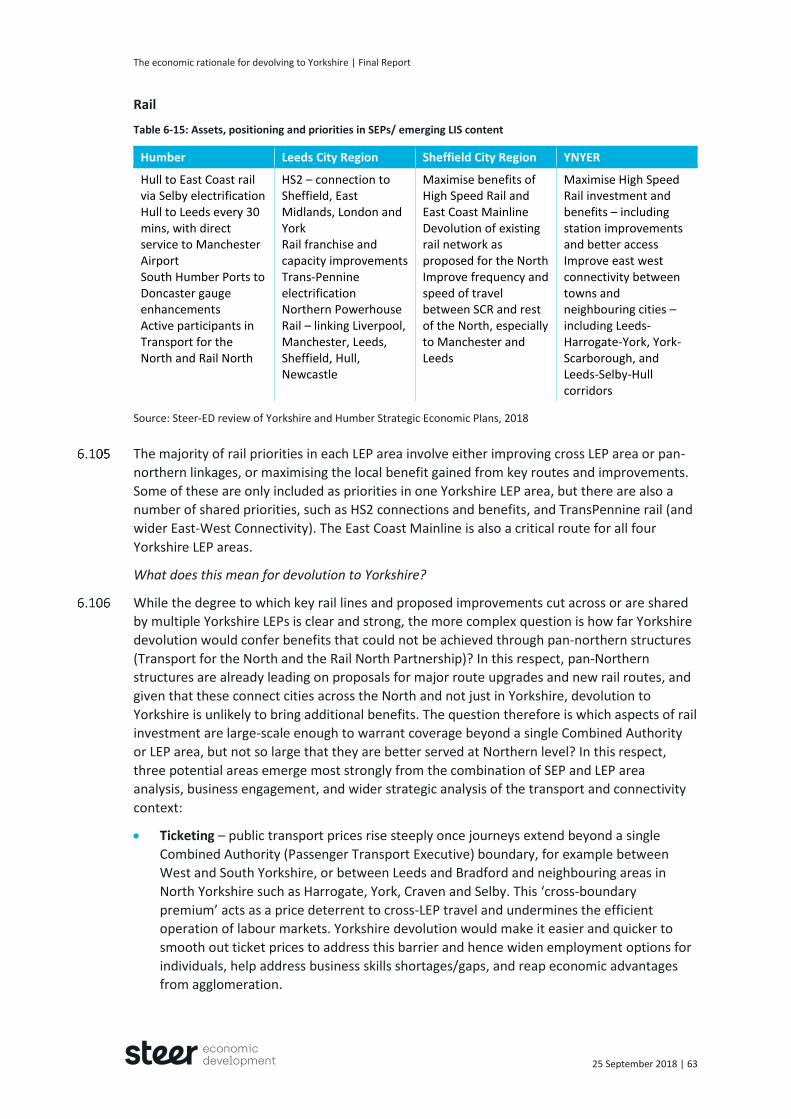
The economic rationale for devolving to Yorkshire | Final Report
25 September 2018 | 63
Rail
Table 6-15: Assets, positioning and priorities in SEPs/ emerging LIS content
Humber Leeds City Region Sheffield City Region YNYER
Hull to East Coast rail via Selby electrification Hull to Leeds every 30 mins, with direct service to Manchester Airport South Humber Ports to Doncaster gauge enhancements Active participants in Transport for the North and Rail North
HS2 – connection to Sheffield, East Midlands, London and York Rail franchise and capacity improvements Trans-Pennine electrification Northern Powerhouse Rail – linking Liverpool, Manchester, Leeds, Sheffield, Hull, Newcastle
Maximise benefits of High Speed Rail and East Coast Mainline Devolution of existing rail network as proposed for the North Improve frequency and speed of travel between SCR and rest of the North, especially to Manchester and Leeds
Maximise High Speed Rail investment and benefits – including station improvements and better access Improve east west connectivity between towns and neighbouring cities – including Leeds-Harrogate-York, York-Scarborough, and Leeds-Selby-Hull corridors
Source: Steer-ED review of Yorkshire and Humber Strategic Economic Plans, 2018
The majority of rail priorities in each LEP area involve either improving cross LEP area or pan-
northern linkages, or maximising the local benefit gained from key routes and improvements.
Some of these are only included as priorities in one Yorkshire LEP area, but there are also a
number of shared priorities, such as HS2 connections and benefits, and TransPennine rail (and
wider East-West Connectivity). The East Coast Mainline is also a critical route for all four
Yorkshire LEP areas.
What does this mean for devolution to Yorkshire?
While the degree to which key rail lines and proposed improvements cut across or are shared
by multiple Yorkshire LEPs is clear and strong, the more complex question is how far Yorkshire
devolution would confer benefits that could not be achieved through pan-northern structures
(Transport for the North and the Rail North Partnership)? In this respect, pan-Northern
structures are already leading on proposals for major route upgrades and new rail routes, and
given that these connect cities across the North and not just in Yorkshire, devolution to
Yorkshire is unlikely to bring additional benefits. The question therefore is which aspects of rail
investment are large-scale enough to warrant coverage beyond a single Combined Authority
or LEP area, but not so large that they are better served at Northern level? In this respect,
three potential areas emerge most strongly from the combination of SEP and LEP area
analysis, business engagement, and wider strategic analysis of the transport and connectivity
context:
Ticketing – public transport prices rise steeply once journeys extend beyond a single
Combined Authority (Passenger Transport Executive) boundary, for example between
West and South Yorkshire, or between Leeds and Bradford and neighbouring areas in
North Yorkshire such as Harrogate, York, Craven and Selby. This ‘cross-boundary
premium’ acts as a price deterrent to cross-LEP travel and undermines the efficient
operation of labour markets. Yorkshire devolution would make it easier and quicker to
smooth out ticket prices to address this barrier and hence widen employment options for
individuals, help address business skills shortages/gaps, and reap economic advantages
from agglomeration.
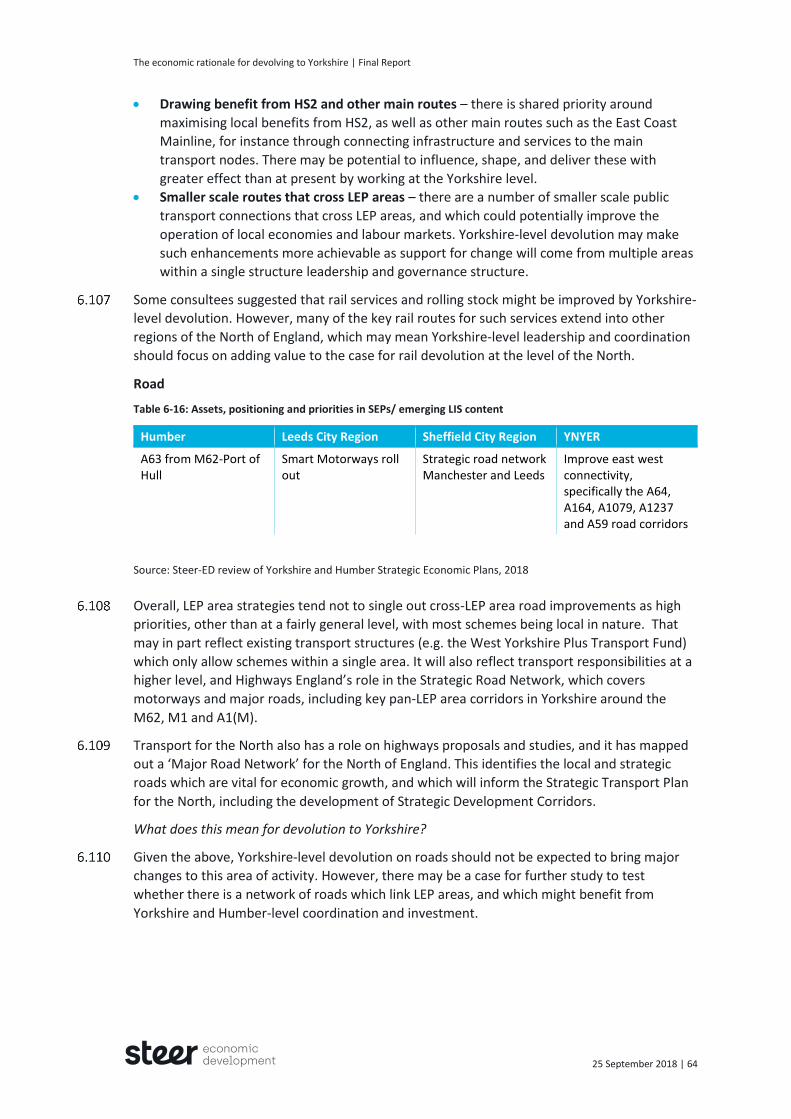
The economic rationale for devolving to Yorkshire | Final Report
25 September 2018 | 64
Drawing benefit from HS2 and other main routes – there is shared priority around
maximising local benefits from HS2, as well as other main routes such as the East Coast
Mainline, for instance through connecting infrastructure and services to the main
transport nodes. There may be potential to influence, shape, and deliver these with
greater effect than at present by working at the Yorkshire level.
Smaller scale routes that cross LEP areas – there are a number of smaller scale public
transport connections that cross LEP areas, and which could potentially improve the
operation of local economies and labour markets. Yorkshire-level devolution may make
such enhancements more achievable as support for change will come from multiple areas
within a single structure leadership and governance structure.
Some consultees suggested that rail services and rolling stock might be improved by Yorkshire-
level devolution. However, many of the key rail routes for such services extend into other
regions of the North of England, which may mean Yorkshire-level leadership and coordination
should focus on adding value to the case for rail devolution at the level of the North.
Road
Table 6-16: Assets, positioning and priorities in SEPs/ emerging LIS content
Humber Leeds City Region Sheffield City Region YNYER
A63 from M62-Port of Hull
Smart Motorways roll out
Strategic road network Manchester and Leeds
Improve east west connectivity, specifically the A64, A164, A1079, A1237 and A59 road corridors
Source: Steer-ED review of Yorkshire and Humber Strategic Economic Plans, 2018
Overall, LEP area strategies tend not to single out cross-LEP area road improvements as high
priorities, other than at a fairly general level, with most schemes being local in nature. That
may in part reflect existing transport structures (e.g. the West Yorkshire Plus Transport Fund)
which only allow schemes within a single area. It will also reflect transport responsibilities at a
higher level, and Highways England’s role in the Strategic Road Network, which covers
motorways and major roads, including key pan-LEP area corridors in Yorkshire around the
M62, M1 and A1(M).
Transport for the North also has a role on highways proposals and studies, and it has mapped
out a ‘Major Road Network’ for the North of England. This identifies the local and strategic
roads which are vital for economic growth, and which will inform the Strategic Transport Plan
for the North, including the development of Strategic Development Corridors.
What does this mean for devolution to Yorkshire?
Given the above, Yorkshire-level devolution on roads should not be expected to bring major
changes to this area of activity. However, there may be a case for further study to test
whether there is a network of roads which link LEP areas, and which might benefit from
Yorkshire and Humber-level coordination and investment.
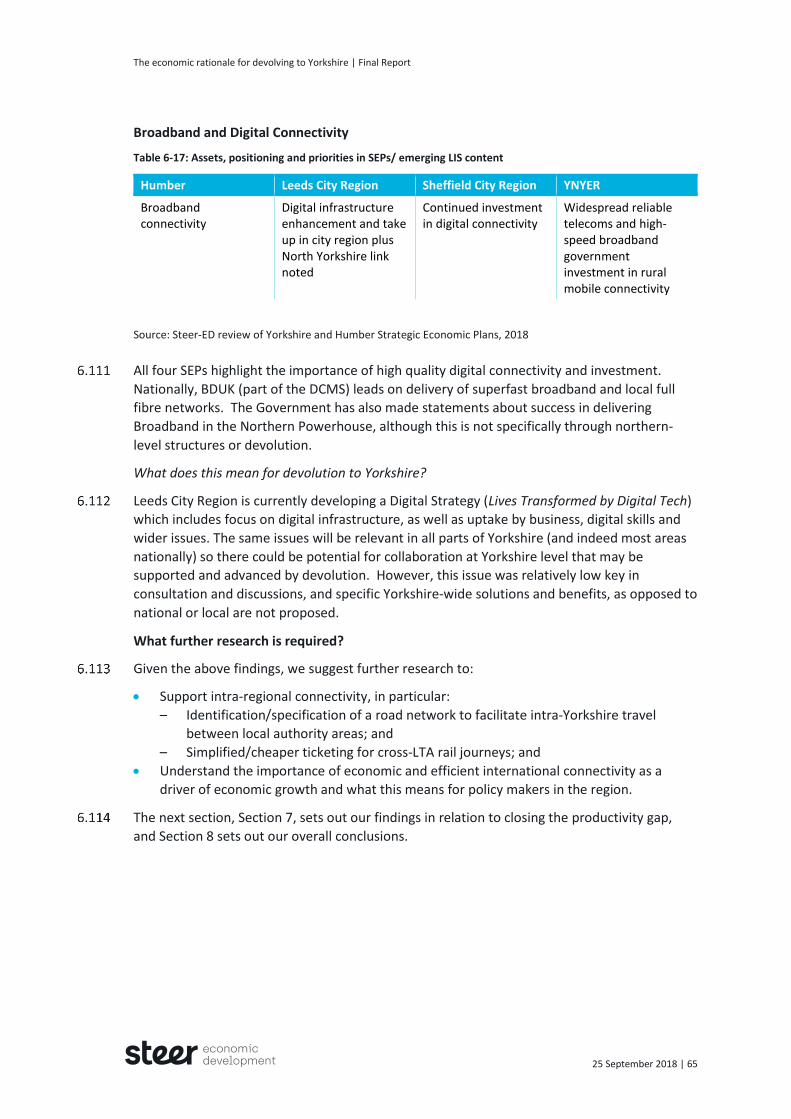
The economic rationale for devolving to Yorkshire | Final Report
25 September 2018 | 65
Broadband and Digital Connectivity
Table 6-17: Assets, positioning and priorities in SEPs/ emerging LIS content
Humber Leeds City Region Sheffield City Region YNYER
Broadband connectivity
Digital infrastructure enhancement and take up in city region plus North Yorkshire link noted
Continued investment in digital connectivity
Widespread reliable telecoms and high-speed broadband government investment in rural mobile connectivity
Source: Steer-ED review of Yorkshire and Humber Strategic Economic Plans, 2018
All four SEPs highlight the importance of high quality digital connectivity and investment.
Nationally, BDUK (part of the DCMS) leads on delivery of superfast broadband and local full
fibre networks. The Government has also made statements about success in delivering
Broadband in the Northern Powerhouse, although this is not specifically through northern-
level structures or devolution.
What does this mean for devolution to Yorkshire?
Leeds City Region is currently developing a Digital Strategy (Lives Transformed by Digital Tech)
which includes focus on digital infrastructure, as well as uptake by business, digital skills and
wider issues. The same issues will be relevant in all parts of Yorkshire (and indeed most areas
nationally) so there could be potential for collaboration at Yorkshire level that may be
supported and advanced by devolution. However, this issue was relatively low key in
consultation and discussions, and specific Yorkshire-wide solutions and benefits, as opposed to
national or local are not proposed.
What further research is required?
Given the above findings, we suggest further research to:
Support intra-regional connectivity, in particular:
– Identification/specification of a road network to facilitate intra-Yorkshire travel
between local authority areas; and
– Simplified/cheaper ticketing for cross-LTA rail journeys; and
Understand the importance of economic and efficient international connectivity as a
driver of economic growth and what this means for policy makers in the region.
The next section, Section 7, sets out our findings in relation to closing the productivity gap,
and Section 8 sets out our overall conclusions.

The economic rationale for devolving to Yorkshire | Final Report
25 September 2018 | 66
The Yorkshire and Humber Productivity Gap
There is a sizeable gap between productivity (and total GVA) in each of the four LEP areas in
Yorkshire and the national average. All four LEPs highlight growth and productivity as issues in
their existing and emerging strategic work, and given the Government’s clear messages on a
productivity focus through the LEP Review, this emphasis is likely to increase further in the
future.
Table 7-1 shows the latest official data on GVA and GVA per head by national and NUTS region
– for 2016.
Table 7-1: GVA for Yorkshire and Humber and comparator countries and regions, 2016
Area Total GVA (£ millions)
Annual growth in total GVA (%)
GVA per head (£) Annual growth in GVA per head (%)
UK 1,747,647 3.7 26,339 2.8
England 1,498,221 3.7 27,108 2.8
Yorkshire & Humber
112,194 2.1 20,678 1.4
Scotland 134,038 3.0 24,800 2.4
Wales 59,585 4.0 19,140 3.5
West Midlands 126,589 3.9
21,823
3.0
Source:
https://www.ons.gov.uk/economy/grossvalueaddedgva/bulletins/regionalgrossvalueaddedbalanceduk/1998to2016
The table demonstrates the scale of the output gap in terms of GVA per head. The Yorkshire
and Humber figure of £20,678 compares to a UK figure of £26,339 and an England figure of
£27,108 – figures that are 27% and 31% higher than the Yorkshire and Humber figure
respectively. The Yorkshire and Humber GVA per head figure is the second lowest of the
English regions (only the North East is lower), higher than in Wales but lower than in Scotland.
If GVA per head in the region were the same as in the UK, that would equate to total GVA of
approx. £142.9 billion – £30.7 billion higher than currently.
The data for annual GVA growth also demonstrate significant challenges. Growth in total GVA
of 2.1% in Yorkshire and Humber compares to a UK average of 3.7%, while growth in GVA per
head of 1.4% in the region was considerably lower than for all the comparator areas (and for
all other English regions apart from the North East) and only a half of the England and UK
average growth rate of 2.8%. In short, the Yorkshire and Humber area has a sizeable GVA and
productivity shortfall compared to UK average and this gap is growing.
7 Closing the productivity gap

The economic rationale for devolving to Yorkshire | Final Report
25 September 2018 | 67
Economic modelling using Experian’s Regional Econometric Model, which covers Yorkshire and
Humber, can provide both an estimate for regional GVA in 2018 and forecast how this may
change in the future. Table 7-2 shows what this means at headline level for total GVA,
employment (total FTE jobs), and productivity (output per employee) over the 20 years from
2018 to 2038. It compares a baseline scenario (i.e. what is currently forecast as Business-as-
Usual) with a high growth scenario which would close the gap to national average by 2038.
Table 7-2: Forecast GVA, Jobs and Productivity in Yorkshire in baseline and high growth scenarios
Baseline Scenario High Growth Scenario
2018 2025 2030 2038 2018 2025 2030 2038
Total GVA (£ billions)
115.54 127.51 137.29 153.93 115.54 133.84 152.82 196.37
Employment (FTE jobs, millions)
2.14 2.17 2.19 2.21 2.14 2.18 2.23 2.32
Productivity (£/worker)
54,100 58,600 62,700 69,600 54,100 61,400 68,700 84,800
The forecasts show that, under the baseline scenario, Yorkshire’s economy will have grown to
produce GVA of £153.9 billion by 2038, up from £115.5 billion in 2018 (just above the ONS
figure of 112.2 billion for 2016). However, it is the gap between the baseline and high growth
scenarios that is of prime interest for this study. For each measure, this gap indicates the
difference between Yorkshire’s expected performance based on current trends, expectations
and arrangements, and what it would have been achieved at a growth rate high enough to
close the gap to (UK) national average by 2038.
The difference between the baseline and the high growth level is GVA of £42.4 billion by 2038.
The equivalent gap for employment is 130,000 FTE jobs, and for productivity the gap is
£15,200 per worker.33
The question is: How far, if at all might devolution at Yorkshire level help to close these gaps?
The Impact of Yorkshire and Humber devolution on the Productivity Gap
In Section 5 we provided commentary on six different perspectives on the economy: Sectors;
R&D and Innovation; International Trade and Investment; Skills and Ambition; Business Base,
Starts, Deaths, Survivals, and Scale-up; and Transport and Connectivity.
In this Section, we offer estimates of the current ‘gap’ for five of these perspectives. We have
not attempted to model change in industrial structure – in part because attempts to influence
industrial structure are a matter for policy makers, and beyond the scope of this study.
The estimates are provided as an indicative snapshot of the scale of the potential prize to be
gained from Yorkshire-level devolution in different policy domains. The estimates:
Are not forecasts;
Do not take account of change over time; and
Should not be treated as cumulative.
33 Note: further study is required to understand the impact of regional price variation on this gap.

The economic rationale for devolving to Yorkshire | Final Report
25 September 2018 | 68
For each subsection, a summary table sets out:
The nature of the issue/opportunity;
Data on the baseline position;
An outline of why it is a shared issue at the One Yorkshire/regional level;
What might be done collaboratively to address the issue/take the opportunity; and
The added value that may result – where possible an estimated GVA figure is provided,
where this is not possible within the scope of this study an investment gap is provided.
As noted above, the GVA figures involve significant simplifying assumptions and are offered to
provide an estimate of the scale of the gap/potential prize. Given this, we present a range of
uplift figures from cautious to ambitious as a guide to their potential contribution to
narrowing the productivity gap.

The economic rationale for devolving to Yorkshire | Final Report
25 September 2018 | 69
Table 7-3: Potential GVA uplift from improving export performance
Strategic Case - what’s the issue/opportunity?
Data/Baseline How far is it a shared issue across LEP areas?
What could be done better/collaboratively via Yorkshire devolution?
Estimated Added Value (based on extent to which gap to national average is closed)
Cautious 30%
Mid-range 65%
Ambitious 100%
Exports are much lower than UK average per head
Exports are a key area for the health of the UK economy post-Brexit
An increase in the number of firms exporting is likely to boost GVA and not displace economic activity elsewhere in the UK
Yorkshire and Humber’s exports are £16.8bn, 5.1% of the UK total of £328.3bn
Based on its 8.3% of UK population, a proportionate Yorkshire and Humber figure would be £27.3bn
There is a gap of £10.4bn to close
There are no LEP- area data available on exports, only data for Yorkshire and Humber
However, all four LEPs identify exports as a priority
Similar barriers exist in each LEP area, e.g. issues linked to culture, market awareness and access, availability of support, connectivity and logistics
Better use of assets across Yorkshire and Humber (e.g. ports)
Capitalise on Yorkshire brand/profile to raise ambitions and promote exports
More intensive and tailored promotion and support for exporting businesses in Yorkshire and Humber
£3.1bn £6.8bn £10.4bn
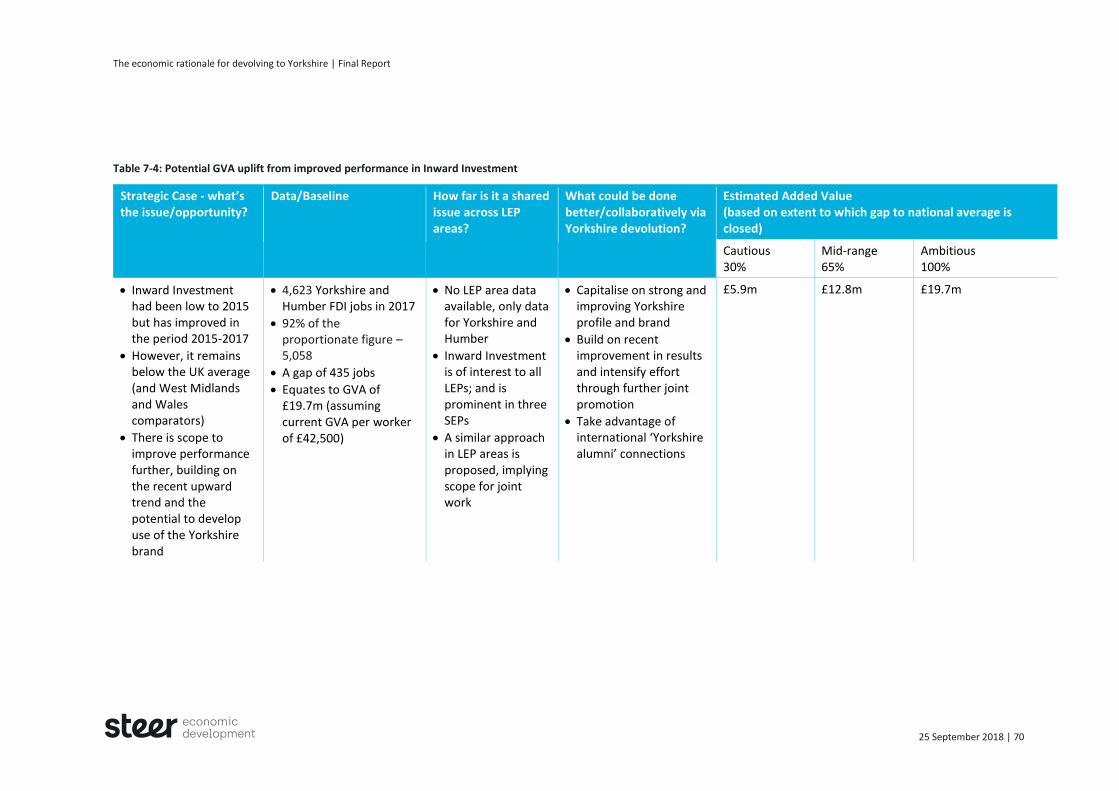
The economic rationale for devolving to Yorkshire | Final Report
25 September 2018 | 70
Table 7-4: Potential GVA uplift from improved performance in Inward Investment
Strategic Case - what’s the issue/opportunity?
Data/Baseline How far is it a shared issue across LEP areas?
What could be done better/collaboratively via Yorkshire devolution?
Estimated Added Value (based on extent to which gap to national average is closed)
Cautious 30%
Mid-range 65%
Ambitious 100%
Inward Investment had been low to 2015 but has improved in the period 2015-2017
However, it remains below the UK average (and West Midlands and Wales comparators)
There is scope to improve performance further, building on the recent upward trend and the potential to develop use of the Yorkshire brand
4,623 Yorkshire and Humber FDI jobs in 2017
92% of the proportionate figure – 5,058
A gap of 435 jobs
Equates to GVA of £19.7m (assuming current GVA per worker of £42,500)
No LEP area data available, only data for Yorkshire and Humber
Inward Investment is of interest to all LEPs; and is prominent in three SEPs
A similar approach in LEP areas is proposed, implying scope for joint work
Capitalise on strong and improving Yorkshire profile and brand
Build on recent improvement in results and intensify effort through further joint promotion
Take advantage of international ‘Yorkshire alumni’ connections
£5.9m £12.8m £19.7m
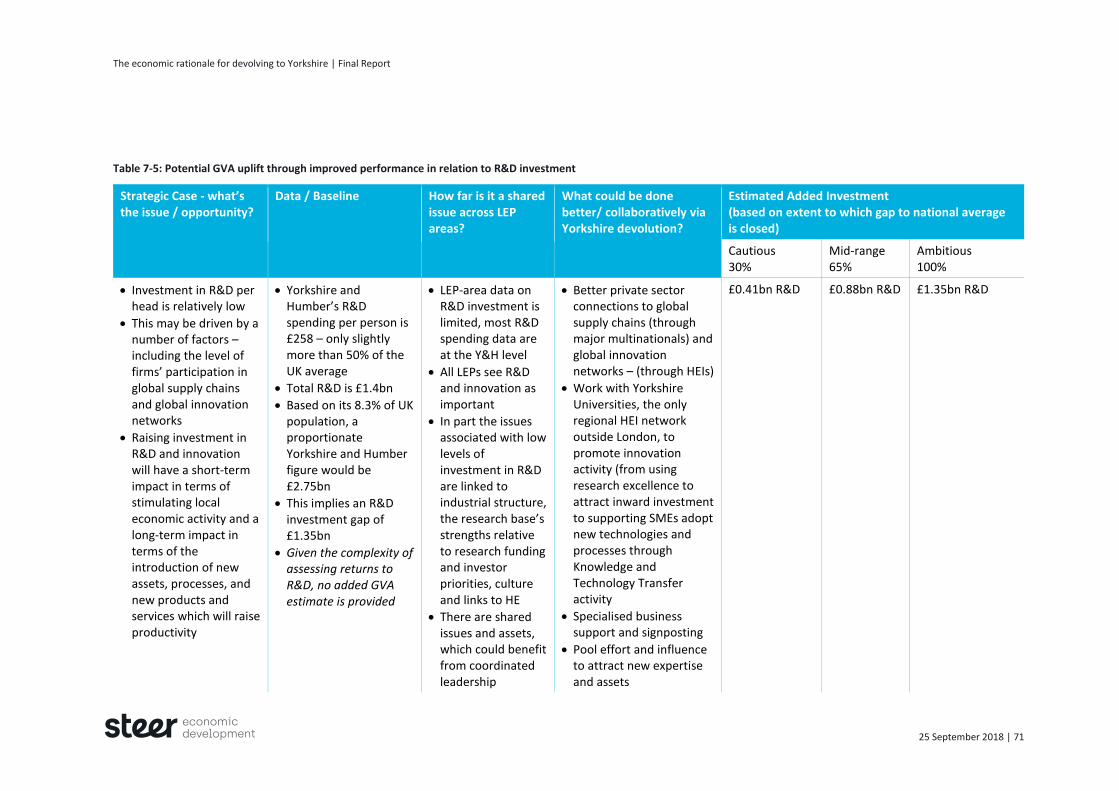
The economic rationale for devolving to Yorkshire | Final Report
25 September 2018 | 71
Table 7-5: Potential GVA uplift through improved performance in relation to R&D investment
Strategic Case - what’s the issue / opportunity?
Data / Baseline How far is it a shared issue across LEP areas?
What could be done better/ collaboratively via Yorkshire devolution?
Estimated Added Investment (based on extent to which gap to national average is closed)
Cautious 30%
Mid-range 65%
Ambitious 100%
Investment in R&D per head is relatively low
This may be driven by a number of factors – including the level of firms’ participation in global supply chains and global innovation networks
Raising investment in R&D and innovation will have a short-term impact in terms of stimulating local economic activity and a long-term impact in terms of the introduction of new assets, processes, and new products and services which will raise productivity
Yorkshire and Humber’s R&D spending per person is £258 – only slightly more than 50% of the UK average
Total R&D is £1.4bn
Based on its 8.3% of UK population, a proportionate Yorkshire and Humber figure would be £2.75bn
This implies an R&D investment gap of £1.35bn
Given the complexity of assessing returns to R&D, no added GVA estimate is provided
LEP-area data on R&D investment is limited, most R&D spending data are at the Y&H level
All LEPs see R&D and innovation as important
In part the issues associated with low levels of investment in R&D are linked to industrial structure, the research base’s strengths relative to research funding and investor priorities, culture and links to HE
There are shared issues and assets, which could benefit from coordinated leadership
Better private sector connections to global supply chains (through major multinationals) and global innovation networks – (through HEIs)
Work with Yorkshire Universities, the only regional HEI network outside London, to promote innovation activity (from using research excellence to attract inward investment to supporting SMEs adopt new technologies and processes through Knowledge and Technology Transfer activity
Specialised business support and signposting
Pool effort and influence to attract new expertise and assets
£0.41bn R&D
£0.88bn R&D
£1.35bn R&D

The economic rationale for devolving to Yorkshire | Final Report
25 September 2018 | 72
Table 7-6: Skills and ambition
Strategic Case - what’s the issue/opportunity?
Data / Baseline How far is it a shared issue across LEP areas?
What could be done better/collaboratively via Yorkshire devolution?
Projected Added NVQ4+ qualifications (based on extent to which gap to national average is closed)
Cautious 30% of gap
Mid-range 65% of gap
Ambitious 100% of gap
Yorkshire and Humber underperforms in relation to the proportion of its workforce qualified to NVQ4+
Higher level skills are
a significant driver of
productivity and
earnings
To close the productivity gap, Yorkshire and Humber needs to raise the proportion of its workforce qualified to NVQ4+
Total Yorkshire and Humber workforce is c. 2.5m with a lower proportion of the workforce with higher level skills
Y&H UK
No
qualifications
7% 2%
NQF Level 1 17% 8%
NQF Level 2 22% 25%
NQF Level 3 20% 23%
NQF Level 4 27% 32%
NQF Level 5 8% 10%
Experian’s Regional Economic Model shows an annual GVA gap of c. £1.56bn
The relatively low proportion of workers qualified to NVQ4+ is a common issue faced in all four LEP areas
Skills are consistently highlighted as a significant issue by businesses
Business consultations indicate lower-level and vocational skills are likely to be best addressed at the local rather than regional level – except where niche specialisms are concerned
While, higher-level skills, requiring more specialised resources, are more likely to generate economies of scale and therefore benefit from pan-Yorkshire leadership and arrangements
£0.46bn £1bn £1.56bn
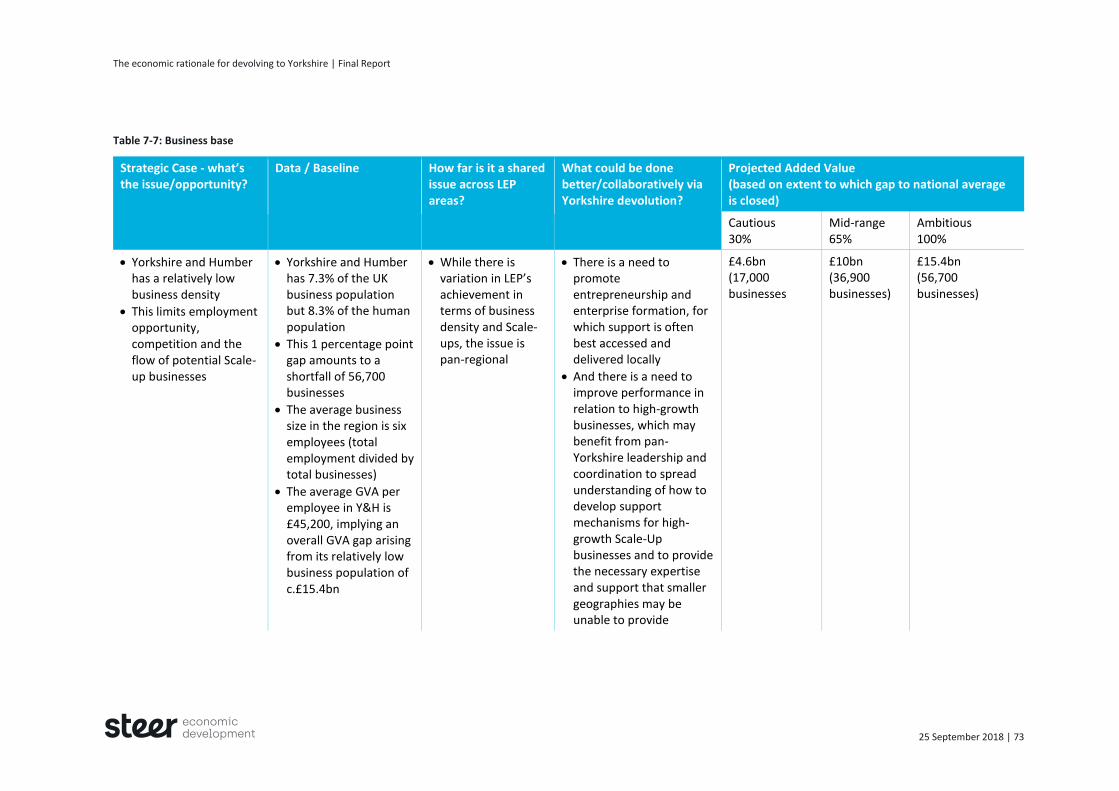
The economic rationale for devolving to Yorkshire | Final Report
25 September 2018 | 73
Table 7-7: Business base
Strategic Case - what’s the issue/opportunity?
Data / Baseline How far is it a shared issue across LEP areas?
What could be done better/collaboratively via Yorkshire devolution?
Projected Added Value (based on extent to which gap to national average is closed)
Cautious 30%
Mid-range 65%
Ambitious 100%
Yorkshire and Humber has a relatively low business density
This limits employment opportunity, competition and the flow of potential Scale-up businesses
Yorkshire and Humber has 7.3% of the UK business population but 8.3% of the human population
This 1 percentage point gap amounts to a shortfall of 56,700 businesses
The average business size in the region is six employees (total employment divided by total businesses)
The average GVA per employee in Y&H is £45,200, implying an overall GVA gap arising from its relatively low business population of c.£15.4bn
While there is variation in LEP’s achievement in terms of business density and Scale-ups, the issue is pan-regional
There is a need to promote entrepreneurship and enterprise formation, for which support is often best accessed and delivered locally
And there is a need to improve performance in relation to high-growth businesses, which may benefit from pan-Yorkshire leadership and coordination to spread understanding of how to develop support mechanisms for high-growth Scale-Up businesses and to provide the necessary expertise and support that smaller geographies may be unable to provide
£4.6bn (17,000 businesses
£10bn (36,900 businesses)
£15.4bn (56,700 businesses)

The economic rationale for devolving to Yorkshire | Final Report
25 September 2018 | 74
Table 7-8:Transport
Strategic Case - what’s the issue/opportunity?
Data / Baseline How far is it a shared issue across LEP areas?
What could be done better/collaboratively via Yorkshire devolution?
Projected Additional transport investment (based on extent to which gap to national average is closed)
Cautious 30%
Mid-range 65%
Ambitious 100%
Businesses consistently highlight transport as a concern and as a barrier to their and the economy’s growth
Efficient labour markets require the right people get to the right job/place-of-work at the right time – there are a number of barriers to this, including inadequate arrangements for cross-LEP/LTA journeys
The region suffers from a significant under-investment which limits partners’ ability to address these issues; especially in local public transport and rail
In 2016/17 total transport spending in England was £23.5bn
In Yorkshire and Humber, it was £1.82bn (7.75%)
If the region had been allocated 8.3% of the budget – in line with its population share – it would have received £1.95bn
IPPR analysis of future transport spending from 2016/17 onwards34 reports a higher England total of £32.7 bn, and a lower Yorkshire and Humber share of £1.05 billion; resulting in a larger gap of £1.66 bn
LEP strategies (and investments) in transport tend to focus on the local transport issues
There is a need for strategic leadership to identify strategic assets and cross-LEP/LTA issues
Strategic leadership and coordination to identify significant roads as part of an intra-regional road network, and simplify/reduce cost for cross-LTA rail journeys
Prioritisation of local public transport and rail in spending decisions, in response to current under-investment
£39m p.a. (or £0.50 billion using IPPR spending pipeline data)
£84.5m p.a. (or £1.08 billion using spending pipeline data)
£130m p.a. (or £1.66 billion using pipeline data)
34 https://www.theguardian.com/uk-news/2017/feb/20/more-than-half-uk-investment-in-transport-is-in-london-says-study

The economic rationale for devolving to Yorkshire | Final Report
25 September 2018 | 75
Conclusions and observations
Given the above, we offer the following conclusions and observations:
Our analysis covers gaps in GVA outcomes in some policy domains, e.g., exports and
inward investment, and spending gaps, for those areas for which it has not been possible
to estimate long-term GVA impact, e.g., transport;
Whether measured in terms of GVA or spending, there are significant gaps to close in
each of the five policy domains;
But where estimates of the potential GVA impact from improved leadership and
coordination at the level of Yorkshire can be made the sums involved are potentially very
large:
– Improvements in the business base and scale-ups, based on an increase in the
number of businesses) and employees with average productivity), could contribute
£5bn-£15bn;
– Improvements in export performance could contribute £3bn- £10bn;
– Improvements in skills and qualifications could contribute £0.46-£12.56bn;
Furthermore, while the GVA impact of improved performance in relation to transport and
R&D and Innovation has not been estimated, it is clear that they would make a significant
positive long-term contribution to economic performance;
The above figures are based on the assumption that significant devolved powers and
budgets are achieved that lead to additional investment, and that policy areas highlighted
above are prioritised. If this is done, then the potential GVA uplift could deliver a
significant reduction in the current GVA gap between Yorkshire and UK average.
What further study is required?
Further study is required in the following areas:
The likely return on transport investment in GVA terms and the impact of this on the
productivity gap, once specific proposals are available;
Fuller and more detailed analysis of all the policy areas and perspectives considered,
including their interrelationships with each other, the timeframes for their impacts to be
felt, and the detail of the actions needed to take them forward;
Analysis of how improvements in GVA and productivity would correlate to wider goals
such as on employment, incomes, and inclusive growth, as well as wider social and
environmental impacts; and
Analysis of how application of interventions and impacts may vary in different
areas/districts.

The economic rationale for devolving to Yorkshire | Final Report
25 September 2018 | 76
Table 8-1 provides a summary of our conclusions in relation to the main research questions.
These conclusions are intentionally focused on exploring how far there is an economic case for
devolution at Yorkshire level and the dividends that may flow from greater devolution.
The study’s findings do not present an all or nothing case for which activities may be best led
through Yorkshire-level devolution; the picture is more complex than that. Some activities and
policy areas are best led and delivered at a local level (especially those that need to be close to
communities and businesses, such as employment support, the more basic skills, social
inclusion, and local regeneration and physical development), while others (specifically
strategic transport issues) are best covered at Northern level. However, in a significant
number of other policy areas our conclusion is that there are potentially considerable
advantages from devolution to the Yorkshire level. These are often higher-level economic
functions such as innovation, exports and international business, high-level skills, specialised
aspects of business support to enable scale ups, and specific elements of transport such as
ports and public transport ticketing. The economic benefits of these are hard to measure
precisely, but scenario-based estimates grounded in logic chain rationales and data analysis
suggest that these could be very sizeable, and of a scale to significantly reduce or even close
the GVA gap between Yorkshire and the UK average over the long term.
8 Conclusions
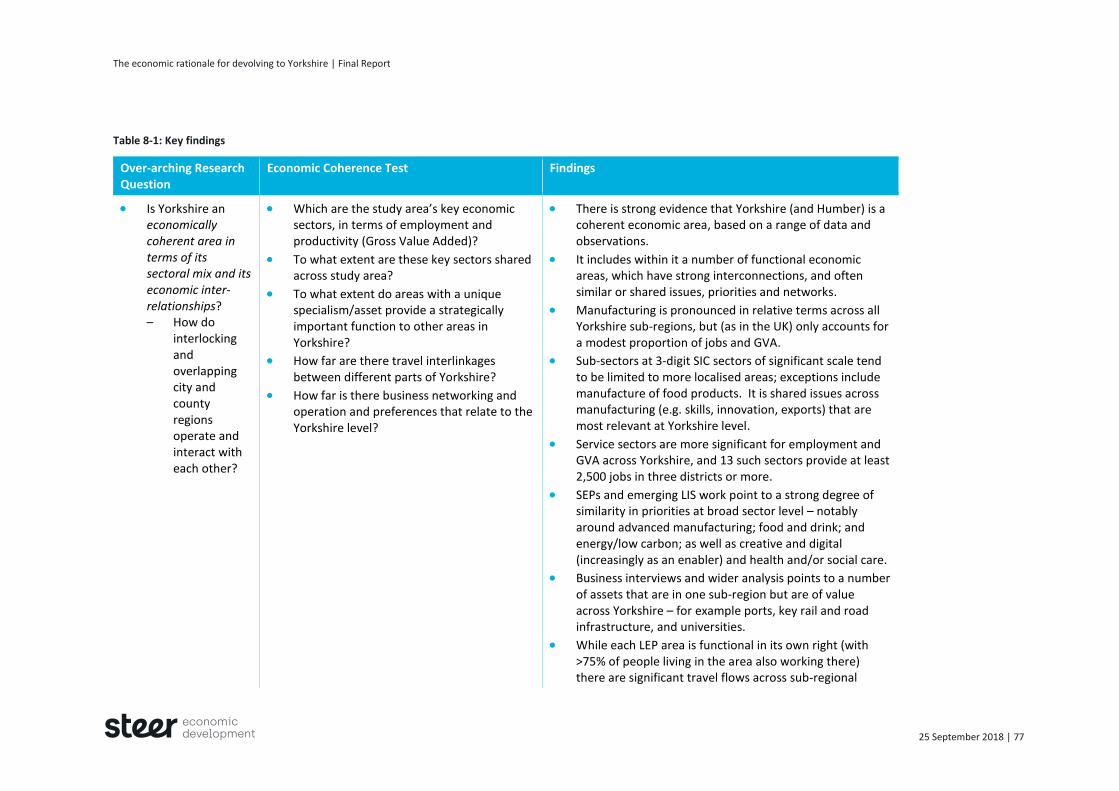
The economic rationale for devolving to Yorkshire | Final Report
25 September 2018 | 77
Table 8-1: Key findings
Over-arching Research Question
Economic Coherence Test Findings
Is Yorkshire an economically coherent area in terms of its sectoral mix and its economic inter-relationships? – How do
interlocking and overlapping city and county regions operate and interact with each other?
Which are the study area’s key economic sectors, in terms of employment and productivity (Gross Value Added)?
To what extent are these key sectors shared across study area?
To what extent do areas with a unique specialism/asset provide a strategically important function to other areas in Yorkshire?
How far are there travel interlinkages between different parts of Yorkshire?
How far is there business networking and operation and preferences that relate to the Yorkshire level?
There is strong evidence that Yorkshire (and Humber) is a coherent economic area, based on a range of data and observations.
It includes within it a number of functional economic areas, which have strong interconnections, and often similar or shared issues, priorities and networks.
Manufacturing is pronounced in relative terms across all Yorkshire sub-regions, but (as in the UK) only accounts for a modest proportion of jobs and GVA.
Sub-sectors at 3-digit SIC sectors of significant scale tend to be limited to more localised areas; exceptions include manufacture of food products. It is shared issues across manufacturing (e.g. skills, innovation, exports) that are most relevant at Yorkshire level.
Service sectors are more significant for employment and GVA across Yorkshire, and 13 such sectors provide at least 2,500 jobs in three districts or more.
SEPs and emerging LIS work point to a strong degree of similarity in priorities at broad sector level – notably around advanced manufacturing; food and drink; and energy/low carbon; as well as creative and digital (increasingly as an enabler) and health and/or social care.
Business interviews and wider analysis points to a number of assets that are in one sub-region but are of value across Yorkshire – for example ports, key rail and road infrastructure, and universities.
While each LEP area is functional in its own right (with >75% of people living in the area also working there) there are significant travel flows across sub-regional

The economic rationale for devolving to Yorkshire | Final Report
25 September 2018 | 78
Over-arching Research Question
Economic Coherence Test Findings
boundaries, for example from Harrogate, Craven, Selby and York into West Yorkshire.
Businesses (and citizens) readily identify with the Yorkshire level, and more so than in other English Counties. Sizeable business networks, and business representative organisations operate at Yorkshire level, as do HE networks, and many businesses feel that Yorkshire identity is an asset.
Is the Yorkshire level capable of maximising the opportunities and benefits of devolution for all its people and businesses?
Which are the key opportunities to support sustainable employment and wealth creation in Yorkshire? – To what extent are these growth
opportunities shared across Yorkshire? – To what extent are these growth
opportunities specific to a single geography?
Which are the key challenges and threats to sustainable employment and wealth creation in Yorkshire? – To what extent are these threats
shared across Yorkshire? – To what extent are these threats
limited to a specific geography? – How do these threats relate to the
wider Northern Powerhouse?
Are there untapped resources, which could be better utilised at the level of the study area, e.g. through more effective use of information and coordination of activity?
Our review of SEPs and emerging Local Industrial Strategy priorities in the four LEP areas found similar overall priorities. All cover productivity, business growth and support, skills (and employment), and infrastructure.
There are locally distinctive (but complementary) variations in visions and emphases (e.g. good/inclusive growth, Energy Estuary, a bigger private sector, the best place to grow a small business).
Similar challenges are identified in the majority of LEP areas: raising GVA, productivity and the size/strength of the business base; more and better paid jobs; better broadband; and reducing flood risk were all noted by three or more LEPs.
Key assets and strengths brought out in LEP areas tend to be more locally specific and distinctive – e.g. the Humber Estuary, research Centres of Excellence or major investments. There is potential to enhance the economic impact of strategic assets across a wider geography through better coordination of plans and investments.
Some of these threats and opportunities are also issues across the North (or the UK) but most (except transport
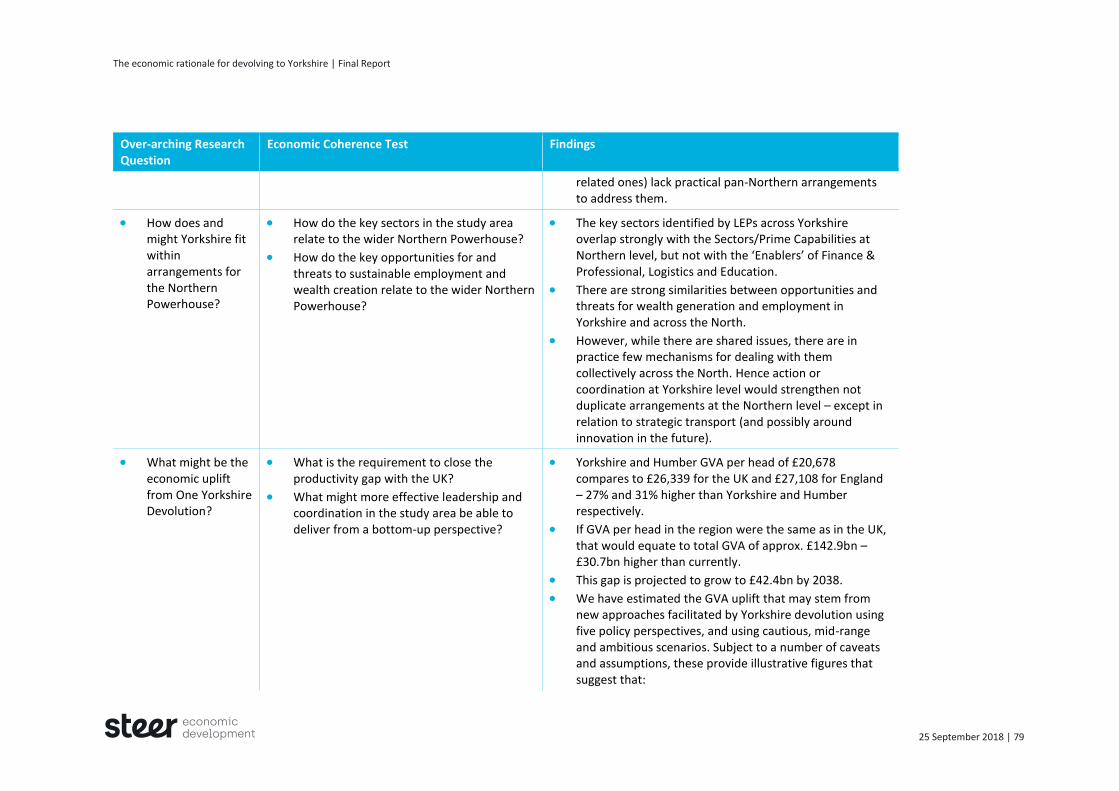
The economic rationale for devolving to Yorkshire | Final Report
25 September 2018 | 79
Over-arching Research Question
Economic Coherence Test Findings
related ones) lack practical pan-Northern arrangements to address them.
How does and might Yorkshire fit within arrangements for the Northern Powerhouse?
How do the key sectors in the study area relate to the wider Northern Powerhouse?
How do the key opportunities for and threats to sustainable employment and wealth creation relate to the wider Northern Powerhouse?
The key sectors identified by LEPs across Yorkshire overlap strongly with the Sectors/Prime Capabilities at Northern level, but not with the ‘Enablers’ of Finance & Professional, Logistics and Education.
There are strong similarities between opportunities and threats for wealth generation and employment in Yorkshire and across the North.
However, while there are shared issues, there are in practice few mechanisms for dealing with them collectively across the North. Hence action or coordination at Yorkshire level would strengthen not duplicate arrangements at the Northern level – except in relation to strategic transport (and possibly around innovation in the future).
What might be the economic uplift from One Yorkshire Devolution?
What is the requirement to close the productivity gap with the UK?
What might more effective leadership and coordination in the study area be able to deliver from a bottom-up perspective?
Yorkshire and Humber GVA per head of £20,678 compares to £26,339 for the UK and £27,108 for England – 27% and 31% higher than Yorkshire and Humber respectively.
If GVA per head in the region were the same as in the UK, that would equate to total GVA of approx. £142.9bn – £30.7bn higher than currently.
This gap is projected to grow to £42.4bn by 2038.
We have estimated the GVA uplift that may stem from new approaches facilitated by Yorkshire devolution using five policy perspectives, and using cautious, mid-range and ambitious scenarios. Subject to a number of caveats and assumptions, these provide illustrative figures that suggest that:

The economic rationale for devolving to Yorkshire | Final Report
25 September 2018 | 80
Over-arching Research Question
Economic Coherence Test Findings
– Uplift in exports value equivalent to GVA of £3.1bn-£10.4bn;
– Uplift in inward investment jobs equivalent to GVA of £5.9m-£19.7m;
– Uplift on skills equivalent to GVA of £0.46bn-£1.56bn;
– Uplift in business base equivalent to GVA of ££4.6bn-£15.4bn;
– Uplift in in R&D investment to the value of £0.4bn-£1.35bn, with long-term GVA benefits; and
– Uplift in transport investment to the value of £39m-£130m (using latest year’s data) or £0.5bn-£1.66bn (using future spend pipeline data), with long-term GVA benefits.
These figures cannot all simply be added together to produce a total because of interrelationships and double-counting risks.
However, depending on levels of ambition and activity an illustrative total uplift could be in the region of £9bn to £30bn a year, over a 20-year timeframe and subject to devolution leading to additional investment, and the key policy areas above being prioritised and actioned accordingly and effectively. This amounts to £1,600-£5,400 a head.
Is there a case to establish a directly-elected Mayor (as enabled under the Cities and Local Government
Are there sufficient economies of scale – based on similarities in economic structure – to support devolved arrangements to the study area?
Are there sufficient economies of scope – based on differences in economic structure
There are considerable similarities in economic structure across most of the Yorkshire area on indicators around the business base (starts, survival rates, etc.), productivity, employment, and (as far as the available data reveal) on innovation and exporting. The main exception is much of North Yorkshire where (apart from in hotspots such as Scarborough) employment and skills

The economic rationale for devolving to Yorkshire | Final Report
25 September 2018 | 81
Over-arching Research Question
Economic Coherence Test Findings
Devolution Act 2016)? – What is the
economic case for devolving statutory economic, social and environmental powers and funding streams?
– to support the case for devolved arrangements to the study area?
Is there sufficient difference between the study area’s economic structure and that of the national economy to warrant devolved governance arrangements?
Are there significant barriers to the coordination of economic development activity at the level of the study area to warrant devolved governance arrangements?
statistics in particular are healthier than in the rest of Yorkshire. However, North Yorkshire still shares many of the same challenges around GVA growth, business productivity and median incomes. Hence as similar challenges, opportunities and approaches are often in place, there are potential economies of scale in coordinating some (but not all) of those at Yorkshire level.
Our findings on sectors also make clear that there are shared areas of interest, especially around energy and food and drink in SEPs, but also niche strengths in local areas and sub-regions at subsector level.
Economies of scope exist, especially in terms of the diverse economic geography at Yorkshire level, which combines large cities and urban centres (for example n West Yorkshire, South Yorkshire and Hull) with extensive rural and coastal areas in North Yorkshire and parts of the Humber, as well as a spread of economic, cultural and natural capital assets. The combination of these varied economic geographies will support economic resilience and can be presented and connected to present a rounded offer that assists in attracting investment, skills and tourism.
Data for the study area overall show it to be markedly different to the UK economy overall. In particular, it faces greater challenges on a suite of economic indicators including on business growth and productivity, exports, innovation, employment and skills. Its sectoral mix is also different, with a deficit in areas such as information and communications and professional services, and a greater emphasis on sectors such as manufacturing, distribution, education and care.

The economic rationale for devolving to Yorkshire | Final Report
25 September 2018 | 82
Over-arching Research Question
Economic Coherence Test Findings
Some limited coordination of economic development activity currently takes place. But SEPs generally make little reference to one another, and administrative and bureaucratic barriers mean that projects and activities are generally limited to a single LEP area, even where there may be economies of scale or greater impact from a more coordinated approach. The main exception is around the visitor economy and major events where Welcome to Yorkshire has provided a successful vehicle for coordination at regional scale and achieved considerable success.

The economic rationale for devolving to Yorkshire | Final Report
25 September 2018 | 83

The economic rationale for devolving to Yorkshire | Final Report
25 September 2018 | 84
A Appendices

The economic rationale for devolving to Yorkshire | Final Report
25 September 2018 | 85
Appendix A: Review of Strategic Economic Plans
Aspect Humber Leeds City Region Sheffield City Region YNYER Key points across SEPs
Overall priorities – themes, objectives, etc.
Ambition focused on the Energy Estuary and Vision is in 3 parts covering: -Economy (focus on renewables), - Skills (raised and better aligned to economy) -Place (visitor economy/ culture, infrastructure & housing, sites and flood risk) Five Strategic Enablers: - Infrastructure that Supports Growth - Supporting Businesses to Succeed - Skilled and Productive Workforce - Flood Risk and Environmental Management
Vision focuses on good growth delivering prosperity, jobs and quality of life for all Four priorities: -Growing business -Skilled people, good jobs - Clean energy & environment - Infrastructure for growth
Vision: a stronger and bigger private sector that can compete in national and global markets Six thematic priorities: -increase no. of start ups -Facilitate/support growth of existing firms -Attract investment -Promote business global trade opportunities -Develop skills, labour mobility and education -Secure investment in infrastructure
Vision (2013 SEP): best place in England to grow a small business, combining a quality business location with great quality of life Targets on jobs, GVA and house building, plus median wages gap and productivity gap Five priorities: -Successful businesses -Global leader in agri-food and bio-economy - Inspired people - Successful and distinctive places -Well connected economy
Overall – cover largely similar themes and objectives, if with some local variations Visions have different emphasis but are not contradictory and have scope to add up to a complementary offer The same three themes of business, skills and infrastructure are prominent in all four areas Energy and Environment/low carbon (potentially linked to Bioeconomy), and place are prominent in 2-3 areas.
Evidence - Key points & challenges
Focus on potential of the Energy Estuary, as well as wider sector strengths. Mostly rural and coastal. Notes skills/education improvements and
Some excellent assets, rising FDI, sectors with growth potential and fit with northern strengths, and WY+ Transport Fund …but challenges on:
Sector ‘design, develop and distribute’ strengths identified including several research centres/ centres of excellence such as AMRC
Opportunities/assets include agri-food and Biorenewables/ Bioscience; potash and energy investment; high skill levels; strong business base; high speed rail; and
Overall, broadly similar challenges are identified in the majority of LEP areas. Raising GVA, productivity and the size and strength of the business base, the need for more and better paid jobs, better broadband and

The economic rationale for devolving to Yorkshire | Final Report
25 September 2018 | 86
Aspect Humber Leeds City Region Sheffield City Region YNYER Key points across SEPs
But identifies barriers/ challenges on: No. with no qualifications plus low higher-level skills Unemployment, esp. in Hull, NEL, and the coast Business survival/growth Fragmented business support and low take up High flood risks Variable broadband/ICT GVA growth below regional/national average
GVA growth not fast enough to close gaps Productivity + drivers of Low innovation despite high HE presence Low businesses per capita Skills rising but gaps growing esp. higher level Employment rising but underemployment Earnings gaps and ‘missing middle’ Increasing flood risks Variable broadband speeds Need to raise exports Housing supply rising slower than population Road congestion and rail connectivity
Identifies four major challenges/targets: More jobs - 70,000 to close gap to average More businesses - 6,000 to close gap to average More higher-skilled occupations – 30,000 Higher productivity - £3 billion+ rise in GVA to narrow productivity gap
rural/coastal quality of life offer. …but challenges on: Areas of deprivation and weak market demand on the coast Post Brexit business uncertainty Median wages below average + skew towards lower paid sectors Risks to energy businesses from national policy Housing affordability and low house building Flood risks broadband connections – esp. for rural SMEs East-west connectivity between our towns and neighbouring cities
reducing flood risk were all noted by 3 or more LEPs Challenges noted by 2 LEPs include transport, housing, low median income. Exports, energy, innovation and post-Brexit are noted once each. The challenges that are brought out in each SEP are not comprehensive, so it is likely that more areas will share an issue than may mention it (e.g. innovation). The key assets and strengths brought out in LEP areas tend to be more locally specific and distinctive – e.g. the Humber Estuary, Research Centres of Excellence or major investments.
Sector priorities Energy Estuary (renewables and decarbonisation) as an overall sector priority Other important sectors: Ports & logistics
Innovative manufacturing Financial & prof services Health & life sciences Low carbon & environmental industries Digital & creative Food & drink
SEP sector content based on IER which identified 5 key ones: Financial, professional & business services Creative & digital
Agri-food and Bioeconomy (Biorenewables and Bioscience) singled out as a distinctive sector
Overall, shared core sectors in 3 of the 4 areas, with more locally specific approaches more evident in addition in the Humber and YNYER Crossover in LCR. SCR and the Humber for the 3 sectors of

The economic rationale for devolving to Yorkshire | Final Report
25 September 2018 | 87
Aspect Humber Leeds City Region Sheffield City Region YNYER Key points across SEPs
Engineering & manufacturing Chemicals (and process) Creative & digital Food Visitor economy
Advanced manufacture, engineering and healthcare technologies Low carbon Logistics
manufacturing/ engineering; creative & digital and energy/low carbon. That rises to all 4 for the latter if bio-economy included, and food and drink is also in 3 areas if Agrifood is included. YNYER notable in having a distinctive approach with just two interrelated sectors. Humber also distinctive in its overall focus on energy, and in 2 other distinctive sectors (ports; chemicals/process)
Business support and enterprise – priorities and approach
coordinated, universal business support and signposting offer (via Growth Hub) Build the growth capabilities of SMEs (inc. access to finance and workspace) Entrepreneurial culture and new enterprises Increase innovation in local businesses Targeted support to businesses in key sectors (inc. supply chains, inward investment) Export support
Business Growth Hub (LEP Growth Service) Innovation Access to finance Digital Supply chain development Enterprise Trade & investment Resource efficient businesses
SCR Growth Hub at the core of business support New business start-up support including Information, advice and support -SCR Start-up Zone - Enterprise culture and pre-start engagement - Intellectual knowledge Support existing firms’ growth through: -Access to finance -Innovation boost - Growth deals
Help new businesses get off the ground Help established SMEs to be more successful Help growth minded businesses to achieve their ambitions (e.g. access to finance, innovation, leadership & management skills, supply chains, staff recruitment and development.) Establish ‘How’s Business’ access point to business support
Similar models in all areas, with a Growth Hub or equivalent at the heart, and a range of support for new and existing businesses, many aspects of which are common Helping foster/support new starts; access to finance and innovation are noted in all 4 Other aspects frequently cited are supply chains (3), exports and investment (3) Aspects such as skills, premises and digital are

The economic rationale for devolving to Yorkshire | Final Report
25 September 2018 | 88
Aspect Humber Leeds City Region Sheffield City Region YNYER Key points across SEPs
[NB – separate SEP priorities are dedicated to trade and investment]
noted under business support in some SEPs and covered elsewhere in others Distinctive elements include leadership & management in YNYER and resource efficiency in LCR.
Innovation – priorities and approach
Innovation low key in 2014 SEP, within the strategic enabler on ‘Supporting businesses to succeed’ Four actions based on: -Research collaboration in priority sectors -Business-to-business collaboration on new products & services -New forms of innovation infrastructure and finance -Investment in new technologies SEP Review notes innovation was low key in the SEP, with a draft Innovation Strategy the basis for future Humber work. Current position of that uncertain, but a strong energy focus.
SEP innovation strand has four actions based on: High quality innovation products and services Role of universities SIAs - focus on MedTech and bio-science Work with Innovate UK - funding for local firms Also: Digital and tech runs across SEP 2014 Innovation strategy (but dated)
Innovation not explicit within 2015-25 SEP headlines or objectives but included in a priority on promoting growth in existing firms ‘Innovation Boost’ project to promote growth in existing firms Some high-profile innovation assets – AMRC, Nuclear AMRC, Medical AMRC – manufacture, health and energy to the fore, also food and computing
Innovation within SEP Priority on Profitable & Successful Businesses’ but not prominent Innovation also noted in relation to Agri-food & Bioeconomy
Overall, innovation is less prominent in SEPs than in North West and North East – but most or all LEPs now recognise this and are looking to strengthen innovation Yorkshire Universities brings region’s HE together, engages with LEPs and is an innovation asset. HE sector sees value of working at the Yorkshire level Opportunities for complementarity and stronger joint offer around sector innovation and assets – esp. on manufacture, health, energy and also food and digital
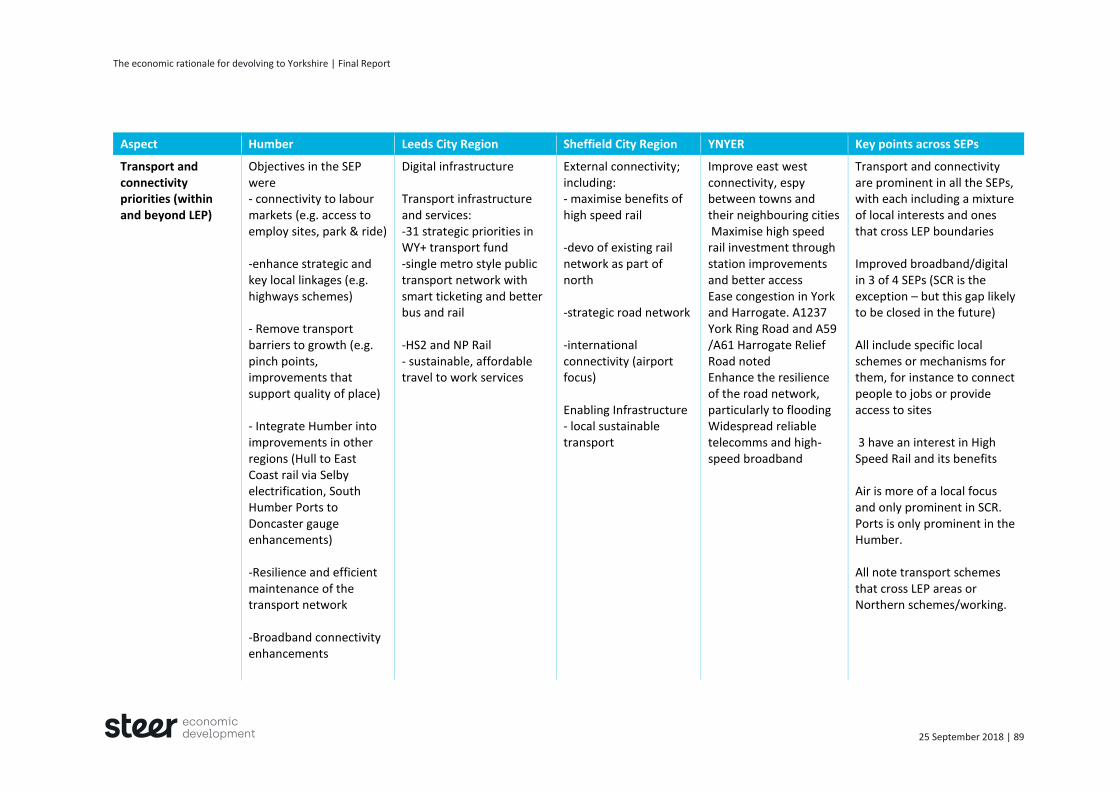
The economic rationale for devolving to Yorkshire | Final Report
25 September 2018 | 89
Aspect Humber Leeds City Region Sheffield City Region YNYER Key points across SEPs
Transport and connectivity priorities (within and beyond LEP)
Objectives in the SEP were - connectivity to labour markets (e.g. access to employ sites, park & ride) -enhance strategic and key local linkages (e.g. highways schemes) - Remove transport barriers to growth (e.g. pinch points, improvements that support quality of place) - Integrate Humber into improvements in other regions (Hull to East Coast rail via Selby electrification, South Humber Ports to Doncaster gauge enhancements) -Resilience and efficient maintenance of the transport network -Broadband connectivity enhancements
Digital infrastructure Transport infrastructure and services: -31 strategic priorities in WY+ transport fund -single metro style public transport network with smart ticketing and better bus and rail -HS2 and NP Rail - sustainable, affordable travel to work services
External connectivity; including: - maximise benefits of high speed rail -devo of existing rail network as part of north -strategic road network -international connectivity (airport focus) Enabling Infrastructure - local sustainable transport
Improve east west connectivity, espy between towns and their neighbouring cities Maximise high speed rail investment through station improvements and better access Ease congestion in York and Harrogate. A1237 York Ring Road and A59 /A61 Harrogate Relief Road noted Enhance the resilience of the road network, particularly to flooding Widespread reliable telecomms and high-speed broadband
Transport and connectivity are prominent in all the SEPs, with each including a mixture of local interests and ones that cross LEP boundaries Improved broadband/digital in 3 of 4 SEPs (SCR is the exception – but this gap likely to be closed in the future) All include specific local schemes or mechanisms for them, for instance to connect people to jobs or provide access to sites 3 have an interest in High Speed Rail and its benefits Air is more of a local focus and only prominent in SCR. Ports is only prominent in the Humber. All note transport schemes that cross LEP areas or Northern schemes/working.

The economic rationale for devolving to Yorkshire | Final Report
25 September 2018 | 90
Aspect Humber Leeds City Region Sheffield City Region YNYER Key points across SEPs
SEP review notes priority ones that still need approval/resources as: - A63 from M62-Port of Hull -Hull-Selby electrification
Other Infrastructure priorities – e.g. sites, housing, energy and environment
Energy Estuary and Clean Growth an overall focus Create the right conditions for business growth (supply of sites and premises, EZs, etc.) Housing quality, volume affordability, resilience etc flood protection and climate adaptation regenerate, transform and reposition neighbourhoods SEP review clear that future Humber LEP housing growth proposals will focus on Hull (to avoid duplication with YNYER and Greater Lincs elsewhere)
Integrated Spatial Priority Areas: -Urban Growth Centres -Housing Growth Areas -Employment Growth Areas Integrated flood prevention New energy generation Energy efficiency and empowering consumers Green infrastructure
Transformational city region schemes – inc. delivery of 14,000 homes and process based mechanisms Enabling Infrastructure – increasing housing delivery
Housing affordability and unlock the housing growth the area needs Fast-track employment sites with market demand for high value sector growth – sites including York Central Enable sustainable rural economies – rural and quality of life is important and linked to cities Flood risk raised as an issue, e.g. risks to infrastructure Energy – noted as an energy powerhouse - Drax and Eggborough, plus bio and one of the world’s largest wind farms offshore
Strong degree of similarity - housing and employment/ business sites (e.g. EZs) are in all 4 SEPs, and quality places, energy, and flood protection are in in 3 (SCR is the exception for each) Most EZs and sites are local, but a good number are in dual LEP areas (e.g. York, Selby, Barnsley) Housing growth is important in all areas, and most area also interested in quality and affordability Green infrastructure and/or environmental management is included in 2 SEPs, with links made to flood protection and catchments approach – which crosses LEP areas.

The economic rationale for devolving to Yorkshire | Final Report
25 September 2018 | 91
Aspect Humber Leeds City Region Sheffield City Region YNYER Key points across SEPs
Culture/ leisure/ tourism approach
‘A great place to live and visit’ one of 5 strategic enablers in SEP Clear on value of a distinctive cultural, leisure & visitor offer, linked to Hull UK City of Culture 2017
Not explicitly covered in priorities or actions Some reference in good growth narrative Box on ‘Visitor Economy, Culture and Quality of Place’ notes that some work on culture/tourism is best done at Yorkshire level New work on culture and LIS moving forward
Passing reference to city region attractive cultural offer and quality of life No Yorkshire level SEP reference, LIS position uncertain
Narrative and vision stress quality of place/ life and cultural offer, plus links to tourism – although not a priority in itself Yorkshire level not explicit in SEP, but since fed in as part of culture study in 2017 and in current SEP/LIS thinking
Culture, quality of place/life and tourism feature in most SEPs to some but not usually great extent. Strongest in the Humber, then in YNYER This element is becoming more prominent and work was completed on it in LCR late 2017, including YNYER input and links to the Yorkshire level Opportunity to present a stronger shared culture and quality of place offer at Yorkshire level Case for this made in terms of attracting skills, investment, tourism, etc.
Trade and inward investment
Growing international trade and exports and promoting investment from foreign and indigenous firms is included as an action within business support section. Trade and investment also connected to sectors and energy estuary
An action under ‘Growing Businesses’ and includes: Integrated City Region approach to trade and investment Targeted investment through unique propositions in financial and professional services, health, digital and manufacturing
Inward Investment focus: -Inward investor support - The inward investment product - Improving our reach Trade and exports focus:
Relatively little content on trade and investment support for export is covered in the detail of business support Export potential and internationalisation covered in relation to agri-food and Bioeconomy
Overall, a very similar approach in all areas - which promotes trade (esp. exports), international business and inward investment It is mainly the level of emphasis and subtleties of detail that vary rather than the overall direction.

The economic rationale for devolving to Yorkshire | Final Report
25 September 2018 | 92
Aspect Humber Leeds City Region Sheffield City Region YNYER Key points across SEPs
Improve export performance, including through simplified and joined up support Explore opportunity for a UKTI Taskforce for the Northern Powerhouse [Also, a separate Trade & Investment strategy]
-Developing export potential -Export challenge -Harnessing export growth -Proactively targeting high growth markets
Points to opportunities for a collaborative approach which may have greater scale and impact, be more efficient, and able to utilise Yorkshire as a better brand/identity in many markets (if with potential exceptions).
Skills and employment – challenges/priorities
Employer investment in skills at all levels (inc. Humber Skills Fund for employers to upskill and Apprenticeship Hub) Inclusive, LEP-wide approach with key stakeholders (inc. an Energy Campus and UTC) Influence provision to meet local economic need (inc. business-education links, employability charter, sector academies) Improve LMI and IAG to support informed choices.
Headline ambitions on: NEETs Higher level skills 5 Priority action areas: More and better apprenticeships Great education, connected to business Employability, access to jobs, realising potential Building workforce skills and attracting talent Addressing skills gaps and shortages
Theme on skills, labour and education includes: -Skills Bank (a single training fund) -Progress to work (employability programme) -Learn to work (focused on education-business links and curriculum) -Invest in excellent facilities (including FE facilities and centres for glass, rail and nuclear)
Employability of young people and attract/ keep talented young people in our area – inc. apprenticeships, graduate retention and business-education links/IAG Develop local workforce – focus on priority sectors. Develop strong communities and build skills, attitude and ambition to help people access jobs – linked to coastal/rural regen and enterprise skills Investment in skills infrastructure - bring college infrastructure to a high standard plus investments pipeline
Skills is a key issue everywhere and there is high consistency in the action areas proposed Core aspects in all LEP areas include apprenticeships, employability, business skills needs (e.g. upskilling workforce, sector needs and skills shortages), and education-business links and related IAG, and skills capital investments Other skills issues cited less often include enterprise skills (2 areas), raising employer demand for skills (1 area), attracting talent (2 areas), ambition (1 area)

The economic rationale for devolving to Yorkshire | Final Report
25 September 2018 | 93
Aspect Humber Leeds City Region Sheffield City Region YNYER Key points across SEPs
Support people in finding/sustaining employment, progressing, or setting up enterprises Develop excellent learning environments (specific skills capital projects)
Also: ‘Stimulate market demand on the coast’ – inc. supply chain opportunities from big investments and place-based regeneration
3 areas have a similar skills profile, with YNYER the outlier with above average skills. While it has some distinctive points (e.g. on ambition, talent and coastal employment) it still shares core issues with other areas. LCR has a distinctive ‘more jobs, better jobs’ strand
Other Themes (not covered under the headings above)
Energy Estuary and Clean Growth run through Environmental management Sustainable development
Good Growth focus – combining economic growth, inclusion and quality of place /environmental goals
Focus on a stronger, larger private sector as the golden thread Social inclusion is a cross cutting theme Low Carbon as a cross cutting theme
Rural/coastal concerns and opportunities Food/Energy covered under sectors and other infrastructure
Each SEP has a at least one additional theme that is usually quite distinctive, and often linked to the Vision In Humber this is the Energy Estuary, in LCR it is Good Growth, in SCR it is a bigger, stronger private sector, and in YNYER it is rural/coastal economy and quality of life. Social Inclusion and Environment/Low Carbon also feature in some SEPs. Distinctive themes are sometimes focused on place specific geography, but are not contradictory.
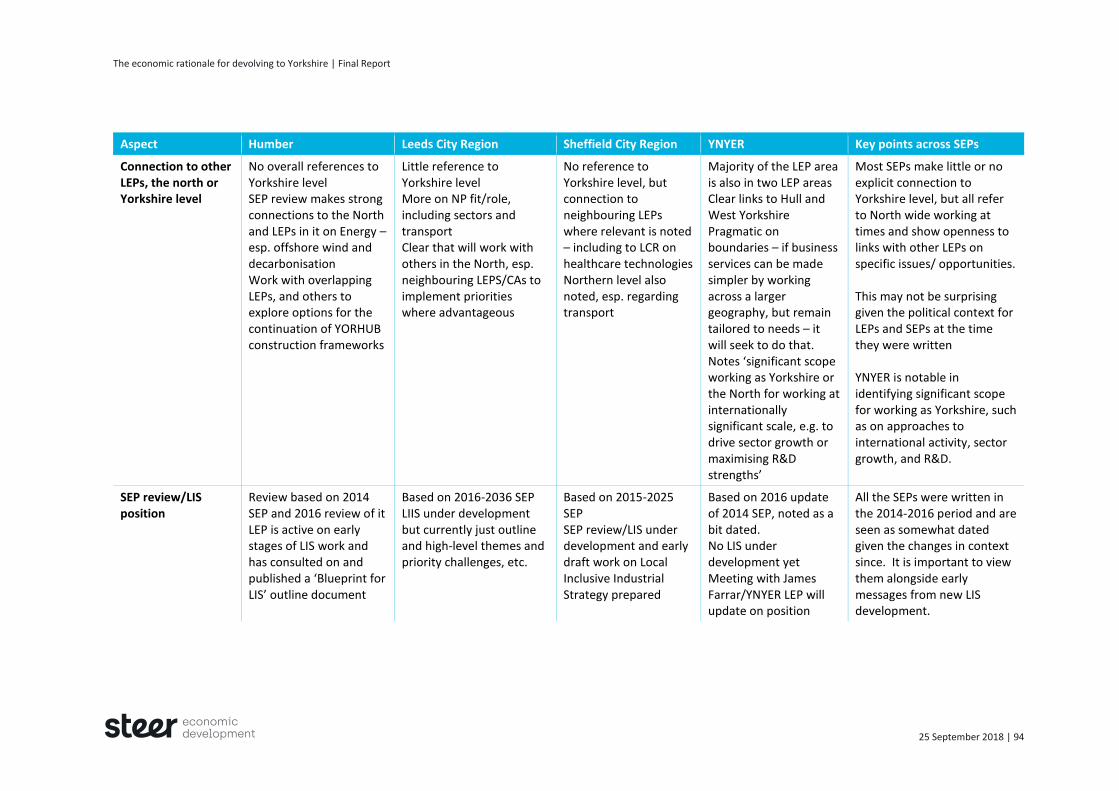
The economic rationale for devolving to Yorkshire | Final Report
25 September 2018 | 94
Aspect Humber Leeds City Region Sheffield City Region YNYER Key points across SEPs
Connection to other LEPs, the north or Yorkshire level
No overall references to Yorkshire level SEP review makes strong connections to the North and LEPs in it on Energy – esp. offshore wind and decarbonisation Work with overlapping LEPs, and others to explore options for the continuation of YORHUB construction frameworks
Little reference to Yorkshire level More on NP fit/role, including sectors and transport Clear that will work with others in the North, esp. neighbouring LEPS/CAs to implement priorities where advantageous
No reference to Yorkshire level, but connection to neighbouring LEPs where relevant is noted – including to LCR on healthcare technologies Northern level also noted, esp. regarding transport
Majority of the LEP area is also in two LEP areas Clear links to Hull and West Yorkshire Pragmatic on boundaries – if business services can be made simpler by working across a larger geography, but remain tailored to needs – it will seek to do that. Notes ‘significant scope working as Yorkshire or the North for working at internationally significant scale, e.g. to drive sector growth or maximising R&D strengths’
Most SEPs make little or no explicit connection to Yorkshire level, but all refer to North wide working at times and show openness to links with other LEPs on specific issues/ opportunities. This may not be surprising given the political context for LEPs and SEPs at the time they were written YNYER is notable in identifying significant scope for working as Yorkshire, such as on approaches to international activity, sector growth, and R&D.
SEP review/LIS position
Review based on 2014 SEP and 2016 review of it LEP is active on early stages of LIS work and has consulted on and published a ‘Blueprint for LIS’ outline document
Based on 2016-2036 SEP LIIS under development but currently just outline and high-level themes and priority challenges, etc.
Based on 2015-2025 SEP SEP review/LIS under development and early draft work on Local Inclusive Industrial Strategy prepared
Based on 2016 update of 2014 SEP, noted as a bit dated. No LIS under development yet Meeting with James Farrar/YNYER LEP will update on position
All the SEPs were written in the 2014-2016 period and are seen as somewhat dated given the changes in context since. It is important to view them alongside early messages from new LIS development.
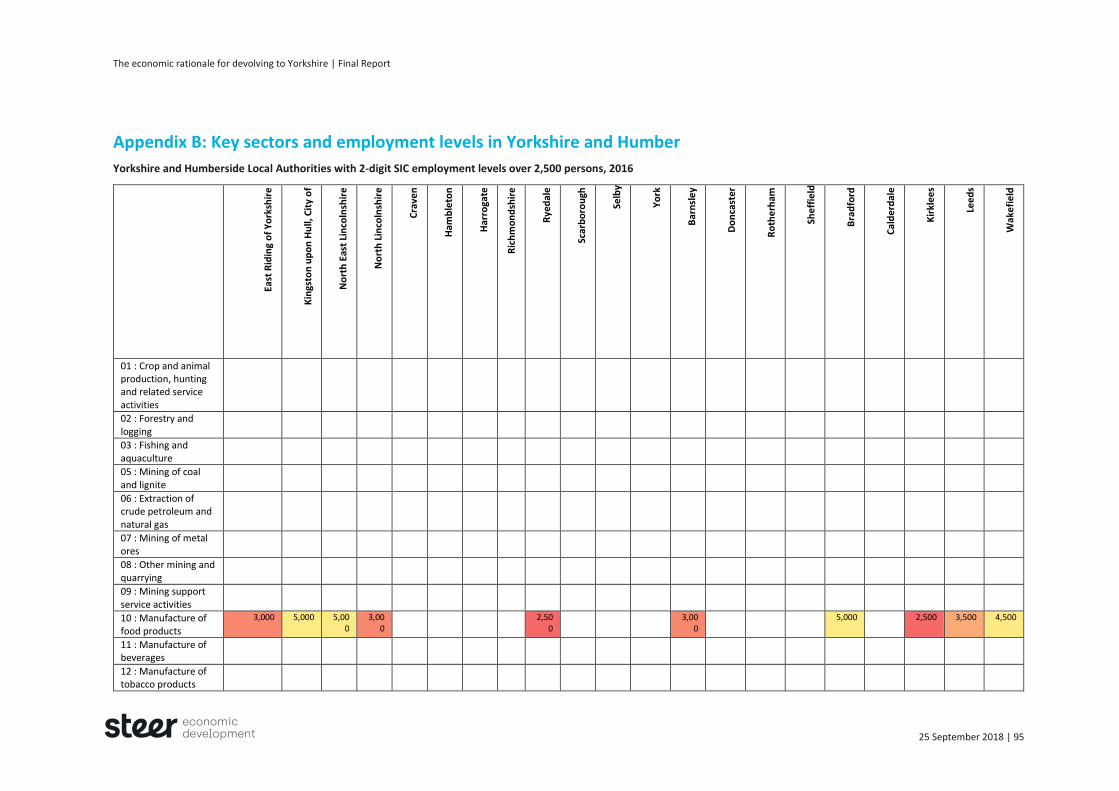
The economic rationale for devolving to Yorkshire | Final Report
25 September 2018 | 95
Appendix B: Key sectors and employment levels in Yorkshire and Humber
Yorkshire and Humberside Local Authorities with 2-digit SIC employment levels over 2,500 persons, 2016
East
Rid
ing
of
Yo
rksh
ire
Kin
gsto
n u
po
n H
ull,
Cit
y o
f
No
rth
Eas
t Li
nco
lnsh
ire
No
rth
Lin
coln
shir
e
Cra
ven
Ham
ble
ton
Har
roga
te
Ric
hm
on
dsh
ire
Rye
dal
e
Scar
bo
rou
gh
Selb
y
Yo
rk
Bar
nsl
ey
Do
nca
ster
Ro
the
rham
She
ffie
ld
Bra
dfo
rd
Cal
de
rdal
e
Kir
kle
es
Lee
ds
Wak
efi
eld
01 : Crop and animal production, hunting and related service activities
02 : Forestry and logging
03 : Fishing and aquaculture
05 : Mining of coal and lignite
06 : Extraction of crude petroleum and natural gas
07 : Mining of metal ores
08 : Other mining and quarrying
09 : Mining support service activities
10 : Manufacture of food products
3,000 5,000 5,000
3,000
2,500
3,000
5,000 2,500 3,500 4,500
11 : Manufacture of beverages
12 : Manufacture of tobacco products
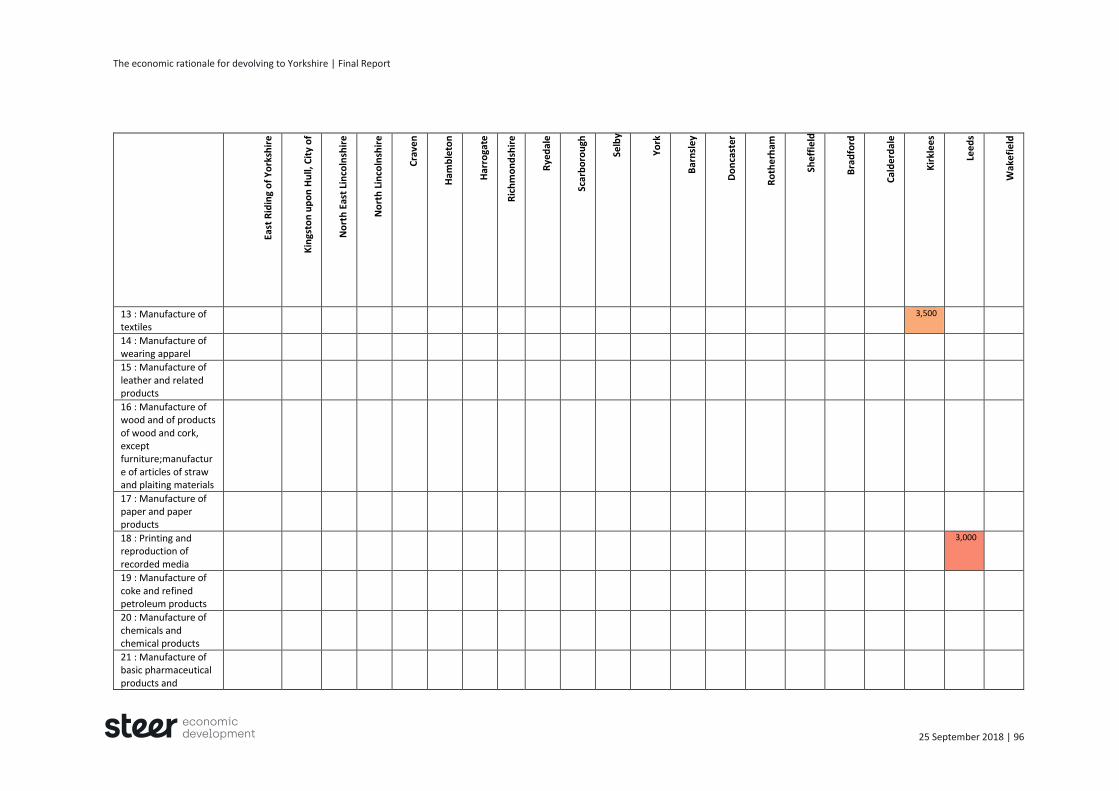
The economic rationale for devolving to Yorkshire | Final Report
25 September 2018 | 96
East
Rid
ing
of
Yo
rksh
ire
Kin
gsto
n u
po
n H
ull,
Cit
y o
f
No
rth
Eas
t Li
nco
lnsh
ire
No
rth
Lin
coln
shir
e
Cra
ven
Ham
ble
ton
Har
roga
te
Ric
hm
on
dsh
ire
Rye
dal
e
Scar
bo
rou
gh
Selb
y
Yo
rk
Bar
nsl
ey
Do
nca
ster
Ro
the
rham
She
ffie
ld
Bra
dfo
rd
Cal
de
rdal
e
Kir
kle
es
Lee
ds
Wak
efi
eld
13 : Manufacture of textiles
3,500
14 : Manufacture of wearing apparel
15 : Manufacture of leather and related products
16 : Manufacture of wood and of products of wood and cork, except furniture;manufacture of articles of straw and plaiting materials
17 : Manufacture of paper and paper products
18 : Printing and reproduction of recorded media
3,000
19 : Manufacture of coke and refined petroleum products
20 : Manufacture of chemicals and chemical products
21 : Manufacture of basic pharmaceutical products and
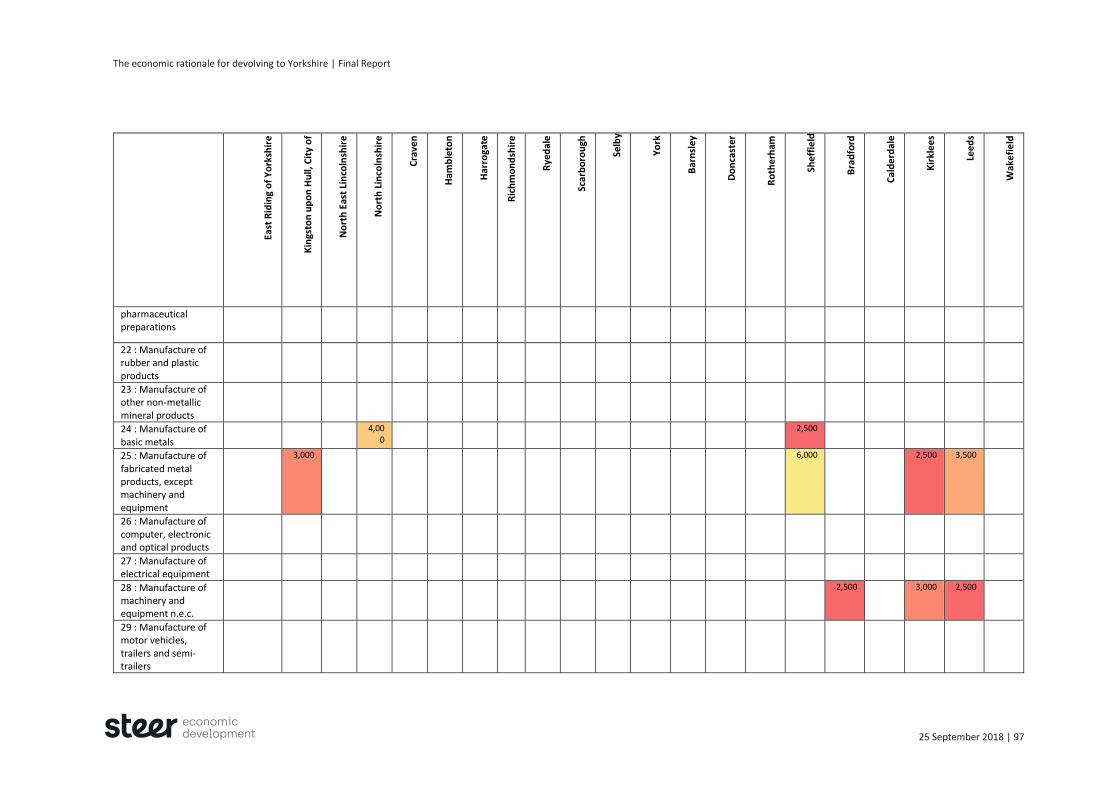
The economic rationale for devolving to Yorkshire | Final Report
25 September 2018 | 97
East
Rid
ing
of
Yo
rksh
ire
Kin
gsto
n u
po
n H
ull,
Cit
y o
f
No
rth
Eas
t Li
nco
lnsh
ire
No
rth
Lin
coln
shir
e
Cra
ven
Ham
ble
ton
Har
roga
te
Ric
hm
on
dsh
ire
Rye
dal
e
Scar
bo
rou
gh
Selb
y
Yo
rk
Bar
nsl
ey
Do
nca
ster
Ro
the
rham
She
ffie
ld
Bra
dfo
rd
Cal
de
rdal
e
Kir
kle
es
Lee
ds
Wak
efi
eld
pharmaceutical preparations
22 : Manufacture of rubber and plastic products
23 : Manufacture of other non-metallic mineral products
24 : Manufacture of basic metals
4,000
2,500
25 : Manufacture of fabricated metal products, except machinery and equipment
3,000 6,000 2,500 3,500
26 : Manufacture of computer, electronic and optical products
27 : Manufacture of electrical equipment
28 : Manufacture of machinery and equipment n.e.c.
2,500 3,000 2,500
29 : Manufacture of motor vehicles, trailers and semi-trailers

The economic rationale for devolving to Yorkshire | Final Report
25 September 2018 | 98
East
Rid
ing
of
Yo
rksh
ire
Kin
gsto
n u
po
n H
ull,
Cit
y o
f
No
rth
Eas
t Li
nco
lnsh
ire
No
rth
Lin
coln
shir
e
Cra
ven
Ham
ble
ton
Har
roga
te
Ric
hm
on
dsh
ire
Rye
dal
e
Scar
bo
rou
gh
Selb
y
Yo
rk
Bar
nsl
ey
Do
nca
ster
Ro
the
rham
She
ffie
ld
Bra
dfo
rd
Cal
de
rdal
e
Kir
kle
es
Lee
ds
Wak
efi
eld
30 : Manufacture of other transport equipment
31 : Manufacture of furniture
2,500
32 : Other manufacturing
33 : Repair and installation of machinery and equipment
35 : Electricity, gas, steam and air conditioning supply
3,000
36 : Water collection, treatment and supply
37 : Sewerage
38 : Waste collection, treatment and disposal activities; materials recovery
3,000
39 : Remediation activities and other waste management services. This division includes the provision of remediation services, i.e. the clean-up of

The economic rationale for devolving to Yorkshire | Final Report
25 September 2018 | 99
East
Rid
ing
of
Yo
rksh
ire
Kin
gsto
n u
po
n H
ull,
Cit
y o
f
No
rth
Eas
t Li
nco
lnsh
ire
No
rth
Lin
coln
shir
e
Cra
ven
Ham
ble
ton
Har
roga
te
Ric
hm
on
dsh
ire
Rye
dal
e
Scar
bo
rou
gh
Selb
y
Yo
rk
Bar
nsl
ey
Do
nca
ster
Ro
the
rham
She
ffie
ld
Bra
dfo
rd
Cal
de
rdal
e
Kir
kle
es
Lee
ds
Wak
efi
eld
contaminated buildings and sites, soil, surface or ground water.
41 : Construction of buildings
2,500 3,000 7,000
42 : Civil engineering 3,000
43 : Specialised construction activities
3,000 3,500 3,000
3,000
3,500 3,500 6,000 4,000 2,500 4,000 10,000
3,500
45 : Wholesale and retail trade and repair of motor vehicles and motorcycles
3,500 2,500 2,500
3,500 4,500 4,500 5,000 7,000 4,000
46 : Wholesale trade, except of motor vehicles and motorcycles
5,000 6,000 3,000
3,000
2,500
4,500
3,000 3,000
5,000 4,000 12,000
10,000
5,000 11,000
18,000
9,000
47 : Retail trade, except of motor vehicles and motorcycles
11,000 12,000
7,000
6,000
2,500
3,500
8,000
5,000
13,000
8,000
12,000
9,000 25,000
19,000
7,000 17,000
32,000
13,000
49 : Land transport and transport via pipelines
3,000 2,500 3,000
4,000 4,000 3,000 3,500 8,000 3,000
50 : Water transport

The economic rationale for devolving to Yorkshire | Final Report
25 September 2018 | 100
East
Rid
ing
of
Yo
rksh
ire
Kin
gsto
n u
po
n H
ull,
Cit
y o
f
No
rth
Eas
t Li
nco
lnsh
ire
No
rth
Lin
coln
shir
e
Cra
ven
Ham
ble
ton
Har
roga
te
Ric
hm
on
dsh
ire
Rye
dal
e
Scar
bo
rou
gh
Selb
y
Yo
rk
Bar
nsl
ey
Do
nca
ster
Ro
the
rham
She
ffie
ld
Bra
dfo
rd
Cal
de
rdal
e
Kir
kle
es
Lee
ds
Wak
efi
eld
51 : Air transport
52 : Warehousing and support activities for transportation
4,500 4,000
3,000
3,000
5,000 4,000 6,000 12,000
53 : Postal and courier activities
3,000 4,000
55 : Accommodation 3,000 3,500
2,500 4,000
56 : Food and beverage service activities
7,000 5,000 3,000
3,000
6,000
4,000
8,000 3,500
6,000 5,000 13,000
8,000 4,500 8,000 20,000
7,000
58 : Publishing activities
2,500
59 : Motion picture, video and television programme production, sound recording and music publishing activities
60 : Programming and broadcasting activities
61 : Telecommunications
3,000 4,000
62 : Computer programming, consultancy and related activities
4,000 12,000

The economic rationale for devolving to Yorkshire | Final Report
25 September 2018 | 101
East
Rid
ing
of
Yo
rksh
ire
Kin
gsto
n u
po
n H
ull,
Cit
y o
f
No
rth
Eas
t Li
nco
lnsh
ire
No
rth
Lin
coln
shir
e
Cra
ven
Ham
ble
ton
Har
roga
te
Ric
hm
on
dsh
ire
Rye
dal
e
Scar
bo
rou
gh
Selb
y
Yo
rk
Bar
nsl
ey
Do
nca
ster
Ro
the
rham
She
ffie
ld
Bra
dfo
rd
Cal
de
rdal
e
Kir
kle
es
Lee
ds
Wak
efi
eld
63 : Information service activities
64 : Financial service activities, except insurance and pension funding
6,000 6,000 5,000 12,000
65 : Insurance, reinsurance and pension funding, except compulsory social security
66 : Activities auxiliary to financial services and insurance activities
3,500 3,000 10,000
68 : Real estate activities
3,000 3,000 6,000 2,500
69 : Legal and accounting activities
5,000 2,500 14,000
70 : Activities of head offices; management consultancy activities
2,500
6,000 4,500 14,000
71 : Architectural and engineering activities; technical testing and analysis
4,000 2,500 9,000 2,500
72 : Scientific research and development
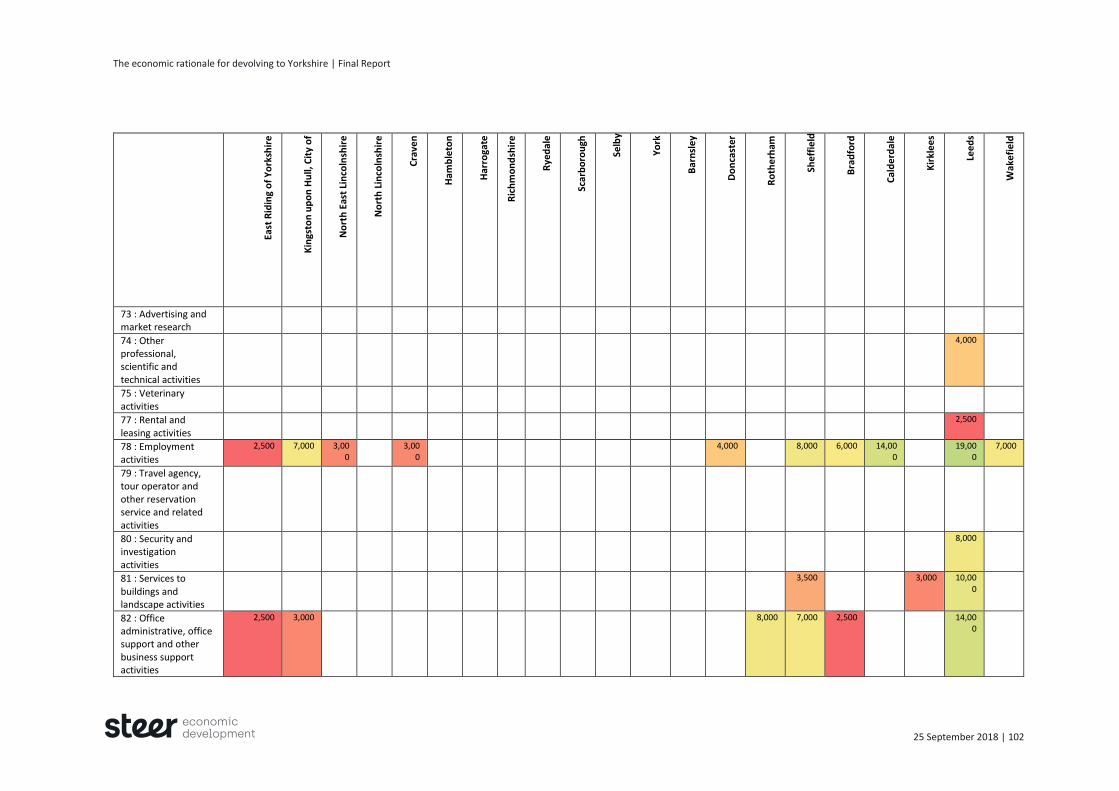
The economic rationale for devolving to Yorkshire | Final Report
25 September 2018 | 102
East
Rid
ing
of
Yo
rksh
ire
Kin
gsto
n u
po
n H
ull,
Cit
y o
f
No
rth
Eas
t Li
nco
lnsh
ire
No
rth
Lin
coln
shir
e
Cra
ven
Ham
ble
ton
Har
roga
te
Ric
hm
on
dsh
ire
Rye
dal
e
Scar
bo
rou
gh
Selb
y
Yo
rk
Bar
nsl
ey
Do
nca
ster
Ro
the
rham
She
ffie
ld
Bra
dfo
rd
Cal
de
rdal
e
Kir
kle
es
Lee
ds
Wak
efi
eld
73 : Advertising and market research
74 : Other professional, scientific and technical activities
4,000
75 : Veterinary activities
77 : Rental and leasing activities
2,500
78 : Employment activities
2,500 7,000 3,000
3,000
4,000 8,000 6,000 14,000
19,000
7,000
79 : Travel agency, tour operator and other reservation service and related activities
80 : Security and investigation activities
8,000
81 : Services to buildings and landscape activities
3,500 3,000 10,000
82 : Office administrative, office support and other business support activities
2,500 3,000 8,000 7,000 2,500 14,000
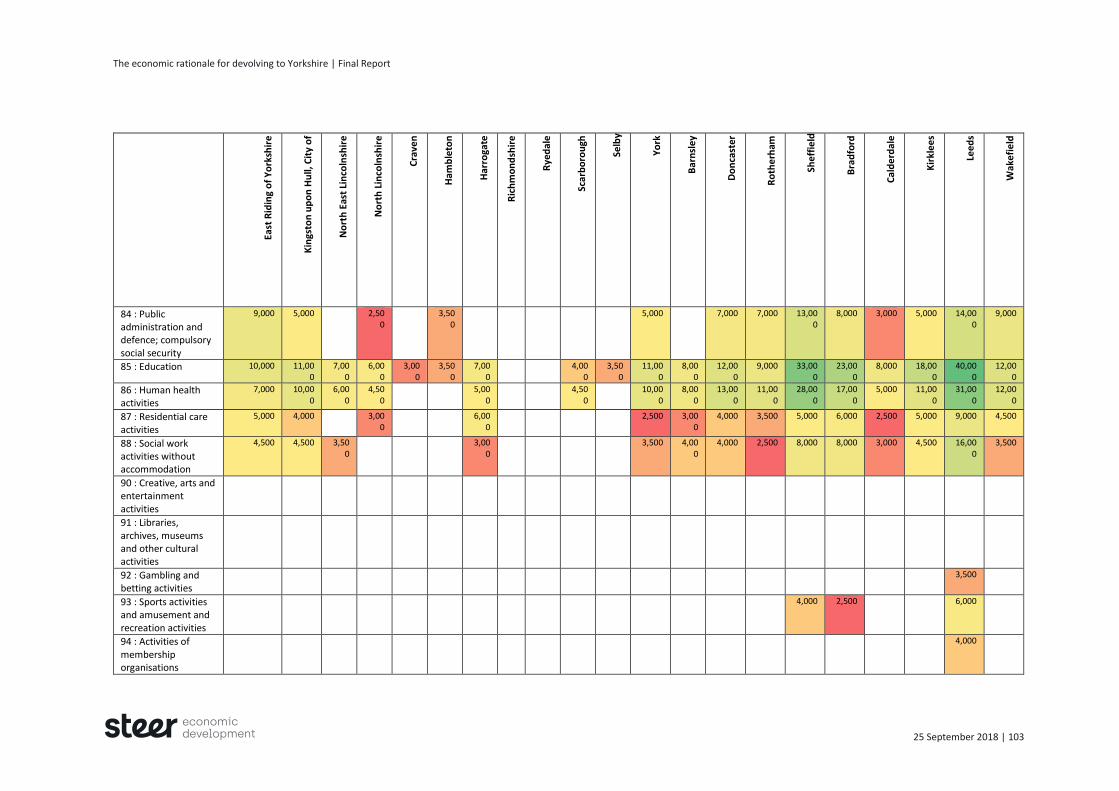
The economic rationale for devolving to Yorkshire | Final Report
25 September 2018 | 103
East
Rid
ing
of
Yo
rksh
ire
Kin
gsto
n u
po
n H
ull,
Cit
y o
f
No
rth
Eas
t Li
nco
lnsh
ire
No
rth
Lin
coln
shir
e
Cra
ven
Ham
ble
ton
Har
roga
te
Ric
hm
on
dsh
ire
Rye
dal
e
Scar
bo
rou
gh
Selb
y
Yo
rk
Bar
nsl
ey
Do
nca
ster
Ro
the
rham
She
ffie
ld
Bra
dfo
rd
Cal
de
rdal
e
Kir
kle
es
Lee
ds
Wak
efi
eld
84 : Public administration and defence; compulsory social security
9,000 5,000 2,500
3,500
5,000 7,000 7,000 13,000
8,000 3,000 5,000 14,000
9,000
85 : Education 10,000 11,000
7,000
6,000
3,000
3,500
7,000
4,000
3,500
11,000
8,000
12,000
9,000 33,000
23,000
8,000 18,000
40,000
12,000
86 : Human health activities
7,000 10,000
6,000
4,500
5,000
4,500
10,000
8,000
13,000
11,000
28,000
17,000
5,000 11,000
31,000
12,000
87 : Residential care activities
5,000 4,000 3,000
6,000
2,500 3,000
4,000 3,500 5,000 6,000 2,500 5,000 9,000 4,500
88 : Social work activities without accommodation
4,500 4,500 3,500
3,000
3,500 4,000
4,000 2,500 8,000 8,000 3,000 4,500 16,000
3,500
90 : Creative, arts and entertainment activities
91 : Libraries, archives, museums and other cultural activities
92 : Gambling and betting activities
3,500
93 : Sports activities and amusement and recreation activities
4,000 2,500 6,000
94 : Activities of membership organisations
4,000

The economic rationale for devolving to Yorkshire | Final Report
25 September 2018 | 104
East
Rid
ing
of
Yo
rksh
ire
Kin
gsto
n u
po
n H
ull,
Cit
y o
f
No
rth
Eas
t Li
nco
lnsh
ire
No
rth
Lin
coln
shir
e
Cra
ven
Ham
ble
ton
Har
roga
te
Ric
hm
on
dsh
ire
Rye
dal
e
Scar
bo
rou
gh
Selb
y
Yo
rk
Bar
nsl
ey
Do
nca
ster
Ro
the
rham
She
ffie
ld
Bra
dfo
rd
Cal
de
rdal
e
Kir
kle
es
Lee
ds
Wak
efi
eld
95 : Repair of computers and personal and household goods
96 : Other personal service activities
3,500
97 : Activities of households as employers of domestic personnel
98 : Undifferentiated goods- and services-producing activities of private households for own use
99 : Activities of extraterritorial organisations and bodies

The economic rationale for devolving to Yorkshire | Final Report
25 September 2018 | 105
Detailed employment LQ correlations for Yorkshire & Humberside (2016)
One Yorkshire signatories in bold
East
Rid
ing
of
Yo
rksh
ire
Kin
gsto
n u
po
n H
ull
No
rth
Eas
t Li
nco
lnsh
ire
No
rth
Lin
coln
shir
e
Cra
ven
Ham
ble
ton
Har
roga
te
Ric
hm
on
dsh
ire
Rye
dal
e
Scar
bo
rou
gh
Selb
y
Yo
rk
Bar
nsl
ey
Do
nca
ster
Ro
ther
ham
Shef
fiel
d
Bra
dfo
rd
Cal
de
rdal
e
Kir
kle
es
Lee
ds
Wak
efi
eld
East Riding of Yorkshire 0.065 0.564
-0.040 0.225
-0.017 0.342
-0.032 0.183 0.897 0.053
-0.172 0.104 0.024
-0.011
-0.102
-0.019 0.035 0.008
-0.173 0.024
Kingston upon Hull, City of 0.199
-0.078 0.681 0.129
-0.128
-0.113
-0.022 0.028
-0.076
-0.013 0.164 0.065 0.099 0.007 0.000 0.041 0.177 0.027 0.040
North East Lincolnshire 0.177 0.072 0.257 0.201
-0.044 0.125 0.510 0.056 0.023 0.220 0.180 0.090
-0.002 0.152 0.178 0.046 0.004 0.185
North Lincolnshire
-0.073
-0.085
-0.075
-0.103 0.103
-0.051
-0.050
-0.172 0.024 0.058 0.249 0.081
-0.057 0.354 0.012 0.136 0.058
Craven 0.117 0.184 0.004 0.236 0.299 -
0.027 -
0.045 -
0.067 -
0.080 -
0.096 -
0.076 0.012 0.116 0.235 -
0.093 -
0.044
Hambleton 0.456 0.346 0.446 0.083 0.403 0.289 0.241 0.230 0.103 0.073 0.135 0.079 0.051 -
0.169 0.195
Harrogate 0.338 0.559 0.475 0.375 0.295 0.011 0.006 0.021 0.050 0.095 0.046 -
0.045 0.026 0.139
Richmondshire 0.404 0.064 0.117 0.207 0.036 0.111 -
0.019 -
0.018 -
0.014 -
0.053 -
0.042 -
0.115 0.015
Ryedale 0.356 0.147 0.143 0.044 0.079 0.296 0.298 0.056 0.059 -
0.043 -
0.121 -
0.063
Scarborough 0.058 -
0.058 -
0.037 -
0.028 -
0.018 -
0.041 0.003 0.033 -
0.058 -
0.095 -
0.014
Selby
-0.124 0.105 0.189 0.053
-0.106 0.141 0.075 0.022
-0.078 0.367
York 0.033 0.124 -
0.008 0.260 0.011 -
0.083 -
0.115 0.141 0.000
Barnsley 0.618 0.451 0.114 0.298 0.364 0.248 -
0.021 0.409
Doncaster 0.536 0.322 0.092 0.242 0.143 0.098 0.390
Rotherham 0.611 0.164 0.250 0.134 0.210 0.242
Sheffield 0.035 0.132 0.039 0.220 -
0.002

The economic rationale for devolving to Yorkshire | Final Report
25 September 2018 | 106
One Yorkshire signatories in bold
East
Rid
ing
of
Yo
rksh
ire
Kin
gsto
n u
po
n H
ull
No
rth
Eas
t Li
nco
lnsh
ire
No
rth
Lin
coln
shir
e
Cra
ven
Ham
ble
ton
Har
roga
te
Ric
hm
on
dsh
ire
Rye
dal
e
Scar
bo
rou
gh
Selb
y
Yo
rk
Bar
nsl
ey
Do
nca
ster
Ro
ther
ham
Shef
fiel
d
Bra
dfo
rd
Cal
de
rdal
e
Kir
kle
es
Lee
ds
Wak
efi
eld
Bradford 0.248 0.369 0.083 0.159
Calderdale 0.300 0.187 0.250
Kirklees 0.083 0.215
Leeds 0.098
Wakefield
Source: Steer Economic Development calculations using ONS data

The economic rationale for devolving to Yorkshire | Final Report
25 September 2018 | 107
Appendix C: Areas for further study
Throughout this report, we have highlighted areas for further study.
On Sectors we highlighted the need for further research into:
Supply-chain linkages – both within the region and with national and global supply chains;
The role of strategic assets and/or sectors serving the whole of Yorkshire from one or two
locations; and
Sector/industry gaps, where leadership at the level of Yorkshire might add value to efforts
to re-balance the economy in terms of sectors as well as economic geography.
On R&D and Innovation we highlighted the need for further research to:
Unpack the drivers of under-investment in R&D in Yorkshire and Humber (e.g., industrial
structure, nature of the research base, relative to the research priorities of funders and
investors, and access to risk capital) to inform the development of interventions and to
determine their form and scale.
On International Trade and Investment, we highlighted the need for further research:
To understand how arrangements to promote international trade and investment in
Yorkshire could improve upon – or extract more value from – current national and pan-
Northern arrangements;
On the potential to use the Yorkshire brand as a tool to engage business in exporting
activities; and
The drivers of and barriers to businesses engaging in exports and/or international supply
chains.
On skills we highlighted the need for further research into:
Future skill requirements which are significant and common across a range of key
sectors/industries in the geography;
How best to improve awareness of and access to significant specialist training assets, so
that it is easier for employers and staff to find and access provision outside their area;
Barriers to retraining, to test whether pan-Yorkshire interventions to tackle market
failures (fear of skilled staff being poached by rivals, opportunity costs of releasing staff
for training etc.) could add value to existing arrangements; and
Identify where pan-Yorkshire leadership and coordination can build on the Northern
Powerhouse research, Educating the North.
On business base, starts, deaths, survivals, and scale-ups we highlighted a need to:
Map the main the characteristics of the region’s business population (e.g. firm size,
businesses’ growth (by turnover and employment), legal structure/s, the patterns of
domestic and overseas ownership, firms’ involvement in international trade/supply/value
chains, and the scale of business investment in capital); to establish a more detailed
understanding of the drivers of and barriers to business growth and the extent to which
these are shared across Yorkshire; and
Understand the scale at which business support needs to be provided, e.g., start-up
advice at the local level and access to equity finance at a pan-Yorkshire or pan-Northern
level.
Use specially provided ONS data on start-ups and survival rates by place and industry to
measure the relative significance of place-specific factors that increase or decrease

The economic rationale for devolving to Yorkshire | Final Report
25 September 2018 | 108
survival rates (i.e. once survival rates are adjusted for national and industry-specific
effects).
On transport we highlighted the need for further research to:
Support intra-regional connectivity, in particular:
– Identification/specification of a road network to facilitate intra-Yorkshire travel
between local authority areas; and
– Simplified/cheaper ticketing for cross-LTA rail journeys; and
Understand the importance of economic and efficient international connectivity as a
driver of economic growth and what this means for policy makers in the region.
In addition to the above, further research is required into policy domains which fell outside
those covered as part of our test of economic coherence, but which are relevant to the wider
devolution debate, in particular, the roles of primary and secondary education, housing policy
and markets, business rates, planning policy, and the interconnected areas of flood
management, green infrastructure and natural capital. Additionally, it will be important to
understand how ambitions and actions to raise GVA and productivity enabled through
devolution can be delivered in a sustainable and inclusive way that reaches all communities,
including the most disadvantaged, and contributes to health and environmental goals such as
air quality, local quality of place and carbon reduction.


www.steer-ed.com
We are a boutique economic development consultancy firm. We don’t just offer strategies for economic development, we change the way our clients think about it. Bringing together a wealth of experience, we deliver a bold, rigorous, integrated vision of the future. We challenge assumptions, and leave our clients with the knowledge and capabilities to succeed.
Progressive thinking No time for business as usual
Our offices Manchester Suite 1 2nd floor 61 Mosley Street Manchester, M2 3HZ +44 (0)161 261 9140 Leeds 67 Albion Street Leeds, LS1 5AA +44 (0)113 389 6400 London 28-32 Upper Ground London, SE1 9PD +44 (0)20 7910 5000