the economic impact of travel & tourism in new york state€¦ · the economic impact of ....
TRANSCRIPT
September 2006
The Economic Impact of Travel & Tourism in New York State
And
Each of its Regions and Counties
Objectives
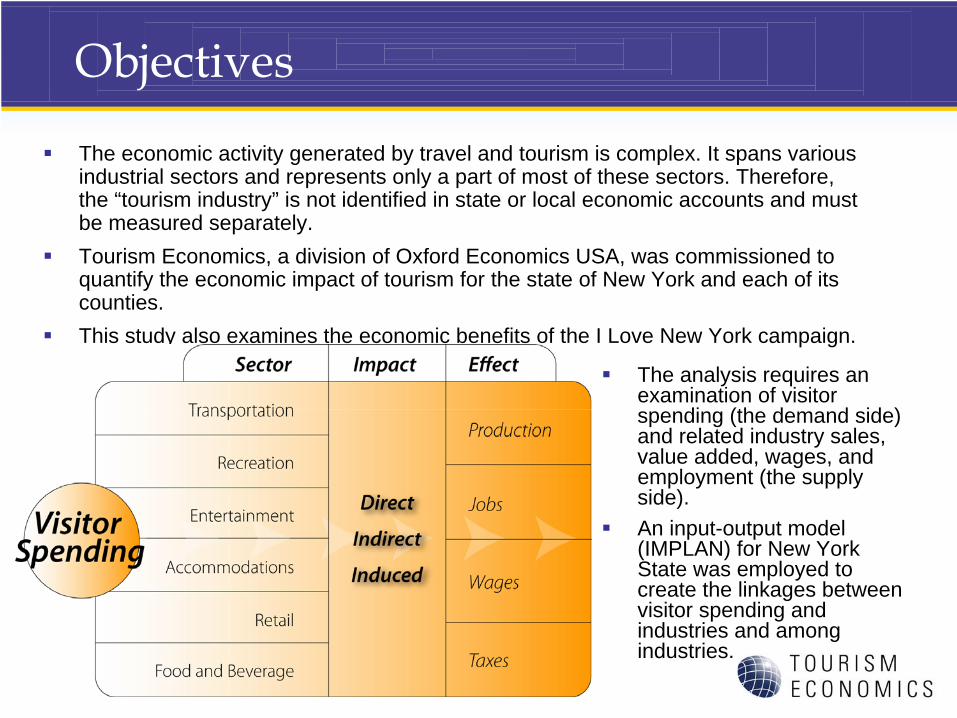
The economic activity generated by travel and tourism is complex. It spans various industrial sectors and represents only a part of most of these sectors. Therefore, the “tourism industry” is not identified in state or local economic accounts and must be measured separately.Tourism Economics, a division of Oxford Economics USA, was commissioned to quantify the economic impact of tourism for the state of New York and each of its counties.This study also examines the economic benefits of the I Love New York campaign.
The analysis requires an examination of visitor spending (the demand side) and related industry sales, value added, wages, and employment (the supply side).An input-output model (IMPLAN) for New York State was employed to create the linkages between visitor spending and industries and among industries.
Economic Impact Levels
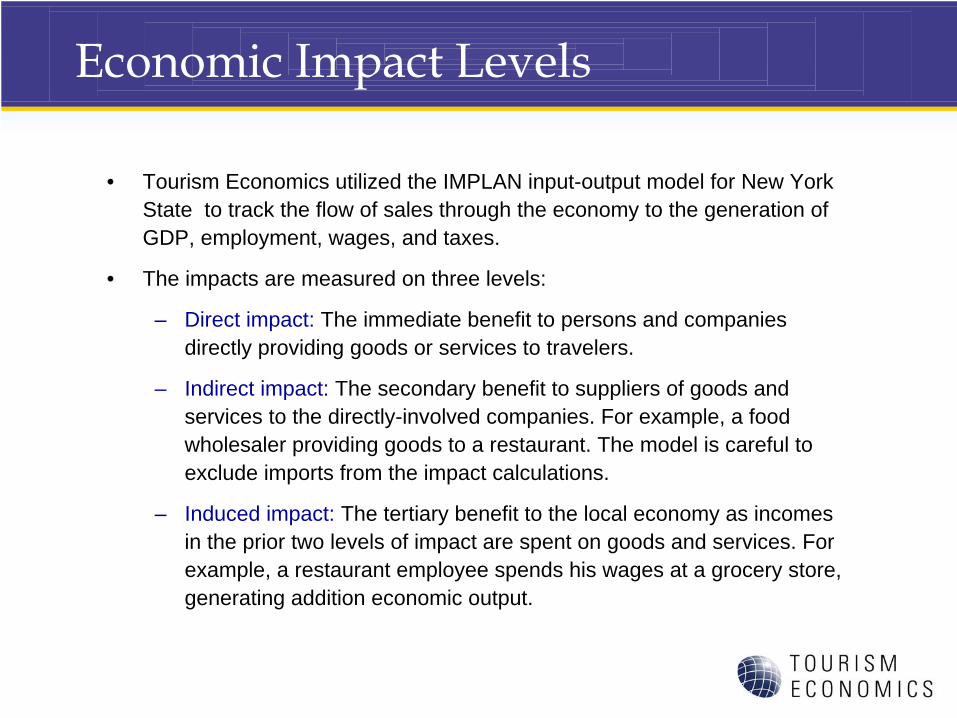
• Tourism Economics utilized the IMPLAN input-output model for New York State to track the flow of sales through the economy to the generation of GDP, employment, wages, and taxes.
• The impacts are measured on three levels:
– Direct impact: The immediate benefit to persons and companies directly providing goods or services to travelers.
– Indirect impact: The secondary benefit to suppliers of goods and services to the directly-involved companies. For example, a food wholesaler providing goods to a restaurant. The model is careful to exclude imports from the impact calculations.
– Induced impact: The tertiary benefit to the local economy as incomes in the prior two levels of impact are spent on goods and services. For example, a restaurant employee spends his wages at a grocery store, generating addition economic output.
The Impact of Travel and Tourism on New York State
Tourism Sales
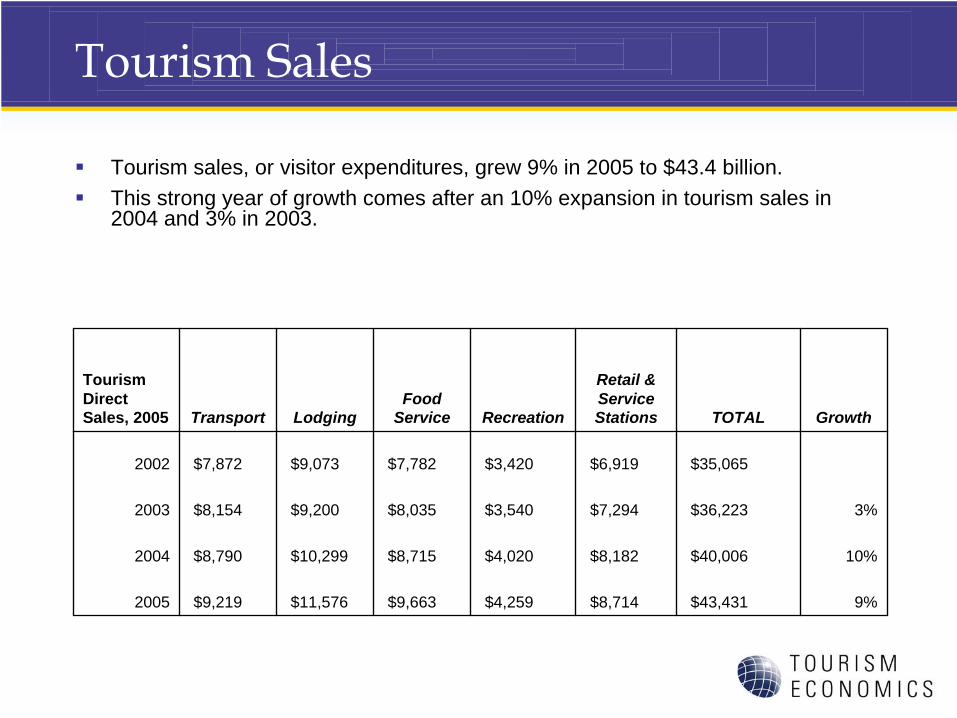
Tourism sales, or visitor expenditures, grew 9% in 2005 to $43.4 billion.This strong year of growth comes after an 10% expansion in tourism sales in 2004 and 3% in 2003.
Tourism Direct Sales, 2005 Transport Lodging
Food Service Recreation
Retail & Service Stations TOTAL Growth
2002 $7,872 $9,073 $7,782 $3,420 $6,919 $35,065
2003 $8,154 $9,200 $8,035 $3,540 $7,294 $36,223 3%
2004 $8,790 $10,299 $8,715 $4,020 $8,182 $40,006 10%
2005 $9,219 $11,576 $9,663 $4,259 $8,714 $43,431 9%
Tourism Sales
Tourism Direct Sales, 2005
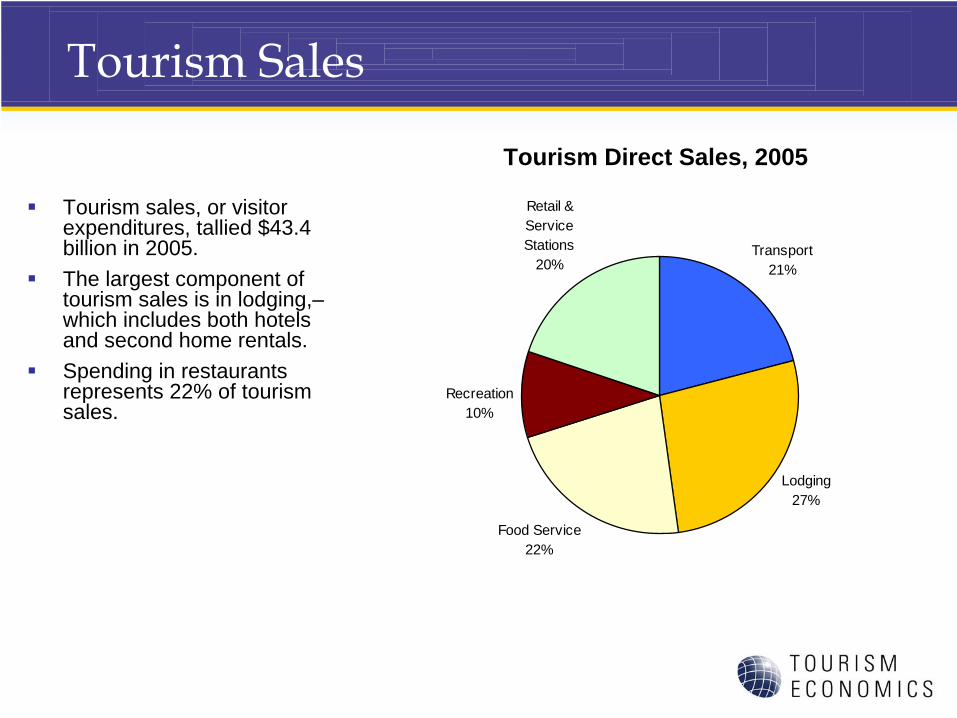
Tourism sales, or visitor expenditures, tallied $43.4 billion in 2005.The largest component of tourism sales is in lodging,–which includes both hotels and second home rentals.Spending in restaurants represents 22% of tourism sales.
Transport21%
Lodging27%
Food Service22%
Retail & Service Stations
20%
Recreation10%
Tourism Gross State Product
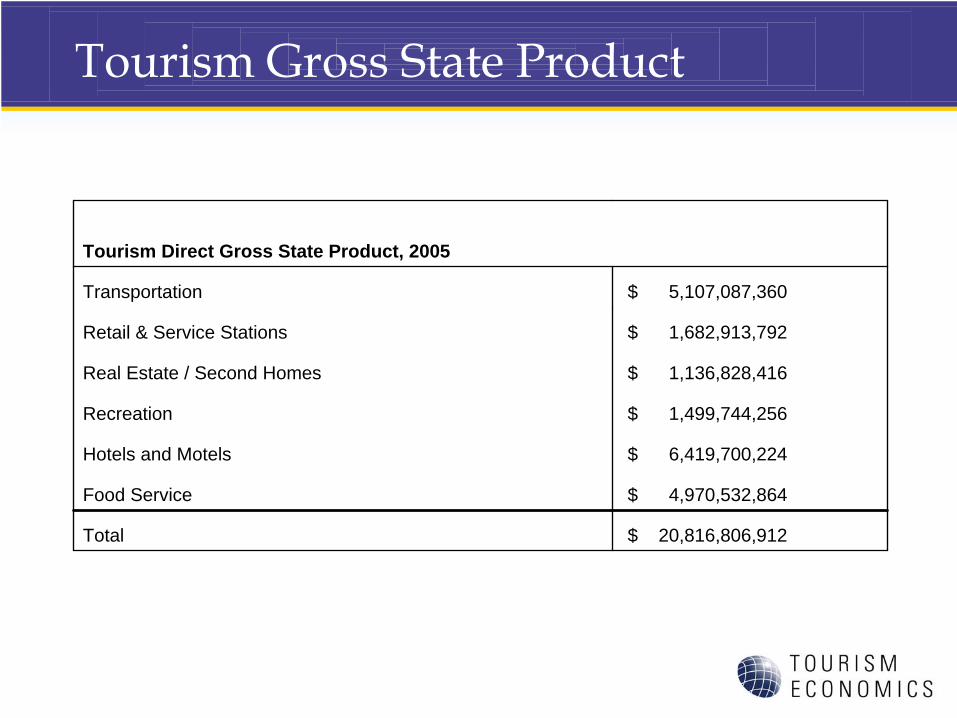
Tourism Direct Gross State Product, 2005
Transportation $ 5,107,087,360
Retail & Service Stations $ 1,682,913,792
Real Estate / Second Homes $ 1,136,828,416
Recreation $ 1,499,744,256
Hotels and Motels $ 6,419,700,224
Food Service $ 4,970,532,864
Total $ 20,816,806,912
Tourism Gross State Product
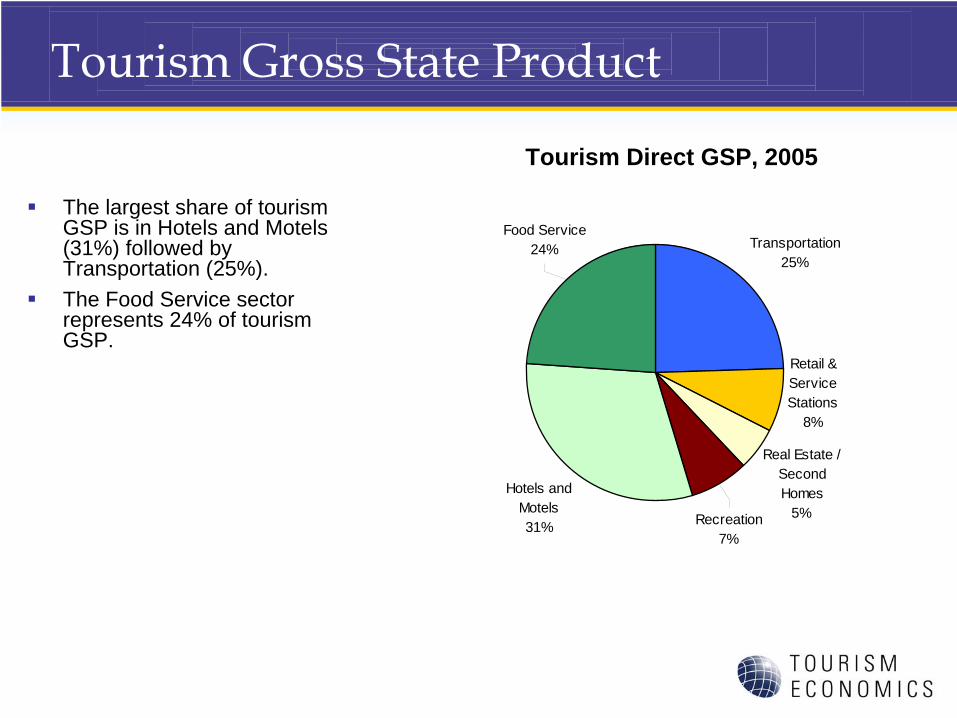
The largest share of tourism GSP is in Hotels and Motels (31%) followed by Transportation (25%).The Food Service sector represents 24% of tourism GSP.
Tourism Direct GSP, 2005
Transportation25%
Real Estate / Second Homes
5%
Hotels and Motels31% Recreation
7%
Food Service24%
Retail & Service Stations
8%
Tourism Gross State Product
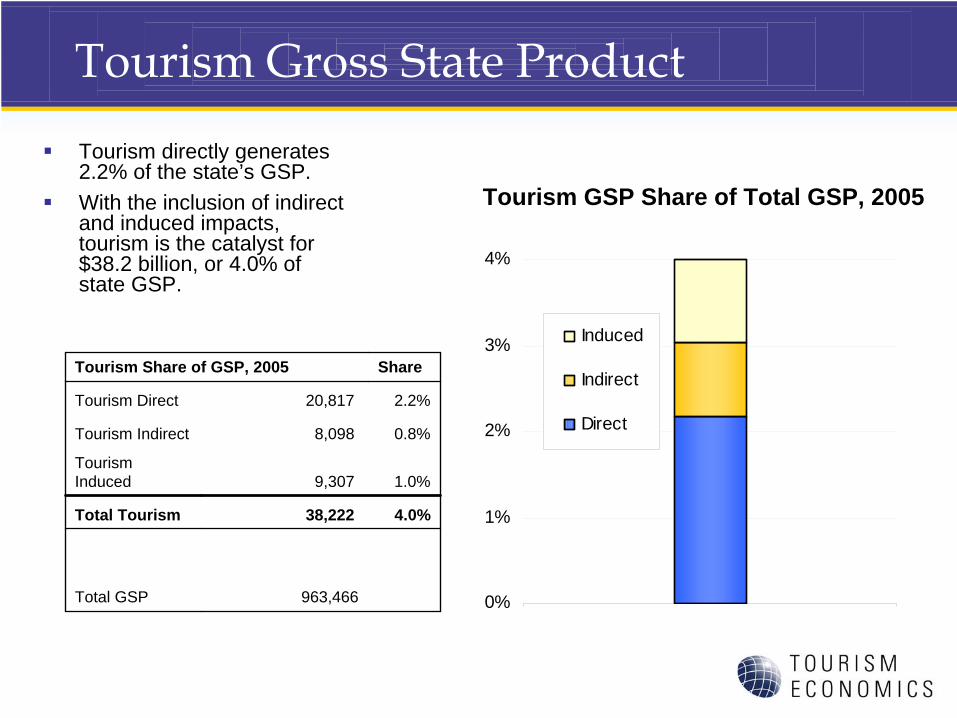
Tourism directly generates 2.2% of the state’s GSP.With the inclusion of indirect and induced impacts, tourism is the catalyst for $38.2 billion, or 4.0% of state GSP.
Tourism GSP Share of Total GSP, 2005
Tourism Share of GSP, 2005 Share
Tourism Direct 20,817 2.2%
Tourism Indirect 8,098 0.8%
Tourism Induced 9,307 1.0%
Total Tourism 38,222 4.0%
Total GSP 963,466 0%
1%
2%
3%
4%
Induced
Indirect
Direct
Tourism Labor Income
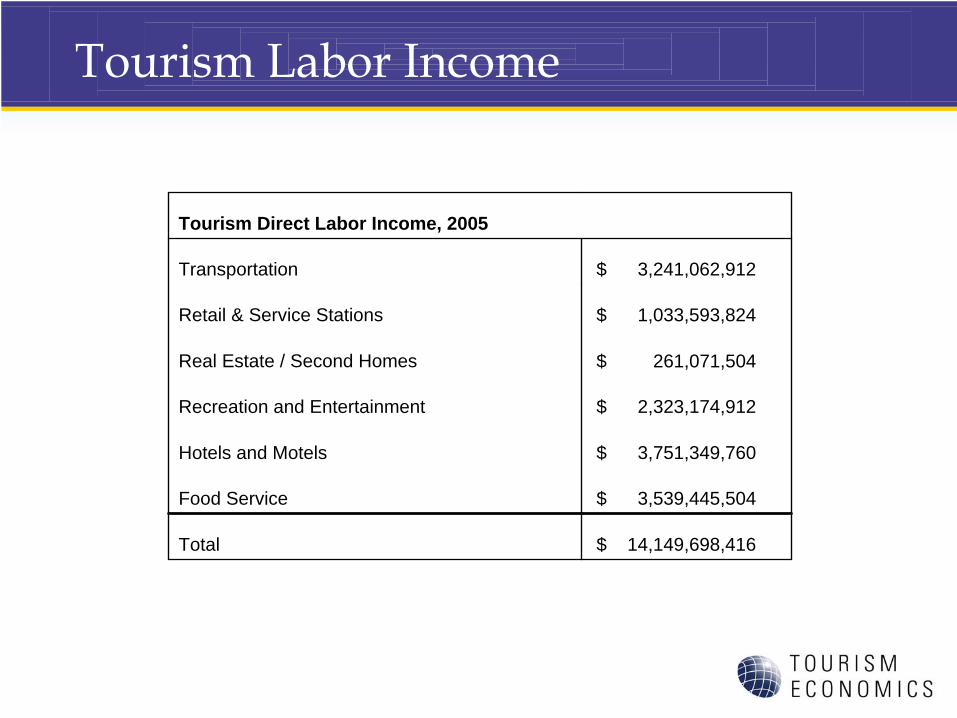
Tourism Direct Labor Income, 2005
Transportation $ 3,241,062,912
Retail & Service Stations $ 1,033,593,824
Real Estate / Second Homes $ 261,071,504
Recreation and Entertainment $ 2,323,174,912
Hotels and Motels $ 3,751,349,760
Food Service $ 3,539,445,504
Total $ 14,149,698,416
Tourism Labor Income
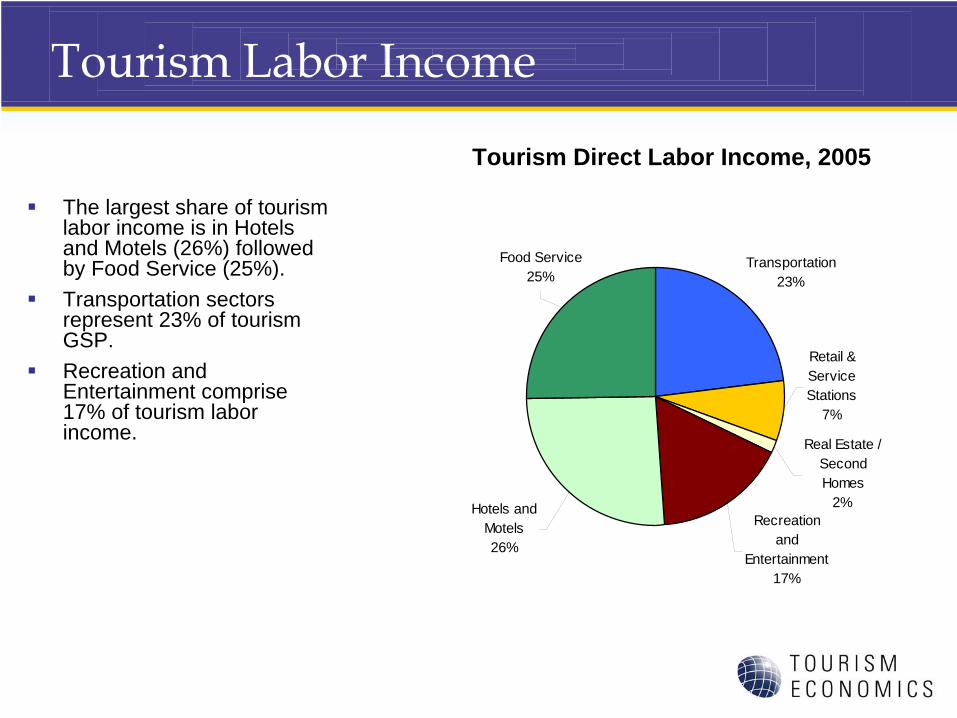
The largest share of tourism labor income is in Hotels and Motels (26%) followed by Food Service (25%).Transportation sectors represent 23% of tourism GSP.Recreation and Entertainment comprise 17% of tourism labor income.
Tourism Direct Labor Income, 2005
Transportation23%
Retail & Service Stations
7%
Food Service25%
Recreation and
Entertainment17%
Hotels and Motels26%
Real Estate / Second Homes
2%
Tourism Labor Income
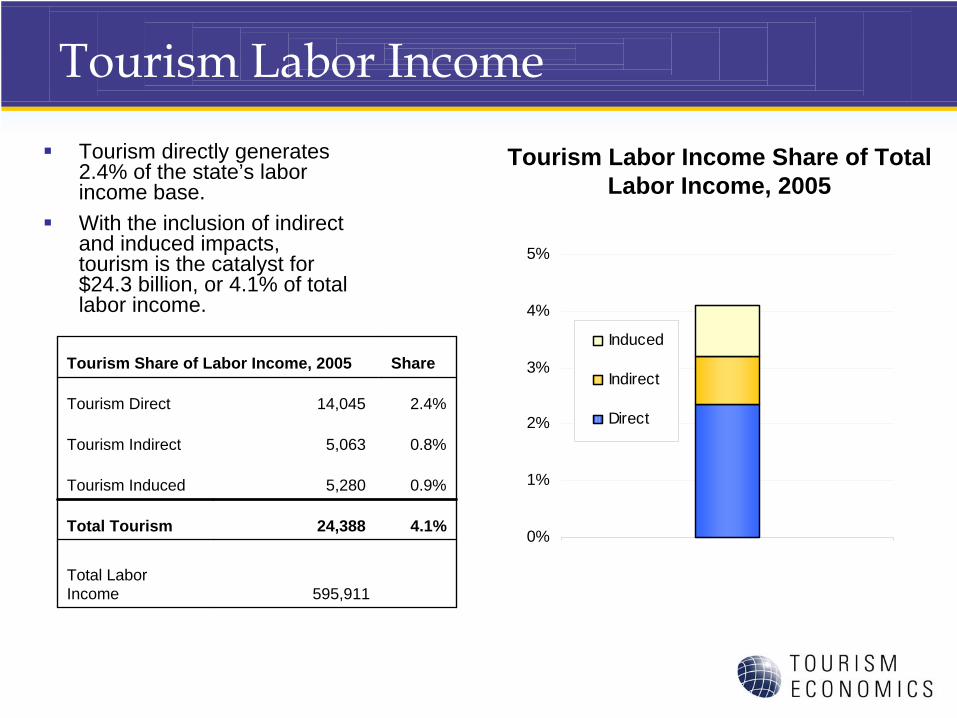
Tourism Share of Labor Income, 2005 Share
Tourism Direct 14,045 2.4%
Tourism Indirect 5,063 0.8%
Tourism Induced 5,280 0.9%
Total Tourism 24,388 4.1%
Total Labor Income 595,911
Tourism directly generates 2.4% of the state’s labor income base.With the inclusion of indirect and induced impacts, tourism is the catalyst for $24.3 billion, or 4.1% of total labor income.
Tourism Labor Income Share of Total Labor Income, 2005
0%
1%
2%
3%
4%
5%
Induced
Indirect
Direct
Tourism Employment
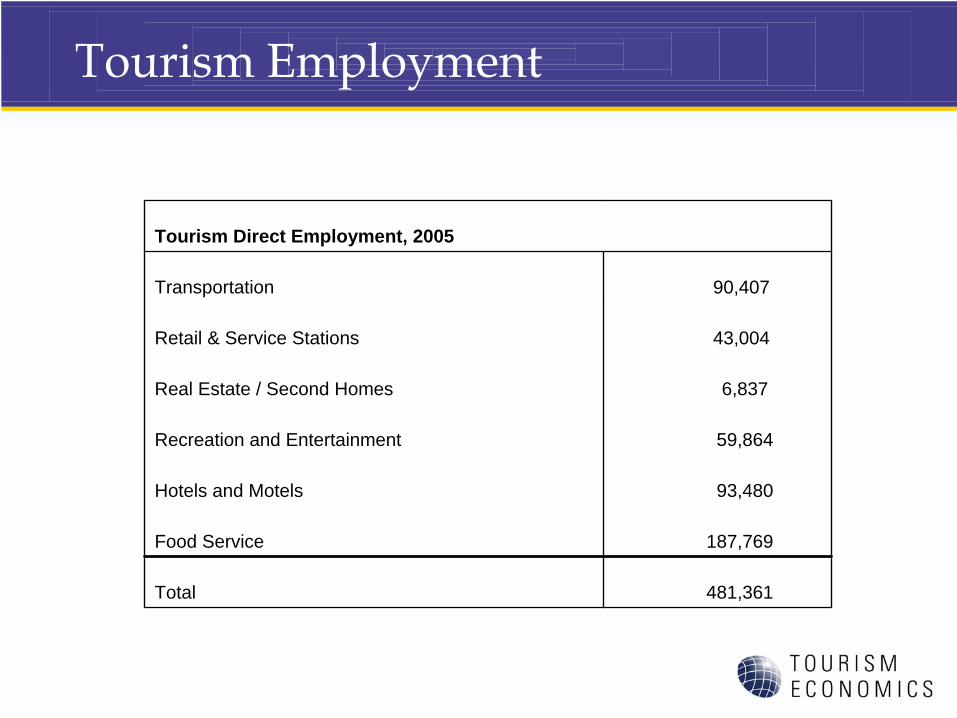
Tourism Direct Employment, 2005
Transportation 90,407
Retail & Service Stations 43,004
Real Estate / Second Homes 6,837
Recreation and Entertainment 59,864
Hotels and Motels 93,480
Food Service 187,769
Total 481,361

Tourism Employment
The largest share of tourism employment is in Food Service (39%) followed by Hotels (19%).Transportation sectors represent 19% of tourism employment.
Tourism Direct Employment, 2005
Transportation19%
Real Estate / Second Homes
1%
Retail & Service Stations
9%
Food Service39%
Recreation and
Entertainment13%Hotels and
Motels19%
Tourism Employment
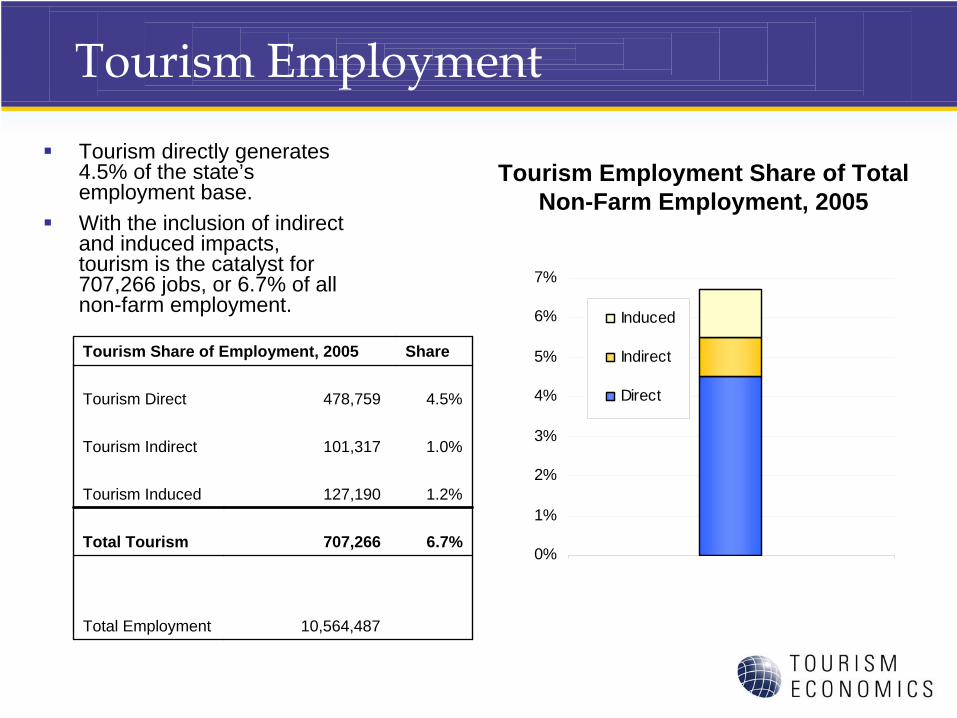
Tourism Share of Employment, 2005 Share
Tourism Direct 478,759 4.5%
Tourism Indirect 101,317 1.0%
Tourism Induced 127,190 1.2%
Total Tourism 707,266 6.7%
Total Employment 10,564,487
Tourism directly generates 4.5% of the state’s employment base.With the inclusion of indirect and induced impacts, tourism is the catalyst for 707,266 jobs, or 6.7% of all non-farm employment.
Tourism Employment Share of Total Non-Farm Employment, 2005
0%
1%
2%
3%
4%
5%
6%
7%
Induced
Indirect
Direct
Regional Summary
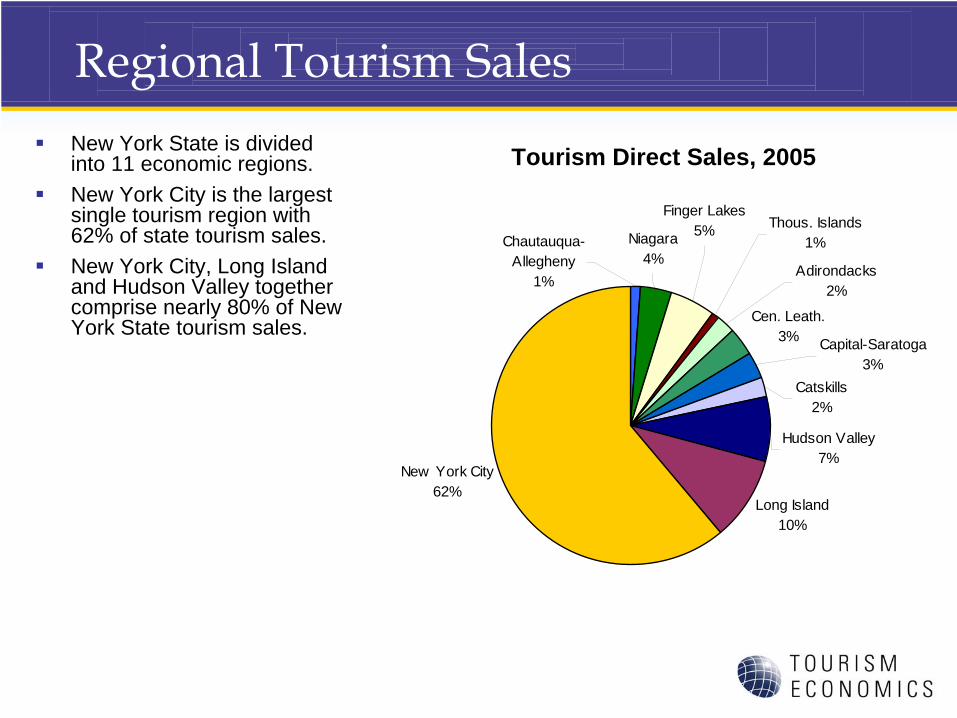
Regional Tourism SalesNew York State is divided into 11 economic regions.New York City is the largest single tourism region with 62% of state tourism sales.New York City, Long Island and Hudson Valley together comprise nearly 80% of New York State tourism sales.
Tourism Direct Sales, 2005
Long Island10%
New York City62%
Cen. Leath.3%
Adirondacks2%
Capital-Saratoga3%
Hudson Valley7%
Catskills2%
Finger Lakes5%Niagara
4%Chautauqua-
Allegheny1%
Thous. Islands1%
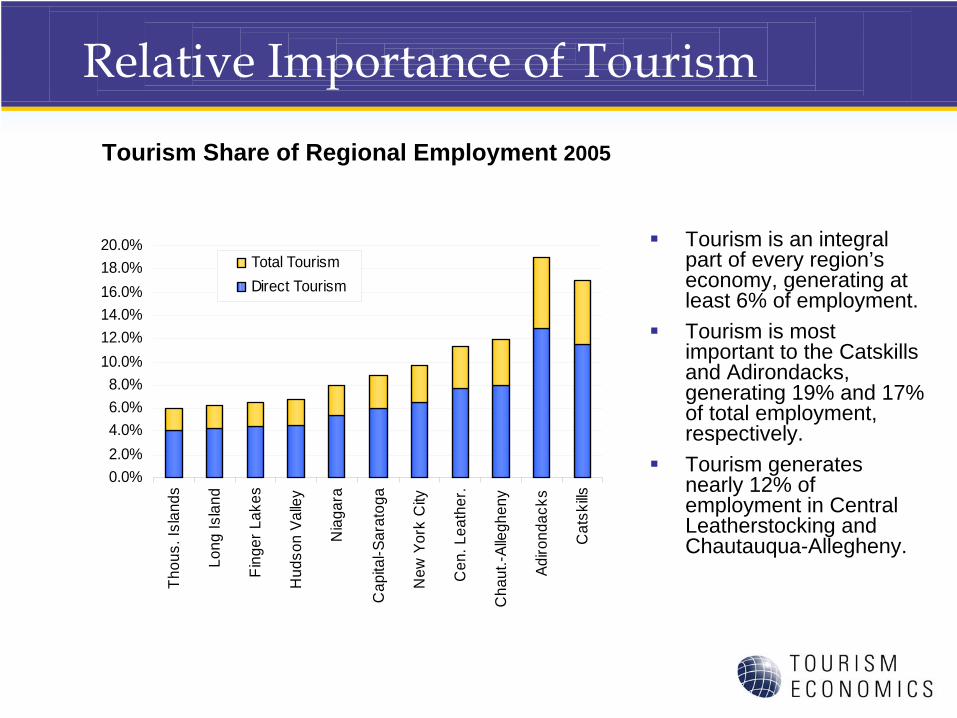
Relative Importance of Tourism
Tourism is an integral part of every region’s economy, generating at least 6% of employment.Tourism is most important to the Catskills and Adirondacks, generating 19% and 17% of total employment, respectively.Tourism generates nearly 12% of employment in Central Leatherstocking and Chautauqua-Allegheny.
Tourism Share of Regional Employment 2005
0.0%2.0%4.0%6.0%8.0%
10.0%12.0%14.0%16.0%18.0%20.0%
Thou
s. Is
land
s
Long
Isla
nd
Fing
er L
akes
Hud
son
Valle
y
Nia
gara
Cap
ital-S
arat
oga
New
Yor
k C
ity
Cen
. Lea
ther
.
Cha
ut.-A
llegh
eny
Adiro
ndac
ks
Cat
skills
Total TourismDirect Tourism
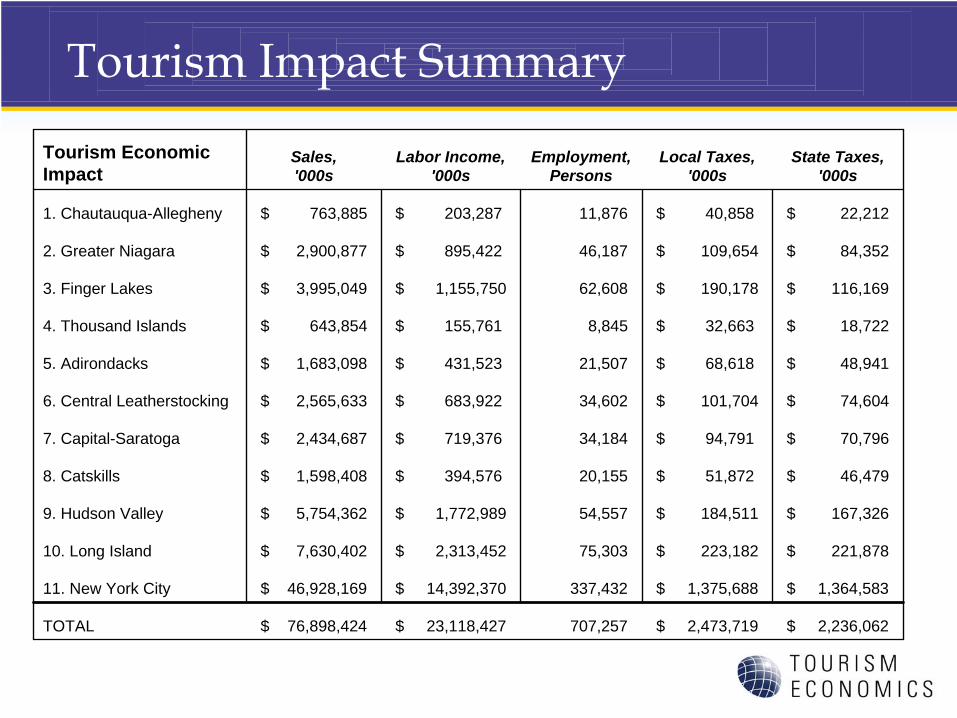
Tourism Impact Summary
Tourism Economic Impact
Sales, '000s
Labor Income, '000s
Employment, Persons
Local Taxes, '000s
State Taxes, '000s
1. Chautauqua-Allegheny $ 763,885 $ 203,287 11,876 $ 40,858 $ 22,212
2. Greater Niagara $ 2,900,877 $ 895,422 46,187 $ 109,654 $ 84,352
3. Finger Lakes $ 3,995,049 $ 1,155,750 62,608 $ 190,178 $ 116,169
4. Thousand Islands $ 643,854 $ 155,761 8,845 $ 32,663 $ 18,722
5. Adirondacks $ 1,683,098 $ 431,523 21,507 $ 68,618 $ 48,941
6. Central Leatherstocking $ 2,565,633 $ 683,922 34,602 $ 101,704 $ 74,604
7. Capital-Saratoga $ 2,434,687 $ 719,376 34,184 $ 94,791 $ 70,796
8. Catskills $ 1,598,408 $ 394,576 20,155 $ 51,872 $ 46,479
9. Hudson Valley $ 5,754,362 $ 1,772,989 54,557 $ 184,511 $ 167,326
10. Long Island $ 7,630,402 $ 2,313,452 75,303 $ 223,182 $ 221,878
11. New York City $ 46,928,169 $ 14,392,370 337,432 $ 1,375,688 $ 1,364,583
TOTAL $ 76,898,424 $ 23,118,427 707,257 $ 2,473,719 $ 2,236,062
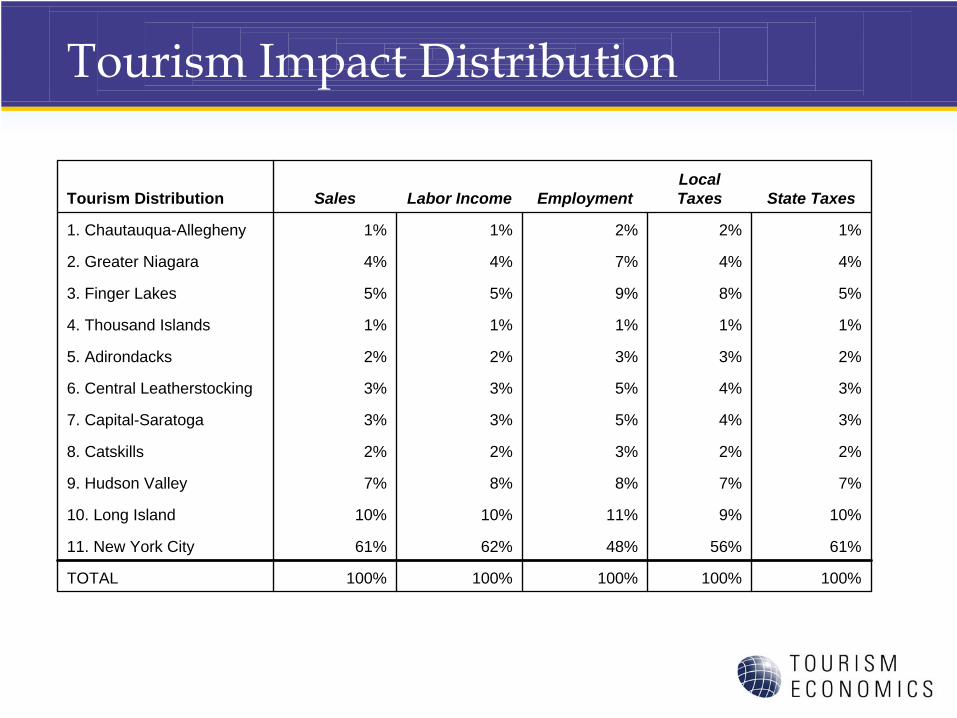
Tourism Impact Distribution
Tourism Distribution Sales Labor Income EmploymentLocal Taxes State Taxes
1. Chautauqua-Allegheny 1% 1% 2% 2% 1%
2. Greater Niagara 4% 4% 7% 4% 4%
3. Finger Lakes 5% 5% 9% 8% 5%
4. Thousand Islands 1% 1% 1% 1% 1%
5. Adirondacks 2% 2% 3% 3% 2%
6. Central Leatherstocking 3% 3% 5% 4% 3%
7. Capital-Saratoga 3% 3% 5% 4% 3%
8. Catskills 2% 2% 3% 2% 2%
9. Hudson Valley 7% 8% 8% 7% 7%
10. Long Island 10% 10% 11% 9% 10%
11. New York City 61% 62% 48% 56% 61%
TOTAL 100% 100% 100% 100% 100%

Region Detail
Region 8: Catskills
Region 8: Catskills Total Tourism Impact
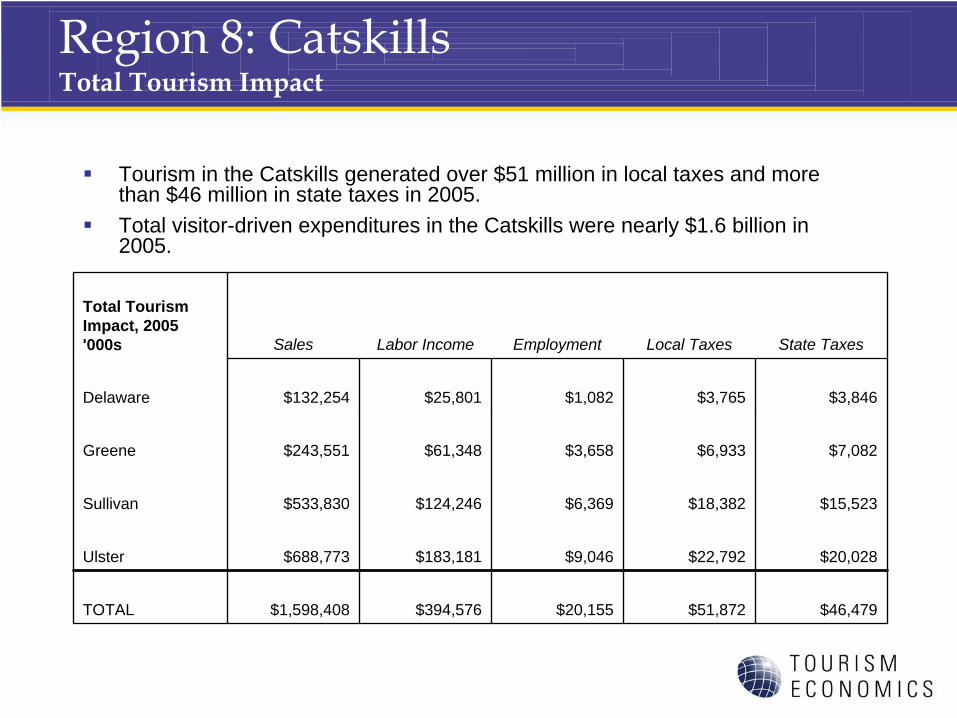
Tourism in the Catskills generated over $51 million in local taxes and more than $46 million in state taxes in 2005.Total visitor-driven expenditures in the Catskills were nearly $1.6 billion in2005.
Total Tourism Impact, 2005'000s Sales Labor Income Employment Local Taxes State Taxes
Delaware $132,254 $25,801 $1,082 $3,765 $3,846
Greene $243,551 $61,348 $3,658 $6,933 $7,082
Sullivan $533,830 $124,246 $6,369 $18,382 $15,523
Ulster $688,773 $183,181 $9,046 $22,792 $20,028
TOTAL $1,598,408 $394,576 $20,155 $51,872 $46,479
Region 8: Catskills Total Tourism Impact
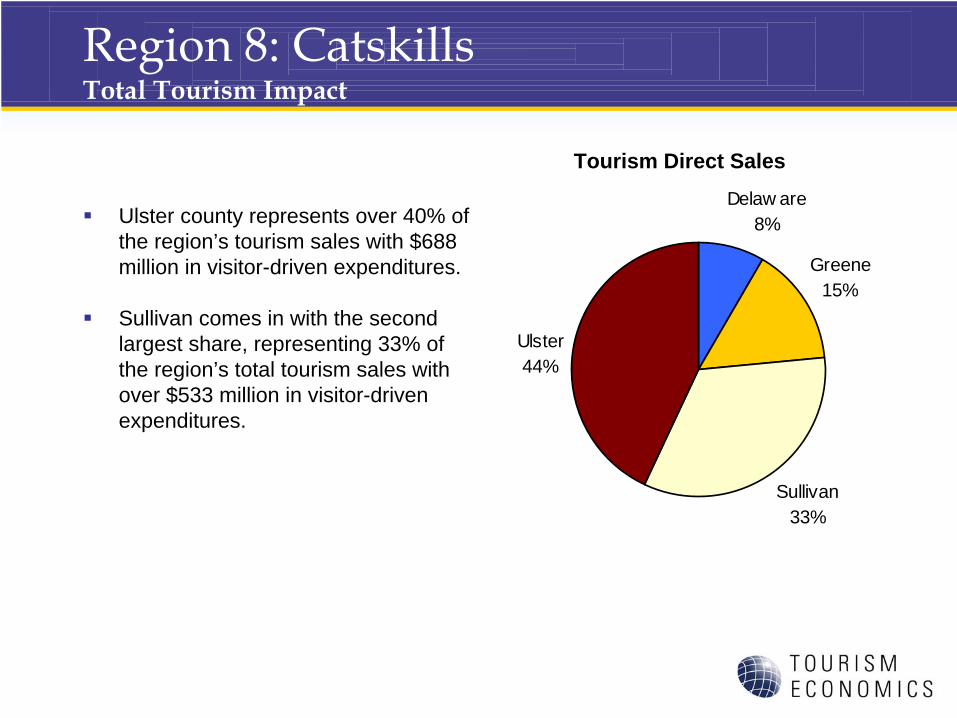
Ulster county represents over 40% of the region’s tourism sales with $688 million in visitor-driven expenditures.
Sullivan comes in with the second largest share, representing 33% of the region’s total tourism sales with over $533 million in visitor-driven expenditures.
Tourism Direct SalesDelaw are
8%
Greene15%
Sullivan33%
Ulster44%
Region 8: Catskills Tourism Sales
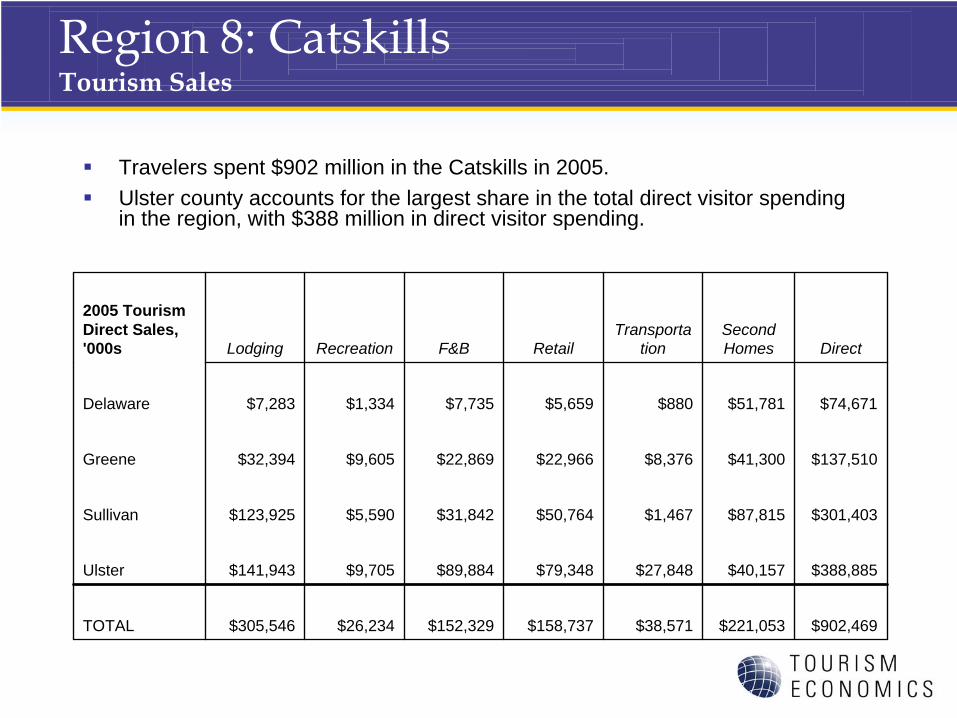
Travelers spent $902 million in the Catskills in 2005.Ulster county accounts for the largest share in the total direct visitor spending in the region, with $388 million in direct visitor spending.
2005 Tourism Direct Sales, '000s Lodging Recreation F&B Retail
Transporta tion
Second Homes Direct
Delaware $7,283 $1,334 $7,735 $5,659 $880 $51,781 $74,671
Greene $32,394 $9,605 $22,869 $22,966 $8,376 $41,300 $137,510
Sullivan $123,925 $5,590 $31,842 $50,764 $1,467 $87,815 $301,403
Ulster $141,943 $9,705 $89,884 $79,348 $27,848 $40,157 $388,885
TOTAL $305,546 $26,234 $152,329 $158,737 $38,571 $221,053 $902,469

Region 8: Catskills Tourism Sales
Spending related to Lodging comprised the largest share of sales at 34%.Spending related to Second Homes was the second largest category, at 24%.
Tourism Direct Sales
Lodging34%
Recreation3%
F&B17%
Transport.4%
Second Homes24%
Retail18%
Region 8: Catskills Tourism Labor Income
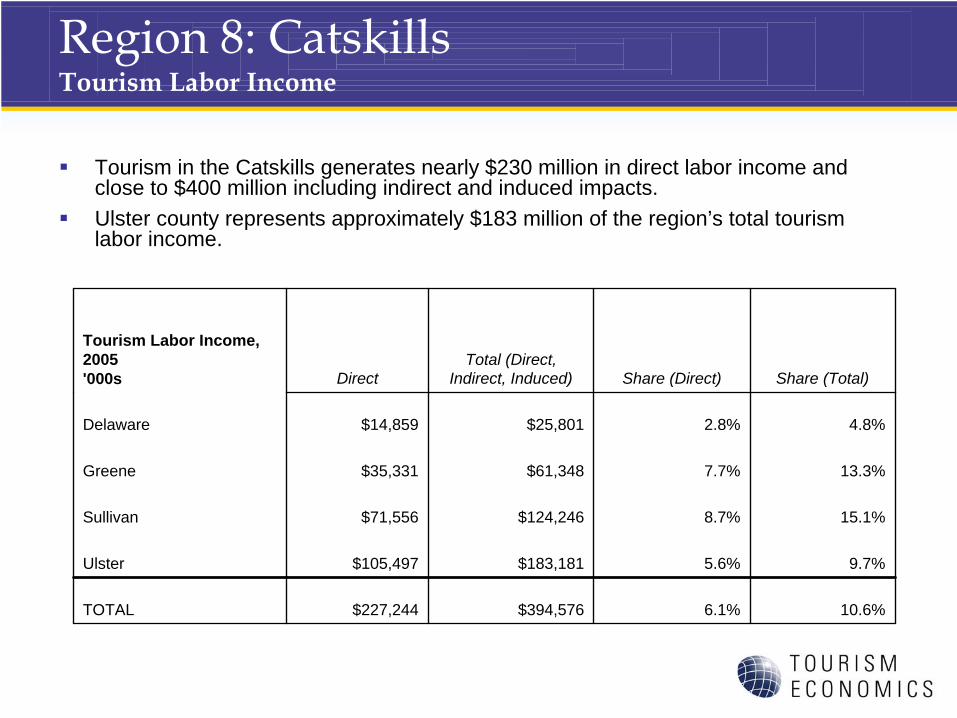
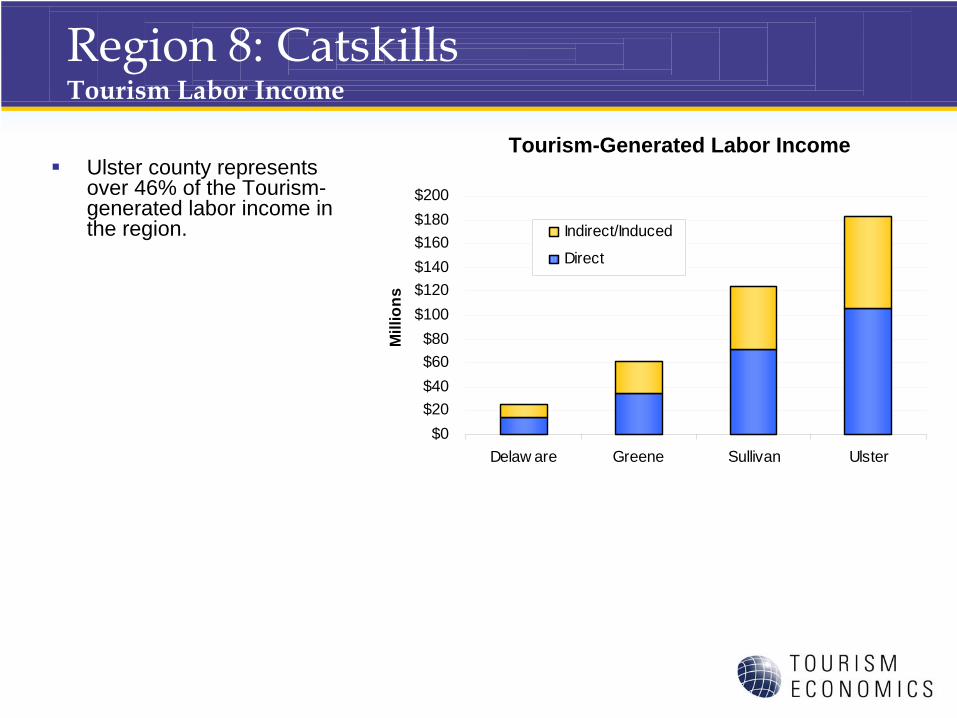
Tourism in the Catskills generates nearly $230 million in direct labor income and close to $400 million including indirect and induced impacts.Ulster county represents approximately $183 million of the region’s total tourism labor income.
Tourism Labor Income, 2005'000s Direct
Total (Direct, Indirect, Induced) Share (Direct) Share (Total)
Delaware $14,859 $25,801 2.8% 4.8%
Greene $35,331 $61,348 7.7% 13.3%
Sullivan $71,556 $124,246 8.7% 15.1%
Ulster $105,497 $183,181 5.6% 9.7%
TOTAL $227,244 $394,576 6.1% 10.6%
Region 8: Catskills Tourism Labor Income
Ulster county represents over 46% of the Tourism-generated labor income in the region.
Tourism-Generated Labor Income
$0$20$40$60$80
$100$120$140$160$180$200
Delaw are Greene Sullivan Ulster
Mill
ions
Indirect/Induced
Direct
Region 8: Catskills Tourism Labor Income
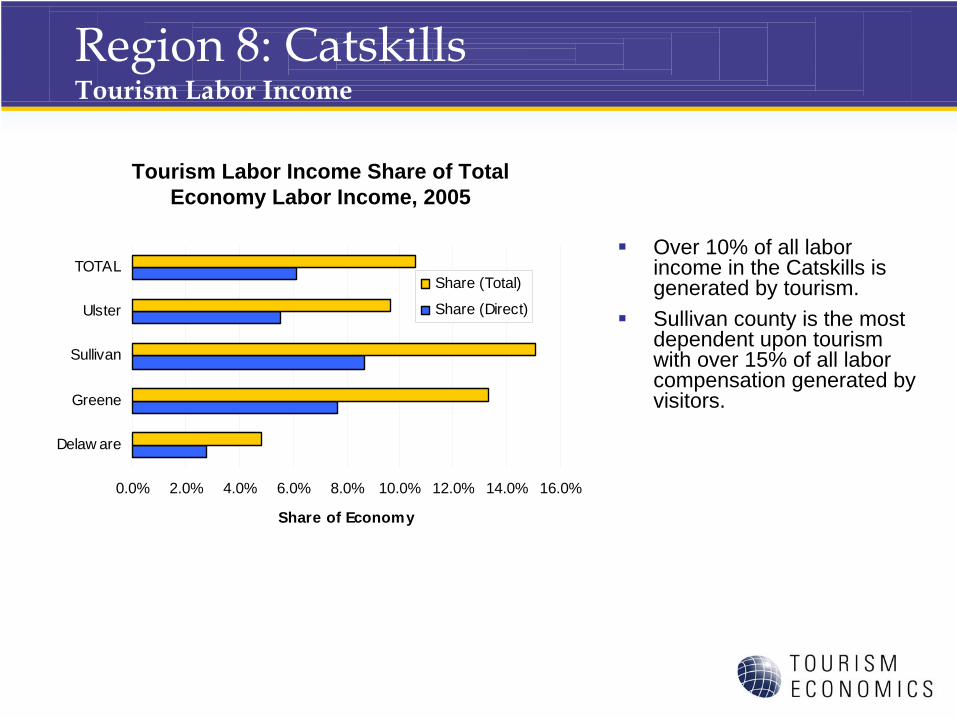
Over 10% of all labor income in the Catskills is generated by tourism.Sullivan county is the most dependent upon tourism with over 15% of all labor compensation generated by visitors.
Tourism Labor Income Share of Total Economy Labor Income, 2005
0.0% 2.0% 4.0% 6.0% 8.0% 10.0% 12.0% 14.0% 16.0%
Delaw are
Greene
Sullivan
Ulster
TOTAL
Share of Economy
Share (Total)
Share (Direct)
Region 8: Catskills Tourism Employment
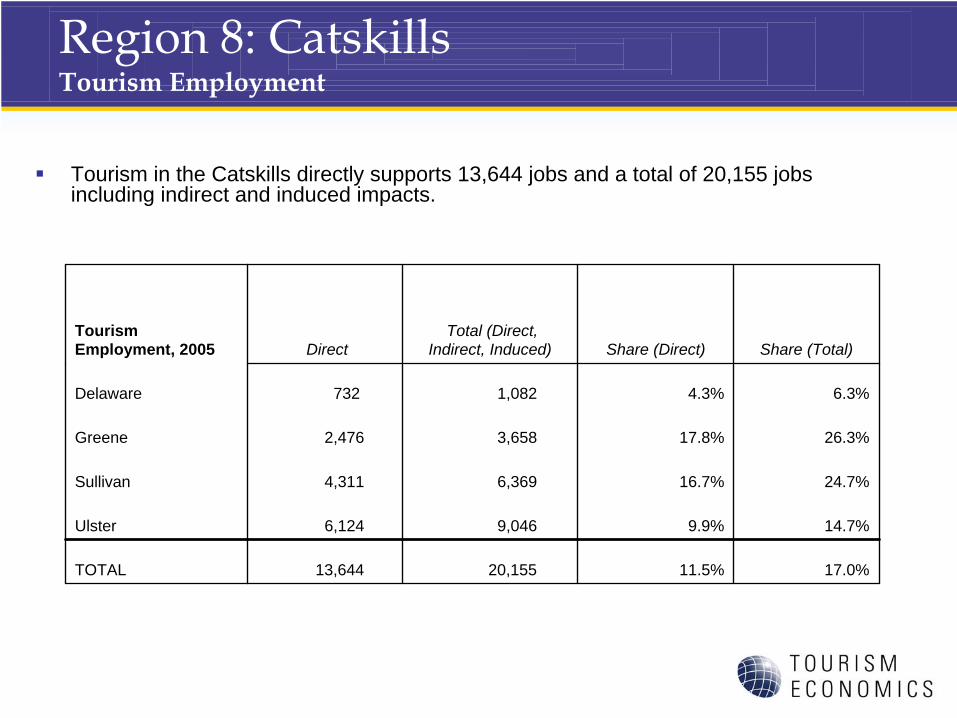
Tourism in the Catskills directly supports 13,644 jobs and a total of 20,155 jobs including indirect and induced impacts.
Tourism Employment, 2005 Direct
Total (Direct, Indirect, Induced) Share (Direct) Share (Total)
Delaware 732 1,082 4.3% 6.3%
Greene 2,476 3,658 17.8% 26.3%
Sullivan 4,311 6,369 16.7% 24.7%
Ulster 6,124 9,046 9.9% 14.7%
TOTAL 13,644 20,155 11.5% 17.0%
Region 8: Catskills Tourism Employment
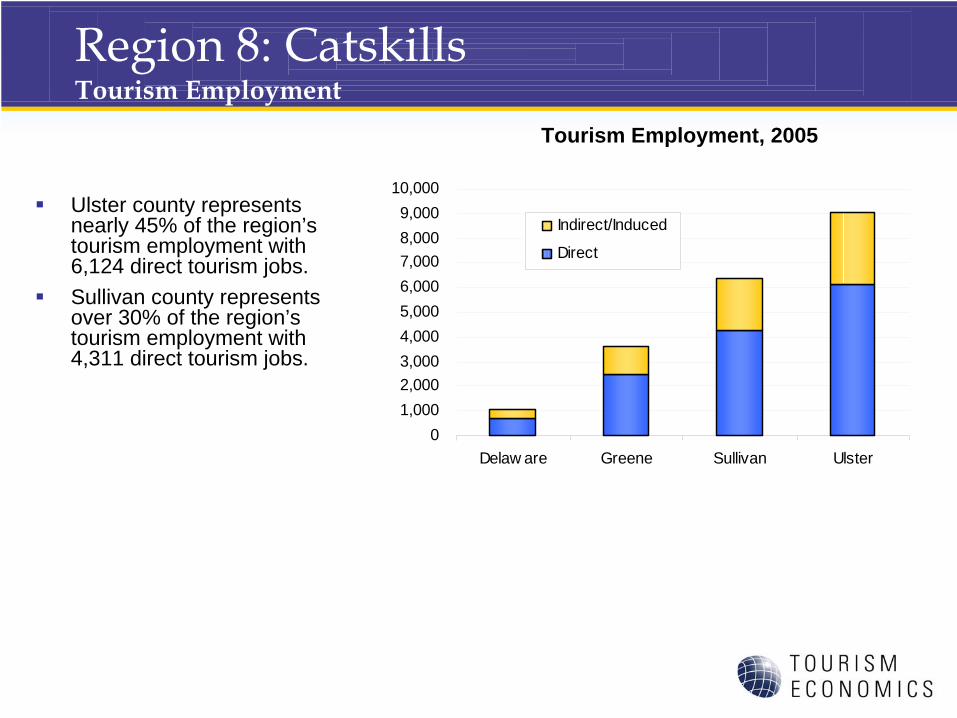
Ulster county represents nearly 45% of the region’s tourism employment with 6,124 direct tourism jobs.Sullivan county represents over 30% of the region’s tourism employment with 4,311 direct tourism jobs.
Tourism Employment, 2005
01,0002,0003,0004,0005,0006,0007,0008,0009,000
10,000
Delaw are Greene Sullivan Ulster
Indirect/Induced
Direct
Region 8: Catskills Tourism Employment
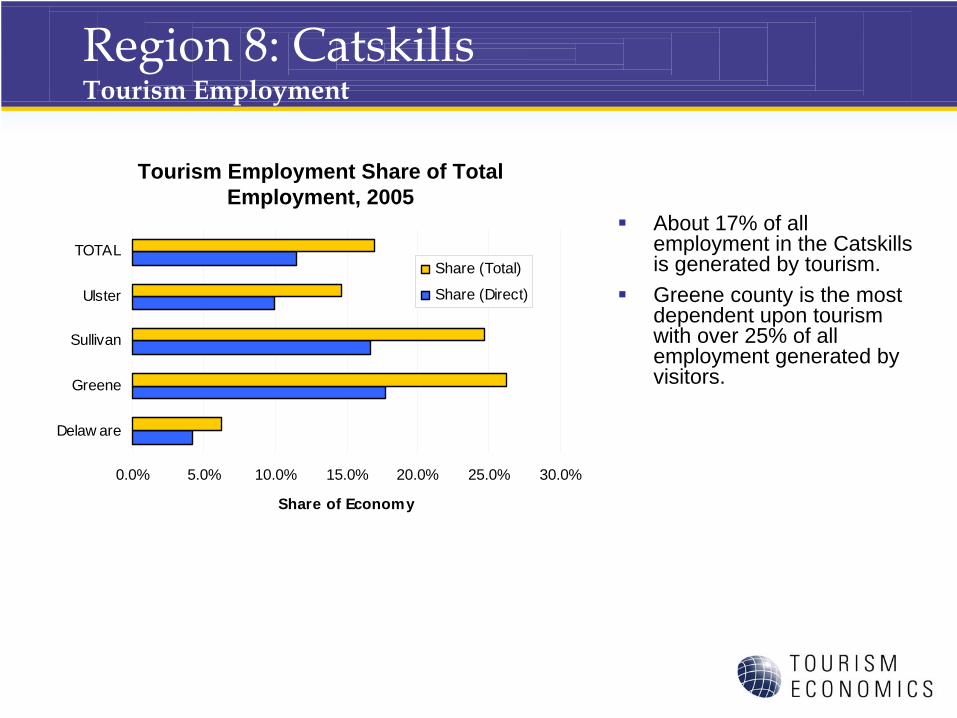
About 17% of all employment in the Catskills is generated by tourism.Greene county is the most dependent upon tourism with over 25% of all employment generated by visitors.
Tourism Employment Share of Total Employment, 2005
0.0% 5.0% 10.0% 15.0% 20.0% 25.0% 30.0%
Delaw are
Greene
Sullivan
Ulster
TOTAL
Share of Economy
Share (Total)
Share (Direct)
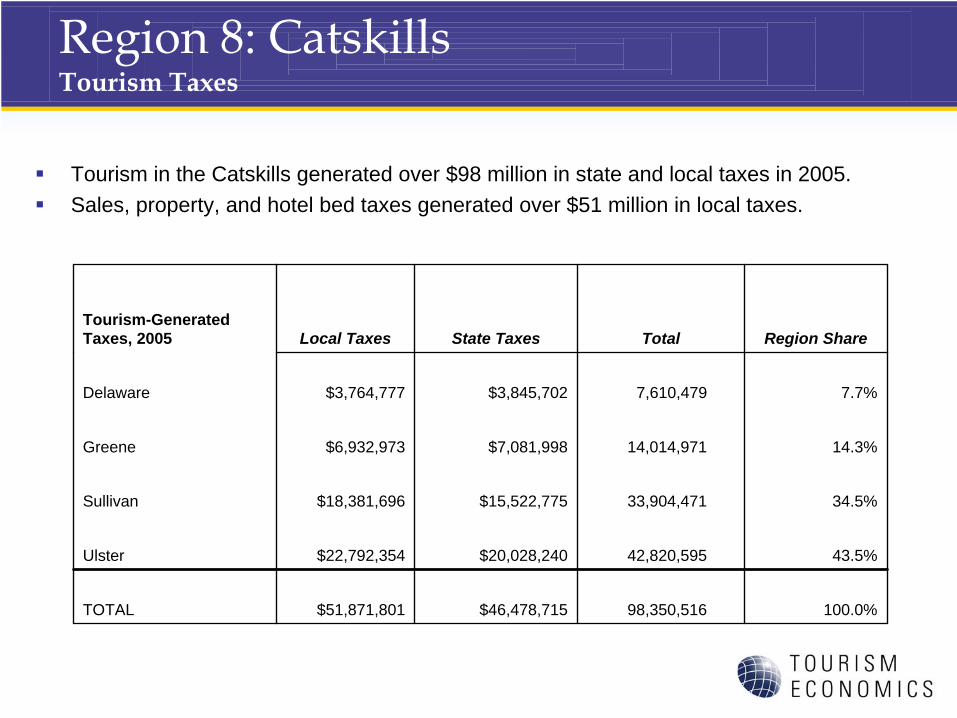
Region 8: Catskills Tourism Taxes
Tourism in the Catskills generated over $98 million in state and local taxes in 2005.Sales, property, and hotel bed taxes generated over $51 million in local taxes.
Tourism-Generated Taxes, 2005 Local Taxes State Taxes Total Region Share
Delaware $3,764,777 $3,845,702 7,610,479 7.7%
Greene $6,932,973 $7,081,998 14,014,971 14.3%
Sullivan $18,381,696 $15,522,775 33,904,471 34.5%
Ulster $22,792,354 $20,028,240 42,820,595 43.5%
TOTAL $51,871,801 $46,478,715 98,350,516 100.0%

Region 8: Catskills Tourism Taxes
Ulster county produces over 43% of the region’s tourism tax base.
Tourism Taxes, 2005
$0$5
$10$15
$20$25
$30$35
$40$45
Delaw are Greene Sullivan Ulster
Mill
ions
Local State
Methodological Notes
• Employment definitions. The basis of our data and modeling is the Regional Economic Information System (REIS), Bureau of Economic Analysis, U.S. Department of Commerce. This is different than the NYS Department of Labor data source (ES202/QCEW). The main definitional difference is that sole-proprietors, which do not require unemployment insurance and are not counted in the ES202 data. BEA data shows (for example) state accommodations employment at 89,124, compared with QCEW at 82,190. For total employment (across all sectors), the difference is 20%.
• International methodology. Our approach (through Travel Industry Association calculations) is based the estimates on direct survey responses to the Department of Commerce in-flight survey and Statistics Canada data – constrained to BEA international balance of payments data. The NY data are consistent with TIA’s state-by-state distribution which ensures against overestimation.
• Bottom-up vs. top-down. We have based our research on tourism expenditure analysis from surveys and controls to known industry measurements for key tourism sectors.
Methodological Notes
• Local taxes are a build-up of individual categories (sales, occupancy, property). The model is not equipped to deal with individual exemptions such as Indian gaming.
• Second home expenditures are based on the stock of seasonal second home inventory. Annual average expenditures for housing are pro-rated to the season length to account for various levels of expenditures not accounted in visitor surveys.
• Lodging sector. Our models use survey information and constrains this to the value of the hotel sector in each county. This can vary from from certain bed tax estimates of total revenue for several reasons. One is that the bed tax may only be based on room revenue while total sales for the industry may include other revenue sources (room service, phone, etc.). Another is that certain smaller establishments may not fully report or be required to report their revenue.
About Tourism Economics
• Tourism Economics, headquartered in Philadelphia, is a distinct unit of Oxford Economics USA dedicated to providing high value, robust, and relevant analyses of the tourism sector that reflects the dynamics of local and global economies. By combining quantitative methods with industry knowledge, Tourism Economics designs custom market strategies, project feasibility analysis, tourism forecasting models, tourism policy analysis, and economic impact studies.
• Oxford Economics USA is one of the world’s leading providers of economic analysis, forecasts and consulting advice. Its services cover three main areas: economic forecasts, for around 200 countries globally and over 70 sectors; user-friendly economic models for scenario analysis and policy assessment; and economic consultancy, including detailed work for the tourism and aviation sectors.
• Founded in 1981 as a joint venture with Oxford University’s business college, Oxford Economics has an excellent reputation for high quality, quantitative analysis and evidence-based advice. For this, it draws on its own staff of 30 highly-experienced professional economists; a dedicated data analysis team; global modeling tools; close links with Oxford University, and a range of partner institutions in Europe, the US and in the United Nations Project Link.