the economic impact of the creative sector in austin – 2012 update
TRANSCRIPT

The Economic Impact of the Creative
Sector in Austin – 2012 UPDATE
TXP, Inc. 1310 South 1st Street, #105 Austin, Texas 78704 (512) 328‐8300 phone (512) 462‐1240 fax www.txp.com
Austin Creative Sector Economic Impact UPDATE | February 2012
Table of Contents
Summary .................................................................................................................................... 1
Overview .................................................................................................................................... 2
The Situation in Austin ........................................................................................................... 2
Definitions and Assumptions Used in the Modeling Process ................................................... 4
Definitions .............................................................................................................................. 4
Assumptions ........................................................................................................................... 4
Economic Impact Methodology ............................................................................................. 5
Summary Results ....................................................................................................................... 6
Music .......................................................................................................................................... 7
Previous Analysis .................................................................................................................... 7
The Current State of Austin’s Music Sector ............................................................................ 8
Film and Visual Media ............................................................................................................... 9
Previous Analysis .................................................................................................................... 9
The Current State of Austin’s Film and Visual Media Sector ................................................ 10
Gaming and Digital Media ....................................................................................................... 11
Previous Analysis .................................................................................................................. 11
The Current State of Austin’s Gaming and Digital Media Sector ......................................... 12
Not‐for‐Profit Arts .................................................................................................................... 13
Previous Analysis .................................................................................................................. 13
The Current State of Austin’s Creative Not‐for‐Profits ........................................................ 13
Findings .................................................................................................................................... 15
Finding #1 ............................................................................................................................. 15
Finding #2 ............................................................................................................................. 15
Finding #3 ............................................................................................................................. 16
Finding #4 ............................................................................................................................. 16
Finding #5 ............................................................................................................................. 17
Finding #6 ............................................................................................................................. 18
Recommendations ................................................................................................................... 19

Austin Creative Sector Economic Impact UPDATE | February 2012
Recommendation #1 ............................................................................................................ 19
Recommendation #2 ............................................................................................................ 19
Recommendation #3 ............................................................................................................ 20
Recommendation #4 ............................................................................................................ 20
Recommendation #5 ............................................................................................................ 21
Recommendation #6 ............................................................................................................ 21
Conclusion ................................................................................................................................ 22
Appendix 1: Detailed Economic Impacts by Sector ............................................................... 23
A1.1: Detailed Music Economic Impacts (2010) .................................................................. 23
A1.2: Detailed Film Economic Impacts (2010) ..................................................................... 24
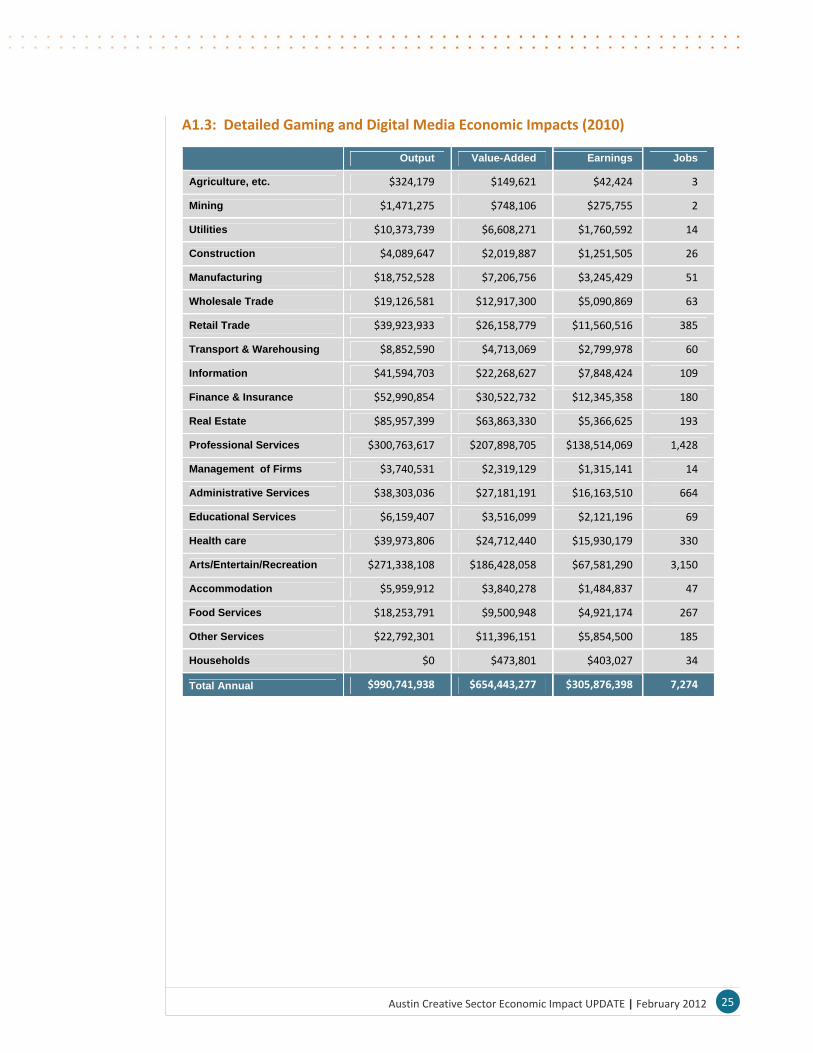
A1.3: Detailed Gaming and Digital Media Economic Impacts (2010) .................................. 25
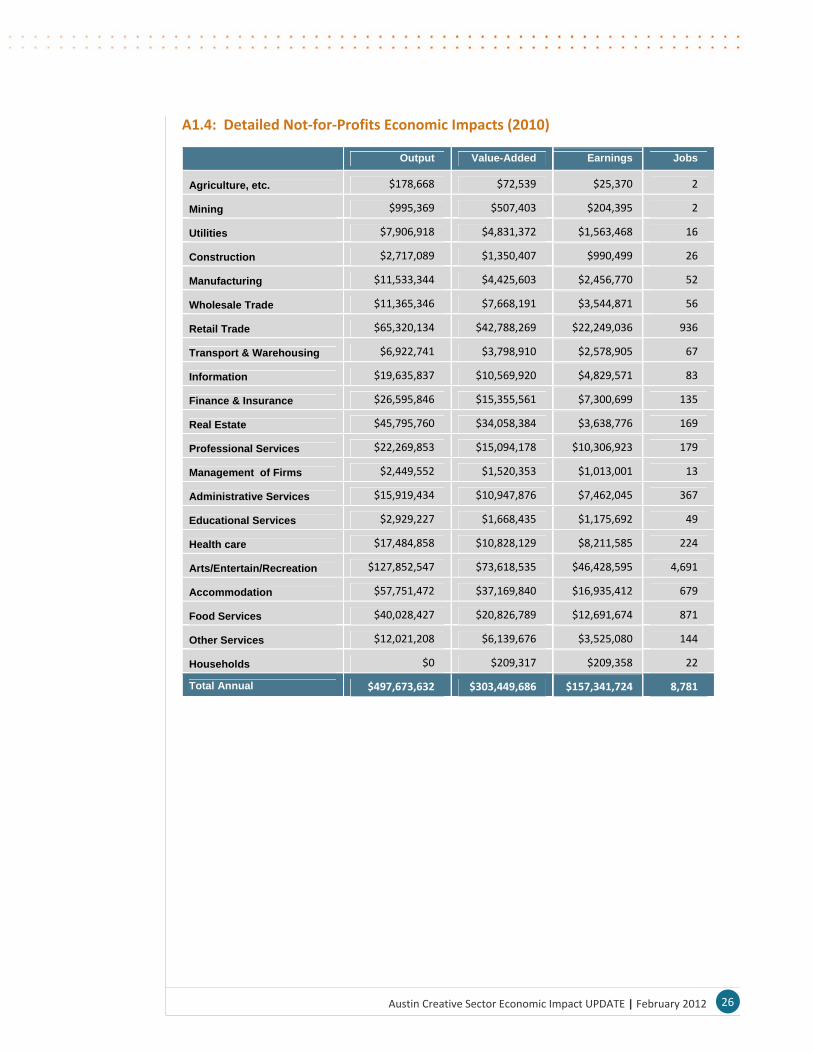
A1.4: Detailed Not‐for‐Profits Economic Impacts (2010) .................................................... 26
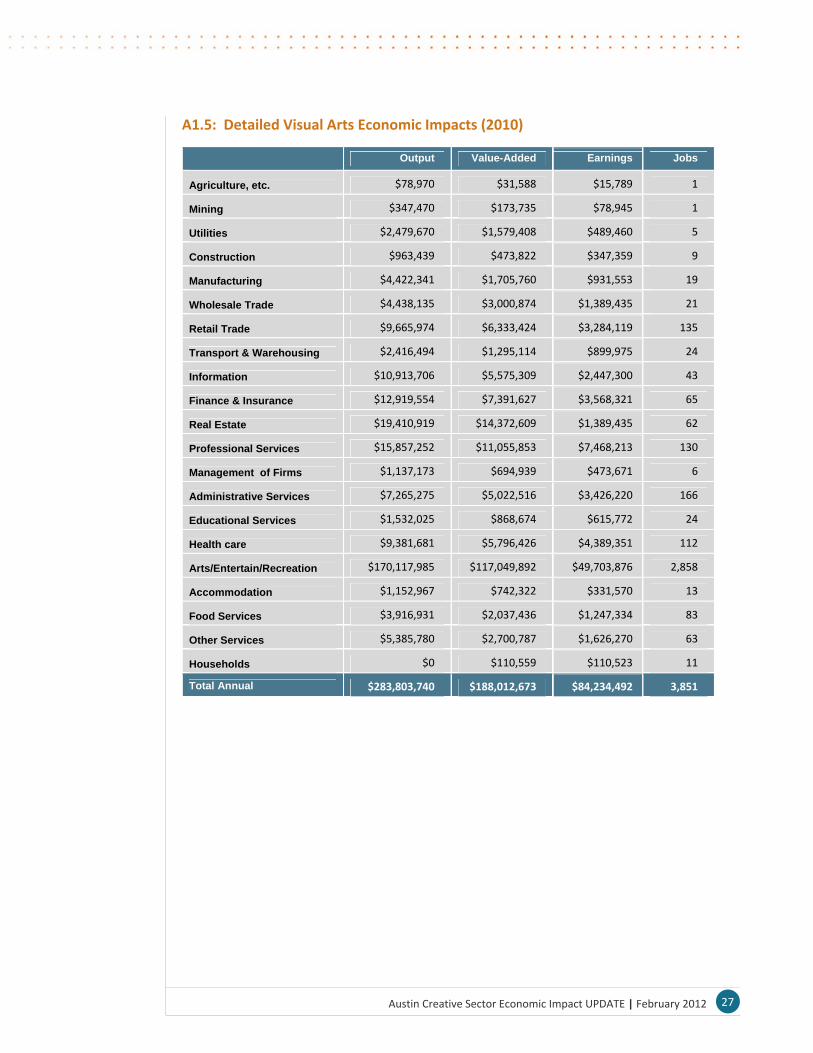
A1.5: Detailed Visual Arts Economic Impacts (2010) .......................................................... 27
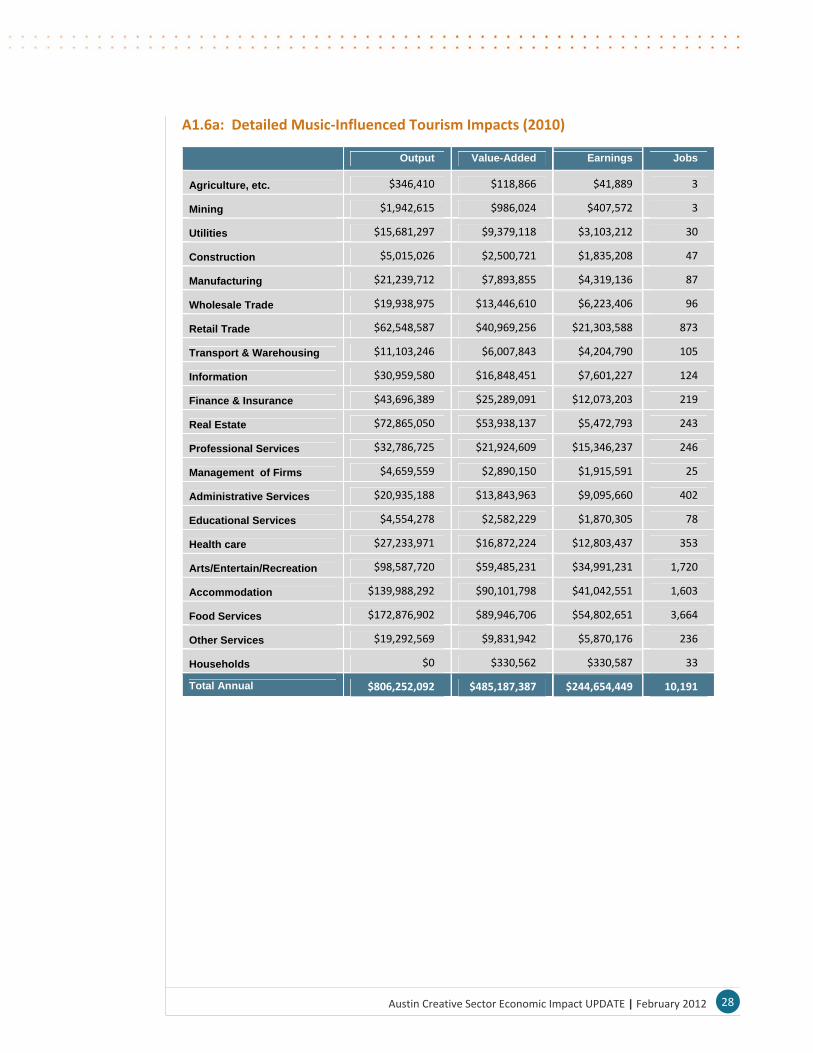
A1.6a: Detailed Music‐Influenced Tourism Impacts (2010) ................................................ 28
A1.6b: Detailed Other Culture‐Influenced Tourism Impacts (2010) ................................... 29
Appendix 2: Detailed Occupational Data ............................................................................... 30
A2.1: Austin‐Round Rock, TX Arts‐Related Occupations (2010) .......................................... 31
A2.2: Charlotte‐Gastonia‐Concord, NC‐SC Arts‐Related Occupations (2010) ..................... 32
A2.3: Columbus, OH Arts‐Related Occupations (2010) ....................................................... 33
A2.4: Dallas‐Plano‐Irving, TX Arts‐Related Occupations (2010) .......................................... 34
A2.5: Fort Worth‐Arlington, TX Arts‐Related Occupations (2010) ...................................... 35
A2.6: Houston‐Sugar Land‐Baytown, TX Arts‐Related Occupations (2010) ........................ 36
A2.7: Indianapolis‐Carmel, IN Arts‐Related Occupations (2010) ........................................ 37
A2.8: Memphis, TN‐MS‐AR Arts‐Related Occupations (2010) ............................................ 38
A2.9: Nashville‐Davidson‐Murfreesboro, TN Arts‐Related Occupations (2010) ................. 39
A2.10: Portland‐Vancouver, OR‐WA Arts‐Related Occupations (2010) .............................. 40
A2.11: San Antonio, TX Arts‐Related Occupations (2010) ................................................... 41
A2.12: San Francisco‐Oakland‐Fremont, CA Arts‐Related Occupations (2010) .................. 42
Appendix 3: Focus Group Participants .................................................................................... 43
Music Focus Group Participants ........................................................................................... 43
Austin Creative Sector Economic Impact UPDATE | February 2012
Film and Visual Media Focus Group Participants ................................................................. 43
Gaming and Digital Media Focus Group Participants ........................................................... 44
Not‐for‐Profit Arts Focus Group Participants ....................................................................... 44
Appendix 4: Focus Group Notes .............................................................................................. 45
A4.1 Film Focus Group .......................................................................................................... 45
A4.2 Video Games and Digital Media Focus Group .............................................................. 49
A4.3 Non‐Profit Arts Focus Group ........................................................................................ 52
A4.4 Music Focus Group ....................................................................................................... 57
Legal Disclaimer ....................................................................................................................... 60

Austin Creative Sector Economic Impact UPDATE | February 2012
List of Figures
Figure 1: Austin MSA Technology Employment ........................................................................ 3
Figure 2: The Flow of Economic Impacts ................................................................................... 5
Figure 3: Location of Live Music Venues in Central Austin ........................................................ 7
Figure 4: Reported Employment in Motion Picture & Video Production in Austin ................... 9
Figure 5: Location of Gaming Firms in Austin ........................................................................... 11
Figure 6: Performing Arts Companies per 100,000 Residents (2010) ..................................... 13
Figure 7: Reported 990 Revenue for Travis County Registered Organizations (preceding 12
Months, $Millions) ................................................................................................................... 14
Figure 8: Arts, Entertainment, Design Occupations Share of Total MSA Employment (2010) 15
List of Tables
Table 1: 2010 Economic Impact of the Creative Sector in Austin ($Millions) ............................ 1
Table 2: Total Creative Sector Economic Impacts in 2005 ($Millions) ...................................... 6
Table 3: Total Creative Sector Economic Impacts in 2010 ........................................................ 6
Table 4: State Film Incentives ($8 Million Budget) .................................................................. 16

1Austin Creative Sector Economic Impact UPDATE | February 2012
Summary
As part of a broader City focus on creativity and its role in the community, TXP has evaluated
the relationship between culture, creativity, and economic activity locally for the past
decade. This paper provides an update to the previous assessments (in some cases, moving
the baseline forward to 2005), and documents creative sector issues that emerged from
focus groups and individual stakeholder conversations.
Table 1: 2010 Economic Impact of the Creative Sector in Austin ($Millions)
2010 Output Value‐Added Earnings Jobs City Tax Rev.
Music $856.10 $325.63 $156.52 7,957 $9.66
Film $282.70 $187.96 $73.66 2,748 $1.08
Gaming $990.74 $256.27 $122.58 7,274 $1.21
Not-for-Profit $497.67 $303.45 $157.34 8,781 $5.66
Visual Arts $283.80 $143.92 $64.48 3,851 $3.23
Tourism/Music $806.25 $485.19 $244.65 10,191 $28.40
Tourism/Other $634.61 $381.90 $192.57 8,021 $22.35
Total Annual $4,351.88 $2,084.31 $1,011.80 48,822 $71.60
Source: TXP
The role of the creative sector in Austin’s economy has grown substantially, accounting in
2010 for just over $4.35 billion in economic activity (about one‐third more than the revised
baseline figure for 2005), over $71 million in City tax revenues, and almost 49,000 jobs. To
put these results in context, the creative sector (as measured by employment) has risen by
about twenty‐five percent over the past five years, a pace more rapid than the ten percent
growth for the local economy as a whole.
Much energy and effort has gone into identifying the reasons that prompt many analysts to
find Austin so appealing, with widespread opportunities in the creative sector clearly a major
factor. Austin is a place that appreciates creativity and culture in a variety of evolving forms,
which serves to both attract and retain talented people. This in turn has a significant impact
on business recruitment, retention, and expansion, as well as local entrepreneurship. As has
long been the case, the sum is greater than the parts; and the parts have become so inter‐
connected as to make traditional distinctions between them almost meaningless. As Austin
looks to its economic development future, creativity is a fundamental comparative
advantage – the goal is to identify the key investments, policies, and regulatory changes that
can support the infrastructure necessary for sustainable growth.
2Austin Creative Sector Economic Impact UPDATE | February 2012
Overview
The connection between culture, creativity, and economic activity is increasingly understood,
and has been a strategic focus for the City for some time. TXP has addressed this
relationship locally for the past decade, beginning with measuring the economic impact of
music in 2001, film in 2004, an update of multiple sectors during 2005, and then a gaming
analysis in 2006. This paper provides a second update to the measurements done previously,
reflecting revised multipliers and a common 2005 base year, and documents issues
influencing the creative sector that emerged from focus groups and individual stakeholder
conversations. Each segment of the creative sector is addressed in an individual section,
including a review of previous analysis, the quantitative update of the current economic and
City tax revenue impact, and a status report that reflects both analysis and input from
stakeholders. The report concludes with a brief discussion of the overall findings and
recommendations related to the role of the creative sector in the Austin economy.
The Situation in Austin
The overall economic recovery continues in Austin, as most measures of the local economy
have been on the upswing for some time. This trend should carry forward into 2012, as the
likelihood of no significant national monetary policy action in an election year and better‐
than‐anticipated news on the state employment front combine with a recovering private
sector to create modest economic growth. This anticipated growth (and the fact that Austin
remains one of the brighter lights on the national economic horizon) has led to some
recovery in the local real estate market, especially in the multifamily sector. However, job
growth remains below the historic trend, and many of the new jobs created recently are
relatively low‐paying. As a result, economic development continues to be a high priority.
The return on investment associated with economic development is normally a longer‐term
payback, as external events tend to drive the fortunes of the local economy in the near term,
per the recent real estate bust and recession. The community can have a more significant
influence on its economic future over the longer run. Austin’s future continues to depend on
a highly capable workforce, innovation, and entrepreneurship, clusters in knowledge
industries, the presence of a world‐class research university and other institutions of higher
learning, and strong community institutions. This mix of assets prompted The Atlantic to
recently rank the Austin area second among U.S. regions on its index of “well‐being,” third in
opportunities for recent college graduates, and eighth “most‐resilient” city.
All of the above is built, at least in part, on the interrelationship between creativity,
innovation, and quality of life in Austin. The connection between creativity and innovation
has been explored in depth, and it is clear that much of the incremental growth of the local
economy has been in sectors of the economy that rely on knowledge and creativity to

3Austin Creative Sector Economic Impact UPDATE | February 2012
generate value. This has occurred as the overall tech sector employment base has declined.
In 1990, technology directly accounted for 10.4 percent of Austin’s job base, a figure that
peaked at 12.9 during 2000. By 2010, tech employment had fallen to 8.4 percent of regional
employment. Moreover, the composition of the tech sector has changed over the past
twenty years, with growth in “soft” tech (Services, ie, research and development, software,
etc.) set against the decline in “hard” tech (Products, ie, semiconductors, etc.). This speaks
to creativity and innovation; while each has a role in the creation of tech products, they are
especially integral to the creation of value on the soft tech side.
Figure 1: Austin MSA Technology Employment
Sources: Tech America, Bureau of Labor Statistics, TXP
At the same time, quality of life, an umbrella term that loosely covers variables such as
recreational and cultural amenities, overall cost of living, diversity of local residents, and a
sense of place that is at least partially informed by land, water, and the physical
environment, is an increasingly important factor in economic development. This is especially
the case in Austin, where there is a strong sense that the above factors combine in a unique
and special way that serves to attract and retain both residents and firms. While the direct
creative sector economic impact is the focus of this analysis, this larger “culture of Austin”
context should be kept in mind in evaluating policies, procedures, and investments that could
emerge from the findings.
4Austin Creative Sector Economic Impact UPDATE | February 2012
Definitions and Assumptions Used in the Modeling Process
Definitions
Any effort to measure the role of the creative sector in a local economy will by definition
involve classification decisions by the analyst, since the creative sector does not map directly
to standard industrial classification patterns. In this case, TXP has defined six broad
categories of activity as comprising the creative sector:
1) Music (which includes production, music video, industry, tour, and recording services, performers, and commercial music);
2) Film and visual media (including film, television, and commercial production); 3) Gaming and digital media; 4) Not‐for‐profit arts groups; 5) Visual arts (galleries, photographers, and other commercial visual artists); and 6) Culture‐related tourism (broken down into tourism influenced by music and other
culture‐influenced tourism).
These categorizations are by no means definitive, but represent TXP’s best effort to capture
the range and scope of Austin’s cultural economic activity in a manner that is both
reasonably comprehensive and consistent with our previous local work in this area.
Assumptions
Since much of this analysis is an update of previous work by TXP, data on the direct impact of
film, music, gaming, and the not‐for‐profits arts community was either obtained from the
original sources or projected forward from the recently available baseline information from
public sources. New information was developed to estimate the role of the cultural arts in
Austin’s tourism industry through several studies commissioned by The Austin Convention &
Visitors Bureau1. These studies examined, among other things, the relative appeal of
attractions that brought visitors to Austin. Once the scores were normalized, questions
concerning the variety of attractions in general, the range of art and cultural offerings
available, and music and nightlife were used (in combination with data on tourism in the
Austin area from D.K. Shifflet maintained by the Governor’s Office of Economic
Development) to calculate the role of music and the cultural arts in bringing tourists to
Austin.
Updates to the 2005 Figures
Updates to both the baseline data provided by the government and the multipliers used to
estimate the ripple effects have prompted us to re‐run the data for 2005 in an attempt touse
the best, most current data available, as well as to provide a consistent basis for comparison.
1 http://www.austintexas.org/media/media_toolkit/research__resources
5Austin Creative Sector Economic Impact UPDATE | February 2012
Economic Impact Methodology
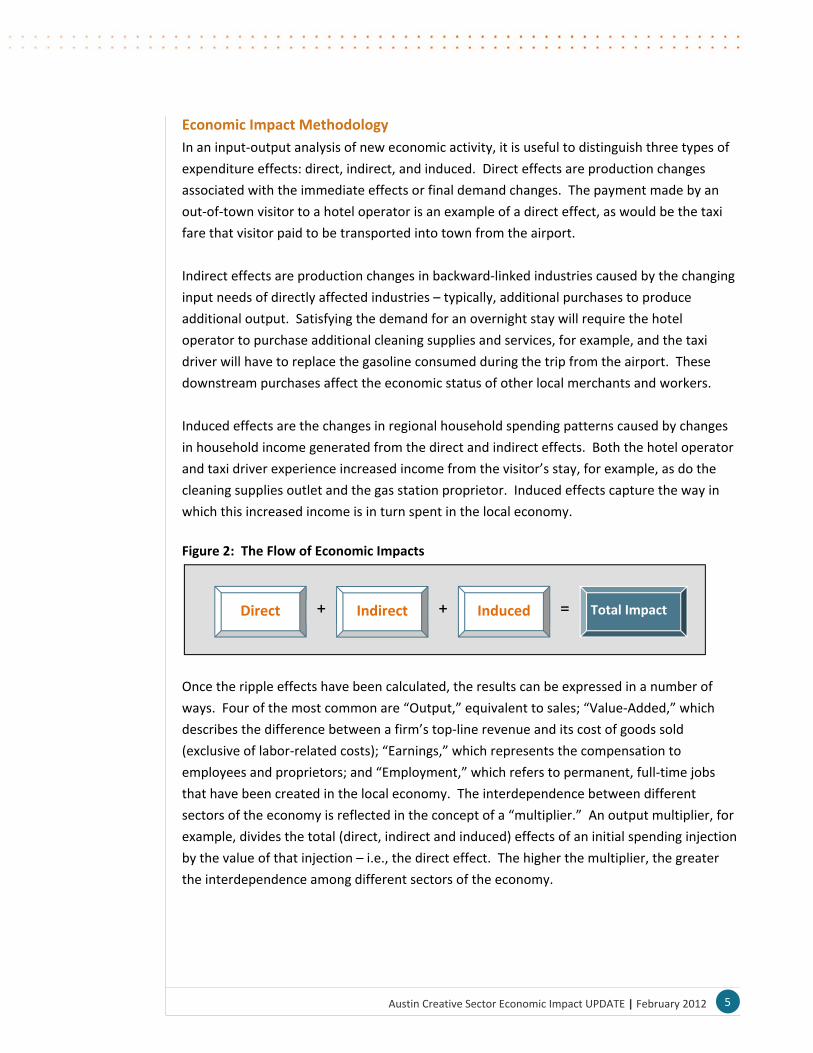
In an input‐output analysis of new economic activity, it is useful to distinguish three types of
expenditure effects: direct, indirect, and induced. Direct effects are production changes
associated with the immediate effects or final demand changes. The payment made by an
out‐of‐town visitor to a hotel operator is an example of a direct effect, as would be the taxi
fare that visitor paid to be transported into town from the airport.
Indirect effects are production changes in backward‐linked industries caused by the changing
input needs of directly affected industries – typically, additional purchases to produce
additional output. Satisfying the demand for an overnight stay will require the hotel
operator to purchase additional cleaning supplies and services, for example, and the taxi
driver will have to replace the gasoline consumed during the trip from the airport. These
downstream purchases affect the economic status of other local merchants and workers.
Induced effects are the changes in regional household spending patterns caused by changes
in household income generated from the direct and indirect effects. Both the hotel operator
and taxi driver experience increased income from the visitor’s stay, for example, as do the
cleaning supplies outlet and the gas station proprietor. Induced effects capture the way in
which this increased income is in turn spent in the local economy.
Figure 2: The Flow of Economic Impacts
Once the ripple effects have been calculated, the results can be expressed in a number of
ways. Four of the most common are “Output,” equivalent to sales; “Value‐Added,” which
describes the difference between a firm’s top‐line revenue and its cost of goods sold
(exclusive of labor‐related costs); “Earnings,” which represents the compensation to
employees and proprietors; and “Employment,” which refers to permanent, full‐time jobs
that have been created in the local economy. The interdependence between different
sectors of the economy is reflected in the concept of a “multiplier.” An output multiplier, for
example, divides the total (direct, indirect and induced) effects of an initial spending injection
by the value of that injection – i.e., the direct effect. The higher the multiplier, the greater
the interdependence among different sectors of the economy.
Indirect Induced Total ImpactDirect + + =
6Austin Creative Sector Economic Impact UPDATE | February 2012
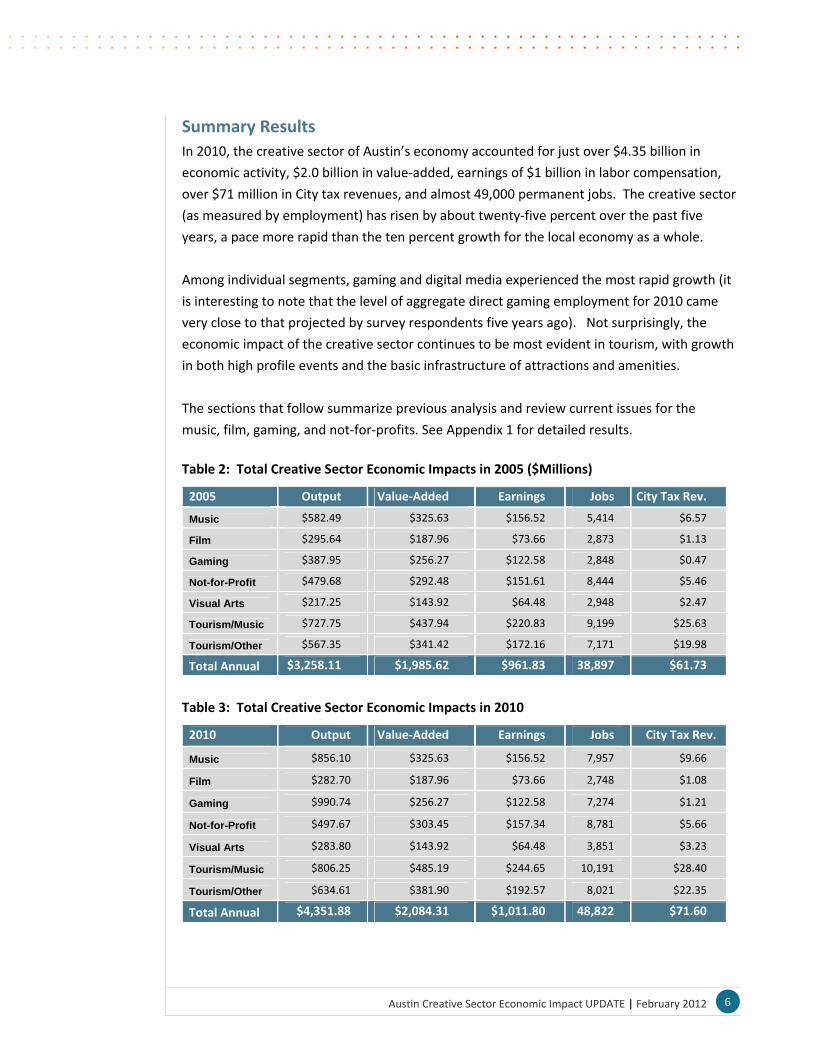
Summary Results
In 2010, the creative sector of Austin’s economy accounted for just over $4.35 billion in
economic activity, $2.0 billion in value‐added, earnings of $1 billion in labor compensation,
over $71 million in City tax revenues, and almost 49,000 permanent jobs. The creative sector
(as measured by employment) has risen by about twenty‐five percent over the past five
years, a pace more rapid than the ten percent growth for the local economy as a whole.
Among individual segments, gaming and digital media experienced the most rapid growth (it
is interesting to note that the level of aggregate direct gaming employment for 2010 came
very close to that projected by survey respondents five years ago). Not surprisingly, the
economic impact of the creative sector continues to be most evident in tourism, with growth
in both high profile events and the basic infrastructure of attractions and amenities.
The sections that follow summarize previous analysis and review current issues for the
music, film, gaming, and not‐for‐profits. See Appendix 1 for detailed results.
Table 2: Total Creative Sector Economic Impacts in 2005 ($Millions)
2005 Output Value‐Added Earnings Jobs City Tax Rev.
Music $582.49 $325.63 $156.52 5,414 $6.57
Film $295.64 $187.96 $73.66 2,873 $1.13
Gaming $387.95 $256.27 $122.58 2,848 $0.47
Not-for-Profit $479.68 $292.48 $151.61 8,444 $5.46
Visual Arts $217.25 $143.92 $64.48 2,948 $2.47
Tourism/Music $727.75 $437.94 $220.83 9,199 $25.63
Tourism/Other $567.35 $341.42 $172.16 7,171 $19.98
Total Annual $3,258.11 $1,985.62 $961.83 38,897 $61.73
Table 3: Total Creative Sector Economic Impacts in 2010
2010 Output Value‐Added Earnings Jobs City Tax Rev.
Music $856.10 $325.63 $156.52 7,957 $9.66
Film $282.70 $187.96 $73.66 2,748 $1.08
Gaming $990.74 $256.27 $122.58 7,274 $1.21
Not-for-Profit $497.67 $303.45 $157.34 8,781 $5.66
Visual Arts $283.80 $143.92 $64.48 3,851 $3.23
Tourism/Music $806.25 $485.19 $244.65 10,191 $28.40
Tourism/Other $634.61 $381.90 $192.57 8,021 $22.35
Total Annual $4,351.88 $2,084.31 $1,011.80 48,822 $71.60
7Austin Creative Sector Economic Impact UPDATE | February 2012
Music
Previous Analysis
Music is a defining element of Austin’s culture. The City has long recognized the role of
music in Austin in a variety of ways, including providing music by local artists at the airport,
previously funding a cable access channel devoted to local music, and administering a loan
program specifically for the music industry. There are also scores of live music festivals in and
around the City each year, attended by residents and out‐of‐towners. At the same time,
music is an integral part of the face presented to the rest of the world, with touring acts,
television shows, and content produced by local artists bringing the Austin sound to
audiences all over the globe.
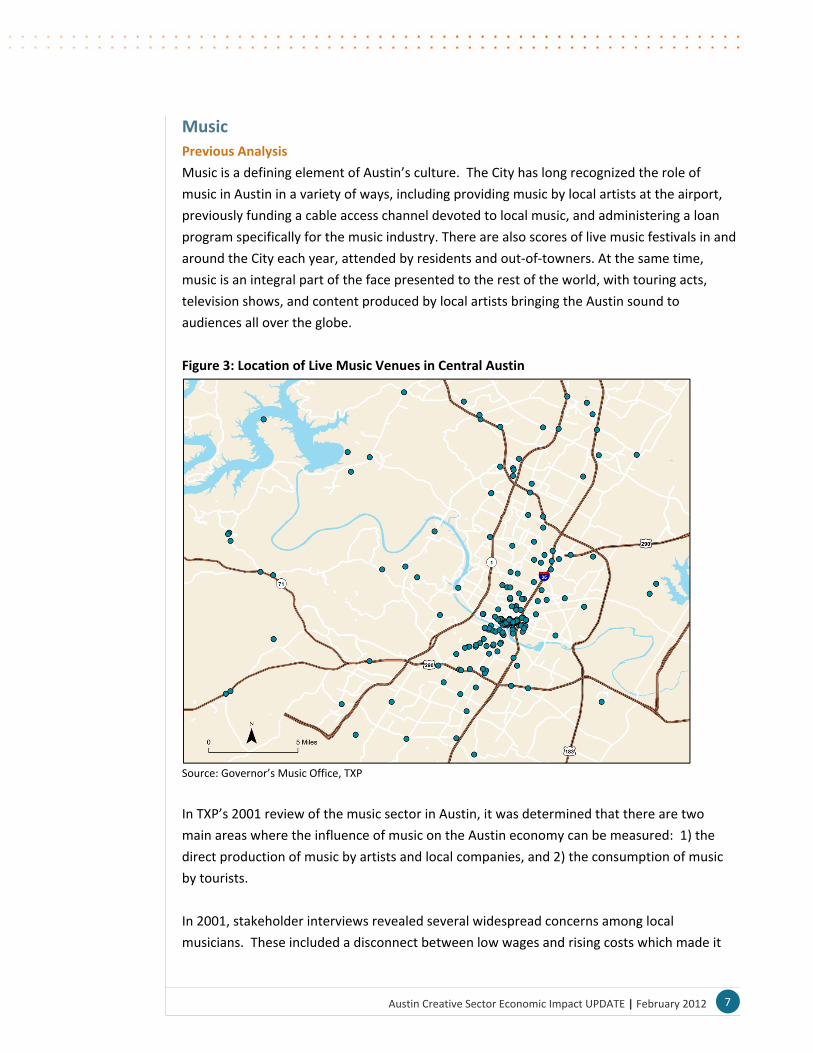
Figure 3: Location of Live Music Venues in Central Austin
Source: Governor’s Music Office, TXP
In TXP’s 2001 review of the music sector in Austin, it was determined that there are two
main areas where the influence of music on the Austin economy can be measured: 1) the
direct production of music by artists and local companies, and 2) the consumption of music
by tourists.
In 2001, stakeholder interviews revealed several widespread concerns among local
musicians. These included a disconnect between low wages and rising costs which made it

8Austin Creative Sector Economic Impact UPDATE | February 2012
difficult for full‐time working musicians to make ends meet. The local musicians interviewed
also mentioned that efforts to support musicians and the music community were widespread
in Austin, but without any central planning or even a communication strategy. They also
cautioned that the impacts to the local music scene should be considered when City
regulations and ordinances are developed and enforced.
The Current State of Austin’s Music Sector
Austin continues to be known for its music scene which attracts both high‐profile musicians
as well as tourists. Local residents have also maintained a consistent support for music and
other cultural events. Even so, the tension between live performance and digital content is
evident. While many Austin musicians both perform and record their music, the business
models and issues faced by these two elements of the industry are widely divergent. As
digital content creators, musicians in Austin face many of the same challenges that confront
other creative sector artists. The recording industry business model, like much of the
creative sector, continues to evolve which brings both uncertainty and opportunities to local
musicians.
For live performers, the impact of competition on compensation remains a concern. The
participants in the music sector focus group also mentioned the negative impacts of
increased conflict between downtown residents and music venues over such issues as noise,
parking, and traffic. The concentration of music venues in close proximity to downtown has
been central to the development of Austin’s music scene. This legacy is facing pressure from
downtown redevelopment, especially with a growing residential and lodging presence.
Several focus group participants were enthusiastic about downtown residents but cautioned
that conflict will escalate without a comprehensive approach to regulating issues such as
parking, traffic, construction, and the noise ordinance.

9Austin Creative Sector Economic Impact UPDATE | February 2012
Film and Visual Media
Previous Analysis
TXP’s initial film analysis found that Austin benefited from a number of distinct advantages:
geographic diversity, a deep pool of talented crew members, several well‐known, locally‐
based directors, and a handful of major film festivals. The strong presence of related creative
businesses, the resources available from the University of Texas, and quality of life
advantages further add to the desirability of the Austin area to filmmakers. Even with these
advantages, the film production market is intensely competitive. Different communities in
the US and Canada have developed incentives packages to reduce production costs and
capture the economic benefits of location filming, including tax abatements, wage
concessions, and subsidies.
One of the conclusions of the 2004 study was that the long‐term success of a community’s
film production industry depended less on the financial incentives offered than the creation
of a supportive regulatory environment coupled with the necessary human and physical
infrastructure to support growth. Furthermore, successful regions act as facilitators for local
and out‐of‐area production companies through publicly or privately operated film
commissions or agencies. They are also proactive in marketing their region to producers and
directors in Hollywood. Coordination with local educational institutions and professional
organizations to provide targeted training programs designed to assure an adequate supply
of local support personnel was also key for these communities.
Figure 4: Reported Employment in Motion Picture & Video Production in Austin
Sources: Bureau of Labor Statistics, TXP
258 269
190
132154
173
235
329
426463
561
2000 2001 2002 2003 2004 2005 2006 2007 2008 2009 2010
10Austin Creative Sector Economic Impact UPDATE | February 2012
The Current State of Austin’s Film and Visual Media Sector
The competition between communities to attract film production companies has only grown
more intense over the past decade. States such as Louisiana, Michigan, Georgia, and New
Mexico are attracting larger productions with significant incentive programs. This has lead
not only to a decrease in the number of large budget features shot in Austin but also to local
production managers and other filming support staff working more outside of the Austin
area. Many of the focus group participants emphasized that producers and crew love
working in Austin, but that ultimately the bottom line drives the final decision for where to
locate. However, other locations in Texas, including Dallas, have been able to substantially
increase the number of productions filmed in their communities through coordinated and
sophisticated marketing campaigns. A more cohesive, comprehensive plan to bring filming
productions to Austin could help in this respect.
Television show production is an area of growing focus and opportunity. While similar to
films, the shorter production cycle and proliferation of cable channels makes television
projects less risky to production companies, potentially creating a niche where Austin is well‐
positioned. Another area of potential opportunity that emerged from stakeholder discussion
is the lack of post‐production facilities and capabilities in Austin. If this downstream activity
could be either recruited or developed, it could benefit the entire media industry.
The fungible nature of shooting locations makes attracting big budget productions
unpredictable. From the focus group discussion it became clear that it may not be in Austin’s
best interest, both from a financial standpoint and in terms of developing the local talent
base, to chase the big blockbusters. Instead, Austin’s crew, location, and creative culture
remain the local filming industry’s competitive advantage. There was general agreement
that communication, cooperation, and mentorship among members of the local film industry
as well as with members of the other creative industries in Austin could create a virtuous
cycle of growth.
11Austin Creative Sector Economic Impact UPDATE | February 2012
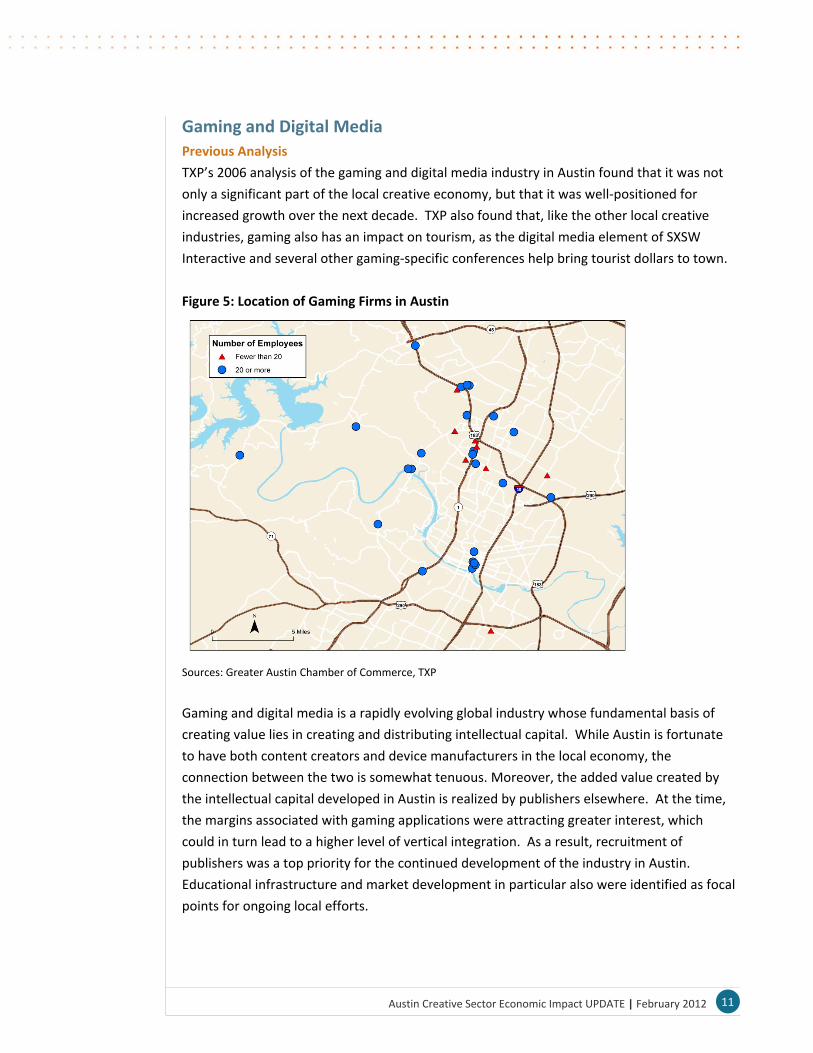
Gaming and Digital Media
Previous Analysis
TXP’s 2006 analysis of the gaming and digital media industry in Austin found that it was not
only a significant part of the local creative economy, but that it was well‐positioned for
increased growth over the next decade. TXP also found that, like the other local creative
industries, gaming also has an impact on tourism, as the digital media element of SXSW
Interactive and several other gaming‐specific conferences help bring tourist dollars to town.
Figure 5: Location of Gaming Firms in Austin
Sources: Greater Austin Chamber of Commerce, TXP
Gaming and digital media is a rapidly evolving global industry whose fundamental basis of
creating value lies in creating and distributing intellectual capital. While Austin is fortunate
to have both content creators and device manufacturers in the local economy, the
connection between the two is somewhat tenuous. Moreover, the added value created by
the intellectual capital developed in Austin is realized by publishers elsewhere. At the time,
the margins associated with gaming applications were attracting greater interest, which
could in turn lead to a higher level of vertical integration. As a result, recruitment of
publishers was a top priority for the continued development of the industry in Austin.
Educational infrastructure and market development in particular also were identified as focal
points for ongoing local efforts.

12Austin Creative Sector Economic Impact UPDATE | February 2012
The Current State of Austin’s Gaming and Digital Media Sector
The gaming and digital media industry continues to experience rapidly changing business
models, financing, and products. The explosion of mobile app gaming has fundamentally
changed the industry in the past five years. It was a consensus of the focus group for this
sector that it is nearly impossible to say what the gaming and digital media industry will look
like five years from now. It is this level of uncertainty, as well as the underlying global
economic recession, that was pointed to as some of the major challenges for their industry.
As with many other industries, particularly in the creative sectors, gaming and digital media
companies are facing a high level of competition for available funding. However,
stakeholders indicated, game designers are able to access venture capital funding that other
creative sectors cannot. Investors are drawn to innovative technology and the link between
new games and these technologies. The entertainment or creative aspects of these products
are less attractive than their potential to be applied to other industries, including biomedical,
military, and scientific research.
Not only is the gaming industry facing growing competition for financing, but competition for
talented employees is becoming even more intense. As one participant stated, “This is a
global labor force.” And while Austin still remains a competitive location in terms of cost of
living and quality of life, local firms are now finding that advantage to be diminishing with the
proliferation of design studios and production teams.
Emphasis was placed on insuring that programs at local educational institutions focus on not
only developing creative talents but also providing cutting edge technical training to the next
generation of game designers and software developers. Tight budgets and production cycles
create staffing cycles that are not conducive to mentorship. As a result, internship
opportunities (long seen as essential), have become a luxury in the eyes of the local gaming
community. Facilitating communication between local firms, educational institutions, and
students for the development of more sustainable internship programs would benefit all
parties involved.
One thing that has not changed in the past five years is the types of industry members
located in Austin. The gaming and digital media industry in Austin continues to consist
mostly of content creators with investors and publishers located elsewhere. Building up the
capacity of local entrepreneurs will help keep talented people in Austin. Stakeholders felt
strongly that a “hub” or “incubator” type project that co‐located established entrepreneurs,
start‐ups, and potential investors – along with potentially other members of the creative
sector – could create a dynamic and creative environment and contribute to the continued
growth of the gaming industry here.

13Austin Creative Sector Economic Impact UPDATE | February 2012
Not‐for‐Profit Arts
Previous Analysis
More than just generating employment and tourism spending, the non‐profit arts are a vital
component of the quality of life and creative energy of Austin that makes it such an
attractive place to live, work, and visit. It is for this reason that a survey of Austin‐area
residents found that even those who had never attended a performance still felt there was a
tangible benefit from arts and culture events.
Figure 6: Performing Arts Companies per 100,000 Residents (2010)
Sources: Bureau of Labor Statistics, TXP
In the previous work, TXP measured the economic impact of non‐profit arts organization and
their audiences, excluding for‐profit arts and entertainment businesses and arts produced by
non‐arts organizations. The direct impact of the non‐profit arts as component of the local
economy was estimated in two ways: (1) expenditures by arts organizations and audiences,
(2) jobs and personal income generated by performers and support personnel. The
secondary effects of this direct activity were then calculated, along with the local
government revenue that accrues from the wages, etc. that are created. By comparing the
amount of tax revenue generated by the arts to local government support for the arts, the
financial return was highly positive.
The Current State of Austin’s Creative Not‐for‐Profits
The economy clearly has had an impact on local creative not‐for‐profits, as the recession,
stock market uncertainty, and changes in the rules related to charitable giving have all
contributed to financial pressure for many groups. In spite of donor issues, the focus group
14Austin Creative Sector Economic Impact UPDATE | February 2012
participants agreed that volunteerism and attendance at cultural events and productions
remains vibrant in Austin. Unlike many other cities, Austin is not dominated by a few large
institutions or large donors. While this means there are many more opportunities for smaller
groups, a lot more time and effort must be spent fundraising and marketing to reach the
larger number of small donations necessary for continued operation. While the range of
local offerings is excellent, it’s easy for many organizations, and the arts in general, to be
taken for granted since they are “everywhere.” This lack of perceived urgency is evident in
fundraising, leading many to suggest the benefit of an educational campaign regarding the
importance of continued investment in local arts.
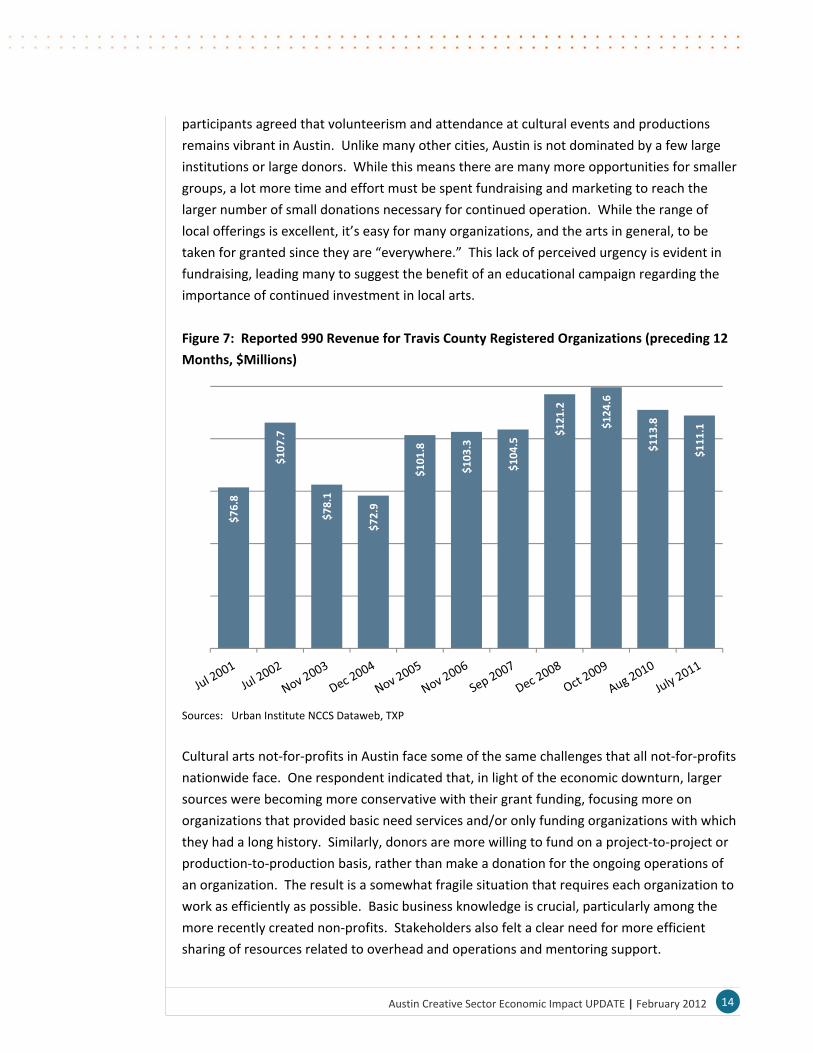
Figure 7: Reported 990 Revenue for Travis County Registered Organizations (preceding 12
Months, $Millions)
Sources: Urban Institute NCCS Dataweb, TXP
Cultural arts not‐for‐profits in Austin face some of the same challenges that all not‐for‐profits
nationwide face. One respondent indicated that, in light of the economic downturn, larger
sources were becoming more conservative with their grant funding, focusing more on
organizations that provided basic need services and/or only funding organizations with which
they had a long history. Similarly, donors are more willing to fund on a project‐to‐project or
production‐to‐production basis, rather than make a donation for the ongoing operations of
an organization. The result is a somewhat fragile situation that requires each organization to
work as efficiently as possible. Basic business knowledge is crucial, particularly among the
more recently created non‐profits. Stakeholders also felt a clear need for more efficient
sharing of resources related to overhead and operations and mentoring support.
$76.8
$107.7
$78.1
$72.9
$101.8
$103.3
$104.5
$121.2
$124.6
$113.8
$111.1
15Austin Creative Sector Economic Impact UPDATE | February 2012
Findings
The findings that follow are based on evaluation of data, industry and overall economic
trends, input from local stakeholders, and previous work. The goal was to identify significant
themes leading to recommendations that translate into action.
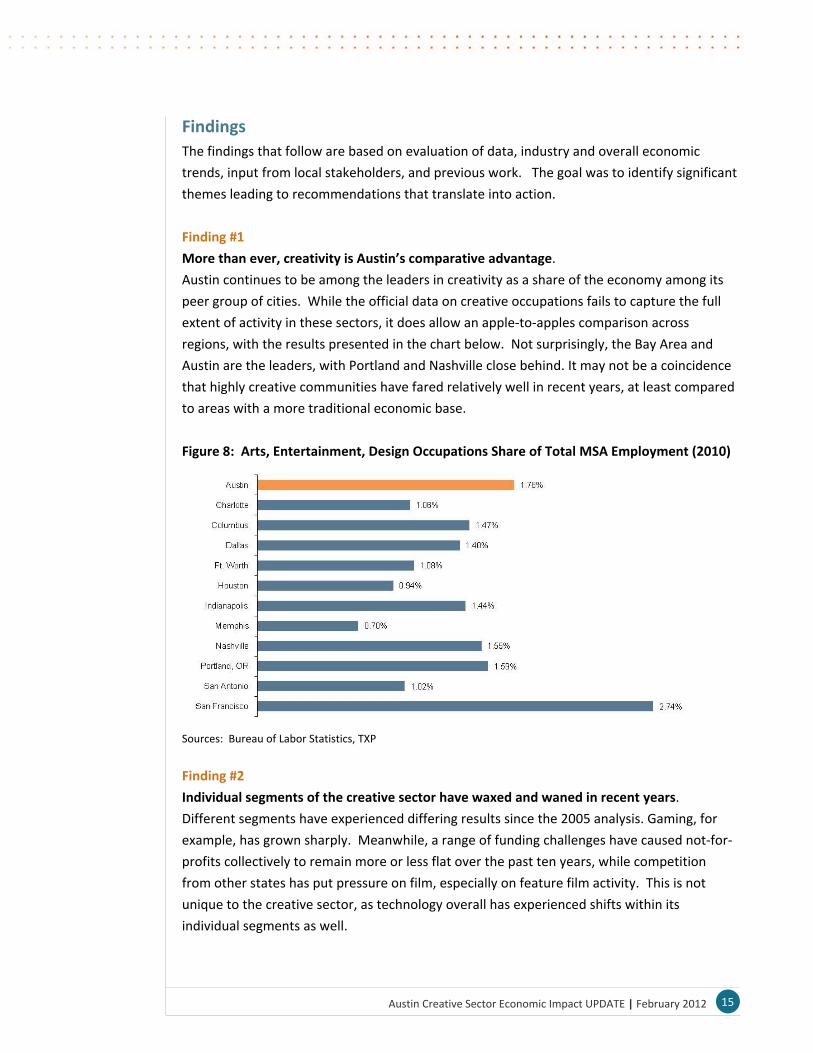
Finding #1
More than ever, creativity is Austin’s comparative advantage.
Austin continues to be among the leaders in creativity as a share of the economy among its
peer group of cities. While the official data on creative occupations fails to capture the full
extent of activity in these sectors, it does allow an apple‐to‐apples comparison across
regions, with the results presented in the chart below. Not surprisingly, the Bay Area and
Austin are the leaders, with Portland and Nashville close behind. It may not be a coincidence
that highly creative communities have fared relatively well in recent years, at least compared
to areas with a more traditional economic base.
Figure 8: Arts, Entertainment, Design Occupations Share of Total MSA Employment (2010)
Sources: Bureau of Labor Statistics, TXP
Finding #2
Individual segments of the creative sector have waxed and waned in recent years.
Different segments have experienced differing results since the 2005 analysis. Gaming, for
example, has grown sharply. Meanwhile, a range of funding challenges have caused not‐for‐
profits collectively to remain more or less flat over the past ten years, while competition
from other states has put pressure on film, especially on feature film activity. This is not
unique to the creative sector, as technology overall has experienced shifts within its
individual segments as well.

16Austin Creative Sector Economic Impact UPDATE | February 2012
About a third of the economic impact (and more than half the City tax revenue generated) of
the creative sector is attributable to tourism. Given the growth of festival‐related activity,
that’s not surprising, but it is important to remember that much of the appeal of Austin to
visitors is based on the network of cultural and entertainment offerings, clubs, restaurants,
shopping and other activities that rely strongly on locals for their business base.
Finding #3
In the film world, Texas is suffering from an incentive disadvantage compared to our peer
states of Oklahoma, New Mexico, and Louisiana.
An industry veteran provided assistance in looking at the numbers on an apples‐to‐apples
basis, using an $8 million film budget (which typically yields about $5 million in local spending
for labor, materials, and services) as the standard. The basic program in Texas is a 15%
rebate on all in‐state spending (17.5% if you shoot in a disadvantaged area) and a sales tax
waiver on taxable sales. Lining the data up is a little tricky; for example, New Mexico offers a
25% rebate on all purchases (not just those in‐state), but imposes sales tax on all purchases
and rentals (as does Oklahoma). Similarly, Louisiana offers a 30% tax credit (rather than a
rebate), which has to be sold to a third party (normally for 85 cents or so on the dollar),
reducing the actual net incentive. The bottom line incentive comparison is as follows.
Table 4: State Film Incentives ($8 Million Budget)
State State Incentive Offered Results
Texas 15% rebate (with sales tax waiver) $750,000
Oklahoma 35% rebate on in‐state expenditures $823,812
New Mexico 25% rebate (subtracting sales tax outlays) $1,064,239
Louisiana 30% rebate on in‐state expenditures (sales tax & tax credit) $1,100,000
Source: TXP
It’s been said it before, but it bears repeating – the level playing field in this area tilts slightly
toward Texas (and Austin), but the willingness of other states to buy market share remains a
significant issue.
Finding #4
Content and experience/performance are the new classifications.
The economic impact results and segment reports reflect traditional categorizations used in
previous analyses. However, a theme throughout much of this effort is that these
categorizations no longer really make sense, and that creativity is best viewed as an inter‐
connected whole, rather than in these traditional “silos.” This message was heard over and
17Austin Creative Sector Economic Impact UPDATE | February 2012
over again in stakeholder conversations. There are two key messages that emerge: 1)
creativity is best viewed as the sum of its parts; and 2) policy should reflect this orientation.
The need to move past traditional classifications has been coming for some time. In working
on the first gaming study in 2005, for example, it was instructive to see that games were now
becoming the inspiration for films (e.g., the Pirates of the Caribbean series), music was a big
part of both, and members of the local not‐for‐profit theater arts community were making a
living (at least in part) by doing voice‐overs for games. That study stated that “the lines of
demarcation between much of the creative economy are blurring, as music, film, and games
are increasingly “mashed‐up” under the broad digital entertainment umbrella.” After some
reflection, the appropriate distinction appears to be between content, i.e., creative output
that can be stored digitally, and experience or performance, which implies live interaction
between the audience and creator. Under this rubric, gaming, film, and recorded music are
content, while live music and much of the arts world (both visual and not‐for‐profit) would
fall under experience/performance.
What was said six years ago is still true: “to the extent that each has a strong local presence,
the opportunity for synergy and overall growth is enhanced. This in turn enhances the
ongoing appeal for the proverbial creative class, including both existing and potential
residents.” In terms of issues facing each, the assessment is that monetization (i.e., turning
intellectual capital into revenue) is top of mind for content providers, while public policy
issues (regulations, operational funding, etc.) are prominent for the experience/performance
side of the equation.
Finding #5
Business models are in flux.
“How are we going to make money in the future?” is one of the most consistent themes
heard from stakeholders across all segments of the creative community, from not‐for‐profits
worried about the impacts of recession and changes in philanthropy to gamers trying to
secure investment capital to feature filmmakers and musicians dealing with uncertainty
industry‐wide. Underlying almost all of it was the sense that business models (especially for
content) are in flux, and that a business plan predicated on the subscription or console model
(to use examples from the gaming world) may be dead‐on‐arrival. However, nobody knows
for sure. What appears to be happening is bifurcation across the creative space – very large
organizations are trying to play it safe with extension of content that has a proven track
record (especially evident in the film world), while technology has enabled micro‐level efforts
that are more experimental. From the point of view of a regional economy, it’s the activity in
between that creates much of the sustainable base, as medium‐sized organizations are both
18Austin Creative Sector Economic Impact UPDATE | February 2012
large enough to create collectively significant economic impact and employment and nimble
enough to respond to rapid change.
Finding #6
Brand identity is extremely important.
This could be the subject of a study unto itself, as the ubiquity of information technology has
had an enormous influence on everything from product development to marketing to
financing/business models to the overall value proposition and customer experience for
anyone in the creative space. To cite but one example, Facebook and Twitter have become
essential for many firms for identifying and communicating with their customer base. This
rise of social media is something of a double‐edged sword. On the one hand, the barriers to
entry have been lowered substantially, as anyone truly can make their content available to
the world at‐large. On the other hand, the noise volume has gone up substantially, making
getting noticed (and maybe making money) very difficult. Since everything is somewhat
fluid, forecasting the future is especially tough, but one thing appears clear – brand identity
is extremely important.

19Austin Creative Sector Economic Impact UPDATE | February 2012
Recommendations
The following recommendations are based on the findings articulated above. In general,
these should be viewed as providing guidance, rather as outlining a specific program of work.
By the same token, some are directed towards the City, while others may best be
implemented by in conjunction with other organizations or entirely outside the City’s
purview.
Recommendation #1
In light of the evolving environment, the City should explore sources of funding to support
the increasing importance of infrastructure and facilities.
There are a range of implications for City policy, both in terms of funding priorities and
operations, in viewing the creative sector as more of an integrated whole. One is the idea
that funding for creative infrastructure (particularly for facilities, but also including loan
guarantees, marketing, business development, etc.) could assume a larger role. There is
precedent for this orientation (e.g., bond funding several years ago for Austin Studios and
the music loan guarantee fund) and the relationship with Austin City Limits for both
improvements to Zilker Park and the development of the Moody Theater as part of Block 21
are examples of extending the idea to include public‐private partnerships. As business
models and organizational structures continue to evolve, resources that provide foundational
support to the sector as a whole are likely to be efficient, especially to the extent that they
can leverage additional private‐sector or philanthropic funding.
Recommendation #2
Support should be provided for an economic development effort that bridges intellectual
capital (content) and financing.
One of the most substantial challenges identified throughout this effort was the
monetization of content (see Finding #5 and #6). Aside from issues around the value
proposition for customers, a large stumbling block has been the gap between the creators of
intellectual capital and those who might provide financing, either debt or equity based.
Creative content is not business as usual; there typically are very few hard assets in play
(making collateral‐based lending almost impossible), and the uncertainty around the
business model makes standard risk and potential reward assessment very tough. The
combination means that financing from traditional sources is hard to come by. What is
available tends to come from a handful of sources (not necessarily local), and new
mechanisms, such as crowd sourcing, have yet to reach critical mass. What appears to be
needed is an organization (probably outside the City) that understands both sides, and can
help each work to resolve the issues that prevent deals from happening. This has elements
of an incubator, but with a sharper focus on deal‐making and finance.

20Austin Creative Sector Economic Impact UPDATE | February 2012
Recommendation #3
Mobility planning must connect to the creative tourism sector.
Brand Austin (created by a range of factors, including the long‐running ACL television show)
likely has been widely embraced across the world, as hundreds of thousands of visitors come
each year to attend a range of high‐profile events, with more (events and people) on the
way. The visitor industry has been gearing up, with as many as 3,000 hotels rooms in the
planning stages to supplement the 6,000 that already exist downtown. Meanwhile, the State
is considering an ambitious plan for redevelopment of its downtown office complex, which
could add another five to seven million square feet of commercial mixed‐use space and
thousands of workers. When Waller Creek redevelopment and efforts on a new medical
school are factored in, it becomes clear that mobility is a crucial issue, a fact lost on no one.
To that end, specific expertise has been engaged (South by Southwest has brought in a crowd
consultant) and creative technology is being discussed (e.g., using lasers in the sky to
facilitate way‐finding). In addition to movement to and within the central city, parking
capacity, and the overall flow of Austin traffic during major events will have an impact on the
capacity to sustain and grow creative tourism.
Recommendation #4
The regulatory environment (particularly in the central city) has to accommodate the
needs of the entertainment industry.
In some ways, local live music has never been in better shape, as the music‐centric festivals
continue to attract record numbers of attendees and dollars to Austin. However, the basic
infrastructure of venues remains at‐risk. Lots of factors are in this equation, including
changing audience demographics, the role of social media, and the evolution of the overall
business model for many bands. Perhaps one of the trickiest is the regulatory environment
facing live music, as the urbanist approach to central‐city redevelopment (mixing a range of
land uses, including housing, in close proximity) runs head‐on into sound ordinances, parking
issues, and the fact that from a real estate perspective the highest and best use of many
venues may no longer be as a place to see music.
As a reminder, the value of live music extends well beyond the activity of any given weekend,
as the brand identity in general and the infrastructure to support cultural tourism in
particular, are highly valuable economic assets. The temptation is to identify iconic music
venues and put policy in place that prohibits changes in use. However, that flies in the face of
regulating the form of the built environment and letting the market determine what needs to
actually happen inside. A range of technology solutions (e.g. “silent” concerts), as well as
possible regulatory adjustments, could also mitigate the problem.
21Austin Creative Sector Economic Impact UPDATE | February 2012
Recommendation #5
Expand promotional efforts to reflect the range and diversity of Austin’s cultural assets.
As outlined in Finding #2, tourism is currently the largest part of Austin’s creative sector.
Beyond the major events, it is the wide range of Austin’s creative offerings – the different
size and genre of performance experiences as well as the diversity of the local creative sector
– which contributes to the vibrancy of Austin. Many cultural tourists come to Austin for the
large festivals, but many also come to experience a cultural scene that occurs daily
throughout the year. This segment is critical, as the commercial infrastructure that supports
this activity depends on large events, this ongoing tourism, and local demand for the
viability.
Recommendation #6
Implement previous recommendations that still apply, and communicate where
appropriate.
Some have been implemented (such as the designation of the single point of contact at the
City), some likely no longer make sense (i.e. using the now‐defunct Burnt Orange Productions
as a model) and some may still be valid, albeit in a modified form. External marketing (both
domestically and abroad) for all aspects of the creative sector probably is an area where
more could be done, especially if it is coordinated with other organizations in town that
promote tourism and the arts. By the same token, there is at least one instance of an Austin‐
based performing arts organization being paid by the host nation to perform overseas,
effectively “exporting culture.” In that same vein, there may be an opportunity to create a
content event similar to the American Film Market. All of this takes place in the context of
the City taking steps on its own. To cite but a few examples:
the CreateAustin Cultural Masterplan lays out a vision and a roadmap for Austin’s
cultural development over the next 10 years;
the Small Business Development Program (SBDP) is increasing focus on providing
service to the creative community; and
the City participated in a recent trade mission between Austin and London to foster
mutual growth in the digital media sector
Finally, much of the ultimate measure of these recommendations and other City actions is
not just implementation but awareness; the best resource in the world is only as effective as
its utilization.

22Austin Creative Sector Economic Impact UPDATE | February 2012
Conclusion
Much energy and effort has gone into analyzing the reasons that prompt many to find Austin
so appealing, with widespread opportunities in the creative space clearly a major factor. The
role of the creative sector in Austin’s economy (as measured by employment) has risen by
about twenty‐five percent over the past five years, a pace more rapid than the ten percent
growth for the local economy as a whole, and reflects the fact that creativity (in its many
facets) is increasingly important to the present and future regional economy. Austin is a
place that appreciates creativity and culture in a variety of evolving forms, and the incredible
diversity of the local scene undoubtedly serves to both attract and retain talented people.
This in turn has a significant impact on business recruitment, retention, and expansion, as
well as local entrepreneurship.
As has long been the case, the sum is greater than the parts; and the parts have become so
inter‐connected as to make traditional distinctions between them almost meaningless. As
Austin looks to its economic development future, creativity is a fundamental comparative
advantage – the goal is to identify the key investments, policies, and regulatory changes that
can support the infrastructure necessary for sustainability and growth.
23Austin Creative Sector Economic Impact UPDATE | February 2012
Appendix 1: Detailed Economic Impacts by Sector
A1.1: Detailed Music Economic Impacts (2010)
Output Value-Added Earnings Jobs
Agriculture, etc. $208,615 $83,446 $41,719 3
Mining $1,063,939 $542,400 $229,452 2
Utilities $7,989,970 $5,131,939 $1,585,305 15
Construction $2,962,339 $1,460,308 $1,084,683 28
Manufacturing $24,700,063 $9,429,416 $5,694,584 103
Wholesale Trade $13,747,755 $9,283,385 $4,297,012 66
Retail Trade $26,285,540 $17,231,632 $8,948,632 367
Transport & Warehousing $10,389,047 $5,799,508 $3,963,263 104
Information $304,349,007 $119,307,147 $63,349,638 1,177
Finance & Insurance $40,179,326 $23,510,956 $11,159,716 202
Real Estate $57,869,912 $43,099,942 $4,422,168 191
Professional Services $47,981,542 $33,169,849 $22,423,728 379
Management of Firms $2,962,339 $1,814,954 $1,230,698 16
Administrative Services $20,986,709 $14,415,324 $9,783,003 481
Educational Services $4,109,723 $2,336,492 $1,647,883 66
Health care $25,597,110 $15,833,909 $11,994,087 307
Arts/Entertain/Recreation $230,165,371 $157,442,042 $67,312,901 3,893
Accommodation $5,444,862 $3,504,739 $1,585,305 62
Food Services $13,101,047 $6,821,724 $4,150,997 278
Other Services $16,000,801 $8,052,554 $4,818,494 187
Households $0 $312,923 $312,889 31
Total Annual $856,095,016 $478,584,589 $230,036,157 7,957
24Austin Creative Sector Economic Impact UPDATE | February 2012
A1.2: Detailed Film Economic Impacts (2010)
Output Value-Added Earnings Jobs
Agriculture, etc. $64,598 $32,299 $16,147 1
Mining $355,290 $177,645 $80,734 1
Utilities $2,955,369 $1,905,648 $597,431 6
Construction $1,130,469 $565,234 $419,816 11
Manufacturing $7,864,834 $2,939,219 $1,792,292 31
Wholesale Trade $4,279,632 $2,890,771 $1,340,182 21
Retail Trade $7,848,684 $5,151,708 $2,680,365 110
Transport & Warehousing $2,583,929 $1,453,460 $968,807 25
Information $181,860,153 $116,147,609 $40,334,647 1,829
Finance & Insurance $11,676,129 $6,766,664 $3,164,768 57
Real Estate $21,333,564 $15,955,762 $1,873,026 86
Professional Services $12,257,513 $8,397,769 $5,732,106 94
Management of Firms $823,627 $500,636 $339,082 4
Administrative Services $6,637,468 $4,618,773 $3,180,915 161
Educational Services $1,162,768 $662,132 $468,257 19
Health care $7,832,535 $4,844,867 $3,665,318 94
Arts/Entertain/Recreation $2,600,079 $1,663,404 $807,339 48
Accommodation $1,114,319 $710,580 $322,936 13
Food Services $3,472,155 $1,808,750 $1,097,981 74
Other Services $4,844,867 $2,438,583 $1,453,210 56
Households $0 $96,897 $96,881 10
Total Annual $282,697,983 $179,728,412 $70,432,238 2,748
25Austin Creative Sector Economic Impact UPDATE | February 2012
A1.3: Detailed Gaming and Digital Media Economic Impacts (2010)
Output Value-Added Earnings Jobs
Agriculture, etc. $324,179 $149,621 $42,424 3
Mining $1,471,275 $748,106 $275,755 2
Utilities $10,373,739 $6,608,271 $1,760,592 14
Construction $4,089,647 $2,019,887 $1,251,505 26
Manufacturing $18,752,528 $7,206,756 $3,245,429 51
Wholesale Trade $19,126,581 $12,917,300 $5,090,869 63
Retail Trade $39,923,933 $26,158,779 $11,560,516 385
Transport & Warehousing $8,852,590 $4,713,069 $2,799,978 60
Information $41,594,703 $22,268,627 $7,848,424 109
Finance & Insurance $52,990,854 $30,522,732 $12,345,358 180
Real Estate $85,957,399 $63,863,330 $5,366,625 193
Professional Services $300,763,617 $207,898,705 $138,514,069 1,428
Management of Firms $3,740,531 $2,319,129 $1,315,141 14
Administrative Services $38,303,036 $27,181,191 $16,163,510 664
Educational Services $6,159,407 $3,516,099 $2,121,196 69
Health care $39,973,806 $24,712,440 $15,930,179 330
Arts/Entertain/Recreation $271,338,108 $186,428,058 $67,581,290 3,150
Accommodation $5,959,912 $3,840,278 $1,484,837 47
Food Services $18,253,791 $9,500,948 $4,921,174 267
Other Services $22,792,301 $11,396,151 $5,854,500 185
Households $0 $473,801 $403,027 34
Total Annual $990,741,938 $654,443,277 $305,876,398 7,274
26Austin Creative Sector Economic Impact UPDATE | February 2012
A1.4: Detailed Not‐for‐Profits Economic Impacts (2010)
Output Value-Added Earnings Jobs
Agriculture, etc. $178,668 $72,539 $25,370 2
Mining $995,369 $507,403 $204,395 2
Utilities $7,906,918 $4,831,372 $1,563,468 16
Construction $2,717,089 $1,350,407 $990,499 26
Manufacturing $11,533,344 $4,425,603 $2,456,770 52
Wholesale Trade $11,365,346 $7,668,191 $3,544,871 56
Retail Trade $65,320,134 $42,788,269 $22,249,036 936
Transport & Warehousing $6,922,741 $3,798,910 $2,578,905 67
Information $19,635,837 $10,569,920 $4,829,571 83
Finance & Insurance $26,595,846 $15,355,561 $7,300,699 135
Real Estate $45,795,760 $34,058,384 $3,638,776 169
Professional Services $22,269,853 $15,094,178 $10,306,923 179
Management of Firms $2,449,552 $1,520,353 $1,013,001 13
Administrative Services $15,919,434 $10,947,876 $7,462,045 367
Educational Services $2,929,227 $1,668,435 $1,175,692 49
Health care $17,484,858 $10,828,129 $8,211,585 224
Arts/Entertain/Recreation $127,852,547 $73,618,535 $46,428,595 4,691
Accommodation $57,751,472 $37,169,840 $16,935,412 679
Food Services $40,028,427 $20,826,789 $12,691,674 871
Other Services $12,021,208 $6,139,676 $3,525,080 144
Households $0 $209,317 $209,358 22
Total Annual $497,673,632 $303,449,686 $157,341,724 8,781
27Austin Creative Sector Economic Impact UPDATE | February 2012
A1.5: Detailed Visual Arts Economic Impacts (2010)
Output Value-Added Earnings Jobs
Agriculture, etc. $78,970 $31,588 $15,789 1
Mining $347,470 $173,735 $78,945 1
Utilities $2,479,670 $1,579,408 $489,460 5
Construction $963,439 $473,822 $347,359 9
Manufacturing $4,422,341 $1,705,760 $931,553 19
Wholesale Trade $4,438,135 $3,000,874 $1,389,435 21
Retail Trade $9,665,974 $6,333,424 $3,284,119 135
Transport & Warehousing $2,416,494 $1,295,114 $899,975 24
Information $10,913,706 $5,575,309 $2,447,300 43
Finance & Insurance $12,919,554 $7,391,627 $3,568,321 65
Real Estate $19,410,919 $14,372,609 $1,389,435 62
Professional Services $15,857,252 $11,055,853 $7,468,213 130
Management of Firms $1,137,173 $694,939 $473,671 6
Administrative Services $7,265,275 $5,022,516 $3,426,220 166
Educational Services $1,532,025 $868,674 $615,772 24
Health care $9,381,681 $5,796,426 $4,389,351 112
Arts/Entertain/Recreation $170,117,985 $117,049,892 $49,703,876 2,858
Accommodation $1,152,967 $742,322 $331,570 13
Food Services $3,916,931 $2,037,436 $1,247,334 83
Other Services $5,385,780 $2,700,787 $1,626,270 63
Households $0 $110,559 $110,523 11
Total Annual $283,803,740 $188,012,673 $84,234,492 3,851
28Austin Creative Sector Economic Impact UPDATE | February 2012
A1.6a: Detailed Music‐Influenced Tourism Impacts (2010)
Output Value-Added Earnings Jobs
Agriculture, etc. $346,410 $118,866 $41,889 3
Mining $1,942,615 $986,024 $407,572 3
Utilities $15,681,297 $9,379,118 $3,103,212 30
Construction $5,015,026 $2,500,721 $1,835,208 47
Manufacturing $21,239,712 $7,893,855 $4,319,136 87
Wholesale Trade $19,938,975 $13,446,610 $6,223,406 96
Retail Trade $62,548,587 $40,969,256 $21,303,588 873
Transport & Warehousing $11,103,246 $6,007,843 $4,204,790 105
Information $30,959,580 $16,848,451 $7,601,227 124
Finance & Insurance $43,696,389 $25,289,091 $12,073,203 219
Real Estate $72,865,050 $53,938,137 $5,472,793 243
Professional Services $32,786,725 $21,924,609 $15,346,237 246
Management of Firms $4,659,559 $2,890,150 $1,915,591 25
Administrative Services $20,935,188 $13,843,963 $9,095,660 402
Educational Services $4,554,278 $2,582,229 $1,870,305 78
Health care $27,233,971 $16,872,224 $12,803,437 353
Arts/Entertain/Recreation $98,587,720 $59,485,231 $34,991,231 1,720
Accommodation $139,988,292 $90,101,798 $41,042,551 1,603
Food Services $172,876,902 $89,946,706 $54,802,651 3,664
Other Services $19,292,569 $9,831,942 $5,870,176 236
Households $0 $330,562 $330,587 33
Total Annual $806,252,092 $485,187,387 $244,654,449 10,191
29Austin Creative Sector Economic Impact UPDATE | February 2012
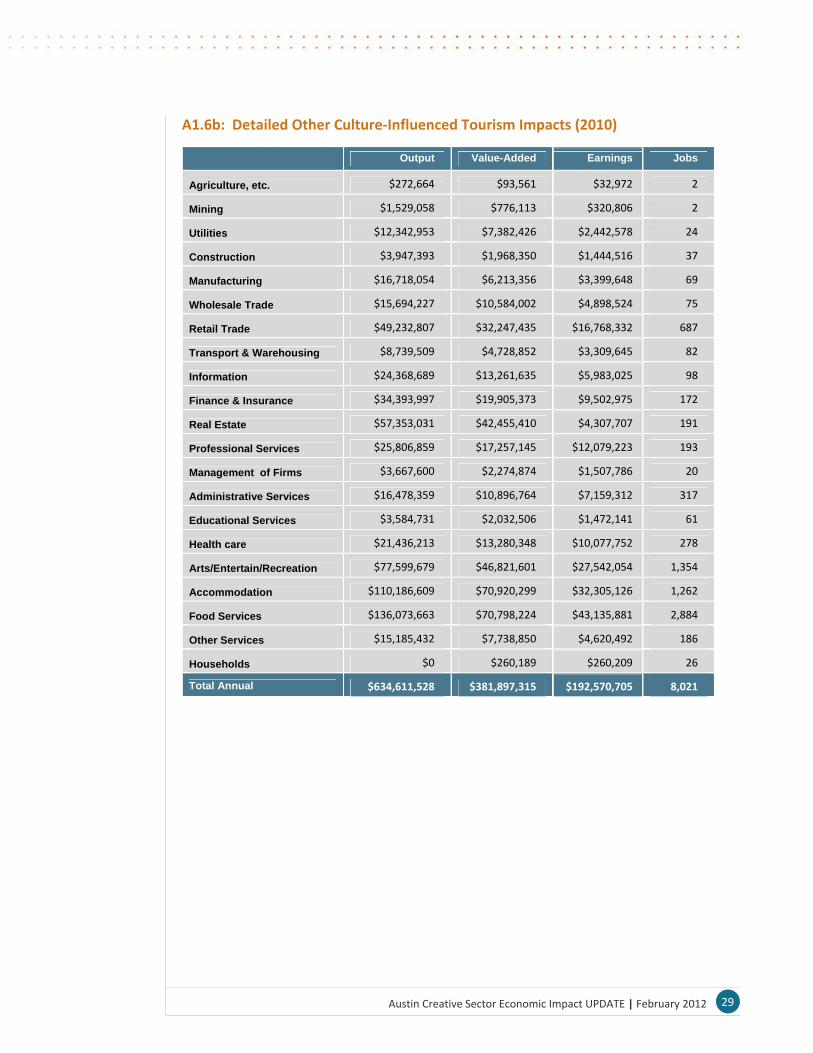
A1.6b: Detailed Other Culture‐Influenced Tourism Impacts (2010)
Output Value-Added Earnings Jobs
Agriculture, etc. $272,664 $93,561 $32,972 2
Mining $1,529,058 $776,113 $320,806 2
Utilities $12,342,953 $7,382,426 $2,442,578 24
Construction $3,947,393 $1,968,350 $1,444,516 37
Manufacturing $16,718,054 $6,213,356 $3,399,648 69
Wholesale Trade $15,694,227 $10,584,002 $4,898,524 75
Retail Trade $49,232,807 $32,247,435 $16,768,332 687
Transport & Warehousing $8,739,509 $4,728,852 $3,309,645 82
Information $24,368,689 $13,261,635 $5,983,025 98
Finance & Insurance $34,393,997 $19,905,373 $9,502,975 172
Real Estate $57,353,031 $42,455,410 $4,307,707 191
Professional Services $25,806,859 $17,257,145 $12,079,223 193
Management of Firms $3,667,600 $2,274,874 $1,507,786 20
Administrative Services $16,478,359 $10,896,764 $7,159,312 317
Educational Services $3,584,731 $2,032,506 $1,472,141 61
Health care $21,436,213 $13,280,348 $10,077,752 278
Arts/Entertain/Recreation $77,599,679 $46,821,601 $27,542,054 1,354
Accommodation $110,186,609 $70,920,299 $32,305,126 1,262
Food Services $136,073,663 $70,798,224 $43,135,881 2,884
Other Services $15,185,432 $7,738,850 $4,620,492 186
Households $0 $260,189 $260,209 26
Total Annual $634,611,528 $381,897,315 $192,570,705 8,021
30Austin Creative Sector Economic Impact UPDATE | February 2012
Appendix 2: Detailed Occupational Data
The data in this appendix is drawn from official federal figures produced by the Bureau of
Labor Statistics (www.bls.gov), and is included for purposes of further relative comparison
between peer communities. A value of N/A in a given cell indicates that, while there are
residents of that community employed in a particular occupation, the employment or
income data was withheld for reasons of confidentiality, could not be measured (as part of
the BLS process) at a statistically‐valid level, or was simply not available at the time of
publication.
The data below for Austin should not be compared to the findings in the main body of the
report, which were produced through primary research by TXP, but rather to that for other
communities in this Appendix.

31Austin Creative Sector Economic Impact UPDATE | February 2012
A2.1: Austin‐Round Rock, TX Arts‐Related Occupations (2010)
Arts‐Related Occupations Total
Employment
Mean Annual
Income
Art Directors 310 $79,430
Craft Artists 70 $60,730
Fine Artists, Including Painters, Sculptors, and Illustrators 30 $34,420
Multimedia Artists and Animators 290 $49,780
Artists and Related Workers, All Other N/A $40,210
Commercial and Industrial Designers 60 $63,920
Floral Designers 160 $24,440
Graphic Designers 1,410 $51,150
Interior Designers 340 $41,280
Merchandise Displayers and Window Trimmers 370 $27,380
Producers and Directors 440 $58,800
Athletes and Sports Competitors 130 $89,050
Coaches and Scouts 940 $44,950
Umpires, Referees, and Other Sports Officials N/A $40,580
Music Directors and Composers 250 $46,050
Musicians and Singers 170 N/A
Radio and Television Announcers 120 $46,750
Public Address System and Other Announcers N/A $22,670
Broadcast News Analysts 30 $79,180
Reporters and Correspondents 310 $41,470
Public Relations Specialists 3,620 $59,460
Editors 740 $51,080
Technical Writers 690 $57,470
Writers and Authors 470 $73,630
Media and Communication Workers, All Other N/A $39,430
Audio and Video Equipment Technicians 400 $35,740
Broadcast Technicians 150 $41,810
Sound Engineering Technicians 110 $36,660
Photographers 460 $34,960
Camera Operators, Television, Video, and Motion Picture 50 $31,610
Film and Video Editors 110 $45,970
Total Arts, Design, Entertainment, Sports, and Media Occupations 13,490 $52,540

32Austin Creative Sector Economic Impact UPDATE | February 2012
A2.2: Charlotte‐Gastonia‐Concord, NC‐SC Arts‐Related Occupations (2010)
Arts‐Related Occupations Total
Employment
Mean Annual
Income
Art Directors 90 $91,160
Craft Artists N/A $29,770
Commercial and Industrial Designers 70 $60,730
Floral Designers 130 $23,180
Graphic Designers 1,500 $49,750
Interior Designers 290 $56,590
Merchandise Displayers and Window Trimmers 140 $34,130
Set and Exhibit Designers 30 $38,710
Designers, All Other 60 $59,080
Producers and Directors 400 $57,820
Athletes and Sports Competitors 160 N/A
Coaches and Scouts 1,010 $35,400
Umpires, Referees, and Other Sports Officials 100 $31,980
Choreographers 110 $27,800
Music Directors and Composers N/A $39,340
Musicians and Singers 190 N/A
Entertainers and Performers, Sports and Related Workers, All Other 80 N/A
Radio and Television Announcers 310 $54,380
Public Address System and Other Announcers N/A $28,470
Broadcast News Analysts 70 N/A
Reporters and Correspondents 230 $46,670
Public Relations Specialists 1,000 $51,670
Editors 430 $54,870
Technical Writers 200 $61,570
Writers and Authors 90 $46,000
Interpreters and Translators 470 $54,550
Media and Communication Workers, All Other 40 $53,230
Audio and Video Equipment Technicians 160 $44,630
Broadcast Technicians 170 $41,530
Sound Engineering Technicians 70 $46,100
Photographers 410 $33,310
Camera Operators, Television, Video, and Motion Picture 120 $35,380
Film and Video Editors 110 $37,240
Media and Communication Equipment Workers, All Other 60 $47,960
Total Arts, Design, Entertainment, Sports, and Media Occupations 8,550 $48,910
33Austin Creative Sector Economic Impact UPDATE | February 2012
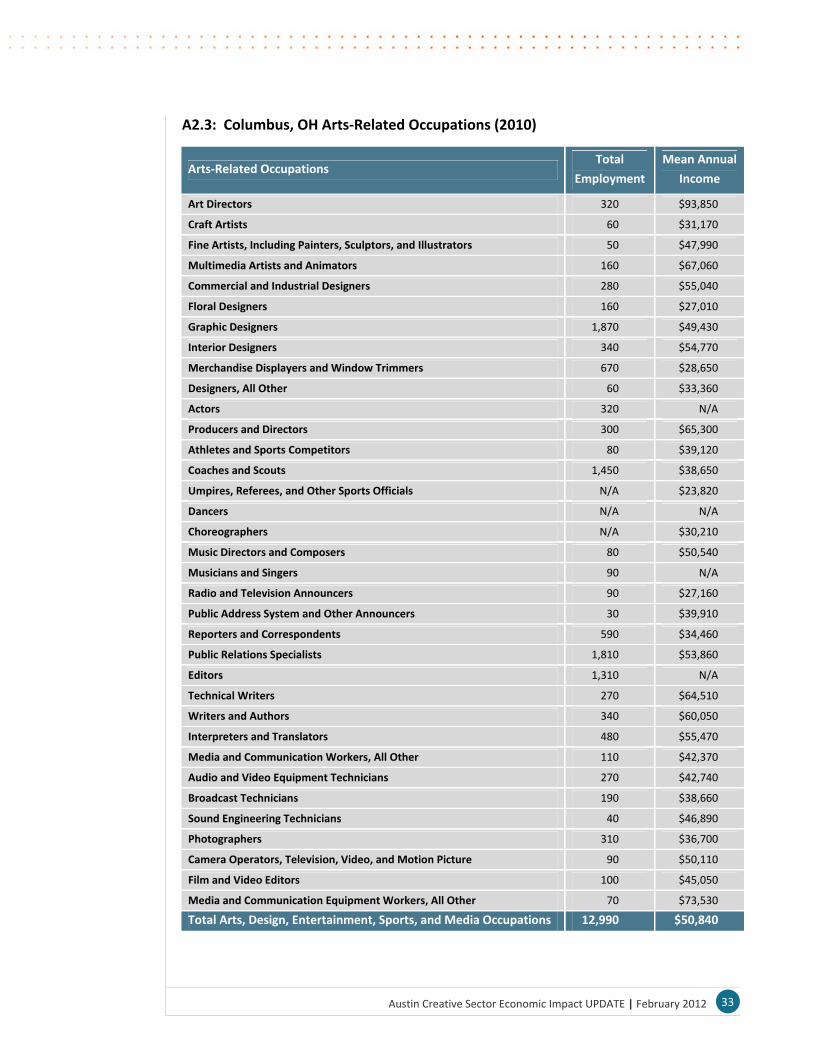
A2.3: Columbus, OH Arts‐Related Occupations (2010)
Arts‐Related Occupations Total
Employment
Mean Annual
Income
Art Directors 320 $93,850
Craft Artists 60 $31,170
Fine Artists, Including Painters, Sculptors, and Illustrators 50 $47,990
Multimedia Artists and Animators 160 $67,060
Commercial and Industrial Designers 280 $55,040
Floral Designers 160 $27,010
Graphic Designers 1,870 $49,430
Interior Designers 340 $54,770
Merchandise Displayers and Window Trimmers 670 $28,650
Designers, All Other 60 $33,360
Actors 320 N/A
Producers and Directors 300 $65,300
Athletes and Sports Competitors 80 $39,120
Coaches and Scouts 1,450 $38,650
Umpires, Referees, and Other Sports Officials N/A $23,820
Dancers N/A N/A
Choreographers N/A $30,210
Music Directors and Composers 80 $50,540
Musicians and Singers 90 N/A
Radio and Television Announcers 90 $27,160
Public Address System and Other Announcers 30 $39,910
Reporters and Correspondents 590 $34,460
Public Relations Specialists 1,810 $53,860
Editors 1,310 N/A
Technical Writers 270 $64,510
Writers and Authors 340 $60,050
Interpreters and Translators 480 $55,470
Media and Communication Workers, All Other 110 $42,370
Audio and Video Equipment Technicians 270 $42,740
Broadcast Technicians 190 $38,660
Sound Engineering Technicians 40 $46,890
Photographers 310 $36,700
Camera Operators, Television, Video, and Motion Picture 90 $50,110
Film and Video Editors 100 $45,050
Media and Communication Equipment Workers, All Other 70 $73,530
Total Arts, Design, Entertainment, Sports, and Media Occupations 12,990 $50,840
34Austin Creative Sector Economic Impact UPDATE | February 2012
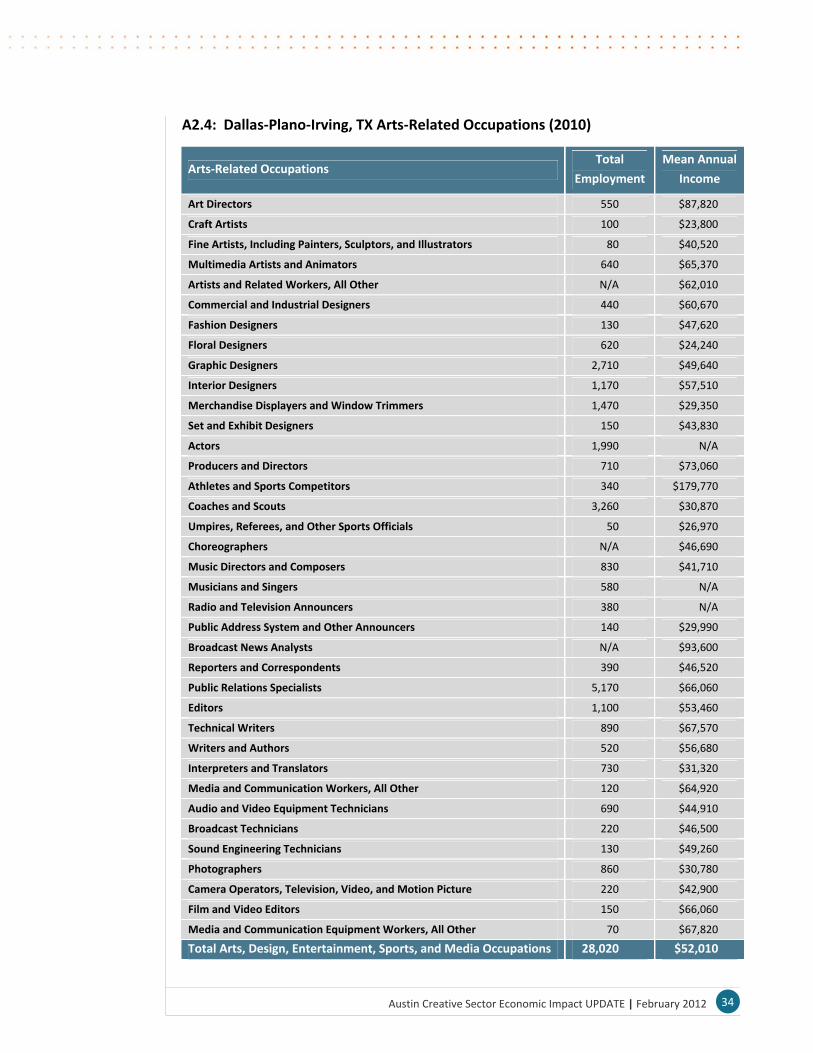
A2.4: Dallas‐Plano‐Irving, TX Arts‐Related Occupations (2010)
Arts‐Related Occupations Total
Employment
Mean Annual
Income
Art Directors 550 $87,820
Craft Artists 100 $23,800
Fine Artists, Including Painters, Sculptors, and Illustrators 80 $40,520
Multimedia Artists and Animators 640 $65,370
Artists and Related Workers, All Other N/A $62,010
Commercial and Industrial Designers 440 $60,670
Fashion Designers 130 $47,620
Floral Designers 620 $24,240
Graphic Designers 2,710 $49,640
Interior Designers 1,170 $57,510
Merchandise Displayers and Window Trimmers 1,470 $29,350
Set and Exhibit Designers 150 $43,830
Actors 1,990 N/A
Producers and Directors 710 $73,060
Athletes and Sports Competitors 340 $179,770
Coaches and Scouts 3,260 $30,870
Umpires, Referees, and Other Sports Officials 50 $26,970
Choreographers N/A $46,690
Music Directors and Composers 830 $41,710
Musicians and Singers 580 N/A
Radio and Television Announcers 380 N/A
Public Address System and Other Announcers 140 $29,990
Broadcast News Analysts N/A $93,600
Reporters and Correspondents 390 $46,520
Public Relations Specialists 5,170 $66,060
Editors 1,100 $53,460
Technical Writers 890 $67,570
Writers and Authors 520 $56,680
Interpreters and Translators 730 $31,320
Media and Communication Workers, All Other 120 $64,920
Audio and Video Equipment Technicians 690 $44,910
Broadcast Technicians 220 $46,500
Sound Engineering Technicians 130 $49,260
Photographers 860 $30,780
Camera Operators, Television, Video, and Motion Picture 220 $42,900
Film and Video Editors 150 $66,060
Media and Communication Equipment Workers, All Other 70 $67,820
Total Arts, Design, Entertainment, Sports, and Media Occupations 28,020 $52,010
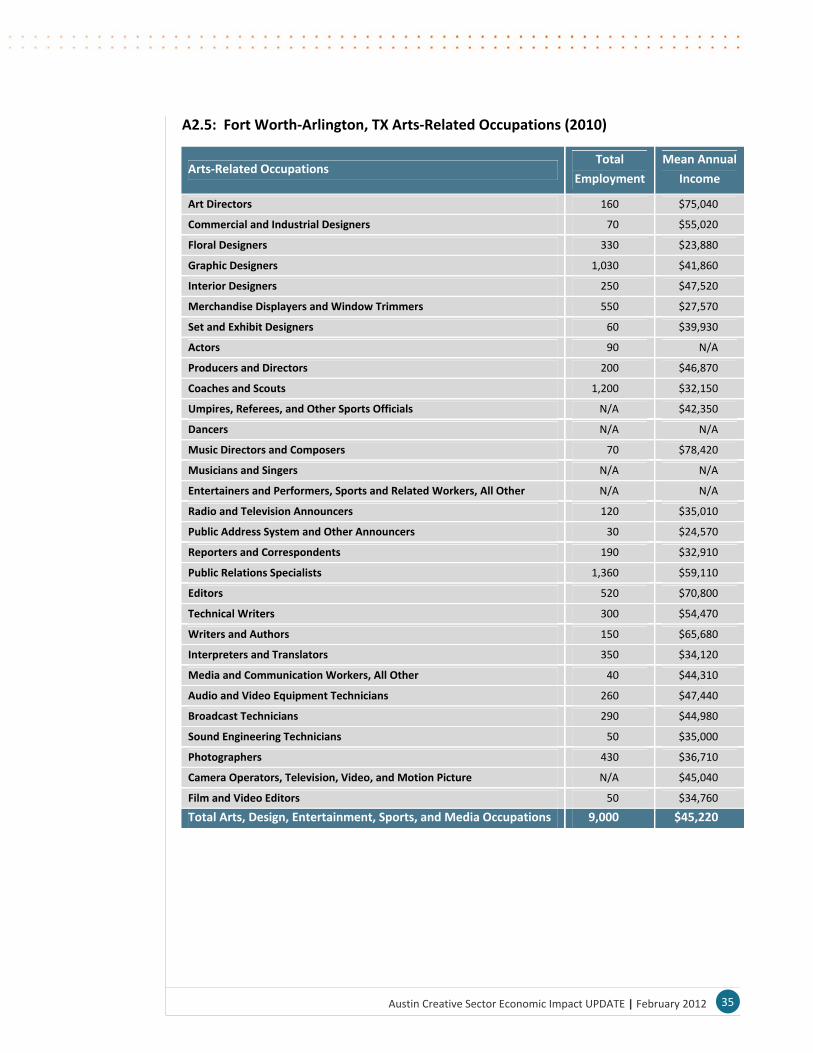
35Austin Creative Sector Economic Impact UPDATE | February 2012
A2.5: Fort Worth‐Arlington, TX Arts‐Related Occupations (2010)
Arts‐Related Occupations Total
Employment
Mean Annual
Income
Art Directors 160 $75,040
Commercial and Industrial Designers 70 $55,020
Floral Designers 330 $23,880
Graphic Designers 1,030 $41,860
Interior Designers 250 $47,520
Merchandise Displayers and Window Trimmers 550 $27,570
Set and Exhibit Designers 60 $39,930
Actors 90 N/A
Producers and Directors 200 $46,870
Coaches and Scouts 1,200 $32,150
Umpires, Referees, and Other Sports Officials N/A $42,350
Dancers N/A N/A
Music Directors and Composers 70 $78,420
Musicians and Singers N/A N/A
Entertainers and Performers, Sports and Related Workers, All Other N/A N/A
Radio and Television Announcers 120 $35,010
Public Address System and Other Announcers 30 $24,570
Reporters and Correspondents 190 $32,910
Public Relations Specialists 1,360 $59,110
Editors 520 $70,800
Technical Writers 300 $54,470
Writers and Authors 150 $65,680
Interpreters and Translators 350 $34,120
Media and Communication Workers, All Other 40 $44,310
Audio and Video Equipment Technicians 260 $47,440
Broadcast Technicians 290 $44,980
Sound Engineering Technicians 50 $35,000
Photographers 430 $36,710
Camera Operators, Television, Video, and Motion Picture N/A $45,040
Film and Video Editors 50 $34,760
Total Arts, Design, Entertainment, Sports, and Media Occupations 9,000 $45,220

36Austin Creative Sector Economic Impact UPDATE | February 2012
A2.6: Houston‐Sugar Land‐Baytown, TX Arts‐Related Occupations (2010)
Arts‐Related Occupations Total
Employment
Mean Annual
Income
Art Directors 410 $69,760
Craft Artists 80 $36,790
Fine Artists, Including Painters, Sculptors, and Illustrators 90 $45,030
Multimedia Artists and Animators 220 $56,300
Commercial and Industrial Designers 420 $70,700
Fashion Designers 130 $80,620
Floral Designers 710 $23,110
Graphic Designers 2,750 $45,480
Interior Designers 1,100 $51,740
Merchandise Displayers and Window Trimmers 2,050 $22,710
Set and Exhibit Designers 170 $48,140
Designers, All Other N/A $42,350
Producers and Directors 730 $53,990
Athletes and Sports Competitors 100 N/A
Coaches and Scouts 2,020 $30,810
Umpires, Referees, and Other Sports Officials 220 $24,310
Dancers 130 N/A
Choreographers 300 $53,220
Music Directors and Composers 300 $60,250
Musicians and Singers 230 N/A
Radio and Television Announcers 240 $45,160
Public Address System and Other Announcers 130 $36,050
Reporters and Correspondents 520 $36,560
Public Relations Specialists 4,300 $59,560
Editors 1,030 $51,380
Technical Writers 760 $59,880
Writers and Authors 460 $48,490
Interpreters and Translators 610 $49,810
Media and Communication Workers, All Other 50 $44,160
Audio and Video Equipment Technicians 540 $35,200
Broadcast Technicians 200 $44,930
Sound Engineering Technicians 110 $31,650
Photographers 1,470 $33,220
Camera Operators, Television, Video, and Motion Picture N/A $25,950
Film and Video Editors 140 $45,920
Media and Communication Equipment Workers, All Other 70 $74,560
Total Arts, Design, Entertainment, Sports, and Media Occupations 23,500 $45,950
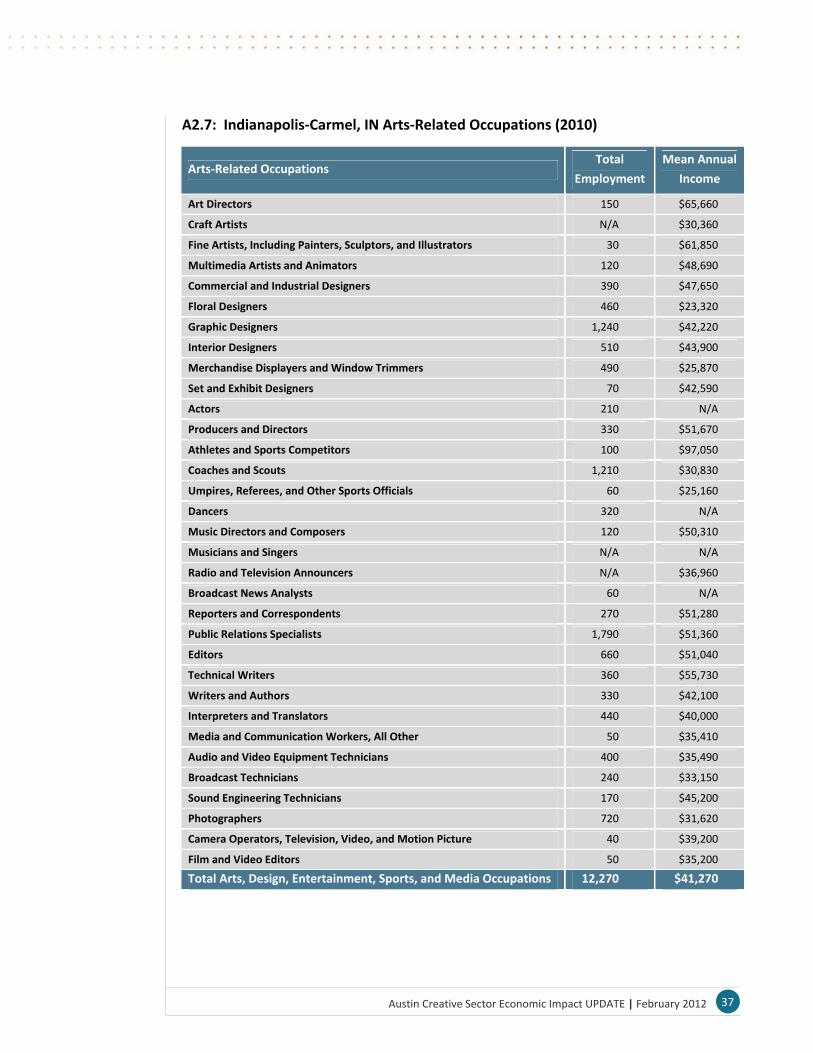
37Austin Creative Sector Economic Impact UPDATE | February 2012
A2.7: Indianapolis‐Carmel, IN Arts‐Related Occupations (2010)
Arts‐Related Occupations Total
Employment
Mean Annual
Income
Art Directors 150 $65,660
Craft Artists N/A $30,360
Fine Artists, Including Painters, Sculptors, and Illustrators 30 $61,850
Multimedia Artists and Animators 120 $48,690
Commercial and Industrial Designers 390 $47,650
Floral Designers 460 $23,320
Graphic Designers 1,240 $42,220
Interior Designers 510 $43,900
Merchandise Displayers and Window Trimmers 490 $25,870
Set and Exhibit Designers 70 $42,590
Actors 210 N/A
Producers and Directors 330 $51,670
Athletes and Sports Competitors 100 $97,050
Coaches and Scouts 1,210 $30,830
Umpires, Referees, and Other Sports Officials 60 $25,160
Dancers 320 N/A
Music Directors and Composers 120 $50,310
Musicians and Singers N/A N/A
Radio and Television Announcers N/A $36,960
Broadcast News Analysts 60 N/A
Reporters and Correspondents 270 $51,280
Public Relations Specialists 1,790 $51,360
Editors 660 $51,040
Technical Writers 360 $55,730
Writers and Authors 330 $42,100
Interpreters and Translators 440 $40,000
Media and Communication Workers, All Other 50 $35,410
Audio and Video Equipment Technicians 400 $35,490
Broadcast Technicians 240 $33,150
Sound Engineering Technicians 170 $45,200
Photographers 720 $31,620
Camera Operators, Television, Video, and Motion Picture 40 $39,200
Film and Video Editors 50 $35,200
Total Arts, Design, Entertainment, Sports, and Media Occupations 12,270 $41,270

38Austin Creative Sector Economic Impact UPDATE | February 2012
A2.8: Memphis, TN‐MS‐AR Arts‐Related Occupations (2010)
Arts‐Related Occupations Total
Employment
Mean Annual
Income
Art Directors 60 $67,470
Commercial and Industrial Designers 60 $49,660
Floral Designers 140 $24,990
Graphic Designers 550 $46,000
Interior Designers 110 $43,440
Merchandise Displayers and Window Trimmers 290 $30,930
Producers and Directors 150 $41,990
Athletes and Sports Competitors 90 N/A
Coaches and Scouts 380 $42,590
Dancers 60 N/A
Music Directors and Composers N/A $40,460
Musicians and Singers 100 N/A
Radio and Television Announcers 200 $27,960
Reporters and Correspondents 170 $31,210
Public Relations Specialists 490 $49,470
Editors 210 $45,910
Technical Writers 110 $57,830
Writers and Authors 90 $45,420
Interpreters and Translators 60 $36,410
Audio and Video Equipment Technicians 150 $29,220
Broadcast Technicians 100 $27,900
Photographers 140 $23,630
Camera Operators, Television, Video, and Motion Picture N/A $39,830
Total Arts, Design, Entertainment, Sports, and Media Occupations 4,100 $41,510
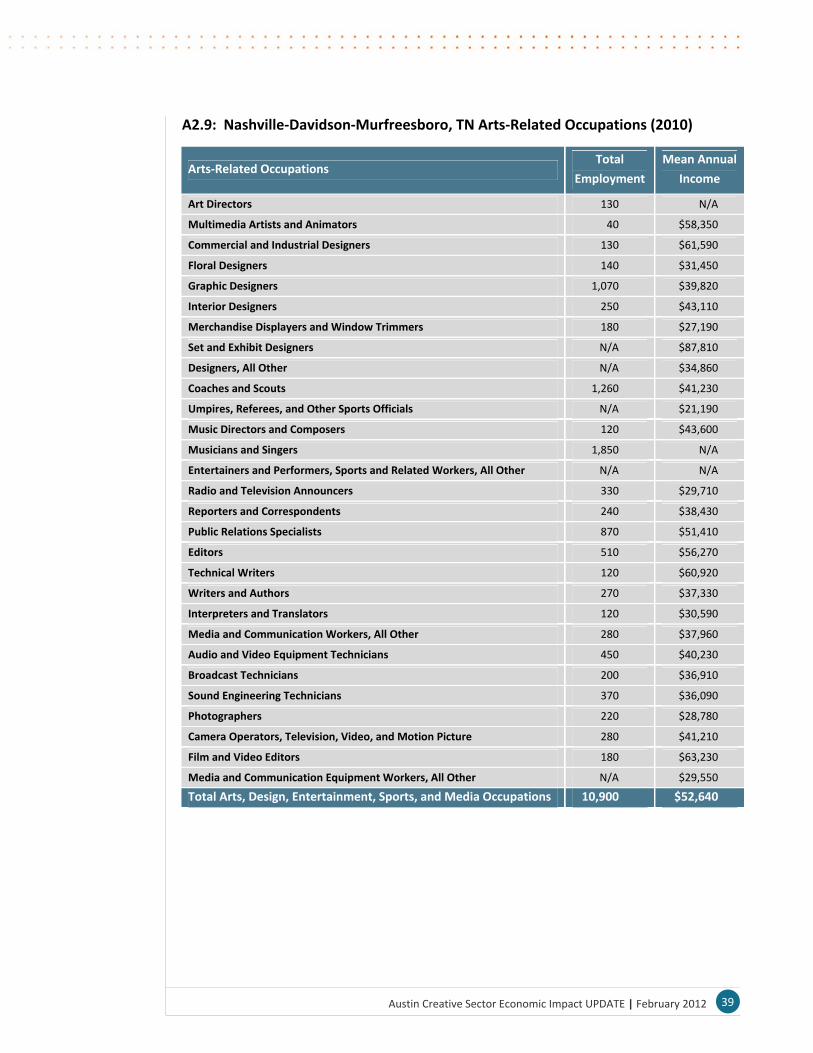
39Austin Creative Sector Economic Impact UPDATE | February 2012
A2.9: Nashville‐Davidson‐Murfreesboro, TN Arts‐Related Occupations (2010)
Arts‐Related Occupations Total
Employment
Mean Annual
Income
Art Directors 130 N/A
Multimedia Artists and Animators 40 $58,350
Commercial and Industrial Designers 130 $61,590
Floral Designers 140 $31,450
Graphic Designers 1,070 $39,820
Interior Designers 250 $43,110
Merchandise Displayers and Window Trimmers 180 $27,190
Set and Exhibit Designers N/A $87,810
Designers, All Other N/A $34,860
Coaches and Scouts 1,260 $41,230
Umpires, Referees, and Other Sports Officials N/A $21,190
Music Directors and Composers 120 $43,600
Musicians and Singers 1,850 N/A
Entertainers and Performers, Sports and Related Workers, All Other N/A N/A
Radio and Television Announcers 330 $29,710
Reporters and Correspondents 240 $38,430
Public Relations Specialists 870 $51,410
Editors 510 $56,270
Technical Writers 120 $60,920
Writers and Authors 270 $37,330
Interpreters and Translators 120 $30,590
Media and Communication Workers, All Other 280 $37,960
Audio and Video Equipment Technicians 450 $40,230
Broadcast Technicians 200 $36,910
Sound Engineering Technicians 370 $36,090
Photographers 220 $28,780
Camera Operators, Television, Video, and Motion Picture 280 $41,210
Film and Video Editors 180 $63,230
Media and Communication Equipment Workers, All Other N/A $29,550
Total Arts, Design, Entertainment, Sports, and Media Occupations 10,900 $52,640
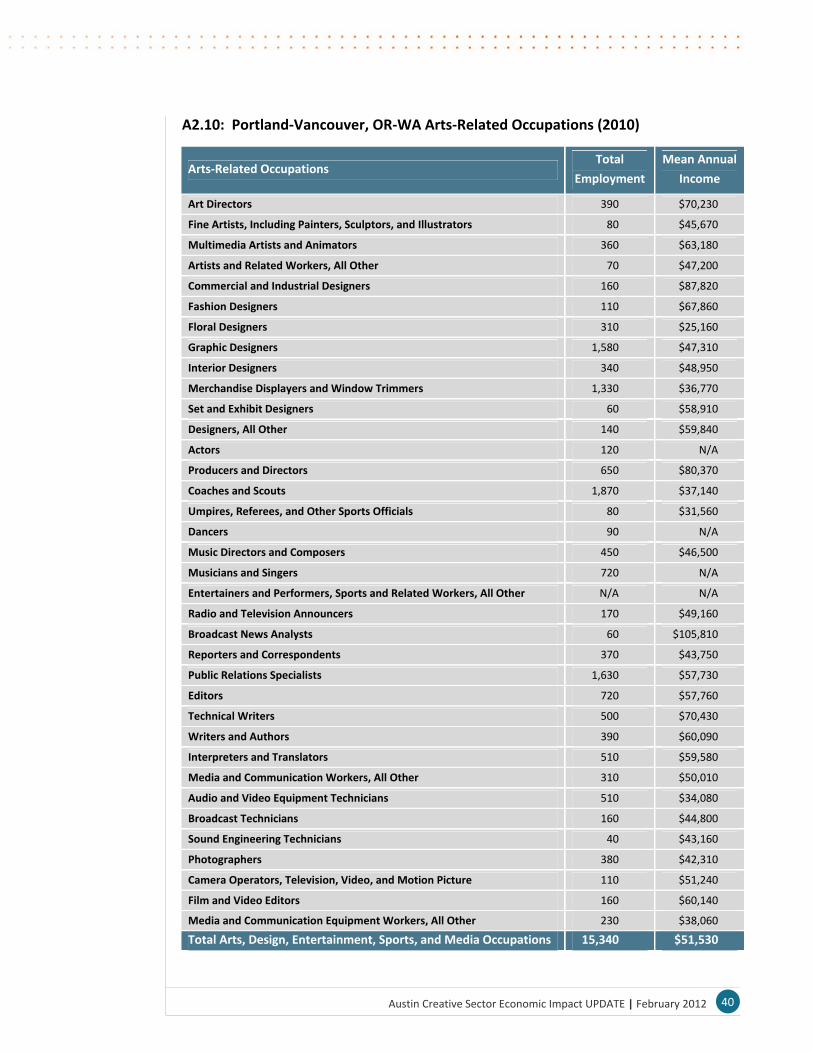
40Austin Creative Sector Economic Impact UPDATE | February 2012
A2.10: Portland‐Vancouver, OR‐WA Arts‐Related Occupations (2010)
Arts‐Related Occupations Total
Employment
Mean Annual
Income
Art Directors 390 $70,230
Fine Artists, Including Painters, Sculptors, and Illustrators 80 $45,670
Multimedia Artists and Animators 360 $63,180
Artists and Related Workers, All Other 70 $47,200
Commercial and Industrial Designers 160 $87,820
Fashion Designers 110 $67,860
Floral Designers 310 $25,160
Graphic Designers 1,580 $47,310
Interior Designers 340 $48,950
Merchandise Displayers and Window Trimmers 1,330 $36,770
Set and Exhibit Designers 60 $58,910
Designers, All Other 140 $59,840
Actors 120 N/A
Producers and Directors 650 $80,370
Coaches and Scouts 1,870 $37,140
Umpires, Referees, and Other Sports Officials 80 $31,560
Dancers 90 N/A
Music Directors and Composers 450 $46,500
Musicians and Singers 720 N/A
Entertainers and Performers, Sports and Related Workers, All Other N/A N/A
Radio and Television Announcers 170 $49,160
Broadcast News Analysts 60 $105,810
Reporters and Correspondents 370 $43,750
Public Relations Specialists 1,630 $57,730
Editors 720 $57,760
Technical Writers 500 $70,430
Writers and Authors 390 $60,090
Interpreters and Translators 510 $59,580
Media and Communication Workers, All Other 310 $50,010
Audio and Video Equipment Technicians 510 $34,080
Broadcast Technicians 160 $44,800
Sound Engineering Technicians 40 $43,160
Photographers 380 $42,310
Camera Operators, Television, Video, and Motion Picture 110 $51,240
Film and Video Editors 160 $60,140
Media and Communication Equipment Workers, All Other 230 $38,060
Total Arts, Design, Entertainment, Sports, and Media Occupations 15,340 $51,530

41Austin Creative Sector Economic Impact UPDATE | February 2012
A2.11: San Antonio, TX Arts‐Related Occupations (2010)
Arts‐Related Occupations Total
Employment
Mean Annual
Income
Art Directors 90 $71,160
Craft Artists 40 $26,280
Multimedia Artists and Animators 110 $57,560
Floral Designers 230 $25,910
Graphic Designers 1,010 $44,260
Interior Designers 260 $46,540
Merchandise Displayers and Window Trimmers 700 $26,010
Producers and Directors 270 $60,010
Coaches and Scouts 540 $33,210
Music Directors and Composers 120 $58,870
Musicians and Singers N/A N/A
Radio and Television Announcers 260 $32,690
Reporters and Correspondents 250 $30,040
Public Relations Specialists 1,590 $52,800
Editors 660 $47,990
Technical Writers 250 $58,050
Writers and Authors 100 $57,490
Interpreters and Translators 220 $42,440
Audio and Video Equipment Technicians 190 $34,510
Broadcast Technicians 170 $39,940
Sound Engineering Technicians N/A $30,920
Photographers 300 $30,410
Camera Operators, Television, Video, and Motion Picture 70 $47,540
Film and Video Editors 30 $42,030
Media and Communication Equipment Workers, All Other 130 $68,150
Total Arts, Design, Entertainment, Sports, and Media Occupations 8,480 $44,630
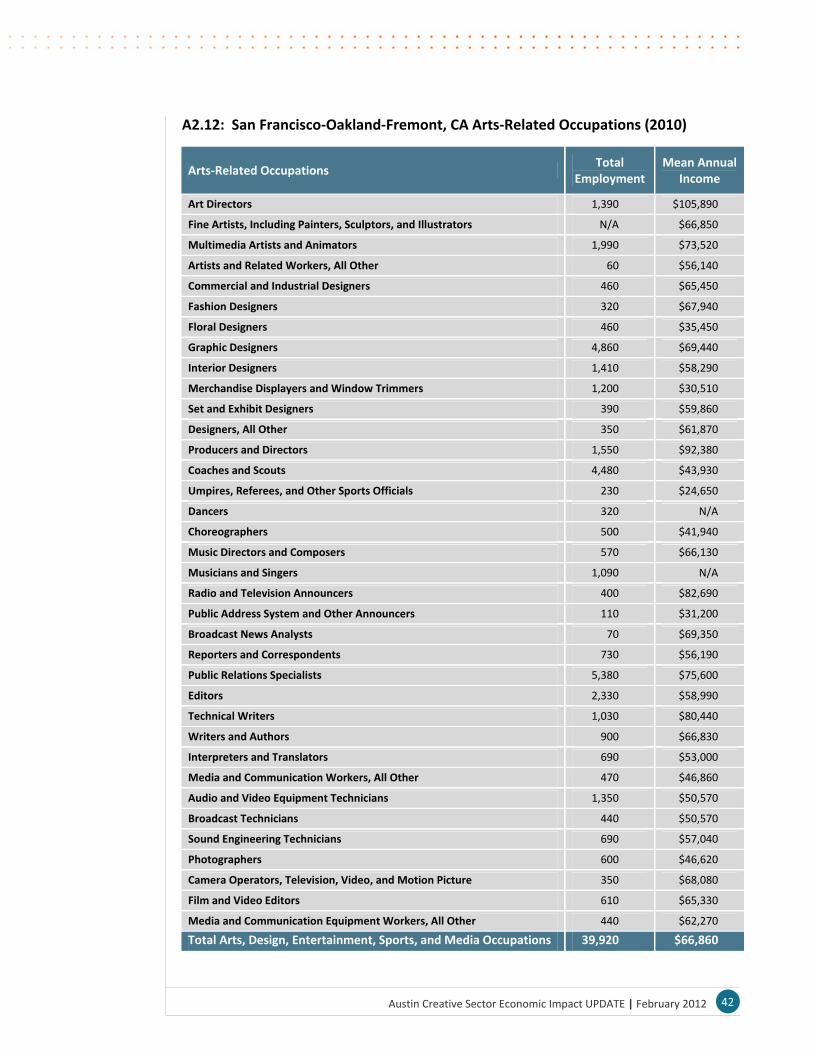
42Austin Creative Sector Economic Impact UPDATE | February 2012
A2.12: San Francisco‐Oakland‐Fremont, CA Arts‐Related Occupations (2010)
Arts‐Related Occupations Total
Employment Mean Annual
Income
Art Directors 1,390 $105,890
Fine Artists, Including Painters, Sculptors, and Illustrators N/A $66,850
Multimedia Artists and Animators 1,990 $73,520
Artists and Related Workers, All Other 60 $56,140
Commercial and Industrial Designers 460 $65,450
Fashion Designers 320 $67,940
Floral Designers 460 $35,450
Graphic Designers 4,860 $69,440
Interior Designers 1,410 $58,290
Merchandise Displayers and Window Trimmers 1,200 $30,510
Set and Exhibit Designers 390 $59,860
Designers, All Other 350 $61,870
Producers and Directors 1,550 $92,380
Coaches and Scouts 4,480 $43,930
Umpires, Referees, and Other Sports Officials 230 $24,650
Dancers 320 N/A
Choreographers 500 $41,940
Music Directors and Composers 570 $66,130
Musicians and Singers 1,090 N/A
Radio and Television Announcers 400 $82,690
Public Address System and Other Announcers 110 $31,200
Broadcast News Analysts 70 $69,350
Reporters and Correspondents 730 $56,190
Public Relations Specialists 5,380 $75,600
Editors 2,330 $58,990
Technical Writers 1,030 $80,440
Writers and Authors 900 $66,830
Interpreters and Translators 690 $53,000
Media and Communication Workers, All Other 470 $46,860
Audio and Video Equipment Technicians 1,350 $50,570
Broadcast Technicians 440 $50,570
Sound Engineering Technicians 690 $57,040
Photographers 600 $46,620
Camera Operators, Television, Video, and Motion Picture 350 $68,080
Film and Video Editors 610 $65,330
Media and Communication Equipment Workers, All Other 440 $62,270
Total Arts, Design, Entertainment, Sports, and Media Occupations 39,920 $66,860

43Austin Creative Sector Economic Impact UPDATE | February 2012
Appendix 3: Focus Group Participants
The following is a list of the industry sector participants, with their affiliations, at each of the
four focus group meetings. Following the meetings, a list of questions and topics discussed
was shared with other industry representatives who were unable to attend the focus group
discussion. The individuals who responded to this email inquiry have been included in the
appropriate sector subgroup and are marked with an asterisk (*).
Music Focus Group Participants
Ernest Auerbach (Austin Lyric Opera)
Danny Gillespie (Austin Music Foundation)
Colin Kendrick (Austin Music Foundation)
Catlin Whitington (SXSW)
Matt Hinsley (Austin Classical Guitar Society)
Michael Feferman (C3 Presents)
Heather Wagner Reed (Juice Consulting LLC/Music Commission)
Harold McMillan (Diverse Arts Culture Works)
Ed Bailey (Austin City Limits//KLRU)
*Ora Shay (Austin Chamber Music Center)
*Michael Melinger (Austin Jazz Workshop, Inc.)
*Michael Mordecai (musician)
Film and Visual Media Focus Group Participants
Susan Kirr (independent producer)
John Crowley (independent location manager/scout)
Christian Raymond (Austin Community College RTF)
Beth Sepko (BSEPKO Casting)
Janet Pierson (SXSW Film)
Rebecca Campbell (Austin Film Society)
Joey Hudgins (location manager/film production)
Elizabeth Reeder‐Neubauer (Alliance Austin and Studio E)
Donise Hardy (A Casting Place)
Barbara Morgan (Austin Film Festival)
*Lisa McWilliams (Mobile Film School)
*Steve White (independent scout/location manager)
*Tim League (Alamo Drafthouse)
*Robbie Friedmann (independent location manager)

44Austin Creative Sector Economic Impact UPDATE | February 2012
Gaming and Digital Media Focus Group Participants
Jesse Benjamin (Sony Online Entertainment)
Matt Scibilia (Critical Mass Interactive Inc)
Brad Woolwine (Critical Mass Interactive Inc)
Fred Scmidt (Portalarium Inc)
Gordon Walton (Playdom Austin)
Tony Schum (Austin Chamber of Commerce)
*Warren Spector (Junction Point)
*Julie Huls (Austin Technology Council)
Not‐for‐Profit Arts Focus Group Participants
Terrence Moline (Team Moline LLC)
Etta Sanders (New Works Theater Community)
Marcy Hoen (Austin Creative Alliance)
Allison Orr (Forklift Danceworks)
Meredith Powell (Art Alliance Austin)
Brad Carlin (Fusebox)
Shea Little (Big Medium)
Cookie Ruiz (Ballet Austin, Create Austin, and Imagine Austin)
Laura Esparza (COA/PARD)
Sylvia Orozco (Mexic‐Arte Museum)
*Lisa McWilliams (Mobile Film School)
45Austin Creative Sector Economic Impact UPDATE | February 2012
Appendix 4: Focus Group Notes
Four individual focus groups were held in mid‐November. In order to provide some structure
and continuity to the conversation, the following questions were asked of each group
1. Describe the current state of your industry in Austin. How has the status of the
national economy influenced the situation?
2. Aside from the overall economic environment, what are the key issues facing your
industry locally?
a. Business model
b. Customers/clients
c. Labor Force (cost/quality/availability)
d. Regulatory environment
e. Other costs
f. Competition – Domestic & Foreign
3. What are Austin’s strengths? Have they changed in the last several years?
4. What are Austin’s weaknesses? Have they changed in the last several years?
5. What could and should the City do to improve the situation? What should other
institutional actors be doing?
A4.1 Film Focus Group
Discussion of change over last 5 years
The industry in Austin is missing big money – no features ($20 to $40 million)
Still lots of ultra‐low budget indie films
Louisiana, Michigan, and New Mexico are drawing all of the large productions with
their incentive programs. Though, in real terms the gap between their incentives
and TX incentives is not as large as is perceived (differences in sales tax, caps on
incentive programs, check verses selling a credit, etc.).
Things do seem to be coming back
The $10‐20 million film base used to be the bread and butter of Austin, but that level
of film budget is not happening very much anywhere
There is a discussion of creating a City matching fund (not 1:1) for state film incentives
The nature of incentives has led several of the participants to work less in Austin and more in
other places in Texas (Dallas) and out of the state
Huge budget films don’t come to Austin and they would be very unpredictable anyway
In the 90s, TV movies were huge
46Austin Creative Sector Economic Impact UPDATE | February 2012
“This is an indie town”
Producers like Austin – they say it is easy to get things done and the town and citizens are
used to creative things happening here
Fox and WB both like to be here; lots of projects look to come here but ultimately they go
where the incentives are. The bottom line in paramount
At the other end of the spectrum are the indie films. They need development and support
their developing businesses
According to Austin Studios, films traditionally came here because of: (1) incentives, (2) crew,
(3) locations, (4) night life, and (5) facilities – but now the available facilities have moved to
third in the rankings with the development of Austin Studios
Maybe there is a need to change perception of incentives to match reality; right now the
perception is that Texas is not serious about incentives. It is important to court production
companies and studios – “let LA people know.” At the Expo, Texas does not have a good
marketing effort (but Dallas does). Other states go all out.
Ann Richards in the 90s
Bring people HERE, rather than sending representatives to LA.
Buy badges for industry people for SXSW (this is already happening, but a more
sustainable and focused approach could be helpful)
Coordinate efforts with location people to see facilities and locations
Spend marketing money IN Austin rather than in LA
Austin Film Commission website is old. It needs to be updated. People need to know what
services are available, where, when, and who to contact.
Austin’s crew, locations, and culture are very competitive with other cities. (Marketing and
incentive programs are not competitive.)
A website with different examples of what can be filmed in Austin (types of geography, eras,
etc.)
What do we want to be competitive in:
47Austin Creative Sector Economic Impact UPDATE | February 2012
We’re here as a location, not as an industry (even though the message to date has
been that Austin wants to be an industry)
Independent, but jobs and support services are not
If we can bridge the funding gap for indies, it will draw them here
Create infrastructure for investment (not just for low end films; everyone needs
funding)
Fungible nature of shooting locations leads to two options:
1. Draw in big budget with incentives
2. Build up local talent (act as a film industry incubator)
UT has moved towards a focus on student‐driven films (less risky) and emphasizing the
teaching opportunity rather than any potential commercial success
Need capital to fund independent film production in Austin
Industry‐wide problem: how do you monetize creative work, BUT creative work will still
happen
Policy Suggestion: cheap rent for home and work space
Incubator strategy: create a center for communication and cooperation which will promote
mentorship (people who have done what you want to do). Some mentoring exists through
AFS and Reel Women.
San Antonio has a city incentive? Maybe HOT funded?
Create a resource guide:
Who has been successful
Could the film society do this?
Help with marketing AND making films
The Alamo theatre is an example of a successful business model
Need to move from an insular community to an industry: invite people in to get their take
from the outside of our market and to get a picture of the entire industry
Local vs industry‐wide issues (most issues facing film industry in Austin stem from industry‐
wide)
48Austin Creative Sector Economic Impact UPDATE | February 2012
Austin’s reputation: can turn permits in a day and the city is fantastic about accommodating
filming
Transmedia: intersection and convergence of gaming, film (production, not casting, lighting,
etc.), and music industries. Media convergence is huge industry‐wide (they are now
interlocking industries) with the rising influence of technology
Policy recommendations: (1) balance incentives, (2) provide free facility/location space, (3)
create an I.D. card for crew members to spread out the incentive (Film Commission is already
doing this?)
Use IC2 as a model. They used the big picture to structure programs and partnerships to
generate a specific outcome and implemented infrastructure project o support industry
development.
Goal: creators need to have sustainable business models (the difference between the tech
industry and the film industry is that there is a lack of a patent, so they need to use a new
entertainment‐based model), to do this firms should be brought together in a consortium or
development‐support institution
New distribution models can be created here!
Geo‐code addresses of locations and firms (get information from TX Film Commission)
Connection of technology, creative sector, money, and the City
Need to have technology innovators at the table
City could take the point to promote communication between sectors and cooperation
Create a consortium (could be housed at National Guard location)
This cooperative effort needs to look like it is not stealing funding from existing film
support monies
Support entrepreneurship
Provide necessary tools for scaling their business models
TV vs film: there is a LOT of TV work and a lot of quality productions (though all writing and
post‐production happens in LA). TV is less risky and offers the possibility for a better return

49Austin Creative Sector Economic Impact UPDATE | February 2012
because it can be adjusted quickly (like Friday Night Lights). There are also a lot of
distributors for TV because each station now makes its own content.
Why Dallas and not Austin?
Lying Game receives an extra 2.5% incentive for filming in a low income area
(“empowerment zone”). When new census data comes out, this is likely no longer be
available to productions at Austin Studios. However, the City could help map areas that do
qualify as “empowerment zones” and facilitate the use of existing facilities in these areas.
“Creativity is the asset”
A4.2 Video Games and Digital Media Focus Group
Old debate: how is the business model changing?
Funding at SXSWi accelerator
Crowd sourcing (new Boondock Saints)
MMOs
Transmedia (connection between different platforms)
Investment groups outside of Austin are the most viable; they are looking to turn $100
million into $1 billion
Connection of gaming to other types of technology use – medical simulation, military, etc
(this is easier for funder to understand how they will recoup their investment); technology
NOT entertainment is the draw for investors
Investment funding is still an issue – so it is important to look for alternative opportunities
This fits Austin’s image as an indie, entrepreneur‐driven city
Super angels and seed funding
It is possible for entrepreneurs to stand out
Deal making is happening at an earlier level; frontline capital is going to entrepreneurs
Video games are high risk, low reward propositions unless they make the jump to other
media platforms or franchise
Need film, not technology/venture capital type financing; innovation/entertainment funding
can be Austin’s niche
50Austin Creative Sector Economic Impact UPDATE | February 2012
Don’t recruit companies to come here; build up the capacity of local entrepreneurs who will
build their headquarters here when the succeed (because they also will STAY)
Create networks/communication avenues between entrepreneurs
Pair money with talent – workforce development (bus programmers to Austin. Once they
get here they will never want to leave.)
Update university curricula to reflect the real needs of the industry
Need own investor infrastructure
Learn from evolution of the industry in San Francisco (creative industry and educational
institutions support each other)
UT is not connected to the industry
Gaming education is seen as a trade school type degree
Large corporations want a relationship with universities; UT requires endowments to get any
traction
Get Sand Hill Road reps here; have managing partners create an Austin office; create a VC
incubator? It is important for them to be familiar with local specifics
SXSWi wants to be a player
Brand Austin as center of creative industries
Need help to capitalize on and take advantage of
Austin is more about innovation, not imitation which can be riskier
Industry is being more involve in work force development
There is an increasing quality of graduates from St Eds and ACC
Need more internship opportunities
Budget and production cycles are so tight that there is less space for mentorship
Industry can’t grow as fast as it could
Need more people with tech training
Need capital empowerment
51Austin Creative Sector Economic Impact UPDATE | February 2012
Have the creative talent
Detroit offers 50% of everything incentive (not just R&D)
Infrastructure changes are more important than incentives (incentives are too slow and
private sector funding is working right now)
City can help create right environment: create a media hub ‐ use old National Guard building
and incentivize venture capital to locate in one space (city could be influential in helping
Austin Studio developing National Guard building into a multimedia facility)
facilities and low cost space (like South of Market in San Francisco)
Unused second and third floors on 6th and Congress: trying to create “nerdberg” – maybe the
City can offer property tax incentives?
Global labor force and global competition
California is too expensive for new businesses, bureaucracy is huge, and because there is a
large supply of employers the employees are not very loyal
In a creative industry they need a lot of people with the same skills so that you can find the
right fit for your business
Money is the biggest issue. Not creative talent. Not product capability.
Funders need to be part philanthropy, part investment
Austin can hold on to talent because of the lifestyle it offers even when there are more
opportunities elsewhere
Have creative, need engineers
Online industry is where the opportunities are
Honors program at UT in computer science – these graduates are poached by Google who
can pay more
Independent studios: publishers, VC, angle funding

52Austin Creative Sector Economic Impact UPDATE | February 2012
SXSWI accelerator, GDC
Need more publisher/published mentors for people who want to publish themselves (in
Austin, the industry is mostly studios who are similar to wholesalers)
Investors are more willing to invest in publishers, rather than studios
Buying vs growing the dog – Texas Emerging Technology Fund: filling funding gap between
friends/family and venture capital. What do they need? What is the cost of funding,
application process, restrictions/requirements/bureaucracy?
Need early stage investors and a mechanism for regular meetings between mentors and
mentees in the industry – creative media vertical incubators
Government funding can’t take the place of investors: there is too much risk and the cultures
are too different
“how do we create publishers” is an evolving question
Nearly impossible to tell what the industry will look like in 5 years
How to tap into conservative old Texas money? They believe in local investment. Focus is on
project investment, not company investment. Need to have a bridge between them and
techy firms.
A4.3 Non‐Profit Arts Focus Group
Assets of non‐profits in cultural production are much lower in Austin than in comparable
communities
Non‐sustainable
according to Louise Stevens, based on 990 reports
disparity between commercial and non‐profits in Austin
could create a “crisis of creativity” going forward
People starting their own non‐profits don’t have enough support and communication
between all members of the non‐profit sector in Austin could be better. If support, classes,
and infrastructure exists it is not well known or take advantage of by most of the sector.
The issue is the economy

53Austin Creative Sector Economic Impact UPDATE | February 2012
HOT funding is up
Changes to the deductibility of charitable giving will have an impact; increasing requirements
for 990s
Size is not the issue, excellence is the issue (non‐profits need to know how to run
businesses). There is a lack of basic business knowledge and how to run their day to day
operations ‐ in Philadelphia, there is a support for infrastructure and foundations that fund
day to day and this s a location where dance in particular is flourishing
Need health insurance and dental coverage and working wages for artists (no one pays all of
these)
Working artists are bypassing the non‐profit model and going to LLCs and other models (not‐
for‐profit is just an IRS taxing designation)
Artists have to exist on a project to project basis and it is hard to make it at an institutional
level and funders don’t want to fund operations
Austin can’t copy NYC, Philadelphia, or Atlanta (they have 100 year old foundations). We
need to think more like entrepreneurs
The perception is non‐profit is easier than a business
Philanthropy is different
Social entrepreneurship has increased the proliferation of non‐profits, but they are “time
sucks”
“kick start” program is an example of innovation in funding models (but it increases the
workload for performers because everyone has to be involved in the marketing effort)
Chronicle of Philanthropy ranks Austin’s “stinginess” as high
No direct correlation between income and participation in the arts in Austin; it is a young
community
54Austin Creative Sector Economic Impact UPDATE | February 2012
Opportunity: not blinded by large institutions and not tied to a few large donors (which can
lead to a type of censorship); this means that it can be anyone’s game and entrepreneurship
is valued
Charitable gifts in Austin are typically at the $500‐$1,500 level; most large gifts are
endowments (so organizations never get to touch the principle)
In 10 years everyone will be shocked that Austin will have used a completely different model
Want funders to be engaged but not overwhelmed
Ongoing sustaining donors – “regulars”
Facilities, infrastructure, and capital assets (the city could help with these) but organizations
really need operations budget and business management assistance
Austin is unique in the availability of community arts (everyone thinks they are an artist to
some degree)
Create Austin set up the framework for collaboration and discussion of new ideas; it found
that there doesn’t need to be yet another department, but just more cross‐department
collaboration and marketing of services that are already available
Need: space (rehearsal and workspace); there are inventories of what is needed and what
exists for space – are they up to date?
Federal courthouse (30,000 square feet) – what will it be repurposed for?
Bond money for workspace for artists?
Movement to get members of the creative sector to be involved in leadership and policy
development; they should sit in arts council or commission and participate as needed; the
issue is that they don’t know how to become involved, don’t know that it is important,
and/or don’t have time
The importance of the strength of organizational and community infrastructure: leaders and
administrators can advocate and be politically involved while artists work and produce; it is
on the arts community themselves to reach out to all members and activate their community
55Austin Creative Sector Economic Impact UPDATE | February 2012
Educate the community about how to donate and how to support: everyone identifies Austin
as an arts town, but there is a lack of a call to action or immediacy to funding requests
Sustainability/ Austin as an arts incubator – people come here to get their start and then
leave
Separate silos don’t make sense and are an impediment to progress; need to change the
orientation to see all creative industries as part of a cohesive whole
Too many non‐profits; maybe some should merge together to share resources and
administrative help
Need to develop professional boards and leadership; it is difficult to make the case for a
funder to pay for full‐time staff/leadership (in this way grants/charity are different from
venture capital)
Change capital; invest with risk
Need to maintain diversity in arts ecosystem but there is a disparity of professionalism and
success
VC mentality (and funding) would help the non‐profit sector in Austin
Businesses that support the arts and art institutions
Cultural contracts
Update city’s system and how they deal with the arts (right now it is lumped into multiple
departments, mostly parks and recreation, and they give HOT $)
Line item funding the operations of their major institutions – has this been successful in
other cities?
Arts must be funded because it promotes innovation and early adopting of new technologies
and models
Different funding models: pay for projects, pay for artists, pay for infrastructure
Speak to the value for businesses; the arts are important in selling Austin

56Austin Creative Sector Economic Impact UPDATE | February 2012
Need to incorporate into the comp plan
Loaded term of “culture”: cultural heritage (minorities), large cultural institutions (pearls), or
creative businesses
Sense of urgency is missing because the arts are everywhere in Austin so it is easy to take
them for granted; it is not about making people believe that it is Armageddon, but that
without investment it will diminish and die overtime and then the city will change ‐ this type
of education effort requires advocacy
City‐wide marketing campaign
Economic development organization for the creative sector: the creative alliance
strengthen value proposition
marketing infrastructure, helping fledgling organizations and companies get funding
working artists need to be included into the political dialogue; they need to take themselves
seriously; mentoring is key
Imagine Austin comp plan is coming out at the beginning of next year
Funding for arts/creative businesses should be consolidated
Mobile app is developing a new model for revenue
Growing importance of digital media for the arts – need to try new things; cutting edge;
changing business model but can’t replace the LIVE aspect of performance, attendance, etc
Regular meetings and conversations among all creative sector participants
Create a chamber of commerce for the arts?
57Austin Creative Sector Economic Impact UPDATE | February 2012
A4.4 Music Focus Group
Clubs downtown and their ability to stay downtown
Struggle for live music venues and even the definition of what that is
Label structure is breaking down; the music business is becoming more spread out and
diffuse
Physical infrastructure is not necessary so marginal cost has gone down to almost nothing
Non‐live component is very similar to rest of creative sector
Need more support for not for profit arts
Live music: noise complaints; balance needs of new residents and existing venues as the city
encourages increased density downtown
If music is pushed out of downtown, it will lead to it being too spread out
There is something special about the central location of mixed big and small venues; Austin
has a unique concentration of live music
There is an issue of bands staying within the decibel limits – i.e. W hotel vs Cedar Street; also,
it may just be that it is not the live music venues but the bars and related noise
City is changing and you have to allow it to change
Construction requirements to use better materials to block music/noise
City could help: data collection with regards to noise complaints (ability to categorize) ‐ this
will separate out the complaints with the undergrad bars and the live music bars
Waller Creek Plan: 15 story mixed use ‐ pays better rent than a music venue but the vibrant
cultural life that is lost when music venues are pushed out creates a different type of value
(similar to a park)
Take into account the impact of music and encourage the unique fabric of downtown to be
recognized in planning
58Austin Creative Sector Economic Impact UPDATE | February 2012
Sound mitigation requirements downtown
City owned venues designated for use by promoters/acts (zoning issue?)
Use vs. personality (incentive specific uses but allow market to determine personality) – the
city needs to take a stand to support specific uses
Tourism vs. relocation
Issue of slippery slope of losing the soul of downtown
Free rider problem with large corporations who use the brand of Austin to capture new
talent
Monetize the brand of Austin
Young creatives and professionals – diversity
City leadership in strategic planning to determine what kind of people we are looking to
attract and what kind of downtown/city we want
Value of young energy even if you don’t participate
City puts money into a running path but people come because the city is “cool”
Incubator & advocacy & tracking data
Needs: places to perform
State of Austin economy; need to raise the level of dialogue
Music industry model is falling apart
Austin Music Foundation tracks music (standing data needs, use their interns to track)
SXSW interactive is growing fastest (issues = safety and crowd control)
Traffic control downtown – limit the number of events? Space them out more? Different
types of events?
59Austin Creative Sector Economic Impact UPDATE | February 2012
SXSW growth: issue of space. Need more venues for interactive (currently they are in all
downtown venues). In east Austin the neighborhood association is pushing back (hotels
downtown don’t complain about the noise). Another problem for SXSW is the cooptation
consumer brands and the movement away from being an industry event to a festival has
created infrastructure shock
Lyric Opera attendees are 25% from outside the Austin area but donors are all Austin –based.
Attendance is approximately 20,000 per year. They are trying to segment their performances
to appeal to different potential audiences
CVB: role of live music in attracting conventions?
Pointer patron model
Album‐tour relationship is changing
Perception: need to leave Austin to a successful Austin musician
Challenge: people in seats
What is needed to help artist tour and make money – entrepreneurship education (VC
model) but most educational funding is aimed at children
Austin Music Foundation helps artists learn to master and market their record
Create a connection between SXSW/ACL and not‐for‐profits for professionalism development
Philanthropy is aimed at charities and high arts, not popular music
60Austin Creative Sector Economic Impact UPDATE | February 2012
Legal Disclaimer
TXP reserves the right to make changes, corrections, and/or improvements at any time and
without notice. In addition, TXP disclaims any and all liability for damages incurred directly or
indirectly as a result of errors, omissions, or discrepancies. TXP disclaims any liability due to
errors, omissions, or discrepancies made by third parties whose material TXP relied on in
good faith to produce the report.
Any statements involving matters of opinion or estimates, whether or not so expressly
stated, are set forth as such and not as representations of fact, and no representation is
made that such opinions or estimates will be realized. The information and expressions of
opinion contained herein are subject to change without notice, and shall not, under any
circumstances, create any implications that there has been no change or updates.