the economic impact of qualcomm: driving san … the economic impact of qualcomm: driving san...
TRANSCRIPT

An economic impact report on Qualcomm and the Telecommunications and Information Technology industries in San Diego, including a workforce needs assessment.
RELEASE DATE | JANUARY 11 , 2013
SPONSORED BY
San Diego Workforce PartnershipSan Diego Regional Economic Development Corporation
THE ECONOMIC IMPACT OF QUALCOMMDriving San Diego’s Technology Growth
2
The Economic Impact of Qualcomm: Driving San Diego’s Technology Growth
San Diego Workforce Partnership & San Diego Regional Economic Development Corporation
TABLE OF CONTENTS
Table of Contents ............................................................................................................ 2
List of Tables ................................................................................................................... 3
List of Figures and Acknowlegements ............................................................................. 4
Introduction ..................................................................................................................... 5
Part 1 - The Economic Impact of Qualcomm: Driving San Diego’s Technology Growth .. 6
Executive Summary ..................................................................................................... 6
Conclusions ................................................................................................................. 9
Defining the Segments ............................................................................................... 10
Economic Impact of QUALCOMM on San Diego County’s Economy ......................... 12
Economic Impacts of Additional QUALCOMM Employment in San Diego County ..... 16
QUALCOMM’s Philanthropic Donations ..................................................................... 17
Part 2 – Economic Impact of Telecommunications & Information Technology Sectors on San Diego County’s Economy ....................................................................................... 18
San Diego County Compared to Other High Technology Communities ..................... 25
Part 3 – Workforce Assessment: Human Capital the Key Variable In San Diego’s Telecommunications & Technology Equation ................................................................ 29
Executive Summary ................................................................................................... 29
Profile of San Diego’s Telecommunications and Information Technology Employers . 34
Survey of Employers .................................................................................................. 35
Career Pathways, Occupations and Skills in Telecommunications and Information Technology ................................................................................................................ 39
Appendix A: Methodology ........................................................................................... A-1
Economic Impact Analysis ....................................................................................... A-1
Comparative Regional Analysis – National University .............................................. A-2
Primary Research – Surveys and Executive Interviews ........................................... A-3
Appendix B: San Diego County Telecom & ICT Employer Survey Toplines (n=200) ... B-1
Appendix C: Telecommunications, ICT, & Convergence with Telecom Industries Comparison Of Metro Areas ........................................................................................ C-1

3
The Economic Impact of Qualcomm: Driving San Diego’s Technology Growth
San Diego Workforce Partnership & San Diego Regional Economic Development Corporation
LIST OF TABLES
Table 1: Qualcomm, Telecommunications & Information Technology Economic Impact Profile for San Diego County ........................................................................................... 9
Table 2: NAICS Definition for Telecommunications (Segment 1) ................................... 10
Table 3: NAICS Definition for Information Technology (Segment 2) .............................. 11
Table 4: Total Economic Impacts of Qualcomm, yearly ................................................. 12
Table 5: Top 10 Industry Sectors Indirectly Impacted by Qualcomm, yearly .................. 14
Table 6: Top 10 Industry Sectors with Induced Impacts from Qualcomm, yearly ........... 15
Table 7: Total Economic Impacts of T & IT (Segments 1 and 2), yearly......................... 19
Table 8: Industry Sectors Included in T & IT, yearly ...................................................... 19
Table 9: Top 20 Industry Sectors Indirectly Impacted by T & IT, yearly ......................... 20
Table 10: Top 20 Industry Sectors with Induced Impacts from T & IT, yearly ................ 21
Table 11: Estimated Total Impact of T & IT on Government Revenues, 2010................ 22
Table 12: Total Economic Impacts of the Core Telecommunications Industry (Segment 1), yearly ....................................................................................................................... 23
Table 13: Total Economic Impacts of $10 million Venture Capital Investment toward Private Sector R&D, initial year ..................................................................................... 24
Table 14: Average Income, 2010................................................................................... 27
Table 15: Employment in Each Area, 2001-2010 .......................................................... 28
Table 16: Qualcomm, Telecommunications & Information Technology Employment Profile for San Diego County, 2010 ............................................................................... 30
Table 17: San Diego County Telecommunications & Information Technology Profile .... 35
Table 18: Overview of Survey Methodology ................................................................ A-3
Table 19: San Diego-Carlsbad-San Marcos, CA Metro Area Clusters ......................... C-3
Table 20: Austin-Round Rock, TX Metro Area Clusters ............................................... C-5
Table 21: Boston-Cambridge-Quincy, MA-NH Metro Area Clusters ............................. C-7
Table 22: Denver-Boulder, CO Consolidated Metro Area Clusters .............................. C-9
Table 23: San Jose-Sunnyvale-Santa Clara, CA Metro Area Clusters ....................... C-11

4
The Economic Impact of Qualcomm: Driving San Diego’s Technology Growth
San Diego Workforce Partnership & San Diego Regional Economic Development Corporation
LIST OF FIGURES
Figure 1: Qualcomm Employment Impact Relative to Industry Sectors.......................... 13
Figure 2: Top Industry Sectors Influenced by Qualcomm, by Total Number of Jobs (Direct, Indirect, and Induced) ....................................................................................... 16
Figure 3: Top Industry Sectors Influenced by Telecommunication & Information Technology, by Total Number of Jobs (Direct, Indirect, and Induced) ............................ 24
Figure 4: Telecommunications Employment .................................................................. 25
Figure 5: Information Technology Employment ............................................................. 26
Figure 6: San Diego County’s Employment from Qualcomm, Telecommunications & Information Technology Sectors .................................................................................... 34
Figure 7: Expected 12-Month Growth Extrapolated for Segments 1 & 2 ........................ 37
Figure 8: Difficulty Finding Qualified Workers in Telecommunications and Information Technology ................................................................................................................... 38
Figure 9: San Diego Telecommunications, ICT, and Related Convergence Employment .................................................................................................................................... C-2
Figure 10: Austin Telecommunications, ICT, and Related Convergence Employment . C-4
Figure 11: Boston Telecommunications, ICT, and Related Convergence Employment C-6
Figure 12: Denver-Boulder Telecommunications, ICT, and Related Convergence Employment ................................................................................................................ C-8
Figure 13: San Jose Telecommunications, ICT, and Related Convergence Employment .................................................................................................................................. C-10
ACKNOWLEDGEMENTS
11355 North Torrey Pines Road 401 B Street, Suite 800 La Jolla, CA 92037 San Diego, CA 92101 (858) 642-8498 (619) 699-1900 www.nusinstitute.org www.sandag.org
2725 Jefferson Street, Suite 13 Carlsbad, CA 92008 (760) 730-9325 www.bwresearch.com
INTRODUCTION
San Diego County’s telecommunications industry and the region’s leading technology employer, Qualcomm, play a central role in the development and advancement of the region’s technology economy and the overall productivity and output of the County. This

5
The Economic Impact of Qualcomm: Driving San Diego’s Technology Growth
San Diego Workforce Partnership & San Diego Regional Economic Development Corporation
study, commissioned by San Diego Workforce Partnership and San Diego Regional Economic Development Corporation had three key research objectives:
1. Examine the role that Qualcomm plays in San Diego’s economy in terms of employment and total economic impact on the County.
2. Quantify the economic impact telecommunications and related industries have on San Diego’s regional economy and compare and contrast that with other high-technology regions within the United States, including the regional economies associated with Austin, Texas; Boston, Massachusetts; Denver and Boulder, Colorado; as well as Silicon Valley in California.
3. Develop an assessment of the talent needs of the region’s telecommunications and information technology sector employers by identifying key career pathways, occupations, and skills that County employers are seeking from the County’s workforce.
These three research objectives provide a foundation for the research questions that drove the analyses for this study. To complete the analyses, the research team – BW Research Partnership, Inc., the National University System Institute for Policy Research, and SANDAG’s Service Bureau – developed and implemented several research methodologies, including:
A complete economic impact analysis that included an examination of historic, current, and expected employment and economic output in San Diego County by key telecommunications industries and related technology sectors.
A separate analysis of the economic impact of Qualcomm in San Diego County.
A comparative evaluation of employment and total economic output in telecommunications and related technology industries within San Diego County and other high technology regions within the United States.
An extensive survey (n=200) of telecommunications and related technology employers within San Diego County, stratified by size and industry, inquiring about issues related to economic and workforce development.
Executive interviews with leading employers and industry experts on San Diego’s telecommunications industries.
The methodologies were implemented concurrently and the combined results provide the foundation for the research findings that are presented in this report.

6
The Economic Impact of Qualcomm: Driving San Diego’s Technology Growth
San Diego Workforce Partnership & San Diego Regional Economic Development Corporation
PART 1 – THE ECONOMIC IMPACT OF QUALCOMM: DRIVING SAN
DIEGO’S TECHNOLOGY GROWTH
Qualcomm is San Diego County’s largest for-profit, private sector employer. Since its founding in 1985, it has been one of the principal drivers of San Diego’s high-technology economy, spurring numerous start-up companies and attracting other major players in the industry to San Diego. Qualcomm is the world’s leading mobile chipset provider and its CDMA technology powers 3G and 4G networks around the globe. Qualcomm employs more than 21,000 people worldwide in more than 170 locations.
EXECUTIVE SUMMARY Qualcomm is one of San Diego’s most critical and valuable private sector employers. Every year Qualcomm creates the economic impact of about one and half 2012 London Olympic Games.1 Qualcomm’s nearly 12,000 San Diego employees create a critical mass for the region’s Telecommunications and Information Technology (T&IT) sectors. Qualcomm expects to continue growing and adding employees in the region.
A world leader in 3G, 4G and next-generation wireless technologies, Qualcomm is San Diego County’s largest for-profit, private sector employer and largest telecommunications employer:
Employs 21,000 people worldwide, including 11,775 local workers.
Nearly one in three people in San Diego’s telecommunications sector works for Qualcomm.
Nearly one in five people in San Diego’s T&IT sectors works for Qualcomm.
Qualcomm’s presence in the regional economy adds $4.53 billion in direct and indirect economic activity annually, equal to about three percent of the county’s Gross Regional Product (GRP) in 2010. The combined effect is larger than six other major industry sectors in the region:
Supports 27,365 jobs paying an average annual wage of more than $70,000.
Every job created at Qualcomm generates about 2.3 jobs in the region.
Every dollar generated directly by Qualcomm generates almost $2 of economic activity in the region.
Qualcomm also provides significant philanthropic support throughout the San Diego community:
Qualcomm and the Qualcomm Foundation donated an estimated $85 million to San Diego County charities between 2000 and 2011.
Qualcomm employees gave an estimated $20 million more to San Diego charities in 2011.
Qualcomm employees gave an estimated 165,000 hours, with a conservatively estimated value of $4.1 million, to local charities in 2011.
1 Estimate of economic impact of 2012 London Olympic and Paralympic games is based on "Realizing a
Golden Opportunity: Visa Europe's London 2012 Olympic and Paralympic Games Expenditure and Economic Impact Report, National and Regional Impacts"

7
The Economic Impact of Qualcomm: Driving San Diego’s Technology Growth
San Diego Workforce Partnership & San Diego Regional Economic Development Corporation
Since its founding in 1985, Qualcomm has been a principal driver of San Diego’s T&IT sectors, spurring numerous start-up companies and attracting other major industry players to San Diego:
Telecommunications and the broader IT sectors directly account for almost 2,000 business establishments and more than 65,000 jobs in the county.
Average income among San Diego telecom jobs is $108,050. Compared to four other high-tech metro areas, only San Jose has a higher average at $130,500.
T&IT sectors generate approximately 179,020 jobs and $38.11 billion annually in direct and indirect economic output, contributing about 22 percent of San Diego’s GRP in 2010.
Qualcomm and the telecom industry currently employ or are responsible for the employment of one in every 12 jobs in the county.
The T&IT sectors combined currently employ or are responsible for the employment of one in every seven jobs in the county.
Every job created in telecom generates about three total jobs in the region.
Every dollar invested directly in the telecom industry generates an additional $1.70 of economic activity in the region.
Despite the disruptive impact of the Great Recession on industries and employers across the nation – in San Diego County alone, total employment declined approximately 10 percent from 2008 to 2011 – the region’s T&IT employers that survived this period experienced a slowing of growth rather than a decline in employment. And, while this should be a loose labor market, Qualcomm and other T&IT employers report difficulty finding talent with the skills they need:
San Diego County’s T&IT employers increased employment, on average by about two percent, from 2008 to 2011.
Like T&IT companies in Silicon Valley, Qualcomm and other employers in San Diego’s telecom and IT industries place a premium on finding and developing talent.
Almost three out of five (58 percent) T&IT employers indicated difficulty finding qualified applicants for non-entry level jobs.
More than two out of five (44 percent) T&IT employers indicated difficulty finding qualified applicants for entry- level jobs.
Good business and governmental policies enable companies like Qualcomm to grow, prosper, create new jobs, and contribute mightily to the San Diego region’s economy.
This region needs and will continue to need smart, talented, qualified workers. A high priority for Qualcomm and other T&IT employers in the region is to be able to find these workers quickly. Every year Qualcomm creates the economic impact of about one and half 2012 London Olympic Games
Policies must be in place to attract the talent required to continue innovating.
The foundation for workforce development strategies for telecom and IT jobs needs to rest on these skills: a commitment to higher learning, digital literacy, the ability to understand and communicate specifically about technology and its role in industry, and initiative and flexibility.
Patents have been key to Qualcomm’s success. Strong patent protection is vital to the continued growth of Qualcomm and other technology companies.

8
The Economic Impact of Qualcomm: Driving San Diego’s Technology Growth
San Diego Workforce Partnership & San Diego Regional Economic Development Corporation
Key Findings
As the largest telecommunications employer in San Diego County, Qualcomm’s presence in the region generates multiple layers of economic benefits. Qualcomm employs approximately 11,775 full-time, part-time, and temporary employees contributing $1.24 billion in total payroll and approximately $2.35 billion in direct output to San Diego County’s GRP per year. This $2.35 billion accounted for slightly more than one percent of San Diego’s GRP in 2010.
Qualcomm’s presence in the regional economy generates indirect economic benefits by procuring products and services from local firms (indirect) whose employees then spend their wages in the local economy (induced). These combined economic impacts (direct, indirect, and induced) impact the region by adding approximately 27,365 total jobs, $1.97 billion in payroll, and $4.53 billion in total economic output per year. In 2010, this $4.53 billion contributed to about three percent of San Diego’s GRP.
Qualcomm’s effect on jobs, wages, and spending also has additional economic benefits in other industry sectors. In San Diego, Qualcomm’s presence in the region has the biggest influence on industry sectors for management of companies, scientific research and development, and restaurants.
As a whole, the telecommunications industry has a strong economic influence in the San Diego region. With a nearly $21.93 billion impact on the regional economy, telecommunications companies provide about $7.16 billion in payroll and employ approximately 66,360 workers in San Diego. This $21.93 billion in direct impact contributed to approximately 13 percent of San Diego County’s GRP in 2010.
The combined economic impact for the Telecommunications and Information Technology industry’s direct, indirect, and induced jobs is expected to generate approximately 179,020 jobs, $12.73 billion in wages, and $38.11 billion of total economic output per year for the regional economy:
This $38.11 billion in combined economic output contributed to about 22 percent of the region’s gross product in 2010. The combined economic effect of telecommunications in San Diego County resulted in an estimated $1.8 billion dollars of taxes and other payments contributing to state and local government revenue.

9
The Economic Impact of Qualcomm: Driving San Diego’s Technology Growth
San Diego Workforce Partnership & San Diego Regional Economic Development Corporation
Table 1: Qualcomm, Telecommunications & Information Technology Economic Impact Profile for San Diego County
Economic Output - San Diego
County ($ in millions)2
Direct Output Generated
Share of Direct Output
Generated
Total Output
Generated
3
Share of Total
Output Generate
d
Qualcomm $2,351 1.3% $4,528 2.6%
Telecommunications
$11,409 6.5% $20,666 11.8%
Information Technology & Telecommunications
$21,926 12.5% $38,111 21.8%
San Diego County Output
4
$175,068 100.0% $175,068 100.0%
Overall, the top industry sectors influenced by Telecommunications and Information Technology include research and development (22,540 jobs), custom computer programming (11,000 jobs), telecommunications (10,890 jobs), food services and drinking places (otherwise known as restaurants, 9,650 jobs), and employment services (7,590 jobs).
Telecommunications and Information Technology’s effect on jobs, wages, and spending also has additional economic benefits in other industry sectors. Broken down by induced impacts, the top three industry sectors affected by indirect telecom spending include: employment services; services to buildings and dwellings; and real estate establishments. The top three industry sectors influenced by workers’ and vendors’ payroll include: food services and drinking places; offices of physicians, dentists, and other health practitioners; and real estate establishments.
CONCLUSIONS
Qualcomm is one of San Diego’s most critical and valuable private sector employers. Every year Qualcomm creates the economic impact of about one and half 2012 London Olympic Games. Its almost 12,000 San Diego employees create a critical mass for the region’s Telecommunications and Information Technology sectors. Looking forward, the company expects to continue to grow and add employees in the region.
2 Analysis was completed using 2010 data with dollar amounts inflation-adjusted to 2012
3 Total Output Generated includes Direct, Indirect, and Induced Output.
4 Bureau of Economic Analysis (BEA), Regional Economic Accounts, Gross Domestic Product (GDP) by
Metropolitan Area (millions of current dollars) (2010), updated September 29, 2011.

10
The Economic Impact of Qualcomm: Driving San Diego’s Technology Growth
San Diego Workforce Partnership & San Diego Regional Economic Development Corporation
DEFINING THE SEGMENTS
The following six-digit NAICS (North American Industry Classification System) codes were used to define the two segments -- telecommunications and related information technology industries. It should be noted that a broader definition of information technology or ICT (information and communications technologies) will often include most if not all of the industries that were used in the telecommunications segment, but for this study the two segments were defined separately.
Telecommunications firms include: telecommunications carriers; satellite telecommunications; design services; research and development in engineering and physical sciences; as well as those manufacturers that produce telecommunications and optical equipment.
Table 2: NAICS Definition for Telecommunications (Segment 1)
Segment 1: Telecommunications
NAICS Industry Description
334220 Broadcast & Wireless Communications Equip. Mfg.
334290 Other Communications Equipment Manufacturing
335921 Fiber Optic Cable Manufacturing
517110 Wired Telecommunications Carriers
517210 Wireless Telecommunications Carriers
517410 Satellite Telecommunications
517911 Telecommunications Resellers
517919 All Other Telecommunications
541512 Computer Systems Design Services
541712 Research & Development in Sciences (except Biotech)

11
The Economic Impact of Qualcomm: Driving San Diego’s Technology Growth
San Diego Workforce Partnership & San Diego Regional Economic Development Corporation
Information technology includes those employers that manufacture electronics and computer equipment; software designers; programming services; and data processing and hosting services.
Table 3: NAICS Definition for Information Technology (Segment 2)
Segment 2: Information Technology
NAICS Industry Description
334111 Electronic Computer Manufacturing
334112 Computer Storage Device Manufacturing
334413 Semiconductor and Related Devices
334119 Other Computer Peripheral Equipment
334417 Electronic Connector Manufacturing
334418 Printed Circuit Assemblies
334513 Industrial Process Variable Instruments
334514 Fluid Meters and Counting Devices
334515 Electricity and Signal Testing Instruments
334611 Software Reproducing
511210 Software Publishers
518210 Data Processing and Related Services
541511 Custom Computer Programming Services
541513 Computer Facilities Management Services
541519 Other Computer Related Services
It should be noted that the industry NAICS codes used to define Segment 1 (telecommunications) and Segment 2 (information technology) were not as broad as some of the definitions used for ICT (information and communications technologies) in other studies. Industry classifications such as digital printing (NAICS 323115), computer training (NAICS 611420), and computer and office machine repair and maintenance (NAICS 811212) which are often found in definitions for ICT in other studies were not included in either of the two segments as they were deemed to be less related to telecommunications and would have less workforce and economic development needs in common with the industries that were included.

12
The Economic Impact of Qualcomm: Driving San Diego’s Technology Growth
San Diego Workforce Partnership & San Diego Regional Economic Development Corporation
ECONOMIC IMPACT OF QUALCOMM ON SAN DIEGO COUNTY’S ECONOMY
This section of the research describes the economic impacts of Qualcomm in the San Diego region including the direct, indirect, and induced impacts of the company. The direct impacts reflect jobs, payroll, and expenditures that are directly related to Qualcomm. The indirect effects are the numerous business products, materials, and services required and supplied locally to support the activities of the company. The induced effects include local household expenditures of workers employed at Qualcomm and in supplier industries.
This study measures the total economic impact of approximately 11,775 full-time, part-time, and temporary Qualcomm employees who work in San Diego County. These direct jobs provide about $1.24 billion in payroll and approximately $2.35 billion in economic activity for the San Diego region per year. This estimated $2.35 billion in direct economic activity contributed to approximately one percent of the San Diego Gross Regional Product (GRP) in 2010. To put this into perspective, Qualcomm employs more workers than the agricultural industry in San Diego County, and contributes nearly twice as much to the region’s GRP.
As a result of Qualcomm’s presence in the region, the combined economic effects for direct, indirect, and induced jobs are expected to generate approximately 27,365 jobs, $1.97 billion in wages, and $4.53 billion in total economic output per year. This $4.53 billion in combined economic output contributed to about three percent of the GRP in 2010. The details are provided below in Table 4.
Table 4: Total Economic Impacts of QUALCOMM, yearly
Direct Indirect Induced TOTAL
Employment 11,775 5,880 9,710 27,365
Wages $1,241 $315 $427 $1,967
Output $2,351 $895 $1,282 $4,528
Employment for indirect and induced economic impacts was rounded to the nearest ten jobs.
Wages and Output were rounded to the nearest million dollars.
Analysis was completed in millions of 2010 dollars, inflation-adjusted to 2012.

13
The Economic Impact of Qualcomm: Driving San Diego’s Technology Growth
San Diego Workforce Partnership & San Diego Regional Economic Development Corporation
Overall, Qualcomm’s presence in the region supports 27,365 jobs paying an average annual wage of more than $70,000. This combined effect is larger than San Diego County’s Transportation, Warehousing, and Utilities industry. In fact, if Qualcomm’s economic impact, by itself, was counted as a single industry, it would be larger than six other major industry sectors in the region. Figure 1: QUALCOMM Employment Impact Relative to Industry Sectors
- 50,000 100,000 150,000 200,000
State & Local Government
Leisure & Hospitality
Retail Trade
Health Care & Social Assistance
Professional, Scientific & Technical Services
Manufacturing
Administrative & Support & Waste Services
Construction
Other Services
Federal Government
Finance & Insurance
Wholesale Trade
Qualcomm (total impact)
Educational Services
Transportation, Warehousing & Utilities
Real Estate & Rental & Leasing
Information
Management of Companies
Agriculture and Mining
Number of Jobs

14
The Economic Impact of Qualcomm: Driving San Diego’s Technology Growth
San Diego Workforce Partnership & San Diego Regional Economic Development Corporation
As noted above, Qualcomm employs almost 12,000 workers and contributes $2.35 billion directly to the San Diego regional economy. This economic activity results in positive economic benefits for other industry sectors. As a result of its day-to-day operations, Qualcomm generates approximately $895 million in additional indirect economic activity at other local companies and nearly $315 million in annual payroll at these companies.
This $895 million can be considered the result of the goods and services that Qualcomm purchases from local vendors. This local purchasing supports approximately 5,880 jobs in addition to the 11,775 workers employed directly at Qualcomm. These local vendors span a wide range of industries, including employment services, food services and drinking places (restaurants), and real estate establishments. The top 10 industry sectors influenced by indirect Qualcomm spending are provided below in Table 5.
Table 5: Top 10 Industry Sectors Indirectly Impacted by QUALCOMM, yearly
INDUSTRY SECTOR (IMPLAN CODES) Jobs Generated
(Estimate)
Employment services 450
Food services and drinking places 390
Real estate establishments 360
Legal services 350
Management, scientific, and technical consulting services 340
Services to buildings and dwellings 310
Advertising and related services 290
Accounting, tax preparation, bookkeeping, and payroll services 240
Securities, commodity contracts, investments, and related activities 220
Non-depository credit intermediation and related activities 210
Employment was rounded to the nearest ten jobs.

15
The Economic Impact of Qualcomm: Driving San Diego’s Technology Growth
San Diego Workforce Partnership & San Diego Regional Economic Development Corporation
In addition to these benefits, Qualcomm also has an impact on the region through the expenditures of its employees at supplier companies. The combined payroll of Qualcomm and its suppliers generates an additional $1.28 billion in economic activity in the region. This induced effect generates approximately 9,710 jobs and an additional $427 million in payroll, which can also be thought of as additional household income, for the region. The earnings of Qualcomm and supplier-company employees support nearly 10,000 additional jobs which pay an average annual wage of $43,975. These induced effects result in positive economic benefits for a wide range of industry sectors including restaurants, healthcare, retail, and other local goods and services. The top 10 industry sectors influenced by worker and supplier industry payroll are provided below in Table 6. Table 6: Top 10 Industry Sectors with Induced Impacts from QUALCOMM, yearly
INDUSTRY SECTOR (IMPLAN CODES) Jobs Generated
(Estimate)
Food services and drinking places 1,090
Offices of physicians, dentists, and other health practitioners 590
Real estate establishments 470
Securities, commodity contracts, investments, and related activities 430
Private household operations 350
Retail Stores - Food and beverage 340
Retail Stores - General merchandise 310
Private hospitals 300
Nursing and residential care facilities 290
Wholesale trade businesses 260
Employment was rounded to the nearest ten jobs.

16
The Economic Impact of Qualcomm: Driving San Diego’s Technology Growth
San Diego Workforce Partnership & San Diego Regional Economic Development Corporation
ECONOMIC IMPACTS OF ADDITIONAL QUALCOMM EMPLOYMENT IN SAN DIEGO COUNTY
For every job added at Qualcomm in a given year, there are additional economic benefits generated in the region. In San Diego County, adding 1,000 jobs at Qualcomm could directly benefit the region by adding approximately $102.78 million in wages and approximately $199.57 million in economic output. Adding jobs at Qualcomm could result in additional indirect economic benefits when contractors are hired and goods and services are purchased from local firms. For example, adding 1,000 direct jobs may result in generating approximately 500 indirect jobs, $26.72 million in indirect payroll, and $75.97 million of indirect economic output. Additionally, the employees hired by Qualcomm use their wages to purchase other goods and services, such as food at restaurants and doctor’s visits, which results in positive induced economic impacts for the region. As a result of adding 1,000 direct jobs at Qualcomm, induced economic impacts could generate approximately 820 additional jobs, $36.23 million dollars of payroll, and $108.79 million dollars of economic output. The total combined economic effect (direct, indirect, and induced) of hiring 1,000 employees at Qualcomm could generate approximately 2,320 total jobs, $166 million in payroll, and $384 in economic output. Conversely, the negative effect of losing 1,000 jobs at Qualcomm would be a loss of a similar amount. Every job created at Qualcomm generates about 2.3 total jobs in the region and every dollar generated directly by Qualcomm generates almost $2 of economic activity in the region. Overall, the top industry sectors influenced by Qualcomm include the management of companies (8.700 jobs), restaurants (1,400 jobs) and research and development (1,200 jobs), as shown on the following page in figure 2. Figure 2: Top Industry Sectors Influenced by QUALCOMM, by Total Number of Jobs (Direct, Indirect, and Induced)
17
The Economic Impact of Qualcomm: Driving San Diego’s Technology Growth
San Diego Workforce Partnership & San Diego Regional Economic Development Corporation
QUALCOMM’S PHILANTHROPIC DONATIONS
In addition to the economic impacts described in the previous section, Qualcomm provides a significant amount of philanthropic support throughout the San Diego community. Each year the company and the Qualcomm Foundation provide several million dollars in direct support to San Diego philanthropies. The company’s employees contribute millions of dollars individually to charities, some of which benefit from Qualcomm’s matching program. These employees also donate a significant amount of time to area non-profits through formal company programs.
Direct Company Donations
Between 2000 and 2011, Qualcomm and the Qualcomm Foundation have globally given $170 million to charity. This includes $30 million through the matching of employee donations. Annually, this would average to $15.45 million. If the geographic distribution of donations is similar to the company’s distribution of employment, it would suggest $85 million has flowed from the company to San Diego charitable organizations.
Employee Giving
In a 2011 report, Qualcomm stated that company employees had given $30 million through the firm’s matching program between 2000 and 2011.
This is likely only a small percentage of giving. According to figures from the American Community Survey, working age Americans donate an estimated 1.9 percent of income to charities. Estimated payroll was approximately $1.2 billion in 2011. Assuming Qualcomm employees give at rates similar to the rest of the nation this would mean that company employees donated an additional $20 million to San Diego charities in 2011.
Estimated Value of Donations of Time
One of the principal means by which Qualcomm supports volunteer activities is through its QCares program. The program creates opportunities for company employees, friends and families to participate in charitable events. A cornerstone of the program is the way in which it matches teams of Qualcomm employees to charitable organizations requesting volunteer efforts. The company estimates that in 2011 workers volunteered more than 6,000 hours worldwide and an estimated 3,000 hours locally through the program.
In addition, the approximately 12,000 Qualcomm employees in San Diego individually volunteer at thousands of San Diego charities. Using data from the U.S. Census Bureau’s Current Population Survey, we conservatively estimate that Qualcomm employees annually volunteer more than 165,000 hours with an estimated value in 2011 of $4.1 million.5
5 For an estimate of volunteerism among working age adults and annual hours contributed see September
2011 supplement to the US Census Bureau’s Current Population Survey and www.bls.gov/news.release/volun.nr0.htm (last accessed June 19, 2012). For an estimate of the value of this volunteered labor see “Independent Sector's Value of Volunteer Time”: www.independentsector.org/volunteer_time (last accessed June 19, 2012).

18
The Economic Impact of Qualcomm: Driving San Diego’s Technology Growth
San Diego Workforce Partnership & San Diego Regional Economic Development Corporation
PART 2 – ECONOMIC IMPACT OF TELECOMMUNICATIONS & INFORMATION TECHNOLOGY SECTORS ON SAN DIEGO COUNTY’S ECONOMY
This section of the research describes the economic impacts of the Telecommunications & Information Technology industries (T&IT) in the San Diego region. It explains the direct, indirect, and induced economic effects of T&IT as well as estimated fiscal impacts to the regional economy. The direct effects reflect jobs, payroll, and expenditures that are directly related to the T&IT Industry. The indirect effects are the numerous business products, materials, and services required and supplied locally to support the direct activities of T&IT. The induced effects include local household expenditures of workers employed in T&IT and in supplier industries. Fiscal impacts include estimates for local, state, and federal taxes as a result of T&IT’s presence in the region.
This study measures the total economic impact of the 66,360 employees who work in T&IT in San Diego County. Of the 66,360 jobs, 39,640 jobs are included in the core Telecommunications definition (segment 1) and 26,720 jobs are included in more broadly defined Information Technology definition (segment 2). Segment 1 generally consists of companies that participate in telecommunications research and development; specific telecommunications; computer systems design services; radio and television broadcasting; and wireless communication manufacturing. Segment 2 includes Information Technology and other related companies with overlap in core telecommunications such as custom computer programming services; software publishing; semiconductors and related device manufacturing; computer terminal manufacturing; fluid meter and counting device manufacturing; and data processing, hosting, and related services. The research includes a combined economic impact analysis based upon 66,360 employees (both segments 1 and 2) who work in the telecommunications industries in San Diego County as well as other industry sectors affected by telecommunications expenditures. It also includes a separate analysis of the 39,640 core telecommunications companies (segment 1) in the County.
19
The Economic Impact of Qualcomm: Driving San Diego’s Technology Growth
San Diego Workforce Partnership & San Diego Regional Economic Development Corporation
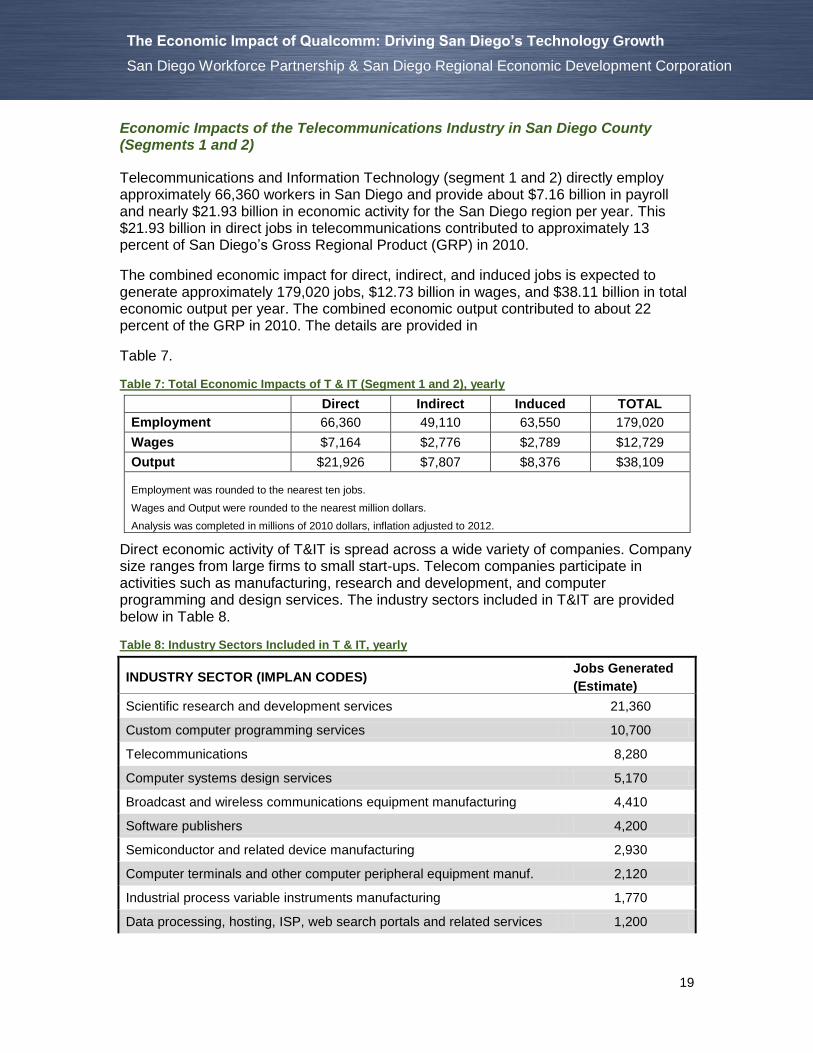
Economic Impacts of the Telecommunications Industry in San Diego County (Segments 1 and 2)
Telecommunications and Information Technology (segment 1 and 2) directly employ approximately 66,360 workers in San Diego and provide about $7.16 billion in payroll and nearly $21.93 billion in economic activity for the San Diego region per year. This $21.93 billion in direct jobs in telecommunications contributed to approximately 13 percent of San Diego’s Gross Regional Product (GRP) in 2010.
The combined economic impact for direct, indirect, and induced jobs is expected to generate approximately 179,020 jobs, $12.73 billion in wages, and $38.11 billion in total economic output per year. The combined economic output contributed to about 22 percent of the GRP in 2010. The details are provided in
Table 7.
Table 7: Total Economic Impacts of T & IT (Segment 1 and 2), yearly
Direct Indirect Induced TOTAL
Employment 66,360 49,110 63,550 179,020
Wages $7,164 $2,776 $2,789 $12,729
Output $21,926 $7,807 $8,376 $38,109
Employment was rounded to the nearest ten jobs.
Wages and Output were rounded to the nearest million dollars.
Analysis was completed in millions of 2010 dollars, inflation adjusted to 2012.
Direct economic activity of T&IT is spread across a wide variety of companies. Company size ranges from large firms to small start-ups. Telecom companies participate in activities such as manufacturing, research and development, and computer programming and design services. The industry sectors included in T&IT are provided below in Table 8.
Table 8: Industry Sectors Included in T & IT, yearly
INDUSTRY SECTOR (IMPLAN CODES) Jobs Generated
(Estimate)
Scientific research and development services 21,360
Custom computer programming services 10,700
Telecommunications 8,280
Computer systems design services 5,170
Broadcast and wireless communications equipment manufacturing 4,410
Software publishers 4,200
Semiconductor and related device manufacturing 2,930
Computer terminals and other computer peripheral equipment manuf. 2,120
Industrial process variable instruments manufacturing 1,770
Data processing, hosting, ISP, web search portals and related services 1,200

20
The Economic Impact of Qualcomm: Driving San Diego’s Technology Growth
San Diego Workforce Partnership & San Diego Regional Economic Development Corporation
Other computer related services, including facilities management 880
Electricity and signal testing instruments manufacturing 660
Printed circuit assembly (electronic assembly) manufacturing 660
Electronic connector manufacturing 630
Electronic computer manufacturing 560
Other communications equipment manufacturing 350
Computer storage device manufacturing 330
Totalizing fluid meters and counting devices manufacturing <100
Communication and energy wire and cable manufacturing <100
Software, audio, and video media for reproduction <100
Total T & IT Jobs (Employment in table rounded to the nearest ten jobs) 66,360
The $21.93 billion in economic activity of T&IT supports other local industries. As a result of its day-to-day operations, T&IT generates approximately $7.81 billion in additional indirect economic activity at other local companies and nearly $2.78 billion in annual payroll at these companies. This $7.81 billion can be considered the result of the goods and services that companies engaged in T&IT purchase from local vendors.
Overall, an estimated 49,110 jobs are generated by the economic activity of companies supporting T&IT. The top three industry sectors influenced by indirect T&IT spending include employment services; services to buildings and dwellings; and real estate establishments.
The top 20 industries indirectly impacted by T & IT businesses are shown in Table 9.
Table 9: Top 20 Industry Sectors Indirectly Impacted by T & IT, yearly
INDUSTRY SECTOR (IMPLAN CODES) Jobs Generated
(Estimate)
Employment services 6,470
Services to buildings and dwellings 3,790
Real estate establishments 2,880
Food services and drinking places 2,510
Wholesale trade businesses 2,390
Management of companies and enterprises 2,290
Telecommunications 2,150
Management, scientific, and technical consulting services 1,700
Maintenance and repair construction of nonresidential structures 1,630
Legal services 1,570
Architectural, engineering, and related services 1,560
Accounting, tax preparation, bookkeeping, and payroll services 1,230

21
The Economic Impact of Qualcomm: Driving San Diego’s Technology Growth
San Diego Workforce Partnership & San Diego Regional Economic Development Corporation
Scientific research and development services 1,080
Office administrative services 1,070
Advertising and related services 940
Securities, commodity contracts, investments, and related activities 840
All other miscellaneous professional, scientific, and technical services 810
Cable and other subscription programming 770
Nondepository credit intermediation and related activities 700
Business support services 690
Other Indirect Effects (25% of Total) 12,040
Total Indirect Effects (Employment in table rounded to the nearest ten jobs) 49,110
In addition to these benefits, T&IT also has an effect on the region through the expenditures of its employees and workers at supplier companies. The combined payroll of T&IT and its suppliers generates an additional $8.38 billion in economic activity in the region. This induced effect generates approximately 63,550 jobs and an additional $2.79 billion in payroll for the region.
The payroll of T&IT employees and workers at supplier companies generates multiplier effects in other industry sectors. The top three industry sectors influenced by workers’ payroll include food services and drinking places; offices of physicians, dentists, and other health practitioners; and real estate establishments. The top 20 industries influenced by the expenditures of employees engaged in T&IT are:
Table 10: Top 20 Industry Sectors with Induced Impacts from T & IT, yearly
INDUSTRY SECTOR (IMPLAN CODES) Jobs Generated
(Estimate)
Food services and drinking places 7,130
Offices of physicians, dentists, and other health practitioners 3,850
Real estate establishments 3,040
Securities, commodity contracts, investments, and related activities 2,780
Private household operations 2,290
Retail Stores - Food and beverage 2,220
Retail Stores - General merchandise 2,040
Private hospitals 1,940
Nursing and residential care facilities 1,890
Wholesale trade businesses 1,700
Nondepository credit intermediation and related activities 1,510
Retail Stores - Motor vehicle and parts 1,290
Retail Stores - Clothing and clothing accessories 1,270
Retail Nonstores - Direct and electronic sales 1,140
22
The Economic Impact of Qualcomm: Driving San Diego’s Technology Growth
San Diego Workforce Partnership & San Diego Regional Economic Development Corporation
Employment services 1,120
Individual and family services 1,120
Retail Stores - Miscellaneous 1,040
Private junior colleges, colleges, universities, and professional schools 1,020
Civic, social, professional, and similar organizations 960
Services to buildings and dwellings 950
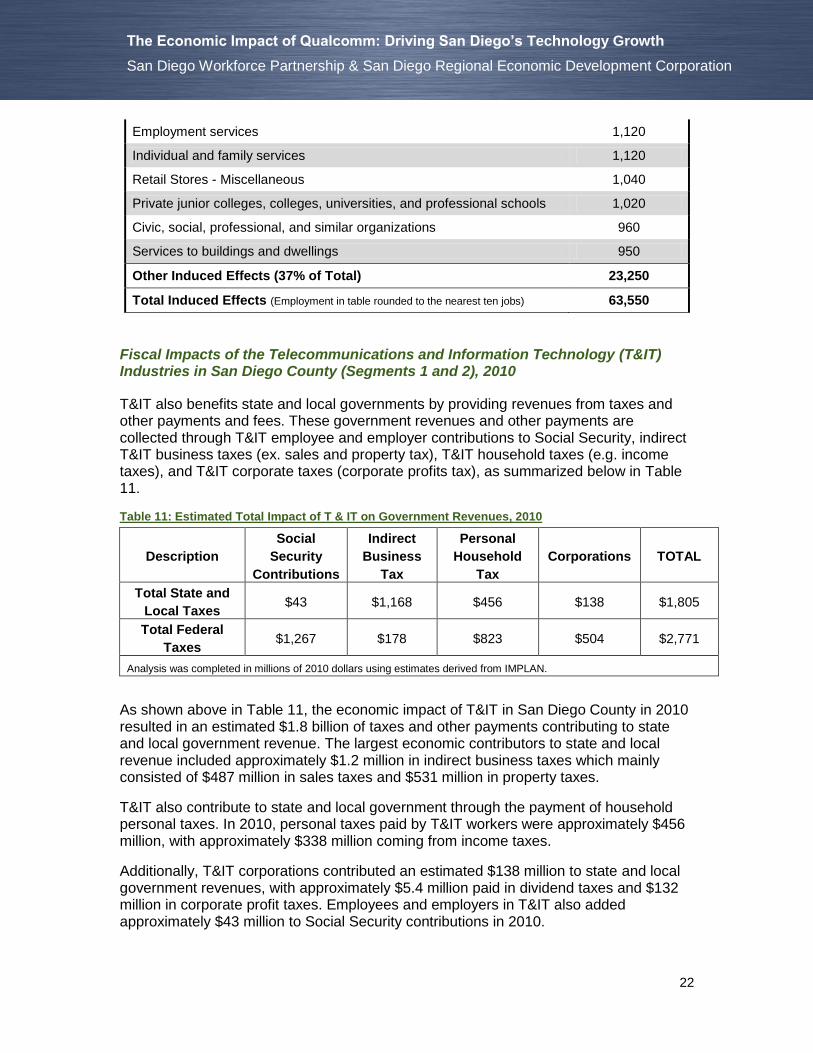
Other Induced Effects (37% of Total) 23,250
Total Induced Effects (Employment in table rounded to the nearest ten jobs) 63,550
Fiscal Impacts of the Telecommunications and Information Technology (T&IT) Industries in San Diego County (Segments 1 and 2), 2010
T&IT also benefits state and local governments by providing revenues from taxes and other payments and fees. These government revenues and other payments are collected through T&IT employee and employer contributions to Social Security, indirect T&IT business taxes (ex. sales and property tax), T&IT household taxes (e.g. income taxes), and T&IT corporate taxes (corporate profits tax), as summarized below in Table 11.
Table 11: Estimated Total Impact of T & IT on Government Revenues, 2010
Description
Social
Security
Contributions
Indirect
Business
Tax
Personal
Household
Tax
Corporations TOTAL
Total State and
Local Taxes $43 $1,168 $456 $138 $1,805
Total Federal
Taxes $1,267 $178 $823 $504 $2,771
Analysis was completed in millions of 2010 dollars using estimates derived from IMPLAN.
As shown above in Table 11, the economic impact of T&IT in San Diego County in 2010 resulted in an estimated $1.8 billion of taxes and other payments contributing to state and local government revenue. The largest economic contributors to state and local revenue included approximately $1.2 million in indirect business taxes which mainly consisted of $487 million in sales taxes and $531 million in property taxes.
T&IT also contribute to state and local government through the payment of household personal taxes. In 2010, personal taxes paid by T&IT workers were approximately $456 million, with approximately $338 million coming from income taxes.
Additionally, T&IT corporations contributed an estimated $138 million to state and local government revenues, with approximately $5.4 million paid in dividend taxes and $132 million in corporate profit taxes. Employees and employers in T&IT also added approximately $43 million to Social Security contributions in 2010.
23
The Economic Impact of Qualcomm: Driving San Diego’s Technology Growth
San Diego Workforce Partnership & San Diego Regional Economic Development Corporation
It is estimated that the federal government receives nearly $2.8 billion dollars in tax revenues from T&IT companies in San Diego County. Out of this estimated $2.8 billion dollars, approximately $823 million are from federal personal income taxes, $504 million from corporate profit taxes, and $178 million from indirect business excise taxes. Employees and employers in T&IT also added approximately $1.27 billion to Social Security contributions in 2010.
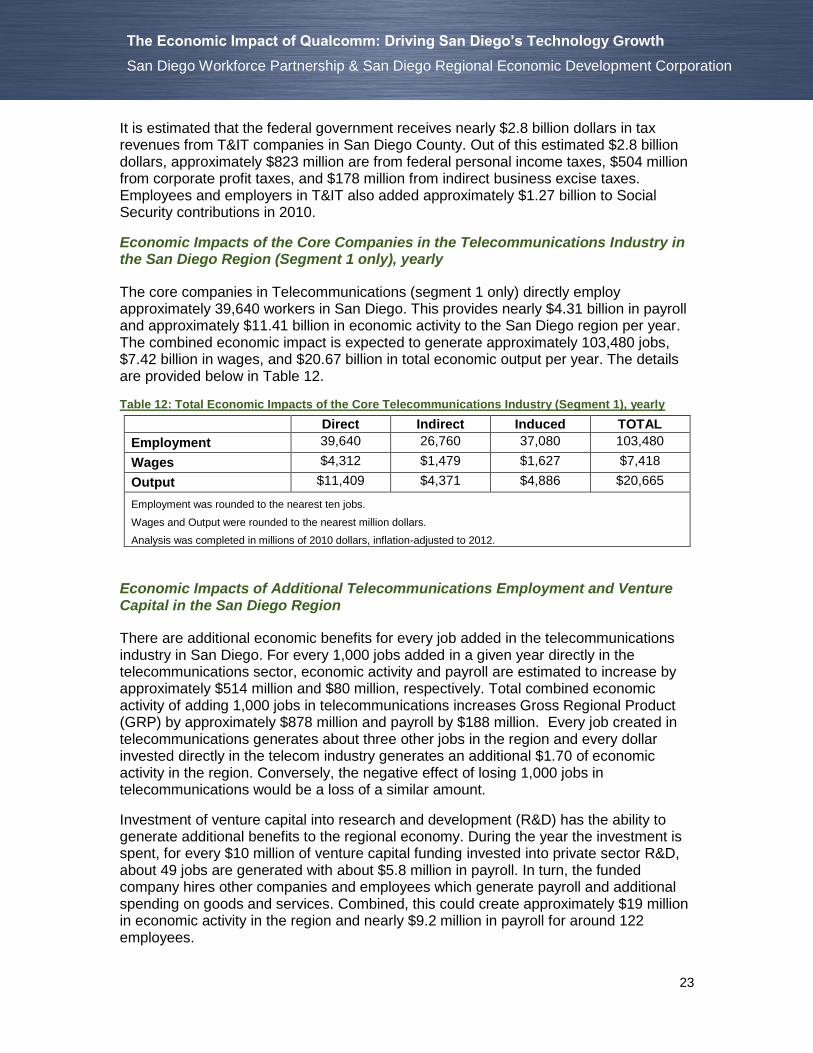
Economic Impacts of the Core Companies in the Telecommunications Industry in the San Diego Region (Segment 1 only), yearly
The core companies in Telecommunications (segment 1 only) directly employ approximately 39,640 workers in San Diego. This provides nearly $4.31 billion in payroll and approximately $11.41 billion in economic activity to the San Diego region per year. The combined economic impact is expected to generate approximately 103,480 jobs, $7.42 billion in wages, and $20.67 billion in total economic output per year. The details are provided below in Table 12.
Table 12: Total Economic Impacts of the Core Telecommunications Industry (Segment 1), yearly
Direct Indirect Induced TOTAL
Employment 39,640 26,760 37,080 103,480
Wages $4,312 $1,479 $1,627 $7,418
Output $11,409 $4,371 $4,886 $20,665
Employment was rounded to the nearest ten jobs.
Wages and Output were rounded to the nearest million dollars.
Analysis was completed in millions of 2010 dollars, inflation-adjusted to 2012.
Economic Impacts of Additional Telecommunications Employment and Venture Capital in the San Diego Region
There are additional economic benefits for every job added in the telecommunications industry in San Diego. For every 1,000 jobs added in a given year directly in the telecommunications sector, economic activity and payroll are estimated to increase by approximately $514 million and $80 million, respectively. Total combined economic activity of adding 1,000 jobs in telecommunications increases Gross Regional Product (GRP) by approximately $878 million and payroll by $188 million. Every job created in telecommunications generates about three other jobs in the region and every dollar invested directly in the telecom industry generates an additional $1.70 of economic activity in the region. Conversely, the negative effect of losing 1,000 jobs in telecommunications would be a loss of a similar amount.
Investment of venture capital into research and development (R&D) has the ability to generate additional benefits to the regional economy. During the year the investment is spent, for every $10 million of venture capital funding invested into private sector R&D, about 49 jobs are generated with about $5.8 million in payroll. In turn, the funded company hires other companies and employees which generate payroll and additional spending on goods and services. Combined, this could create approximately $19 million in economic activity in the region and nearly $9.2 million in payroll for around 122 employees.

24
The Economic Impact of Qualcomm: Driving San Diego’s Technology Growth
San Diego Workforce Partnership & San Diego Regional Economic Development Corporation
A summary of the effects of $10 million in venture capital investment in private sector R&D is shown below.
Table 13: Total Economic Impacts of $10 million Venture Capital investment toward Private Sector R&D, initial year
Direct Indirect Induced TOTAL
Employment 49 26 46 121
Wages $5,815 $1,328 $2,011 $9,154
Output $9,547 $3,447 $6,041 $19,035
Employment was rounded to the nearest job.
Wages and Output were rounded to the nearest thousand dollars.
Analysis was completed in millions of 2010 dollars, inflation-adjusted to millions of 2012 dollars.
The top industry sectors influenced by Telecommunications and Information Technology include research and development (22,540 jobs), custom computer programming (11,000 jobs), telecommunications (10,890 jobs), food services and drinking places (restaurants, 9,650 jobs), and employment services (7,590 jobs), as shown below in Figure 3.
Figure 3: Top Industry Sectors Influenced Telecommunication & Information Technology, by Total Number of Jobs (Direct, Indirect, and Induced)

25
The Economic Impact of Qualcomm: Driving San Diego’s Technology Growth
San Diego Workforce Partnership & San Diego Regional Economic Development Corporation
SAN DIEGO COUNTY COMPARED TO OTHER HIGH TECHNOLOGY COMMUNITIES
Employment
Employment in telecommunications held up much better in San Diego than the other compared metro areas, including the highest upswing of jobs before slipping somewhat in more recent years. As of 2010, San Diego barely retains an edge in the number of telecommunications jobs compared to San Jose. Boston and Denver have more telecom positions. Boston was the only area to record continual growth over the past four years, although not quite reaching their previous 2001 level. The consolidated Denver-Boulder metro is closest in total jobs to San Diego. Boston’s job base is almost twice as large, while San Jose and Austin are 20-30 percent smaller.
Figure 4: Telecommunications Employment
As a percentage of total employment, telecommunications represents 3.2 percent of all San Diego industry jobs. San Jose (4.6%) and Denver-Boulder (4.0%) have higher proportions for telecommunications, while in Boston (2.3 percent) and Austin (1.8%) the proportions are much smaller.
The decline in San Diego’s telecommunications employment is primarily due to a decrease of 9,975 jobs in Wireless Telecommunications Carriers (NAICS: 517210) during 2010, according to the U.S. Bureau of Labor Statistics (BLS) “Quarterly Census of Employment and Wages” data series (See NOTE). At the same time, Research and Development Physical, Engineering, Life Sciences (except Biotech) (NAICS: 541712) added 7,200 jobs. The BLS does not divulge information on individual companies or data that could indicate a company’s operations. Discussion with employment statisticians alludes to a change in coding assigned to an individual company that could account for
0
10,000
20,000
30,000
40,000
50,000
60,000
2001 2002 2003 2004 2005 2006 2007 2008 2009 2010
Segment 1: Telecommunications Employment
BOSTON
DENVER-BOULDER
SAN DIEGO
SAN JOSE
AUSTIN

26
The Economic Impact of Qualcomm: Driving San Diego’s Technology Growth
San Diego Workforce Partnership & San Diego Regional Economic Development Corporation
the large difference in industry data. None of the other metro areas showed such large differences of employment for these two NAICS sectors.
San Diego has the lowest number of information technology and related convergence jobs, as well as the lowest proportion (2.1%) to total job numbers. San Jose (12.9%) has the highest percentage by far and Austin is next (4.4%). Both of these metro areas have nearly three times as many ICT/convergence jobs as telecommunications positions. Note that the comparisons to other metro areas reference Information and Communications Technologies (ICT) which provides a broader definition than the analysis of the San Diego market that segmented telecommunications and information technology.
Figure 5: Information Technology Employment
0
20,000
40,000
60,000
80,000
100,000
120,000
140,000
160,000
2001 2002 2003 2004 2005 2006 2007 2008 2009 2010
Segment 2: ICT & Related Convergence EmploymentSAN JOSE
BOSTON
AUSTIN
DENVER-BOULDER
SAN DIEGO

27
The Economic Impact of Qualcomm: Driving San Diego’s Technology Growth
San Diego Workforce Partnership & San Diego Regional Economic Development Corporation
Income Average Comparisons
Average income among San Diego telecommunications jobs is $108,050. Only San Jose has a higher average at $130,500. The variance of average income for telecommunications to overall average is highest in San Diego, more than double the metro’s overall income average. The ratio of income average for ICT and related convergence jobs in San Diego is just 20 percent above the metro average. Only the Boston area’s ICT/related income average is lower.
Table 14: Average Income, 2010
Employees per Company
As shown in the table on the following page, San Diego has relatively fewer telecommunications companies, only exceeding Austin in number. The proportion to total firms is also the lowest. The average number of employees per telecommunications company in San Diego is also highest among the five metro areas. This is undoubtedly due to the presence of Qualcomm, and their dominant position in the local telecommunications industry. San Diego’s average of 32.3 employees per telecommunications firm was slightly higher than San Jose’s average at 28.6. The three other metro areas average between 13 and 17 employees per firm.
DENVER- SAN SAN
AVERAGE INCOME (2010) AUSTIN BOSTON BOULDER DIEGO JOSE
Telecommunications $72,423 $100,311 $84,303 $108,051 $130,506
ICT & Related Convergence 116,796 124,752 99,276 98,226 160,034
Total Metro, All Industries 47,183 60,549 51,822 49,240 79,609
Ratio to Total: Telecomm 1.53 1.66 1.63 2.19 1.64
ICT/Related 2.48 2.06 1.92 1.99 2.01

28
The Economic Impact of Qualcomm: Driving San Diego’s Technology Growth
San Diego Workforce Partnership & San Diego Regional Economic Development Corporation
Table 15: Employment in Each Area, 2001-2010
EMPLOYMENT
AUSTIN 2001 2002 2003 2004 2005 2006 2007 2008 2009 2010
Telecommunications 12,469 11,143 10,508 10,085 11,634 12,189 14,860 14,996 14,203 13,236
ICT & Related Convergence 45,968 40,759 38,142 38,282 38,527 38,770 39,959 40,281 35,078 33,287
% of Total Industries: Telecommunications 1.9% 1.7% 1.6% 1.5% 1.7% 1.7% 2.0% 2.0% 1.9% 1.7%
% of Total Industries: ICT & Related 6.9% 6.3% 5.9% 5.8% 5.6% 5.4% 5.3% 5.2% 4.7% 4.4%
Total, All Industries 665,927 651,095 645,292 656,166 688,910 718,198 754,675 768,189 748,101 758,381
BOSTON
Telecommunications 57,512 49,335 42,706 42,810 44,952 43,460 47,145 49,969 51,170 54,164
ICT & Related Convergence 88,741 80,702 75,071 72,407 74,566 75,219 78,757 80,333 77,605 76,273
% of Total Industries: Telecommunications 2.4% 2.1% 1.9% 1.9% 1.9% 1.9% 2.0% 2.1% 2.2% 2.3%
% of Total Industries: ICT & Related 3.7% 3.4% 3.3% 3.2% 3.2% 3.2% 3.3% 3.3% 3.3% 3.3%
Total, All Industries 2,427,471 2,359,505 2,302,141 2,296,096 2,317,721 2,348,752 2,384,292 2,399,034 2,317,704 2,329,776
DENVER-BOULDER
Telecommunications 53,074 44,166 40,512 39,679 38,227 37,910 45,804 47,179 45,974 45,503
ICT & Related Convergence 45,736 43,844 39,492 37,303 35,782 35,733 35,006 35,147 33,634 32,781
% of Total Industries: Telecommunications 4.5% 3.9% 3.7% 3.5% 3.3% 3.3% 3.8% 3.9% 4.1% 4.0%
% of Total Industries: ICT & Related 3.9% 3.9% 3.6% 3.3% 3.1% 3.1% 2.9% 2.9% 3.0% 2.9%
Total, All Industries 1,186,007 1,138,315 1,107,614 1,118,208 1,141,983 1,166,399 1,191,731 1,199,898 1,134,023 1,124,201
SAN DIEGO
Telecommunications 34,314 32,869 32,545 32,096 33,618 33,440 40,926 43,273 41,687 39,962
ICT & Related Convergence 26,994 26,743 25,884 25,979 25,796 26,421 26,873 26,591 26,922 26,526
% of Total Industries: Telecommunications 2.8% 2.7% 2.6% 2.5% 2.6% 2.5% 3.1% 3.3% 3.3% 3.2%
% of Total Industries: ICT & Related 2.2% 2.2% 2.1% 2.0% 2.0% 2.0% 2.0% 2.0% 2.2% 2.2%
Total, All Industries 1,218,982 1,237,169 1,253,034 1,270,351 1,291,900 1,313,949 1,321,214 1,317,274 1,247,861 1,230,694
SAN JOSE
Telecommunications 33,696 28,249 25,676 25,638 26,620 28,859 42,449 43,397 41,477 39,865
ICT & Related Convergence 157,427 133,796 120,579 117,659 115,599 116,284 114,592 115,583 110,209 111,416
% of Total Industries: Telecommunications 3.3% 3.1% 3.0% 3.0% 3.1% 3.2% 4.6% 4.7% 4.8% 4.7%
% of Total Industries: ICT & Related 15.5% 14.5% 13.9% 13.7% 13.3% 13.0% 12.5% 12.5% 12.8% 13.0%
Total, All Industries 1,018,126 920,665 868,182 861,158 871,239 894,073 913,386 922,144 863,465 856,605
29
The Economic Impact of Qualcomm: Driving San Diego’s Technology Growth
San Diego Workforce Partnership & San Diego Regional Economic Development Corporation
PART 3 – WORKFORCE ASSESSMENT: HUMAN CAPITAL THE
KEY VARIABLE IN SAN DIEGO’S TELECOMMUNICATIONS &
TECHNOLOGY EQUATION
EXECUTIVE SUMMARY
For Qualcomm and San Diego County’s other Telecommunications and Information Technology (T&IT) sector employers, this should be the best time to find and hire talent. And yet, with unemployment in the County just under 10 percent (9.2%6) almost three out of five (58%) T&IT employers indicated they were having at least some difficulty finding qualified applicants for non-entry level positions and just over a quarter (26%) were having great difficulty. Even for entry-level positions, almost half (44%) of San Diego County’s employers indicated at least some difficulty finding qualified applicants.
This section of the study examines San Diego County’s T&IT employers, both their workforce needs and their expectations for growth in the near future. The research also provides information on skills and occupational pathways that could provide a foundation for workforce development strategies to support Qualcomm and the County’s other T&IT employers.
Key Findings
2008 to 2011 slows not shrinks San Diego County’s remaining Telecommunications and Information Technology Employers: The great recession has had a disruptive impact on industries and employers across the country. In San Diego County alone, total employment has declined by approximately 10 percent from 2008 to 2011. However, for the San Diego County’s T&IT employers that have survived this period, the disruptive impact has resulted in a slowing of growth rather than an outright decline in employment. San Diego County’s T&IT employers increased employment, on average by about two percent, over the three-year span. While two percent growth over the last three years is not robust, it still paints a considerably healthier employment picture than what the regional economy experienced overall. Twice as many of the T&IT employers surveyed (37%) experienced growth in total employment over the last three years compared to the number of employers that saw a decline (18%) in total employment over the same time period.
6 July 2012: Source California Employment Development Department)

30
The Economic Impact of Qualcomm: Driving San Diego’s Technology Growth
San Diego Workforce Partnership & San Diego Regional Economic Development Corporation
Qualcomm and the telecommunications industry currently employ or are responsible for employment (indirect & induced) of one in every 12 jobs in San Diego County: If we combine the Telecommunications and Information Technology industries, they account for one in every seven jobs in the County. These jobs not only represent a sizable portion of the County’s employment - they also include, on average, higher-paying, higher-skilled jobs. Table 16: Qualcomm, Telecommunications & Information Technology Employment Profile for San Diego County, 2010
Employment - San Diego County
Direct Employment
Share of Direct
Employment
Total Employment Generated
7
Share of Total
Employment
Qualcomm 11,775 1.0% 27,365 2.2%
Telecommunications 39,640 3.2% 103,480 8.4%
Information Technology & Telecommunications
66,360 5.4% 179,020 14.5%
San Diego County Employment Data
8
1,230,694 100.0% 1,230,694 100.0%
Looking forward, employers in Telecommunications and Information Technology are considerably more optimistic about hiring in the near future. Approximately half (48%) of employers expect to have more employees at their current location 12 months from now and 42 percent expect to maintain their current level of employment. Over the next 12 months, San Diego County’s Telecommunications and Information Technology employers expect to add approximately 5,000 new jobs in the County. It is worth noting that medium and large sized firms in telecommunications and information technology are more confident about their hiring expectations than their smaller counterparts in the County. It would indicate that smaller firms are still facing higher levels of uncertainty about the economy and their growth opportunities.
Skills Assessment
San Diego’s T&IT employers provided valuable feedback on the skills that should be the foundation for workforce development strategies, particularly those looking to enter these industries or transition into telecommunications or information technology.
Commitment to higher learning: Most occupational pathways in T&IT require a four-year degree even for a significant portion of entry-level positions. Applicants may not necessarily need a four-year degree to get into the initial position for which they are applying, but they should probably expect to get a four-year degree or more if they want to advance to the next position in that career pathway.
7 Total Employment Generated includes Direct, Indirect, and Induced Employment.
8 California Employment Development Department (EDD), Quarterly Census of Employment and Wages
(QCEW), Annual Average Employment Data (2010), March 2011 Benchmark (released on June 15, 2012).

31
The Economic Impact of Qualcomm: Driving San Diego’s Technology Growth
San Diego Workforce Partnership & San Diego Regional Economic Development Corporation
Digital literacy a critical foundational skill: T&IT employers expect their employees, and any successful applicants, to not only be able to use technology effectively but also be able to teach themselves the latest advances and changes in mobile technologies, social media and other critical components of digital literacy.
Ability to understand and communicate specifically about technology and its role in industry: Different industries and emerging technologies in T&IT including mobile and wireless technologies; cloud computing; information security; and applications development all have specific issues. Successful employees and applicants should be able to communicate these key issues and understand the relationship they have to the larger technology community.
Initiative and Flexibility: Employers have always stressed the importance of technical expertise, whether that is programming in the latest web language, designing more robust databases, or engineering smaller and lighter electronic components. However, T&IT employers are increasingly looking for people who have the ability to learn new skills, who willingly take on new responsibilities, and who can connect their individual areas of expertise with emerging technologies. Occupational Pathways
San Diego County’s T&IT employers consistently identified occupations that they expected to have difficulty hiring. These occupations were grouped into broad occupational categories or pathways. Overall, employers were more likely to identify non-entry level occupations that they would have difficulty finding and hiring compared to entry-level occupations. More than 90 percent of the entry-level positions that San Diego’s employers expect to hire in the next 12 months -- and expect to have difficulty finding qualified talent to fill -- fall into three general occupational categories. They include: Entry-level Pathways-
Sales and customer service occupations (32% of occupations identified fell into this category). These positions are focused on working directly with customers, developing initial sales leads and working to solve initial problems that customers may encounter when using the company’s products.
Technical engineering, design and developer occupations (32% of occupations identified fell into this category). These higher-end entry level positions are typically focused on designing or developing new products, improving current products, or supporting and improving current business operations.
Technician or Assembler (28% of occupations identified fell into this category). These positions are largely focused on supporting the continued operations of individual systems; assisting internal customers with the use and repair of different systems, networks and/or applications; or assisting in the assembly and production of products.
More than half of San Diego’s T&IT employers indicated either some (32%) or great (26%) difficulty finding qualified non-entry level applicants who meet their organizations’
32
The Economic Impact of Qualcomm: Driving San Diego’s Technology Growth
San Diego Workforce Partnership & San Diego Regional Economic Development Corporation
hiring standards. Employers were more likely to identify specific non-entry level occupations that they expected to have difficulty hiring in the next 12 months compared to entry-level positions. More than 80 percent of the non-entry level occupations fell into one three general occupational categories listed below;
Non-entry level Pathways-
Technical engineering, design and developer occupations (54% of occupations identified fell into this category). These non-entry level positions represent more than half of the occupations that employers are most likely to identify having difficulty finding and hiring for in the next 12 months. These occupations are often focused on designing or developing new products or improving current ones or secondarily improving current business operations.
Sales and Marketing occupations (16% of occupations identified fell into this category). These positions are focused on working directly with customers; developing and following up on sales leads and providing initial cost estimates; and facilitating contract negotiations and developing and implementing sales plans and market expansion strategies.
Management and Supervisorial occupations (14% of occupations identified fell into this category). These positions are focused on leading a team of technical specialists to develop a product, manage a program, or complete a specific task for a given project or customer.
Conclusions
Qualcomm and San Diego County’s other T&IT employers, and many other high technology regions in the country, face challenges finding and developing talent even in a historically loose labor market. On average, job-seekers spend more than 40 weeks looking for a new job. Some of the strategies to support San Diego’s telecommunications and information technology employers and provide opportunities for job-seekers include:
1. Develop opportunities for entry-level work experience and exposure to career pathways in telecommunications and information technology. Work experience and knowledge of specific industries is a key requirement for the region’s technology employers and one which often disqualifies applicants for employment. These opportunities can be developed through internships, job-shadowing, teacher training, and establishing career pathways that are agreed upon between employers and educators.
2. Identify and support intermediate career opportunities that allow individuals to work and move towards completion of a four-year degree. Most long-term employment opportunities in T&IT require industry experience and know-how, but also a four-year college degree or more. Job-seekers who want to move into one of these vibrant, well-paying industries should plan on getting a four-year college degree, either before they move into the industry or while they are in an entry-level position gaining work experience and going to school. Programs should look to support and incentivize those job-seekers who are working and completing their requirements for a bachelor’s degree.

33
The Economic Impact of Qualcomm: Driving San Diego’s Technology Growth
San Diego Workforce Partnership & San Diego Regional Economic Development Corporation
3. Emphasize to students and job-seekers the importance of learning new technologies. Taking on new responsibilities and being able to communicate the technical aspects of what they are learning is very important to employers. Technology employers are no longer focused entirely on hiring individuals who have very specific technical skills, such as computer programming in a specific language, or the ability to trouble shoot specific networking problems. Instead, employers continue to require specific technical abilities associated with a given employment opportunity, but are also looking for those individuals who can learn new technologies, initiate new programs, take on new responsibilities, and who are able to communicate the nuances of their responsibilities and their industry to others. Training and education programs need to incorporate employer expectations into their curriculum.

34
The Economic Impact of Qualcomm: Driving San Diego’s Technology Growth
San Diego Workforce Partnership & San Diego Regional Economic Development Corporation
PROFILE OF SAN DIEGO’S TELECOMMUNICATIONS AND INFORMATION TECHNOLOGY EMPLOYERS
Telecommunications and the broader information technology sectors in San Diego County directly account for almost 2,000 business establishments and more than 65,000 jobs in the county. These businesses not only play a critical role in driving San Diego County’s economic output, they are also a key employer in the County – accounting for one in seven jobs, when direct, indirect and induced employment is considered.
This section of the report is meant to provide a comprehensive profile of both telecommunications and information technology employers in San Diego County, emphasizing their needs for a skilled and talented workforce.
Measuring San Diego County’s Telecommunications and IT Employers
In San Diego County, almost one in every three telecommunications workers is employed by Qualcomm. That statistic changes to almost one in five workers when both telecommunications and information technology are included. The figure below shows the proportion of both direct employment and total employment generated9 for all of San Diego County’s payroll employment, including both the private and public sectors.
Figure 6: San Diego County’s Employment from Qualcomm, Telecommunications & Information Technology Sectors
9 Total employment generated includes direct, indirect, and induced employment.
1.0%
3.2% 2.2%
5.4%
2.2%
8.4%
6.1%
14.5%
0%
5%
10%
15%
20%
Qualcomm Telecom (1) InformationTechnology (2)
T & IT (1 + 2)
Direct Employment Total Employment Generated

35
The Economic Impact of Qualcomm: Driving San Diego’s Technology Growth
San Diego Workforce Partnership & San Diego Regional Economic Development Corporation
The table below shows the number of business locations, employees, and average number of workers per location for T&IT employers in San Diego County. Telecommunications has approximately 50 percent more employees than information technology in San Diego County and on average has twice as many workers at each business location.
Table 17: San Diego County Telecommunications & Information Technology Profile10
San Diego County Telecommunications Business Locations (Segment 1) 823
San Diego County Telecommunications Employees 39,640
Average number of workers per SD Telecommunications Business Location 48
San Diego County Information Technology Business Locations (Segment 2) 1,154
San Diego County Information Technology Employees 26,720
Average number of workers per SD Information Technology Business Location 23
% San Diego Direct Employment in Telecommunications & Information Technology
5.4%
SURVEY OF EMPLOYERS
A survey of 200 San Diego County T&IT employers was completed as part of this study to better understand the workforce challenges facing these businesses. The survey was stratified by employer size and industry11 and provides not only a valuable overall employer perspective, but also allows us to examine the differences between small and large firms, firms connected to telecommunications and wireless devices, and those more focused on software development or providing networking services. The surveys were completed in June of 2012 and were complemented by additional executive interviews completed in July and August of 2012.
10
Source: SANDAG Current Employment Inventory (2010) and InfoUSA. 11
For a more detailed description of the survey methodology, please refer to Appendix C, page 2.

36
The Economic Impact of Qualcomm: Driving San Diego’s Technology Growth
San Diego Workforce Partnership & San Diego Regional Economic Development Corporation
Employment Experience and Expectations
As outlined in the key findings, the last three years have been challenging for businesses and employers across the country and in just about every industry. In San Diego County alone, total employment has declined by approximately 10 percent from 2008 to 201112 (the last three years of publically available annual data). However, the employers surveyed increased employment, on average by about two percent. While two percent growth over the last three years is not robust, it still paints a considerably healthier employment picture than what was experienced for the entire regional economy. Twice as many telecommunications and information technology employers (37%) who were surveyed experienced growth in total employment when compared to the number of employers that saw a decline (18%) in total employment.
Telecommunications and Information Technology employers in San Diego County were impacted quite differently in the last three years. Smaller firms (9 or less employees at a given location) were equally likely to have grown or declined in employment over the last three years, while medium (10 to 49 employees at a location) and larger (50+ employees at a location) firms were considerably more likely to have grown in total employment in the last three years. Newer firms, those that have been in business in San Diego County for five years or less, were also more likely to have grown in employment over the last three years when compared to those businesses that have been in the County for more than 10 years.
Looking forward, employers in T&IT are considerably more optimistic about hiring. Approximately half (48%) of employers expect to have more employees at their current location 12 months from now and 42 percent expect to maintain the same level of employment. Six percent were unsure and only two percent indicated they were likely to decline in employment over the next 12 months.
Expectation for employment growth is often tied to recent hiring experience. Those firms that experienced employment growth over the last three years were considerably more likely to expect to grow over the next 12 months.
Medium-sized firms (10 to 49 employees at a location) were the most optimistic about growth expectations, with 60 percent expecting to increase total employment in the next 12 months, while small firms (9 or less employees at a single location) were the least likely to increase employment, with only 40 percent indicating they expect to grow.
Newer firms (in business for 5 years or less) were considerably more optimistic about their growth expectations, with almost three out of four (74%) expecting to grow in the next 12 months, when compared to those telecommunications and information technology firms that have been located in the County six years or more.
12
California Employment Development Department (EDD), Quarterly Census of Employment and Wages (QCEW), Annual Average Employment Data (2008 & 2011), March 2011 Benchmark (released on June 15, 2012).
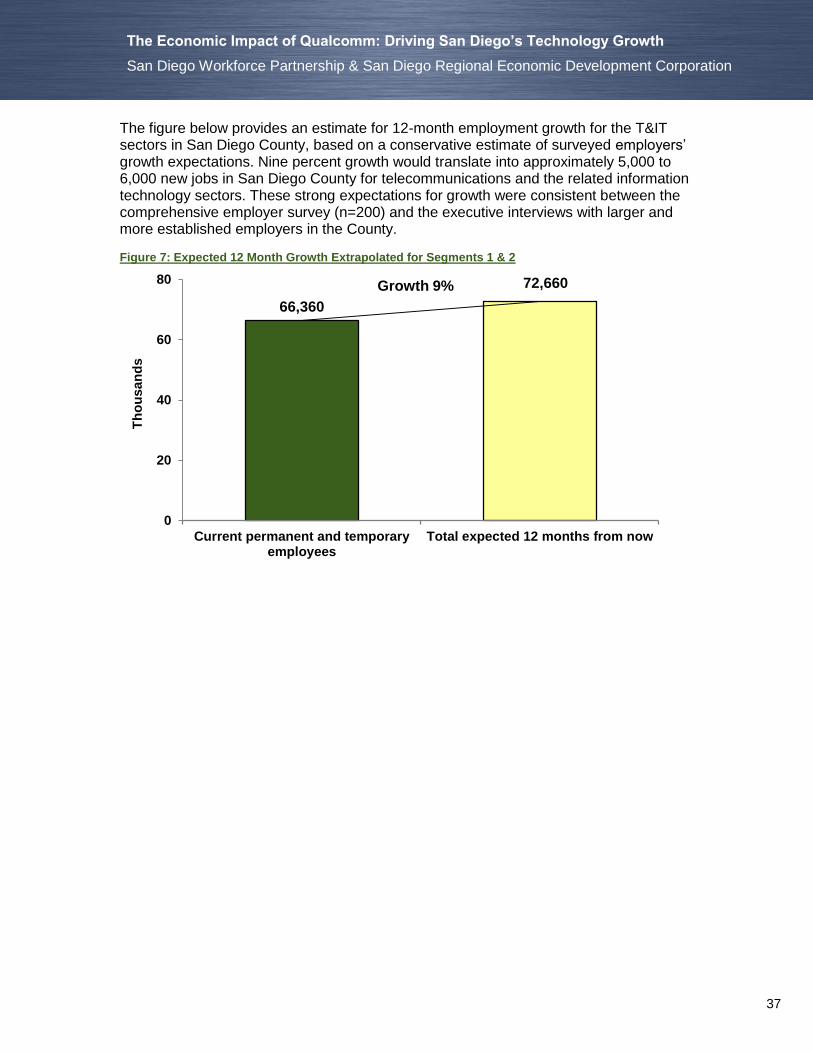
37
The Economic Impact of Qualcomm: Driving San Diego’s Technology Growth
San Diego Workforce Partnership & San Diego Regional Economic Development Corporation
The figure below provides an estimate for 12-month employment growth for the T&IT sectors in San Diego County, based on a conservative estimate of surveyed employers’ growth expectations. Nine percent growth would translate into approximately 5,000 to 6,000 new jobs in San Diego County for telecommunications and the related information technology sectors. These strong expectations for growth were consistent between the comprehensive employer survey (n=200) and the executive interviews with larger and more established employers in the County.
Figure 7: Expected 12 Month Growth Extrapolated for Segments 1 & 2
66,360
72,660
0
20
40
60
80
Current permanent and temporaryemployees
Total expected 12 months from now
Th
ou
san
ds
Growth 9%

38
The Economic Impact of Qualcomm: Driving San Diego’s Technology Growth
San Diego Workforce Partnership & San Diego Regional Economic Development Corporation
Difficulty Finding Qualified Workers
San Diego County, like many counties throughout the country, continues to experience high unemployment (between nine and ten percent), which typically translates into a loose labor market where employers are able to find qualified applicants quickly and relatively easily. However, San Diego’s telecommunications and information technology employers are showing signs of a relatively tight labor market. Almost three out of five T&IT employers indicated difficulty (some or great) finding qualified non-entry level applicants and more than two out of five indicated some difficulty finding qualified entry-level applicants.
The figure below shows how T&IT employers perceived the difficulty of finding qualified applicants among different general position types. These position types include temporary and contract workers13, entry-level positions and non-entry level positions. Overall, more than one quarter of employers indicated great difficulty finding qualified non-entry level applicants.
Figure 8: Difficulty Finding Qualified Workers in Telecommunications and Information Technology
13 Temporary & contract worker results were filtered to remove difficulty responses from those that never hire temporary employees as indicated in question 2 of the employer survey.
10%
32%
56%
3%
14%
30%
46%
10%
26%
32% 35%
7%
0%
20%
40%
60%
80%
Great difficulty Some difficulty Little to nodifficulty
DK/NA
Temporary & Contract
Entry-level
Non-Entry level

39
The Economic Impact of Qualcomm: Driving San Diego’s Technology Growth
San Diego Workforce Partnership & San Diego Regional Economic Development Corporation
Employers were more likely to indicate difficulty finding qualified non-entry level applicants in comparison to entry-level or temporary and contract employees. However, the overall high level of difficulty employers are experiencing finding qualified applicants in telecommunications and information technology – given the region’s overall loose labor market – is worth noting.
Small firms with a single location and new firms (less than 5 years in the County) were more likely to indicate difficulty finding qualified temporary or contract employees compared to other telecommunications and information technology employers.
Employers associated with telecommunications, wireless technologies and mobile devices were more likely to indicate difficulty finding qualified entry-level applicants than those employers associated with other aspects of the ICT spectrum, including software, hardware or the Internet.
Large firms, new firms and those firms that expect to grow in the next 12 months were the most likely to indicate difficulty finding qualified non-entry level applicants.
CAREER PATHWAYS, OCCUPATIONS AND SKILLS IN TELECOMMUNICATIONS AND INFORMATION TECHNOLOGY
A recent study14 on Silicon Valley’s ICT economy supported three fundamental realities for the region’s technology ecosystem.
1. For existing technology firms, talent is the key differentiator between those firms that succeed and those that do not.
2. Access to capital and availability of talent are key ingredients in the creation and growth of new technology companies.
3. Even in labor markets with double digit (or close to double digit) unemployment, finding qualified workers quickly (speed to hire) is a challenge to the continued success of the firms in the region’s ICT ecosystem.
While San Diego’s telecommunications and information technology industries are not a replica of Silicon Valley, the results of the employer survey reveal that both regions’ ICT employers face comparable difficulty finding qualified talent. The results of the survey also show that San Diego’s telecommunications and information technology employers also place a premium on finding and developing talent.
14
Silicon Valley in Transition: Economic & Workforce Implications in the Age of iPads, Android Apps, and the Social Web. Managed by the NOVA Workforce Board. July 2011.
40
The Economic Impact of Qualcomm: Driving San Diego’s Technology Growth
San Diego Workforce Partnership & San Diego Regional Economic Development Corporation
Detailed Occupational Gap Analysis: Entry- Level
An analysis of the positions that San Diego’s T&IT employers expect to have difficulty finding and hiring for over the next 12 months reveals some key findings regarding the positions and skills for which employers are experiencing the most immediate disconnect between the supply of talent and for the skills they seek.
In general, employers were more likely to identify non-entry level occupations that they would have difficulty finding and hiring over the next 12 months compared to entry-level occupations. More than 90 percent of the entry-level positions that San Diego’s employers expect to hire in the next 12 months and expect to have difficulty filling fall into three general occupational categories. They include:
Sales and customer service occupations (32% of occupations identified fell into this category). These positions are focused on working directly with customers, developing initial sales leads and working to solve initial problems that customers may encounter when using the company’s products.
Skills: These positions require strong communication skills, both spoken and written; a comprehensive understanding of the industry and the technology with which they are working; and the ability to persuade clients and potential clients to consider new products and/or technologies. Some positions will require the ability to speak both English and Spanish.
Occupation titles or key words include – inside sales agent, customer service representative and business development/sales support
Technical engineering, design and developer occupations (32% of occupations identified fell into this category). These higher-end entry level positions are typically focused on designing or developing new products, improving current products, or supporting and improving current business operations.
Skills: These positions typically require at least a four-year college degree in a technical field specific to the occupation such as engineering or computer science with some industry experience in a specific industry and/or technology.
Occupation titles or key words include – programmer/software engineer, systems engineer, RFIC design engineer and web developer
Technician or Assembler (28% of occupations identified fell into this category). These positions are largely focused on supporting the continued operations of individual systems; assisting internal customers with the use and repair of different, systems, networks and/or applications; or assisting in the assembly and productions of products.
Skills: At the entry-level, employers are often looking for specific technical training (bachelor’s or associate degree or certificate) combined with industry understanding and experience with a given or related technology.

41
The Economic Impact of Qualcomm: Driving San Diego’s Technology Growth
San Diego Workforce Partnership & San Diego Regional Economic Development Corporation
Occupation titles or key words include – technical support specialist, electrical and mechanical assembler and NOC technician
These three general occupational categories are not meant to represent the totality of entry-level hiring in San Diego’s T&IT industries but they do represent the overwhelming majority of occupational categories where employers expect to hire – and have difficulty hiring – in the next 12 months. Other entry-level occupational categories for this broad sector include administrative support occupations, professional support occupations, and facility and security positions.
Occupational Gap Analysis: Non-Entry Level
More than half of San Diego’s T&IT employers indicated either some (32%) or great (26%) difficulty finding qualified non-entry level applicants who meet their organizations’ hiring standards. Employers were more likely to identify specific non-entry level occupations that they expected to have difficulty hiring in the next 12 months compared to entry-level positions. Over 80 percent of the non-entry level occupations fell into one of three general occupational categories listed below;
Technical engineering, design and developer occupations (54% of occupations identified fell into this category). These non-entry level positions represent more than half of the occupations that employers are most likely to identify having difficulty finding and hiring for in the next 12 months. These occupations are often focused on designing or developing new products or improving current ones, or secondarily improving current business operations.
Skills: These positions almost always require a four-year college degree or more in a technical field specific to the occupation, such as engineering or computer science, with considerable industry experience in a specific industry and/or technology.
Occupation titles or key words include – senior software engineer, senior systems engineer, RF designer and applications developer
Sales and Marketing occupations (16% of occupations identified fell into this category). These positions are focused on working directly with customers; developing and following up on sales leads, providing initial cost estimates; and facilitating contract negotiations, and developing and implementing sales plans and market expansion strategies.
Skills: These positions require strong communication skills, both spoken and written, a comprehensive understanding of the industry, and the ability to forecast trends and industry growth expectations into sales and expansion plans. Employees at this level must understand with whom they are working, and have the ability to persuade clients and potential clients to consider new products and/or technologies.
Occupation titles or key words include – inside or outside sales representatives, sales engineer, marketing analyst or director and business development manager.

42
The Economic Impact of Qualcomm: Driving San Diego’s Technology Growth
San Diego Workforce Partnership & San Diego Regional Economic Development Corporation
Management and Supervisorial occupations (14% of occupations identified fell into this category). These positions are focused on leading a team of technical specialists to develop a product, manage a program or complete a specific task for a given project or customer.
Skills: These positions require comprehensive technical communication skills, both spoken and written; a methodical approach to organization; and the ability to work with people from diverse backgrounds. Managers and supervisors typically require both a fundamental technical understanding of their area of management as well as a comprehensive understanding of evaluation and assessment protocols to continually examine the success or failure of different components of a program, department or project. Education requirements are varied. Extensive industry experience can sometimes compensate for a less complete educational background.
Occupation titles or key words include – program manager, supply chain manager, senior project manager and quality assurance manager.

A-1
The Economic Impact of Qualcomm: Driving San Diego’s Technology Growth
San Diego Workforce Partnership & San Diego Regional Economic Development Corporation
APPENDIX A: METHODOLOGY
ECONOMIC IMPACT ANALYSIS
Our Telecommunications and Information Technology (T&IT) study was developed through several data collection methodologies;
a. Economic Impact Assessment (SANDAG Service Bureau) was based on the IMPLAN model and information provided by Qualcomm.
b. Comparative regional analysis (National University System Institute for Policy Research) was based on several sources and methodologies including the Connect Innovation Index, World Intellectual Property Organization database and Patent Café.
Extensive employer surveys (n=200) and executive interviews (BW Research) were completed with T&IT employers throughout the County, including Qualcomm. Economic Impact Analysis
The MIG, Inc. (Minnesota IMPLAN Group) economic impact analysis software, IMPLAN, was used to run the economic impact analysis model. IMPLAN was used to determine estimates of the direct, indirect, induced, and total economic impacts of Qualcomm and the T&IT industries on the San Diego region’s economy. Data inputs used for the Qualcomm analysis were collected from Qualcomm for calendar year 2012 while data used for the T&IT analysis was primarily collected from the SANDAG Current Employment Inventory (2010), which is based on data from the California Employment Development Department (EDD). The T&IT analysis was calculated for calendar year 2012 based on 2010 IMPLAN and employment data. The fiscal economic impacts for the T&IT analysis were also estimated using IMPLAN. IMPLAN software uses a variety of national and regional data to estimate regional economic benefits. Data used in the model was collected from sources such as the Bureau of Economic Analysis, which uses input-output accounting matrices to determine purchase and sales linkages between industries, and the Bureau of Labor Statistics, which uses employment and wage data. Industry sectors are also a major component of economic impact analysis and are generally compiled by their four- and five-digit NAICS codes. However, some sectors, such as construction, are based on Census data. These data files get loaded into this model and run on a variety of assumptions, as described in additional detail below. Each set of annual data files has a unique input-output structural matrix and a unique annual trade flow model based on a selected area to estimate economic benefits. These benefits could include the impact of an activity, policy, or industry sector, such as telecommunications, and how it affects the regional economy in areas such as the number of jobs, wages, economic output, and additional industries influenced. It also provides estimates of revenues on federal and state/local taxes in areas such as sales tax, property tax, social security, and income tax. Direct, indirect, and induced impacts are terms used to measure how an activity, policy, or industry sector may influence a regional economy. The direct impacts reflect the immediate economic benefits of an activity, policy, or industry sector resulting in a

A-2
The Economic Impact of Qualcomm: Driving San Diego’s Technology Growth
San Diego Workforce Partnership & San Diego Regional Economic Development Corporation
change in jobs, wages, and economic output. These direct economic impacts could have additional ripple effects, also known as economic benefits, in the economy. For example, as a result of an increase in demand for Qualcomm’s goods and services, Qualcomm would likely need to purchase additional goods and services from other local companies, such as contractors for legal services and renting space from real estate establishments, resulting in additional indirect economic benefits. Additionally, the employees hired by Qualcomm are paid a wage. Employees use wages to purchase other goods and services, such as food at restaurants and doctor’s visits, which result in positive induced economic impacts. Some of the benefit of this spending will be lost to the regional economy, as some contracts and spending will likely occur outside the county. IMPLAN and economic impact analysis typically provide a good general estimate of an activity, policy, or industry change on the regional economy. However, there are certain assumptions and limitations to the software and methodology. It should be noted that the figures generated are estimates, and the results of actual economic impacts may vary depending on a variety of factors. The Social Accounts Matrix (SAM) and fiscal impacts are based on BEA national trends (the fiscal impacts use Income and Product Accounts [NIPA] tables) and therefore provide regional estimates based on national data; regional purchase and sales patterns may differ from national trends. Comparing economic impacts across different studies and software, such as RIMS II, should not be undertaken since different studies use different data, model inputs, inflation adjustments, and other assumptions. In this study, it should also be noted that many companies work in more than one telecommunications sector, and some companies who perform telecommunications work may not be included in this study based on the restrictions imposed on current industry definitions (NAICS codes). Many of these companies are represented in other sectors, such as wireless health, biotech, medical devices, and other health-related fields. They are typically measured in separate industry clusters from telecommunications, but have recently shown some overlap. Assumptions were based on readily available data from public sources and data and information provided by Qualcomm and the organizations that commissioned the research.
COMPARATIVE REGIONAL ANALYSIS
The comparisons of San Diego’s T&IT employment with the four other metro areas (Austin, Boston, Denver-Boulder, and San Jose), were based on the U.S. Department of Labor’s Bureau of Labor Statistics (BLS) “Quarterly Census of Employment and Wages” (QCEW) and the current geographic boundaries for these Metropolitan Statistical Areas (MSAs). The QCEW data is a comprehensive tabulation of employment and wage information for workers covered by State unemployment insurance (UI). Employment covered by UI programs represents about 99.7% of all wage and salary civilian employment in the country.
Average employment by industry and total annual compensation were used for comparison among the metro areas. Wages represent total compensation paid during the calendar year, including pay for vacation and other paid leave, bonuses, stock options, tips, the cash value of meals and lodging, and in some cases, contributions to deferred compensation plans,such as 401(k) plans.

A-3
The Economic Impact of Qualcomm: Driving San Diego’s Technology Growth
San Diego Workforce Partnership & San Diego Regional Economic Development Corporation
The QCEW program serves as a near census of employment and wage information by 6-digit NAICS industry at national, state, and county levels. At metropolitan area levels, employment and wage data is published down to 6-digit NAICS industry levels if disclosure restrictions are met. In accordance with BLS policy, data provided to the BLS in confidence are not published and are used only for specified statistical purposes. BLS withholds publication of UI-covered employment and wage data at any industry level when necessary to protect the identity of cooperating employers.
In order to identify and compare NAICS sector data for T&IT sectors, a methodology was developed and utilized for estimating undisclosed sectors based on statewide employment and higher level ratios of aggregated sectors. Estimates were consistently applied when needed for each metro area observed.
PRIMARY RESEARCH – SURVEYS AND EXECUTIVE INTERVIEWS
Data compiled for this report were drawn from both primary and secondary data sources. The table below provides a brief overview of the methodology utilized for the survey research component of the project. After the survey research was completed, five executive interviews were conducted with representatives from leading employers in San Diego’s telecommunications community as well as academics and industry experts on San Diego’s telecommunications industry.
Table 18: Overview of Survey Methodology
Method
Telephone Survey of San Diego County Employers
Number of Survey Participants
200 Telecommunications (Segment 1) and Information Technology (Segment 2) Employers in San Diego County.
Survey Field Dates
Telephone Survey: June 1 – 20, 2012
Survey Universe 1,977 Telecommunications and Information Technology Firms in San Diego County
Survey Margin of Error
The margin of error for questions answered by all 200 respondents was +/-6.57% at the 95% level of confidence.
SURVEY DESIGN
Through an iterative process, the survey partners and sponsors developed a survey instrument that met the research objectives of the study. In developing the survey instrument, techniques were utilized to overcome known biases in survey research and minimize potential sources of measurement error within the survey.

A-4
The Economic Impact of Qualcomm: Driving San Diego’s Technology Growth
San Diego Workforce Partnership & San Diego Regional Economic Development Corporation
Sampling Method
A database of 1,977 San Diego County firms in the NAICS codes defining the study’s two technology segments was developed and filtered and served as the basis of sampling. The firms were stratified based on industry, technology segment and the size of the firm. Efforts were made to gather data from a representative sampling of firms.
Data Collection
Prior to beginning data collection, interviewer training was conducted and the survey instrument was pre-tested to ensure that all words and questions were easily understood by the respondents. Telephone interviews were generally conducted from 9:00 a.m. to 4:30 p.m. Monday through Friday. The data collection period was June 1 through June 20, 2012.
A Note about Margin of Error and Analysis of Sub-Groups
The overall margin of error for the survey, at the 95 percent level of confidence, is +/- 6.57 percent for questions answered by all 200 respondents. It is important to note that questions asked of smaller groups of respondents, as well as results presented separately for each segment, will have a margin of error greater than +/- 5.36 percent, with the exact margin of error dependent on the number of respondents in each sub-group.

B-1
The Economic Impact of Qualcomm: Driving San Diego’s Technology Growth
San Diego Workforce Partnership & San Diego Regional Economic Development Corporation
APPENDIX B: SAN DIEGO COUNTY TELECOM & ICT EMPLOYER
SURVEY TOPLINES (N=200)
Introduction:
Hello, my name is __________. May I please speak to a Human Resources Manager or person responsible for staffing at [organization]? Hello, my name is ________ and I’m calling on behalf of the San Diego Workforce Partnership and the San Diego Regional Economic Development Corporation who would value your participation in a brief survey about the region’s workforce. (If needed): The survey should take approximately ten minutes of your time. By answering this survey, you can help us prepare the present and future labor pool based on your needs. (If needed): The surveys are being conducted by BW Research, an independent research organization. (If needed): Your individual responses will not be published; only summary information will be used in reporting the survey results.
Screener A
Do you have an office with employees in San Diego County, California? If yes, how many?
100% Yes [CONTINUE]
0% No [TERMINATE]
0% Not sure [TERMINATE]
Total number of San Diego County locations Mean Median
828 4.14 1.00
Breakdown: 73% 1 location in San Diego County
28% 2 or more locations in San Diego County

B-2
The Economic Impact of Qualcomm: Driving San Diego’s Technology Growth
San Diego Workforce Partnership & San Diego Regional Economic Development Corporation
Screener B
For this survey, please only answer for your current San Diego business location. If your firm has more than one location, please do not include their information. What is the zip code of your current location? (If needed: This is the location where you are physically located).
San Diego County city derived by zip code provided by respondents:
59% San Diego
9% Carlsbad
5% Vista
4% San Marcos
3% Escondido
3% La Jolla
3% Poway
2% Chula Vista
2% El Cajon
2% Oceanside
2% Encinitas
2% Santee
2% Spring Valley
1% Del Mar
1% Ramona
1% Solana Beach
1% Bonita
1% Cardiff By The Sea
1% Fallbrook
1% La Mesa

B-1
The Economic Impact of Qualcomm: Driving San Diego’s Technology Growth
San Diego Workforce Partnership & San Diego Regional Economic Development Corporation
Section 1 – Organization Related Questions
Q1
For this survey, we will just be asking about the employees that work from or directly report to your current location. Including all full-time and part-time employees, how many permanent employees work at or from your location?
Total Number of Employees Mean Median
4,637 23.19 6.00
Breakdown:
39% Less than 5 employees
24% Between 5 and 9 employees
19% Between 10 and 24 employees
9% Between 25 and 49 employees
3% Between 50 and 99 employees
7% 100 or more employees
0% DK/NA

B-2
The Economic Impact of Qualcomm: Driving San Diego’s Technology Growth
San Diego Workforce Partnership & San Diego Regional Economic Development Corporation
Q2
If you currently have [TAKE Q1 #] full-time and part-time permanent and temporary employees at your location, how many more or less employees do you expect to have at your location 12 months from now?
48% More
5% Less
42% (DON'T READ) Same number of employees
6% (DON'T READ) DK/NA
Expected Employment in 12 months
(Calculated by only examining employers with both current and projected data)
Current 12 months N 187 187 Mean 19.47 21.98 Median 6.00 7.00 Total Employees 3,640 4,111
New Employees 471
% Growth 12.9%
Conservative Statistics -Expected Employment in 12 months
(With two firms removed; one firm adding 100 more employees and having 86% growth and and one firm adding 40 more employees and having 1,000% growth)
Current 12 months n 185 185 Mean 18.74 20.52 Median 6.00 7.00 Total Employees 3,466 3,797
New Employees 331
% Growth 9.5%
[If amount differs by 10% or more in either direction, ask: ]
Just to confirm, you currently have ____ employees and you expect to have _____ (more/less) employees, for a total of ____ employees 12 months from now.

B-3
The Economic Impact of Qualcomm: Driving San Diego’s Technology Growth
San Diego Workforce Partnership & San Diego Regional Economic Development Corporation
Q3
Next, I would like to ask about just those workers at your current location that are not permanent workers, they are either temporary or contract and working on a project by project basis or for a certain period of time. How often does your location hire non-permanent workers, either on a temporary or contract basis?
24% Regularly
22% Sometimes
28% Rarely
26% Never
2% (DON'T READ) DK/NA
Q4
What level of difficulty does your firm have finding and hiring qualified non-permanent workers [IF NEEDED: this includes temporary and contract workers]: great difficulty, some difficulty, or no difficulty?
10% Great difficulty
29% Some difficulty
48% No difficulty
13% (DON'T READ) DK/NA
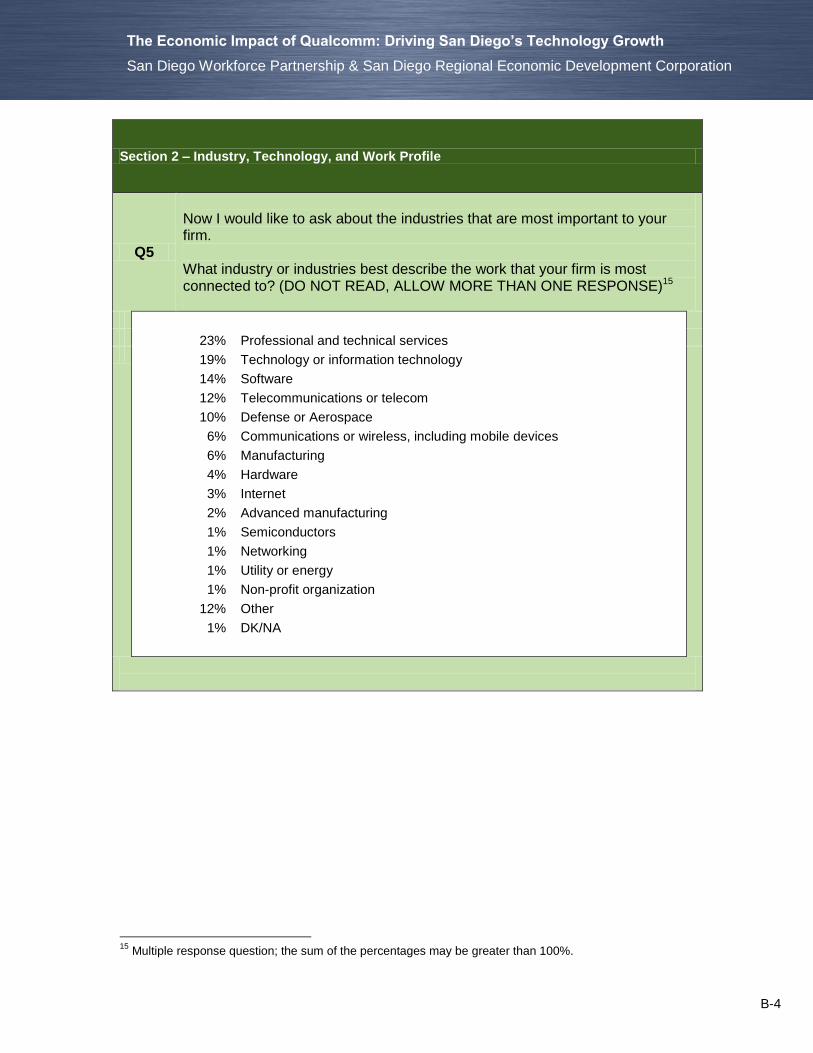
B-4
The Economic Impact of Qualcomm: Driving San Diego’s Technology Growth
San Diego Workforce Partnership & San Diego Regional Economic Development Corporation
Section 2 – Industry, Technology, and Work Profile
Q5
Now I would like to ask about the industries that are most important to your firm. What industry or industries best describe the work that your firm is most connected to? (DO NOT READ, ALLOW MORE THAN ONE RESPONSE)15
23% Professional and technical services
19% Technology or information technology
14% Software
12% Telecommunications or telecom
10% Defense or Aerospace
6% Communications or wireless, including mobile devices
6% Manufacturing
4% Hardware
3% Internet
2% Advanced manufacturing
1% Semiconductors
1% Networking
1% Utility or energy
1% Non-profit organization
12% Other
1% DK/NA
15
Multiple response question; the sum of the percentages may be greater than 100%.

B-5
The Economic Impact of Qualcomm: Driving San Diego’s Technology Growth
San Diego Workforce Partnership & San Diego Regional Economic Development Corporation
Q6
Next I would like to ask a few questions about the products and/or services that your firm provides. Which of the following technologies – software, hardware, Internet, networking, or telecommunications – are most important to your firm? (ACCEPT FIRST RESPONSE – REPEAT CATEGORIES AS NEEDED)
26% Software
18% Hardware
16% Internet
10% Telecommunications (This includes wireless)
6% Networking (This includes cloud computing)
20% (DON'T READ) A combination
2% (DON'T READ) Other
3% (DON'T READ) DK/NA
Q7
Next, I would like to ask about the role of technology at [FIRM NAME]. Please identify the emerging or new technologies that are most important to your firm? (DO NOT READ, ALLOW MORE THAN ONE RESPONSE)16
23% Mobile or wireless technologies 16% Cloud computing 12% Software systems
9% Hardware development 8% Internet 5% Applications development 3% Video and audio development 3% Social media 3% Voice over Internet Protocol (VoIP) 2% Chip design 1% Nano technology
16% Other 23% DK/NA
16
Multiple response question; the sum of the percentages may be greater than 100%.
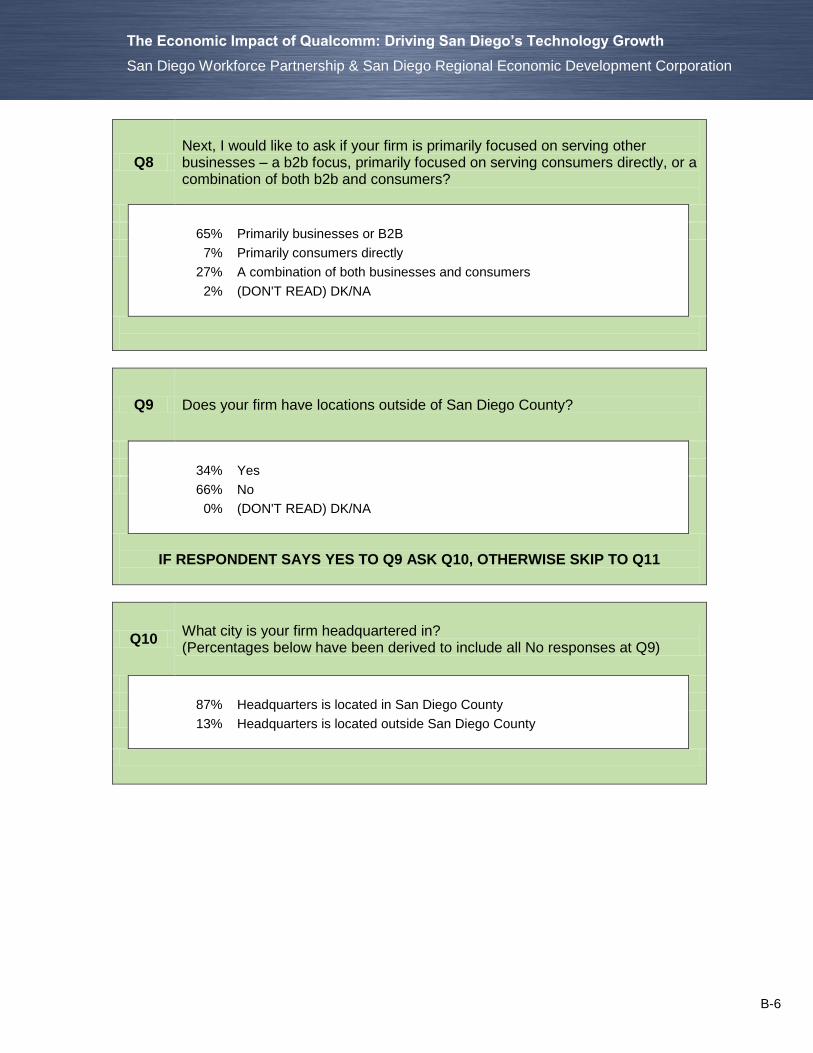
B-6
The Economic Impact of Qualcomm: Driving San Diego’s Technology Growth
San Diego Workforce Partnership & San Diego Regional Economic Development Corporation
Q8
Next, I would like to ask if your firm is primarily focused on serving other businesses – a b2b focus, primarily focused on serving consumers directly, or a combination of both b2b and consumers?
65% Primarily businesses or B2B
7% Primarily consumers directly
27% A combination of both businesses and consumers
2% (DON'T READ) DK/NA
Q9 Does your firm have locations outside of San Diego County?
34% Yes
66% No
0% (DON'T READ) DK/NA
IF RESPONDENT SAYS YES TO Q9 ASK Q10, OTHERWISE SKIP TO Q11
Q10 What city is your firm headquartered in? (Percentages below have been derived to include all No responses at Q9)
87% Headquarters is located in San Diego County
13% Headquarters is located outside San Diego County

B-7
The Economic Impact of Qualcomm: Driving San Diego’s Technology Growth
San Diego Workforce Partnership & San Diego Regional Economic Development Corporation
Section 3 – Location and Overall Rating for Economic Development
Q11
Next I want to ask about your location in San Diego County and discuss issues related to being in San Diego County. How long has your company been located in San Diego County?
6% Less than 3 years
14% Between 3 and 5 years
25% Between 6 and 10 years
55% More than 10 years
1% (DON'T READ) DK/NA
IF RESPONDENT SAYS THEIR COMPANY HAS BEEN LOCATED IN SAN DIEGO
COUNTY FOR 3 YEARS OR MORE, ASK Q12. OTHERWISE SKIP TO Q13
Q12
Over the last three years, has your company grown, declined or stayed about the same in terms of permanent employment at your location? [If it has grown or declined, ask] By about how many people? (n=186)
37% Grown
44% Stayed the same
18% Declined
1% (DON'T READ) DK/NA
Employment Growth from the Last 3 Years
(Calculated by only examining employers with both current and past data)
Current 3 Years Ago n 181 181 Mean 22.01 21.65 Median 6.00 6.00 Total Employees 3,984 3,919
Change in Employees 65
% Growth 1.7%
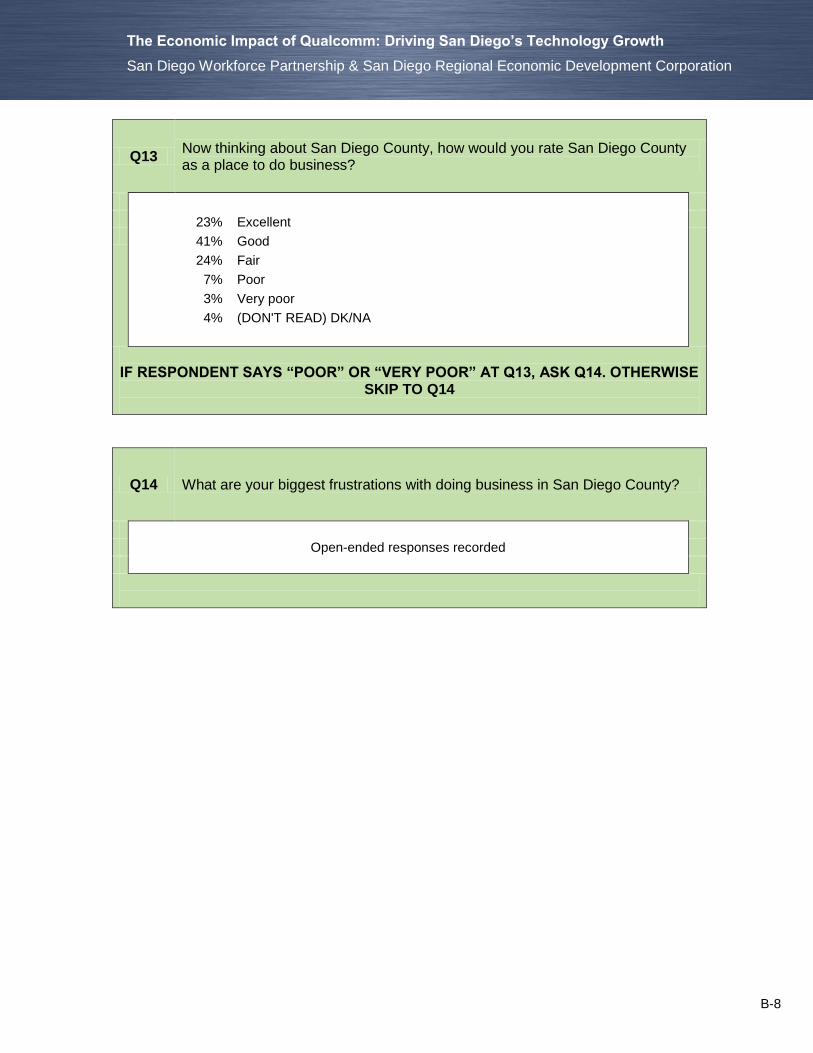
B-8
The Economic Impact of Qualcomm: Driving San Diego’s Technology Growth
San Diego Workforce Partnership & San Diego Regional Economic Development Corporation
Q13 Now thinking about San Diego County, how would you rate San Diego County as a place to do business?
23% Excellent
41% Good
24% Fair
7% Poor
3% Very poor
4% (DON'T READ) DK/NA
IF RESPONDENT SAYS “POOR” OR “VERY POOR” AT Q13, ASK Q14. OTHERWISE
SKIP TO Q14
Q14 What are your biggest frustrations with doing business in San Diego County?
Open-ended responses recorded

B-9
The Economic Impact of Qualcomm: Driving San Diego’s Technology Growth
San Diego Workforce Partnership & San Diego Regional Economic Development Corporation
Q15
Thinking big picture, what are the key drivers of growth for your firm in San Diego County? [DO NOT READ: ALLOW MULTIPLE RESPONSE]17
22% Better economy
15% Proximity to clients/customers
9% Increased customer interest/ awareness
6% Speed and ability to find talented people
6% Government funding/ contracts
6% Developments in technology
3% Strong quality of life
3% Sales
2% Proximity to vendors and your supply chain
2% Proximity to UCSD, SDSU, CSUSM, USD
1% Close to large markets in a small town feel
15% Other
22% DK/NA
17
Multiple response question; the sum of the percentages may be greater than 100%.
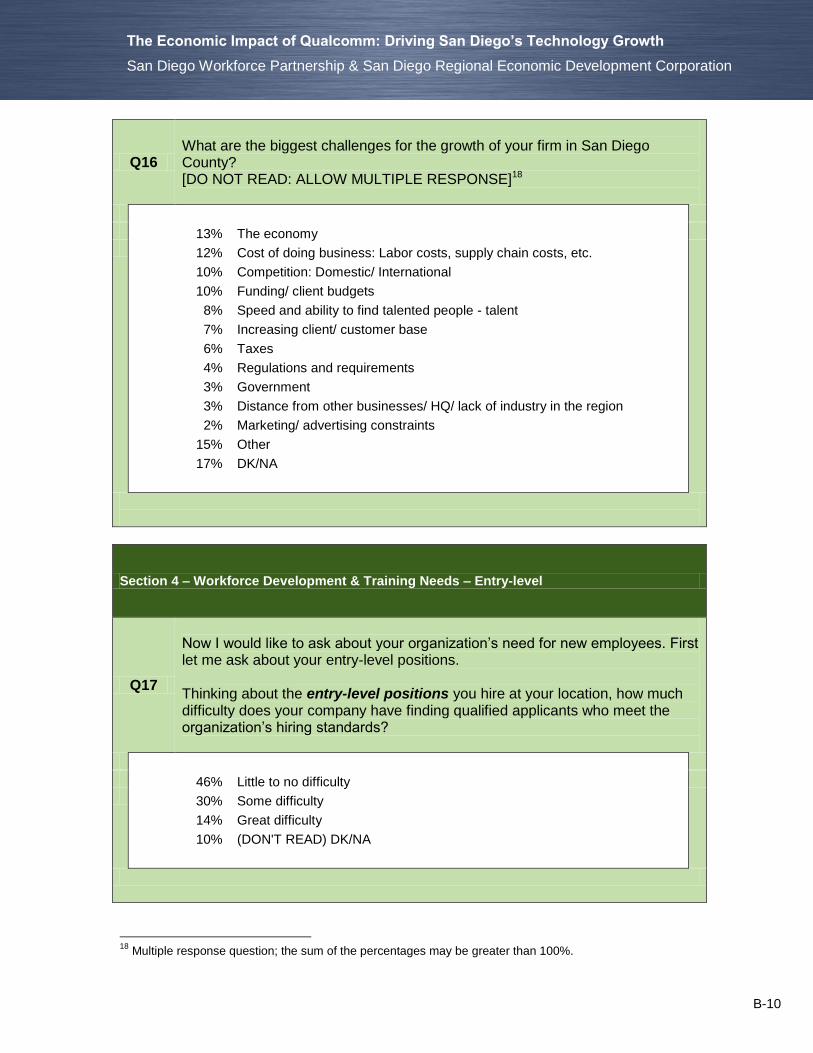
B-10
The Economic Impact of Qualcomm: Driving San Diego’s Technology Growth
San Diego Workforce Partnership & San Diego Regional Economic Development Corporation
Q16
What are the biggest challenges for the growth of your firm in San Diego County? [DO NOT READ: ALLOW MULTIPLE RESPONSE]18
13% The economy
12% Cost of doing business: Labor costs, supply chain costs, etc.
10% Competition: Domestic/ International
10% Funding/ client budgets
8% Speed and ability to find talented people - talent
7% Increasing client/ customer base
6% Taxes
4% Regulations and requirements
3% Government
3% Distance from other businesses/ HQ/ lack of industry in the region
2% Marketing/ advertising constraints
15% Other
17% DK/NA
Section 4 – Workforce Development & Training Needs – Entry-level
Q17
Now I would like to ask about your organization’s need for new employees. First let me ask about your entry-level positions. Thinking about the entry-level positions you hire at your location, how much difficulty does your company have finding qualified applicants who meet the organization’s hiring standards?
46% Little to no difficulty
30% Some difficulty
14% Great difficulty
10% (DON'T READ) DK/NA
18
Multiple response question; the sum of the percentages may be greater than 100%.

B-11
The Economic Impact of Qualcomm: Driving San Diego’s Technology Growth
San Diego Workforce Partnership & San Diego Regional Economic Development Corporation
Q18
Thinking about your hires over the last 12 months, what has been your preferred method for recruiting entry-level employees? [DO NOT READ: ALLOW MULTIPLE RESPONSE]19
23% Referrals from existing employees and clients
18% Other online/social media postings (craigslist, twitter,
14% Online job board (such as Monster or Indeed)
8% Professional recruiters
5% Online networking (such as LinkedIn)
5% Colleges and universities
4% Word of mouth
3% Temp agencies/ staffing agencies
2% Company website (internal and external)
2% Newspapers, classified ads (either online or hard copy)
10% Do not hire entry-level employees/ No new hires in the past 12 months
9% Other
16% DK/NA
Q19 Please tell me how important the following items are when considering candidates for entry-level positions at your firm: very important, somewhat important, or not at all important.
Randomize
Very important
Somewhat important
Not at all important
(DON’T READ)
It depends
(DON'T READ) DK/NA
A. An industry recognized
credential 20% 41% 31% 3% 5%
B. At least one year of
industry related work experience
55% 29% 10% 1% 6%
C. The ability to write
effectively for different audiences
47% 29% 17% 2% 5%
D. A four year college degree
or higher 34% 31% 26% 4% 5%
E.
Technical training and expertise specific to the position they are applying for
62% 26% 6% 2% 4%
19
Multiple response question; the sum of the percentages may be greater than 100%.
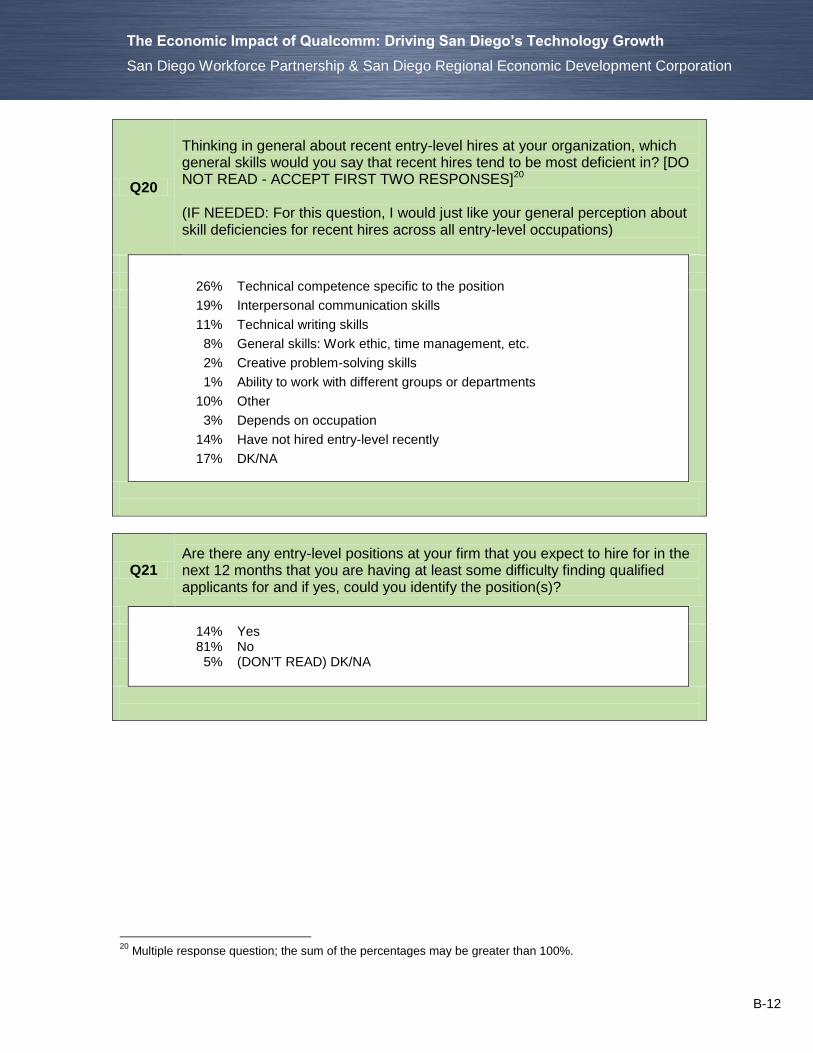
B-12
The Economic Impact of Qualcomm: Driving San Diego’s Technology Growth
San Diego Workforce Partnership & San Diego Regional Economic Development Corporation
Q20
Thinking in general about recent entry-level hires at your organization, which general skills would you say that recent hires tend to be most deficient in? [DO NOT READ - ACCEPT FIRST TWO RESPONSES]20 (IF NEEDED: For this question, I would just like your general perception about skill deficiencies for recent hires across all entry-level occupations)
26% Technical competence specific to the position
19% Interpersonal communication skills
11% Technical writing skills
8% General skills: Work ethic, time management, etc.
2% Creative problem-solving skills
1% Ability to work with different groups or departments
10% Other
3% Depends on occupation
14% Have not hired entry-level recently
17% DK/NA
Q21 Are there any entry-level positions at your firm that you expect to hire for in the next 12 months that you are having at least some difficulty finding qualified applicants for and if yes, could you identify the position(s)?
14% Yes 81% No
5% (DON'T READ) DK/NA
20
Multiple response question; the sum of the percentages may be greater than 100%.

B-13
The Economic Impact of Qualcomm: Driving San Diego’s Technology Growth
San Diego Workforce Partnership & San Diego Regional Economic Development Corporation
Q22
Thinking beyond occupational titles, what are the skills and characteristics you look for when hiring entry-level employees? [WAIT FOR INITIAL RESPONSE AND IF NO ANSWER READ]21
27% Ability to communicate effectively
26% Industry experience or knowledge
24% Work ethic/ character/ reliability
22% Specific skills
15% Ability to learn and develop new skills
14% Ability to work with others and as part of a team
8% A specific type of degree
2% Ability to work independently
12% Other
13% DK/NA
Section 5 – Workforce Development & Training Needs – Non-Entry level
Q23
Now I would like to switch gears and ask about non entry-level positions at your firm Thinking about the non-entry level positions you hire at your current location, how much difficulty does your company have finding qualified applicants who meet the organization’s hiring standards?
35% Little to no difficulty
32% Some difficulty
26% Great difficulty
7% (DON'T READ) DK/NA
21
Multiple response question; the sum of the percentages may be greater than 100%.
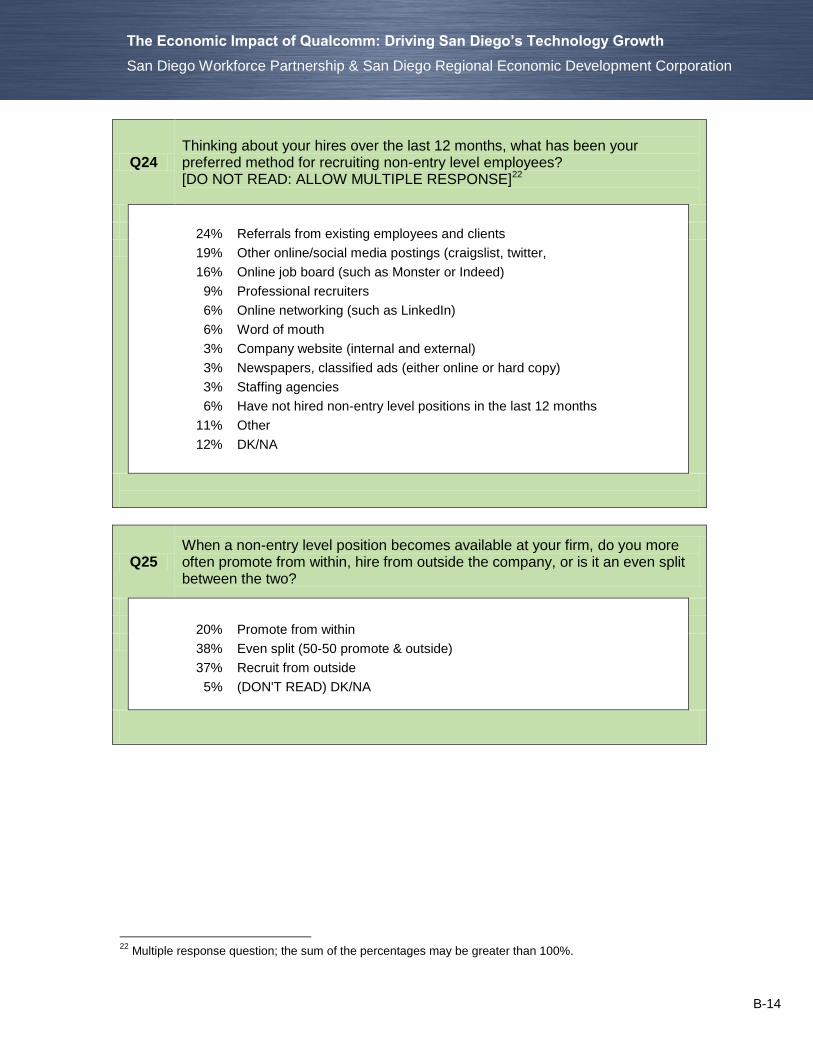
B-14
The Economic Impact of Qualcomm: Driving San Diego’s Technology Growth
San Diego Workforce Partnership & San Diego Regional Economic Development Corporation
Q24
Thinking about your hires over the last 12 months, what has been your preferred method for recruiting non-entry level employees? [DO NOT READ: ALLOW MULTIPLE RESPONSE]22
24% Referrals from existing employees and clients
19% Other online/social media postings (craigslist, twitter,
16% Online job board (such as Monster or Indeed)
9% Professional recruiters
6% Online networking (such as LinkedIn)
6% Word of mouth
3% Company website (internal and external)
3% Newspapers, classified ads (either online or hard copy)
3% Staffing agencies
6% Have not hired non-entry level positions in the last 12 months
11% Other
12% DK/NA
Q25 When a non-entry level position becomes available at your firm, do you more often promote from within, hire from outside the company, or is it an even split between the two?
20% Promote from within
38% Even split (50-50 promote & outside)
37% Recruit from outside
5% (DON'T READ) DK/NA
22
Multiple response question; the sum of the percentages may be greater than 100%.

B-15
The Economic Impact of Qualcomm: Driving San Diego’s Technology Growth
San Diego Workforce Partnership & San Diego Regional Economic Development Corporation
Q26 How often does your firm recruit non-entry level individuals from outside San Diego County?
3% Always (100% to 75% of the time)
9% Frequently (50% to 74% of the time)
20% Sometimes (49% to 25% of the time)
27% Rarely (1% to 24% of the time)
40% Never (0% of the time)
2% (DON'T READ) DK/NA
Q27 Are there any non-entry level positions at your firm that you expect to hire for in the next 12 months that you are having at least some difficulty finding qualified applicants and if yes, could you identify the position(s)?
21% Yes
76% No
3% (DON'T READ) DK/NA
Q28
Next, I would like to ask about the different technical credentials and their influence in the hiring process for both entry-level and non-entry level positions Here’s the (first/next) one _________ (READ ITEM): Did this credential positively influence your hiring decision of any employees in the last 12 months?
Randomize
Yes Somewhat No
(DON'T READ) DK/NA
A. A+ 12% 5% 68% 15%
B. Network+ 16% 8% 63% 12%
C. Security+ 11% 7% 69% 13%
D. Microsoft IT professional certifications 22% 12% 58% 8%
E. Java 20% 9% 65% 7%

B-16
The Economic Impact of Qualcomm: Driving San Diego’s Technology Growth
San Diego Workforce Partnership & San Diego Regional Economic Development Corporation
Q29 Are there any other credentials that we have not asked about that are valuable when considering applicants and if yes, what are they?
41% Yes
55% No
4% (DON'T READ) DK/NA
Section 5 – Intellectual Property
Q30
Next, I would like to ask a few questions about your intellectual property or what is sometimes simply referred to as IP. What kind of importance does your firm place on the protection of its intellectual property, through the use of patents and trademarks?
37% Highest importance
20% Important
15% Somewhat important
25% Not at all important
3% (DON'T READ) DK/NA
Q31 Have you heard, read, or seen anything about the proposal to open a satellite US Patent and Trademark Office in San Diego?
4% Yes
95% No
1% (DON’T READ) Not sure

B-17
The Economic Impact of Qualcomm: Driving San Diego’s Technology Growth
San Diego Workforce Partnership & San Diego Regional Economic Development Corporation
Q32 Would the opening of a proposed satellite US Patent and Trademark Office in San Diego be valuable to your company? [IF YES] Is that very valuable or somewhat valuable?
10% Very valuable
25% Somewhat valuable
54% No (not valuable)
11% (DON'T READ) DK/NA
Section 6 – Corporate Philanthropy
Q33
Before we finish, I would like to ask a few questions about your firm’s charitable activities. Does your firm make corporate charitable or philanthropic donations to non-profit or public organizations in San Diego County?
57% Yes
36% No
7% (DON’T READ) Not sure

B-18
The Economic Impact of Qualcomm: Driving San Diego’s Technology Growth
San Diego Workforce Partnership & San Diego Regional Economic Development Corporation
Q34 In 2011, what would you estimate the total value of those donations were to non-profit or public organizations in San Diego County?
Mean Median
$4,668 $2,000
Breakdown:
87% Under $100,000
2% Between $100,000 and $500,000
0% Between $1 million and $5 million
0% More than $5 million
1% (DON'T READ) DK/NA
Q35 Does your firm have a formal system through human resources to match employees interested in volunteering time with community groups seeking volunteers?
7% Yes
89% No
4% (DON'T READ) DK/NA
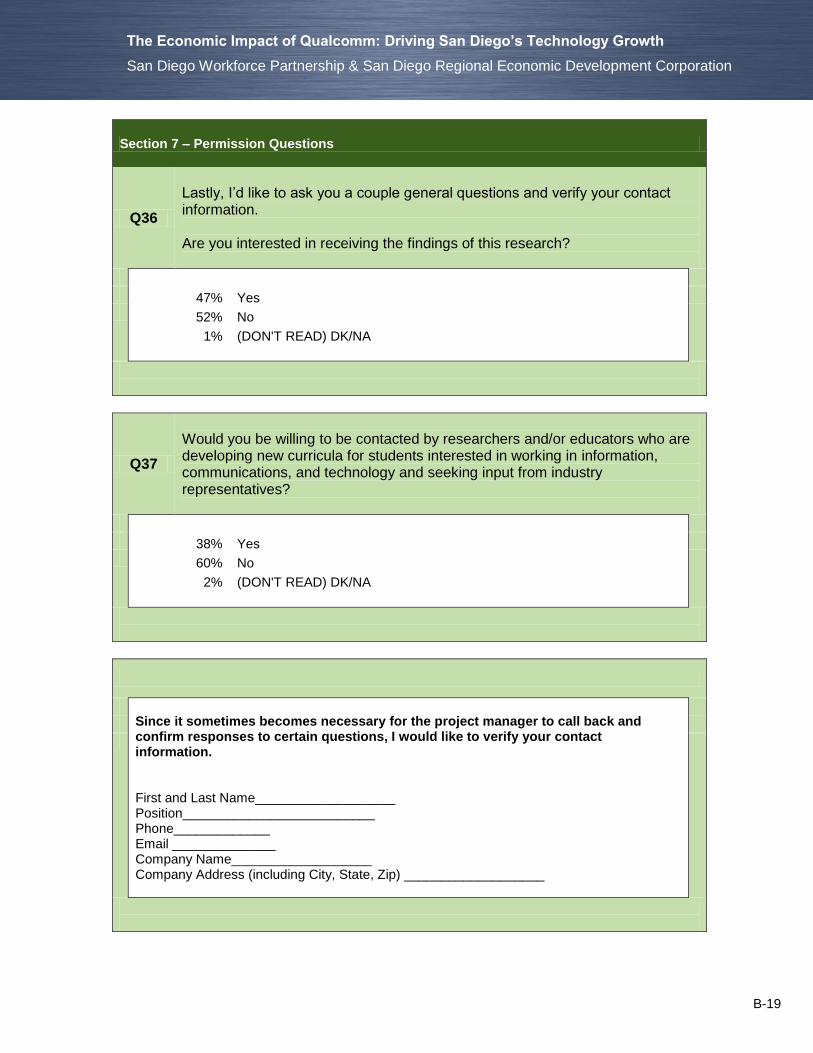
B-19
The Economic Impact of Qualcomm: Driving San Diego’s Technology Growth
San Diego Workforce Partnership & San Diego Regional Economic Development Corporation
Section 7 – Permission Questions
Q36
Lastly, I’d like to ask you a couple general questions and verify your contact information. Are you interested in receiving the findings of this research?
47% Yes
52% No
1% (DON'T READ) DK/NA
Q37
Would you be willing to be contacted by researchers and/or educators who are developing new curricula for students interested in working in information, communications, and technology and seeking input from industry representatives?
38% Yes
60% No
2% (DON'T READ) DK/NA
Since it sometimes becomes necessary for the project manager to call back and confirm responses to certain questions, I would like to verify your contact information. First and Last Name___________________ Position__________________________ Phone_____________ Email ______________ Company Name___________________ Company Address (including City, State, Zip) ___________________

C-1
The Economic Impact of Qualcomm: Driving San Diego’s Technology Growth
San Diego Workforce Partnership & San Diego Regional Economic Development Corporation
APPENDIX C: TELECOMMUNICATIONS, ICT, & CONVERGENCE WITH TELECOM INDUSTRIES
COMPARISON OF METRO AREAS
NOTE: All metropolitan establishment, employment, and wage data are based upon the U.S. Bureau of Labor Statistics “Quarterly Census of Employment and Wages (QCEW). The data is a tabulation of employment and wages for establishments reporting Unemployment Insurance (UI) programs. Employment covered by these UI programs represents about 99.7% of all wage and salary civilian employment in the country.
Industries are classified according to the North American Industrial Classification System (NAICS), which groups establishments into industries based on the activity in which they are primarily engaged. Establishments using similar raw material inputs, similar capital equipment, and similar labor are classified in the same industry. NAICS uses a six-digit hierarchical coding system to classify all economic activity into twenty main industry sectors.

C-2
The Economic Impact of Qualcomm: Driving San Diego’s Technology Growth
San Diego Workforce Partnership & San Diego Regional Economic Development Corporation
Figure 9: San Diego Telecommunications, ICT, and Related Convergence Employment
24,000
26,000
28,000
30,000
32,000
34,000
36,000
38,000
40,000
42,000
44,000
2001 2002 2003 2004 2005 2006 2007 2008 2009 2010
SAN DIEGO TELECOMMUNICATIONS,ICT & RELATED CONVERGENCE EMPLOYMENT
Telecommunications
ICT &RelatedConvergence

C-3
The Economic Impact of Qualcomm: Driving San Diego’s Technology Growth
San Diego Workforce Partnership & San Diego Regional Economic Development Corporation
Table 19: San Diego-Carlsbad-San Marcos, CA Metro Area Clusters
SAN DIEGO-CARLSBAD-SAN MARCOS, CA METRO AREA CLUSTERSESTABLISHMENTS 2001 2002 2003 2004 2005 2006 2007 2008 2009 2010
Telecommunications 1,130 1,152 1,162 1,188 1,176 1,317 1,520 1,470 1,475 1,238
ICT & Related Convergence 1,230 1,354 1,427 1,485 1,463 1,501 1,452 1,463 1,484 1,496
% of Total Industries: Telecommunications 1.5% 1.5% 1.4% 1.4% 1.4% 1.4% 1.7% 1.5% 1.5% 1.3%
% of Total Industries: ICT & Related 1.6% 1.7% 1.7% 1.7% 1.7% 1.6% 1.6% 1.5% 1.5% 1.5%
Total Metro, All Industries 75,348 79,408 83,354 85,621 86,553 91,732 91,960 97,453 96,716 96,853
EMPLOYMENT
Telecommunications 34,314 32,868 32,545 32,096 33,618 33,441 40,926 43,273 41,687 39,962
ICT & Related Convergence 26,994 26,743 25,884 25,979 25,796 26,421 26,873 26,591 26,922 26,526
% of Total Industries: Telecommunications 2.8% 2.7% 2.6% 2.5% 2.6% 2.5% 3.1% 3.3% 3.3% 3.2%
% of Total Industries: ICT & Related 2.2% 2.2% 2.1% 2.0% 2.0% 2.0% 2.0% 2.0% 2.2% 2.2%
Total, All Industries 1,218,982 1,237,169 1,253,034 1,270,351 1,291,900 1,313,949 1,321,214 1,317,274 1,247,861 1,230,694
ANNUAL PAYROLL (000s)
Telecommunications $3,049,949 $2,856,115 $3,008,833 $3,572,812 $3,703,784 $4,046,933 $4,687,172 $5,309,091 $4,501,680 $4,317,896
ICT & Related Convergence 2,057,859 1,969,914 1,944,167 1,982,925 2,118,142 2,223,531 2,389,695 2,419,957 2,443,052 2,605,556
% of Total Industries: Telecommunications 6.5% 5.9% 5.9% 6.6% 6.5% 6.7% 7.4% 8.2% 7.3% 6.9%
% of Total Industries: ICT & Related 6.5% 5.9% 5.9% 6.6% 6.5% 6.7% 7.4% 8.2% 7.3% 6.9%
Total Metro, All Industries $46,830,597 $48,627,462 $50,731,998 $53,839,712 $56,615,777 $60,157,440 $62,964,597 $64,650,283 $61,444,861 $62,452,460
AVERAGE ANNUAL INCOME
Telecommunications $88,884 $86,896 $92,453 $111,316 $110,173 $121,019 $114,529 $122,689 $107,987 $108,051
ICT & Related Convergence 76,234 73,661 75,111 76,328 82,112 84,159 88,925 91,006 90,745 98,226
Ratio to Total: Telecommunications 2.31 2.21 2.28 2.63 2.52 2.64 2.40 2.50 2.19 2.13
Ratio to Total: ICT & Related 1.99 1.87 1.85 1.80 1.87 1.84 1.86 1.85 1.84 1.94
Total, All Industries $38,400 $39,300 $40,500 $42,400 $43,800 $45,800 $47,700 $49,100 $49,200 $50,700
Average Firm Size/Number of Employees
Telecommunications 30.4 28.5 28.0 27.0 28.6 25.4 26.9 29.4 28.3 32.3
ICT & Related Convergence 21.9 19.8 18.1 17.5 17.6 17.6 18.5 18.2 18.1 17.7
Ratio to Total: Telecommunications 1.88 1.83 1.86 1.82 1.92 1.77 1.87 2.18 2.19 2.54
Ratio to Total: ICT & Related 1.36 1.27 1.21 1.18 1.18 1.23 1.29 1.34 1.41 1.40
Total, All Industries 16.2 15.6 15.0 14.8 14.9 14.3 14.4 13.5 12.9 12.7
Average Payroll per Firm
Telecommunications $2,698,109 $2,480,106 $2,589,968 $3,006,245 $3,149,809 $3,072,557 $3,083,666 $3,611,627 $3,051,986 $3,487,800
ICT & Related Convergence 1,673,056 1,454,885 1,362,738 1,335,303 1,447,807 1,481,367 1,645,796 1,654,106 1,646,262 1,741,682
Ratio to Total: Telecommunications 4.34 4.05 4.26 4.78 4.82 4.69 4.50 5.44 4.80 5.41
Ratio to Total: ICT & Related 2.69 2.38 2.24 2.12 2.21 2.26 2.40 2.49 2.59 2.70
Total, All Industries $621,524 $612,375 $608,633 $628,814 $654,117 $655,796 $684,695 $663,400 $635,312 $644,817

C-4
The Economic Impact of Qualcomm: Driving San Diego’s Technology Growth
San Diego Workforce Partnership & San Diego Regional Economic Development Corporation
Figure 10: Austin Telecommunications, ICT, and Related Convergence Employment
0
5,000
10,000
15,000
20,000
25,000
30,000
35,000
40,000
45,000
2001 2002 2003 2004 2005 2006 2007 2008 2009 2010
AUSTIN TELECOMMUNICATIONS,ICT & RELATED CONVERGENCE EMPLOYMENT
ICT & RelatedConvergence
Telecommunications
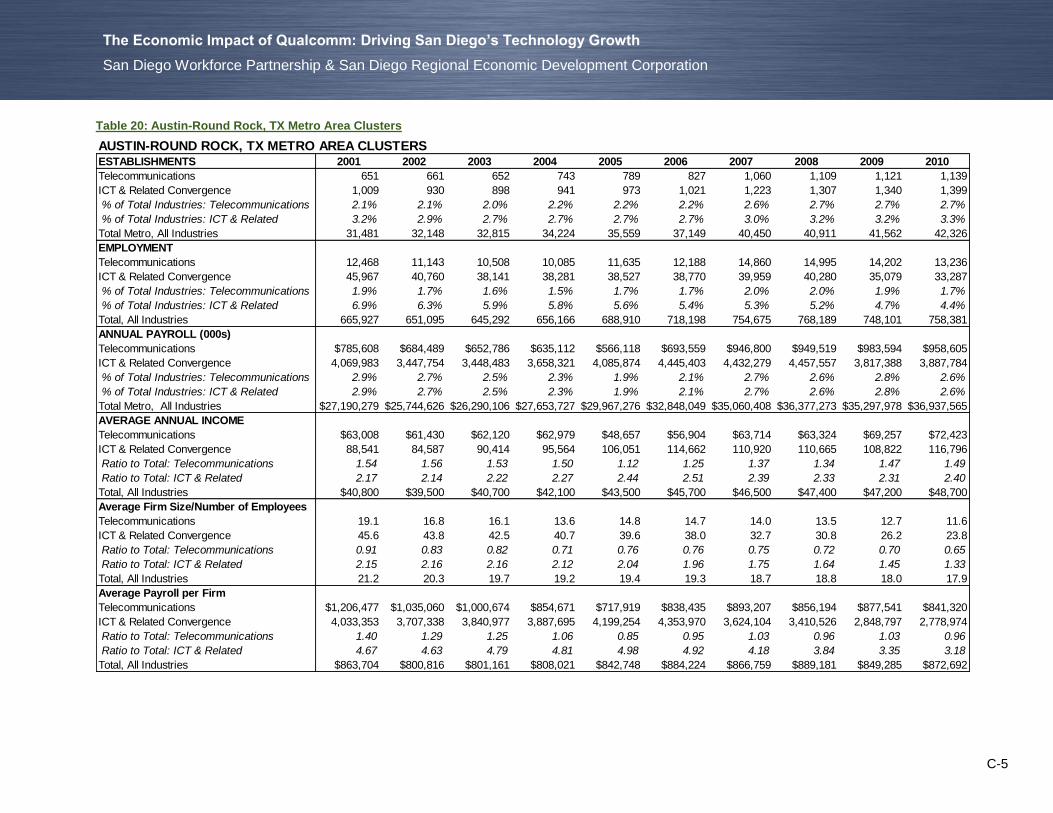
C-5
The Economic Impact of Qualcomm: Driving San Diego’s Technology Growth
San Diego Workforce Partnership & San Diego Regional Economic Development Corporation
Table 20: Austin-Round Rock, TX Metro Area Clusters
AUSTIN-ROUND ROCK, TX METRO AREA CLUSTERSESTABLISHMENTS 2001 2002 2003 2004 2005 2006 2007 2008 2009 2010
Telecommunications 651 661 652 743 789 827 1,060 1,109 1,121 1,139
ICT & Related Convergence 1,009 930 898 941 973 1,021 1,223 1,307 1,340 1,399
% of Total Industries: Telecommunications 2.1% 2.1% 2.0% 2.2% 2.2% 2.2% 2.6% 2.7% 2.7% 2.7%
% of Total Industries: ICT & Related 3.2% 2.9% 2.7% 2.7% 2.7% 2.7% 3.0% 3.2% 3.2% 3.3%
Total Metro, All Industries 31,481 32,148 32,815 34,224 35,559 37,149 40,450 40,911 41,562 42,326
EMPLOYMENT
Telecommunications 12,468 11,143 10,508 10,085 11,635 12,188 14,860 14,995 14,202 13,236
ICT & Related Convergence 45,967 40,760 38,141 38,281 38,527 38,770 39,959 40,280 35,079 33,287
% of Total Industries: Telecommunications 1.9% 1.7% 1.6% 1.5% 1.7% 1.7% 2.0% 2.0% 1.9% 1.7%
% of Total Industries: ICT & Related 6.9% 6.3% 5.9% 5.8% 5.6% 5.4% 5.3% 5.2% 4.7% 4.4%
Total, All Industries 665,927 651,095 645,292 656,166 688,910 718,198 754,675 768,189 748,101 758,381
ANNUAL PAYROLL (000s)
Telecommunications $785,608 $684,489 $652,786 $635,112 $566,118 $693,559 $946,800 $949,519 $983,594 $958,605
ICT & Related Convergence 4,069,983 3,447,754 3,448,483 3,658,321 4,085,874 4,445,403 4,432,279 4,457,557 3,817,388 3,887,784
% of Total Industries: Telecommunications 2.9% 2.7% 2.5% 2.3% 1.9% 2.1% 2.7% 2.6% 2.8% 2.6%
% of Total Industries: ICT & Related 2.9% 2.7% 2.5% 2.3% 1.9% 2.1% 2.7% 2.6% 2.8% 2.6%
Total Metro, All Industries $27,190,279 $25,744,626 $26,290,106 $27,653,727 $29,967,276 $32,848,049 $35,060,408 $36,377,273 $35,297,978 $36,937,565
AVERAGE ANNUAL INCOME
Telecommunications $63,008 $61,430 $62,120 $62,979 $48,657 $56,904 $63,714 $63,324 $69,257 $72,423
ICT & Related Convergence 88,541 84,587 90,414 95,564 106,051 114,662 110,920 110,665 108,822 116,796
Ratio to Total: Telecommunications 1.54 1.56 1.53 1.50 1.12 1.25 1.37 1.34 1.47 1.49
Ratio to Total: ICT & Related 2.17 2.14 2.22 2.27 2.44 2.51 2.39 2.33 2.31 2.40
Total, All Industries $40,800 $39,500 $40,700 $42,100 $43,500 $45,700 $46,500 $47,400 $47,200 $48,700
Average Firm Size/Number of Employees
Telecommunications 19.1 16.8 16.1 13.6 14.8 14.7 14.0 13.5 12.7 11.6
ICT & Related Convergence 45.6 43.8 42.5 40.7 39.6 38.0 32.7 30.8 26.2 23.8
Ratio to Total: Telecommunications 0.91 0.83 0.82 0.71 0.76 0.76 0.75 0.72 0.70 0.65
Ratio to Total: ICT & Related 2.15 2.16 2.16 2.12 2.04 1.96 1.75 1.64 1.45 1.33
Total, All Industries 21.2 20.3 19.7 19.2 19.4 19.3 18.7 18.8 18.0 17.9
Average Payroll per Firm
Telecommunications $1,206,477 $1,035,060 $1,000,674 $854,671 $717,919 $838,435 $893,207 $856,194 $877,541 $841,320
ICT & Related Convergence 4,033,353 3,707,338 3,840,977 3,887,695 4,199,254 4,353,970 3,624,104 3,410,526 2,848,797 2,778,974
Ratio to Total: Telecommunications 1.40 1.29 1.25 1.06 0.85 0.95 1.03 0.96 1.03 0.96
Ratio to Total: ICT & Related 4.67 4.63 4.79 4.81 4.98 4.92 4.18 3.84 3.35 3.18
Total, All Industries $863,704 $800,816 $801,161 $808,021 $842,748 $884,224 $866,759 $889,181 $849,285 $872,692

C-6
The Economic Impact of Qualcomm: Driving San Diego’s Technology Growth
San Diego Workforce Partnership & San Diego Regional Economic Development Corporation
Figure 11: Boston Telecommunications, ICT, and Related Convergence Employment
40,000
45,000
50,000
55,000
60,000
65,000
70,000
75,000
80,000
85,000
90,000
2001 2002 2003 2004 2005 2006 2007 2008 2009 2010
BOSTON TELECOMMUNICATIONS,ICT & RELATED CONVERGENCE EMPLOYMENT
ICT &RelatedConvergence
Telecommunications

C-7
The Economic Impact of Qualcomm: Driving San Diego’s Technology Growth
San Diego Workforce Partnership & San Diego Regional Economic Development Corporation
Table 21: Boston-Cambridge-Quincy, MA-NH Metro Area Clusters
BOSTON-CAMBRIDGE-QUINCY, MA-NH METRO AREA CLUSTERSESTABLISHMENTS 2001 2002 2003 2004 2005 2006 2007 2008 2009 2010
Telecommunications 2,873 2,686 2,592 2,568 2,489 2,284 2,671 2,886 2,985 3,118
ICT & Related Convergence 2,953 3,418 3,459 3,538 3,504 3,174 3,224 3,297 3,268 3,449
% of Total Industries: Telecommunications 2.2% 2.0% 1.9% 1.8% 1.8% 1.7% 1.9% 2.0% 2.1% 2.2%
% of Total Industries: ICT & Related 2.3% 2.6% 2.5% 2.5% 2.5% 2.3% 2.3% 2.3% 2.3% 2.4%
Total Metro, All Industries 130,834 133,519 136,735 140,002 141,954 137,838 139,417 140,905 140,235 144,439
EMPLOYMENT
Telecommunications 57,511 49,335 42,706 42,810 44,952 43,460 47,145 49,969 51,170 54,164
ICT & Related Convergence 88,741 80,702 75,072 72,407 74,566 75,220 78,757 80,334 77,606 76,273
% of Total Industries: Telecommunications 2.4% 2.1% 1.9% 1.9% 1.9% 1.9% 2.0% 2.1% 2.2% 2.3%
% of Total Industries: ICT & Related 3.7% 3.4% 3.3% 3.2% 3.2% 3.2% 3.3% 3.3% 3.3% 3.3%
Total, All Industries 2,427,471 2,359,505 2,302,141 2,296,096 2,317,721 2,348,752 2,384,292 2,399,034 2,317,704 2,329,776
ANNUAL PAYROLL (000s)
Telecommunications $4,720,484 $4,004,139 $3,577,961 $3,734,458 $4,448,770 $4,311,001 $4,621,286 $4,881,259 $4,990,021 $5,433,256
ICT & Related Convergence 7,485,643 6,712,684 6,533,513 6,820,540 7,193,373 7,915,013 8,820,611 9,012,222 8,749,496 9,515,189
% of Total Industries: Telecommunications 4.0% 3.5% 3.1% 3.1% 3.5% 3.2% 3.2% 3.3% 3.6% 3.7%
% of Total Industries: ICT & Related 4.0% 3.5% 3.1% 3.1% 3.5% 3.2% 3.2% 3.3% 3.6% 3.7%
Total Metro, All Industries $118,066,383 $114,168,828 $114,852,560 $121,638,992 $125,617,741 $133,429,730 $142,621,525 $146,647,447 $140,334,039 $145,517,412
AVERAGE ANNUAL INCOME
Telecommunications $82,080 $81,162 $83,781 $87,233 $98,967 $99,195 $98,024 $97,686 $97,519 $100,311
ICT & Related Convergence 84,354 83,179 87,031 94,198 96,470 105,225 111,998 112,185 112,743 124,752
Ratio to Total: Telecommunications 1.69 1.68 1.68 1.65 1.83 1.75 1.64 1.60 1.61 1.60
Ratio to Total: ICT & Related 1.74 1.72 1.74 1.78 1.78 1.85 1.87 1.84 1.86 2.00
Total, All Industries $48,600 $48,400 $49,900 $53,000 $54,200 $56,800 $59,800 $61,100 $60,500 $62,500
Average Firm Size/Number of Employees
Telecommunications 20.0 18.4 16.5 16.7 18.1 19.0 17.7 17.3 17.1 17.4
ICT & Related Convergence 30.1 23.6 21.7 20.5 21.3 23.7 24.4 24.4 23.7 22.1
Ratio to Total: Telecommunications 1.08 1.04 0.98 1.02 1.11 1.12 1.03 1.02 1.04 1.08
Ratio to Total: ICT & Related 1.62 1.34 1.29 1.25 1.30 1.39 1.43 1.43 1.44 1.37
Total, All Industries 18.6 17.7 16.8 16.4 16.3 17.0 17.1 17.0 16.5 16.1
Average Payroll per Firm
Telecommunications $1,643,202 $1,490,867 $1,380,395 $1,454,203 $1,787,392 $1,887,577 $1,730,171 $1,691,358 $1,671,699 $1,742,545
ICT & Related Convergence 2,535,041 1,963,892 1,888,658 1,927,795 2,052,903 2,493,703 2,735,921 2,733,461 2,677,324 2,758,826
Ratio to Total: Telecommunications 1.82 1.74 1.64 1.67 2.02 1.95 1.69 1.63 1.67 1.73
Ratio to Total: ICT & Related 2.81 2.30 2.25 2.22 2.32 2.58 2.67 2.63 2.68 2.74
Total, All Industries $902,414 $855,076 $839,965 $868,838 $884,919 $968,018 $1,022,985 $1,040,754 $1,000,706 $1,007,466

C-8
The Economic Impact of Qualcomm: Driving San Diego’s Technology Growth
San Diego Workforce Partnership & San Diego Regional Economic Development Corporation
Figure 12: Denver-Boulder Telecommunications, ICT, and Related Convergence Employment
30,000
35,000
40,000
45,000
50,000
55,000
2001 2002 2003 2004 2005 2006 2007 2008 2009 2010
DENVER-BOULDER TELECOMMUNICATIONS,ICT & RELATED CONVERGENCE EMPLOYMENT
Telecommunications
ICT &RelatedConvergence

C-9
The Economic Impact of Qualcomm: Driving San Diego’s Technology Growth
San Diego Workforce Partnership & San Diego Regional Economic Development Corporation
Table 22: Denver-Boulder, CO Consolidated Metro Area Clusters
DENVER-BOULDER CONSOLIDATED METRO AREA CLUSTERSESTABLISHMENTS 2001 2002 2003 2004 2005 2006 2007 2008 2009 2010
Telecommunications 2,648 2,580 2,556 2,560 2,735 2,972 3,271 3,303 3,359 3,434
ICT & Related Convergence 2,552 2,172 2,062 2,355 2,444 2,604 2,708 2,735 2,724 2,800
% of Total Industries: Telecommunications 3.0% 2.9% 2.8% 2.8% 2.9% 3.0% 3.3% 3.3% 3.5% 3.6%
% of Total Industries: ICT & Related 2.9% 2.4% 2.3% 2.6% 2.6% 2.7% 2.7% 2.8% 2.8% 2.9%
Total Metro, All Industries 87,552 88,671 90,134 91,640 94,954 97,451 99,113 98,839 97,245 96,128
EMPLOYMENT
Telecommunications 53,073 44,167 40,512 39,679 38,227 37,911 45,805 47,179 45,973 45,503
ICT & Related Convergence 45,736 43,844 39,492 37,302 35,781 35,733 35,004 35,147 33,633 32,781
% of Total Industries: Telecommunications 4.5% 3.9% 3.7% 3.5% 3.3% 3.3% 3.8% 3.9% 4.1% 4.0%
% of Total Industries: ICT & Related 3.9% 3.9% 3.6% 3.3% 3.1% 3.1% 2.9% 2.9% 3.0% 2.9%
Total, All Industries 1,186,007 1,138,315 1,107,614 1,118,208 1,141,983 1,166,399 1,191,731 1,199,898 1,134,023 1,124,201
ANNUAL PAYROLL (000s)
Telecommunications $3,698,750 $2,954,173 $2,720,941 $2,845,521 $2,800,084 $3,265,300 $3,787,222 $3,816,010 $3,646,664 $3,836,000
ICT & Related Convergence 3,299,549 3,277,963 3,099,727 3,102,229 3,239,666 3,267,193 3,335,264 3,403,062 3,239,028 3,254,338
% of Total Industries: Telecommunications 7.3% 6.1% 5.6% 5.7% 5.3% 5.7% 6.3% 6.2% 6.2% 6.4%
% of Total Industries: ICT & Related 7.3% 6.1% 5.6% 5.7% 5.3% 5.7% 6.3% 6.2% 6.2% 6.4%
Total Metro, All Industries $50,836,763 $48,190,719 $48,165,980 $50,241,484 $53,005,925 $56,980,460 $60,561,537 $62,008,397 $58,767,310 $59,765,450
AVERAGE ANNUAL INCOME
Telecommunications $69,691 $66,887 $67,164 $71,713 $73,249 $86,132 $82,682 $80,884 $79,321 $84,303
ICT & Related Convergence 72,143 74,764 78,490 83,165 90,541 91,433 95,281 96,824 96,306 99,276
Ratio to Total: Telecommunications 1.62 1.58 1.54 1.60 1.58 1.76 1.63 1.56 1.53 1.58
Ratio to Total: ICT & Related 1.68 1.77 1.80 1.85 1.95 1.87 1.88 1.87 1.86 1.87
Total, All Industries $42,900 $42,300 $43,500 $44,900 $46,400 $48,900 $50,800 $51,700 $51,800 $53,200
Average Firm Size/Number of Employees
Telecommunications 20.0 17.1 15.9 15.5 14.0 12.8 14.0 14.3 13.7 13.3
ICT & Related Convergence 17.9 20.2 19.2 15.8 14.6 13.7 12.9 12.9 12.3 11.7
Ratio to Total: Telecommunications 1.48 1.33 1.29 1.27 1.16 1.07 1.16 1.18 1.17 1.13
Ratio to Total: ICT & Related 1.32 1.57 1.56 1.30 1.22 1.15 1.08 1.06 1.06 1.00
Total, All Industries 13.5 12.8 12.3 12.2 12.0 12.0 12.0 12.1 11.7 11.7
Average Payroll per Firm
Telecommunications $1,396,800 $1,145,202 $1,064,630 $1,111,563 $1,023,870 $1,098,628 $1,157,818 $1,155,316 $1,085,640 $1,117,065
ICT & Related Convergence 1,292,859 1,509,140 1,503,365 1,317,295 1,325,559 1,254,682 1,231,634 1,244,264 1,189,071 1,162,263
Ratio to Total: Telecommunications 2.41 2.11 1.99 2.03 1.83 1.88 1.89 1.84 1.80 1.80
Ratio to Total: ICT & Related 2.23 2.78 2.81 2.40 2.37 2.15 2.02 1.98 1.97 1.87
Total, All Industries $580,647 $543,478 $534,382 $548,248 $558,227 $584,709 $611,035 $627,368 $604,322 $621,728

C-10
The Economic Impact of Qualcomm: Driving San Diego’s Technology Growth
San Diego Workforce Partnership & San Diego Regional Economic Development Corporation
Figure 13: San Jose Telecommunications, ICT, and Related Convergence Employment
0
20,000
40,000
60,000
80,000
100,000
120,000
140,000
160,000
2001 2002 2003 2004 2005 2006 2007 2008 2009 2010
SAN JOSE TELECOMMUNICATIONS,ICT & RELATED CONVERGENCE EMPLOYMENT
ICT & RelatedConvergence
Telecommunications

C-11
The Economic Impact of Qualcomm: Driving San Diego’s Technology Growth
San Diego Workforce Partnership & San Diego Regional Economic Development Corporation
Table 23: San Jose-Sunnyvale-Santa Clara, CA Metro Area Clusters
SAN JOSE-SUNNYVALE-SANTA CLARA, CA METRO AREA CLUSTERSESTABLISHMENTS 2001 2002 2003 2004 2005 2006 2007 2008 2009 2010
Telecommunications 1,399 1,332 1,249 1,186 1,113 1,253 1,467 1,419 1,445 1,395
ICT & Related Convergence 2,760 2,798 2,726 2,602 2,477 2,567 2,462 2,462 2,467 2,417
% of Total Industries: Telecommunications 2.8% 2.6% 2.4% 2.2% 2.1% 2.2% 2.5% 2.3% 2.4% 2.3%
% of Total Industries: ICT & Related 5.5% 5.5% 5.2% 4.9% 4.6% 4.5% 4.3% 4.0% 4.0% 3.9%
Total Metro, All Industries 50,121 50,932 52,130 53,200 53,651 56,831 57,771 61,073 61,479 61,847
EMPLOYMENT
Telecommunications 33,696 28,249 25,676 25,638 26,621 28,859 42,448 43,397 41,477 39,865
ICT & Related Convergence 157,427 133,796 120,579 117,659 115,599 116,284 114,592 115,582 110,209 111,416
% of Total Industries: Telecommunications 3.3% 3.1% 3.0% 3.0% 3.1% 3.2% 4.6% 4.7% 4.8% 4.7%
% of Total Industries: ICT & Related 15.5% 14.5% 13.9% 13.7% 13.3% 13.0% 12.5% 12.5% 12.8% 13.0%
Total, All Industries 1,018,126 920,665 868,182 861,158 871,239 894,073 913,386 922,144 863,465 856,605
ANNUAL PAYROLL (000s)
Telecommunications $3,293,887 $2,741,483 $2,634,674 $2,824,659 $3,104,443 $3,411,251 $5,020,548 $5,226,564 $5,278,009 $5,202,654
ICT & Related Convergence 18,324,480 15,082,830 13,871,845 14,381,657 15,173,189 16,824,209 18,280,790 17,532,646 15,664,294 17,830,320
% of Total Industries: Telecommunications 4.9% 4.8% 4.7% 4.7% 5.0% 5.0% 6.7% 7.1% 7.7% 6.9%
% of Total Industries: ICT & Related 4.9% 4.8% 4.7% 4.7% 5.0% 5.0% 6.7% 7.1% 7.7% 6.9%
Total Metro, All Industries $66,562,806 $57,568,750 $56,589,467 $59,968,729 $62,702,832 $68,493,106 $74,932,221 $73,830,022 $68,739,967 $75,854,467
AVERAGE ANNUAL INCOME
Telecommunications $97,754 $97,045 $102,611 $110,176 $116,615 $118,205 $118,277 $120,436 $127,251 $130,506
ICT & Related Convergence 116,400 112,730 115,044 122,232 131,258 144,683 159,530 151,690 142,132 160,034
Ratio to Total: Telecommunications 1.49 1.55 1.57 1.58 1.62 1.54 1.44 1.50 1.60 1.47
Ratio to Total: ICT & Related 1.78 1.80 1.76 1.76 1.82 1.89 1.95 1.89 1.79 1.81
Total, All Industries $65,400 $62,500 $65,200 $69,600 $72,000 $76,600 $82,000 $80,100 $79,600 $88,600
Average Firm Size/Number of Employees
Telecommunications 24.1 21.2 20.6 21.6 23.9 23.0 28.9 30.6 28.7 28.6
ICT & Related Convergence 57.0 47.8 44.2 45.2 46.7 45.3 46.5 46.9 44.7 46.1
Ratio to Total: Telecommunications 1.19 1.17 1.23 1.34 1.47 1.46 1.83 2.03 2.04 2.06
Ratio to Total: ICT & Related 2.81 2.65 2.66 2.79 2.87 2.88 2.94 3.11 3.18 3.33
Total, All Industries 20.3 18.1 16.7 16.2 16.2 15.7 15.8 15.1 14.0 13.9
Average Payroll per Firm
Telecommunications $2,354,657 $2,058,814 $2,109,820 $2,382,380 $2,789,257 $2,723,062 $3,422,323 $3,683,272 $3,652,601 $3,729,517
ICT & Related Convergence 6,640,284 5,390,346 5,089,351 5,527,155 6,125,632 6,554,036 7,425,179 7,121,302 6,349,531 7,377,027
Ratio to Total: Telecommunications 1.77 1.82 1.94 2.11 2.39 2.26 2.64 3.05 3.27 3.04
Ratio to Total: ICT & Related 5.00 4.77 4.69 4.90 5.24 5.44 5.72 5.89 5.68 6.01
Total, All Industries $1,328,042 $1,130,306 $1,085,545 $1,127,232 $1,168,717 $1,205,207 $1,297,056 $1,208,882 $1,118,105 $1,226,486

SAN DIEGO REGIONAL ECONOMIC DEVELOPMENT CORPORATION
ADDRESS 530 B Street, 7th Floor
San Diego, CA 92101
PHONE 619.234.8484
WEB sandiegobusiness.org
SAN DIEGO WORKFORCE PARTNERSHIP
ADDRESS 3910 University Avenue, Suite 400
San Diego, CA 92105
PHONE (619) 228-2900 Toll-free: 1-888-884-SDWP (7397)
WEB workforce.org
Thank you to Qualcomm for providing information
contributing to the report
Research completed by Sponsored by