the ecology, impacts, and control of crassula helmsii
TRANSCRIPT

The Ecology, Impacts, and Control of Crassula helmsii
Clare E. Dean
This thesis has been submitted in partial fulfilment of the requirements of the degree of
Doctor of Philosophy
Bournemouth University in collaboration with the National Trust and with the Royal
Society for the Protection of Birds
June 2015

2
This copy of the thesis has been supplied on condition that anyone who consults it is understood
to recognise that its copyright rests with its author and due acknowledgement must always be
made of the use of any material contained in, or derived from, this thesis.

3
Abstract
A major focus of research regarding non-native invasive plants is to understand what ecological
variables (abiotic and biotic) increase or decrease the likelihood that a non-native plant species
will become invasive, and to determine whether invasion has a negative impact on native plant
species. Crassula helmsii is a plant indigenous to Australasia, which has invaded wetland
habitats across much of Britain. It is a low growing, clonally spreading plant, which occupies
the margins and shallows of freshwater and brackish waterbodies. Crassula helmsii is
considered invasive due to its ability to produce vigorous aboveground growth, which in some
locations spreads to form dense monospecific mats of vegetation. There are concerns that C.
helmsii can exclude native plant species, and therefore that its invasion may have a negative
impact on biodiversity. The research presented in this thesis was conducted with the aim of
better understanding the mechanisms which allow C. helmsii to develop dense, dominating
vegetative mats. This aim was addressed by investigating how C. helmsii abundance was related
to variation in the abiotic environment, how C. helmsii abundance was affected by generalist
herbivores, and whether C. helmsii abundance was related to the presence or absence of co-
occurring plant competitors.
To investigate how C. helmsii abundance is related to the abiotic environment, firstly field data
were collected of pH, nutrient levels, water depth, and shade levels along C. helmsii invaded
margins of waterbodies. Multiple linear regression was used to address the question: How well
does abiotic variation predict variation in C. helmsii abundance in the field? Finding that C.
helmsii cover was significantly greater at a higher pH and at lower shade levels. Secondly C.
helmsii was grown in mesocosms at different strengths of salinity (0, 2, 4, 8 ppt) to address the
question: What is the estimated minimum salinity level for the control of C. helmsii in brackish
water habitats? Relative growth rate decreased significantly with increasing salinity and C.
helmsii died in the highest salinity treatments (8 ppt). These two experiments demonstrated that
C. helmsii abundance can be affected by the abiotic environment, and specifically by pH, shade
levels, and salinity. Dense, dominating mats of C. helmsii are more likely to occur in freshwater
conditions, which have a neutral to alkaline pH, and with minimal overhead shading. More
effective control against C. helmsii dominance may be achieved by preventing C. helmsii from
colonising sites with such abiotic conditions, or by focusing more effort on removal of C.
helmsii vegetation which has colonised such sites.
To investigate the effect of disturbance from generalist herbivores, a field-based experiment was
set up, in which 4 m2 fenced plots which excluded large vertebrates were erected along a C.
helmsii invaded drawdown zone. The abundances of all plants species within the fenced plots
and within adjacent unfenced plots were recorded repeatedly over a year, and compared, in
order to explore the question: What is the effect of grazing on the abundance of C. helmsii

4
within a wetland plant community? Crassula helmsii declined in abundance in the fenced plots
compared to the unfenced plots, and the abundance of co-occurring vegetation was consistently
higher in the fenced plots than in the unfenced plots. Crassula helmsii appeared to benefit from
grazing disturbance, attaining a higher abundance in the unfenced plots, where competitor plant
species had been grazed out. Crassula helmsii could have a negative impact on native plant
species diversity, if it is able to fill a niche usually occupied by native plant species of open,
grazed drawdown zones (e.g. Teucrium scordium).
The relationship between C. helmsii abundance and the presence or absence of co-occurring
plants was investigated in order to ascertain the effect of competition on the abundance of C.
helmsii, and also to ascertain the effect of competition from C. helmsii on the abundance and
diversity of co-occurring plants, therefore giving an indication of whether the spread of C.
helmsii can have a negative impact on native species. Firstly a common garden experiment and
a field based experiment were separately conducted, both assessing how well C. helmsii could
spread into available bare ground compared to native competitors, and addressing the question:
Is available bare ground an important pre-requisite to high C. helmsii abundance? These
experiments found that C. helmsii can rapidly respond to available bare ground, but that
simultaneous spread of native competitors might limit C. helmsii community dominance. The
effect of C. helmsii on native plants was species specific; the common garden experiment
showed that C. helmsii limited the spread of Anagallis tenella, but not Hypericum elodes or
Hydrocotyle vulgaris. Secondly field survey data of plant species abundance and diversity were
collected to explore the question: Can the invasion of C. helmsii negatively affect the plant
community in a Phragmites australis dominated fen habitat? Survey data were analysed to
determine whether C. helmsii was negatively correlated with variables of the plant community,
a pattern indicating that C. helmsii could increase in abundance by displacing native plants. The
variables ‘total community abundance’ and ‘species diversity’ were not significantly correlated
with C. helmsii. At the single species level, C. helmsii and the dominant plant species P.
australis showed a high capacity to coexist, although C. helmsii was most abundant where P.
australis was absent. Based on these three experiments, evidence was not found to suggest that
C. helmsii has a negative impact through direct displacement of native plants. However, because
dominating C. helmsii growth may be more likely to occur in an area with ample bare ground
into which this species can spread, and where tall competitive plant species (e.g. P. australis)
are in low abundance, management activities designed to increase species diversity by creating
patches of open vegetation structure, might instead just encourage a higher abundance and
dominance of C. helmsii.
5
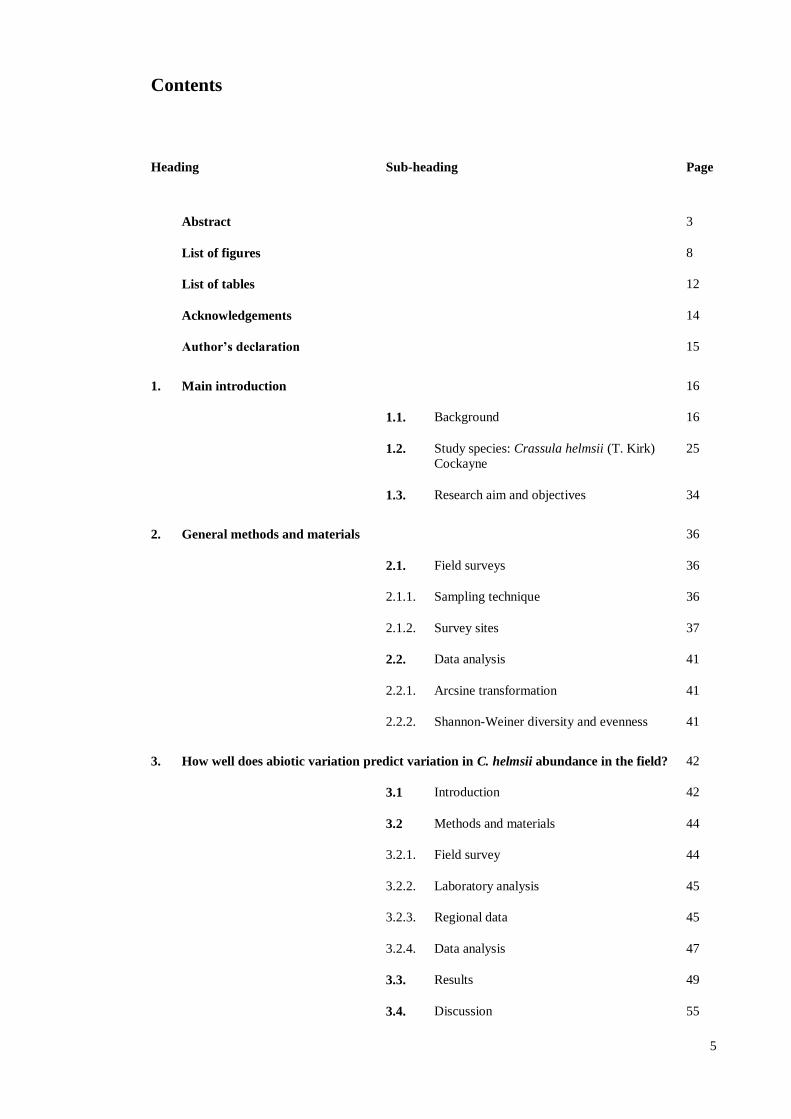
Contents
Heading Sub-heading Page
Abstract 3
List of figures 8
List of tables 12
Acknowledgements 14
Author’s declaration 15
1. Main introduction 16
1.1. Background 16
1.2. Study species: Crassula helmsii (T. Kirk)
Cockayne
25
1.3. Research aim and objectives 34
2. General methods and materials 36
2.1. Field surveys 36
2.1.1. Sampling technique 36
2.1.2. Survey sites 37
2.2. Data analysis 41
2.2.1. Arcsine transformation 41
2.2.2. Shannon-Weiner diversity and evenness 41
3. How well does abiotic variation predict variation in C. helmsii abundance in the field? 42
3.1 Introduction 42
3.2 Methods and materials 44
3.2.1. Field survey 44
3.2.2. Laboratory analysis 45
3.2.3. Regional data 45
3.2.4. Data analysis 47
3.3. Results 49
3.4. Discussion 55

6
4. What is the estimated minimum salinity level for the control of Crassula helmsii in
brackish water habitats?
59
4.1. Background 59
4.2. Action 61
4.3. Consequences 63
4.4. Discussion 65
5. What is the effect of vertebrate grazing disturbance on the abundance of C. helmsii
within a wetland plant community?
67
5.1. Introduction 67
5.2. Methods and materials 69
5.2.1. Experimental design 69
5.2.2. Statistical analysis 70
5.3. Results 72
5.4. Discussion 79
6. Is available bare ground an important pre-requisite to high C. helmsii abundance? 82
6.1. Introduction 82
6.2. Methods and materials: Common garden
experiment
85
6.2.1. Experimental design 85
6.2.2. Data collection 88
6.2.3. Statistical analysis 89
6.3. Results: Common garden experiment 92
6.4. Methods and materials: Field experiment 99
6.4.1. Experimental design 99
6.4.2. Data collection 101
6.4.3. Statistical analysis 102
6.5. Results: Field experiment 103
6.6. Discussion 110
6.6.1. Common garden experiment 110
6.6.2. Field experiment 112
6.6.3. Is available bare ground an important pre-
requisite to high C. helmsii abundance?
113

7
7. Can the invasion of C. helmsii negatively affect the plant community in a Phragmites
australis dominated fen habitat?
114
7.1. Introduction 114
7.2. Methods and materials 117
7.2.1. Data collection: plant species 117
7.2.2. Data collection: plant traits 117
7.2.3. Statistical analysis 119
7.3. Results 122
7.4. Discussion 135
8. Main discussion 139
9. References 152
10. Appendices 173
I Data volunteered from C. helmsii invaded
sites
173
II Is there an effect of pH on the growth rate
of C. helmsii?
175
III Plant trait matrix 178
IV Insect visitors 182

8
List of figures
Figure Description Page
Main thesis
1. The appearance of the leaves of Crassula helmsii when the plant is growing
terrestrially along the margins of waterbodies (top), compared to the appearance of the
leaves when C. helmsii is growing submerged within water (bottom).
26
2. The distribution of Crassula helmsii in Britain, shown at a resolution of 10 km squares,
and containing data from records up to 2014. Data courtesy of the NBN Gateway with
thanks to all the data contributors:
https://data.nbn.org.uk/Taxa/NBNSYS0000004639/Grid_Map (accessed 11th March
2014). The NBN and its data contributors bear no responsibility for the further analysis
or interpretation of this material, data and/or information.
29
3. The bright green patches in the photograph are dense mats of Crassula helmsii, which
grows extensively along the exposed muddy banks at Castle Water, in Rye Harbour
nature reserve, East Sussex (© Barry Yates).
31
4. Crassula helmsii occurring as a dense and extensive monospecific mat of vegetation
(top), and C. helmsii growing in a mixed stand alongside native species (bottom).
33
5. A satellite image of the New Forest, Hampshire, showing the spatial distribution of the
15 Crassula helmsii invaded ponds that were surveyed here. Image © 2015
Getmapping plc, © 2015 Infoterra Ltd & Bluesky, image © 2015 The Geoinformation
Group.
39
6. The geographical distribution of the five Crassula helmsii invaded sites (nature
reserves), where surveying was carried out. These sites were: Castle Water, East
Sussex; Fen Drayton, Cambridgeshire; Kingfishers Bridge, Cambridgeshire; The New
Forest (ponds), Hampshire; and Ouse Fen, Cambridgeshire.
40
7. The green markers indicate the geographical distribution of locations, from which
additional pH and macronutrient (available nitrogen and total phosphorus) data were
obtained, in order to compile the regional dataset of Crassula hemsii invaded sites.
47
8. Each of the seven graphs relates to a measured variable. From the top of p.51: water
pH, nitrate, ammonia + ammonium, total phosphorus, water depth, shading, and
Crassula helmsii abundance. The five boxplots in each graph indicate the data range
for each variable, in each of the five sites that were surveyed for this study. Extreme
outliers have been excluded from these graphs in order to maintain legibility. These
outliers are 7.52 and 8.84 mg / L ammonia + ammonium, and 1.96 mg / L total
phosphorus, all recorded at Fen Drayton.
51
9. A visual comparison of the range of pH and macronutrient concentrations (nitrate,
ammonia + ammonium, total phosphorus) measured in the ‘field survey’ dataset, to the
range of the same measured variables in the ‘additional’ regional dataset. The ‘field
survey’ data were collected from water bodies in Southern and Eastern England,
whereas the ‘additional’ regional data were obtained from waterbodies across a wider
UK distribution. It can be seen that the range of pH was roughly equivalent between
the two datasets, but that the ‘field survey’ dataset had a lower range of available
nitrogen, and a smaller range of total phosphorus. Extreme outliers of 83.2, 24.8, and
13.4 mg / L nitrate, recorded in the ‘additional’ regional dataset, have been excluded
from the graph in order to maintain legibility.
54

9
10. Bar charts showing the relative growth rate (± 1 SE) of Crassula helmsii when grown
in tanks, with a factorial design combining three treatment levels of salinity (2, 4, and 8
parts/thousand) plus a control, and three treatment levels of nutrient dilution (0.5, 0.25,
and 0.125 x full strength nutrient solution). Bars falling below the 0.00 line represent
negative growth, and thus biomass loss.
63
11. Photograph showing the 4m2 grazing exclosures during the set up of the experiment in
February 2012. These exclosures, along with paired unfenced plots, were situated
along a lake drawdown zone at Kingfishers Bridge nature reserve, Cambridgeshire,
where Crassula helmsii was known to have invaded (© Roger Beecroft).
70
12. The mean percentage cover (± 1 SE) of Crassula helmsii in two separate experimental
treatments: ‘grazed’ unfenced plots, and ‘ungrazed’ fenced exclosures. The graph
shows the change in mean percentage cover over the course of eight repeated surveys
that were carried out between July 2012 and October 2013.
72
13. The mean maximum height (± 1 SE) of Crassula helmsii in ‘grazed’ unfenced plots,
and ‘ungrazed’ fenced exclosures, in the final four of eight repeated surveys.
73
14. The mean maximum height (± 1 SE) of all vegetation, excluding Crassula helmsii, in
‘grazed’ unfenced plots, and ‘ungrazed’ fenced exclosures. The graph shows data
collected over eight repeated surveys.
73
15. The top graph shows the mean percentage cover (± 1 SE) of all vegetation excluding
Crassula helmsii, and the bottom graph shows the Shannon-Weiner H species diversity
index (± 1 SE) for this vegetation, over eight repeated surveys. Both graphs indicate
the change over time in these variables, in two separate experimental treatments:
‘grazed’ unfenced plots, and ‘ungrazed’ fenced exclosures.
74
16. Photograph taken in August 2013 showing a fenced plot (ungrazed treatment) on the
left, and an unfenced plot (grazed treatment) on the right.
75
17. Abundant and frequently occurring plant species, recorded in grazed and ungrazed plot
treatments. Species classed as ‘abundant’ (shaded bars) had a cover of 10% or higher
in at least three of the six plots, in at least four of the eight sequential surveys. Species
which were classed as ‘frequent’ (no fill) were recorded in at least four of the eight
sequential surveys. Species are presented in rank order of mean abundance (± 1 SE),
and data labels refer to the number of surveys in which each species was recorded.
77
18. The mean proportional abundance (± 1 SE) of Crassula helmsii, Epilobium hirsutum,
and Mentha aquatica, occurring together in (top) ‘grazed’ unfenced plots, and (bottom)
‘ungrazed’ fenced exclosures. Both graphs show the change in mean proportional
abundance of these species, over the course of eight repeated surveys that were carried
out between July 2012 and October 2013.
78
19. Photograph showing the composition of an individual replicate in this experiment. This
particular replicate shows the experimental treatment of Crassula helmsii and
Hydrocotyle vulgaris planted in a pair-wise combination.
86
20. The daily maximum (red) and minimum (blue) temperature of water within the pond
used for the planting experiment, during the year in which the experiment was run.
Temperature was recorded using a Tingtag Plus 2 data logger (© Tinytag, 2013).
87
21. The mean horizontal cover (± 1 SE) over time of four species: Crassula helmsii,
Anagallis tenella, Hypericum elodes, and Hydrocotyle vulgaris. For each species, the
growth over time is shown for a single plug of vegetation which was either paired with
itself in a monoculture (control), or paired in a two-species combination.
94

10
22. These graphs show the outcomes of paired t-tests that were used to test for a significant
difference in mean cover between Crassula helmsii and the species it was paired with.
Three separate paired species treatments are shown; (left) C. helmsii with Anagallis
tenella, (middle) C. helmsii with Hypericum elodes, and (right) C. helmsii with
Hydrocotyle vulgaris. In these graphs, where the confidence interval of the mean
remains above 0 ‘proportional cover’ on the Y axis this is indicative of a result where
C. helmsii had a significantly higher cover than the species it was paired with. Where
the confidence interval of the mean falls across the X axis (above and below 0 cover),
this is indicative of a result where there was no significant difference in cover between
the paired species.
97
23. Photograph showing a section of the drawdown zone at Little Sea lake, shortly after the
75 experimental plots were set-up in summer 2011. Plots of all three treatments groups
are included in the image; (1) bare ground, (2) grass dominated, and (3) moss
dominated.
101
24. Each data point represents one of the 75 experimental plots. These plots are arranged
on the graph based on their easting and northing coordinates (coordinate system: WGS
1984), providing an accurate representation of how the plots were arranged in space
relative to one another. The data points coloured green represent plots where Crassula
helmsii was recorded to occur, on the first (survey 1), middle (survey 6), and last
(survey 13) surveys of the two-year experiment, and thus indicate the spread of C.
helmsii across the experimental area over time.
104
25. The mean abundance (± 1 SE) of vegetation recorded over two years, in three different
planting treatments; 1) left as bare ground, 2) planted with grass dominated vegetation,
or 3) planted with moss dominated vegetation. Data are shown for the abundance of
Agrostis stolonifera the dominant grass species, Sphagnum cuspidatum the dominant
moss species, and for the summed abundance of all other species excluding Crassula
helmsii.
106
26. Each bar represents the frequency of experimental plots within a survey where
Crassula helmsii was recorded for the first time; indicating recent colonisation. The X
axis categories relate to each of the 13 repeated surveys, arranged in chronological
order, and the data are split into three graphs to separately describe colonisation into
(top) bare ground, (middle) grass dominated, and (bottom) moss dominated
experimental treatments. There were 25 plots in each experimental treatment.
107
27. The mean abundance (± 1 SE) of Crassula helmsii recorded over two years, in three
different planting treatments; 1) left as bare ground, 2) planted with grass dominated
vegetation, or 3) planted with moss dominated vegetation.
108
28. The mean abundance (± 1 SE) of the most abundant and frequently occurring species
as recorded in the final survey of the experiment (26.09.13). The species shown are
those species which had a mean abundance of greater than 5 % cover. The number of
plots in which each species was recorded is shown above the corresponding bar on the
graph.
109
29. The plant species recorded in the field survey which had an overall mean abundance of
greater than 1% cover. The bars show the mean abundance (± 1 SE) and the numbers
above each bar show the frequency of sample locations within which each species was
recorded.
122
30. The overall mean abundance (± 1 SE) of plants possessing 28 individual plant traits,
nested within seven trait groups. The numbers above each bar indicate the frequency of
sample locations in which plants with each trait occurred. These data represent all 42
plants species that were recorded in the study.
123

11
31. A 2D MDS (Multi Dimensional Scaling) plot representing each of the 51 sample
locations included in the survey. The Bray-Curtis similarity between each sample
location, based on the presence and absence of plant species, is represented by the
distance between each plotted sample location point.
124
32. The abundance of Crassula helmsii plotted against the abundance of Phragmites
australis. Data were obtained from 51 1m2 quadrats, located within P. australis
dominated fen habitat in Cambridgeshire, UK. When fit to a linear model, these species
were found to be significantly negatively correlated (rs = -0.311, df = 48, p = 0.026).
125
33. The relationships between Crassula helmsii abundance and seven variables of the plant
community: the abundance of co-occurring (subordinate) vegetation, the amount of
bare ground (absence of vegetation), species diversity (Shannon-Weiner H), species
evenness (Shannon-Weiner J), functional richness, functional evenness, and functional
dispersion. A significant strong negative relationship is indicated between C. helmsii
and bare ground percentage cover (rs = -0.738, df = 48, p < 0.001).
128
34. The relationships between Phragmites australis abundance and seven variables of the
plant community: the abundance of co-occurring (subordinate) vegetation, the amount
of bare ground (absence of vegetation), species diversity (Shannon-Weiner H), species
evenness (Shannon-Weiner J), functional richness, functional evenness, and functional
dispersion. Significant negative relationships were found between P. australis and
species diversity (rs = -0.350, df = 48, p = 0.010), and between P. australis and
functional richness (rs = -0.313, df = 48, p = 0.022).
133
Appendices
II-1 Bar charts showing the relative growth rate (± 1 SE) of Crassula helmsii when grown
in a factorial design combining three treatment levels of pH (5.0, 7.0, and 9.0), and
three treatment levels of nutrient dilution (0.5, 0.25, and 0.125 x full strength nutrient
solution).
176
IV-1 Observations whilst conducting fieldwork suggest that insects may be attracted to
dense flowering mats of Crassula helmsii.
182

12
List of tables
Table Description Page
Main thesis
1. The Ordinance Survey grid references of the 15 Crassula helmsii invaded ponds with
were surveyed within The New Forest, Hampshire.
38
2. The number of individual sample locations (1m2 quadrats) visited at each survey site,
and the number of non-connected water bodies which this sampling effort
encompassed.
40
3. The output from linear regression models of Crassula helmsii abundance predicted by
a number of abiotic habitat variables. These variables were: water pH, nitrate (NO3),
ammonia + ammonium (NH3 / NH4+), total phosphorus (TP), water depth, shading. The
first model included all six of these variables. The subsequent three models included
only pH and/or shading, as these two variables were shown to be statistically
significant predictors of C. helmsii abundance in the first model.
49
4. The output from linear regression models of Crassula helmsii abundance predicted by
pH and shading. Five regression models were run using data from five different C.
helmsii invaded sites: Castle Water, East Sussex; Fen Drayton, Cambridgeshire;
Kingfishers Bridge, Cambridgeshire; The New Forest (ponds), Hampshire; and Ouse
Fen, Cambridgeshire.
50
5. The average start dry weight, end dry weight, and growth rate values for replicate trials
of Crassula helmsii when exposed to three different levels of salinity (2, 4, and 8
parts/thousand) plus a control, combined with three different nutrient dilutions (0.5,
0.25, and 0.125 x full strength nutrient solution).
64
6. The results of linear mixed effects models, to compare the proportional abundance of
the most dominant species Crassula helmsii to the proportional abundance of the next
most abundant species Mentha aquatica and Epilobium hirsutum. Data from grazed
and ungrazed plot treatments were analysed separately.
76
7. The dry weight of vegetation harvested at the end of the experiment. The data are
shown for three separate paired treatments; Crassula helmsii paired with Anagallis
tenella, C. helmsii paired with Hypericum elodes, and C. helmsii paired with
Hydrocotyle vulgaris.
98
8. The maximum height of species as measured at the end of the experiment. The data are
shown for three separate paired treatments; Crassula helmsii paired with Anagallis
tenella, C. helmsii paired with Hypericum elodes, and C. helmsii paired with
Hydrocotyle vulgaris.
98
9. The plant trait categories used to group the species that were recorded in the field
survey, and the traits nested within each category. For each category, an explanation is
given of how species were categorised.
118
10. The significant a) negative and b) positive results of Spearman partial correlation tests
between Crassula helmsii and the abundance of individual plant traits, controlling for
variation in Phragmites australis abundance.
127

13
11. The results of Spearman partial correlation tests, conducted on plant abundance data
(percentage cover). Shown are the outcomes of tests in which individual species in the
plant community were tested against Crassula helmsii and Phragmites australis. The
significant positive (grey) and negative (blue) correlation results are highlighted.
131
12. The results of Spearman partial correlation tests. Shown here are the outcomes for tests
in which individual trait variables were tested against Crassula helmsii abundance, and
against Phragmites australis abundance. Each trait variable represented the summed
abundance of all species possessing that trait within each sample location. The
significant positive (grey) and negative (blue) correlation results are highlighted.
132
Appendices
I-1 Details of the 36 additional Crassula helmsii invaded sites from which data were
provided on pH, macronutrient levels, and C. helmsii abundance. These data were used
in Chapter three to compare against collected field survey data.
173
II-1 The mean pH of the water measured in each treatment, at the end of each week of the
experiment. Also indicated is the amount of change in pH away from the required
treatment level, and whether the pH was too high (↑) or too low (↓).
177
III-1 The list of trait categories included within the trait matrix. These were used to
categorise the plant species which were recorded in the survey detailed in Chapter
seven.
178
III-2 A trait matrix listing the specific traits of each plant species which was recorded within
the field survey of Phragmites australis dominated habitat, detailed in Chapter seven.
179

14
Acknowledgements
First and foremost I would like to thank my supervisory team, Anita Diaz, Rudy Gozlan, and
John Day. Thank you for your guidance, expertise, and patience. Special thanks to Ant for
acknowledging that I am not a “typical academic”, which made all the difference.
I am indebted to Bournemouth University, the National Trust, and the Royal Society for the
Protection of Birds for funding this research project.
From Bournemouth University I wish to thank Iain Green for extensive help with laboratory
work, Harry Manley for dPGS instruction, Karen Walmsley for logistics, and the Applied
Sciences administration team, especially Louise Pearson.
I am grateful to the New Forest Park Authority for allowing me to survey ponds in the New
Forest, and to Naomi Ewald for sharing the locations of C. helmsii invaded ponds. Thank you to
Barry Yates for allowing site access at Castle Water and Pett Pools, and for collaborating on the
salinity experiment paper. To Jacqui Miller and Ricky Whelan for site access at RSPB Fen
Drayton, to Chris Hudson for site access at RSPB Ouse Fen, to Roger Beecroft and James Page
for access at Kingfishers Bridge and for allowing many return visits. I would like to thank all of
the members of the reserve team at Studland Nature Reserve (National Trust), particularly
Armand Ian Delbarre, Angela Peters, and Aemelia Roe for their help in initiating the experiment
at Little Sea and for their skippering skills.
Thank you to everybody who has helped me over the years with fieldwork: Clare Davies,
Daniel Doherty, Ella Egberts, Greg Murray, James Page, Vicky Penson, Sui Chian Phang, Ann
Thornton, and Annalea White. I am indebted to everybody who kindly collected data on my
behalf for use in chapter three: Paula Baker, Charlotte Bell, Toby Branston, Vicky Buckel, Paul
Charlton, Andy Coulson-Phillips, Phil Dean, Cath Dewhurst, Amy-Jayne Dutton, Simon Ford,
Leanne Harris, Natalie Holt, Peter Hughes, Sarah Money, Dave Morgan, Edward Nicholson,
Rhian Pierce, Martin Randall, Jon Sibthorp, Katherine Stearne, Andrew Tuddenham, Jenny
Wallace, Michael Walter, Rob West, and Andrew Upton.
I would like to thank Greg Murray for his endless positivity and good humour. Thank you to
Phil and Sue Dean for their unwavering support, not just during this PhD, but during the whole
of my university education. Thank you to the PhD community for the ‘witty’ banter, the
climbing trips, and the occasional half marathon; I wish you all the very best of luck in your
future careers. Finally, thank you to Jemima, Lola, Maurice, and Angus for really not caring
whether or not I finished my thesis.

15
Author’s declaration
1) I confirm that the work presented in this thesis is my own work, with the following
exception: Included in chapter three, are data of C. helmsii invaded ponds which were surveyed
as part of an unconnected research project in which the author of this thesis was not involved
(Sayer et al. 2012; Sayer et al. 2013). Data from this research project were provided for use here
by Carl Sayer. In chapter three data were also voluntarily collected on behalf of the author, by
reserves teams from the RSPB, the National Trust, the Wildlife Trusts (BBOWT), and Natural
England.
2) Chapter four is published in collaboration with John Day, Rudy Gozlan, Iain Green, Barry
Yates, and Anita Diaz.
Dean C., Day J., Gozlan R.E., Green I., Yates B. Diaz A. 2013. Estimating the minimum
salinity level for the control of New Zealand Pygmyweed Crassula helmsii in brackish water
habitats. Conservation Evidence. 10. 89-92.
3) Chapter five is published in collaboration with John Day, Rudy Gozlan, and Anita Diaz.
Dean, C.E. Day, J. Gozlan, R.E. Diaz, A. 2015. Grazing vertebrates promote invasive swamp
stonecrop (Crassula helmsii) abundance. Invasive Plant Science and Management. In Press.
Available from: http://www.wssajournals.org/doi/10.1614/IPSM-D-14-00068.1.

16
1. Main introduction
1.1. Background
What is a non-native invasive plant?
A species is referred to as ‘non-native’ when it is found within a region which is outside the
species’ indigenous range (Hulme et al. 2008; Blackburn et al. 2011). Whilst species
distributions can be naturally wide-ranging, the term non-native implies that the organism
encountered the new region because human activity transported it beyond the geographical and
physical barriers which had historically prevented its spread, for example across expansive
oceans to new continents, and that it would not occur in the new region if humans had not
initially introduced it (Theoharides & Dukes, 2007; Hulme et al. 2008; Blackburn et al. 2011).
In some cases this transportation is intended because the species is a commercially valuable
commodity, however other species are transported unintentionally either as a contaminant of the
commodity or because they are attached to the transport vessel (Hulme et al. 2008). For higher
plants, species are most frequently intentionally transported as commodities, and are grown in
new regions as food crops or ornamental garden plants (Hulme, 2009; Keller et al. 2009).
There are several mechanisms by which non-native plants can be dispersed beyond designated
growing areas such as gardens (Hulme et al. 2008). For higher plants, the pathways often
involve the unintended ‘escape’ of plants or propagules, which can be via natural dispersal
mechanisms like flowing water, or via human activities such as the transport of contaminated
soil, or the disposal of plant material into adjacent wild habitats (Willby, 2007; Hulme et al.
2008; Keller et al. 2009). Of these escaped plants a small sample of propagules may disperse to
areas with abiotic conditions suitable for growth, and of these a small sample may overcome
competition from the resident plant community and attack from natural enemies to grow to full
maturity (Richardson et al. 2000; Henderson et al. 2006; Theoharides & Dukes, 2007). A non-
native plant species which can grow to maturity and produce viable dispersing propagules in the
wild, unaided by human cultivation, is said to be ‘naturalised’ (Richardson et al. 2000;
Henderson et al. 2006; Pyšek & Richardson, 2006). Of the non-native species capable of
becoming naturalised in a new region, a small number are able to successfully disperse to and
become naturalised in multiple locations and at long distances from the source of escape,
leading to the establishment of the species as constituents of the plant community across an
increasingly wide scale. Such species are termed ‘invasive’ (Richardson et al. 2000; Pyšek &
Richardson, 2006), particularly if they characteristically attain high relative abundance in the
areas where they become naturalised (Henderson et al. 2006). Thus there is a distinguishable

17
process which starts with the transport of plants to a new region, and results in a small number
of these species becoming invasive (Richardson et al. 2000). It should be noted however that
this process is not linear; the same species can be transported on multiple occasions, cultivated
in several different areas, and escape into the field many times via different pathways, leading to
multiple independently arising naturalised populations of the non-native species (Davis, 2009).
In this thesis the term ‘non-native invasive plant’ is defined as meaning a non-native plant
species which has naturalised across a wide geographic scale in a non-indigenous region, and
which readily colonises newly encountered suitable habitat, where it can display invasive
growth. The term ‘invasive growth’ is defined in this thesis as meaning the accumulation of
highly abundant and prolifically spreading biomass, within a colonised habitat.
Why do some non-native plant species become invasive?
The identity of species which successfully naturalise and become invasive varies between
regions, and the same species introduced to several separate regions can have differing invasion
success (Heger & Trepl, 2003; Davis, 2009). This variation in the outcomes from non-native
species introductions has prompted research, to try and understand the principle factors
determining which non-natives become invasive, where, and why (Richardson & Pyšek, 2006).
Much of this research has been directed towards understanding how the abiotic environment and
interactions with other organisms, and the specific traits of a non-native plant, combine to
determine whether the plant will become a successful invader within a particular region.
In a heterogeneous landscape, the likelihood of a non-native plant becoming invasive will vary
according to how favourable the abiotic conditions are for the development of prolific growth
and spread (Meekins & McCarthy, 2001; Wang et al. 2006; Cheplick, 2010; David & Menges,
2011; Warren et al. 2011; Kostrakiewicz-Gierałt & Zając, 2014). For instance, Andrews et al.
(2009) suggested that Impatiens glandulifera could become invasive within deciduous
woodland in situations where a fallen tree creates transient conditions of higher light and
nutrient availability. The authors explained that the ability of I. glandulifera seeds to respond
quickly to increased light and nutrient levels, with rapid and extensive germination, meant that
it could out-compete other woodland floor plants under such conditions. Whilst there are
exceptions (Funk & Vitousek, 2007), increased resource availability may be a key
environmental parameter influencing invasion success in a large number of cases. In a review of
published non-native invasive-versus-native comparison studies, Daehler (2003) concluded that
non-native invasive species often performed (in terms of fitness) better than the natives only
under certain growth conditions or at certain life stages; in particular a number of non-native
invasive species performed better with high nutrient levels. Such findings concur with the
‘fluctuating resource availability theory’ (Davis et al. 2000) which proposes that variation in
invasion success is, in general, related to variation in the availability of resources. That the

18
availability of resources is heterogeneous over time and across space, and that the likelihood of
invasion is greatest during those occasions and in those locations where resource availability is
high. In a subsequent assessment of this theory Davis (2009) also points out that not all
resources may have the same impact on invasive success. Thus attention needs to be given to
determining which resource (e.g. particular nutrients, light, water, physical space) is more
limiting to the further spread of a non-native species in a particular situation.
The likelihood of a non-native plant becoming invasive will also vary according to the
outcomes of interactions with other organisms within the new region (Richardson & Pyšek,
2006). Biotic resistance describes the ability of a resident community to prevent or limit the
invasive spread of a non-native (Davis, 2009), and is a topic that has received attention from
researchers; in a meta-analysis Levine et al. (2004) reported that the spread of non-native plants
may be limited, if not prevented, by competition. Other single-study papers however, have
found competition to be a relatively weak factor limiting non-native plants compared to the
abiotic environment (Detheir & Hacker, 2005; Thomsen et al. 2006; Gerhardt & Collinge,
2007), therefore there are still questions regarding the importance of resident plant competition
as a factor mediating invasive success. Contrastingly, invasive success can be facilitated by
interactions with the resident plant community. For example Smith et al. (2004) found that the
seedling establishment of a non-native invasive forb (Melilotus officinalis) was positively
associated with the abundance of a group of dominating grass species. The authors discussed
how this result may reflect a facilitative interaction, in which the dominant grasses shielded the
establishing seedlings from stressful levels of sunlight, and thus reduced mortality in the
establishing non-native. At other trophic levels, it has been suggested that natural enemies such
as herbivores and pathogens could exert biological resistance, if they caused biomass loss or
increased mortality in a non-native plant (Levine et al. 2004). Herbivory experiments have
shown that non-native invasive plants can suffer equal or greater damage than natives or non-
invasive plants (Agrawal & Kotanen, 2003; Stricker & Stiling, 2012; Fan et al. 2013), although
it has been disputed whether such impacts on individual plants, translate to a limitation on the
invasive spread of the population (Maron & Vilà, 2001). Conversely, if the non-native plant
experiences lower levels of attack (Keane & Crawley, 2002; Mitchell & Power, 2003), or is less
affected by damage from natural enemies compared to the resident plant species (Kimball &
Schiffman, 2003; HilleRisLambers et al. 2010), this could facilitate invasive spread. Overall
there are few generalisations that can be made about how interactions with other organisms
affect invasive success. It is therefore valuable to conduct research on particular non-native
species, and particular interspecific interactions, in order to understand the contexts in which
such interactions facilitate or suppress invasive success.
It has been recognised that the traits of a non-native species may or may not be advantageous,
based on the abiotic and biotic conditions of the region (Daehler, 2003; Heger & Trepl, 2003;

19
Pyšek & Richardson, 2006; Davis, 2009). However, there has also been investigation of whether
successful non-native invasive species possess specific traits which made them inherently more
able to overcome the abiotic and biotic barriers lying between escape, naturalisation, and
invasiveness (Kolar & Lodge, 2001; Heger & Trepl, 2003). Indeed from single-system studies,
researchers have identified traits which likely aided in invasive success (Allred et al. 2010;
Marco et al. 2010). For example, Bohl Stricker & Stiling (2013) concluded that the non-native
invasive shrub Eugenia uniflora had become a successful invader in Florida (U.S.) because
more numerous seedling emergence and a taller stem height had allowed it to out-compete both
native and non-invasive non-native species for access to resources during establishment.
Comparisons between closely related invasive and non-invasive species have also identified
traits related to invasiveness within a particular taxon (Grotkopp et al. 2002; Burns, 2004; Keser
et al. 2014; Skálová et al. 2013). At the wider scale, research has been directed towards
determining whether a general suite of traits exists, which could be used to predict invasive
success across a diverse range of non-native invasive taxa (Kolar & Lodge, 2001; Davis, 2009).
For example, analyses of the literature have found that successful non-native invasive plant
species tend to possess traits relating to better competitive performance, such as a high relative
growth rate (van Kleunen et al. 2010; Dawson et al. 2011) or large size and height (Williamson
& Fitter, 1996; van Kleunen et al. 2010), and also traits relating to efficacious dispersal
(Williamson & Fitter, 1996; Kolar & Lodge, 2001; van Kleunen et al. 2010). However, there is
nevertheless considerable variation in the suite of traits possessed by successful plant invaders
(Grime, 2001; Heger & Trepl, 2003), and no particular traits have been discovered which are
essential for invasive success (Heger & Trepl, 2003). It has also been suggested that invasive
success may be enhanced if a non-native plant can exhibit plasticity in its traits, in response to
varying conditions (Daehler, 2003). Indeed, Martina & von Ende (2012) hypothesise that the
non-native invasive grass Phalaris arundinacea has been able to successfully invade habitats
across the majority of the United States, because it displays phenotypic plasticity in its traits
relating to growth and resource allocation, and so can remain competitive under changing
conditions of light, nutrient, and moisture availability. Again however, it has not been possible
to draw general conclusions about the level of such phenotypic plasticity exhibited by
successful non-native invaders; non-native invasive plants do not consistently have higher
phenotypic plasticity than native or non-invasive congeneric species (Palacio-López & Gianoli,
2011), and the possession of phenotypic plasticity may not necessarily be the cause of invasive
success (Davidson et al. 2011).
20
What are the ecological impacts of non-native invasive plants?
A major concern regarding non-native invasive plants is that they may competitively suppress
or exclude native plant species, ultimately causing declines in species diversity (Levine et al.
2003; Vilà et al. 2011). Indeed studies have shown that non-native invasive plants can suppress
native competitors at germination (Greene & Blossey, 2012), during vegetative growth (Murrell
et al. 2011), and at the reproductive stage (Gooden et al. 2014). Furthermore, many non-native
invasive plants attain wide distributions within invaded regions (Stohlgren et al. 2011), which
has lead to concerns that ubiquitous invaders may replace scarce or locally distributed native
species, and thus contribute towards the biotic homogenisation of regions (Schwartz et al. 2006;
Winter et al. 2010; Chen et al. 2013). The initial invasion of one species may also facilitate the
subsequent colonisation of other non-native invasive species (Simberloff & von Holle, 1999).
For example Santos et al. (2011) suggest that the invasion of the non-native aquatic plant
Myriophyllum spicatum into Californian river delta systems created shallower areas of the river
bed which then aided colonisation by the aquatic non-native invasive plant (Egeria densa),
which has now come to dominate this system.
Invasion by a non-native plant, which causes reductions in native plant species, may in turn also
cause reductions in species from other trophic levels if they are dependent on interactions with
the native flora (Levine et al. 2003; Keeler et al. 2006; Gerber et al. 2008). Alternatively, plant
invasion can have a direct impact on non-plant organisms if invasion leads to changes in the
physical or abiotic characteristics of the habitat (Hessen et al. 2004; van der Wal et al. 2008;
Stiers et al. 2011). For example Schultz & Dibble (2012) discuss how the invasion of a non-
native plant to aquatic systems may impact upon fish and invertebrate communities through
changes to the structure and complexity of submerged habitats, impeding foraging and
restricting the movement of larger individuals. Non-native plant invasion can also affect
ecosystem functioning, in cases where the invader possesses significantly different functional
traits to the plants that it replaced (Levine et al. 2003; Simberloff, 2010). For instance if a non-
native invasive plant differs significantly in the amount of available nutrients it contributes to
the system, compared to the previously occupying natives, as a primary producer this can have a
strong effect on the rate of nutrient cycling within an ecosystem (Yelenik et al. 2004; Ashton et
al. 2005; Simberloff, 2011).
Whilst ecosystem impacts caused by the invasions of non-native plants have been detected in
many cases, there is considerable variation in the magnitude of these impacts (Ortega &
Pearson, 2005; Vilà et al. 2011; Pyšek et al. 2012b). For example, a high impact invasion was
reported by Gerber et al. (2008) who found a negative association between the abundance of
non-native invasive Fallopia species, and the diversity of native plant species, which the authors
suggested was in turn driving a decline in the abundance and richness of phytophagous
invertebrates. In contrast a low impact invasion was reported by Meffin et al. (2010), who found

21
no negative association between the abundance of a non-native invasive herb (Hieracium
lepidulum) and native plant species diversity or evenness over a six year study period, instead
finding evidence for coexistence between the non-native invasive and native species. An
important area of research is therefore to investigate why some non-native invasive plants have
greater impacts than others.
Equally, research is needed to understand why there might be variation in the level of impact
caused by the same non-native invasive plant. It has been recognised that the ability of a non-
native invasive species to competitively suppress native species is context dependent (Ortega &
Pearson, 2005; Pyšek et al. 2012b). As such, interactions can be affected by the traits of the non-
native invasive plant relative to the traits of the native plants. This was shown by Hedja et al.
(2009), who assessed 13 different non-native invasive plant species for their impact on species
diversity and evenness, and found that some non-native invasive species reduced diversity and
evenness whilst other non-native invasive species had little or no impact. The authors attributed
these results to the differential ability of the 13 species to overtop competitors, with the largest
impacts seen when the non-native invasive species showed taller, denser growth which could
shade out smaller native species. Competitive interactions can also be mediated by the
characteristics of the habitat, for example a non-native invasive species may have a reduced
competitive ability when abiotic conditions are less favourable for its growth (Price et al. 2011;
Warren et al. 2011; Goldstein & Suding, 2014). Wang et al. (2006) described a gradient of
suitability within a salt marsh habitat, and showed experimentally that a non-native invasive
wetland grass (Spartina alterniflora) had increased dominance at high water levels and high
salinity, whereas this non-native invasive species was dominated by a native species
(Phragmites australis) in drier and less saline conditions. Such context dependence is also
shown for impacts related to ecosystem functioning (Simberloff, 2011). For instance invasion
by a nitrogen fixing species would likely have a smaller impact on nutrient cycling in habitats
which are already naturally high in nitrogen (Levine et al. 2003).
Importantly, such examples demonstrate the overlap between research to understand where a
non-native invasive plant has the greatest impacts, and research to try and understand where a
non-native plant will be most invasive; both are mediated by the abiotic and biotic conditions of
the region. Due to the lack of general patterns, research which focuses on a single non-native
invasive species is still highly valuable, as it is necessary to understand something of the
ecology of an individual species in order to understand why it has become invasive, and
whether its interactions with the native species community are likely to result in negative
ecosystem impacts.

22
Control of non-native invasive plants
In order to ameliorate the negative effects non-native invasive plants can have on ecosystems, it
is often deemed necessary to try and eradicate them or to control their growth. Eradication is
generally considered to be the most desirable outcome (IUCN, 2000), completely removing the
chances that a non-native invasive plant could have future negative ecosystem impacts. There
have been some successful eradication schemes, with greater success seeming to be had from
attempts over small spatial scales (Rejmánek & Pitcairn, 2002; Genovesi, 2005; Simberloff,
2009a), but also many failures (Manchester & Bullock, 2000). Rejmánek & Pitcairn (2002)
discuss that it is often unfeasible to completely eradicate a non-native invasive plant which has
become widespread over large spatial scales (greater than 10,000 hectares), and Davis (2009)
argues that small scale eradication may also be unsuccessful over the longer term, due to the
chances of re-invasion from surviving non-native populations in the surrounding landscape. In
such cases control schemes are often nevertheless implemented, with the aim of limiting the
abundance and spread of non-native invasive plants, in order to reduce their potential to have
negative ecosystem impacts (IUCN, 2000; Simberloff, 2009a).
Methods commonly used for control, focus on the removal of biomass by hand or with
machines, or focus on the degradation of biomass in situ, for example by burning or spraying
with chemical herbicides (Charudattan, 2001; Environment Agency, 2010). The idea behind
such control methods, is that by removing the non-native invasive plant, native plants in the
community will have time to recover and fill the space previously occupied by the invader. In
accordance with this Jäger & Kowarik (2010) reported the successful regeneration of the native
Galapágos plant community following the removal of the non-native invasive tree species
Cinchona pubescens, however the authors noted that some non-native species also benefitted
from the control actions. Importantly, a criticism of such clearance methods is that they
represent a disturbance event which creates conditions of increased resources; such activities
would be likely to favour those species which are best able to take advantage of the available
resources, which may not necessarily be the plant species which existed in the community
before invasion (Hobbs & Huenneke, 1992; Mason & French, 2007). This is illustrated by
Hulme & Bremner (2006) who reported that the plant species which most benefitted from the
removal of the non-native invasive plant Impatiens glandulifera were common ruderal species
which were adapted to colonising areas of recent disturbance. There is a need for more research
which assesses the ability of a non-native invasive plant to recolonise following clearance
control, and compares this to the ability of native species to recolonise. This information could
inform land managers of whether clearance control methods are likely to be an effective way of
removing a particular invader and encouraging the regrowth of desired native plant species.
An alternative to removal and degradation is to limit the abundance of a non-native invasive
plant, and thus its ability to spread, by increasing attack from natural enemies. Classical

23
biological control; introducing into the invaded region, specialist natural enemies from the non-
native invasive species’ indigenous region (Cronk & Fuller, 1995); has been highlighted as an
option for limiting non-native invasive plant abundance (Gassman et al. 2006; Sheppard et al.
2006). Biological control benefits from being a cost-effective and long term option, which if
implemented carefully does not damage co-occurring native plants (Culliney, 2005), and has
shown control efficacy in a number of cases (Van Driesche et al. 2010). That said, limiting a
non-native invasive plant using this method still does not guarantee that the desired native
species will benefit, for instance Stephens et al. (2009) reported that the decline in the non-
native invasive plant, Centaurea diffusa, following the release of a biological control agent lead
to subsequent increases in the abundance of non-native invasive grass species. Biological
control attempts also require considerable preliminary research, due to the necessity of
minimising the risk that the control agent could also attack non-target native plants (Barrat et al.
2010). Apart from the use of specialist natural enemies (classical biocontrol), it has been
discussed how biotic resistance to non-native invasive plants could be strengthened in habitats
by increasing grazing pressure from generalist herbivores (Popay & Field, 1996), or by
encouraging the growth of strong native plant competitors (DeWine & Cooper, 2010; Denton,
2013). It has been emphasised here, how the outcomes of interactions between non-native plants
and resident plants and herbivores are highly context dependent; to effectively use biotic
resistance to control a non-native invasive plant, research would need to be conducted to assess
whether particular plant or herbivore species interact with the the non-native in a way to limit its
abundance, rather than facilitate its abundance. It has also been suggested that a non-native
invasive plant could be limited or eradicated if abiotic conditions were made less suitable for its
growth (Davis, 2009). For instance, Price et al. (2011) discussed how land management to
encourage more frequent and persistent flooding, could be used to control the abundance of the
non-native invasive grass Phyla canescens within a study region, because the species is
competitively subordinate to the native grass Paspalum distichum, under flooded conditions.
Further research to understand the environmental tolerances of individual non-native invasive
plants is therefore another valueable line of further inquiry, and could be used to aid in the
design of successful control attempts.
Summary of research themes
Understanding why some non-native plants produce highly invasive growth is a fundamental
question in invasive species ecology (Elton, 1958; Cronk & Fuller, 1995), and provides valuable
insights regarding the ability of non-native invasive plant species to negatively impact invaded
ecosystems (Levine et al. 2003). Making a contribution to knowledge in this area requires
investigation of, how the characteristics of the habitat influence invasive growth (Cheplick,
2010; Jauni & Hyvönen, 2012), how resistance from the native species assemblage mediates

24
invasive growth (Maron & Vilà, 2001; Corbin & D’Antonio, 2004), whether invasive growth is
associated with specific changes in the habitat conditions or species assemblage (Davis et al.
2000; MacDougall & Turkington, 2005; Baiser et al. 2008), and how invasive growth is
influenced by the specific traits of the non-native invader (Hejda et al. 2009; Marco et al. 2010;
Jauni & Hyvönen, 2012).
Understanding why a non-native plant produces invasive growth can be of utility when making
predictions regarding where a non-native plant is likely to be most invasive and dominating
(David & Menges, 2011; Warren et al. 2011). Determining where a non-native plant is most
likely to become invasive and dominating, allows management resources to be allocated to
situations where preventing invasion or limiting abundance is most needed in order to limit the
negative impacts of invasions (D’Antonio et al. 2004).
The research presented in thesis focuses on the non-native invasive plant species Crassula
helmsii. Using this species, questions are explored which relate to understanding why a non-
native plant species can become invasive, what the ecological impacts of invasion are, and how
such information can be used to design effective future control schemes.

25
1.2. Study species: Crassula helmsii (T. Kirk) Cockayne
Morphology and growth habit
Crassula helmsii is a perennial herb which is adapted to grow within water or in wet areas
adjacent to water. This species characteristically produces dense mats of low-growing
vegetation cover. It has round stems which grow erect or prostrate, and which are simple to
twice-branched. The stems can vary in maximum length from 100 mm to 1.3 m, depending on
the depth of water. The stalkless leaves grow in opposite pairs along the stem and are linear to
lanceolate in shape, growing to approximately 20 mm long and 2 mm wide. The flowers are
produced singly on stalks from the leaf axils and are up to 4 mm in diameter, with four petals
arranged in a star shape which are white to pale pink in colour (Laundon, 1961; Dawson &
Warman, 1987; Sainty & Jacobs, 2003).
The growth form of C. helmsii varies depending on the depth of water in which it occurs. This
species is plastic in its growth form, allowing it to respond to changes in water levels (EPPO,
2007):
Marginal growth: When occurring on land around the margins of water C. helmsii has a fleshy,
succulent appearance. It produces prostrate and creeping stems which spread out across the
ground, but can also form dense stands of erect stems up to 100 mm tall (Laundon, 1961;
Dawson & Warman, 1987; CAPM, 2004; EPPO, 2007) (Fig. 1).
Emergent growth: When growing in shallow water (less than 0.6 m), C. helmsii grows up out of
the water on erect stems, which it can produce in very dense stands (Laundon, 1961; Dawson &
Warman, 1987; EPPO, 2007).
Submerged growth: In deeper water C. helmsii grows from a basal rosette which is rooted to the
bottom substrate. It produces longer stems, and has narrow non-fleshy leaves which are more
sparsely located along the stem. Crassula helmsii does not produce flowers on submerged stems
(Laundon, 1961; Dawson & Warman, 1987; EPPO, 2007) (Fig. 1).
In all three growth forms C. helmsii is an evergreen plant, and experiences little die-back or
dormancy during the winter (Preston & Croft, 1997; CAPM, 2004). However, it may be more
resilient to winter conditions when submerged (Dawson & Warman, 1987). Crassula helmsii
uses Crassulacean Acid Metabolism (CAM); a photosynthetic pathway in which carbon dioxide
is obtained during the night and stored as malic acid, for use in photosynthesis during the day. It
is hypothesised that CAM may provide C. helmsii with a competitive advantage in conditions
where carbon availability limits photosynthesis (Newman & Raven, 1995; Klavsen & Maberly,
2009).

26
Figure 1. The appearance of the leaves of Crassula helmsii when the plant is growing terrestrially along
the margins of waterbodies (top), compared to the appearance of the leaves when C. helmsii is growing
submerged within water (bottom).

27
Reproduction
In its invaded range C. helmsii spreads clonally via above-ground mechanisms. Stands of C.
helmsii vegetation increase in size by creeping stems which grow out into adjacent space and
establish by producing roots and shoots from the stem nodes (Laundon, 1961; Hill et al. 2004).
Dispersal over longer distances occurs by the transport of vegetative fragments. These
fragments can be created when established stems of C. helmsii are broken up in a disturbance
event (Dawson & Warman, 1987; CAPM, 2004; Hill et al. 2004; EPPO, 2007), and this species
can produce small apical stem fragments which detach from the main stems in autumn (Preston
& Croft, 1997; EPPO, 2007). It has been shown that C. helmsii can grow and establish from
fragments of stem which contain just a single node, but not from single leaves, and that
regeneration from shorter stem fragments may show particularly vigorous regeneration (Dawson
& Warman, 1987; Hussner, 2009).
In southern England in August and September, C. helmsii produces flowers on emergent and
terrestrially growing stems, which have a sweet scent (Dawson & Warman, 1987) and attract
flying insects (personal observation). It is generally considered that C. helmsii does not
reproduce sexually in the invaded range, because the seeds that it produces are non-viable
(Dawson & Warman, 1987). Denys et al. (2014) report that seeds from C. helmsii growing wild
in Belgium showed some viability however; in laboratory controlled germination studies where
300 flowers (maximum potential of two to five seeds per flower) were planted in shallow sandy
substrate, 21 plants developed.
Habitat
Crassula helmsii is native to southern Australia and New Zealand. In its native range it is
associated with swampy conditions, growing within and around the margins of still and slow
flowing waterbodies, inland and in coastal habitats (Laundon, 1961; Dawson, 1989; Sainty &
Jacobs, 2003).
Similarly in its invaded range C. helmsii has been recorded in ponds, flooded sand and gravel
pits, lakes, reservoirs, marl pits, dune slacks, canals, ditches, fens, marshes, peat bogs, coastal
lagoons and grazing marsh (Preston & Croft, 1997; EPPO, 2007; Charlton et al. 2010; personal
observations). In these habitats C. helmsii has been found growing on damp ground along the
margins of waterbodies, and within water down to depths of approximately 3 m. This species
can tolerate water chemistry from acid to alkaline conditions and from low to high nutrient
levels. It mainly inhabits freshwater but does grow in brackish conditions (Preston & Croft,
1997; EPPO, 2007), and is also tolerant to high concentrations of copper (Küpper et al. 2009).
Crassula helmsii has not colonised fast-flowing waterbodies such as rivers (EPPO, 2007), and is

28
generally absent from locations where the substrate is exposed to frequent wave-action (Dawson
& Warman, 1987; Preston & Croft, 1997; personal observations).
Invasion history
In Britain C. helmsii is naturalised across much of England and Wales, and has been recorded in
scattered locations in Scotland and Northern Ireland (Fig. 2). This non-native plant has also
invaded a number of other countries in Western Europe (EPPO, 2007; Minchin, 2008; van
Valkenburg & de Hoop, 2013).
The population of C. helmsii in Britain originated from Tasmania (EPPO, 2007), and was first
introduced in the 1910s (Dawson & Warman, 1987; EPPO, 2007). An early account of C.
helmsii in Britain by Laundon (1961) describes how a plant retailer based in Enfield, Middlesex
had been selling this species since 1927 as an oxygenating aquatic for use in outdoor ponds.
Laundon (1961) also described several outdoor ponds in south east England where C. helmsii
had naturalised. Dawson & Warman (1987) comment that C. helmsii was available to buy from
many other plant retailers across England during the 1970s and 80s, and in fact legislation
which banned the sale of C. helmsii in England and Wales did not come into force until April
2014 (Plantlife, 2014). Thus the trade of this species as an ornamental pond plant has likely
greatly aided its spread across Britain (Keller et al. 2009), and the release of vegetation from
garden ponds into the countryside may have facilitated the escape of this species into wetland
habitats (Willby, 2007). The spread of C. helmsii in the countryside may have been further
aided by the accidental transferral of vegetative fragments between waterbodies; it is thought
that this transferral has been largely due to human activities, for example using the same fishing,
pond dipping, or management equipment in many different waterbodies (Dawson & Warman,
1987; EPPO, 2007; Burchnall, 2013). It has also been speculated that large grazing animals
could transfer fragments over short distances on their hooves (Dawson & Warman, 1987; Ewald
et al. 2010), and that fragments could be spread over longer distances by waterfowl. Denys et al
(2014) showed experimentally that it is possible for a vegetative fragment of C. helmsii to
survive and grow after passing through the gut of a waterfowl, though such an event may
happen only rarely.

29
© Crown copyright and database rights 2011 Ordinance Survey [100017955]
Figure 2. The distribution of Crassula helmsii in Britain, shown at a resolution of 10 km squares, and
containing data from records up to 2014. Data courtesy of the NBN Gateway with thanks to all the data
contributors: https://data.nbn.org.uk/Taxa/NBNSYS0000004639/Grid_Map (accessed 11th March 2014).
The NBN and its data contributors bear no responsibility for the further analysis or interpretation of this
material, data and/or information.
30
Impacts of invasion
Crassula helmsii can form extensive mats of vegetation across the marginal and emergent zones
of waterbodies; a trait which is characteristic of the species both in its native and invaded ranges
(Dawson, 1989; Sainty & Jacobs, 2003). In some locations these mats grow to become
extremely dense, with few or no other species occurring amongst the invasive vegetation. This
can change the appearance of the habitat, especially when C. helmsii grows along the margins of
waterbodies (Fig. 3). It is these dense monospecific mats which are the main basis for concern
regarding this species in the invaded range (Dawson & Warman, 1987).
There are concerns that such vigorous growth may be indicative of a competitively dominant
species, and that the dense mats of C. helmsii can smother small plants and suppress their
growth (Dawson & Warman, 1987). Conservationists suggest that C. helmsii invasion could
reduce the abundance of native vegetation, and could potentially exclude specific wetland
species (Bridge, 2005; Gomes, 2005; Wilton-Jones, 2005), thus reducing diversity. For
example, highlighted as vulnerable are Baldellia ranunculoides (Yates, B. personal
communication) and Teucrium scordium (Page, J. personal communication), which are classed
as ‘near threatened’ and ‘endangered’ respectively, according to the IUCN Red List definition
(Cheffings & Farrell, 2005). By extension there are concerns that the development of dense C.
helmsii mats could negatively affect other organisms in the ecosystem; by displacing plant
species which other organisms rely on, by reducing the availability of bare ground and open
water, or by locally depleting dissolved oxygen levels in waterbodies (Watson, 1999; CAPM,
2004; Langdon et al. 2004; Foster, 2010).
Anecdotal accounts of C. helmsii suppressing native flora exist in the literature (Dawson &
Warman, 1987; Watson, 1999), however quantitative studies of the impact of C. helmsii on
native flora are less common. In a laboratory experiment Langdon et al. (2004) measured the
germination success of 11 native aquatic plant species, with and without a 1 mm thick cover of
C. helmsii vegetation. The authors found that the germination success of six species was
significantly reduced under the C. helmsii cover, and discuss that this may be indicative of the
effect of C. helmsii cover on the germination success of native species in the field. However in
the same paper, Langdon et al. (2004) found no significant decline in plant species richness in
C. helmsii invaded ponds over a four to seven year period, although results were not provided
for changes in species abundance over that time, and another germination experiment did not
find a significant difference in the number of species in the seedbank between C. helmsii
invaded and non-invaded sites.

31
Figure 3. The bright green patches in the photograph are dense mats of Crassula helmsii, which grows
extensively along the exposed muddy banks at Castle Water, in Rye Harbour nature reserve, East Sussex
(© Barry Yates).
Control
Crassula helmsii is naturalised and widespread to the extent that its total eradication in Britain is
probably unfeasible (Rejmánek & Pitcairn, 2002) although there is evidence that C. helmsii can
be eradicated from individual sites (Charlton et al. 2010). Because C. helmsii is classed as a
non-native invasive species, land managers are encouraged to take action to control its
abundance and spread (Environment Agency, 2010). Methods which are used for control
include; dredging the marginal and emergent zone and removing subsequent dead vegetation
(Environment Agency, 2010), covering the plant with black plastic for three to six months to
prevent access to light (CAPM, 2004; Wilton-Jones, 2005; Environment Agency, 2010; van
Valkenburg & de Hoop, 2013), spraying the vegetation with the herbicide glyphosate (Dawson,
1996; Bridge, 2005; Gomes, 2005; Environment Agency, 2010), and spraying the vegetation
with ‘hot foam’ to kill C. helmsii through heat stress (Bridge, 2005; Pearson, 2012). These
control attempts often only produce reductions in C. helmsii abundance however, leaving living
C. helmsii vegetation which can re-colonise the habitat (Bridge, 2005; Gomes, 2005; Wilton-
Jones, 2005; Denton, 2013; van Valkenburg & de Hoop, 2013). Indeed it may be valuable to
consider whether the clonal traits of C. helmsii; creeping horizontal growth and the ability to
regenerate from small stem fragments (Dawson & Warman, 1987; Hussner, 2009); make this
species particularly well adapted for recovery after clearance control.

32
Greater success had been achieved with salt water inundation; C. helmsii was eradicated from
120 ha of coastal grazing marsh by draining the brackish water, allowing seawater to flood the
habitat, and then keeping it inundated for 12 months (Charlton et al. 2010). This method was
feasible because the site had near access to sea water, and such actions could prove logistically
difficult to implement at sites further from the coast.
The above described options for controlling C. helmsii are all non-specific, meaning that any
native plants and animals living in-amongst the invasive vegetation would also be subject to the
effects of the control treatment. In this way non-specific control methods can be problematic, if
negative impacts on non-target species hamper the recovery of the pre-invasion native species
assemblage (Matarczyk et al. 2002; Kettenring & Reinhardt Adams, 2011). Classical biological
control has been suggested as an alternative method for reducing the abundance of C. helmsii in
the invaded range (CABI, 2013), and the introduction of a specialist natural enemy would
ideally minimise the impacts of control on the native plant community (Cronk & Fuller, 1995).
Research and development is on-going in this area (CABI, 2013), and so it is not yet known
whether the release of biocontrol agent could reduce the abundance of C. helmsii. It has been
noted that large vertebrates such as ponies (Ewald et al. 2010; personal observations), sheep and
wildfowl (Cadbury, J. personal communication) may graze patches of C. helmsii, and therefore
it may be useful to investigate whether these generalist herbivores could be an effective method
of limiting C. helmsii abundance.
Why study Crassula helmsii?
Concerns regarding C. helmsii in the invaded range stem from its ability to form dense
monospecific mats. However, such mats are not always observed and C. helmsii can be found in
the field growing in a mixed stand alongside native species (Fig. 4). Further, it is not clear
whether the development of dense C. helmsii mats is associated with synchronous changes in
the resident plant community, such as declines in species diversity. More research on this
species is required in order to better understand when it develops dense monospecific mats and
why, and furthermore, whether the spread of dense C. helmsii cover can result in the
displacement of native plants. Attempts to control C. helmsii have rarely been successful long-
term; a greater knowledge of the ecology of this species may help to identify ways that the
abiotic or biotic environment could be manipulated in order to maintain C. helmsii at lower
abundances. Furthermore, if the factors which contribute towards the formation of C. helmsii
mats are understood, specific habitats or nature reserves can be assessed for their vulnerability
to C. helmsii domination, and control efforts can be targeted towards those sites or parts of sites,
where control is most critical for suppressing this non-native invasive plant.

33
Figure 4. Crassula helmsii occurring as a dense and extensive monospecific mat of vegetation (top), and
C. helmsii growing in a mixed stand alongside native species (bottom).
C. helmsii

34
1.3. Research aim and objectives
The main aim of this thesis is to better understand the mechanisms which allow C. helmsii to
develop dense, dominating vegetative mats. Towards this aim, aspects of the ecology of C.
helmsii were investigated which were hypothesised to affect its growth rate and abundance;
namely its response to abiotic variation, and its interactions with other plant species and with
generalist herbivores. As such, this research offers an opportunity to assess how C. helmsii may
have an impact on the ecosystems that it invades via its impact on native flora, and provides
information which may be of utility when designing control schemes to limit the prolific growth
of C. helmsii.
Within the main aim, five objectives were addressed which are presented in the form of research
questions:
1. How well does abiotic variation predict variation in C. helmsii abundance in the field?
Field data were analysed to assess whether C. helmsii abundance varied in relation to pH,
nutrient levels, water depth, and shade. This objective therefore, contributed to the overall aim
by providing information on whether high C. helmsii abundance was associated with particular
abiotic conditions.
2. What is the estimated minimum salinity level for the control of C. helmsii in brackish water
habitats?
A mesocosm experiment was conducted to investigate what level of salinity was required to kill
C. helmsii. Within the experiment, the growth rate of C. helmsii was assessed when exposed to
levels of salinity from 0 to 8 parts per thousand. Thus this objective contributed to the overall
aim because information was obtained on how C. helmsii growth, and thus the development of
vegetative mats, could be limited by variation in the abiotic environment (salinity).
3. What is the effect of vertebrate grazing disturbance on the abundance of C. helmsii within a
wetland plant community?
Grazing exclosures were set up within a heavily C. helmsii invaded nature reserve, in order to
ascertain whether the presence of large vertebrate herbivores affected the abundance of C.
helmsii. As such, this objective contributed to the overall aim by assessing whether interactions
with generalist herbivores could mediate the abundance of C. helmsii.

35
4. Is available bare ground an important pre-requisite to high C. helmsii abundance?
Field and common garden experiments were conducted which assessed how well C. helmsii
could compete for available bare ground, compared to native plant species occupying a similar
niche. This objective contributed to the overall aim by considering how C. helmsii growth rate
and abundance could be mediated, by the presence or absence of adjacently spreading native
plants. This objective also provided information on whether C. helmsii could have an impact on
invaded ecosystems by out-competing individual native plant species.
5. Can the invasion of C. helmsii negatively affect the plant community in a Phragmites
australis dominated fen habitat?
Field survey data were collected of C. helmsii abundance, P. australis abundance, and the
abundance and diversity of plant species in the co-occurring community. These data were
analysed to ascertain whether C. helmsii was negatively correlated with other plant community
variables; a pattern indicating that an increase in C. helmsii abundance was associated with the
loss of species from the resident plant community. This objective contributed to the overall aim
by looking for evidence that C. helmsii invasion could increase in abundance by displacing
native species. This objective also offered an assessment of the impact of C. helmsii invasion on
native plant diversity.

36
2. General methods and materials
2.1. Field surveys
This section describes the methodology used in a field survey of C. helmsii invaded habitat, and
gives brief descriptions of each of the sites visited for this survey. The data gathered from this
field survey are presented in chapters three and seven, and one site described here was also
referred to in chapter five.
2.1.1. Sampling technique
Survey data were gathered from 94 sampling locations. These sampling locations occurred
within 28 separate water bodies that were spread across five geographically separate survey
sites (nature reserves), all located in southern and eastern England (Fig 6.). To reduce the
magnitude to which dispersal could influence the presence or absence of C. helmsii, all survey
sites were selected on the basis that C. helmsii was known to occur there. These sites were:
Castle Water, Fen Drayton, Kingfishers Bridge, The New Forest (ponds), and Ouse Fen (see
section 2.1.2. below for site descriptions).
The sites varied considerably in their overall size, and in the size and number of waterbodies
which they encompassed, and so a stratified design was used which ensured that sampling effort
remained constant across sites. This stratified design determined one sampling location per
hectare, which consisted of a 1m2 quadrat, with a minimum distance of 25m between individual
sampling locations. In order to ensure that the same visual method of vegetation cover
estimation could be used in all cases, surveying was also restricted to the margins and shallows
(0 - 50cm depth water) of waterbodies. This meant that the number of samples at each site was
dependent on the total area of marginal habitat per reserve (Table 2), and that large waterbodies
were sampled at many points along the margins whereas small ponds had just one sample point.
To minimise bias, the location of each 1m2 quadrat was selected prior to surveying using the
following approach. First, a satellite photograph was obtained of each waterbody from Google
Earth (© Google, 2014) or from the online resource UK Grid Reference Finder
(http://gridreferencefinder.com/). Then a to-scale 100m2 grid was placed over these maps and
each grid square which overlaid a section of marginal habitat was marked. For each of these
grid squares a vector was generated using the random number formula in Excel 2010 (©
Microsoft, 2010) to create X Y coordinates, which corresponded to the horizontal and vertical
axis of the grid square when measured in millimetres. The patch of marginal habitat on the

37
photograph in closest proximity to the vector was selected as the sample point. Ten figure OS
grid references were obtained for each of the selected locations using UK Grid Reference
Finder. This allowed sample points to be navigated to in the field using a Garmin model GPS
device (± 5m accuracy).
2.1.2. Survey sites
Castle Water
Castle Water is a wetland site located within Rye Harbour Nature Reserve, East Sussex (OS
grid ref: TQ 926 187), which is owned by the Sussex Wildlife Trust. Castle Water is a
freshwater system, with expanses of open water and reedbeds. Through the reedbeds also run
water channels, which are bordered by exposed (not submerged) silty banks and margins of silt
and gravel. Crassula helmsii was first found at the site in 2007 (Yates, B. personal
communication). Sample locations for the described field survey (chapters three and seven)
were selected from within the reedbed and water channel habitat, which covered an area of c. 12
ha. In 2012 when surveying was conducted, C. helmsii was growing extensively as a dense,
almost monospecific marginal mat, across the exposed silty banks. Crassula helmsii was also
growing along the silt and gravel margins, immediately adjacently to the reedbeds, and in
amongst the reeds.
Fen Drayton
RSPB Fen Drayton Lakes (hereafter ‘Fen Drayton’) is a nature reserve in Cambridgeshire (OS
grid ref: TL 352 680), which is owned by the Royal Society for the Protection of Birds
(hereafter ‘RPSB’). The nature reserve contains a series of lakes which have a varied marginal
habitat, consisting of dense reedbeds, over hanging stands of willow, and more open patches
with a shorter vegetation structure. Crassula helmsii is known to have been present at the site
since at least 2008 (Shanklin, J. personal communication). Field survey sample locations were
selected from an area of c. 62 ha, which encompassed two of the lakes. In 2012 C. helmsii was
only found within the more open patches of marginal habitat, where it occurred as a mixed stand
alongside other plant species.
Kingfishers Bridge
Kingfishers Bridge is a privately owned nature reserve in Cambridgeshire (OS grid ref: TL 540
732). This nature reserve contains a lake with a variable marginal habitat of reedbeds and open
patches of shorter vegetation, and a water meadow with drainage ditches. Crassula helmsii was
first detected in 2007, along the drawdown zone of the lake (Cadbury, J. personal

38
communication). Field survey sampling locations were selected along the margins of the lake,
which covered an area of c. 9 ha. In 2012 C. helmsii occurred within the open vegetation along
the lake margins at high abundance, and at lower abundance along the lake margins vegetated
with reedbeds.
The New Forest (ponds)
The New Forest is a National Park in Hampshire, which is managed by the New Forest National
Park Authority. The park encompasses broadleaf and coniferous woodland, dry heathland,
grassland, wet heathland, and bog. Within these broad habitats are numerous ponds, some of
which have been invaded by C. helmsii. This species was first recorded in The New Forest in
the mid-1970s (Rand & Chatters, 2010). Fifteen separate C. helmsii invaded ponds were visited
for the field survey (Table 1; Fig. 5), the locations of which had been provided by Dr Naomi
Ewald (Freshwater Habitats Trust). The ponds included in the survey occurred within the
grassland and wet heathland, and many were in close proximity to development such as roads,
car parks, and houses. The ponds ranged from a seasonally flooded area of c. 60 m2 to a large
permanent pond of c. 0.5 ha, and were vegetated with low-growing emergent and marginal plant
species. In 2012 there was considerable variation in the abundance of C. helmsii within these 15
ponds.
Table 1. The Ordinance Survey grid references of the 15 Crassula helmsii invaded ponds which were
surveyed within The New Forest, Hampshire.
Pond Grid reference
1 SU 23457 11911
2 SU 19920 02141
3 SU 17796 12882
4 SU 40546 04943
5 SU 37393 01755
6 SU 36964 01677
7 SU 36724 01706
8 SU 36839 01343
9 SU 30616 03497
10 SU 21824 03589
11 SZ 23532 98715
12 SZ 23903 98608
13 SZ 36808 97544
14 SZ 33413 98547
15 SZ 33735 98939

39
Figure 5. A satellite image of the New Forest, Hampshire, showing the spatial distribution of the 15
Crassula helmsii invaded ponds that were surveyed here. Image © 2015 Getmapping plc, © 2015
Infoterra Ltd & Bluesky, image © 2015 The Geoinformation Group.
Ouse Fen
RSPB Ouse Fen (hereafter ‘Ouse Fen’) is a RSPB owned nature reserve in Cambridgeshire (OS
grid ref: TL 348 729). It consists of disused sand and gravel quarry pits, which are being
converted into a series of five lakes, with open-water and reedbed habitat, surrounded by
grassland. Crassula helmsii was first found at the site in 2007 (Hudson, C. personal
communication). Field survey sample locations were selected from one lake of c. 17 ha, which
was the first to be converted in 2004 (Hudson, C. personal communication). This lake is
bordered by extensive reedbeds, with a few more open patches of shorter vegetation. In 2012
when surveying was conducted, C. helmsii was found growing abundantly through the reedbeds,
as well as in more open patches.
10 km
N

40
Table 2. The number of individual sample locations (1m2 quadrats) visited at each survey site, and the
number of non connected water bodies which this sampling effort encompassed.
Survey site No. of locations No. of waterbodies
Castle Water 14 3
Fen Drayton 22 2
Kingfishers Bridge 9 1
The New Forest 29 15
Ouse Fen 20 1
Figure 6. The geographical distribution of the five Crassula helmsii invaded sites (nature reserves),
where surveying was carried out. These sites were: Castle Water, East Sussex; Fen Drayton,
Cambridgeshire; Kingfishers Bridge, Cambridgeshire; The New Forest (ponds), Hampshire; and Ouse
Fen, Cambridgeshire.
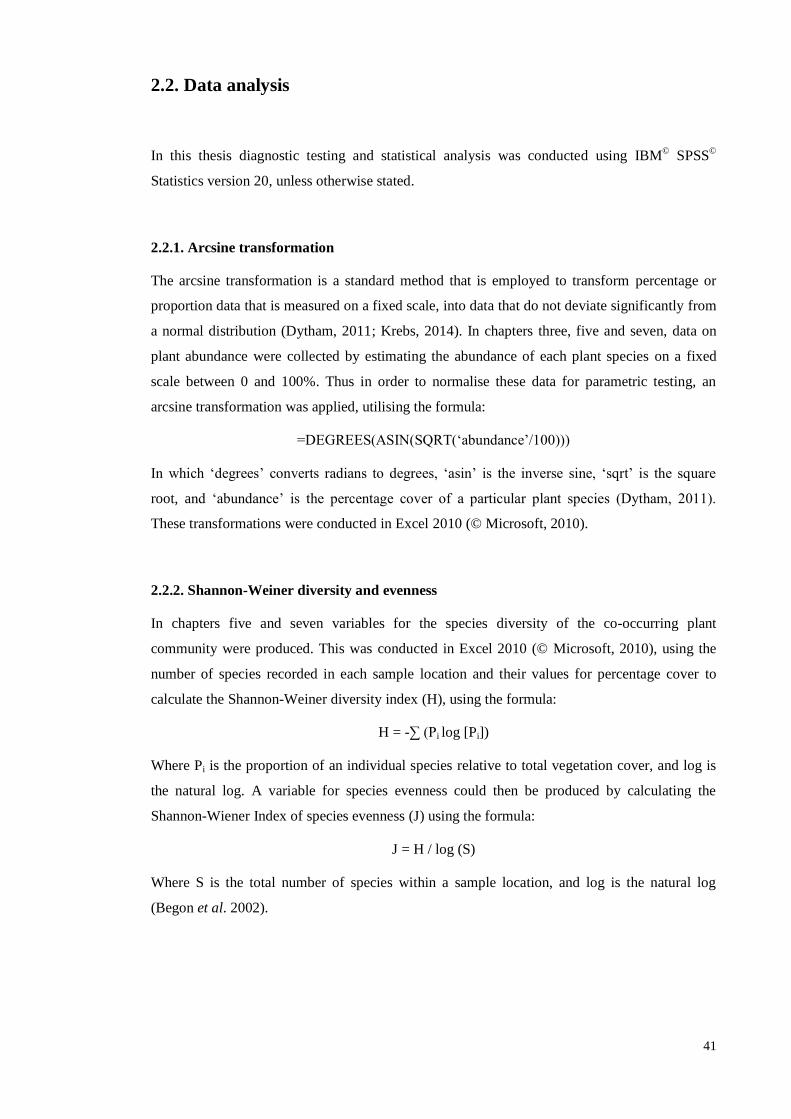
41
2.2. Data analysis
In this thesis diagnostic testing and statistical analysis was conducted using IBM© SPSS
©
Statistics version 20, unless otherwise stated.
2.2.1. Arcsine transformation
The arcsine transformation is a standard method that is employed to transform percentage or
proportion data that is measured on a fixed scale, into data that do not deviate significantly from
a normal distribution (Dytham, 2011; Krebs, 2014). In chapters three, five and seven, data on
plant abundance were collected by estimating the abundance of each plant species on a fixed
scale between 0 and 100%. Thus in order to normalise these data for parametric testing, an
arcsine transformation was applied, utilising the formula:
=DEGREES(ASIN(SQRT(‘abundance’/100)))
In which ‘degrees’ converts radians to degrees, ‘asin’ is the inverse sine, ‘sqrt’ is the square
root, and ‘abundance’ is the percentage cover of a particular plant species (Dytham, 2011).
These transformations were conducted in Excel 2010 (© Microsoft, 2010).
2.2.2. Shannon-Weiner diversity and evenness
In chapters five and seven variables for the species diversity of the co-occurring plant
community were produced. This was conducted in Excel 2010 (© Microsoft, 2010), using the
number of species recorded in each sample location and their values for percentage cover to
calculate the Shannon-Weiner diversity index (H), using the formula:
H = -∑ (Pi log [Pi])
Where Pi is the proportion of an individual species relative to total vegetation cover, and log is
the natural log. A variable for species evenness could then be produced by calculating the
Shannon-Wiener Index of species evenness (J) using the formula:
J = H / log (S)
Where S is the total number of species within a sample location, and log is the natural log
(Begon et al. 2002).

42
3. How well does abiotic variation predict variation in C. helmsii
abundance in the field?
3.1. Introduction
The habitat preferences of a species may be determined by using niche theory to interpret its
response to environmental gradients (Hirzel & Le Lay, 2008). Niche theory predicts that the
margins of a species’ range represent the limits of its tolerance to certain environmental
parameters, whilst the theoretical centre is characterised by optimum environmental conditions
for survival and growth. As such, high abundance and vigour may be interpreted as a
characteristic of plants growing within optimal conditions, whilst reduced abundance and vigour
represent sub-optimal conditions (Leibold, 1995). This distinction between optimal and sub-
optimal conditions is important as the outcome and strength of biotic interactions may vary
according to the favourability of the conditions relative to different species’ preferences
(Silvertown, 2004).
Research into habitat preferences has a useful application in the study of non-native invasive
plants, as it generates information about where species colonise and what limits their spread
(Willis & Hulme, 2002; Jarnevich & Reynolds, 2011). For example Truscott et al. (2008) were
able to define habitat patches in which the non-native invasive aquatic plant species Mimulus
guttatus occurred, based on the abiotic parameters of available sediment and light, and stream
water depth. Investigations of preference to environmental parameters therefore help to define
the overall distribution of a non-native invasive plant (Thuiller et al. 2005; Albright et al. 2010),
and this information can be used to make predictions of its potential to spread further across
landscapes (Jarnevich & Reynolds, 2011; Gassó et al. 2009). A stronger synthesis between
niche theory and investigations of non-native invasive plant spread may be achieved by
inclusion of data regarding the optimal and sub-optimal environmental conditions within the
habitable range of a species (Warren et al. 2011). Information can be obtained not only on
where a non-native invasive plant species can grow but also where it grows best, and in this way
key environmental gradients can be identified which affect the abundance as well as the
presence or absence of the species (Meekins & McCarthy, 2001; Kilroy et al. 2008; Cheplick,
2010; David & Menges, 2011; Kostrakiewicz-Gierałt & Zając, 2014). Knowledge of the habitat
optima of a non-native invasive plant species could therefore also be used to identify specific
areas in which it may have a greater impact on the ecosystem (Huston, 2004; Wang et al. 2006;
Davis, 2009).

43
Published information on the habitat range of C. helmsii documents a wide abiotic tolerance; C.
helmsii can occur in acidic and alkaline sites, (Preston & Croft, 1997; EPPO, 2007; Minchin,
2008), in high and low nutrient conditions, (Preston & Croft, 1997), in sunlight and in shade
(Hill et al. 2004), and can grow terrestrially and in water several metres deep (Preston & Croft,
1997; EPPO, 2007; Minchin, 2008). It is less clear from these sources whether there are known
optima within this range, which are particularly favourable for C. helmsii growth. However,
sources suggest that C. helmsii is more typical of higher nutrient conditions (Hill et al. 2004;
Minchin, 2008), and a laboratory growth experiment found that the relative growth rate of C.
helmsii increased with increasing soil nutrient levels (Hussner, 2009).
More research is required to understand how strongly C. helmsii abundance in the field is
related to pH, nutrient levels, water depth, and shade. At present it is not clear whether optimal
conditions of these abiotic variables are important in facilitating the growth of dense, dominant
mats of C. helmsii, or whether C. helmsii can grow equally vigorously under most conditions.
As such it is not known to what extent different components of the abiotic habitat are applicable
when trying to predict how vulnerable a site is to C. helmsii domination. This chapter reports on
a detailed field survey of the pH, macronutrient levels, water depth, and shading levels across
five C. helmsii invaded sites in southern England. Analysis was conducted to test how much
variation in C. helmsii abundance, was related to variation in these abiotic conditions.

44
3.2. Methods and materials
3.2.1. Field survey
A field survey was conducted between June 13th and September 6
th 2012, in which 94 1m
2
sampling locations were visited at five geographically separate sites; Castle Water (E. Sussex),
Fen Drayton (Cambridge), Kingfishers Bridge (Cambridge), The New Forest ponds
(Hampshire), and Ouse Fen (Cambridge). See Chapter two, section 2.1 for site descriptions and
an explanation of how the sampling locations were selected. The rationale for choosing to
collect data from five geographically separate sites was that it allowed a greater range of abiotic
variation to be encompassed within the field survey, than would have been possible if just one
site had been surveyed more intensively. Within each sampling location, the abundance of C.
helmsii was recorded as an estimate of percentage cover, and the following measurements were
taken:
Water pH. This was measured using a Hanna pHep® hand held probe (accuracy at 20°C ± 0.1
pH) calibrated using pH 7.01 and pH 4.01 buffer solutions. Readings were taken by immersing
the probe within water and waiting for the digital reading to stabilise. Three readings were taken
at random positions within the quadrat area, and from this the mean pH value was calculated.
Data on pH were obtained from 93 quadrats out of a total of 94 quadrats, as there was no water
present in one quadrat at Ouse Fen.
Water samples. One water sample per quadrat was collected and stored in clean 60ml plastic
sample pots for subsequent laboratory analysis of available nitrogen and total phosphorus
concentration. Water was taken from just below the surface to avoid sediment disturbance
during collection. In order to minimise post-collection changes due to chemical or biological
reactions, all samples were kept in coolbags in the field and transferred as soon as possible
(within 2 - 9 hours) to freezer storage (Radojevid & Bashkin, 2006). Water samples were
obtained from 93 quadrats out of a total of 94 quadrats, as there was no water present in one
quadrat at Ouse Fen.
Water depth. The depth was measured in centimetres, in four random positions within the
quadrat. From these measurements a mean depth value was calculated. As described in Chapter
two, section 2.1, surveying was restricted to water of 50 cm or shallower. However, this range
represented the gradient from terrestrial to semi-aquatic habitat, and so was likely to encompass
variation in abiotic conditions related to inundation.
Shading. A shade index was created by estimating the percentage of the quadrat that lay in the
shadow of tall structures (greater tham 1 m), including vegetation, during mid-daylight hours. A
limitation of this method is that it did not differentiate between intensity of shade created by

45
different structures, however it was deemed more appropriate than using a light meter to directly
measure light levels. This is because surveying took place over a number of months, in different
weather conditions and during different times of the day, and any light meter readings would
have been influenced by these confounding variables.
3.2.2. Laboratory analysis
Water samples were tested for the concentrations of available nitrogen (nitrate, ammonia +
ammonium) and total phosphorus. These macronutrients were chosen as they are considered to
be most limiting to productivity in wetland ecosystems (Brönmark & Hansson, 1998; Dodds,
2002).
Total phosphorus in water. 10ml from each collected water sample was filtered through a
0.45μm syringe filter and transferred to a 15ml polypropene centrifuge tube. Total P
concentration (mg / L) was determined by inductively coupled plasma atomic emission
spectroscopy (ICP-AES) (NEMIa, n.d.) using a Vista ICP-AES spectrometer. Readings were
taken at a wavelength of 213.618 nm.
Nitrate (NO3-). Nitrate levels were determined using a uv / visible spectrometry method
(NEMIb, n.d.). 80μl of a water sample was mixed with 4ml of Griess reagent (VCl3) within a
plastic cuvette, and left for 12 hours for the completion of the chemical reaction. These
solutions were then analysed for nitrate concentration (mg / L) using a Varian Cary uv-visible
spectrometer.
Ammonia + ammonium (NH3- + NH4
+). Levels were determined using an Ion Selective
Electrode (ISE) method (NEMIc, n.d.). 10ml from each water sample was mixed with 0.63ml of
2M NaOH, raising the pH in order to convert ammonium within the sample to ammonia.
Ammonia concentration (mg / L) was then detected using a Thermo Scientific Orion 4 Star ISE
portable probe.
3.2.3 Regional data
Before field data collection, it could not be exactly ascertained how much variation in pH and
macronutrients was going to be encompassed by the survey. Therefore, to aid in interpretation
of the results following data collection, pH and macronutrient data were obtained from a further
37 C. helmsii invaded sites in the UK (appendix I). This ‘regional dataset’ encompassed sites
from a larger geographic distribution (Fig. 7), and provided pH and macronutrient
measurements from a greater number of sites. The sample of pH and macronutrient levels in the
field survey data could thus be compared to the sample in the regional dataset, as a way of

46
assessing whether the abiotic variation included in the survey, was similar to the variation
recorded over a wider distribution.
The sites from which data were obtained were C. helmsii invaded areas primarily within nature
reserves. Data were voluntarily provided by reserves teams from the RSPB, the National Trust,
the Wildlife Trusts (BBOWT), and Natural England. Data were also provided from a detailed
study of ponds at Manor Farm in Norfolk, UK which was unconnected with this research
project (Sayer et al. 2012; Sayer et al. 2013).
Because data were not collected by the researcher, it was not feasible to repeat the stratified
sampling method, as used for the main field survey. Instead abiotic data were collected ‘per
invaded site’. In this case a site was defined as an isolated waterbody such as a pond or lake, or
an interconnected habitat such as a reedbed system, within which C. helmsii was growing.
In summer 2011, reserve team contacts were asked to test the pH of the water within each of the
sites using Fisherbrand colour-fixed pH indicator sticks, which were provided by the researcher.
This was considered to be the most appropriate method for recording pH as there was no
technical equipment requiring calibration, and the indicator sticks were easy to interpret.
Reserve team contacts were also asked to take one water sample per site, from the water within
which the C. helmsii was growing, whilst taking care not to stir up sediment in the area where
the sample was to be taken from. Contacts were sent 60ml plastic pots and blunt syringes with
0.22μm syringe filters for the purpose of taking water samples, and it was asked for water
samples to be drawn into the syringe through the filter in order to remove large organic particles
and large micro-organisms (Ward, 1997). This step was deemed as necessary in order to reduce
nutrient degradation of the sample due to chemical or biological reactions (Radojevid &
Bashkin, 2006). The syringe filters were then removed and the filtered water was transferred to
the 60ml plastic pot, and posted back to Bournemouth University for laboratory analysis of
nitrate, ammonia + ammonium and total phosphorus content, using the method described above.
Reserve contacts were also asked to provide categorical information on the abundance of C.
helmsii within the site: 1) Forming dense carpets which exclude all other species, 2) highly
abundant but other plants species still occur, 3) Frequent but not dominating the vegetation, 4)
sparse or infrequent patches amongst other vegetation. Data from Manor Farm, Norfolk (Sayer
et al. 2012; Sayer et al. 2013) were collected as part of research into the effects of active pond
management on macrophyte and invertebrate diversity, which was not connected with this
thesis. Within this extensive study of 45 ponds, seven ponds were recorded to have contained C.
helmsii between 2009 and 2013. From these ponds, data had been collected on the water pH,
nitrate concentration, total phosphorus concentration, and C. helmsii abundance (DAFOR).

47
Figure 7. The green markers indicate the geographical distribution of locations, from which additional
pH and macronutrient (available nitrogen and total phosphorus) data were obtained, in order to compile
the regional dataset of Crassula hemsii invaded sites.
3.2.4. Data analysis
In the raw dataset, between-sample variation in C. helmsii abundance was obscured by larger
scale between-site patterns of abundance. For example whilst 50 % cover was one of the highest
abundances at Fen Drayton, 50 % cover was one of the lowest abundances recorded at Castle
Water. To account for this effect of site, the raw data were transformed by group mean-centring
before statistical analysis. This was conducted by first finding the mean value of C. helmsii at
each of the survey sites. Then the site mean values were subtracted from each recorded data
point of abundance within their corresponding sites (Field et al. 2012). Thus the variables were
transformed from a set of raw data points, into data points which provided a value, relative to
the mean value of abundance at that site. Using group mean-centring, those values which were
high relative to the average amount of C. helmsii at the respective site, were shown as higher
values in the overall linear relationship, and vice-versa. This transformation also improved the
homoscedacity and the normal distribution of the residuals in the regression model. When group
mean-centring was used to transform C. helmsii data, the same transformation was also

48
conducted on the abiotic or biotic variables against which C. helmsii was being tested. In all
cases, the group mean-centred data points were calculated in Excel 2010 (© Microsoft, 2010).
Multiple linear regression was then conducted with the group mean-centred variables, using R
version 3.0.2 (© the R foundation for statistical computing, 2013). The first model which was
run had C. helmsii abundance as the dependent variable and included all five measured abiotic
variables as predictors; pH, nitrate, ammonia + ammonium, total phosphorus and shading.
Based on the results of this model, a second multiple linear regression was run which included
only those abiotic variables which were shown to be significant predictors, as indicated by
statistically significant standardised beta coefficients. AIC (Akaike’s information criterion)
values were also calculated for each model, as a method of assessing goodness-of-fit whilst
accounting for the number of variables included in the models (Field et al. 2012). The second
model was compared to the first based on the proportion of explained variation and the
goodness-of-fit; greater explained variation being indicated by a higher R2, and a better
goodness-of-fit being indicated by higher adjusted R2 and lower AIC values. Linear regression
was also run separately on data from each of the five survey sites, using only those predictor
variables which were shown to be significant in the main regression model. This was done to
determine whether some sites were having a greater influence on the linear trend shown in the
main model.
Further interpretation of the model was conducted by comparing the sample of abiotic data
recorded in the field survey, to the sample of abiotic data documented in the regional dataset.
This provided a way of assessing how well the conclusions of the field survey could be
generalised to apply to other C. helmsii invaded sites in the UK. Comparisons were conducted
simply by producing boxplots, which showed the range of raw data values for an abiotic
variable in the field survey dataset, next to the range of values for the same variable in the
regional dataset. Visual inspection of the boxplots showed how similar the ranges of values
were in the two datasets. The data in the regional dataset was collected on a ‘per invaded site’
basis, meaning per isolated waterbody. To match this in the field survey dataset, mean values
were calculated per waterbody (eg. pond, lake), and these values were used as the abiotic
variables instead of the 94 individual sample locations.

49
3.3. Results
Within the field survey data, the pH ranged from 5.4 to 9.7 (mean ‘M’ = 7.5, standard deviation
‘SD’ = 1.0), nitrate ranged from below detectable levels to 10.2 mg / L (M = 1.8, SD = 2.0),
ammonia + ammonium ranged from 0.012 to 8.840 mg / L (M = 0.610, SD = 1.235), total
phosphorus ranged from 0.129 to 1.962 mg / L (M = 0.213, SD = 0.208), average depth ranged
from 0 to 37.5 cm (M = 12.5, SD = 9.1), and shading ranged from 0 to 100 % (M = 30, SD =
40). Overall, the abundance of C. helmsii ranged from 0 % to 100 % cover (M = 39, SD = 37)
(Fig. 8).
Multiple linear regression of the field survey data produced statistically significant models
(Table 3). When all measured abiotic variables were included in the regression, the variables pH
(standardised β = 0.264, p = 0.009) and shading (standardised β = -0.397, p < 0.001) were found
to be significant predictors of C. helmsii abundance. A model which included just pH and
shading as predictors, had an equivalent R2 fit to the data and showed improved adjusted R
2 and
AIC values (Table 3). This model showed a significant positive relationship between pH and C.
helmsii abundance (standardised β = 0.255, p = 0.008), and a significant negative relationship
between shading and C. helmsii abundance (standardised β = -0.389, p < 0.001).
When data from each of the five field survey sites were analysed separately, the strongest
positive relationship between C. helmsii abundance and pH was shown in data from the New
Forest ponds. There was also a positive relationship between C. helmsii abundance and pH at
Ouse Fen, but a negative relationship at Castle Water, Fen Drayton, and Kingfishers Bridge.
The strongest negative relationship between C. helmsii abundance and shading was shown in
data from Kingfishers Bridge, but C. helmsii abundance was negatively related to shade at all
sites (Table 4).
Table 3. The output from linear regression models of Crassula helmsii abundance predicted by a number
of abiotic habitat variables. These variables were: water pH, nitrate (NO3), ammonia + ammonium (NH3 /
NH4+), total phosphorus (TP), water depth, shading. The first model included all six of these variables.
The subsequent three models included only pH and/or shading, as these two variables were shown to be
statistically significant predictors of C. helmsii abundance in the first model.
Dependent Predictors R2 F p Adj R
2 AIC
Value df
C. helmsii pH, NO3, NH3 / NH4+, TP,
depth, shading
0.220 4.006 6, 85 0.001 0.165 878.038
C. helmsii pH, shading 0.215 12.220 2, 89 < 0.001 0.198 870.629
C. helmsii pH 0.064 6.189 1, 90 0.015 0.054 884.830
C. helmsii shading 0.150 15.910 1, 90 < 0.001 0.141 875.971

50
Table 4. The output from linear regression models of Crassula helmsii abundance predicted by pH and
shading. Five regression models were run using data from five different C. helmsii invaded sites: Castle
Water, East Sussex; Fen Drayton, Cambridgeshire; Kingfishers Bridge, Cambridgeshire; The New Forest
(ponds), Hampshire; and Ouse Fen, Cambridgeshire.
Site R2 F p Predictor Standardised β p
Value df
Castle Water 0.279 2.123 2, 11 0.166 pH -0.003 0.991
shading -0.527 0.081
Fen Drayton 0.065 0.657 2, 19 0.530 pH -0.224 0.340
shading -0.187 0.423
Kingfishers Bridge 0.849 16.840 2, 6 0.003 pH -0.145 0.425
shading -0.963 0.001
New Forest ponds 0.391 8.344 2, 26 0.002 pH 0.576 0.001
shading -0.366 0.027
Ouse Fen 0.194 1.923 2, 16 0.179 pH 0.192 0.406
shading -0.388 0.104

51
Figure 8. Continued on next two pages.

52
Figure 8. Continued on next page.

53
Figure 8 (and previous two pages). Each of the seven graphs relates to a measured variable. From the top
of p.51: water pH, nitrate, ammonia + ammonium, total phosphorus, water depth, shading, and Crassula
helmsii abundance. The five box plots in each graph indicate the data range for each variable, in each of
the five sites that were surveyed for this study. Extreme outliers have been excluded from these graphs in
order to maintain legibility. These outliers are 7.52 and 8.84 mg / L ammonia + ammonium, and 1.96 mg
/ L total phosphorus, all recorded at Fen Drayton.
In the regional dataset, the pH ranged from 6.0 to 10.8 (M = 7.5, SD = 0.9), nitrate ranged
from below detectable levels to 83.2 mg / L (M = 6.88, SD = 15.4), ammonia + ammonium
ranged from 0.289 to 2.200 mg / L (M = 0.977, SD = 0.533), and total phosphorus ranged from
below detectable levels to 0.379 mg / L (M = 0.090, SD = 0.103). Of the C. helmsii abundance
categories, at 4 sites it grew in ‘dense monospecific carpets’, at 22 sites it was ‘highly
abundant’, at 11 sites it was ‘fairly abundant’, and at 3 sites it grew in ‘infrequent patches’.
Variation in pH overlapped and was equivalent in the field survey and regional datasets.
Variation in nitrates was greater in the regional dataset, encompassing more samples with
higher nitrate levels. Variation in ammonia + ammonium overlapped between the two datasets,
but the regional dataset contained more samples with higher ammonia + ammonium levels, and
the field survey dataset contained more samples with lower ammonia + ammonium levels. Total
phosphorus overlapped between the two datasets, but there was more variation in the regional
dataset, which contained more samples with higher and with lower total phosphorus levels (Fig.
9).

54
Figure 9. A visual comparison of the range of pH and macronutrient concentrations (nitrate, ammonia +
ammonium, total phosphorus) measured in the ‘field survey’ dataset, to the range of the same measured
variables in the ‘additional’ regional dataset. The ‘field survey’ data were collected from water bodies in
Southern and Eastern England, whereas the ‘additional’ regional data were obtained from waterbodies
across a wider UK distribution. It can be seen that the range of pH was roughly equivalent between the
two datasets, but that the ‘field survey’ dataset had a lower range of available nitrogen, and a smaller
range of total phosphorus. Extreme outliers of 83.2, 24.8, and 13.4 mg / L nitrate, recorded in the
‘additional’ regional dataset, have been excluded from the graph in order to maintain legibility.

55
3.4. Discussion
The abundance of C. helmsii in the field was positively associated with pH and negatively
associated with the amount of shading, but macronutrient levels and the depth of water in the
marginal zone had little influence on C. helmsii abundance. The best-fit linear regression model
indicated that variation in pH and shading accounted for 21.5 % of the variation in C. helmsii
abundance, with shading accounting for more of this explained variation than pH. Accordingly
there was a considerable amount of unexplained variation in the model, and so there are likely
to be a number of factors not included in this survey which affected C. helmsii abundance. Most
obviously abundance could have varied due to the strength of interspecific competition imposed
by the resident plant community (Levine et al. 2004; Mitchell et al. 2006), with C. helmsii
becoming more abundant were there was less competitive pressure. This topic is addressed in
more detail in chapter seven. The amount of time elapsed since colonisation of an area
(Theoharides & Dukes, 2007) could also have accounted for a proportion of the unexplained
variation in abundance. Nevertheless based on this study, knowledge of pH and shading levels
represent a useful contribution to site information when making predictions of C. helmsii
abundance in the field.
An overall significant positive relationship was found between C. helmsii abundance and pH,
suggesting that C. helmsii abundance was relatively high, where the pH was relatively high.
Importantly however, inspection of this relationship when data were tested separately per site,
suggests that the quadrat samples from the New Forest ponds may have had a disproportionally
large effect on the outcome of the main linear model. The overall range of pH measured in the
field survey was pH 5.4 to 9.7 however nearly all quadrats with an acidic pH were located in the
New Forest ponds. Consequently, data from the New Forest ponds had a disproportionally large
effect on the outcome of the main linear model, because C. helmsii abundance was only being
limited by pH in acidic conditions. Significantly, the quadrat location with the lowest measured
pH (5.4) did not contain any C. helmsii, although this species was found growing in the quadrat
location with the next lowest pH (5.8). In other sites, a significant relationship with pH may not
have occurred because C. helmsii abundance was not being limited by pH within the neutral to
alkaline range. The distribution of the pH sample in this survey further suggests that C. helmsii
may be more limited in acidic conditions; 30 % of quadrats measured had a pH lower than 7.0,
and only 4 % had a pH lower than 6.0. Whilst it is possible that this distribution may simply
have been reflective of the pH within the chosen sample sites, the fact that the same pH
distribution was found in the regional dataset sample, adds confidence to the generalisation that
C. helmsii more typically occurs in sites with a neutral to alkaline pH.
Further work is required to test the hypothesis that C. helmsii abundance was limited in an
acidic pH, but not in a neutral or alkaline pH. Firstly, it would be beneficial to extend data

56
collection to encompass more sites where the range of pH is between neutral and acidic, to
determine whether the same positive relationship is found in locations other than the New
Forest ponds. Secondly, experiments could be conducted which assess the growth rate of C.
helmsii under controlled conditions of acidic, neutral, and alkaline pH. Such growth trials were
attempted for this thesis however the pH was not successfully controlled (appendix II).
An overall significant negative relationship was found between C. helmsii abundance and shade,
and a negative relationship was also found in all sites when data were tested separately per site.
This suggests that C. helmsii abundance was relatively high where shade levels were relatively
low. In particular at Kingfishers Bridge, shading was found to be a significant predictor of a
large proportion of variation in C. helmsii abundance. Concurrently the distribution of C.
helmsii at this site was distinct; C. helmsii occurred in high abundance along the edges of the
lake where there was open draw down zone, and was absent from the edges where there were
dense Phragmites autralis reedbeds shading the drawdown zone. Importantly this demonstrates
that in this survey, the consistent source of shading was taller, overtopping vegetation. Crassula
helmsii was not totally excluded from shady habitat however, and especially in quadrats located
at Ouse Fen this species was found growing underneath dense stands of P. australis. As
discussed in the introduction to this chapter, C. helmsii has been documented as tolerant of
shade (Hill et al. 2004), and Hussner (2009) reported that this species had lower light
requirements than three other invasive aquatic plant species. It is likely therefore, that unshaded
habitats represent optimal conditions for C. helmsii in the UK, but that this species can persist in
shady habitats, although at lower abundances. Growth experiments with controlled levels of
shade, for example using shade net of varying opacity (Skálová et al. 2013), could be used to
improve confidence in this hypothesis.
In this study macronutrient levels were not found to be significant predictors of C. helmsii
abundance. This result seems contradictory to laboratory findings that C. helmsii growth rate
increases with nutrient availability (Hussner, 2009; appendix II), and descriptions of C. helmsii
as typical of higher nutrient level conditions (Hill et al. 2004; Minchin, 2008). One reason why
this relationship was not detected could be that C. helmsii faced stronger competition from co-
occurring plants in the locations where nutrients were highest. Indeed, increased community
resistance to invasive plant dominance, has been recorded in response to increased nitrogen
levels, in grassland plant communities (Going et al. 2009). Alternatively, it is possible that
nutrient levels do influence the abundance of this species, but that the relationship was not
detected in this field survey because the nutrient level sample did not encompass enough
variation. To support this suggestion, the regional dataset indicated that C. helmsii could occur
across a much wider range of nutrient levels than was included in the main field survey, and
especially in conditions with higher nitrogen levels. Similarly, whilst water depth was not found
to be a significant predictor of C. helmsii abundance in water of 0 to 38 cm, it is possible that a

57
relationship could have been detected if the survey methodology had allowed for sampling at
greater depths.
This chapter was designed to provide information on whether simple abiotic variables, could be
used to reliably predict where high C. helmsii abundance was likely to occur, and in this way
assess how important the abiotic habitat was in facilitating the growth of dense, dominating C.
helmsii. Based on the results of this survey, it seems that high C. helmsii abundance is more
likely in wetland habitats where the pH is neutral to alkaline, and in open sites which lack tall,
shading vegetation.

58
NB. The following chapter was published as a paper in the journal Conservation Evidence, on
11th December 2013:
Dean C., Day J., Gozlan R.E., Green I., Yates B. Diaz A. 2013. Estimating the minimum
salinity level for the control of New Zealand Pygmyweed Crassula helmsii in brackish water
habitats. Conservation Evidence. 10. 89-92.
The format of this data chapter therefore follows the style of this journal.

59
4. What is the estimated minimum salinity level for the control of
Crassula helmsii in brackish water habitats?
4.1. Background
The non-native semi-aquatic plant New Zealand Pygmyweed Crassula helmsii has invaded and
become abundant within many nature reserves across Europe where land is managed as wetland
habitat such as ponds, shallow pools, reedbeds, and grazing marsh (Langdon et al. 2004; Bridge,
2005; Gomes, 2005; Wilton-Jones, 2005). Crassula helmsii can spread rapidly across bare mud
(personal observation), and heavy invasions resemble thick green carpets, with few other plant
species occurring in amongst the dense vegetation (Dawson & Warman, 1987; EPPO, 2007;
Minchin, 2008). Degrading the invasive vegetation using herbicides, heating, or covering with
light eliminating material, can decrease the abundance of C. helmsii but complete eradication is
rarely achieved due to subsequent re-growth of remaining vegetative fragments (Bridge, 2005;
Gomes, 2005; Wilton-Jones, 2005).
The use of seawater inundation has been found to be a practical option for the control of C.
helmsii in coastal habitats. For example, Charlton et al. (2010) found that C. helmsii was
eradicated from grazing marsh at RSPB Old Hall Marshes by flooding the area with seawater.
At this site, the benefit of C. helmsii eradication was carefully weighed against the potential
negative impacts on co-occurring native species (Charlton et al. 2010; Gardiner & Charlton,
2012). Such considerations are important as saltwater inundation is a non-targeted method of
control, so any other organisms occurring within an inundation zone would also experience a
sudden rise in salinity; those which cannot tolerate the rise in salinity would also be locally
eradicated. Reviews of invasive plant control efficacy have also highlighted that the costs to
native species is an important consideration when planning best practice control attempts
(Kettenring & Adams, 2011).
There is limited published information on salinity tolerance in C. helmsii. Whilst it can be
deduced that this invasive plant has some tolerance to saline water due to its invasion of coastal
habitats (EPPO, 2007), this species is not a brackish habitat specialist and its UK distribution is
more associated with freshwater (Preston & Croft, 1997). Knowledge of the environmental
tolerances of an invasive species can be used to create conditions which are less favourable for
the invader (Davis, 2009). In the current context knowing the threshold between freshwater and
saline water at which C. helmsii can no longer grow, allows manipulation of site salinity to be
used as a management tool. Furthermore, such information has utility when predicting how the

60
abundance and distribution of the invasive plant may change, if land management is altered in a
way which affects the salinity of a site (Thouvenot et al. 2012).
The aim of this investigation was to determine the levels of salinity required to kill C. helmsii.
In doing so we aimed to provide information on the increase in salinity needed at a site in order
to eradicate C. helmsii, whilst minimising saline toxicity in co-occurring native species. We
conducted growth trials with the objective of finding the lowest level of salinity which kills C.
helmsii. The concentration of plant available nutrients was also controlled, as nutrient
availability in tank experiments has previously been found to affect the growth rate of C.
helmsii (Hussner, 2009).

61
4.2. Action
The growth trials were conducted outdoors at Bournemouth University, Dorset, UK (OS grid
ref: SZ 073 937). Crassula helmsii was grown in conditions specifically modified to produce
three different levels of salinity; 2, 4, and 8 parts/thousand (‘ppt’). In contrast seawater has a
salinity of greater than 30 ppt. The three test levels of 2, 4 and 8 ppt were chosen based on field
observations of the distribution of C. helmsii in brackish water pools at Pett Level in East
Sussex (OS grid ref: TQ 903 147), where this plant was restricted to water of 4 ppt and below.
To set up the growth trials, we used 5 L plastic storage containers, lined with horticultural sand
to 3 cm depth and filled with 1 L of distilled water, to mimic shallow water habitat conditions
suitable for C. helmsii. Fresh cut samples of C. helmsii weighing 10 g were added to each 5 L
container. The correct salinity was achieved at the start of the experiment by mixing 2, 4, or 8 g
of salt (sodium chloride) to the 1 L of distilled water. A solution containing all required mineral
elements for growth (Taiz & Zeiger, 2006), was applied to the water + salt solutions at the start
of the experiment. The nutrient solution was applied at three different dilutions; 0.125, 0.25 and
0.5 times the full strength solution. Each salinity level was combined with each nutrient
dilution, making nine different salinity/nutrient treatments, and each treatment was replicated
four times in a separate container. To act as a control, additional containers were set up in which
10 g fresh weight samples of C. helmsii were grown within the same three nutrient dilutions but
with no added salt, replicated three times each. In total therefore, C. helmsii was grown in 45
separate containers.
The experiment lasted for 31 days, during September and October 2011. Met Office records of
climatic data from Hurn weather station (approximately 4 miles north-east of the trial location)
report that in September 2011 daily temperature averages ranged from 19.8 °C to 11.3 °C, with
0 days air frost, and in October 2011 daily temperature averages ranged from 17.3 °C to 8.6 °C,
with 1 day air frost (© Crown copyright, 2011). At the end of the experiment, the C. helmsii was
removed from each container and thoroughly rinsed with tap water. In order to obtain a dry
weight value for the amount of C. helmsii growing in each container at the end of the
experiment, the vegetation was dried at 90 ˚C for 48 hrs before being weighed. A dry weight
value for the start of the experiment was estimated by weighing out twenty additional C. helmsii
samples of 10 g fresh weight, drying them at 90 ˚C for 48 hours, and taking the average dry
weight of these samples. Having the average ‘start dry weight’, and the ‘end dry weight’ for
each C. helmsii sample allowed for the relative growth rate to be calculated for each replicate.

62
This was done using the formula:
Relative growth rate = ln(W2) – ln(W1) / (t2 – t1)
Where W1 is the start and W2 the end dry weight, ln is the natural logarithm, and t1 is the start
and t2 the end time measured in days. The formula describes the proportional increase of a plant
in grams, expressed per gram per day (g g-1
/day-1
) (Hunt, 2003).

63
4.3. Consequences
A significant difference was found in average growth rate between the salinity treatments (two-
way ANOVA: F(3, 33) = 197.705, p < 0.001) (Fig. 10). The highest average growth rates were
recorded within the control (0 ppt) (Table 5). Growth was recorded at 4 ppt but the average
growth rates were lower than at 2 ppt or in the control. In the 8 ppt treatments, all but one
replicate was found to have a negative growth rate which is indicative of a loss of biomass. By
the end of the experiment it was observed that the C. helmsii within the 8 ppt salinity treatments
had died and was in the early stages of decomposition. The nutrient dilution had no significant
effect on the growth rate of C. helmsii in this experiment (two-way ANOVA: F(2, 33) = 0.115, p =
0.892).
Figure 10. Bar charts showing the relative growth rate (± 1 SE) of Crassula helmsii when grown in tanks,
with a factorial design combining three treatment levels of salinity (2, 4, and 8 parts/thousand) plus a
control, and three treatment levels of nutrient dilution (0.5, 0.25, and 0.125 x full strength nutrient
solution). Bars falling below the 0.00 line represent negative growth, and thus biomass loss.
-0.02
-0.01
0
0.01
0.02
0.03
0.04
0.05
0.06
0 2 4 8
Mea
n r
elat
ive
gro
wth
rat
e (g
g-1
/d-1
)
Salinity (ppt)
0.125
0.25
0.5

64
Table 5. The average start dry weight, end dry weight, and growth rate values for replicate trials of
Crassula helmsii when exposed to three different levels of salinity (2, 4, and 8 parts/thousand) plus a
control, combined with three different nutrient dilutions (0.5, 0.25, and 0.125 x full strength nutrient
solution).
Salinity
(ppt)
Nutrient dilution
(x full strength)
Average values
Start dry weight (g) End dry weight (g)
Growth Rate
(g g-1
/day-1
)
0 0.125 0.840 2.790 0.048
0 0.25 0.840 3.067 0.052
0 0.5 0.840 3.093 0.052
2 0.125 0.840 1.288 0.014
2 0.25 0.840 1.268 0.013
2 0.5 0.840 1.445 0.017
4 0.125 0.840 1.033 0.007
4 0.25 0.840 1.013 0.006
4 0.5 0.840 0.923 0.003
8 0.125 0.840 0.678 -0.008
8 0.25 0.840 0.593 -0.012
8 0.5 0.840 0.653 -0.009

65
4.4. Discussion
The results of the growth trials show a negative linear relationship between C. helmsii growth
and salinity, indicating that C. helmsii growth is inhibited by increasing salinity across the range
from 2 to 8 ppt. Importantly C. helmsii died in tanks of 8 ppt, suggesting that this is beyond the
salinity tolerance of this species. Thus, based on the findings of these growth trials, we suggest
that if the salinity of a C. helmsii invaded site were raised to 8 ppt or above, this could have
similar eradication efficacy to that produced by seawater of 30 ppt. Furthermore, if a site could
be permanently maintained at 8 ppt or higher, this could provide a long-term solution for the
prevention of re-invasion in sites where C. helmsii has been eradicated, or prevent its spread
within habitats where the species has a patchy distribution.
Using the lowest effective salinity for C. helmsii eradication may represent a way to minimise
the impacts of saltwater inundation. In particular this method may minimise impacts in naturally
brackish habitats, where an increase to 8 ppt may be enough to inhibit C. helmsii whilst
favouring native brackish habitat specialists. For example plant species such as saltmarsh
goosefoot (Chenopodium chenopodioides), brackish water-crowfoot (Rununculus baudotii), sea
clubrush (Scirpus maritimus) and greater sea-spurrey (Spergularia media) have all been
recorded as co-occurring with C. helmsii at Pett Level in East Sussex. In addition, the salt
tolerance of common reed (Phragmites australis) (Preston & Croft, 1997; Chambers et al. 2003)
may make brackish water (8 ppt) inundation an appropriate method of C. helmsii eradication in
mature reedbed systems.
This paper represents a demonstration of concept. We acknowledge that the next step will be to
test whether C. helmsii is successfully eradicated in the field using inundation with water at 8
ppt, and whether control of salinity levels is a feasible management option. Additional tank-
based growth trials could also be conducted to estimate the minimum length of time inundated
at 8 ppt, which is required to ensure a total kill. We recommend that field trials be conducted in
sites where the predominant co-occurring plant community are tolerant of brackish conditions.
Furthermore, monitoring of the abundance of co-occurring native species in such field trials,
would provide evidence of whether C. helmsii is more greatly inhibited at 8 ppt than plants
which are brackish habitat specialists.

66
NB. The following chapter was re-written as a research article and published in the journal
Invasive Plant Science and Management:
Dean, C.E. Day, J. Gozlan, R.E. Diaz, A. 2015. Grazing vertebrates promote invasive swamp
stonecrop (Crassula helmsii) abundance. Invasive Plant Science and Management. In Press.
Available from: http://www.wssajournals.org/doi/10.1614/IPSM-D-14-00068.1.

67
5. What is the effect of vertebrate grazing disturbance on the
abundance of C. helmsii within a wetland plant community?
5.1. Introduction
The effect of grazing disturbance on plant community structure is variable, dependent on the
grazing intensity, the type of grazing animal, and the individualistic response of plant species to
this form of disturbance (Milchunas et al. 1988; Olff & Ritchie, 1998; Bullock et al. 2001;
Bakker et al. 2006). However, it is generally recognised that herbivory can directly affect the
composition of plant communities by altering the survival and biomass of individual species,
and can indirectly affect the composition by altering plant-plant interactions (Crawley, 1997;
Olff & Ritchie, 1998; Huston, 2004; Rook et al. 2004; Jones et al. 2011). It is therefore possible
that grazing disturbance can influence the extent to which a non-native invasive plant produces
dominating invasive growth, both by directly affecting the invader, and by mediating the
abundance and competitive strength of co-occurring plant species. Predicting how grazing
might influence a non-native invasive plant requires an understanding of how different forms of
grazing affect the non-native invasive species, relative to how they affect other plant species in
the invaded range (Mitchell et al. 2006).
In situations where non-native invasive plants show high productivity (Davis, 2009; Vilà et al.
2011) this competitive growth may encourage grazing (Olff & Ritche, 1998). In particular non-
native invasive species may be subject to attack from generalist herbivores (Maron & Vilà,
2001), indeed experiments using invertebrate herbivores have shown that some non-native
invasive species can be equally or more palatable to generalists than native plants (Agrawal &
Kotanen, 2003; Parker & Hay, 2005). Such attack may therefore suppress the abundance of a
non-native invasive plant, and furthermore, removal of seedlings may limit establishment
(Maron & Vilà, 2001; Stricker & Stiling, 2012; Fan et al. 2013).
In contrast, grazing could favour the growth and dominance of a non-native invasive species.
For example if stronger competitors were reduced by grazers, then the non-native invasive
species could benefit from greater access to light, space and nutrient resources (Xie et al. 2013).
Furthermore, suppression of native seedlings could prevent stronger competitors from
establishing, promoting the persistence of the non-native invasive plant (Baiser et al. 2008). The
‘enemy release hypothesis’ suggests that invasive growth of a non-native species can arise if the
plants are selected less, or selected by fewer grazing species. Specifically this hypothesis
suggests that non-native invasive species experience reduced herbivory in an introduced range,
due to the absence of specific herbivores which have co-evolved with the plant in its native

68
range (Tilman, 1999). Summative evidence for the relative strength of this mechanism is
however still lacking (Keane & Crawley, 2002; Davis, 2009). An alternative hypothesis is that
non-native invasive species experience similar levels of grazing as the natives due to attack
from generalist herbivores, but increase in abundance because they are less negatively affected,
or respond more positively to this kind of disturbance (Kimball & Schiffman, 2003;
HilleRisLambers et al. 2010; Stahlherber & D’ Antonio, 2013).
Because C. helmsii occurs in habitats which use livestock grazing as a management tool; for
example fens and grazing meadows (Preston & Croft, 1997); it is important to investigate how
this non-native invasive plant responds to disturbance created by large vertebrates. In particular,
does the presence of grazing livestock influence whether C. helmsii forms dense dominating
vegetative mats? Light grazing by livestock, such as cattle and sheep, is used in the management
of fen habitat to encourage plant species diversity, by suppressing the abundance of tall, highly
competitive and dominating plant species. This suppression may occur both via consumption of
biomass, and via vegetative damage from trampling (Natural England, 2005; McBride et al.
2011). As a plant species which can produce extensive above-ground biomass, it may be
hypothesised that the presence of grazing animals could limit the overall abundance of C.
helmsii, through consumption or trampling degradation. Grazing could therefore, offer a way of
limiting the dominance of this invasive species in fen habitat. However, this hypothesis is
predicated on the assumption that C. helmsii would be selected by grazing animals or that it
would be suppressed by trampling, and furthermore, that it would experience more negative
impacts from grazing disturbance than other plant species in the community.
The aim of this study was to test whether the presence of grazing disturbance affected the
relative abundance of C. helmsii within a plant community, and further whether grazing had a
suppressive or facilitative effect on C. helmsii abundance. The benefits of this study were thus
twofold; firstly it offered insight into whether grazing disturbance is an ecological factor which
can mediate dominating invasive C. helmsii growth, and secondly it offered an assessment of
whether livestock grazing is an appropriate management technique for maintaining higher plant
species diversity, in C. helmsii invaded habitats. To address this aim, a field experiment was
conducted in which grazing exclosures were set up along a heavily C. helmsii invaded lake
drawdown zone, in a fen habitat where livestock grazing was used as a management tool to limit
the abundance of tall, dominating herbaceous species. The abundance of C. hemsii and the co-
occurring plant community was monitored in these exclosures, and was compared with control
plots which were accessible to large vertebrates. Three questions were asked; 1) Is there an
effect of grazing disturbance on the abundance of C. helmsii? 2) Is there an effect of grazing
disturbance on the abundance and species diversity of co-occurring vegetation? 3) Is there an
effect of grazing disturbance on species dominance?

69
5.2. Methods and Materials
5.2.1. Experimental design
In this experiment the effect of disturbance from grazing vertberates was ascertained, by
observation of changes to the plant community when these animals were excluded. The
experiment was sited at Kingfishers Bridge nature reserve. For a description of the site see
chapter two, section 2.1. Six grazing exclosures were set up along a wide section of the
drawdown zone, on the southern margin of a shallow lake, where C. helmsii was growing in
abundance. These exclosures were 4 m2 in area with 1m high fencing, and designed to impede
access by medium to large vertebrates. The exclosures were set up on 28th February 2012 pre-
empting spring vegetation regeneration; at this stage in the year the drawdown zone was
predominantly bare ground with patches of C. helmsii which had persisted through the winter
(Fig. 11). At the same time the positions of six grazed (unfenced) 4 m2 plots were designated,
interspersed within the grazing exclosures but separated by a buffer zone of 1m, and located so
that all plots experienced water levels of an equivalent depth.
Grazing pressure and livestock type varied during the experiment based on the habitat
management decisions of the reserve warden: sheep were grazed from January to March 2012
and from August 2012 to October 2013, and 11 buffalo were grazed from late July to December
2012. The site was also frequently visited throughout the year by herbivorous wildfowl. This
variation meant that C. helmsii response to grazing intensity could not be ascertained, and this
experiment purely focuses on the response of C. helmsii to the presence or absence of
disturbance from vertebrate grazing.
The plots were surveyed eight times between July 2012 and October 2013, with a two month
gap between each subsequent survey. The first survey was conducted on 16th July 2012 to
coincide with the end of the ground nesting bird season and when seasonal vegetation growth
was present. The final survey was conducted on 4th
October 2013 to coincide with the end of the
main growing season. In each plot the abundance of C. helmsii was recorded as an estimate of
percentage cover. All co-occurring plants were identified to species using standard keys for
vascular plants (Rose, 1989; Rose, 2006), and the percentage cover was estimated separately for
each species. The maximum height of vegetation was recorded throughout the experiment, and
the maximum height of C. helmsii specifically was recorded during the last four surveys of the
experiment, as an added line of enquiry.

70
Figure 11. Photograph showing the 4m2 grazing exclosures during the set up of the experiment in
February 2012. These exclosures, along with paired unfenced plots, were situated along a lake drawdown
zone at Kingfishers Bridge nature reserve, Cambridgeshire, where Crassula helmsii was known to have
invaded (© Roger Beecroft).
5.2.2. Statistical analysis
Is there an effect of grazing disturbance on the abundance of C. helmsii?
The effect of grazing disturbance on C. helmsii abundance was assessed with a linear mixed
effects model, using the R package ‘nlme’ (Pinheiro et al. 2013) in R version 3.0.2 (© the R
foundation for statistical computing, 2013). Before analysis percentage cover data for C. helmsii
were arcsine transformed to normalise the data (see chapter two, section 2.2). Then data from all
eight surveys were included in a linear model, to test for an effect of ‘grazing treatment’ on C.
helmsii abundance. The variable ‘survey’ was included as a random factor in this model in order
to account for the non-independence of data collected from the same plots over the 8 survey
dates.

71
Is there an effect of grazing disturbance on the abundance and species diversity of co-occurring
vegetation?
The abundance of co-occurring vegetation was calculated as the sum of the cover of all plant
species recorded within a plot on a particular survey date, excluding C. helmsii. All vegetation
percentage cover data were arcsine transformed before analysis. To quantify plant species
diversity in each plot, the Shannon-Weiner diversity index (H) was calculated (see chapter two,
section 2.2), and again this variable excluded C. helmsii. Abundance and species diversity were
tested separately for an effect of grazing, using data from all eight surveys, in linear mixed
effects models with ‘survey’ included as a random factor.
Is there an effect of grazing disturbance on species dominance?
Dominance was scored based on proportional abundance, defined as the abundance of a plant
species relative to the total amount of vegetation cover recorded in a plot, and calculated using
the formula;
Proportion = (% cover single species / total % cover all species)*100
The plant species with the highest proportional abundance within a plot, equated to the most
dominant species. Using these data the most dominant species was determined for each plot in
each survey, allowing comparisons to be made between the grazed and ungrazed treatments.
The magnitude of dominance was also assessed, by comparing the proportional abundance of
the dominant species, to that of other abundant species within the same plot. In this study,
species were considered ‘abundant’ if they were present in at least four out of the eight
sequential surveys, and if they had a percentage cover of 10 % of higher in at least three out of
the six plots, per treatment. Linear mixed effects models were used to statistically compare the
proportional abundance of species within the same plot, through calculation of the mean
difference and t values. These models used arcsine transformed ‘proportional abundance’ as the
dependent variable, and ‘species’ as the fixed factor, with ‘plot’ nested within ‘survey’ as
random factors. Data from grazed and ungrazed treatments were analysed separately.

72
5.3. Results
Is there an effect of grazing disturbance on the abundance of C. helmsii?
There was a significant effect of grazing treatment on C. helmsii abundance (t(87) = 28.974, p <
0.001), with mean C. helmsii abundance found to be lower in the ungrazed plots than in the
grazed plots. The abundance of C. helmsii was found to decrease over time in the ungrazed
plots, whilst remaining constant in the grazed plots (Fig. 12). Measurements of the maximum C.
helmsii height suggest a trend for taller growth in the ungrazed plots during the summer months
(Fig. 13).
Figure 12. The mean percentage cover (± 1 SE) of Crassula helmsii in two separate experimental
treatments: ‘grazed’ unfenced plots, and ‘ungrazed’ fenced exclosures. The graph shows the change in
mean percentage cover over the course of eight repeated surveys that were carried out between July 2012
and October 2013.
0
10
20
30
40
50
60
70
80
90
100
Mea
n a
bundan
ce (
% c
over
)
Grazed
Ungrazed

73
Figure 13. The mean maximum height (± 1 SE) of Crassula helmsii in ‘grazed’ unfenced plots, and
‘ungrazed’ fenced exclosures, in the final four of eight repeated surveys.
Is there an effect of grazing disturbance on the abundance and species diversity of co-occurring
vegetation?
There was a significant effect of grazing treatment on co-occurring vegetation abundance (t(87) =
6.264, p < 0.001), and on co-occurring species diversity (t(87) = 2.647, p = 0.010). Mean
abundance was consistently higher in the ungrazed plots, and mean species diversity was higher
in the ungrazed plots in all but the first two surveys of the experiment (Fig. 15). The mean
maximum height of vegetation was also shown to be consistently higher in the ungrazed plots
(Fig. 14).
Figure 14. The mean maximum height (± 1 SE) of all vegetation, excluding Crassula helmsii, in ‘grazed’
unfenced plots, and ‘ungrazed’ fenced exclosures. The graph shows data collected over eight repeated
surveys.
0
10
20
30
40
50
Apr '13 Jun '13 Aug '13 Oct '13
Mea
n m
axim
um
hei
ght
(cm
)
Grazed
Ungrazed
0
50
100
150
200
Jul '12 Sep '12 Nov '12 Jan '13 Apr '13 Jun '13 Aug '13 Oct '13
Mea
n m
axim
um
hei
ght
(cm
)
Grazed
Ungrazed

74
Figure 15. The top graph shows the mean percentage cover (± 1 SE) of all vegetation excluding Crassula
helmsii, and the bottom graph shows the Shannon-Weiner H species diversity index (± 1 SE) for this
vegetation, over eight repeated surveys. Both graphs indicate the change over time in these variables, in
two separate experimental treatments: ‘grazed’ unfenced plots, and ‘ungrazed’ fenced exclosures.
0
20
40
60
80
100
120
140
160
Mea
n a
bundan
ce (
% c
over
)
Grazed
Ungrazed
0.0
0.2
0.4
0.6
0.8
1.0
1.2
1.4
1.6
Mea
n s
pec
ies
div
ersi
ty (
H)

75
Figure 16. Photograph taken in August 2013 showing a fenced plot (ungrazed treatment) on the left, and
an unfenced plot (grazed treatment) on the right.
Fenced plot Unfenced plot

76
Is there an effect of grazing disturbance on species dominance?
Based on the criteria for abundance detailed in the methods section above, two species were
classed as abundant in the grazed plot treatments (C. helmsii and Mentha aquatica) and three
species were classed as abundant in the ungrazed plots (C. helmsii, Eplibium hirsutum, and M.
aquatica). There were a number of other species which occurred in four or more surveys
however the percentage cover of these species was not high enough to meet the criteria (Fig.
17).
Crassula helmsii remained the most dominant species throughout the experiment in both grazed
and ungrazed plots, with the next most abundant species having significantly lower proportional
abundance. However, the dominance of C. helmsii was less distinct in the ungrazed plots, with
lower mean difference and t values (Table 6; Fig. 18).
Table 6. The results of linear mixed effects models, to compare the proportional abundance of the most
dominant species Crassula helmsii to the proportional abundance of the next most abundant species
Mentha aquatica and Epilobium hirsutum. Data from grazed and ungrazed plot treatments were analysed
separately.
Comparison Treatment Mean difference SE t df p
C. helmsii M. aquatica Grazed -34.054 2.150 -15.838 47 < 0.001
C. helmsii M. aquatica Ungrazed -13.424 1.554 -8.637 47 < 0.001
C. helmsii E. hirsutum Ungrazed -16.687 2.115 -7.889 47 < 0.001

77
Figure 17. Abundant and frequently occurring plant species, recorded in grazed and ungrazed plot
treatments. Species classed as ‘abundant’ (shaded bars) had a cover of 10% or higher in at least three of
the six plots, in at least four of the eight sequential surveys. Species which were classed as ‘frequent’ (no
fill) were recorded in at least four of the eight sequential surveys. Species are presented in rank order of
mean abundance (± 1 SE), and data labels refer to the number of surveys in which each species was
recorded.
8
8
8
7 8 5 6 6 4 4 0
10
20
30
40
50
60
70
80
90
100
Mea
n a
bundan
ce (
% c
over
)
Grazed
8
8
8
7 7 7 6 7 5 6 7 5 4 5 0
10
20
30
40
50
60
70
80
90
100
Mea
n a
bundan
ce (
% c
over
)
Ungrazed
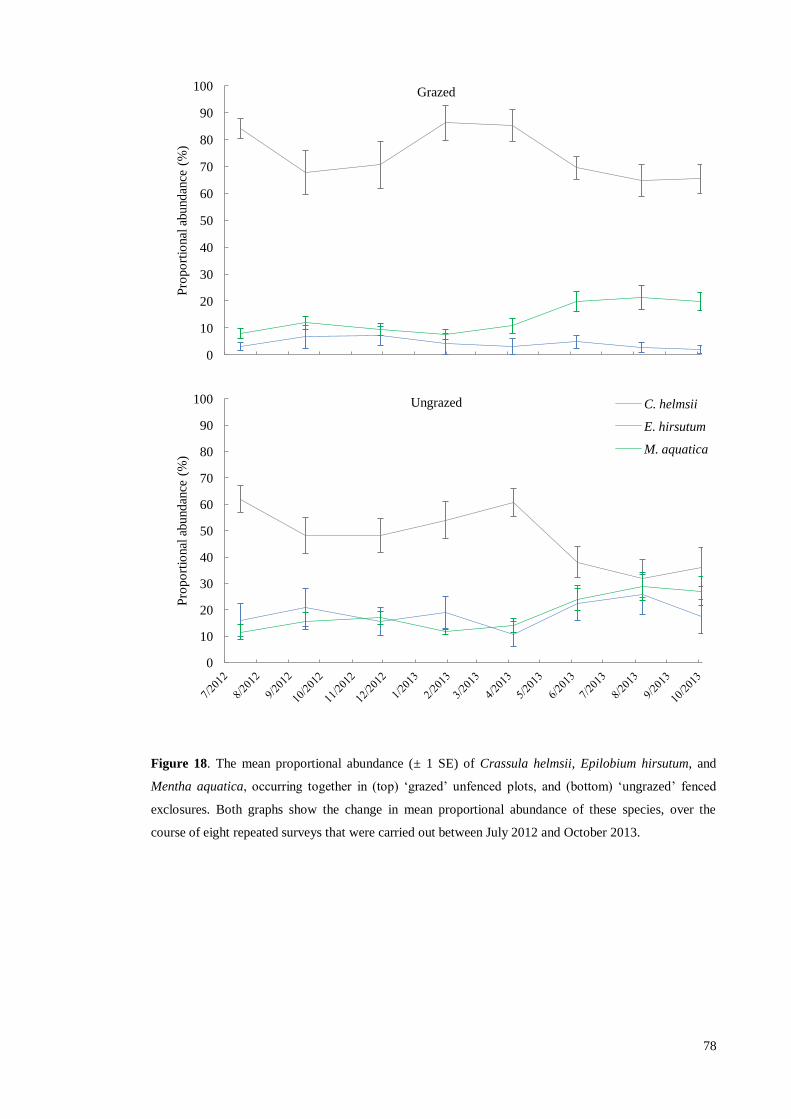
78
Figure 18. The mean proportional abundance (± 1 SE) of Crassula helmsii, Epilobium hirsutum, and
Mentha aquatica, occurring together in (top) ‘grazed’ unfenced plots, and (bottom) ‘ungrazed’ fenced
exclosures. Both graphs show the change in mean proportional abundance of these species, over the
course of eight repeated surveys that were carried out between July 2012 and October 2013.
0
10
20
30
40
50
60
70
80
90
100
Pro
po
rtio
nal
abundan
ce (
%)
Grazed
0
10
20
30
40
50
60
70
80
90
100
Pro
po
rtio
nal
abundan
ce (
%)
Ungrazed C. helmsii
E. hirsutum
M. aquatica

79
5.4. Discussion
The results reported in this chapter indicate that at this site, disturbance from grazing vertebrates
had a significant impact on the structure of the plant community. The abundance of C. helmsii
declined within the ungrazed plots, whilst maintaining very high abundance in the grazed plots.
At the same time the abundance and diversity of the co-occurring plant community was higher
in the ungrazed plots than in the grazed plots.
These results indicate that the presence of grazing vertebrates was advantageous for C. helmsii
at this site. A likely explanation for these results is that C. helmsii benefitted from reduced
interspecific competition in the grazed plots, because species which would have otherwise
competed with C. helmsii were suppressed. Interestingly co-occurring species abundance was
lower in the grazed plots right from the first survey in mid-July 2012, suggesting that
competitors may have been grazed out earlier in the year by either sheep or wildfowl.
Importantly maximum vegetation height was consistently higher in the ungrazed plots. It is
hypothesised that the greater abundance of tall co-occurring plants in the ungrazed plots
restricted access to light for C. helmsii, and resulted in its partial decline. Crassula helmsii also
grew taller in the ungrazed plots and here it is interpreted that this was due to light limitation.
This explanation is consistent with Olff & Ritchie (1998) who discuss that in sites where
nutrients and water are non-limiting, as was the case at Kingfishers Bridge (Beecroft et al. 2007;
chapter three), tall plants which compete strongly for light are likely to dominate the plant
community in the absence of grazing. At Kingfishers Bridge, Epilobium hirsutum had
considerably higher abundance in the ungrazed plots compared to the grazed plots, and
produced taller plants which were the main reason for the increased height of vegetation
recorded in the ungrazed plots. Olff & Ritchie (1998) discuss that when grazing occurs at such
sites, this creates a more open habitat which favours only those plants that are tolerant to
grazing disturbance, and may not serve to increase species diversity. Other than C. helmsii,
Teucrium scordium was the only plant species which had a higher mean abundance and
frequency in the grazed plots. It is known that T. scordium prefers open habitat such as
drawdown zones, and the unmanaged growth of taller, shading vegetation has been linked to the
decline of T. scordium (Beecroft et al. 2007). This species is nationally rare, and classified as
‘endangered’ according to the IUCN Red List definition (Cheffings & Farrell, 2005; JNCC,
2010), and so its response in this experiment is of particular interest.
As well as reductions in competition, C. helmsii may have benefitted directly from grazing
disturbance. For example trampling could have broken up the C. helmsii vegetation, creating
more fragments which could have subsequently rooted. Additionally, the ability of C. helmsii to
grow from nodes along creeping stolons (Dawson & Warman, 1987; EPPO, 2007), may have

80
compensated for shoot tip damage, and given this species a competitive advantage under grazed
conditions (Milchunas et al. 1988; Díaz et al. 2007). However it is not known how extensively
C. helmsii was grazed; although sheep and waterfowl have previously been seen to graze on the
C. helmsii at this site (Cadbury, J. personal communication) during the experiment the C.
helmsii did not appear to be ‘cropped’, instead it formed a dense vegetative mat of between 20
and 40 cm in height.
In laboratory experiments Langdon et al. (2004) showed that mats of C. helmsii vegetation can
significantly suppress the germination success of other plant species. In the present study it is
possible therefore, that the abundance and diversity of co-occurring vegetation was maintained
at a lower level in the grazed plots, because grazing had selectively removed competitors, and
because C. helmsii was preventing subsequent re-recruitment by supressing germination. Baiser
et al. (2008), describe a similar interaction in North American deciduous forests, where
increased browsing on the shrub layer by deer, had suppressed native species and favoured
dense dominating growth of the non-native invasive grass Microstegium vimineum. The authors
describe how regeneration of the native shrub layer was prevented both by strong competition
from M. vimineum limiting seedling growth, and by continued over-browsing by deer.
An interesting further observation from this study site was that in February 2012 when the
experiment began, the C. helmsii vegetation was considerably degraded, although no control
had been attempted since September 2008 (Cadbury, J. personal communication). In January
2013 however the C. helmsii vegetation was thick and vigorous. Whilst data were not collected
on this matter, it was noted that the water levels were considerably lower in February 2012 and
the drawdown zone was exposed, whilst in January 2013 the drawdown zone was inundated.
Crassula helmsii is classed as a hydrophyte (Hill et al. 2004), and so it is hypothesised here that
the higher water levels during the second winter allowed C. helmsii to persist without
degradation.
Additional information is required for further interpretation of this study. Firstly, additional
information about the behaviour of the grazing animals and the condition of the experimental
plots early in their establishment, would serve to confirm what animals grazed-out the
competitors of C. helmsii. To gain this additional information the experiment would have to be
run again, with frequent surveying during the early establishment phase, along with
observations of what animals fed on the drawdown zone at this stage. Secondly, more empirical
work is needed to determine whether C. helmsii directly benefits from grazing disturbance. This
could be done using observational studies to determine which animals graze C. helmsii and how
frequently, and by controlled clipping experiments (Kimball & Schiffman, 2003; Kohyani et al.
2009) to investigate how C. helmsii responds to shoot tip damage. Thirdly, it would be valuable
to ascertain whether C. helmsii has a suppressing effect on Teucrium scordium. The results from
the current study suggest that grazing favours the abundance of C. helmsii, and also favours the
81
persistence of endangered T. scordium. However based on abundance levels, C. helmsii strongly
dominates. A study of this interaction would provide targeted information about the threat C.
helmsii poses to T. scordium in its preferred habitat.
Traditionally light grazing by large vertebrates has been used in conservation to encourage plant
species diversity, by supressing highly competitive and dominating plant species (Natural
England, 2005; McBride et al. 2011). However, this current study is one of a number which
report that grazing is linked to increased abundance of non-native invasive plants (Kimball &
Schiffman, 2003; Baiser et al. 2008; HilleRisLambers et al. 2010; Relva et al. 2010). These
results also concur with publications which highlight the role of disturbance as a factor
facilitating non-native plant invasion and abundance, by making more resources available to the
invader (Davis et al. 2000; Catford et al. 2012). In light of these non-native plant invasions, a
new approach to management may be required, which considers how plant community
competitive dynamics may have altered post-invasion (Seastedt et al. 2008; Firn et al. 2010).
The results of this study indicate that C. helmsii thrives under light grazing as this disturbance
inhibits taller competitors. However, discouraging grazing by vertebrates and allowing taller
vegetation to develop may run against other management objectives; in the case of Kingfishers
Bridge the conservation of Teucrium scordium (Beecroft et al. 2007). A better result may be
reached, not by removing the grazing disturbance, but by altering the conditions and disturbance
regime at the site to disadvantage the invasive plant (Firn et al. 2010). Based on observations
from Kingfishers Bridge the following management regime could be trialled at the site: keeping
the drawdown zone exposed during winter to stress C. helmsii, preventing or restricting grazing
on the drawdown zone during spring to allow competitor species to germinate and establish, and
using grazing later in the season to limit vegetation height.

82
6. Is available bare ground an important pre-requisite to high C.
helmsii abundance?
6.1. Introduction
Reductions in the biomass of plants in a native community have been cited as a mechanism by
which a non-native plant species may successfully invade habitats. For example, the theory of
fluctuating resources (Davis et al. 2000) describes how reductions in native plant cover could
increase the likelihood of invasion, due to reduced competition for resources. Not mutually
exclusive of this, the driver-passenger theory of community change (MacDougall & Turkington,
2005) posits that some non-native invasive plants are the ‘passengers’ of community change,
and become highly abundant under circumstance where they are able to adequately tolerate
changes to the habitat which cause declines in native species. Both of these theories suggest that
the absence of competition from the native plant community presents an opportunity for a non-
native plant to invade and become highly abundant. It also follows that high abundance could be
maintained, if the growth of the non-native invasive species created subsequent conditions of
limited resources which inhibited later developing native competitors (Hager, 2004; Didham et
al. 2005).
Bare ground is a good example of a habitat with low competition and high resource availability.
Furthermore, there is interspecific variation in how well plants can tolerate environments in
which disturbances create bare ground patches (Gross & Werner, 1982; Grime, 2001). Bare
ground patches can be created naturally (Townsend et al. 2008). However, they can also be
created by activities which are designed to control invasive and dominating vegetation, namely
the physical removal and degradation of vegetation (Charudattan, 2001). Thus it is possible that
the activities designed to control non-native invasive plants, may actually promote the
abundance and persistence of some species (Hobbs & Huenneke, 1992). In line with this,
studies which have monitored community regeneration following the clearance of invasive
vegetation, have reported subsequent colonisation by secondary invaders and considerable re-
colonisation by the original non-native invasive species (Hulme & Bremner, 2006; Mason &
French, 2007; Jäger & Kowarik, 2010; Kettenring & Adams, 2011).
To take advantage of available bare ground, it follows that a non-native invasive species must
be able to move into the space before co-occurring native species. Traits such as fast growth,
extensive aboveground production, and lateral spread may aid in competition (Grime, 2001),
and in the literature fast growth rate and high vegetation production are traits which have been
associated with non-native invasive species (Hussner, 2009; Dawson et al. 2011; Graebner et al.

83
2012; Skálová et al. 2013). An advantage could also be gained if a non-native invasive species
begins growth earlier in the season than other species, or responds faster to favourable growing
conditions (Wainwright et al. 2012; Wainwright & Cleland, 2013). This could lead to greater
competitive dominance later in the season, if earlier expansion allowed the non-native invasive
species to achieve a larger size than other species (Abraham et al. 2009; Dickson et al. 2012).
Furthermore, non-native invasive plants with a seasonal growth period which extends later than
its competitors, could gain an advantage by expanding into available space whilst other species
had stopped (Wolkovich & Cleland, 2011).
Crassula helmsii has several traits which may be advantageous when competing for available
bare ground, including high relative growth rate (Minchin, 2008; Hussner, 2009), high
vegetative productivity, and a horizontal growth habit (Dawson & Warman, 1987; EPPO,
2007), allowing mature plants to move into adjacent space on creeping stolons. Being a
perennial which is winter green and experiences little winter die-back (Preston & Croft, 1997;
EPPO, 2007; Minchin, 2008), C. helmsii may also have a longer growing season than many
annuals or deciduous perennials. Furthermore, schemes to remove invasive C. helmsii
vegetation report a high incidence of re-colonisation (Bridge, 2005; Gomes, 2005; Wilton-
Jones, 2005), suggesting that the conditions created during removal are highly suitable for
subsequent C. helmsii growth.
Two separate experiments are described in this chapter, which both assess how well C. helmsii
can compete for available bare ground, compared to native plant species which inhabit the same
habitats. Firstly, a common garden experiment is described which investigated the rate at which
C. helmsii could expand horizontally into unoccupied bare ground, when grown in paired
combinations with native species, and when grown singularly in a control. Secondly, a field
experiment is described which monitored the abundance of C. helmsii, as it naturally colonised
and grew within sample plots in the field. This experiment tested whether plots which initially
had bare ground (lower competition), were colonised more quickly by C. helmsii and developed
higher C. helmsii abundance, than plots which had initially been planted with native vegetation
(higher competition). Within these two experiments, the following questions were asked:
Common garden experiment: 1) Is there a difference in expansion rate between C. helmsii and
the native species? 2) Is the expansion rate of C. helmsii affected by interspecific competition
from native plants? 3) Are the expansion rates of the native plant species affected by
competition from C. helmsii? 4) Which paired species becomes more abundant, C. helmsii or
the native plant?
Field experiment: 1) Does plot treatment have an effect on the speed of C. helmsii colonisation?
2) Does plot treatment have an effect on the abundance of C. helmsii?

84
Assessing how well C. helmsii can compete for bare ground relative to native species has
important relevance for the management of habitats which have been invaded by this non-native
plant. This is because if bare ground favours C. helmsii abundance over other species, then
management activities which create bare ground could inadvertently encourage higher C.
helmsii abundance.

85
6.2. Methods and materials: Common garden experiment
6.2.1. Experimental design
Crassula helmsii was grown in paired treatments with three different native species Anagallis
tenella, Hypericum elodes, and Hydrocotyle vulgaris. These three native species were chosen
because they had been found at the site of the field-based experiment reported in this chapter
(sections 6.4. and 6.5.), and thus were known to naturally co-occur with C. helmsii.
Furthermore, A. tenella, H.elodes, and H. vulgaris were specifically chosen out of the pool of
species at Little Sea because they possessed growth habits similar to C. helmsii; that of low
growing, creeping, perennial herbs of wetland margins (Hill et al. 2004; Stace, 2010).
Therefore, the competitive strength of C. helmsii was being tested, relative to native species
which occupied a similar niche and could potentially be displaced by C. helmsii in the field.
Ahead of the set-up of the common garden experiment, in May 2012 stock cultures were
planted of each of the chosen test species. These stock cultures were planted within plastic
containers (35 cm width x 50 cm length x 20 cm height), two containers per species, which were
filled with aquatic plant compost and saturated with tap water to mimic wetland habitat
substrate. A. tenella, H. vulgaris, and H. elodes plants were purchased from a commercial
aquatic plant specialist (www.lilieswatergardens.co.uk) in May 2012, and additional plants were
purchased from the same supplier in July 2012 to expand the cultures. Crassula helmsii for this
experiment had originally been collected in March 2011 from Studland Nature Reserve in
Dorset (OS grid ref: SZ 035 835). The stock cultures were kept in an outdoor location at
Bournemouth University, Dorset (OS grid ref: SZ 073 937). To shield the cultures from seed
rain and detritus, translucent lids were placed over the plastic containers, which were propped
open to allow for transpiration and to prevent overheating.
The common garden experiment ran for one year, beginning on 14th
September 2012 and ending
on 14th September 2013. Between-species differences in the patterns of seasonal growth activity
can influence the outcome of competitive interactions (Wolkovich & Cleland, 2011;
Wainwright et al. 2012). Thus the timing of this experiment, at the end of summer, meant that
how long each species could continue growing into autumn and how quickly they could resume
growth the following spring, was predicted to have an effect on their overall ability to compete
for available bare ground.
Crassula helmsii was planted in pair-wise combinations with each of the chosen native species,
and all four species were planted in monocultures as a control. Thus there were seven different
planting treatments in this experiment. Each planting treatment was replicated five times,
producing a total of 35 individual replicates. Each replicate was contained within an individual
planting basket, designed for aquatic pond plants, which were 12 cm in height and 16 cm in

86
diameter. Each basket was lined with thin porous fabric and filled to 5 mm below the brim with
aquatic plant compost, which had been homogenised by hand. The same amount was planted
into each replicate by cutting circular plugs of the cultured vegetation 55 mm in diameter, with
trailing stolons trimmed back to a maximum of 5 cm. These plugs of vegetation were cut from
the stock cultures and planted two per basket. A pair-wise treatment therefore contained one
plug of a native species and one plug of C. helmsii, whereas a control contained two plugs of
one species. Plugs were planted in the middle of the basket directly next to each other, and at the
start of the experiment there was available bare compost surrounding the plugs for plants to
grow into (Fig. 19).
Figure 19. Photograph showing the composition of an individual replicate in this experiment. This
particular replicate shows the experimental treatment of Crassula helmsii and Hydrocotyle vulgaris
planted in a pair-wise combination.
The replicates were contained within a single fibreglass pond, in order that the depth and
nutrient status of the water was homogeneous for all replicates. The pond was filled with tap
water to 10 cm depth; this was deep enough to saturate the compost in the pots thus mimicking
marginal wetland conditions, but it was not so deep as to submerge the plants, which would
have compromised the independence of the replicates by allowing vegetation fragments to float
between the planting baskets. During the course of the experiment an outflow was kept open on

87
the side of the pond which evacuated water if the depth increased above 10 cm, and more tap
water was added to the pond if the depth decreased below 10 cm.
The fibreglass pond was located in an outdoor compound, at Bournemouth University. There
was no supplementary temperature or light control, and thus the plants experienced
temperatures (Fig. 20) and a photoperiod which varied according to natural daily and seasonal
variation. The outdoor compound was located adjacent to a building, facing north-east. Shading
from the adjacent building caused a slight photogradient across the experimental area, and so
replicates were placed within the pond in a random arrangement, and were re-arranged every
four weeks. During the morning, this photogradient was estimated to be a difference in PAR of
1.6 x10µmol.m-2
.s-1
. In the afternoon this photogradient was less pronounced, estimated to be a
difference in PAR of 0.5 x10µmol.m-2
.s-1
. The extent of this gradient was estimated by taking
PAR measurements (using a Skye Instruments Ltd. PAR quantum sensor) twice daily at 10:00
and 16:00 hours, at locations nearest to and furthest from the building, over five weeks from 26th
September to 15th
October 2012, and 4th
to 18th
February 2013. The mean difference in PAR in
the morning and in the afternoon was calculated from these data.
Figure 20. The daily maximum (red) and minimum (blue) temperature of water within the pond used for
the planting experiment, during the year in which the experiment was run. Temperature was recorded
using a Tingtag Plus 2 data logger (© Tinytag, 2013).
0
5
10
15
20
25
30
35
Wat
er t
emper
ature
°C

88
6.2.2. Data collection
To measure the expansion in horizontal growth, the cover of vegetation in each replicate as
viewed from directly above, was recorded at the start of the experiment and then once every
four weeks until the end of the experiment. This gave a total of 14 repeated measurements of
cover for each replicate. Documenting the horizontal spread over time served as a non-
destructive method of estimating plant growth.
To record the horizontal cover, photographs were taken of each replicate, and the horizontal
area of cover was calculated from these. All photographs were taken using a Nikon COOLPIX
P100 digital camera mounted on a tripod set to 50 cm high, directly above the planting basket.
The fully automatic mode was used for all photos, and produced JPEG images at a resolution of
300 dpi. Horizontal cover was measured from the photographs, by digitally overlaying a 1000 x
1000 pixel grid onto each photograph, and counting the number of grid cells a plant occupied. A
1000 x 1000 grid cell size was chosen as it was judged to provide the best compromise between
the resolution at which the cover was measured, and the time taken to count the grid cells. The
computer program ImageJ (Schneider et al. 2012) was used for counting; grid cells which
contained vegetation were marked as ‘in’ by clicking with the mouse, and the plugin ‘cell
counter’ provided a tally of the number of grid cells based on the number of mouse clicks. A
binary ‘in/out’ method was used, so that grid cells which contained any amount of vegetation
were classed as ‘in’, and only grid cells which were completely empty of vegetation were
classed as ‘out’. For the paired species replicates, a separate tally was counted for the two
different species in the pair. For the control treatments it became increasingly difficult to
distinguish between the two individual plugs as they grew together, and so a single tally was
counted of both plugs together and this figure was divided by two to give an average per
individual.
As plants in the paired-species treatments expanded, competition for space led to species
overlapping in their cover. When this occurred, one species could be obscured in photographs
due to overtopping by the competing species. To account for this, when photographs were being
taken the amount of overtopped vegetation was estimated and recorded as a percentage, relative
to the amount that was visible from above. The number of grid cells that this overtopped
vegetation represented, was subsequently calculated from the number of grid cells that the
photograph-visible vegetation was counted to represent. These two counts were added together
to give a total grid cell count for each species in each replicate. A limitation to this method was
that it was not possible to determine the extent of overtopping between the two plugs of the
same species in the control treatments.

89
At the end of the experiment, the maximum above-ground height of each species in each
replicate was measured in millimetres, with a precision of one millimetre. The above-ground
biomass was then harvested by cutting the stems at soil level. Vegetation was dried at 90˚C for
48 hours, and then each species in each replicate was separately weighed to a precision of ±
0.001 g to obtain final dry weight values.
6.2.3. Statistical analysis
The raw horizontal cover data, measured as the number of grid cells, were used to calculate the
proportion of space a species occupied, relative to the total amount of space it could occupy. For
the paired-species treatments this was done using the formula:
Proportional cover = (cover of species / total cover)*100
Whereas for the monoculture control treatments this was done using the formula:
Proportional cover = ((cover of species / 2) / total cover)*100
In both formulae, ‘total cover’ represents the summed cover of all plant grid cells, occupied and
unoccupied. Using proportional data accounted for the fact that the extent of cover of each
species was ultimately limited by the area of the plant pot.
These data were used to calculate a rate for the increase in proportional cover of each species, in
each planting treatment. To do this, expansion rate was equated to the value of the slope of the
fitted line in a linear regression model, with proportional cover as the dependent variable and
time in days as the independent variable. Separate linear regression models of proportional
cover predicted by time were calculated for each replicate, providing a slope value for the
expansion rate for each species in each individual replicate.
In this experiment C. helmsii showed two distinct growth phases during the year, one beginning
in autumn 2012 and one beginning in summer 2013, with a decline in vegetative cover between
these growth phases. This meant that the relationship between C. helmsii horizontal cover and
time, over the full year of the experiment, was non-linear. For this reason it was decided to
calculate separate slope values for the two growth phases. In the first growth phase slope values
were calculated for expansion occurring between 14th
September 2012 and 4th
January 2013, and
in the second growth phase slope values were calculated for expansion occurring between 24th
June 2013 and 14th September 2013. In this way, the expansion rates were only calculated for
the parts of the year when C. helmsii was actually expanding, not when it was showing
vegetative decline. For each of the native species, the same growth phases were adhered to
because these represented the times during the year when C. helmsii was expanding, thus
competing more strongly with the native species.

90
Is there a difference in expansion rate between C. helmsii and the native species?
One-way ANOVA was used to test whether there was a significant difference in the mean slope
values between the test species, when each species was grown singularly in the control. Thus
whether there was a difference in expansion rate between the species, in the absence of
interspecific competition. Tukey’s hsd post-hoc tests were used to make specific comparisons
between the mean slope value of C. helmsii and each of the native species. The tests were
conducted separately for the slope values calculated in the first and second growth phases.
Is the expansion rate of C. helmsii affected by interspecific competition from native plants?
One-way ANOVA was used to test whether there was a significant difference in the mean slope
values of C. helmsii grown in different treatments, indicating a between-treatment difference in
the expansion rate. Tukey’s hsd post-hoc tests were used to make specific comparisons between
the mean slope value of C. helmsii in the control and the mean slope value in each of the paired
species treatment, translating to a difference in the expansion rate between C. helmsii grown in
on its own and C. helmsii grown with interspecific competition. These tests were conducted
separately for the slope values calculated in the first and second growth phases.
Are the expansion rates of the native plant species affected by competition from C. helmsii?
Data from each native species was analysed separately. Independent t-tests were used to test
whether there was a significant difference in the mean slope value between the native species in
the control and the native species when paired with C. helmsii. This identified whether there
was a significant difference in the expansion rate between the native species when grown in on
its own, versus when competing with C. helmsii. The tests were conducted separately for the
slope values calculated in the first and second growth phases.
Which paired species becomes more abundant, C. helmsii or the native plant?
Tests were conducted to determine whether there was an asymmetry in the abundance of C.
helmsii compared to the native species it was paired with; a large asymmetry indicating that the
more abundant species was out-competing the other. Two different measures of abundance were
tested, horizontal cover and dry weight.
Horizontal cover was tested using the proportional cover data for the end of the first growth
phase (4th
January 2013), and for the end of the second growth phase (14th
September 2013)
which was also the end of the experiment. In both cases paired t-tests were conducted to test
whether there was a significant difference in horizontal cover between C. helmsii and the native
species it was paired with.

91
Dry weight data was only available for the end of the experiment (14th
September 2013),
because only at this point was destructive sampling conducted. The dry weight data did not
meet the assumption that the numeric difference between the paired values was normally
distributed (Field et al. 2012), and so Wilcoxon’s signed-rank tests were used to test whether
there was a significant difference in dry weight between C. helmsii and the native species it was
paired with.

92
6.3. Results: Common garden experiment
Is there a difference in expansion rate between C. helmsii and the native species?
In the weeks following planting, C. helmsii rapidly spread out to occupy available bare soil.
This was in contrast to the native species, where A. tenella showed a slighter increase in cover,
and H. elodes and H. vulgaris showed declines in cover (Fig. 21). Indeed, in the first growth
phase there was a strong significant difference in the mean slope value between the test species
in the control treatments (F(3, 16) = 63.815, p < 0.001). Tukey’s hsd post hoc tests showed that the
mean slope value was significantly higher for C. helmsii than for A. tenella (mean diff. = 0.141,
p = 0.001), H. elodes (mean diff. = 0.301, p < 0.001), and H. vulgaris (mean diff. = 0.385, p <
0.001). Both H. elodes and H. vulgaris had negative slope values for this phase indicating
negative expansion and thus vegetative decline.
The three native species showed the most pronounced increases in cover during spring and
summer 2013, and at this time the increase in C. helmsii cover was slighter (Fig. 21). Reflective
of this, in the second growth phase there was a significant difference in the mean slope value
between the test species (F(3, 16) = 28.701, p < 0.001), with Tukey’s hsd post hoc tests showing
that the mean slope value was significantly lower for C. helmsii than for and H. elodes (mean
diff. = -0.303, p < 0.001), and that there was no significant difference between C. helmsii and A.
tenella (mean diff. = -0.066, p = 0.401), or H. vulgaris (mean diff. = 0.066, p = 0.682).
Is the expansion rate of C. helmsii affected by interspecific competition from native plants?
In the first growth phase, the C. helmsii control increased in cover rapidly for the first month
and then was shown to plateau at approximately 50 % proportional cover, whilst in the paired-
species treatments C. helmsii was found to keep increasing throughout the measured time period
(Fig. 21). In this growth phase there was a significant difference in the mean slope value
between the four planting treatments (F(3, 16) = 27.540, p > 0.001), in which the slope in the
control treatment was significantly lower than the slope when C. helmsii was paired with A.
tenella (mean diff. = -0.202, p = 0.001), H. elodes (mean diff. = -0.198, p < 0.001), and H.
vulgaris (mean diff. = -0.320, p < 0.001).
In the second growth phase expansion was slower in all treatments, compared to the first growth
phase (Fig. 21). There was no significant difference in the mean slope value between the four
planting treatments (F(3, 16) = 1.952, p = 0.162). However, the mean slope for C. helmsii paired
with H. vulgaris was lower than for the other three treatments: control (mean diff. = -0.252, p =
0.241), A. tenella (mean diff. = -0.283, p = 0.164), H. elodes (mean diff. = -0.173, p = 0.545).

93
Are the expansion rates of the native plant species affected by competition from C. helmsii?
Anagallis tenella. The mean slope value was significantly higher in the control than in the
paired treatment, both in the first growth phase (t(8) = 8.788, p < 0.001), and in the second
growth phase (t(8) = 2.860, p = 0.021).
Hypericum elodes. There was no significant difference in the mean slope value between the
control and the paired treatment in either the first growth phase (t(8) = 0.547, p = 0.599), or in
the second growth phase (t(8) = -0.392, p = 0.706).
Hydrocotyle vulgaris. In the first growth phase, there was no significant difference in the mean
slope value between the control and the paired treatment (t(4.971) = 0.587, p = 0.583). In the
second growth phase, the mean slope value was significantly higher in the paired treatment than
in the control (t(8) = -4.292, p = 0.003).

94
0
10
20
30
40
50
Pro
po
rtio
nal
co
ver
C. helmsii control
0
10
20
30
40
50
Pro
po
rtio
nal
co
ver
H. elodes control
0
10
20
30
40
50 H. vulgaris control
0
10
20
30
40
50
A. tenella control
Figure 21. Continued on next page.

95
C. helmsii paired with H. elodes
C. helmsii
H. elodes
0
20
40
60
80
100
Pro
po
rtio
nal
co
ver
C. helmsii paired with A. tenella
C. helmsii
A. tenella
Figure 21 (and previous page). The mean horizontal cover (± 1 SE) over
time of four species: Crassula helmsii, Anagallis tenella, Hypericum elodes,
and Hydrocotyle vulgaris. For each species, the growth over time is shown
for a single plug of vegetation which was either paired with itself in a
monoculture (control), or paired in a two-species combination.
0
20
40
60
80
100
Pro
po
rtio
nal
co
ver
C. helmsii paired with H. vulgaris C. helmsii
H. vulgaris

96
Which paired species becomes more abundant, C. helmsii or the native plant?
At the end of the first growth phase the mean cover was significantly higher for C. helmsii than
A. tenella (t(4) = 13.078, p < 0.001), significantly higher for C. helmsii than H. elodes (t(4) =
9.033, p = 0.001), and significantly higher for C. helmsii than H. vulgaris (t(4) = 13.598, p <
0.001), when these species were grown in paired treatments (Fig. 22). At the end of the second
growth phase, the mean cover was significantly higher for C. helmsii than for A. tenella, when
these species were grown in a paired treatments (t(4) = 3.410, p = 0.027). There was no
significant difference in mean cover between C. helmsii and H. elodes (t(4) = 0.667, p = 0.541),
or between C. helmsii and H. vulgaris (t(4) = -1.660, p = 0.172) (Fig. 22).
At the end of the experiment, the median dry weight was consistently higher for C. helmsii than
for the paired native species (Table 7), however this between-species difference was not
statistically significant; C. helmsii with A. tenella (p = 0.080), C. helmsii with H. elodes (p =
0.080), C. helmsii with H. vulgaris (p = 0.345), as there was considerable between-replicate
variation (Table 7). Based on the median maximum height data for the end of the experiment, C.
helmsii grew taller than A. tenella but H. elodes and H. vulgaris grew taller than C. helmsii
(Table 8).

97
Figure 22. These graphs show the outcomes of paired t-tests that were used to test for a significant
difference in mean cover between Crassula helmsii and the species it was paired with. Three separate
paired species treatments are shown; (left) C. helmsii with Anagallis tenella, (middle) C. helmsii with
Hypericum elodes, and (right) C. helmsii with Hydrocotyle vulgaris. In these graphs, where the
confidence interval of the mean remains above 0 ‘proportional cover’ on the Y axis this is indicative of a
result where C. helmsii had a significantly higher cover than the species it was paired with. Where the
confidence interval of the mean falls across the X axis (above and below 0 cover), this is indicative of a
result where there was no significant difference in cover between the paired species.
-60
-40
-20
0
20
40
60
80
100
C. helmsii + A. tenella C. helmsii + H. elodes C. helmsii + H. vulgaris
Pro
po
rtio
nal
co
ver
Growth phase 1
-60
-40
-20
0
20
40
60
80
100
C. helmsii + A. tenella C. helmsii + H. elodes C. helmsii + H. vulgaris
Pro
po
rtio
nal
co
ver
Growth phase 2

98
Table 7. The dry weight of vegetation harvested at the end of the experiment. The data are shown for
three separate paired treatments; Crassula helmsii paired with Anagallis tenella, C. helmsii paired with
Hypericum elodes, and C. helmsii paired with Hydrocotyle vulgaris.
Planting treatment Species Dry weight (g)
Median Min Max
C. helmsii + A. tenella C. helmsii 4.428 2.651 6.331
A. tenella 1.706 1.029 2.909
C. helmsii + H. elodes C. helmsii 2.297 2.090 2.575
H. elodes 0.859 0.445 2.421
C. helmsii + H. vulgaris C. helmsii 2.607 0.206 3.598
H. vulgaris 1.287 0.624 2.340
Table 8. The maximum height of species as measured at the end of the experiment. The data are shown
for three separate paired treatments; Crassula helmsii paired with Anagallis tenella, C. helmsii paired
with Hypericum elodes, and C. helmsii paired with Hydrocotyle vulgaris.
Treatment Species Max height (mm)
Median Min Max
C. helmsii + A. tenella C. helmsii 50 45 53
A. tenella 33 31 41
C. helmsii + H. elodes C. helmsii 42 36 55
H. elodes 56 37 91
C. helmsii + H. vulgaris C. helmsii 47 11 55
H. vulgaris 54 36 59

99
6.4. Methods and materials: Field experiment
6.4.1. Experimental design
Experimental plots were set up along a stretch of the drawdown zone bordering Little Sea lake,
within Studland Nature Reserve, Dorset, UK (OS grid ref: SZ 035 835). Studland nature reserve
is owned and managed by the National Trust, and encompasses successional sand dune habitat
transitioning into wet heathland. Little Sea is a land-locked lake which exists within this
transitional habitat, receiving fresh, acidic oligotrophic water as run-off from the heathland
(JNCC, n.d).
This site was chosen for the experiment due to its recent history of C. helmsii colonisation and
subsequent control efforts. Crassula helmsii had been found on the drawdown zone of Little Sea
in August 2007, and was described as being frequent but not dominant. In October 2008 C.
helmsii was cleared by hand from three adjacent patches of this drawdown zone, and these
patches were covered with black plastic sheeting to block access to light and thus prevent re-
growth (Peters, A. personal communication). In May 2011 it was judged that all C. helmsii
under the plastic would have been destroyed and so the plastic sheeting was removed. All
vegetation underneath the plastic had degraded revealing bare mud, but despite this success, C.
helmsii was still found growing around the edges of the plastic and elsewhere in the lake,
meaning that there was a high potential for this species to re-colonise the cleared area.
The experiment was set up on the 28th of June 2011 following removal of the plastic sheeting.
As described above, three patches of bare mud had been created which were 24, 3, and 16 m2 in
area. These patches all occurred within an 80 m stretch of the drawdown zone and were at an
equal distance from the edge of the water. These three patches were considered as a single site
due to their close proximity to one another, because they experienced the same abiotic
conditions, and were exposed to the same plant species pool. Within these bare mud patches, 75
square plots of 50 cm2 were marked out using string and bamboo canes (Fig. 23). As a way of
trying to ensure that all plots received similar levels of water and nutrients, the plots were
specifically placed on bare mud which was damp but not inundated and was free of any
remaining rotting wood. For the majority of the experiment the plots were situated in marginal
habitat above the level of the water, however visits to the site found that the plots were
inundated in June 2012 and in March 2013.
The 75 plots were divided into three treatments groups, with 25 plots per treatment group.
Individual plots were randomly assigned to one of the three treatment groups, ensuring that
there was a random distribution of the three treatments across space. The three treatment groups
were:

100
1) Left as bare ground: nothing was done to the plots during the set-up. At the start of the
experiment they consisted of 50 cm2 of bare mud.
2) Planted with grass dominated vegetation: at set-up a 25cm2 square of turf was transplanted
into the middle of the plots. This turf consisted mainly of the grass species Agrostis stoloniefera.
3) Planted with moss dominated vegetation: at set-up a 25cm2 square of turf was transplanted
into the middle of the plots. This turf consisted mainly of the moss species Sphagnum
cuspidatum.
A. stolonifera and S. cuspidatum were selected because they were growing in abundance at the
site immediately surrounding the cleared experimental area, and were therefore judged to be
strong competitors in that plant community. The grass dominated turf contained at least 80 % A.
stolonifera, and the moss dominated turf contained at least 90 % S. cuspidatum. Because the
mature vegetation was obtained from a natural community it was not possible to collect mono-
specific turf sections. Within the turf were also small amounts of Hydrocotyle vulgaris,
Hypericum elodes, Anagallis tenella and Juncus spp., and some mixing of S. cuspidatum and A.
stolonifera. Importantly all turf was checked to ensure that it did not contain any fragments of
C. helmsii.

101
Figure 23. Photograph showing a section of the drawdown zone at Little Sea lake, shortly after the 75
experimental plots were set-up in summer 2011. Plots of all three treatments groups are included in the
image; (1) bare ground, (2) grass dominated, and (3) moss dominated.
6.4.2. Data collection
The 75 experimental plots were surveyed during the spring, summer, and autumn of 2011 to
2013. Surveys were planned to be repeated once every six weeks during these seasons. However
the logistics of reaching the experimental area, which could be accessed only by boat, meant
that the length of time between surveys varied between four and seven weeks. In total the
survey was repeated 13 times: 24th August and 9
th November 2011, 24
th April, 14
th June, 24
th
July, 29th August, 2
nd October, and 8
th November 2012, 8
th May, 14
th June, 12
th July, 13
th
August, and 26th
September 2013.
For each survey, data were collected on the percentage cover of C. helmsii, the species identity
and the percentage cover of co-occurring vegetation. The spatial location of each experimental
plot was recorded with an accuracy of c. 10 cm, using a Leica Viva differential GPS rover and
reference station.
1
3
2

102
6.4.3. Statistical analysis
Does plot treatment have an effect on the speed of C. helmsii colonisation?
A test was conducted to see if there was an effect of plot treatment, on how quickly C. helmsii
colonised a plot. The speed of colonisation was quantified by determining for each of the 75
experimental plots, the survey in which C. helmsii was first recorded to occur. This dataset had
a large positive skew which could not be overcome using data transformation methods, and so a
Kruskal-Wallis test was used to analyse whether there was a significant difference between bare
ground, grass dominated, and moss dominated plot treatments, regarding when C. helmsii was
first recorded.
Does plot treatment have an effect on the abundance of C. helmsii?
Data from all 13 surveys were included in a single linear mixed effects model, to test whether
plot treatment had a significant effect on mean C. helmsii abundance. Before analysis, the
percentage cover data for C. helmsii were arcsine transformed (see Chapter 2, section 2.2). The
linear mixed effects model was run using the R package ‘nlme’ (Pinheiro et al. 2013). ‘Crassula
helmsii abundance’ was set as the dependent variable and ‘plot treatment’ as the fixed factor,
with ‘survey number’ included as a random factor to account for the repeated measures. The
covariance structure ‘corCAR1()’ was specified in the model, because the repeated surveys had
been conducted at unequally spaced time intervals (Field et al. 2012).

103
6.5. Results: Field experiment
At the first survey after set-up C. hemsii had colonised 26 experimental plots across a wide
distribution of the experimental area, and this species continued to spread into and colonise
adjacent plots throughout the experiment (Fig. 24). During the two years when surveying was
conducted, C. helmsii was recorded to have occurred in 71 out of the 75 experimental plots.
However C. helmsii did not persist in all of these plots; at the end of the experiment this species
was recorded to occur in 59 plots, having disappeared from three control plots, three grass
dominated plots, and six moss dominated plots.
Other plants were colonising and spreading across the experimental area alongside C. helmsii.
The amount of co-occurring vegetation cover recorded in the bare ground plots increased over
time, reaching a similar amount of cover as in the planted plots by summer 2012 (Fig. 25). The
dominance of A. stolonifera and S. cuspidatum decreased within their respective plot treatments,
reaching a similar and lower level of abundance in all treatments by the end of 2012 (Fig. 25).
There was a particularly sharp decline in A. stolonifera and S. cuspidatum abundance between
14th June and 24
th July 2012, which may have been caused by inundation of the plots in June
2012. Based on these changes in the plant community, the contrast in competitive pressure
between the different plot treatments created at the start of the experiment, could only be seen to
have persisted during the first year of the two-year experiment.

104
84790
84800
84810
84820
84830
84840
84850
84860
84870
84880
84890
402870 402875 402880 402885 402890 402895 402900 402905 402910 402915 402920
No
rthin
g
Survey 1 - 24/08/11 Absent
Present
84790
84800
84810
84820
84830
84840
84850
84860
84870
84880
84890
402870 402875 402880 402885 402890 402895 402900 402905 402910 402915 402920
No
rthin
g
Survey 6 - 29/08/12 Absent
Present
Number of plots where
C. helmsii present = 26
Number of plots where
C. helmsii present = 56
Figure 24. Continued on next page.

105
Figure 24 (and previous page). Each data point represents one of the 75 experimental plots. These plots
are arranged on the graph based on their easting and northing coordinates (coordinate system: WGS
1984), providing an accurate representation of how the plots were arranged in space relative to one
another. The data points coloured green represent plots where Crassula helmsii was recorded to occur, on
the first (survey 1), middle (survey 6), and last (survey 13) surveys of the two-year experiment, and thus
indicate the spread of C. helmsii across the experimental area over time.
84790
84800
84810
84820
84830
84840
84850
84860
84870
84880
84890
402870 402875 402880 402885 402890 402895 402900 402905 402910 402915 402920
No
rthin
g
Easting
Survey 13 - 26/09/13 Absent
Present
Number of plots where
C. helmsii present = 59

106
0
10
20
30
40
50
Mea
n a
bundan
ce (
% c
over
)
A. stolonifera
0
20
40
60
80
100
Mea
n a
bundan
ce (
% c
over
)
Other vegetation
Figure 25. The mean abundance (± 1 SE) of vegetation recorded over two years,
in three different planting treatments; 1) left as bare ground, 2) planted with grass
dominated vegetation, or 3) planted with moss dominated vegetation. Data are
shown for the abundance of Agrostis stolonifera the dominant grass species,
Sphagnum cuspidatum the dominant moss species, and for the summed
abundance of all other species excluding Crassula helmsii.
0
10
20
30
40
50
Mea
n a
bundan
ce (
% c
over
)
S. cuspidatum Bare ground Grass dominated Moss dominated

107
Does plot treatment have an effect on the speed of C. helmsii colonisation?
There was no significant difference between the plot treatments, regarding the median value of
when C. helmsii was first recorded (H = 0.817, p = 0.665). Meaning that plot treatment did not
have a significant effect on the time when C. helmsii first colonised a plot, and therefore that C.
helmsii colonised plots of all three treatments at a similar speed. In all plot treatments, there
tended to be a higher frequency of first occurrence within the earlier surveys (Fig. 26).
Figure 26. Each bar represents the frequency of experimental plots within a survey where Crassula
helmsii was recorded for the first time; indicating recent colonisation. The X axis categories relate to each
of the 13 repeated surveys, arranged in chronological order, and the data are split into three graphs to
separately describe colonisation into (top) bare ground, (middle) grass dominated, and (bottom) moss
dominated experimental treatments. There were 25 plots in each experimental treatment.
0
2
4
6
8
10
12
Fre
quen
cy o
f plo
ts
Bare ground
0
2
4
6
8
10
12
Fre
quen
cy o
f plo
ts
Grass dominated
0
2
4
6
8
10
12
Fre
quen
cy o
f plo
ts
Moss dominated

108
Does plot treatment have an effect on the abundance of C. helmsii?
There was no significant effect of plot treatment on the mean abundance of C. helmsii (F(2, 960) =
1.124, p = 0.325), and the increase in abundance over the course of the experiment was similar
in plots of all three treatments (Fig. 27). Crassula helmsii did not come to dominate the plant
community in any of the three plot treatments (Fig. 28).
Figure 27. The mean abundance (± 1 SE) of Crassula helmsii recorded over two years, in three different
planting treatments; 1) left as bare ground, 2) planted with grass dominated vegetation, or 3) planted with
moss dominated vegetation.
0
5
10
15
20
Mea
n
abundan
ce (
% c
over
)
Bare ground
Grass dominated
Moss dominated

109
Figure 28. The mean abundance (± 1 SE) of the most abundant and frequently occurring species as
recorded in the final survey of the experiment (26.09.13). The species shown are those which had a mean
abundance of greater than 5 % cover. The number of plots in which each species was recorded is shown
above the corresponding bar on the graph.
25
17 20 16 19
18
0
10
20
30
40
Hypericum
elodes
Juncus
effusus
Juncus
bulbosus
Agrostis
stolonifera
Crassula
helmsii
Hydrocotyle
vulgaris
Mea
n a
bundan
ce (
% c
over
)
Bare ground
26.09.13
21 25
22 21
18 20
0
10
20
30
40
Agrostis
stolonifera
Hypericum
elodes
Juncus
effusus
Crassula
helmsii
Hydrocotyle
vulgaris
Juncus
bulbosus
Mea
n a
bundan
ce (
% c
over
)
Grass dominated
26.09.13
25
20 19 15
19 19
0
10
20
30
40
Hypericum
elodes
Juncus
bulbosus
Crassula
helmsii
Agrostis
stolonifera
Juncus
effusus
Hydrocotyle
vulgaris
Mea
n a
bundan
ce (
% c
over
)
Moss dominated
26.09.13

110
6.6. Discussion
6.6.1. Common garden experiment
The significantly higher expansion rate of the C. helmsii control compared to the native species
controls, during the first growth phase, is reflective of the fact that C. helmsii was able to begin
expansion in the weeks directly following planting and to rapidly increase in horizontal cover
during this time period. In contrast, the native species showed little or no horizontal expansion
during the same period. The timing of the common garden experiment is likely to have affected
this result, by influencing the ability of the test species to respond to available bare ground at
the start of the experiment, which was in September and thus at the end of the main growing
season in the UK. It is possible that if the experiment had begun earlier in the growing season,
the seasonally declining species H. elodes and H. vulgaris (Hill et al. 2004; Stace, 2010) may
have shown a greater initial response. The results from this experiment did not find that C.
helmsii had an intrinsically faster expansion rate than the natives, because during the second
growth phase when all four species showed horizontal expansion, the results from the control
treatments found that C. helmsii did not have a significantly higher expansion rate than A.
tenella or H. vulgaris, and indeed had an expansion rate which was significantly lower than H.
elodes. To separate the effects of innate response speed and season, additional experiments
could be conducted which measure the response speed of the test species at different stages
during the growing season, similarly to Barrat-Segretain & Amaros (1995) who compared the
speed at which aquatic vegetation recovered after disturbance, in summer (July) and winter
(December).
During the first growth phase, the expansion rate of C. helmsii was significantly lower in the
control than when C. helmsii was paired with the native species. From observation of the cover
over time graphs, it can be seen that this result was obtained because C. helmsii cover reached a
plateau much sooner in the control than in the paired species treatments, and so when expansion
was calculated over the whole of the first growth phase (five months), the slope value for the
control was lower. In fact, the reason that expansion ceased much earlier in the control was
because C. helmsii had expanded to occupy nearly all available bare ground by the end of the
first month; both of the two plugs of C. helmsii vegetation had expanded to cover on average of
50 % of the total available space. In contrast, the native species which were paired with C.
helmsii showed little expansion during the first growth phase and so the single plug of C.
helmsii could continue on expanding much further across the space in the pot. In this first
growth phase therefore, it can be concluded that interspecific competition from the native
species was minimal and C. helmsii expansion was much more limited by intraspecific
competition. In the second growth phase there was no significant difference in the expansion

111
rate of C. helmsii between the control and the paired-species treatments. By this stage in the
experiment, the native species within the paired-species treatments were also showing
expansion, and so the strength of interspecific competition may have been greater in this second
growth phase, imposing greater limits on the expansion rate of C. helmsii. It should be noted
that even in the second growth phase, the effect of interspecific competition was not
significantly greater than intraspecific competition. The general negative trend of expansion in
C. helmsii paired with H. vulgaris, suggests that this native species may have limited the
expansion of C. helmsii to a greater extent than the other native species or C. helmsii itself,
however further replication of this experiment would be required to confirm this result as there
was considerable variation in the data for this treatment.
The expansion rate of A. tenella was significantly lower when paired with C. helmsii compared
to the A.tenella control, suggesting that competition from C. helmsii limited the expansion rates
of this native species. The results from this experiment also show that when C. helmsii was
paired with A. tenella the proportional cover was consistently higher for C. helmsii than for the
native. This gives further indication that C. helmsii was the dominant species and able to limit
the growth of A. tenella. It is important to note that A. tenella was not totally excluded from any
of the replicates during the course of the experiment, although it is possible that if the
experimental treatment had been carried on then continued competition for resources may have
lead to the species’ decline.
The expansion rate of H. elodes was not found to be affected by C. helmsii, and the expansion
rate of H. vulgaris was higher in the paired-species treatment compared to the control.
Furthermore, the asymmetry in cover C. helmsii gained, during the first half of the experiment,
did not prevent H. elodes and H. vulgaris from expanding rapidly during the second growth
phase, and achieving a similar amount of cover to C. helmsii by the end of the experiment. Thus
this experiment did not find evidence that C. helmsii was competitively dominant, compared to
H. elodes and H. vulgaris. It is hypothesised here, that the height of the native species relative to
C. helmsii may have influenced the competitive outcomes in this experiment; both H. elodes
and H. vulgaris had a greater maximum height than C. helmsii, and so may have been able to
compete by producing taller growth which overtopped the already present C. helmsii vegetation.
This hypothesis is in line with Hejda et al. (2009), who reported that the height of non-native
invasive plant species, relative to other competing species, was strongly associated with their
level of impact on native plant communities; the greater the relative height of a non-native
invasive plant, the greater the negative impact on species diversity.

112
6.6.2. Field experiment
The results of this experiment suggest that this species is adept at re-colonising cleared patches
of ground. Indeed four weeks into the two-year experiment C. helmsii had appeared in 35 % of
all plots. It is possible therefore, that there was no significant difference in the speed at which
this species colonised the two planted treatments compared to the bare ground treatment,
because C. helmsii had been able to disperse to and colonise the remaining bare ground within
the planted plots, before the transplanted natives could spread out and occupy the space.
The creeping horizontal growth of C. helmsii was suggested in the introduction to this chapter
(section 6.1.) to be an important mechanism for colonising bare ground. However in the case of
this experiment, the scattered distribution of C. helmsii occupied plots recorded in the first
survey suggests that many plots may have been separately colonised by individual vegetative
propagules (Barrat-Segretain & Amoros, 1996), with creeping growth likely contributing to
subsequent horizontal spread. The dispersal of clonal propagules has also been highlighted in
other non-native invasive plants as a mechanism for extensive colonisation of an invaded area
(Aguilera et al. 2010; Lin et al. 2012), and it is known that C. helmsii can disperse via this
mechanism as well as by creeping horizontal growth (Dawson & Warman, 1987; EPPO, 2007).
In the field experiment, no significant difference was found in the abundance of C. helmsii
between the plots which were initially bare ground, and the plots into which native vegetation
was transplanted. The results showed that C. helmsii obtained a similar abundance within all
three treatments, suggesting that manipulating the amount of competition at the start of the
experiment did not have an effect on the abundance of this species. It is possible that this result
reflects that C. helmsii was able to increase in abundance despite competition from native
vegetation in the planted plots. Such an interaction however, would imply that the non-native
invasive species was competitively stronger than the native species, as has been found in
previous studies of non-native invasive-native plant community interactions (Flory & Clay,
2010; French, 2012). However, the data from the present experiment showed that C. helmsii did
not dominate the plant community. Alternatively, this non-significant this result could indicate
that over time the level of competitive pressure from native species equalised across the three
treatments, thus imposing similar limits on C. helmsii abundance. There is more evidence to
support this second hypothesis that the level of competitive pressure equalised, indeed data
showed that the abundance of native vegetation occurring in each of the three treatments had
converged by the mid-point in the experiment.
A major factor in the convergence of competitive pressure between the three plot treatments was
likely to have been the growth of native species within the bare ground plots which could
compete strongly against C. helmsii. To illustrate this, H. elodes was the most abundant species
recorded in the bare ground plots at the end of the experiment and H. vulgaris was also
relatively abundant. Indeed in a separate study of temperate wetland plants, Houlahan & Findlay

113
(2004) found that the native species chosen for the study were equally likely to be competitively
dominant as the non-native species. Furthermore, germination of plants from the seed bank has
been known to promote the development of the native plant communities following clearance
disturbances (Jäger & Kowarik, 2010), and this could have been the case within the bare ground
plots at Little Sea. The level of competitive pressure may also have equalised during the
experiment, due to a reduction in the competitive pressure within the planted plots. In particular
this may have occurred when the plots were inundated by lake water in June 2012 and in March
2013, because inundation can damage or uproot plants and can cause deposition of sediment
layers (Bornette & Puijalon, 2011) resulting in a loss of vegetation cover.
It would be valuable to repeat the field experiment at a different site. Little Sea is characterised
by low levels of plant available nutrients (JNCC, n.d) and the margins of the lake experience
disturbance due to inundation and wave action (personal observation). It is possible that at
another site with lower levels of inundation disturbance or higher nutrient levels, plant growth
may have been less limited, thus allowing stronger competitive interactions to develop between
species (Huston, 2004).
6.6.3. Is available bare ground an important pre-requisite to high C. helmsii abundance?
It was found that C. helmsii could respond to available bare ground ahead of native competitors,
and that it quickly re-colonised bare ground in the field. As such, a faster response to available
bare ground could allow to C. helmsii to grow and to utilise the resource before other species,
and could thus lead to C. helmsii becoming proportionally more abundant in the developing
plant community, as has been found for other non-native invasive species (Abraham et al. 2009;
Dickson et al. 2012). Furthermore, C. helmsii showed a strong growth response in autumn when
other species were no longer growing. This is another mechanism which has been described as
facilitating the success of other non-native invasive plants (Wolkovich & Cleland, 2011), and
which could also allow C. helmsii to spread into bare ground ahead of native competitors,
allowing it to increase in abundance whilst other species are dormant or declining.
The results showed that the spread of C. helmsii was not strongly limited, despite the presence
of native competitors. On the other hand C. helmsii was not found to totally exclude any of the
native species in these experiments, and was not found to dominate the plant community. Based
on these results therefore, it may be interpreted that competition from native species is unlikely
to prevent C. helmsii spread or prevent this species from becoming relatively abundant within a
plant community in the field, but the presence of strong native competitors could nevertheless
impose some limits on abundance and prevent the invasive species from becoming dominant.
As such, bare ground conditions which lack native competitors would very likely facilitate
higher C. helmsii abundance.

114
7. Can the invasion of C. helmsii negatively affect the plant community
in a Phragmites australis dominated fen habitat?
7.1. Introduction
A non-native invasive plant can achieve high abundance in plant communities where it is a
stronger competitor than the resident native species, and in such cases, strong competition from
the non-native can lead to the displacement of resident plants (Levine et al. 2003; Allred et al.
2010; Corbin & D’Antonio, 2010). A localised decline in plant abundance and diversity is
therefore commonly highlighted as a negative impact caused by the invasion of a non-native
plant (Vilà et al. 2011; Pyšek et al. 2012b). The magnitude of these reductions varies
considerably however (Ricciardi & Cohen, 2007; Vilà et al. 2011; Pyšek et al. 2012b), and
indeed there are examples where significant reductions have not been detected (Mills et al.
2009; Meffin et al. 2010). In part, this variation is related to the specificity of competitive
outcomes between a particular non-native invasive plant and the resident species (Hejda et al.
2009; Thiele et al. 2010). Indeed some native resident species can be as strong or a stronger
competitor, and provide biotic resistance against community dominance by the non-native
invasive species (Levine et al. 2004; DeWine & Cooper, 2008; Meyer et al. 2010). Other
species however, may be particularly vulnerable to displacement because they are unable to
compete with the invader or because they are naturally scarce (Walck et al. 1999; Miller &
Duncan, 2004; Thiele et al. 2010). Understanding which non-native invasive plants have the
greatest impacts on biodiversity and which native species are more vulnerable to invasion is an
over arching theme in invasion ecology (Davis, 2009), and also has a practical application for
conservation by highlighting which communities and species most require protection from non-
native invaders (Parker et al. 1999; Byers et al. 2002).
Because a decline in resident plants is a recognised indicator of an invasion impact, it is useful
for preliminary research into the impacts of a non-native invader, to test communities for an
inverse pattern between non-native abundance and resident plant abundance and diversity
(Houlahan & Findlay, 2004; Gerber et al. 2008; Davies, 2011). If such patterns are detected,
further research is justified to understand the mechanisms behind the relationship and whether
the non-native invasive plant is the driver (HilleRisLambers et al. 2010; Murrell et al. 2011).
Studies can look at the impacts on plants as classified taxonomically (Tererai et al. 2013) and
plants as classified by their functional traits (Hejda, 2013). Moreover, it is valuable to
investigate both species diversity and functional diversity for associations, because these two
community measurements are not necessarily correlated (de Bello et al. 2006). Importantly, by
investigation of exactly which species and functional traits decline with increasing non-native

115
invasive plant abundance, it may be possible to determine associations between the possession
of certain traits and a negative response to invasion (Mason & French, 2008; Hejda, 2013), and
so enable predictions to be made regarding what other potentially co-occurring species could be
vulnerable (Drenovsky et al. 2012).
Non-native invasive plants may not be detected in the field until they are well established
(Hulme, 2006), meaning that information relating to community change during the initial stages
of an invasion may not be available for a field site, as described by D’Antonio et al. (1998). In
such cases identifying differences between highly invaded locations and those which are little or
un- invaded, is useful for inferring how the invasion process may have altered the plant
community, and has thus been widely utilised to investigate the impacts of specific non-native
invasive species on the abundance and diversity of resident plants (e.g. Hejda & Pyšek, 2006;
Gerber et al. 2008; Hejda et al. 2009; Aguilera et al. 2010; Stiers et al. 2011). In this study, such
field data were collected from across a range of C. helmsii abundance, which was located within
Phragmites australis (common reed) dominated fen. This is a habitat in which the shallows and
margins of freshwater lakes are managed to maintain stands of P. australis, interspersed with
open patches occupied by a more diverse assemblage of herbaceous species. This type of habitat
is considered beneficial for biodiversity, and in particular P. australis stands (reedbeds) provide
shelter and feeding opportunities for species of wetland birds and their chicks (McBride et al.
2011). The displacement of P. australis by a non reedbed forming plant such as C. helmsii could
have negative ecological impacts beyond the plant community. P. australis itself is a tall (≤ 3.5
m), perennial graminoid, which forms dense reedbeds in fresh and brackish water habitats,
growing marginally or as an emergent (Rose, 1989; Hill et al. 2004). It is a native community
dominant in UK freshwater habitats (Rodwell, 1998) and a highly competitive and invasive
species in North America (Chambers et al. 1999; Ailstock et al. 2001).
The aim of the study was to investigate whether C. helmsii could achieve high abundance by
displacing plants in the resident community, and in this way find evidence that the invasion of
C. helmsii into P. australis dominated fen was having a negative impact on the resident plant
assemblage. Evidence in this case was given to be negative correlations between C. helmsii
abundance and variables of abundance and diversity in the resident plant community; patterns
which are consistent with the displacement of species. Toward this aim comparisons were made
between three elements of the plant community. Firstly, field surveyed data were analysed for a
correlation between C. helmsii and P. australis, giving an indication of whether these two
species were in competition and could potentially displace or suppress each other. Secondly,
data were analysed for a correlation between C. helmsii and the subordinate herbaceous
community, giving an indication of whether C. helmsii was displacing these species. Thirdly,
the correlation between C. helmsii and the subordinate herbaceous community was compared to
the correlation between P. australis and the subordinate herbaceous community, providing an

116
indication of the relative impact of C. helmsii in the community compared to a strongly
competing native species. Correspondingly three questions were asked: 1) Is there evidence that
C. helmsii is in competition with P. australis? 2) Is there evidence that C. helmsii has displaced
plant species in the subordinate plant community? 3) Is the impact of C. helmsii on the
subordinate plant community, greater than the impact of P. australis on the subordinate plant
community?

117
7.2. Methods and materials
7.2.1. Data collection: plant species
Field survey data used in this chapter were collected from three ‘sites’ in Cambridgeshire, UK.
These were: Fen Drayton, Kingfishers Bridge, and Ouse Fen. Within each of these sites, data
were collected from sample locations of 1m2, which were located along the margins of lakes.
Stands of P. australis occurred frequently and at high densities along these margins, and C.
helmsii was also known to have invaded the margins. The sample locations were distributed in a
stratified sampling design, and in total 51 sample locations were visited across the three sites.
The methods by which these sampling locations were selected, is explained in detail in chapter
two, section 2.1.
In each sample location the abundances of C. helmsii and P. australis were recorded as
estimates of percentage cover. All other co-occurring plants were identified to species using
standard keys for vascular plants (Rose, 1989; Rose, 2006), and the percentage cover was
estimated separately for each species. The amount of bare ground, representing an absence of
co-occurring vegetation, was also recorded as an estimate of percentage cover. Surveying of the
plant community was carried out between 16th
July and 23rd
August 2012, and was conducted
simultaneously with the collection of the abiotic data presented in chapter three.
7.2.2. Data collection: plant traits
All 40 co-occurring species recorded in the field survey were categorised based on a number of
plant traits. Seven different trait categories were included in this analysis, within which were
nested 28 traits (Table 9). The trait categories were chosen based on how a species occupies the
space (morphology), when it occurs (seasonality), and how it spreads into new space
(reproduction). Data relating to morphology, seasonality, and reproduction were chosen for this
analysis as it was considered that such traits could play a role in determining how well a species
could compete for space.
Trait data were sourced from online databases of plant species traits (Fitter & Peat, 1994; Hill et
al. 2004; Kleyer et al. 2008), and from botanical keys (Rose, 1989, 2006). The databases were
used as the primary source of trait information and provided the majority of the trait data for the
species included in the analysis, whilst the floral keys were a secondary source and only referred
to when information on a trait could not be found within the databases. A trait matrix was
produced from these data, which listed the specific traits of each species, data on how frequently
each species occurred, and the mean overall abundance of each species (appendix III).

118
Table 9. The plant trait categories used to group the species that were recorded in the field survey, and
the traits nested within each category. For each category, an explanation is given of how species were
categorised.
Category Explanation of traits
Main reproductive
strategy:
The most frequently utilised method of reproduction. Species were categorised as
either utilising ‘sexual’, ‘clonal’, or ‘sexual and clonal’ strategies.
Primary clonal
organs:
Whether a species produces clonal organs, and if so of what form. Species were
categorised as primarily possessing vegetative ‘fragments’, aboveground ‘stolons’,
or belowground ‘rhizomes’.
Leaf persistence: For how long a species maintains its leaves throughout the year. Species were
categorised as either ‘aestival’, ‘semi-evergreen’, or ‘evergreen’.
Typical maximum
height:
The maximum height a species typically grows to. Species were classed as ‘short’ if
they had a typical maximum height of 0.1 – 25cm, classed as ‘medium’ if they had
a typical maximum height of 26 – 50 cm, classed as ‘tall’ if they had a typical
maximum height of 51 - 100 cm, and classed as ‘v.tall’ if they had a typical
maximum height of greater than 100 cm. Species were classed as ‘floating’ if their
maximum height was dependent on the water depth.
Typical stem
position:
The natural orientation of the main stem. Species were categorised as ‘erect’,
‘prostrate’, climbing’, or ‘floating’.
Typical leaf area: The area to which the leaves of a particular species typically grow to. The system of
categorisation used in the Ecoflora trait database (Fitter & Peat, 1994), which had
four categories (0.1 – 1, 1 – 10, 10 – 100, and 100 – 1000 cm2), was adapted so that
leaves of 0.1 – 2 cm2 were categorised as ‘very small’, leaves of 1 – 10 cm
2 as
‘small’, leaves of 10 – 100 cm2 as ‘medium’, and leaves of 100 – 1000 cm2 as
‘large’.
Leaf dimensions: How wide compared to long the leaves a particular species are. The system of
categorisation used in the Ecoflora trait database (Fitter & Peat, 1994), which had
three categories (> 3x as long as wide, 1 – 3x as long as wide, and length = width),
was adapted so that leaves > 3x as long as wide were categorised as ‘narrow’,
leaves 1 – 3x as long as wide as ‘broad’, and leaves length = width as ‘equal’.

119
7.2.3. Statistical analysis
Survey data from the three C. helmsii invaded sites (Fen Drayton, Kingfishers Bridge, and Ouse
Fen) were analysed together as a single dataset. The similarity in the structure of the vegetation
at these sites, which were dominated by P. australis with herbaceous mainly perennial
subordinate species; and the relative geographic closeness of these sites, all falling within
approximately 33 square miles of Cambridgeshire; was considered justification for combining
these data to represent a single plant community. It was acknowledged however, that there was
between-site variation in pool of subordinate species which were recorded in the survey. To
assess the magnitude of this between-site variation in the plant community, a 2D non-metric
MDS (Multi Dimensional Scaling) graph was plotted of the Bray-Curtis similarity between
sample locations, based on species presence and absence. The graph was plotted using the
program PRIMER 6 version 6.1.15 (© PRIMER-E Ltd, 2012), and was visually inspected for
clustering of sample locations into sites.
Prior to analysis all percentage cover data were transformed using an arcsine transformation
(see chapter two, section 2.2). For each 1m2 sample location, three variables were calculated
which related to plant species abundance and diversity of the co-occurring plant community: 1)
total co-occurring plant abundance, 2) species diversity, and 3) species evenness). The total
abundance of the co-occurring plant community was calculated as the summed percentage cover
of all co-occurring plant species, species diversity was calculated using the Shannon-Weiner
diversity index (H), and species evenness was calculated using the Shannon-Wiener Index of
species evenness (J) (see chapter two, section 2.2). In all cases these variables were calculated
excluding C. helmsii and P. australis, thus obtaining results regarding the properties of the
communities co-occurring with these dominating species.
For each 1m2 sample location, three variables were also calculated which related to plant trait
abundance and diversity within the co-occurring plant community: 1) functional richness, 2)
functional evenness, and 3) functional dispersion. Functional richness is a measure of the extent
of all traits possessed by species within a community (Villéger et al. 2008). Because the data for
this study were all categorical, the functional richness index in this case specifically related to
how many different combinations of traits occurred within a sample location (Laliberté &
Shipley, 2011). Functional evenness is a measure of how evenly species differ in terms of their
traits, and how evenly they differ in terms of their relative abundance within a community
(Villéger et al. 2008). Functional dispersion, is a measure of the extent to which species differ
in terms of their traits, from the typical suite of traits (centroid) within a community, and also
takes into account the relative abundances of each species (Laliberté & Legendre, 2010). These
indices were chosen because the methods, by which they were calculated, did not require
species to initially be placed into functional groupings, but instead calculated functional

120
diversity based on the differences in the traits of each species to every other species (Villéger et
al. 2008). Furthermore, calculations of these indices were compatible with categorical data
(Laliberté & Shipley, 2011). Values for functional richness, functional evenness, and functional
dispersion were calculated within the R package ‘FD’ (Laliberté & Shipley, 2011). This
package required two separate data frames, with one containing the listed traits for each species
included in the analysis and the other containing data on the abundance of each species in each
sample location. R then calculated the corresponding indices of functional diversity using these
data. Again, C. helmsii and P. australis were excluded from these data frames, providing
functional diversity values for the plant community co-occurring with these two species.
Is there evidence that C. helmsii is in competition with P. australis?
The variable for C. helmsii abundance and the variable for P. australis abundance were analysed
for a correlation using a Spearman rank test, and a scatter plot of C. helmsii abundance against
P. australis abundance was inspected to assess the linearity of the relationship. The R package
‘ppcor’ (Kim, 2011) was used to conduct Spearman partial correlation tests, in order to
investigate whether there was an association between C. helmsii and P. australis after taking
into account shared variation associated with each of the co-occurring plant community
variables: total co-occurring plant abundance, bare ground, species diversity, species evenness,
functional richness, functional evenness, and functional dispersion.
Is there evidence that C. helmsii has displaced plant species in the subordinate plant
community?
Analyses were conducted which tested for a negative correlation between C. helmsii and
community composition. A number of Spearman partial correlation tests were run, which
controlled for variation associated with P. australis abundance. Firstly, correlation tests were
run between the variable for C. helmsii abundance and each calculated variable of the co-
occurring plant community: total co-occurring plant abundance, bare ground, species diversity,
species evenness, functional richness, functional evenness, and functional dispersion. Again,
scatter plots of C. helmsii abundance against each variable, were inspected to assess the linearity
of the relationships. Secondly, Spearman partial correlation tests were run between C. helmsii
abundance and the abundances of individual recorded species. Species were only included in the
analysis if they were recorded to have occurred in at least five sample locations, a total of 12
species, with a separate test run for each species against C. helmsii. Thirdly, Spearman partial
correlation tests were run between C. helmsii abundance and the abundance of individual plant
traits. For each trait, a value of abundance was obtained for each of the 51 sample locations,
calculated as the summed percentage cover of all species possessing the trait. From these data

121
23 (out of 28) traits were selected for statistical analysis, based on the criteria that they occurred
in at least five sample locations and were represented by at least two recorded plant species.
Is the impact of C. helmsii on the subordinate plant community, greater than the impact of P.
australis on the subordinate plant community?
Spearman partial correlation tests were run, repeating the structure as outlined in the above
paragraph. In this case P. australis abundance was tested for a correlation with each of the seven
community variables, the individual species variables, and individual trait variables, whilst
controlling for variation associated with C. helmsii abundance. The results obtained from P.
australis were then compared to the results obtained from C. helmsii, indicating which species
imposed greater competitive impacts.

122
7.3. Results
A total of 42 plant species were recorded over the three sites, of which 14 species had an overall
mean cover of greater than 1 % (Fig. 29). The mean abundances of P. australis and C. helmsii
were considerably higher than that of all other recorded plant species, and P. australis had a
higher frequency (43 out of 51 sample locations) than C. helmsii (33 out of 51 sample
locations). The plant community contained a high abundance of species which were capable of
clonal reproduction, and which were tall with an erect stem, or floating (Fig. 30). Inspection of
the 2D MDS plot (Fig. 31), indicating the Bray-Curtis similarity between sample locations
based on species presence and absence, showed that the sample locations were not discreetly
clustered based on site. Whilst a number of the sample locations from Fen Drayton and a
number of the sample locations from Ouse Fen were differentiated from other sample locations,
there were also differentiated clusters which contained sample locations from all three sites.
Overall there was overlap in species composition in the sample locations from the three sites.
Figure 29. The plant species recorded in the field survey which had an overall mean abundance of greater
than 1% cover. The bars show the mean abundance (± 1 SE) and the numbers above each bar show the
frequency of sample locations within which each species was recorded.
43 33
19
17
11 9
10 3 4 7 9 3 9 8
0
10
20
30
40
50
Mea
n a
bundan
ce (
% c
over
)

123
Figure 30. The overall mean abundance (± 1 SE) of plants possessing 28 individual plant traits, nested within seven trait groups. The numbers above each bar indicate the frequency
of sample locations in which plants with each trait occurred. These data represent all 42 plants species that were recorded in the study.
38
30
14
0
10
20
30
40
50
clo.sex clonal sexual
Mea
n a
bundan
ce (
% c
over
)
Main reproductive strategy
7
41
7
25
0
10
20
30
40
50
climbing erect prostrate floating
Mea
n a
bundan
ce (
% c
over
)
Typical stem position
25
41
20
14
fragments rhizomes stolons none
Primary clonal organs
34
34
35
aestival evergreen semi_ev
Leaf persistence
24
3 11
29
32
floating short medium tall v.tall
Typical maximum height
3
42
19
28
17
large medium small v.small none
Typical leaf area
39
38
1
17
broad narrow equal none
Leaf dimensions

124
Plant species compositionTransform: Presence/absence
Resemblance: S17 Bray Curtis similarity
Site
Fen Drayton
Kingfishers Bridge
Ouse Fen
fd01fd02
fd03
fd04
fd05
fd06
fd07
fd08
fd09
fd10
fd11fd12
fd13fd14
fd15
fd16
fd17
fd18
fd19
fd20
fd21fd22
kfb01
kfb03
kfb04kfb05
kfb06
kfb07
kfb08
kfb09
kfb10
of01
of02of03
of04
of05
of06
of07
of08
of09
of10of11
of12
of13
of14
of15
of16
of17
of18
of19
of20
2D Stress: 0.16
Figure 31. A 2D MDS (Multi Dimensional Scaling) plot representing each of the 51 sample locations included in the survey. The Bray-Curtis similarity
between each sample location, based on the presence and absence of plant species, is represented by the distance between each plotted sample location point.

125
Is there evidence that C. helmsii is in competition with P. australis?
Crassula helmsii abundance and P. australis abundance was significantly negatively correlated
(rs = -0.311, df = 48, p = 0.026). This correlation was significant when a Spearman partial
correlation accounted for variation in; the amount of co-occurring vegetation (rs = -0.351, df =
48, p = 0.009), species diversity (rs = -0.324, df = 48, p = 0.018), species evenness (rs = -0.332,
df = 48, p = 0.015), functional richness (rs = -0.280, df = 48, p = 0.044), functional evenness (rs
= -0.295, df = 48, p = 0.033), and functional dispersion (rs = -0.312, df = 48, p = 0.023).
Crassula helmsii and P. australis were not significantly negatively correlated when a Spearman
partial correlation accounted for variation in the amount of bare ground (rs = -0.156, df = 49, p =
0.273). Inspection of the scatter plot of C. helmsii abundance against P. australis showed that
where C. helmsii was absent (0 % cover) there was wide variation in the abundance of P.
australis. Where P. australis was absent there was wide variation in the abundance of C.
helmsii, however C. helmsii abundance tended to be highest where P. australis abundance was
below 40 % cover (Fig. 32).
Figure 32. The abundance of Crassula helmsii plotted against the abundance of Phragmites australis.
Data were obtained from 51 1m2 quadrats, located within P. australis dominated fen habitat in
Cambridgeshire, UK. When fit to a linear model, these species were found to be significantly negatively
correlated (rs = -0.311, df = 48, p = 0.026).
0
10
20
30
40
50
60
70
0 10 20 30 40 50 60 70 80 90
P. au
stra
lis
(% c
over
)
C. helmsii (% cover)

126
Is there evidence that C. helmsii has displaced plant species in the subordinate plant
community?
Spearman partial correlation tests, accounting for P. australis abundance, indicated that the
abundance of C. helmsii was strongly significantly negatively correlated with the amount of
bare ground (rs = -0.738, df = 48, p < 0.001). The abundance of C. helmsii was not found to be
significantly correlated with the abundance of co-occurring vegetation (rs = -0.230, df = 48, p =
0.101), species diversity (rs = -0.097, df = 48, p = 0.498), species evenness (rs = -0.128, df = 48,
p = 0.371), functional richness (rs = 0.048, df = 48, p = 0.739), functional evenness (rs = 0.041,
df = 48, p = 0.776), or functional dispersion (rs = -0.030, df = 48, p = 0.837).
Inspection of the scatter plot of C. helmsii abundance against the abundance of co-occurring
vegetation (Fig. 33) showed that there was considerable variation in the amount of co-occurring
vegetation cover in sample locations where C. helmsii was absent or present at a low abundance.
However, the abundance of co-occurring vegetation tended to be consistently lower in sample
locations where C. helmsii abundance was highest. The same pattern was observed in the scatter
plot of C. helmsii abundance against species diversity, and in the scatter plots of C. helmsii
abundance against functional richness (Fig. 33).
Partial correlation tests against individual species found that C. helmsii was significantly
negatively correlated with Calystegia sepium (rs = -0.344, df = 48, p = 0.011), and Lemna
trisulca (rs = -0.345, df = 48, p = 0.011). Crassula helmsii was found to be significantly
positively correlated with Cirsium palustre (rs = 0.311, df = 48, p = 0.024) and Epilobium
hirsutum (rs = 0.365, df = 48, p = 0.007). Partial correlation tests against individual traits found
that C. helmsii was significantly negatively correlated with seven traits (Table 10), and that C.
helmsii was significantly positively correlated with sexual reproductive strategy (rs = 0.398, df =
48, p = 0.003).

127
Table 10. The significant a) negative and b) positive results of Spearman partial correlation tests between
Crassula helmsii and the abundance of individual plant traits, controlling for variation in Phragmites
australis abundance.
Trait group Trait Spearman partial correlation
rs df p
a. Main reproductive strategy clonal -0.356 48 0.008
Primary clonal organs fragments -0.395 48 0.003
Typical maximum height floating -0.427 48 0.001
Typical stem position climbing -0.300 48 0.029
floating -0.410 48 0.002
Typical leaf area v.small -0.448 48 0.001
Leaf dimensions broad -0.297 48 0.031
b. Main reproductive strategy sexual 0.398 48 0.003

128
0
40
80
120
160
200
Co
-occ
urr
ing v
eget
atio
n (
% c
over
)
0
0.5
1
1.5
2
2.5
0 20 40 60 80 100
Spec
ies
div
ersi
ty (
H)
C. helmsii (% cover)
0
20
40
60
80
Bar
e gro
und (
% c
over
)
0
0.2
0.4
0.6
0.8
1
1.2
0 20 40 60 80 100
Spec
ies
even
nes
s (J
)
C. helmsii (% cover)
Figure 33. Continued on next page.
rs = -0.738, df = 48, p < 0.001

129
0
1
2
3
4
5
6
7
8
9
10
Funct
ional
ric
hness
0.000
0.100
0.200
0.300
0.400
0.500
0.600
0 20 40 60 80 100
Funct
ional
dis
per
sio
n
C. helmsii (% cover)
0.000
0.200
0.400
0.600
0.800
1.000
1.200
0 20 40 60 80 100
Funct
ional
even
nes
s
C. helmsii (% cover)
Figure 33 (and previous page). The relationships between Crassula helmsii abundance and
seven variables of the plant community: the abundance of co-occurring (subordinate)
vegetation, the amount of bare ground (absence of vegetation), species diversity (Shannon-
Weiner H), species evenness (Shannon-Weiner J), functional richness, functional evenness,
and functional dispersion. A significant strong negative relationship is indicated between C.
helmsii and bare ground percentage cover (rs = -0.738, df = 48, p < 0.001).

130
Is the impact of C. helmsii on the subordinate plant community, greater than the impact of P.
australis on the subordinate plant community?
In contrast with C. helmsii, Spearman partial correlation tests (controlling for C. helmsii
abundance) found that the abundance of P. australis was significantly negatively correlated with
species diversity (rs = -0.350, df = 48, p = 0.010) and functional richness (rs = -0.313, df = 48, p
= 0.022), and that P. australis abundance was not significantly correlated with bare ground (rs =
0.071, df = 48, p = 0.620). Similarly to C. helmsii, the abundance of P. australis was not
significantly correlated with the abundance of co-occurring vegetation (rs = -0.252, df = 48, p =
0.071), species evenness (rs = -0.278, df = 48, p = 0.055), functional evenness (r = -0.212, df =
48, p = 0.133), or with functional dispersion (rs = -0.114, df = 48, p = 0.425).
In contrast to the C. helmsii scatter plots, the abundance of co-occurring vegetation, species
diversity, and functional richness, did not show a clustering of low values in the sample
locations where P. australis abundance was highest. Instead the scatter plots showed a pattern
where species diversity and functional richness tended to be relatively high in the sample
locations where P. australis was absent (0 % cover) (Fig. 34).
Inspection of the individual species Spearman partial correlations, showed that P. australis was
significantly positively correlated with two species, and significantly negatively correlated with
two species (Table 11), as was the case for C. helmsii. P. australis was significantly positively
correlated with Calystegia sepium (rs = 0.274, df = 48, p = 0.048), whilst C. helmsii had been
significantly negatively correlated with C. sepium. Otherwise, P. australis was not significantly
correlated with the same species as C. helmsii (Table 11). P. australis was found to be
significantly positively correlated with five individual traits, with which C. helmsii had been
significantly negatively correlated (Table 12). P. australis was also significantly negatively
correlated with seven other individual plants traits, with which C. helmsii was not significantly
correlated (Table 12).

131
Table 11. The results of Spearman partial correlation tests, conducted on plant abundance data
(percentage cover). Shown are the outcomes of tests in which individual species in the plant community
were tested against Crassula helmsii and Phragmites australis. The significant positive (grey) and
negative (blue) correlation results are highlighted.
Species C. helmsii
(controlling for P. australis)
P. australis
(controlling for C. helmsii)
rs df p rs df p
C. sepium -0.344 48 0.011 0.274 48 0.048
C. riparia -0.064 48 0.657 0.199 48 0.159
C. palustre 0.311 48 0.024 -0.054 48 0.709
E. palustris 0.195 48 0.169 -0.267 48 0.055
E. hirsutum 0.365 48 0.007 0.131 48 0.361
G. palustre -0.060 48 0.676 -0.125 48 0.382
L. minor -0.269 48 0.053 0.335 48 0.014
L. trisulca -0.345 48 0.011 0.022 48 0.877
M. aquatica 0.234 48 0.096 -0.271 48 0.051
M. scorpiodes -0.226 48 0.108 -0.3988 48 0.003
P. amphibia -0.157 48 0.272 -0.450 48 < 0.001
R. nasturtium aquaticum -0.051 48 0.725 -0.061 48 0.673

132
Table 12. The results of Spearman partial correlation tests. Shown here are the outcomes for tests in
which individual trait variables were tested against Crassula helmsii abundance, and against Phragmites
australis abundance. Each trait variable represented the summed abundance of all species possessing that
trait within each sample location. The significant positive (grey) and negative (blue) correlation results
are highlighted.
Category Trait C. helmsii
(controlling for P. australis)
P. australis
(controlling for C. helmsii)
rs df p rs df p
Typical reproductive strat. clo.sex 0.217 48 0.123 -0.368 48 0.006
clonal -0.356 48 0.008 0.262 48 0.060
sexual 0.398 48 0.003 -0.155 48 0.278
Primary clonal organs fragments -0.395 48 0.003 0.306 48 0.026
rhizomes 0.221 48 0.117 -0.404 48 0.002
stolons -0.079 48 0.582 -0.306 48 0.026
none 0.234 48 0.096 -0.259 48 0.064
Leaf persistence aestival 0.197 48 0.163 -0.273 48 0.049
semi_ev -0.264 48 0.058 0.181 48 0.202
evergreen -0.100 48 0.487 -0.304 48 0.027
Typical maximum height floating -0.427 48 0.001 0.306 48 0.026
medium 0.098 48 0.496 -0.228 48 0.104
tall 0.247 48 0.077 -0.522 48 < 0.001
v.tall 0.127 48 0.376 0.071 48 0.622
Typical stem position climbing -0.300 48 0.029 0.346 48 0.011
erect 0.258 48 0.064 -0.480 48 < 0.001
floating -0.410 48 0.002 0.277 48 0.046
prostrate -0.078 48 0.586 -0.102 48 0.477
Typical leaf area medium 0.110 48 0.444 -0.334 48 0.014
small 0.052 48 0.717 -0.457 48 < 0.001
v.small -0.448 48 0.001 0.298 48 0.031
Leaf dimensions broad -0.297 48 0.031 -0.070 48 0.627
narrow -0.006 48 0.966 -0.193 48 0.172

133
0
40
80
120
160
200
Co
-occ
urr
ing v
eget
atio
n (
% c
over
)
0
0.5
1
1.5
2
2.5
0 20 40 60 80
Spec
ies
div
ersi
ty (
H)
P. australis (% cover)
0
10
20
30
40
50
60
70
Bar
e gro
und (
% c
over
)
0
0.2
0.4
0.6
0.8
1
1.2
0 20 40 60 80
Spec
ies
even
nes
s (J
)
P. australis (% cover)
Figure 34. Continued on next page.
rs = -0.350, df = 48, p = 0.010

134
0
1
2
3
4
5
6
7
8
9
10
Funct
ional
ric
hness
0.000
0.100
0.200
0.300
0.400
0.500
0.600
0 20 40 60 80
Funct
ional
dis
per
sio
n
P. australis (% cover)
0.000
0.200
0.400
0.600
0.800
1.000
1.200
0 20 40 60 80
Funct
ional
even
nes
s
P. australis (% cover)
Figure 34 (and previous page). The relationships between Phragmites australis
abundance and seven variables of the plant community: the abundance of co-occurring
(subordinate) vegetation, the amount of bare ground (absence of vegetation), species
diversity (Shannon-Weiner H), species evenness (Shannon-Weiner J), functional richness,
functional evenness, and functional dispersion. Significant negative relationships were
found between P. australis and species diversity (rs = -0.350, df = 48, p = 0.010), and
between P. australis and functional richness (rs = -0.313, df = 48, p = 0.022).
rs = -0.313, df = 48, p = 0.022

135
7.4. Discussion
In this study C. helmsii and P. australis were found to be significantly negatively correlated,
with a low to medium correlation coefficient value, in all but one of the seven partial correlation
tests which were run. This indicates that there may have been suppression of abundance
occurring between these species. In particular, C. helmsii abundance was highest where P.
australis abundance was lower, which could signify that C. helmsii experienced reduced
competitive pressure in these locations allowing it to achieve higher abundance, although it is
also possible that where C. helmsii achieved very high abundance regeneration by P. australis
was suppressed. The fact that these two species were not significantly correlated with each other
when variation in the amount of bare ground was controlled for, suggests that the distribution of
bare ground was a more important factor in structuring C. helmsii abundance, which is
discussed in more detail below. Importantly, despite the significant negative correlation between
C. helmsii and P. australis, these two species were nevertheless found to co-occur in many of
the sample locations, and in some locations both achieving a cover of 50 % or greater. In these
locations C. helmsii was seen to form a carpet at ground level whilst P. australis formed a
canopy above. Therefore, it is concluded that whilst these species may experience some
limitations in abundance due to competition with one another, overall evidence was found that
these two species can coexist, both at relatively high abundances. To provide validation of this
conclusion, it would be valuable to conduct repeat surveys of the sample locations, in order to
investigate whether the abundance of C. helmsii compared to P. australis is stable over time, or
whether one species increases in abundance in relation to the other. Controlled growth
experiments could also be conducted to test the strength of competition between these two
species.
Coexistence has been indicated in studies of other competitive native versus non-native invasive
species. For example Meyer et al. (2010) compared the competitiveness of a vigorous North
American native grass species (Panicum virgatum) to a non-native invasive grass species
(Miscanthus sinensis), in a greenhouse experiment where the species where grown together at
varying ratios. The authors found that although the native species grew comparatively larger,
the growth of the non-native invasive species was not strongly suppressed, and it was concluded
that these two species could co-occur in the field. The presently considered relationship,
between C. helmsii and P. australis, is different from the one considered by Meyer et al. (2010)
in that the present species differ more greatly in their morphology, and in particular stem
position and maximum height. Indeed it is interesting how frequently C. helmsii was found
growing extensively with P. australis, given how much taller P. australis was and thus how it
could consistently restrict light availability to C. helmsii.

136
C. helmsii was not found to be significantly negatively correlated with the variables of the
subordinate plant community; those relating to overall abundance, species diversity, and
functional diversity. Thus these results did not provided a basis for evidence that C. helmsii
invasion was having a negative impact on the subordinate plant community. This was in
concurrence with Langdon et al. (2004), who found no significant change in plant species
richness in ponds invaded by C. helmsii over a four to seven year period, although results were
not provided for changes in species abundance over that time. Comparable results were also
obtained by Mills et al. (2009), who found that although a non-native invasive shrub (Rhamnus
frangula) had shown a substantial increase in cover between 1991 and 2006, there was not a
significant change or decline in community composition during the time period. The authors
discuss that this may be an example of a non-native invasive species coexisting with natives by
inhabiting a slightly different niche. In the present study it should be noted however, that the
statistical test used restricted analysis to the detection of linear relationships. As indicated in the
results section, there may have been a pattern in which declines in the plant community were
only evident in the sample locations where C. helmsii abundance was highest. It is possible that
C. helmsii does have a negative relationship with the abundance and diversity of other plant
species but only above a particular threshold of abundance. In line with this hypothesis, Gooden
et al. (2009) demonstrated that the non-native invasive shrub, Lantana camara, had a
considerably greater negative association with native plant species richness when it was above a
particular percentage cover, which varied between approximately 30 % and 80 % cover
depending on which native plant group it was being tested against. In particular therefore,
further research on the effects of C. helmsii invasion, should focus on identifying whether such
an impact threshold exists.
The strongest correlation result for C. helmsii was the significantly negative correlation with
bare ground. This result is consistent with the hypothesis that C. helmsii is adept at filling bare
space, because such a pattern could indicate that C. helmsii had increased in abundance by
spreading out to occupy available bare ground. Indeed, colonising bare ground is equivalent to
colonising an empty niche, and therefore also consistent with the hypothesis discussed by Mills
et al. (2009), that a non-native invasive plant could increase in abundance without causing
declines in native species diversity, if it were moving into an empty niche.
Whilst community-level correlations were not detected, C. helmsii was found to be significantly
negatively correlated with two individual species (Calystegia sepium and Lemna trisulca). The
negative correlation with C. sepium might have been related to the unsuitability of C. helmsii as
structural support for this climbing species, or dense C. helmsii ground cover could have limited
the ability of C. sepium to regenerate from its rhizomes. L. trisulca has small free-floating
leaves, and so it is possible that emergent C. helmsii growth could have disrupted the dispersal
of this species into heavily invaded areas. It has also been shown experimentally that Lemna sp.

137
growth can be suppressed by rooted plant species growing below, but specifically in conditions
where access to nutrients is a limiting factor (Szabo et al. 2010). For both C. sepium and L.
trisulca additional controlled experimentation would be required to confirm whether the
detected relationship with C. helmsii was causal. C. helmsii was also significantly positively
correlated with two species (Cirsium palustre and Epilobium hirsutum). It is surprising that C.
helmsii was positively correlated with E. hirsutum given that the grazing exclosure experiment
set up at Kingfishers Bridge (chapter five) showed an inverse relationship between the
abundances of these two species. However, is possible that the positive correlation shown here
is indicative that E. hirsutum was able to compete well in the plant community, in locations
where C. helmsii was abundant. Indeed, both C. palustre and E. hirsutum are known to be
strongly competing species, and C. palustre in particular grows well in recently disturbed
habitats (Grime et al. 1995), similarly to C. helmsii (chapter six). Overall, that C. helmsii was
significantly negatively correlated with only two species out of the 12 that were tested, and that
C. helmsii was significantly positively correlated with as many species, does not provide strong
evidence that C. helmsii had a negative impact on plant species in the subordinate plant
community.
There appeared to be a strong link between the two species which were significantly negatively
correlated with C. helmsii, and the individual traits which were significantly negatively
correlated with C. helmsii; six out of seven of these individual traits were classified as being
possessed by L. trisulca, and three traits as being possessed by C. sepium. However the
correlation results were not identical, for example the correlation coefficient for L. trisulca and
the correlation coefficient for floating stem position were different, and therefore the trait
correlation results were unlikely to have been solely driven by the abundance of an individual
species. In particular it may be valuable to conduct further research on whether C. helmsii has a
negative impact on plant species which have a floating morphology, because as discussed above
it is possible that emergent C. helmsii vegetation could alter the habitat structure in a way that
could negatively affect such plants.
The impact of C. helmsii on the subordinate plant community was not found to be greater than
the impact of P. australis. Indeed as discussed above, there was no strong evidence to support
an impact of C. helmsii on the plant community. In contrast, P. australis was significantly
negatively correlated with species diversity and functional richness, with this relationship in
particular being driven by the more diverse communities in the sample locations where P.
australis was absent. A negative correlation had been expected given the description of P.
australis dominated habitat as reported in the introduction to this chapter; stands of P. australis
interspersed with open patches occupied by a more diverse assemblage of herbaceous species
(McBride et al. 2011). However, the correlation coefficients for the significant relationships
with P. australis showed only medium effect sizes, and together with observations of the scatter

138
plots, the results indicate that there was much variation in the subordinate plant community
which was not explained by variation in P. australis abundance. It was interesting to find that P.
australis had the inverse correlative relationships with individual species and traits than C.
helmsii did, as this pattern suggests divergent community associations between P. australis and
C. helmsii, and therefore niche partitioning (Begon et al. 2002). As discussed above, C. helmsii
could persist amongst the reedbeds but sample locations with the highest abundance were
associated with the ‘open’ patches of the habitat, suggesting that these open patches were more
optimal for C. helmsii growth.
The aim of this study was to investigate whether the invasion of C. helmsii into P. australis
dominated fen could displace the resident plant assemblage. In summary, there was not strong
evidence that this mechanism had occurred. However, because the plant assemblage which
seemed to persist well alongside C. helmsii was the opposite of the assemblage that seemed to
persist well alongside P. australis, it is possible that a situation in which C. helmsii and P.
australis formed a stable coexistence, could be indicative of particularly species-poor plant
community.
139
8. Main discussion
Summary of thesis results
The aim of this thesis was to better understand the mechanisms which allow C. helmsii to
develop dense dominating vegetative mats. This aim was addressed firstly, by investigating how
variation in the abiotic environment could affect C. helmsii abundance, using field data from
several sites in southern and eastern England, in order to analyse how well variation in C.
helmsii abundance could be predicted by variation in the pH, macronutrient levels, water depth,
and shading of these sites. It was found that higher C. helmsii abundance was associated with
lower levels of shade, but that C. helmsii still persisted even under conditions where overhead
shading from vegetation was extensive. There was also found to be an association between C.
helmsii abundance and pH. Crassula helmsii abundance was limited by pH within the acidic to
neutral range, with abundance higher where pH was higher, but was not limited by pH within
the neutral to alkaline range. It was concluded that knowledge of the levels of shading at a site,
and the pH of the water, could contribute towards predictions of the extent of C. helmsii
abundance. The inclusion of biotic variables within the linear model, for example the
abundances of certain competitor plant species, may have accounted for some of the variation in
C. helmsii abundance which was not accounted for by the abiotic variables assessed in this
study.
Variation in the abiotic environment, and its effect on C. helmsii, was further investigated in the
mesocosm experiment run to detect the limits of C. helmsii tolerance to salinity. This
experiment found that the relative growth rate of C. helmsii was reduced in conditions of 2 and
4 ppt, compared to freshwater, and that the plant died in the 8 ppt treatment. These results
therefore suggested that in the field C. helmsii growth, and therefore potentially its ability to
develop dominating vegetative mats, would be reduced in brackish conditions up to 4 ppt, and
that C. helmsii would be totally absent from conditions of 8 ppt or higher.
The effect of grazing on C. helmsii abundance, and specifically the effect of generalist
vertebrate herbivores, was investigated by comparing a C. helmsii invaded plant community
within fenced grazing exclosures to the community in adjacent unfenced plots. It was found that
the abundance of C. helmsii declined in the fenced exclosure, compared to the unfenced plots,
and that the abundance of tall competitive resident species was consistently higher in the fenced
exclosure compared to the unfenced plots. These results therefore, indicated that grazing could
facilitate a higher abundance of C. helmsii in situations where competitive resident plant species
were selectively removed by grazers.
Two separate experiments were run to investigate how well C. helmsii could compete for bare
ground, and thus how the availability of this resource in an ecosystem could affect the

140
likelihood of C. helmsii developing extensive vegetative mats. A common garden experiment
was run to assess the rate and extent of expansion into bare space when C. helmsii was grown
on its own compared to when grown paired with a native species, and to assess the rate and
extent of expansion of C. helmsii compared to the native species. The results showed that C.
helmsii began to expand much more quickly after planting than any of the three native species.
This initial expansion phase occurred in September and October, thus also demonstrating that C.
helmsii could continue expanding rapidly in autumn when other species had ceased growth.
Crassula helmsii expanded to colonise a significantly greater proportion of bare ground than the
native competitor Anagallis tenella, but not than the other two species in the experiment.
Crassula helmsii did not completely smother or exclude any of the three native species. In a
separate field-based experiment, the re-colonisation of C. helmsii was monitored, and the speed
and extent of re-colonisation was compared between experimental plots which initially had bare
ground and plots which had initially been planted with native vegetation. No significant effect
of plot treatment was found, and C. helmsii did not expand to become dominating, or form
monospecific mats. However, it was apparent that C. helmsii re-colonised the area from which it
had been cleared, right from the start of the experiment.
Finally, field survey data were analysed to investigate whether C. helmsii abundance was
negatively correlated with P. australis abundance, and negatively correlated with variables
indicating abundance and diversity in the co-occurring plant community. It was found that C.
helmsii was negatively correlated with P. australis but was not excluded by this taller, dominant
species. Crassula helmsii was not significantly negatively correlated with the variables of
community abundance and diversity, and thus these data could not be taken as evidence that C.
helmsii can develop dense, monospecific mats by displacing other plant species.
In summary, based on the outcomes of this thesis, a number of factors have been identified
which may facilitate the development of dense, dominating mats of C. helmsii. With regards to
the abiotic environment, conditions which are likely to favour prolific C. helmsii growth include
freshwater, which is a neutral to alkaline pH, and ground-level conditions where there is little or
no overhead shading. An environment with high resource availability in the form of bare ground
can promote the spread of C. helmsii because this species can adeptly spread vegetatively to
take advantage of such resources. Further, C. helmsii may do so ahead of other plants where C.
helmsii is able to suppress the growth of other species, or when the seasonal conditions prevent
rapid growth of other species. Implicit in a system with available bare ground, is a lack of co-
occurring vegetation. Linked to this, the level of biotic resistance from the resident plant
community also appears to be an important factor influencing C. helmsii dominance. Crassula
helmsii may be more likely to form monospecific cover in habitats where native competitors
have been removed, and in particular C. helmsii may experience a release from competition
where tall, canopy forming plants are absent. In this respect the ecology of C. helmsii reflects a

141
wider trend seen in invasive plant ecology; that disturbance events which cause the release of
available resources can facilitate non-native invasive plant colonisation (Hobbs & Huenneke,
1992; Burke & Grime, 1996; Davis et al. 2000; Pyšek et al. 2012a).
Implications: the ecological impacts of C. helmsii
A better understanding of the mechanisms which allow C. helmsii to develop dense, dominating
vegetative mats, has in turn provided insights into how C. helmsii invasion can have a negative
impact on ecosystems, by indicating the types of plant species which may be vulnerable to
competition from C. helmsii. In outline, C. helmsii may not have the same level of negative
impact on all plant species, and there appear to be a number of wetland plant species which can
coexist well with C. helmsii, potentially making community-level changes from C. helmsii
invasion difficult to detect. However, plant species which are restricted to open drawdown
zones, and plant species which cannot grow up through mats of C. helmsii, may be limited or
displaced by the spread of this non-native plant. Furthermore, a change from bare ground to
mats of vegetation, could affect animals which live and feed within these areas by altering the
physical structure of the habitat.
In this thesis, the abundance of C. helmsii in the field was strongly negatively correlated with
bare ground cover (chapter seven), a relationship which suggests that this species may have
been taking advantage of an available resource (Davis et al. 2000). It was also shown
experimentally that C. helmsii responded to available bare ground with rapid re-colonisation and
fast growth (chapter six). It therefore appears that C. helmsii is very successful at dispersing to,
colonising, and filling empty spaces that occur in wetland habitats. This means that already
established, mature plants, especially those which are taller than C. helmsii, may not be
particularly vulnerable to displacement as a result of the encroachment of C. helmsii into a
habitat. Where C. helmsii is invading an established floral community, rather than signifying a
loss of resident species, increases in C. helmsii abundance may reflect that it is utilising
previously unoccupied space (‘space filling’). This space filling hypothesis proposed in this
thesis, bears similarity to the ‘passenger’ model of community change (MacDougal &
Turkington, 2005), which describes how a non-native plant can increase in abundance if it is
able to fill the space which is not occupied by a native plant (Didham et al. 2005; MacDougal &
Turkington, 2005). A space filling mechanism may explain why, in the field survey data
presented in chapter seven, no negative linear relationship was found between C. helmsii
abundance and co-occurring species diversity or overall community abundance. The results of
chapter seven are not sufficient on their own to confidently conclude that C. helmsii invasion is
never associated with decreases in plant species diversity, as they are only representative of one
specific plant community within the extensive range (as described by Preston & Croft, 1997)
that C. helmsii occupies within the UK, and therefore it is possible that C. helmsii could induce

142
declines in diversity at another site with a different flora. Interestingly however, the author is
aware of only one other published study which has investigated the relationship between C.
helmsii invasion and declines in biodiversity (Langdon et al. 2004), and in concurrence with the
present study Langdon et al. (2004) found no significant change in plant species richness over a
four to seven year period within ponds which had been invaded by C. helmsii.
Ricciardi & Cohen (2007) discuss that the non-native species which are considered highly
successful invaders, displaying high colonisation success and rapid spread, are not always the
non-native invasive species which cause the greatest declines in native species diversity.
Accordingly traits such as vegetative dispersal (Kolar & Lodge, 2001), tolerance to abiotic
variation (Theoharides & Dukes, 2007), and a fast response to available resources (Daehler,
2003; Davidson et al. 2011), may confer invasive success to C. helmsii across a large proportion
of Western Europe but do not necessarily also allow C. helmsii to displace other plants.
Houlahan & Findlay (2004) also showed that not all non-native invasive plant species are
strongly associated with declines in native plants. The authors studied four wetland plant
species of varying morphology, which were non-native to Ontario, Canada, and were known to
sometimes achieve community dominance. Of these four potential community dominants, only
one species (the graminoid Phalaris arundinacea) was found to be significantly negatively
associated with native species richness. In contrast however, Stiers et al. (2011) found that
ponds which were ‘semi-invaded’ or ‘heavily invaded’ by one of the three non-native invasive
species (Hydrocotyle ranunculoides, Ludwigia grandiflora, or Myriophyllum aquaticum) had
significantly lower plant species richness than ponds which were uninvaded, with stronger
negative impacts seen on the abundance of submerged and floating species compared to
emergent species.
The impacts of non-native invasive plants have been found to be context dependent (Pyšek et al.
2012b), controlled in part by the competitive strength of the invader compared to the resident
species (Dukes, 2002; Hejda et al. 2009). Whilst many of the wetland plant species which were
commonly encountered during field work for this research project, such as Phragmites
australis, Mentha aquatica, and Eleocharis palustris (appendix III), may be able to tolerate the
encroachment of C. helmsii, there may nevertheless be particular set of native plant species
which are out-competed and therefore negatively impacted by C. helmsii. Both Didham et al.
(2005) and Bauer (2012) discuss a theoretical compromise with regards to the driver-passenger
theory of community change, in which an invading non-native species may benefit from
declines in the resident community whilst also directly imposing further community change.
Therefore in the case of C. helmsii, it could be that this species acts mainly as a space-filler, but
still directly displaces a small number of plants in the community. Because C. helmsii is very
successful at colonising bare ground, the plant species which may be vulnerable to competition
from C. helmsii are likely to be small, low growing plant species which are specialists of open,

143
bare ground habitats. Examples of such plant species which grow in the UK are; Baldellia
ranunculoides, Elatine hexandra, Limosella aquatica, and Pilularia globulifera (Hill et al.
2004; Abrahams, 2005). These types of plant tend to persist on drawdown zones because
disturbance from fluctuating water levels generally limits the survival of more vigorous
competitors (Hill et al. 2004; Abrahams, 2005), the invasion of C. helmsii along a drawdown
zone would thus disrupt this dynamic. From site observations made during this research project
it is known that B. ranunculoides, P. globulifera, and E. hexandra do occur in habitats which
have also been invaded by C. helmsii; Castle Water, The New Forest ponds (Chapter two,
section 2.1.2.), and Little Sea (chapter six, section 6.4.1) respectively; with this confirmed
habitat overlap indicating that competition from C. helmsii is a realistic threat to these species.
Moreover, out of the three native test species which were grown alongside C. helmsii for the
common garden experiment in chapter six, it was Anagallis tenella which showed to be most
greatly limited by competition from the non-native species (section 6.3.), and A. tenella is
another small plant which grows on open, bare ground patches in wetland habitats (Hill et al.
2004). Contrastingly, Litorella uniflora is a small plant which grows on bare substrate along
wetland margins (Hill et al. 2004), but Denton (2013) presents case study evidence to suggest
that L. uniflora may be able to competitively suppress C. helmsii.
Where previously bare ground becomes covered by a mat of vegetation, this could inhibit
germination or seedling survival, and therefore larger plant species which nevertheless require
bare ground to regenerate could also experience declines due to the spread of C. helmsii. Indeed
this is also a point made by Langdon et al. (2004) who found that a covering of C. helmsii can
suppress the germination of some pond plant species. From the results of chapter seven (section
7.3.) it was apparent that plant species with a solely sexual reproductive strategy represented
only a small proportion of the abundance of the co-occurring plant community, and during the
process of collecting trait information it was noticeable that nearly all species were perennials.
Therefore, it is possible that sexually reproducing and annually germinating species are
suppressed in C. helmsii invaded habitats. In contrast, perennial species which spread via
rhizomes may be less negatively impacted as the parent plants can generate new peripheral
shoots which grow through the C. helmsii layer. Plant species which rely on mowing or light
grazing management, to maintain an unshaded habitat with a short vegetation structure, may
also experience increased competitive pressure with the invasion of C. helmsii, as this non-
native can attain high abundance in such conditions. This type of interaction was discussed in
reference to Teucrium scordium in chapter five (section 5.4.).
This thesis focused on investigating the interactions between C. helmsii and the co-occurring
plant community, and therefore focused on how C. helmsii invasion could have a negative
impact on plants. However if high C. helmsii abundance is most likely to develop in unshaded
wetland areas with ample bare ground, it is likely that animal species which utilise such habitat

144
may be impacted by the development of dense mats of C. helmsii. It is hypothesised here that
these impacts will arise primarily due to the change in the physical structure of the habitat, from
bare ground to vegetated, and may in particular affect wetland invertebrate taxa such as insects,
molluscs, and crustaceans. For instance vegetation provides hiding places, for prey species but
also for ambush predators, and therefore the growth of C. helmsii mats could affect predator-
prey interactions. Dense submerged and emergent vegetation in the shallows of water bodies
could impede the movement of free-swimming invertebrate taxa, and dense vegetation growing
on margins above the water line could affect the microclimate at ground level, for example by
preventing direct sunlight reaching the substrate. Some species could benefit from the
development of vegetated margins, whereas other species may experience declines, overall
causing a shift in the composition of the invertebrate community. Invertebrates which could be
especially negatively affected by the loss of bare ground include a number of species of
Coleoptera which rely on this particular habitat, for example Omophron limbatum which
constructs burrows within damp bare sandy substrate (Hodge & Yates, 2000), and also species
of Odonata such as Aeshna cyanea and Cordulegaster boltonii which require bare mud at the
edge of water for oviposition (Merritt, 1995; Abrahams, 2005). Changes to the invertebrate
community could in turn affect vertebrate species, notably if the availability of invertebrate prey
was altered, either through a change in actual population numbers, or a change in how easy the
invertebrates were to locate and catch. Wading birds and waterfowl which feed within reedbeds,
or in the shallows of water bodies, would be likely to be affected in this way. Birds which glean
invertebrates from along bare mud margins; for example members of the Charadriidae family
(plovers and lapwings); could be particularly negatively affected by C. helmsii invasion due to a
reduction in suitable feeding habitat.
Implications: the control of C. helmsii
If C. helmsii can increase in abundance by filling space, such information has relevance when
giving recommendations for its control. In outline, land managers should be vigilant for signs of
C. helmsii colonisation where bare ground is prevalent in a habitat, and should limit activities
which create bare ground and activities which cut or remove tall vegetation. Specifically
encouraging native wetland plant species to grow into available bare ground may be a strategy
of limiting C. helmsii dominance. A problem exists however, when methods which could limit
the abundance of C. helmsii would also limit the abundance of rare native plant species.
Sites identified as being more vulnerable to the development of dense dominating C. helmsii
mats should be monitored more intensively for signs of C. helmsii colonisation, and where C.
helmsii has colonised, more resources should be invested into locally eradicating it or
maintaining its abundance at a low level. Within the preferred abiotic range of C. helmsii;
approximately pH 6 – 9 (chapter three) and below 8 ppt salinity (chapter four); wetland nature

145
reserves which contain large patches of bare ground may be particularly vulnerable to the
development of extensive C. helmsii cover. An example of this is coastal and floodplain grazing
marsh, where fluctuating water levels and trampling by cattle create bare mud around the
margins of pools and drainage ditches (Buglife, 2013). Furthermore, newly created wetland
habitats such as freshly dug scrapes and ponds or lake systems created on disused aggregate /
material extraction sites (Green, 1996), may be especially vulnerable to C. helmsii domination,
because as well as containing large patches of bare ground, they would also lack mature
vegetation or a substantial seed bank (Zedler, 2000) and thus would have even lower biological
resistance to non-native invasive spread. Consideration of the characteristics of the flora within
a habitat might also provide an indication of its vulnerability to high C. helmsii abundance and
dominance. In particular, communities where many species do not main year-round above
ground vegetation cover might be more vulnerable, as C. helmsii could spread and occupy space
during periods when it has been vacated by other plants. Examples of this include plant
communities with many annual species or species which senesce at the end of the main growing
season, and which only regenerate from seed. Also, ephemeral plant communities of drawdown
zones which show sequential die off and recolonisation in response to inundation and exposure
disturbance from fluctuating water levels (Abrahams, 2005; Bournette & Puijalon, 2010).
Based on the conditions which have been found to encourage high C. helmsii abundance, there
are certain land management activities which are inadvisable or which should be limited, in sites
where C. helmsii has invaded or sites near to where C. helmsii has invaded. One such activity is
the practice of liming acidic ponds, to enhance plant productivity and reduce pH fluctuations
(Wurts & Masser, 2013), which is inadvisable because this raises the overall pH of the water.
Reducing the acidity and making the pond water more neutral would make abiotic conditions
more favourable for C. helmsii (chapter three), and indeed Denton (2001) described a case study
where C. helmsii invaded an acidic pond only when liming had increased the pH. Primarily
however, land managers should be cautious in the implementation of activities which remove
existing native vegetation and increase the amount of available light and space at ground level,
keeping such activities to a minimum. If ground works or vegetation clearance has to be
conducted in order to fulfil other management objectives, to avoid facilitating higher C. helmsii
abundance these should not be carried out in late summer and autumn, when C. helmsii can still
grow and spread to utilise the available resource but more seasonally constrained competitors
cannot. Grazing regimes should be designed in order to ensure that the plant competitors of C.
helmsii persist within the habitat. For instance it might be best to avoid allowing selective
grazers (e.g. sheep) onto exposed drawdown zones in spring and early summer where they could
reduce the survival of seedlings and new shoots, and to avoid allowing cattle to remove too
much tall vegetation later on in the growing season.

146
With regards to the removal of C. helmsii, land managers should avoid implementing clearance
control (biomass removal or degradation) as a stand-alone strategy. Strategies to implement
alongside clearance control are discussed in the section below. This recommendation is made
because simply killing or clearing the vegetation is unlikely to be a successful strategy for
controlling this species long-term; such activities return a site to bare ground, thus creating
conditions which are highly suitable for C. helmsii colonisation, spread and dominance. As an
example of this, C. helmsii quickly re-colonised the experimental area at Little Sea (chapter six),
arriving within weeks of the black plastic being removed, a finding which concurs with a
previous trial of this particular control method (Wilton-Jones, 2005). This also reflects the wider
literature, as many studies have reported that after the clearance of a non-native invasive plant,
the invader has re-colonised, or another non-native invasive plant has filled the gap (Hulme &
Bremner, 2006; Mason & French, 2007; Reid et al. 2009; Jäger & Kowarik, 2010). In this way,
repeating clearance control over sequential months and years to keep C. helmsii re-growth in
check is also self defeating, as bare ground conditions are repeatedly being created.
In sites vulnerable to high C. helmsii abundance, there are measures which might be valuable to
incorporate into land management schemes. In newly created habitats or habitats which
naturally contain extensive bare ground patches, the most effective method of preventing dense
C. helmsii growth would be to stop the plant from colonising in the first place. Indeed it is well
acknowledged that the most effective defence against non-native invasive species is a pre-
emptive approach (IUCN, 2000; Davis, 2009). National biological security initiatives such as
‘Check-Clean-Dry’ (GB non-native species secretariat, 2014) and organisation specific
recommendations (Day, J. & Gilbert, J. personal communication) provide practical guidelines to
prevent the dispersal of viable vegetative propagules, and so will not be discussed in detail here.
In sites where C. helmsii has already colonised or where a nearby source of colonising
propagules makes colonisation hard to prevent, increasing biotic resistance by encouraging the
growth of native plants could be a way of limiting the extent to which this species could attain
dominance. Similarly (and in reference to the section above) where clearance control of C.
helmsii has been carried out, encouraging native plants to colonise the cleared areas could be a
way of limiting C. helmsii re-growth if not a way of totally preventing its re-colonisation.
Ensuring a sufficient supply of native propagules to cleared areas has been suggested in the
literature as a method of promoting the development of the native species community (Erskine
Ogden & Rejmánek, 2005; Reid et al. 2009; Stevens & Fehmi, 2011). Thus it could be
beneficial to ensure that there are no barriers to the recruitment of native wetland plants in areas
cleared of C. helmsii. Furthermore, native species, especially species which are known to
produce vigorous horizontal growth across bare ground (such as Hypericum elodes, chapter six),
could be deliberately planted or seeded in C. helmsii cleared areas. Land managers could also
plant a flora which is tolerant to the conditions of stress and disturbance commonly experienced
within a particular habitat therefore limiting the amount to which native vegetation might

147
experience die back. For example planting native species which are tolerant to sequential
inundation and exposure in seasonal wetland pools and drawdown zones, encouraging a ground
level flora which is adapted to grazing and trampling where livestock are used to maintain an
open vegetation structure, or planting species which can survive salinity of 8 ppt or greater
where brackish water inundation is to be used. Of course this selection for tolerant species
should happen naturally in habitats, but this process could be prevented if C. helmsii were to
colonise and spread before more tolerant native species could become established. As presented
in chapter four, C. helmsii could be killed with water of above 8 ppt salinity. If it is decided to
implement this strategy to eradicate C. helmsii from an area, firstly it is important to ensure that
all C. helmsii vegetation is totally submerged, because C. helmsii can ‘escape’ from this
treatment if it is able to grow up the margins and away from the water (Money, S. personal
communication). Secondly, to achieve long term elimination of C. helmsii a site would need to
be maintained above 8 ppt salinity. Post-treatment sites with natural freshwater inputs (e.g.
Charlton et al. 2010) would likely become less saline over time, and it is probable that if salinity
levels at a site dropped back into the tolerance range for C. helmsii, that site would again be
vulnerable to re-invasion. Maintenance at above 8 ppt could perhaps be achieved by
constructive a permanent connection to a source of saline water. For example coastal lagoons
could be connected to sea water via drainage ditches (Yates, B. personal communication).
Recommendations such as planting vegetation on bare ground to limit C. helmsii dominance, or
allowing taller vegetation to persist, may conflict with other management objectives in some
cases. For example, because of the species assemblages associated with bare ground drawdown
zones, which include rare species of plants and animals (Hodge & Yates, 2000; Abrahams,
2005), some wetland areas are managed specifically to provide exposed mud (Williams et al.
2007). Therefore, it is not a viable option to increase biotic resistance by deliberately planting
vegetation in such habitats. Similarly, habitats are often specifically managed to include areas of
vegetation with an ‘open’ structure, as this enhances beta diversity by allowing species to persist
which would not grow under a taller closed canopy. Indeed fens are managed to limit the
dominance in places of tall plants such as Epilobium hirsutum and Phragmites australis
(McBride et al. 2011), species found in this thesis to compete strongly against C. helmsii
(chapters five and seven). Thus by encouraging the persistence of taller vegetation to suppress
C. helmsii, other native species might also be suppressed. An example of this was shown in
chapter five; the abundance of C. helmsii declined in the grazing exclosures, attributed to
competition from E. hirsutum, however the abundance and frequency of Teucrium scordium, a
nationally rare plant that requires an open vegetation structure (Beecroft et al. 2007), was also
lower in the grazing exclosures. Perhaps one of the biggest impacts of C. helmsii is that it can
‘hijack’ implemented conditions in managed habitats, so that standard methods of increasing
biodiversity are no longer effective, and just serve to facilitate C. helmsii spread.

148
Limitations and further work
The strategy taken in this thesis was to conduct a number of different experiments and surveys,
covering different questions regarding the ecology of C. helmsii. The rationale behind this
strategy being that overall, more could be learned about this non-native invasive plant species.
This meant however, that the time which could be spent on each experiment or survey was
restricted by the need to collect data for other objectives, within the time frame allocated for the
research project. The strategy was successful in that reference could be made to abiotic, plant-
plant, and plant-herbivore interactions within the main conclusion of the discussion. However
the alternative strategy, of allocating research time to a smaller number of objectives and
research questions, may have provided stronger individual conclusions by allowing for
additional replication. Firstly, in the common garden experiment (chapter six) it could be seen
that there was between-replicate variation within each of the treatment groups, which in some
groups, may have influenced the outcome of statistical analysis. Thus this experiment may have
benefitted from a sample size of greater than five per treatment group. As it was, the method of
taking photographs of each replicate every four weeks (490 photographs taken overall) and then
digitally counting the grid cells for all of these photographs (an average of 1151 grid cells per
photograph) was a time consuming activity. Including more replicate plots would have
considerably increased the time spent on this experiment. Secondly, the field experiments
presented in chapters five and six (field experiment) were each carried out in just one location.
If it had been possible to have replicated these experiments in locations with different abiotic
conditions and species assemblages, this would have additionally provided an indication of the
generality of the interactions seen between C. helmsii, grazing animals, and the plant
community. Thirdly, it is acknowledged that abiotic conditions and plant abundance vary
seasonally in wetland habitats (Brönmark & Hansson, 1998). It would have been beneficial to
have conducted the field survey (chapters three and seven) across three or four seasons to
determine whether the same statistically significant relationships persisted.
With additional time, the research presented here could have been expanded to investigate the
research questions in more depth, and additional research questions could have been added, to
understand more about the ecology of C. helmsii. Three potential avenues of further study are
discussed here. Firstly, an important area of additional research would be to disentangle the
relationship between C. helmsii abundance, the amount of overhead shading, and the abundance
of co-occurring tall plant species. It was found that C. helmsii abundance was negatively
correlated with shade (chapter three), negatively correlated with P. australis (chapter seven),
and showed a decline in abundance as E. hirsutum increased in abundance (chapter five). The
hypothesis discussed above was that tall vegetation suppresses C. helmsii abundance due to a
shading effect. However, it cannot be implicitly assumed that these statistically significant
relationships are causal, and furthermore, C. helmsii abundance was not significantly correlated
149
with the abundance of plants in the trait categories ‘tall’ or ‘v.tall’ (from which P. australis was
excluded) (chapter seven). It needs to be experimentally ascertained, that there is indeed direct
competition between C. helmsii and these tall, competitive species. If causality is demonstrated,
and it is found that C. helmsii abundance can be suppressed by competition, the next stage
would be to investigate what factors are involved in this relationship. As discussed C. helmsii
could experience light limitation, but it could also experience nutrient limitation, or simply have
less space available for expansion. Mesocosm growth experiments would be an appropriate
method of investigating competition between C. helmsii and tall competitive wetland plant
species; species can be planted at varying ratios to investigate the strength of suppression (how
much of a size asymmetry is required for suppression to be evident) (e.g. Meyer et al. 2010;
Leger et al. 2014), and also allow abiotic factors of interest such as shade and nutrient levels to
be manipulated, whilst controlling for other confounding factors (e.g. Abraham et al. 2009; Xie
et al. 2013).
Secondly, invasion success is more likely in an area to which a large number of propagules have
been dispersed, or to which propagules frequently disperse (Lockwood et al. 2005; Simberloff,
2009a). Furthermore, a high propagule pressure may aid a non-native species in persisting
despite sub-optimal abiotic conditions (D’Antonio et al. 2001). Thus propagule pressure may
have been an additional significant explanatory variable, related to C. helmsii abundance, in the
field survey dataset (chapters three and seven). Further work, which incorporated propagule
pressure as an additional explanatory variable, would need to acknowledge that it is not of
interest per se whether the propagule pressure affects colonisation success, but instead whether
the propagule pressure at colonisation, has any influence on how dominant C. helmsii later
becomes in the plant community. Instead of a field survey it might be more efficacious to
conduct a controlled field experiment (e.g. von Holle & Simberloff, 2005), as this would allow
propagule pressure to be manipulated to produce treatments with varying numbers of
propagules.
Thirdly, it is possible that disturbance related to changing water levels may have been an
additional important factor influencing the experimental outcomes, as has been recorded in
other invaded wetland systems (Schooler et al. 2010; Price et al. 2011). In particular, both the
grazing exclosure experiment (chapter five) and the bare ground / vegetated plot field
experiment (chapter six) were located on lake margins which were seen to be varyingly flooded
or exposed. It is not known to what extent the abundance of C. helmsii was independently
affected by the inundation regime in these experiments, or whether the inundation regime
influenced interspecific competition between C. helmsii and the resident native species. Growth
experiments, which manipulated inundation in a controlled manner, would be an effective
method of ascertaining how C. helmsii responds to this type of disturbance, and how C. helmsii
responds relative to selected native competitors.

150
Additional research time could have been used to conduct more work to understand how
dominating C. helmsii growth has an impact on native plant species. For instance, there could
have been a greater focus on testing whether C. helmsii has a more negative impact on plant
species with particular traits. The traits of plants species were considered in the analysis for
chapter seven, and due to the low representation of plants with an annual life cycle and sexual
reproduction, it might be informative to specifically test whether C. helmsii outcompetes these
types of plants more so than perennials which can spread clonally. If more field data were to be
collected for this objective, it would be important to first consider how many annual seeding
species (compared to perennial clonal species) might be expected to be found within a habitat
irrespective of the presence of C. helmsii. Specialists of bare ground drawdown zones have been
highlighted in this discussion as species which might be particularly negatively affected by C.
helmsii. This hypothesis could be tested in a number of ways, for instance surveys of C. helmsii
invaded and non-invaded drawdown zones within the same habitats could be used to determine
whether the native species of interest had a lower abundance or were absent where C. helmsii
occurred. Similarly, time series data of C. helmsii colonising a bare ground drawdown zone
could be analysed for declines in key native plant species. Common garden experiments could
also be used to compare the competitive ability of C. helmsii to that of the native drawdown
zone species in question, similarly to the experiment presented here in chapter six (section 6.2).
It might also be valuable to conduct further research which tests how well C. helmsii competes
against other non-native invasive plants of wetlands, such as Myriophyllum aquaticum and
Hydrocotyle ranunculoides, and further whether a combination of non-native invasive plant
species, for example C. helmsii and M. aquaticum growing as emergent plants within a pond
(personal observation), has a more negative impact on native flora due to an additive or
synergistic effect (Kuebbing et al. 2013).
It would be valuable to also direct future research towards testing the impact of dominating C.
helmsii growth on animal taxa. As with the plants, it may be most pressing to investigate
whether C. helmsii negatively affects taxa which are specialists of bare ground drawdown
zones, thus testing the hypothesis outlined in this discussion that C. helmsii has a greater
negative impact on species of this habitat type. Such work could include sampling sites for
invertebrates or signs of invertebrate habitation (e.g. burrows), and observation of bird feeding
behaviour to see if it is altered where C. helmsii occurs instead of bare ground. It might also be
interesting to investigate whether the appearance of dense vegetation affects the feeding
behaviour of invertebrates. For example it could be asked whether the presence of C. helmsii
flowering on land in late summer could have an impact on the foraging choices made by nectar
feeding insects; whilst conducting fieldwork for this thesis it was apparent that the dense mats
of flowering C. helmsii produced a strong honey-like scent, and that insects such as hoverflies
were moving amongst these flowering mats (appendix VI), potentially attracted to a source of
nectar. Within the water, it could be asked how aquatic crustaceans such as Gammarus

151
aquaticus, which are non-specialised consumers of plant and animal matter (Kelly et al. 2002),
might be affected by an additional source of vegetation both as a substrate in which to live and
as a food source. To test this, laboratory tank experiments could be conducted to investigate
whether similar population sizes of G. aquaticus can be sustained in C. helmsii stocked tanks,
compared to tanks stocked with common native aquatic plants. Crassula helmsii does not
experience much vegetative die back because it is a hardy evergreen plant (Preston & Croft,
1997; CAPM, 2004), and can grow during the autumn (chapter six) when many other plants are
senescing and releasing nutrients. Future research into how the invasion of C. helmsii could
have an impact on nutrient cycling might therefore also be an informative topic. A sensible
hypothesis to test might be; whether the prevalence of available nutrients in aquatic systems
during spring, is lowered by the invasion of C. helmsii, because this species can assimilate
nutrients made available from senescence during the autumn.
In summary this thesis presents data on the ecology C. helmsii, which leads on to deeper
investigation of the specific situations in which this plant might have a negative impact on
invaded ecosystems. Conclusions regarding C. helmsii ecology and impacts can also be used in
the design of future management strategies to more successfully limit C. helmsii growth and
dominance. Single-species studies, such as this one, furthermore represent a useful contribution
to the literature of non-native invasive plant ecology, acting as case studies which can be used in
larger syntheses to confirm or reject the existence of general patterns.

152
9. References
Abraham, J. Corbin, J. D’Antonio, C. 2009. California native and exotic perennial grasses differ
in their response to soil nitrogen, exotic annual grass density, and order of emergence.
Plant Ecology. 201. 445-456.
Abrahams, C. 2005. The ecology and management of drawdown zones. British Wildlife. 16.
395-402.
Agrawal, A.A. Kotanen, P.M. 2003. Herbivores and the success of exotic plants: a
phylogenetically controlled experiment. Ecology Letters. 6. 712-715.
Aguilera, A.G. Alpert, P. Dukes, J.S. Harrington, R. 2010. Impacts of the invasive plant
Fallopia japonica (Houtt.) on plant communities and ecosystem processes. Biological
Invasions. 12. 1243-1252.
Ailstock, M.S. Norman, C.M. Bushmann, P.J. 2001. Common reed Phragmites australis:
control and effects upon biodiversity in freshwater nontidal wetlands. Restoration Ecology.
9. 49-59.
Albright, T.P. Chen, H. Chen, L. Guo, Q. 2010. The ecological niche and reciprocal prediction
of the disjunct distribution of an invasive species: the example of Ailanthus altissima.
Biological Invasions. 12. 2413-2427.
Allred, B.W. Fuhlendorf, S.D. Monaco, T.A. Will, R.E. 2010. Morphological and physiological
traits in the success of the invasive plant Lespedeza cuneata. Biological Invasions. 12. 739-
749.
Andrews, M. Maule, H.G. Hodge, S. Cherrill, A. Raven, J.A. 2009. Seed dormancy, nitrogen
nutrition and shade acclimation of Impatiens glandulifera: implications for successful
invasion of deciduous woodland. Plant Ecology and Diversity. 2. 145-153.
Ashton, I.W. Hyatt, L.A. Howe, K.M. Gurevitch, J. Lerdau, M.T. 2005. Invasive species
accelerate decomposition and litter nitrogen loss in a mixed deciduous forest. Ecological
Applications. 15. 1263-1272.
Baiser, B. Lockwood, J.L. La Puma, D. Aronson, M.F.J. 2008. A perfect storm: two ecosystem
engineers interact to degrade deciduous forests of New Jersey. Biological Invasions. 10.
785-795.
Bakker, E.S. Ritchie, M.E. Olff, H. Milchunas, D.G. Knops, J.M.H. 2006. Herbivore impact on
grassland plant diversity depends on habitat productivity and herbivore size. Ecology
Letters. 9. 780-788.

153
Barrat-Segretain, M.H. Amoros, C. 1995. Influence of flood timing on the recovery of
macrophytes in a former river channel. Hydrobiologia. 316. 91-101.
Barrat-Segretain, M.H. Amoros, C. 1996. Recolonization of cleared riverine macrophyte
patches: importance of the border effect. Journal of Vegetation Science. 7. 769-776.
Barratt, B.P.I. Howarth, F.G. Wither, T.M. Kean, J.M. Ridley, G.S. 2010. Progress in risk
assessment for classical biological control. Biological Control. 52. 245-254.
Bauer, J.T. 2012. Invasive species: “back-seat drivers” of ecosystem change? Biological
Invasions. 14. 1295-1304.
Beecroft, R.C. Cadbury, C.J. Mountford, J.O. 2007. Water germander Teucrium scordium L. in
Cambridgeshire: back from the brink of extinction. Watsonia. 26. 303-316.
Begon, M.G. Townsend, C.R. Harper, J.L. 2002. Ecology from individuals to ecosystems 4th
edition. Blackwell Publishing Ltd. Oxford. 471-555.
Brönmark, C. Hansson, L.A. 1998. The biology of lakes and ponds. Oxford University Press.
Oxford. pp 285.
Blackburn, T.M. Pyšek, P. Bacher, S. Carlton, J.T. Duncan, R.P. Jarošík, V. Wilson, J.R.U.
Richardson, D.M. 2011. A proposed unified framework for biological invasions. Trends in
Ecology and Evolution. 26. 333-339.
Bohl Stricker, K. Stiling, P. 2013. Seedlings of the introduced invasive shrub Eugenia uniflora
(Myrtaceae) outperform those of its native and introduced non-invasive congeners in
Florida. Biological Invasions. 15. 1973-1987.
Bornette, G. Puijalon, S. 2011. Response of aquatic plants to abiotic factors: a review. Aquatic
Sciences. 73. 1-14.
Bridge, T. 2005. Controlling New Zealand pygmyweed Crassula helmsii using hot foam,
herbicide and by burying at Old Moor RSPB reserve, South Yorkshire, England.
Conservation Evidence. 2. 33-34.
Buglife. 2013. Coastal and floodplain grazing marsh. Available online:
http://www.buglife.org.uk/advice-and-publications/advice-on-managing-bap-
habitats/coastal-and-floodplain-grazing-marsh. [Accessed 15th August 2014].
Bullock, J.M. Franklin, J. Stevenson, M.J. Silvertown, J. Coulson, S.J. Gregory, S.J. Tofts, R.
2001. A plant trait analysis of responses to grazing in a long-term experiment. Journal of
Applied Ecology. 38. 253-267.
Burchnall, W. 2013. Biosecurity and business: because prevention is better than cure.
Proceedings from the 45th Robson meeting 7
th – 8
th March 2013. 12-17.

154
Burke, M.J.W. Grime, J.P. 1996. An experimental study of plant community invasibility.
Ecology. 77. 776-790.
Burns, J.H. 2004. A comparison of invasive and non-invasive dayflowers (Commelinaceae)
across experimental nutrient and water gradients. Diversity and Distributions. 10. 387-389.
Byers, J.E. Reichard, S. Randall, J.M. Parker, I.M. Smith, C.S. Lonsdale, W.M. Atkinson,
I.A.E. Seastedt, T.R. Williamson, M. Chornesky, E. Hayes, D. 2002. Directing research to
reduce the impacts of non-indigenous species. Conservation Biology. 16. 630-640.
CABI. 2013. Progress with weed biocontol projects: CABI in the UK. Available online:
http://www.cabi.org/Uploads/CABI/projects/cabi-biocontrol-project-update-for-GB.pdf.
[Accessed 15th
March 2014].
CAPM (Centre for Aquatic Plant Management). 2004. Information sheet 11: Australian swamp
stonecrop. Centre for Ecology and Hydrology, Natural Environment Research Council
(GB). Available online: http://www.ceh.ac.uk/sections/wq/CAPMInformationsheets.htm.
[Accessed 1st November 2010].
Catford, J.A. Daehler, C.C. Murphy, H.T. Sheppard, A.W. Hardesty, B.D. Westcott, D.A.
Rejmánek, M. Bellingham, P.J. Pergl, J. Horvitz, C.C. Hulme, P.E. 2012. The intermediate
disturbance hypothesis and plant invasions: implications for species richness and
management. Perspectives in Plant Ecology, Evolution and Systematics. 14. 231-241.
Chambers, R.M. Meyerson, L.A. Saltonstall, K. 1999. Expansion of Phragmites australis into
tidal wetlands of North America. Aquatic Botany. 64. 261-273.
Chambers R.M., Osgood D.T., Bart D.J. Montalto, F. 2003. Phragmites australis invasion and
expansion in tidal wetlands: interactions among salinity, sulphide, and hydrology.
Estuaries, 26, 398-406.
Charlton, P.E. Gurney, M. Lyons, G. 2010. Large-scale eradication of New Zealand pygmy
weed Crassula helmsii from grazing marsh by inundation with seawater, Old Hall Marshes
RSPB reserve, Essex, England. Conservation Evidence. 7. 130-133.
Charudattan, R. 2001. Are we on top of aquatic weeds? Weed problems, control options, and
challenges. A talk presented at an international symposium on the World’s Worst Weeds.
Organized by the British Crop Protection Council. November 12th
2001.
Cheffings, C.M. Farrell, L. (eds). 2005. The vascular plant Red Data List for Great Britain.
Available online: http://jncc.defra.gov.uk/pdf/pub05_speciesstatusvpredlist3_web.pdf.
[Accessed 7th
February 2013].
Chen, G. Zhang, C. Ma, L. Qiang, S. Silander, J.A. Qi, L.L. 2013. Biotic homogenization
caused by the invasion of Solidago Canadensis in China. Journal of Intergrative
Agriculture. 12. 835-845.

155
Cheplick, G.P. 2010. Limits to local spatial spread in a highly invasive annual grass
(Microstegium vimineum). Biological Invasions. 12. 1759-1771.
Corbin, J.D. D’Antonio, C.M. 2004. Competition between native perennial and exotic annual
grasses: implications for an historical invasion. Ecology. 85. 1273-1283.
Corbin, J.D. D’Antonio, C.M. 2010. Not novel, just better: competition between native and non-
native plants in California grasslands that share species traits. Plant Ecology. 209. 71-81.
Crawley, M.J. 1997. Plant – herbivore dynamics. In: Plant Ecology 2nd edition. Blackwell
Science. Oxford. 401-474.
Cronk, Q.C.B. Fuller, J.L. 1995. Plant Invaders. Chapman and Hall. London. 30-56.
Culliney, T.W. 2005. Benefits of classical biological control for managing invasive plants.
Critical Reviews in Plant Sciences. 24. 131-150.
D’Antonio, C.M. Hughes, R.F. Mack, M. Hitchcock, D. Vitousek, P.M. 1998. The response of
native species to removal of invasive exotic grasses in a seasonally dry Hawaiian
woodland. Journal of Vegetation Science. 9. 699-712.
D’Antonio, C. Levine, J. Thomsen, M. 2001. Ecosystem resistance to invasion and the role of
propagule supply. Journal of Mediterranean Ecology. 2. 233-245.
D’Antonio, C.M. Jackson, N.E. Horvitz, C.C. Hedberg, R. 2004. Invasive plants in wildland
ecosystems: merging the study of invasion processes with management needs. Frontiers in
Ecology and the Environment. 2. 513-521.
Daehler, C.C. 2003. Performance comparisons of co-occurring native and alien invasive plants:
implications for conservation and restoration. Annual Review of Ecology, Evolution, and
Systematics. 34. 183-211.
Davies, K.W. 2011. Plant community diversity and native plant abundance decline with
increasing abundance of an exotic annual grass. Oecologia. 167. 481-491.
David, A.S. Menges, E.S. 2011. Microhabitat preference constrains invasive spread of non-
native natal grass (Melinis repens). Biological Invasions. 13. 2309-2322.
Davidson, A.M. Jennions, M. Nicotra, A.B. 2011. Do invasive species show higher phenotypic
plasticity than native species and, if so, is it adaptive? A meta-analysis. Ecology Letters. 14.
419-431.
Davis, M.A. Grime, J.P. Thompson, K. 2000. Fluctuating resources in plant communities: a
general theory of invasibility. Journal of Ecology. 88. 528-534.
Davis, M.A. 2009. Invasion Biology. Oxford University Press. Oxford. pp 244.

156
Dawson, F.H. Warman, E.A. 1987. Crassula helmsii (T. Kirk) Cockayne: is it an aggressive
alien aquatic plant in Britain? Biological Conservation. 42. 247-272.
Dawson, F.H. 1989. Natural habitat and population control mechanisms of Crassula helmsii
(Australian swamp stone-crop) in Australia. Winston Churchill memorial trust travelling
fellowship: report. 21-31.
Dawson, F.H. 1996. Crassula helmsii: attempts at elimination using herbicides. Hydrobiologia.
340. 241-245.
Dawson, W. Fischer, M. Van Kleunen, M. 2011. The maximum relative growth rate of common
UK plant species is positively correlated with their global invasiveness. Global Ecology
and Biogeography. 20. 299-306.
De Bello, F. Lepš, J. Sebastià, M.T. 2006. Variations in species and functional plant diversity
along climatic and grazing gradients. Ecography. 29. 801-810.
Denton, J. 2001. What impact does Crassula helmsii have on aquatic beetles? Latissimus. 13.
17-18.
Denton, J. 2013. Could shoreweed be useful for Crassula control? Conservation Land
Management. Winter 2013. 18-19.
Denys, L. Packet, J. Jambon, W. Scheers, K. 2014. Dispersal of the non-native invasive species
Crassula helmsii (Crassulaceae) may involve seeds and endozoochorous transport by birds.
New Journal of Botany. 4. 104-106.
Dethier, M.N. Hacker, S.D. 2005. Physical factors vs. biotic resistance in controlling the
invasion of an estuarine marsh grass. Ecological Applications. 15. 1273-1283.
DeWine, J.M. Cooper, D.J. 2008. Canopy shade and the successional replacement of tamarisk
by native box elder. Journal of Applied Ecology. 45. 505-514.
DeWine, J.M. Cooper, D.J. 2010. Habitat overlap and facilitation in tamarisk and box elder
stands: implications for tamarisk control using native plants. Restoration Ecology. 18. 349-
358.
Díaz, S. Lavorel, S. McIntyre, S. Falczuk, V. Casanoves, F. Milchunas, D.G. Skarpe, C. Rusch,
G. Sternberg, M. Noy-Meir, I. Landsberg, J. Zhang, W. Clark, H. Campbell, B.D. 2007.
Plant trait responses – a global synthesis. Global Change Biology. 13. 313-341.
Dickson, T.L. Hopwood, J.L. Wilsey, B.J. 2012. Do priority effects benefit invasive plants more
than native plants? An experiment with six grassland species. Biological Invasions. 14.
2617-2624.

157
Didham, R.K. Tylianakis, J.M. Hutchinson, M.A. Ewers, R.M. Gemmell, N.J. 2005. Are
invasive species the drivers of ecological change? Trends in Ecology and Evolution. 20.
470-474.
Dodds, W.K. 2002. Nitrogen, sulphur, phosphorus, and other nutrients. In: Freshwater ecology
concepts and environmental applications. Academic Press. London. 247-266.
Drenovsky, R.E. Grewell, B.J. D’Antonio, C.M. Funk, J.L. James, J.J. Molinari, N. Parker, I.M.
Richards, C.L. 2012. A functional trait perspective on plant invasion. Annals of Botany.
110. 141-153.
Dukes, J.S. 2002. Species composition and diversity affect grassland susceptibility and response
to invasion. Ecological Applications. 12. 602-617.
Dytham, C. 2011. The angular transformation. In: Choosing and using statistics – A biologist’s
guide. Blackwell Science. Chichester. 44 – 45.
Elton, C.S. 1958. The balance between populations. In: The ecology of invasions by animals and
plants. Chapman and Hall. London. 109-124.
Environment Agency. 2010. Managing invasive non-native plants in or near fresh water, revised
version April 2010. Available online: http://cdn.environment-
agency.gov.uk/LIT_5001_d24b8c.PDF. [Accessed 13th March 2014].
EPPO (European and Mediterranean Plant Protection Organisation). 2007. Data sheets on
quarantine pests Crassula helmsii. EPPO Bulletin. 37. 225-229.
Erskine Ogden, J.A. Rejmánek, M. 2005. Recovery of native plant communities after the
control of a dominant invasive plant species, Foeniculum vulgare: implications for
management. Biological Conservation. 125. 427-439.
Ewald, N. Hartley, S. Stewart, A. 2010. A pooled history of temporary pond research in the
New Forest. In: Newton, A.C. (ed). 2010. Biodiversity in the New Forest. Pisces
Publications. Newbury. 178.
Fan, S. Yu, D. Liu, C. 2013. The invasive plant Alternanthera philoxeroides was suppressed
more intensively than its native congener by a native generalist: implications for the biotic
resistance hypothesis. PLoS ONE. 8. e83619. doi: 10.1371/journal.pone.0083619.
Field, A. Miles, J. Field, Z. 2012. Discovering statistics using R. Sage Publications Ltd.
London. pp 918.
Firn, J. House, A.P.N. Buckley, Y.M. 2010. Alternative states models provide an effective
framework for invasive species control and restoration of native communities. Journal of
Applied Ecology. 47. 96-105.

158
Fitter, A.H. Peat, H.J. 1994. The Ecological Flora Database http://www.ecoflora.co.uk/. Journal
of Ecology. 82. 415-425.
Flory, S.L. Clay, K. 2010. Non-native grass invasion alters native plant composition in
experimental communities. Biological Invasions. 12. 1285-1294.
Foster, G.N. 2010. A review of the scarce and threatened Coleoptera of Great Britain part (3):
water beetles of Great Britain. Species status 1. Joint Nature Conservation Committee.
Peterborough. 22.
French, K. 2012. Competition strength of two significant invasive species in coastal dunes.
Plant Ecology. 213. 1667-1673.
Funk, J.L. Vitousek, P.M. 2007. Resource-use efficiency and plant invasion in low-resource
systems. Nature. 446. 1079-1081.
Gardiner T., Charlton P. 2012. Effects of seawater flooding on Orthoptera and the yellow
meadow ant Lasius flavus during New Zealand pygmyweed Crassula helmsii eradication at
Old Hall Marshes, Essex, England. Conservation Evidence, 9, 50-53.
Gassmann, A. Cock, M.J.W. Shaw, R. Evans, H.C. 2006. The potential for biological control of
invasive alien aquatic weeds in Europe: a review. Hydrobiologia. 570. 217-222.
Gassó, N. Sol, D. Pino, J. Dana, E.D. Lloret, F. Sanz-Elorza, M. Sobrino, E. Vilà, M. 2009.
Exploring species attributes and site characteristics to assess plant invasions in Spain.
Diversity and Distributions. 15. 50-58.
GB non-native species secretariat. 2014. Biosecurity and prevetion: clean, check, dry. Available
online: http://www.nonnativespecies.org/checkcleandry/. [Accessed 2nd
July 2014].
Genovesi, P. 2005. Eradications of invasive alien species in Europe: a review. Biological
Invasions. 7. 127-133.
Gerber, E. Krebs, C. Murrell, C. Moretti, M. Rocklin, R. Schaffner, U. 2008. Exotic invasive
knotweeds (Fallopia spp.) negatively affects native plant and invertebrate assemblages in
European riparian habitats. Biological Conservation. 141. 646-654.
Gerhardt, F. Collinge, S.K. 2007. Abiotic constraints eclipse biotic resistance in determining
invasibility along experimental vernal pool gradients. Ecological Applications. 17. 922-
933.
Going, B.M. HillRisLambers, J. Levine, J.M. 2009. Abiotic and biotic resistance to grass
invasion in serpentine annual plant communities. Oecologia. 159. 839-847.
Goldstein, J.L. Suding, K.N. 2014. Intra-annual rainfall regime shifts competitive interactions
between coastal sage scrub and invasive grass. Ecology. 95. 425-435.

159
Gooden, B. French, K.O. Turner, P. Downey, P.O. 2009. Impact threshold for an alien plant
invader, Lantana camara L., on native plant communities. Biological Conservation. 142.
2631-2641.
Gooden, B. French, K. Robinson, S.A. 2014. Alien grass disrupts reproduction and post-
settlement recruitment of co-occurring native vegetation: a mechanism for diversity decline
in invaded forest? Plant Ecology. 215. 567-580.
Gomes, B. 2005. Controlling New Zealand pygmyweed Crassula helmsii in field ditches and a
gravel pit by herbicide spraying at Dungeness RSPB reserve, Kent, England. Conservation
Evidence. 2. 62.
Graebner, R.C. Callaway, R.M. Montesinos, D. 2012. Invasive species grows faster, competes
better, and shows greater evolution toward increased seed size and growth than exotic non-
invasive congeners. Plant Ecology. 213. 545-553.
Green, B. 1996. Practice: landscape restoration and management, Wetlands. In: Countryside
Conservation. 3rd
ed. Chapman & Hall. London. 274-296.
Greene, B.T. Blossey, B. 2012. Lost in the weeds: Ligustrum sinense reduces native plant
growth and survival. Biological Invasions. 14. 139-150.
Grime, J.P. Hodgson, J.G. Hunt, R. Thompson, K. 1995. The electronic comparative plant
ecology. Chapman & Hall. London.
Grime, J.P. 2001. Plant strategies, vegetation processes, and ecosystem properties. 2nd
edition.
Wiley. Chichester. pp 456.
Gross, K.L. Werner, P.A. 1982. Colonizing abilities of ‘biennial’ plant species in relation to
ground cover: implications for their distributions in a successional sere. Ecology. 63. 921-
931.
Grotkopp, E. Rejmánek, M. Rost, T.L. 2002. Toward a causal explanation of plant invasiveness:
seedling growth and life-history strategies of 29 pine (Pinus) species. The American
Naturalist. 159. 396-419.
Hager, H. 2004. Competitive effect versus competitive response of invasive and native wetland
plant species. Oecologia. 139. 140-149.
Heger, T. Trepl, L. 2003. Predicting biological invasions. Biological Invasions. 5. 313-321.
Hejda, M. Pyšek, P. 2006. What is the impact of Impatiens glandulifera on species diversity of
invaded riparian vegetation? Biological Conservation. 132. 143-152.
Hejda, M. Pyšek, P. Jarošík, V. 2009. Impact of invasive plants on the species richness,
diversity and composition of invaded communities. Journal of Ecology. 97. 393-403.

160
Hejda, M. 2013. Do species of invaded communities differ in their vulnerability to being
eliminated by the dominant alien plants? Biological Invasions. 15. 1989-1999.
Henderson, S. Dawson, T.P. Whittaker, R.J. 2006. Progress in invasive plants research.
Progress in Physical Geography. 30. 25-46.
Hessen, D.O. Skurdal, J. Braathen, J.E. 2004. Plant exclusion of a herbivore; crayfish
population decline caused by an invading waterweed. Biological Invasions. 6. 133-140.
Hill, M.O. Preston, C.D. Roy, D.B. 2004. PLANTATT attributes of British and Irish plants:
status, size, life history, geography and habitats. Biological Records Centre, NERC Centre
for Ecology and Hydrology. Available online from:
http://www.brc.ac.uk/plantatlas/index.php?q=title_page. [First accessed 1st March 2013].
HilleRisLambers, J. Yelenik, S.G. Colman, B.P. Levine, J.M. 2010. California annual grass
invaders: the drivers or passengers of change? Journal of Ecology. 98. 1147-1156.
Hirzel, A.H. Le Lay, G. 2008. Habitat suitability modelling and niche theory. Journal of
Applied Ecology. 45. 1372-1381.
Hobbs, R.J. Huenneke, L.F. 1992. Disturbance, diversity, and invasion: implications for
conservation. Conservation Biology. 6. 324-337.
Hodge, P.J. Yates, B.J. 2000. The Coleoptera of Rye Bay: a specialist report of the Interreg
project. East Sussex County Council.
Houlahan, J.E. Findlay, C.S. 2004. Effect of invasive plant species on temperate wetland plant
diversity. Conservation Biology. 18. 1132-1138.
Hulme, P.E. 2006. Beyond control: wider implications for the management of biological
invasions. Journal of Applied Ecology. 43. 835-847.
Hulme, P.E. Bremner, E.T. 2006. Assessing the impact of Impatiens glandulifera on riparian
habitats: partitioning diversity components following species removal. Journal of Applied
Ecology. 43. 43-50.
Hulme, P.E. Bacher, S. Kenis, M. Klotz, S. Kühn, I. Minchin, D. Nentwig, W. Olenin, S. Panov,
V. Pergl, J. Pyšek, P. Roques, A. Sol, D. Solarz, D. Vilà, M. 2008. Grasping at the routes of
biological invasions: a framework for integrating pathways into policy. Journal of Applied
Ecology. 45. 403-414.
Hulme, P.E. 2009. Trade, transport and trouble: managing invasive species pathways in an era
of globalization. Journal of Applied Ecology. 46. 10-18.
Hunt, R. 2003. Growth analysis, individual plants. In: Thomas, B. Murphy, D.J. Murray, D.
(eds.). 2003. Encyclopaedia of applied plant sciences. Academic Press. London. 579-583.
161
Hussner, A. 2009. Growth and photosynthesis of four invasive aquatic plant species in Europe.
Weed Research. 49. 506-515.
Huston, M.A. 2004. Management strategies for plant invasions: manipulating productivity,
disturbance, and competition. Diversity and Distributions. 10. 167-178.
IUCN (International Union for Conservation of Nature). 2000. IUCN guidelines for the
prevention of biodiversity loss caused by alien invasive species: prepared by the SSC
Invasive Species Specialist Group. Available online:
http://www.issg.org/pdf/guidelines_iucn.pdf. [Accessed 1st June 2014].
Jäger, H. Kowarik, I. 2010. Resilience of native plant community following manual control of
invasive Cinchona pubescens in Galápagos. Restoration Ecology. 18. 103-112.
Jarnevich, C.S. Reynolds, L.V. 2011. Challenges of predicting the potential distribution of a
slow-spreading invader: a habitat suitability map for an invasive riparian tree. Biological
Invasions. 13. 153-163.
Jauni, M. Hyvönen, T. 2012. Interactions between alien plant species traits and habitat
characteristics in agricultural landscapes in Finland. Biological Invasions. 14. 47-63.
JNCC (Joint Nature Conservation Committee), n.d. Special Areas of Conservation (SAC):
Dorset Heaths (Purbeck and Wareham) and Studland Dunes. Available online:
http://jncc.defra.gov.uk/protectedsites/sacselection/sac.asp?EUcode=UK0030038. [First
accessed 12th December 2012].
JNCC. 2010. UK priority species pages – version 2: Teucrium scordium L. Water germander.
Available online: http://jncc.defra.gov.uk/_speciespages/2652.pdf. [Accessed 7th
February
2013].
Jones, W.M. Fraser, L.H. Curtis, P.J. 2011. Plant community functional shifts in response to
livestock grazing in intermountain depressional wetlands in British Columbia, Canada.
Biological Conservations. 144. 511-517.
Keane, R.M. Crawley, M.J. 2002. Exotic plant invasions and the enemy release hypothesis.
Trends in Ecology and Evolution. 17. 164-170.
Keeler, M.S. Chew, F.S. Goodale, B.C. Reed, J.M. 2006. Modelling the impacts of two exotic
invasive species on a native butterfly: top-down vs. bottom-up effects. Journal of Animal
Ecology. 75. 777-788.
Keller, R.P. Zu Ermgassen, P.S.E. Aldridge, D.C. 2009. Vectors and timing of freshwater
invasions in Great Britain. Conservation Biology. 23. 1526-1534.
Kelly, D.W. Dick, J.T.A. Montgomery, W.I. 2002. The functional role of Gammarus
(Crustacea, Amphipoda): shredders, predators, or both? Hydrobiologia. 485. 199-203.

162
Keser, L.H. Dawson, W. Song, Y.B. Yu, F.H. Fischer, M. Dong, M. Van Kleunen, M. 2014.
Invasive clonal plant species have a greater root-foraging plasticity than invasive ones.
Oecologia. 174. 1055-1064.
Kettenring, K.M. Reinhardt Adams, C. 2011. Lessons learned from invasive plant control
experiments: a systematic review and meta-analysis. Journal of Applied Ecology. 48. 970-
979.
Kim, S. 2011. ppcor: partial and semi-partial (part) correlation. R package version 1.0.
Kimball, S. Schiffman, P.M. 2003. Differing effects of cattle grazing on native and alien plants.
Conservation Biology. 17. 1681-1693.
Kilroy, C. Snelder, T.H. Floerl, O. Vieglais, C.C. Dey, K.L. 2008. A rapid technique for
assessing the suitability of areas for invasive species applied to New Zealand’s rivers.
Diversity and Distributions. 14. 262-272.
Klavsen, S.K. Maberly, S.C. 2009. Crassulacean acid metabolism contributes significantly to
the in situ carbon budget in a population of the invasive aquatic macrophyte Crassula
helmsii. Freshwater Biology. 54. 105-118.
Kleyer, M. Bekker, R.M. Knevel, I.C. Bakker, J.P. Thompson, K. Sonnenschein, M. Poschold,
P. van Groenendael, J.M. Klimes, L. Klimesová, J. Klotz, S. Rusch, G.M. Hermy, M.
Adriaens, D. Boedeltje, G. Bossuyt, B. Dannemann, A. Endels, P. Götzenberger, L.
Hodgson, J.G. Jackel, A.K. Kühn, I. Kunzmann, D. Ozinga, W.A. Römermann, C. Stadler,
M. Schlegelmilch, J. Steendam, H.J. Tackenberg, O. Wilmann, B. Cornelissen, J.H.C.
Eriksson, O. Garnier, E. Peco, B. 2008. The LEDA Traitbase: a database of life-history
traits of Northwest European flora http://www.leda-traitbase.org/LEDAfactsheet/search.jsp.
Journal of Ecology. 96. 1266-1274.
Kohyani, P.T. Bossuyt, B. Bonte, D. Hoffmann, M. 2009. Differential herbivory tolerance of
dominant and subordinate plant species along gradients of nutrient availability and
competition. Plant Ecology. 201. 611-619.
Kolar, C.S. Lodge, D.M. 2001. Progress in invasion biology: predicting invaders. Trends in
Ecology and Evolution. 16. 199-204.
Kostrakiewicz-Gierałt, K. Zając, M. 2014. The influence of habitat conditions on the
performance of two invasive, annuals – Impatiens glandulifera and Bidens frondosa.
Biologia. 69. 449-462.
Krebs, C.J. 2014. 16.1.1 Standard Transformations. In: Ecological Methodology 2nd edition.
Benjamin Cummings. San Francisco. 710-712.

163
Kuebbing, S.E. Nuñez, M.A. Simberloff, D. 2013. Current mismatch between research and
conservation efforts: the need to study co-occurring invasive plant species. Biological
Conservation. 160. 121-129.
Küpper, H. Götz, B. Mijovilovich, A. Küpper, F.C. Mayer-Klaucke, W. 2009. Complexation
and toxicity of copper in higher plants. I. Characterization of copper accumulation,
speciation, and toxicity in Crassula helmsii as a new copper accumulator. Plant Physiology.
151. 702-714.
Laliberté, E. Legendre, P. 2010. A distance-based framework for measuring functional diversity
from multiple traits. Ecology. 91. 299-305.
Laliberté, E. Shipley. 2011. FD: measuring functional diversity from multiple traits, and other
tools for functional ecology. R package version 1.0-11.
Langdon, S.J. Marrs, R.H. Hosie, C. McAllister, H.A. Norris, K.M. Potter, J.A. 2004. Crassula
helmsii in UK ponds: effects on plant biodiversity and implications for newt conservation.
Weed Technology. 18. 1349-1352.
Laundon, J.R. 1961. An Australasian species of Crassula introduced into Britain. Watsonia. 5.
59-63.
Leger, E.A. Goergen, E.M. de Queiros, T.F. 2014. Can native annual forbs reduce Bromus
tectorum biomass and indirectly facilitate establishment of a native perennial grass?
Journal of Arid Environments. 102. 9-16.
Leibold, M.A. 1995. The niche concept revisited: mechanistic models and community context.
Ecology. 76. 1371-1382.
Levine, J.M. Vilà, M. D’Antonio, C.M. Dukes, J.S. Grigulis, K. Lavorel, S. 2003. Mechanisms
underlying the impacts of exotic plant invasions. Proceedings of The Royal Society B. 270.
775-781.
Levine, J.M. Adler, P.B. Yelenik, S.G. 2004. A meta-analysis of biotic resistance to exotic plant
invasions. Ecology Letters. 7. 975-989.
Lin, H.F. Alpert, P. Yu, F.H. 2012. Effects of fragment size and water depth on performance of
stem fragments of the invasive, amphibious, clonal plant Ipomoea aquatica. Aquatic
Botany. 99. 34-40.
Lockwood, J.L. Cassey, P. Blackburn, T. 2005. The role of propagule pressure in explaining
species invasions. Trends in Ecology and Evolution. 20. 223-228.
MacDougall, A.S. Turkington, R. 2005. Are invasive species the drivers or passengers of
change in degraded ecosystems? Ecology. 86. 42-55.

164
Manchester, S.J. Bullock, J.M. 2000. The impacts of non-native species in UK biodiversity and
the effectiveness of control. Journal of Applied Ecology. 37. 845-864.
Marco, A. Lavergne, S. Dutoit, T. Bertaudiere-Montes, V. 2010. From the backyard to the
backcountry: how ecological and biological traits explain the escape of garden plants into
Mediterranean old fields. Biological Invasions. 12. 761-779.
Maron, J.L. Vilà, M. 2001. When do herbivores affect plant invasion? Evidence for the natural
enemies and biotic resistance hypothesis. Oikos. 95. 361-373.
Martina, J.P. von Ende, C.N. 2012. Highly plastic response in morphological and physiological
traits to light, soil-N and moisture in the model invasive plant, Phalaris arundinacea.
Environmental and Experimental Botany. 82. 43-53.
Mason, T.J. French, K. 2007. Management regimes for a plant invader differentially impact
resident communities. Biological Conservation. 136. 246-259.
Mason, T.J. French, K. 2008. Impacts of a woody invader vary in different vegetation
communities. Diversity and Distributions. 14. 829-838.
Matarczyk, J.A. Willis, A.J. Vranjic, J.A. Ash, J.E. 2002. Herbicides, weeds and endangered
species: management of bitou bush (Chrysanthemoides monilifera ssp. rotundata) with
glyphosate and impacts on the endangered shrub Pimelea spicata. Biological Conservation.
108. 133-141.
McBride, A. Diack, I. Droy, N. Hamill, B. Jones, P. Schutten, J. Skinner, A. Street, M (eds).
2011. Fen flora and fauna. In: The fen management handbook. Scottish National Heritage.
Perth. 14-38.
Meekins, J.F. McCarthy, B.C. 2001. Effect of environmental variation on the invasive success
of a nonindigenous forest herb. Ecological Applications. 11. 1336-1348.
Meffin, R. Miller, A.L. Hulme, P.E. Duncan, R.P. 2010. Experimental introduction of the alien
plant Hieracium lepidulum reveals no significant impact on montane plant communities in
New Zealand. Diversity and Distributions. 16. 804-815.
Merritt, A. 1994. Appendix 5 - Commoner dragonflies of the UK: habitat preferences. In:
Wetlands, industry and wildlife – a manual of principles and practices. Wildfowl and
Wetlands Trust. Slimbridge.
Meyer, M.H. Paul, J. Anderson, N.O. 2010. Competitive ability of invasive Miscanthus biotypes
with aggressive switchgrass. Biological Invasions. 12. 3809-3816.
Milchunas, D.G. Sala, O.E. Lauenroth, W.K. 1988. A generalized model of the effects of
grazing by large herbivores on grassland community structure. The American Naturalist.
132. 87-106.

165
Miller, A.L. Duncan, R.P. 2004. The impact of exotic weed competition on a rare New Zealand
outcrop herb, Pachycladon cheesemanii (Brassicaceae). New Zealand Journal of Ecology.
28. 113-124.
Mills, J.E. Reinartz, J.A. Meyer, G.A. Young, E.B. 2009. Exotic shrub invasion in an
undisturbed wetland has little community-level effect over a 15-year period. Biological
Invasions. 11. 1803-1820.
Minchin, D. 2008. Crassula helmsii. Delivering Alien Invasive Species Inventories for Europe.
Available online: http://www.europe-aliens.org/pdf/Crassula_helmsii.pdf. [Accessed 12th
March 2012].
Mitchell, C.E. Power, A.G. 2003. Release of invasive plants from fungal and viral pathogens.
Nature. 421. 625-627.
Mitchell, C.E. Agrawal, A.A. Bever, J.D. Gilbert, G.S. Hufbauer, R.A. Klironomos, J.N. Maron,
J.L. Morris, W.F. Parker, I.M. Power, A.G. Seabloom, E.W. Torchin, M.E. Vázquez, D.P.
2006. Biotic interactions and plant invasions. Ecology Letters. 9. 726-740.
Murrell, C. Gerber, E. Krebs, C. Parepa, M. Schaffner, U. Bossdorf, O. 2011. Invasive
knotweed affects native plants through allelopathy. American Journal of Botany. 98. 38-43.
Natural England. 2005. The importance of livestock grazing for wildlife conservation. Available
online: www.publications.naturalengland.org.uk/file/612038. [Accessed 28th January 2014].
Newman, J.R. Raven, J.A. 1995. Photosynthetic carbon assimilation by Crassula helmsii.
Oecologia. 101. 494-499.
NEMIa. n.d. Metals in Water by ICP-AES. Available online:
http://infotrek.er.usgs.gov/apex/f?p=237:38:860182071095643::::P38_METHOD_ID:4690.
[Accessed 13th January 2012].
NEMIb. n.d. Nitrate via manual vanadium(III) reduction. Available online:
http://infotrek.er.usgs.gov/apex/f?p=237:38:7835326542046752::::P38_METHOD_ID:917
1. [Accessed 13th January 2012].
NEMIc. n.d. Ammonia by selective electrode. Available online:
http://infotrek.er.usgs.gov/apex/f?p=237:38:2534503409165525::::P38_METHOD_ID:743
8. [Accessed 13th January 2012].
Olff, H. Ritchie, M.E. 1998. Effects of herbivores on grassland plant diversity. Trends in
Ecology and Evolution. 13. 261-265.
Ortega, Y.K. Pearson, D.E. 2005. Weak vs. strong invaders of natural plant communities:
assessing invasibility and impact. Ecological Applications. 15. 651-661.

166
Palacio-López, K. Gianoli, E. 2011. Invasive plants do not display greater phenotypic plasticity
than their native or non-invasive counterparts: a meta-analysis. Oikos. 120. 1393-1401.
Parker, I.M. Simberloff, D. Lonsdale, W.M. Goodell, K. Wonham, M. Kareiva, P.M.
Williamson, M.H. Von Holle, B. Moyle, P.B. Byers, J.E. Goldwasser, L. 1999. Impact:
toward a framework for understanding the ecological effects of invaders. Biological
Invasions. 1. 3-19.
Parker, J.D. Hay, M.E. 2005. Biotic resistance to plant invasions? Native herbivores prefer non-
native plants. Ecology Letters. 8. 959-967.
Pearson, R. 2012. Foamstream ® hot foam for controlling Crassula helmsii. Proceedings from
the 44th
Robson meeting 28th
– 29th February 2012. 12-13.
Pinheiro, J. Bates, D. DebRoy, S. Sarkar, D. R Development Core Team. 2013. nlme: Linear
and nonlinear mixed effects models. R package version 3. 1-113.
Plantlife. 2014. New Zealand pygmyweed (Australian swamp-stonecrop) (Crassula helmsii).
Available online:
http://www.plantlife.org.uk/wild_plants/plant_species/new_zealand_pigmyweed_australian
_swasw-stonecrop. [Accessed 13th
March 2014].
Popay, I. Field, R. 1996. Grazing animals as weed control agents. Weed Technology. 10. 217-
231.
Preston, C.D. Croft, J.M. 1997. Crassulaceae: Crassula helmsii (Kirk) cockayne. In: Aquatic
plants in Britain and Ireland. Harley Books. Colchester. 92.
Price, J.N. Berney, P.J. Ryder, D. Whalley, R.D.B. Gross, C.L. 2011. Disturbance governs
dominance of an invasive forb in a temporary wetland. Oecologia. 167. 759-769.
Pyšek, P. Richardson, D.M. 2006. The biogeography of naturalization in alien plants. Journal of
Biogeography. 33. 2040-2050.
Pyšek, P. Chytrý, M. Pergl, J. Sádlo, J. Wild, J. 2012a. Plant invasions in the Czech Republic:
current state, introduction dynamics, invasive species and invaded habitats. Preslia. 84.
575-629.
Pyšek, P. Jarošík, V. Hulme, P.E. Pergl, J. Hejda, M. Schaffner, U. Vilà, M. 2012b. A global
assessment of invasive plant impacts on resident species, communities and ecosystems: the
interaction of impact measures, invading species’ traits and environment. Global Change
Biology. 18. 1725-1737.
Radojevid, M. Bashkin, V.N. 2006. Chapter 4 Water Analysis. In: Practical Environmental
Analysis 2nd Ed. RSC Publishing. Cambridge. 135-265.

167
Rand, M. Chatters, C. 2010. Introductions and exotic plants. In: Newton, A.C. (ed). 2010.
Biodiversity in the New Forest. Pisces Publications. Newbury. 72-73.
Reid, A.M. Morin, L. Downey, P.O. French, K. Virtue, J.G. 2009. Does invasive plant
management aid the restoration of natural ecosystems? Biological Conservation. 142. 2342-
2349.
Rejmánek, M. Pitcairn, M.J. 2002. When is eradication of exotic plant pests a realistic goal? In:
Veitch, C.R. Clout, M.N. (eds). Turning the tide: the eradication of invasive species. IUCN
SSC invasive species specialist group. Cambridge. 249-253.
Relva, M.A. Nunez, M.A. Simberloff, D. 2010. Introduced deer reduce native plant cover and
facilitate invasion of non-native tree species: evidence for invasional meltdown. Biological
Invasions. 12. 303-311.
Ricciardi, A. Cohen, J. 2007. The invasiveness of an introduced species does not predict its
impact. Biological Invasions. 9. 309-315.
Richardson, D.M. Pyšek, P. Rejmánek, M. Barbour, M.G. Panetta, F.D. West, C.J. 2000.
Naturalization and invasion of alien plants: concepts and definitions. Diversity and
Distributions. 6. 93-107.
Richardson, D.M. Pyšek, P. 2006. Plant invasions: merging the concepts of species invasiveness
and community invisibility. Progress in Physical Geography. 30. 409-431.
Rodwell, J.S. (ed). 1998. British plant communities volume 4: aquatic communities, swamps
and tall-herb fens. Cambridge University Press. Cambridge. pp 296.
Rook, A.J. Dumont, B. Isselstein, J. Osoro, K. WallisDeVries, M.F. Parente, G. Mills, J. 2004.
Matching type of livestock to desired biodiversity outcomes in pastures – a review.
Biological Conservation. 119. 137-150.
Rose, F. 1989. Colour identification guide to the grasses, sedges, rushes, and ferns of the
British Isles and north-western Europe. Viking Press. London. pp 240.
Rose, F. 2006. The wild flower key: how to identify wild flowers, trees, and shrubs of Britain
and Ireland, revised and updated by Clare O’Reilly. Frederick Warne. London. pp 576.
Santos, M.J. Anderson, L.W. Ustin, S.L. 2011. Effects of invasive species on plant
communities: an example using submersed aquatic plants at the regional scale. Biological
Invasions. 13. 443-457.
Sainty, G.R. Jacobs, S.W.L. 2003. Crassula helmsii “swamp Crassula” “swamp stonecrop”
Crassulaceae. In: Waterplants in Australia. 4th edition. Sainty and Associates. Sydney. 134-
135.
168
Sayer, C. Andrews, K. Shilland, E. Edmonds, N. Edmonds-Brown, R. Patmore, I. Emson, D.
Axmacher, J. 2012. The role of pond management for biodiversity conservation in an
agricultural landscape. Aquatic Conservation: Marine and Freshwater Ecosystems. 22.
626-638.
Sayer, C. Shilland, E. Greaves, H. 2013. Managing Britain’s ponds – conservation lessons from
a Norfolk farm. British Wildlife. 25. 21-28.
Schooler, S.S. Cook, T. Prichard, G. Yeates, A.G. 2010. Disturbance-mediated competition: the
interacting roles of inundation regime and mechanical and herbicidal control in determining
native and invasive plant abundance. Biological Invasions. 12. 3289-3298.
Schneider, C.A. Rasband, W.S. Eliceiri, K.W. 2012. NIH image to image: 25 years of image
analysis. Nature Methods. 9. 671-675.
Schultz, R. Dibble, E. 2012. Effects of invasive macrophytes on freshwater fish and
macroinvertebrate community: the role of invasive plant traits. Hydrobiologia. 684. 1-14.
Schwartz, M.W. Thorne, J.H. Viers, J.H. 2006. Biotic homogenization of the California flora in
urban and urbanizing regions. Biological Conservation. 127. 282-291.
Seastedt, T.R. Hobbs, R.J. Suding, K.N. 2008. Management of novel ecosystems: are novel
approaches required? Frontiers in Ecology and the Environment. 6. 547-553.
Sheppard, A.W. Shaw, R.H. Sforza, R. 2006. Top 20 environmental weeds for classical
biological control in Europe: a review of opportunities, regulations and other barriers to
adoption. Weed Research. 46. 93-117.
Silvertown, J. 2004. Plant coexistence and the niche. Trends in Ecology and Evolution. 19. 605-
611.
Simberloff, D. Von Holle, B. 1999. Positive interactions of nonindigenous species: invasional
meltdown? Biological Invasions. 1. 21-32.
Simberloff, D. 2009a. We can eliminate invasions or live with them. Successful management
projects. Biological Invasions. 11. 149-157.
Simberloff, D. 2009b. The role of propagule pressure in biological invasions. Annual Review of
Ecology, Evolution, and Systematics. 40. 81-102.
Simberloff, D. 2010. Invasions of plant communities – more of the same, something very
different, or both? The American Midland Naturalist. 163. 220-233.
Simberloff, D. 2011. How common are invasion induced ecosystem impacts? Biological
Invasions. 13. 1255-1268.

169
Skálová, H. Jarošík, V. Dvořáčková, Š. Pyšek, P. 2013. Effect of intra- and interspecific
competition on the performance of native and invasive species of Impatiens under varying
levels of shade and moisture. PLOS one. 8. e62842. doi:10.1371/journal.pone.0062842.
Smith, M.D. Wilcox, J.C. Kelly, T. Knapp, A.K. 2004. Dominance not richness determines
invasibility of tallgrass prairie. Oikos. 106. 253-262.
Stace, C. 2010. New Flora of the British Isles. 3rd
edition. Cambridge University Press.
Cambridge. 520-801.
Stahlherber, K.A. D’ Antonio, C.M. 2013. Using livestock to manage plant composition: A
meta-analysis of grazing in California Mediterranean grasslands. Biological Conservation.
157. 300-308.
Stephens, A.E.A. Krannitz, P.G. Myers, J.H. 2009. Plant community changes after the reduction
of an invasive rangeland weed, diffuse knapweed, Centaurea diffusa. Biological Control.
51. 140-146.
Stevens, J.M. Fehmi, J.S. 2011. Early establishment of a native grass reduces the competitive
effect of a non-native grass. Restoration Ecology. 19. 399-406.
Stricker, K.B. Stiling, P. 2012. Herbivory by an introduced Asian weevil negatively affects
population growth of an invasive Brazilian shrub in Florida. Ecology. 93. 1902-1911.
Stiers, I. Crohain, N. Josens, G. Triest, L. 2011. Impacts of three aquatic invasive species on
native plants and macroinvertebrates in temperate ponds. Biological Invasions. 13. 2715-
2726.
Stohlgren, T.J. Pyšek, P. Kartesz, J. Nishino, M. Pauchard, A. Winter, M. Pino, J. Richardson,
D.M. Wilson, J.R.U. Murray, B.R. Phillips, M.L. Ming-yang, L. Celesti-Grapow, L. Font,
X. 2011. Widespread plant species: native versus aliens in out changing world. Biological
Invasions. 13. 1931-1944.
Stricker, K.B. Stiling, P. 2012. Herbivory by an introduced Asian weevil negatively affects
population growth of an invasive Brazilian shrub in Florida. Ecology. 93. 1902-1911.
Szabo, S. Scheffer, M. Roijackers, R. Waluto, B. Braun, M. Nagy, P.T. Borics, G. Zambrano, L.
2010. Strong growth limitation of a floating plant (Lemna gibba) by the submerged
macrophyte (Elodea nuttallii) under laboratory conditions. Freshwater Biology. 55. 681-
690.
Taiz L., Zeiger E. 2006. Mineral nutrition. In: Plant Physiology. 4th
ed. Sinauer Associates Inc.
Sunderland. pp 78.
170
Tererai, F. Gaertner, M. Jacobs, S.M. Richardson, D.M. 2013. Eucalyptus invasions in riparian
forests: effects on native vegetation community diversity, stand structure and composition.
Forest Ecology and Management. 297. 84-93.
Theoharides, K.A. Dukes, J.S. 2007. Plant invasion across space and time: factors affecting
nonindigenous species success during four stages of invasion. New Phytologist. 176. 256-
273.
Thomsen, M.A. D’Antonio, C.M. Suttle, K.B. Sousa, W.P. 2006. Ecological resistance, seed
density and their interactions determine patterns of invasion in a California coastal
grassland. Ecology Letters. 9. 160-170.
Thiele, J. Isermann, M. Otte, A. Kollmann, J. 2010. Competitive displacement or biotic
resistance? Disentangling relationships between community diversity and invasion success
of tall herbs and shrubs. Journal of Vegetation Science. 21. 213-220.
Thouvenot L., Haury J., Thiébaut G. 2012. Responses of two invasive macrophyte species to
salt. Hydrobiologia, 686, 213-223.
Thuiller, W. Richardson, D.M. Pyšek, P. Midgley, G.F. Hughes, G.O. Rouget, M. 2005. Niche-
based modelling as a tool for predicting the risk of alien plant invasions at a global scale.
Global Change Biology. 11. 2234-2250.
Tilman, D. 1999. The ecological consequences of changes in biodiversity: a search for general
principles. Ecology. 80. 1455-1474.
Townsend, C.R. Begon, M. Harper, J.L. 2008. Temporal patterns in community composition.
In: Essentials of Ecology. 3rd
edition. Blackwell Publishing. Oxford. 299.
Truscott, A.M. Palmer, S.C.F. Soulsby, C. Hulme, P.E. 2008. Assessing the vulnerability of
riparian vegetation to invasion by Mimulus guttatus: relative importance of biotic and
abiotic variables in determining species occurrence and abundance. Diversity and
Distributions. 14. 412-421.
Van der Wal, R. Truscott, A.M. Pearce, I.S.K. Cole, L. Harris, M.P. Wanless, S. 2008. Multiple
anthropogenic changes cause biodiversity loss through plant invasion. Global Change
Biology. 14. 1428-1436.
Van Driesche, R.G. Carruthers, R.I. Center, T. Hoddle, M.S. Hough-Goldstein, J. Morin, L.
Smith, L. Wagner, D.L. Blossey, B. Brancatini, V. Casagrande, R. Causton, C.E. Coetzee,
J.A. Cuda, J. Ding, J. Fowler, S.V. Frank, J.H. Fuester, R. Goolsby, J. Grodowitz, M.
Heard, T.A. Hill, M.P. Hoffmann, J.H. Huber, J. Julien, M. Kairo, M.T.K. Kenis, M.
Mason, P. Medal, J. Messing, R. Miller, R. Moore, A. Neuenschwander, P. Newman, R.
Norambuena, H. Palmer, W.A. Pemberton, R. Perez Panduro, A. Pratt, P.D. Rayamajhi, M.
Salom, S. Sands, D. Schooler, S. Schwarzländer, M. Sheppard, A. Shaw, R. Tipping, P.W.

171
Van Klinken, R.D. 2010. Classical biological control for the protection of natural
ecosystems. Biological Control. 54. 2-33.
Van Kleunen, M. Weber, E. Fischer, M. 2010. A meta-analysis of trait differences between
invasive and non-invasive plant species. Ecology Letters. 13. 235-245.
Van Valkenburg, J. de Hoop, E. 2013. The on-going Crassula battle at Huis ter Heide.
Proceedings from the 45th Robson meeting 7
th – 8
th March 2013. 10.
Vilà, M. Espinar, J.L. Hejda, M. Hulme, P.E. Jarošík, V. Maron, J.L. Pergl, J. Schaffner, U.
Sun, Y. Pyšek, P. 2011. Ecological impacts of invasive alien plants: a meta- analysis of
their effects on species, communities and ecosystems. Ecology Letters. 14. 702-708.
Villéger, S. Mason, N.W.H. Mouillot, D. 2008. New multidimensional functional diversity
indices for a multifaceted framework in functional ecology. Ecology. 89. 2290-2301.
Von Holle, B. Simberloff, D. 2005. Ecological resistance to biological invasion overwhelmed
by propagule pressure. Ecology. 86. 3212-3218.
Wainwright, C.E. Wolkovich, E.M. Cleland, E.E. 2012. Seasonal priority effects: implications
for invasion and restoration in a semi-arid system. Journal of Applied Ecology. 49. 234-
241.
Wainwright, C.E. Cleland, E.E. 2013. Exotic species display greater germination plasticity and
higher germination rates than native species across multiple cues. Biological Invasions. 15.
2253-2264.
Walck, J.L. Baskin, J.M. Baskin, C.C. 1999. Effects of competition from introduced plants on
establishment, survival, growth and reproduction of the rare plant Solidago shortii
(Asteraceae). Biological Conservation. 88. 213-219.
Wang, Q. Wang, C.H. Zhao, B. Ma, Z.J. Luo, Y.Q. Chen, J.K. Li, B. 2006. Effects of growing
conditions on the growth of and interactions between salt marsh plants: implications for
invasibility of habitats. Biological Invasions. 8. 1547-1560.
Ward, N.I. 1997. Trace Elements: 15.4.2 Water samples. In: Environmental Analytical
Chemistry eds Fifield, F.W. Haines, P.J. Blackie Academic & Professional. London. 338.
Warren II, R.J. Wright, J.P. Bradford, M.A. 2011. The putative niche requirements and
landscape dynamics of Microstegium vimineum: an invasive Asian grass. Biological
Invasions. 13. 471-483.
Watson, W. 1999. Amphibians and Crassula helmsii. Froglog newsletter of the declining
amphibian populations task force, no. 31. Available online:
http://issuu.com/amphibiansdotorg/docs/froglog31?e=2785774/5251787#search. [Accessed
12th March 2014].

172
Willby, N.J. 2007. Managing invasive aquatic plants: problems and prospects. Aquatic
Conservation: Marine and Freshwater Ecosystems. 17. 659-665.
Williams, P. Biggs, J. Corfield, A. Fox, G. Walker, D. Whitfield, M. 1997. Designing new
ponds for wildlife. British Wildlife. 8. 137-150.
Williamson, M.H. Fitter, A. 1996. The characters of successful invaders. Biological
Conservation. 78. 163-170.
Willis, S.G. Hulme, P.E. 2002. Does temperature limit the invasion of Impatiens glandulifera
and Heracleum mantegazzianum in the UK? Functional Ecology. 16. 530-539.
Wilton-Jones, G. 2005. Control of New Zealand pygmyweed Crassula helmsii by covering with
black polythene at The Lodge RSPB reserve, Bedfordshire, England. Conservation
Evidence. 2. 63.
Winter, M. Kühn, I. La Sorte, F.A. Schweiger, O. Nentwig, W. Klotz, S. 2010. The role of non-
native plants and vertebrates in defining patterns of compositional dissimilarity within and
across continents. Global Ecology and Biogeography. 19. 332-342.
Wolkovich, E.M. Cleland, E.E. 2011. The phenology of plant invasions: a community ecology
perspective. Frontiers in Ecology and the Environment. 9. 287-294.
Wurts, W.A. Masser, M.P. 2013. Liming ponds for aquaculture. Available online:
http://www2.ca.uky.edu/wkrec/LimingPondsAquaculture.htm. [Accessed 16th
August
2014].
Xie, D. Yu, D. You, W.H. Xia, C.X. 2013. The propagule supply, litter layers and canopy shade
in the littoral community influence the establishment and growth of Myriophyllum
aquaticum. Biological Invasions. 15. 113-123.
Yelenik, S.G. Stock, W.D. Richardson, D.M. 2004. Ecosystem level impacts of invasive Acacia
saligna in the South African fynbos. Restoration Ecology. 12. 44-51.
Zedler, J.B. 2000. Progress in wetland restoration ecology. Trends in Ecology and Evolution.
15. 402-407.

173
10. Appendices
I: Data volunteered from C. helmsii invaded sites
Table I-1 (and next page). Details of the 36 additional Crassula helmsii invaded sites from which data
were provided on pH, macronutrient levels, and C. helmsii abundance. These data were used in Chapter
three to compare against collected field survey data.
Reserve
No. sites Land owned / managed by Location Contributors
Bowdown woods 1 Berkshire,
Buckinghamshire, and
Oxfordshire Wildlife Trust
(BBOWT)
Crookham, Berks Phil Dean
Greenham Common
2 BBOWT Crookham, Berks Phil Dean
Kintbury
1 BBOWT Kintbury, Berks Andy
Coulson-
Phillips
Berryhill Fields 1 Stoke-on-Trent City Council Stoke-on-Trent,
Staffs
Amy-Jayne
Dutton
Farrer Hall 2 National Trust Eastbourne, E.
Sussex
Dave
Morgan
Filcombe Farm 2 National Trust Morcombelake,
Dorset
John
Sibthorpe
Glastry ponds 1 National Trust Ballyhalbert,
County Down
Andrew
Upton
Mottisfont
1 National Trust Romsey, Hants Rob West
Manor Farm
7 Private land owner Norfolk Sayer et al.
(2012)
Sayer et al.
(2013)
Park Hall 2 Stoke-on-Trent City Council Stoke-on-Trent,
Staffs
Amy-Jayne
Dutton
Pett Level
1 The Wetland Trust Pett, E. Sussex Barry Yates
Arne 1 The Royal Society for the
Protection of Birds (RSPB)
Wareham, Dorset Toby
Branston
Blean Woods
1 RSPB Canterbury, Kent Michael
Walter
Conwy
3 RSPB Conwy Sarah
Money

174
Table I-1. Continued.
Reserve
No. sites Land owned /
managed by
Location Contributors
Dearne Valley 1 RSPB Barnsley, S. Yorkshire Charlotte Bell
Dee Estuary
1 RSPB Neston, Cheshire Rhian Pierce
Dungeness
1 RSPB Lydd, Kent Natalie Holt
Lochwinnoch 1 RSPB Lochwinnoch,
Renfrewshire
Paula Baker
North Kent Marshes
1 RSPB Rochester, Kent Cath Dewhurst
Otmoor
1 RSPB Beckley, Oxford Martin Randall
Pulborough Brooks 1 RSPB Pulborough, W. Sussex Peter Hughes
Rye Meads 1 RSPB Stanstead Abbotts,
Herts.
Vicky Buckel
Sandwell 1 RSPB West Bromwich, W.
Midlands
Leanne Harris
Woolmer Forest 2 South Downs
National Park
Authority
Hants. / W. Sussex Katherine
Stearne

175
II: Is there an effect of pH on the growth rate of C. helmsii?
An experiment was conducted, which was designed to measure the growth rate of C. helmsii in
experimentally controlled treatments of pH, at three levels of nutrient concentration.
Methods and materials
To set up the experiment, 27 plastic storage containers (5 L) were used as individual replicates.
These were lined with horticultural sand to 3 cm depth and filled with 1 L of water, to mimic
shallow water habitat conditions. Containers were placed in a randomised treatment
arrangement, in an outdoor location at Bournemouth University in Dorset (OS grid ref: SZ 073
937). Translucent lids were placed on the plastic containers, to shield from rain and detritus,
which were propped open to allow for transpiration and prevent overheating.
Three levels of pH were used; pH 5.0, 7.0, and 9.0. These were combined in a factorial design
with three levels of nutrient concentration; 0.5, 0.25 and 0.125 x full strength modified
Hoagland solution (Taiz & Zeiger 2006). In total there were 9 different treatments, with 3
replicates per treatment. Treatments were applied as a solution, in the 1 L water added to each
replicate. The treatment levels were set by adding the correct concentration of nutrient solution,
and then adjusting the pH by adding 0.1M HCl or NaOH, to lower or raise the pH of the
solution respectively. Care was taken to adjust the pH slowly, minimising the chances of over
shooting the required pH and thus having to add additional acid or alkali, as it was unknown
whether these compounds would have an effect on plant nutrition. For this reason, it was
decided to avoid also adding buffer solutions to further stabilise the pH of the nutrient solutions.
The experiment was run over 26 days between 12th
August and 7th
October 2011. At the start of
the experiment each replicate was filled with the correct 1 L pH adjusted nutrient solution, and
then 10 g (± 0.01 g) fresh weight of C. helmsii was added to each replicate. Distilled water
which had been pH adjusted was added subsequently, every week throughout the duration of the
experiment, to maintain the correct pH treatment levels. The pH of the water within each
replicate was recorded prior to the addition of fresh solution in order to ascertain the amount of
change in pH experienced within the treatment mesocosms. At the end of the experiment, the C.
helmsii from each replicate was separately rinsed thoroughly to remove attached sand and algae,
and dried at 90˚C for 48 hours, before being weighed to obtain an end dry weight. A start dry
weight value was estimated by weighing out twenty additional C. helmsii samples of 10 g fresh
weight, drying them at 90˚C for 48 hours and taking the mean dry weight of these samples.

176
The relative growth rate of C. helmsii was calculated for each replicate by using the formula:
Relative growth rate = ln(W2) – ln(W1) / (t2 – t1)
Where W1 is the start and W2 the end dry weight, ln is the natural logarithm, and t1 is the start
and t2 the end time measured in days. The formula describes the proportional increase of a plant
in grams, expressed per gram per day (g g-1
/day-1
) (Hunt, 2003).
Results
The experiment was carried through to completion, and results were obtained for the relative
growth rate of C. helmsii in each pH / nutrient concentration treatment (Fig. II-1). However, the
results for the effect of pH were considered unreliable, because there was too much change in
the pH during the course of the experiment. In most replicates the pH had moved towards to
neutral to alkaline pH by the end of each week (Table II-1), and so between treatment
differences could not be confidently attributed to differences in pH treatment level.
Figure II-1. Bar charts showing the relative growth rate (± 1 SE) of Crassula helmsii when grown in a
factorial design combining three treatment levels of pH (5.0, 7.0, and 9.0), and three treatment levels of
nutrient dilution (0.5, 0.25, and 0.125 x full strength nutrient solution).
0
0.01
0.02
0.03
0.04
0.05
0.06
0.07
0.08
0.09
5 7 9
Rel
ativ
e gro
wth
rat
e g g
-1 /
d-1
pH
0.125
0.25
0.5

177
Table II-1. The mean pH of the water measured in each treatment, at the end of each week of the
experiment. Also indicated is the amount of change in pH away from the required treatment level, and
whether the pH was too high (↑) or too low (↓).
Treatment End week 1 End week 2 End week 3 End week 4
pH Nutrients pH Change pH Change pH Change pH Change
5.0 0.125 7.4 ↑ 2.4 8.4 ↑ 3.4 9.0 ↑ 4.0 8.6 ↑ 3.6
5.0 0.250 6.2 ↑ 1.2 8.5 ↑ 3.5 9.0 ↑ 4.0 8.9 ↑ 3.9
5.0 0.500 5.6 ↑ 0.6 7.9 ↑ 2.9 8.7 ↑ 3.7 8.8 ↑ 3.8
7.0 0.125 7.8 ↑ 0.8 8.7 ↑ 1.7 9.3 ↑ 2.3 9.3 ↑ 2.3
7.0 0.250 7.3 ↑ 0.3 8.7 ↑ 1.7 9.5 ↑ 2.5 9.5 ↑ 2.5
7.0 0.500 7.0 − 0.0 8.6 ↑ 1.6 8.7 ↑ 1.7 9.1 ↑ 2.1
9.0 0.125 8.5 ↓ -0.5 9.7 ↑ 0.7 9.7 ↑ 0.7 9.9 ↑ 0.9
9.0 0.250 8.2 ↓ -0.8 10.1 ↑ 1.1 10.0 ↑ 1.0 9.6 ↑ 0.6
9.0 0.500 8.5 ↓ -0.5 9.0 − 0.0 8.9 ↓ -0.1 9.1 ↑ 0.1
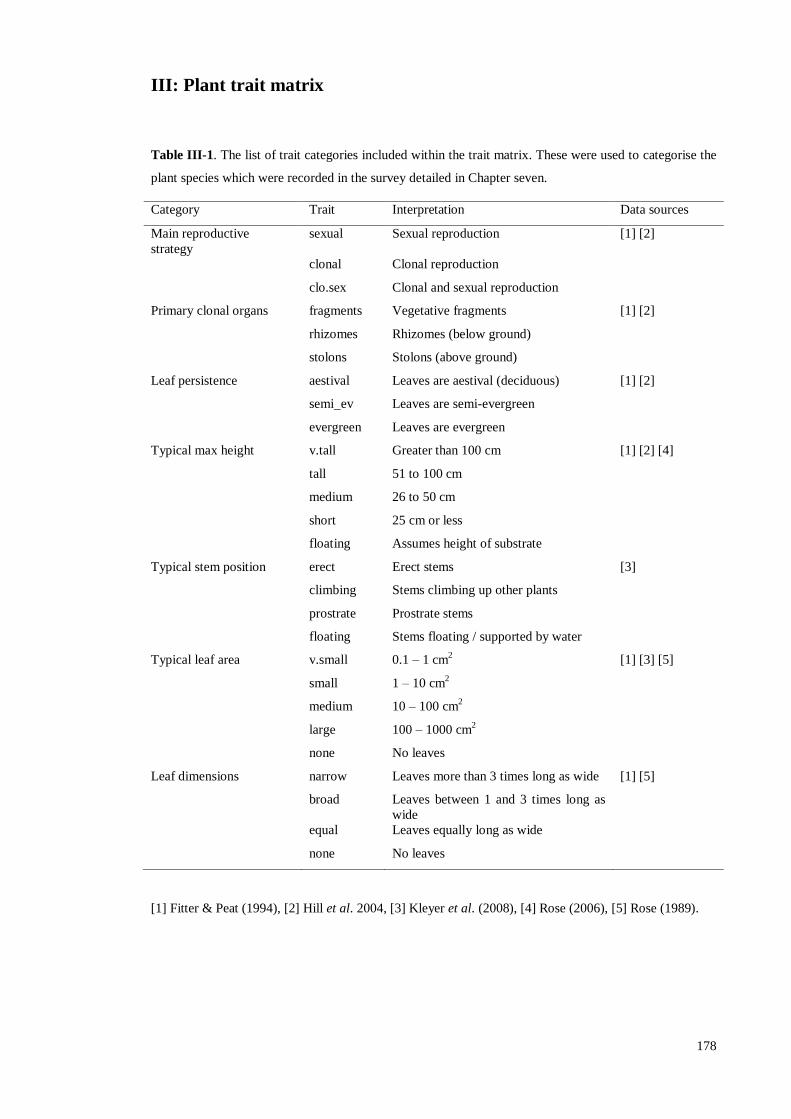
178
III: Plant trait matrix
Table III-1. The list of trait categories included within the trait matrix. These were used to categorise the
plant species which were recorded in the survey detailed in Chapter seven.
Category Trait Interpretation Data sources
Main reproductive
strategy
sexual Sexual reproduction [1] [2]
clonal Clonal reproduction
clo.sex Clonal and sexual reproduction
Primary clonal organs fragments Vegetative fragments [1] [2]
rhizomes Rhizomes (below ground)
stolons Stolons (above ground)
Leaf persistence aestival Leaves are aestival (deciduous) [1] [2]
semi_ev Leaves are semi-evergreen
evergreen Leaves are evergreen
Typical max height v.tall Greater than 100 cm [1] [2] [4]
tall 51 to 100 cm
medium 26 to 50 cm
short 25 cm or less
floating Assumes height of substrate
Typical stem position erect Erect stems [3]
climbing Stems climbing up other plants
prostrate Prostrate stems
floating Stems floating / supported by water
Typical leaf area v.small 0.1 – 1 cm2 [1] [3] [5]
small 1 – 10 cm2
medium 10 – 100 cm2
large 100 – 1000 cm2
none No leaves
Leaf dimensions narrow Leaves more than 3 times long as wide [1] [5]
broad Leaves between 1 and 3 times long as
wide
equal Leaves equally long as wide
none No leaves
[1] Fitter & Peat (1994), [2] Hill et al. 2004, [3] Kleyer et al. (2008), [4] Rose (2006), [5] Rose (1989).

179
Table III-2. (and next two pages). A trait matrix listing the specific traits of each plant species which was
recorded within the field survey of Phragmites australis dominated habitat, detailed in Chapter seven.
Species Trait category
Reproductive
strategy
Clonal
organs
Leaf
persistence
Max
height
Stem
position
Leaf area Leaf
dimensions
Crassula
helmsii
clonal fragments evergreen short prostrate v.small narrow
Phragmites
australis
clonal rhizomes aestival v.tall erect medium narrow
Agrostis
stolonifera
clo.sex stolons evergreen medium erect small narrow
Alisma
lanceolata
sexual none aestival tall erect medium broad
Alisma
plantago-
aquatica
sexual none aestival tall erect large broad
Apium
nodiflorum
clonal fragments aestival tall erect medium broad
Calystegia
sepium
clonal rhizomes aestival v.tall climbing medium broad
Carex
acutiformis
clonal rhizomes semi_ev v.tall erect medium narrow
Carex
flacca
clonal rhizomes evergreen medium erect small narrow
Carex
riparia
clo.sex rhizomes evergreen v.tall erect medium narrow
Cirsium
palustre
sexual none evergreen v.tall erect medium narrow
Eleocharis
palustris
clo.sex rhizomes aestival tall erect none none
Elodea
nuttallii
clonal fragments evergreen floating floating v.small narrow
Epilobium
hirsutum
clo.sex rhizomes semi_ev v.tall erect medium narrow
Epilobium
tetragonum
clo.sex none semi_ev tall erect small narrow
Galium
palustre
clo.sex rhizomes semi_ev tall erect v.small narrow
Juncus
acutiflorus
clo.sex rhizomes aestival tall erect small narrow
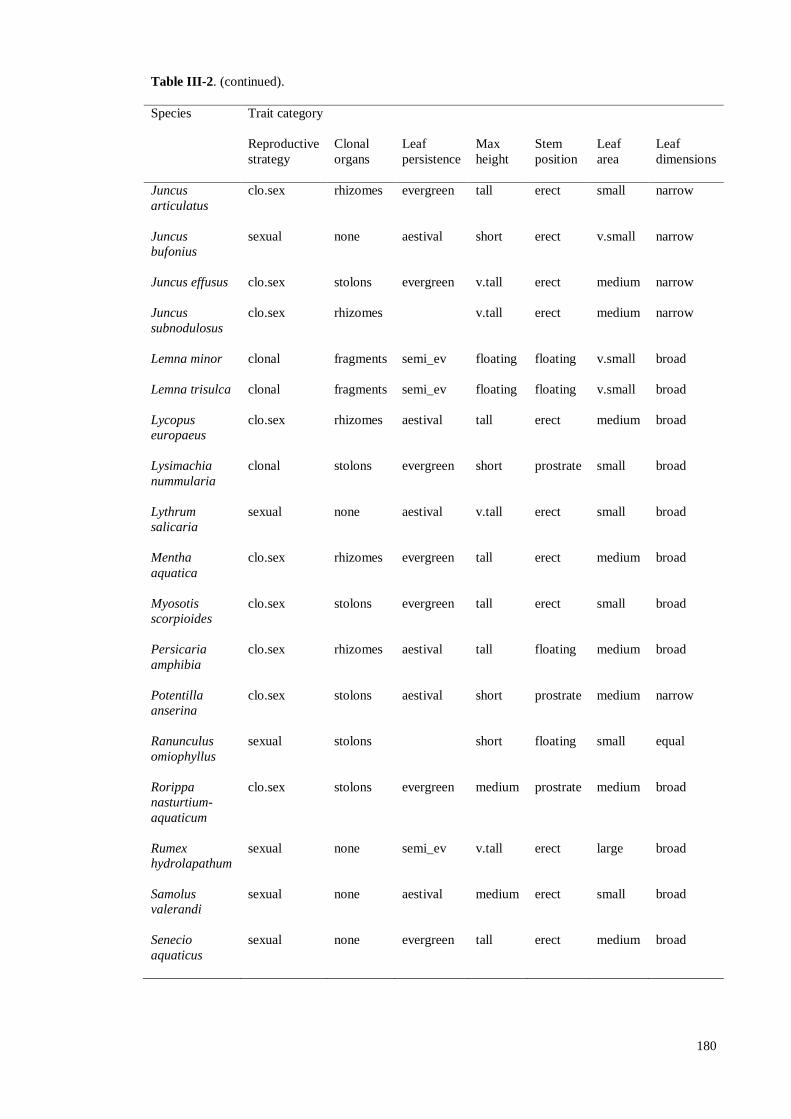
180
Table III-2. (continued).
Species Trait category
Reproductive
strategy
Clonal
organs
Leaf
persistence
Max
height
Stem
position
Leaf
area
Leaf
dimensions
Juncus
articulatus
clo.sex rhizomes evergreen tall erect small narrow
Juncus
bufonius
sexual none aestival short erect v.small narrow
Juncus effusus
clo.sex stolons evergreen v.tall erect medium narrow
Juncus
subnodulosus
clo.sex rhizomes v.tall erect medium narrow
Lemna minor
clonal fragments semi_ev floating floating v.small broad
Lemna trisulca
clonal fragments semi_ev floating floating v.small broad
Lycopus
europaeus
clo.sex rhizomes aestival tall erect medium broad
Lysimachia
nummularia
clonal stolons evergreen short prostrate small broad
Lythrum
salicaria
sexual none aestival v.tall erect small broad
Mentha
aquatica
clo.sex rhizomes evergreen tall erect medium broad
Myosotis
scorpioides
clo.sex stolons evergreen tall erect small broad
Persicaria
amphibia
clo.sex rhizomes aestival tall floating medium broad
Potentilla
anserina
clo.sex stolons aestival short prostrate medium narrow
Ranunculus
omiophyllus
sexual stolons short floating small equal
Rorippa
nasturtium-
aquaticum
clo.sex stolons evergreen medium prostrate medium broad
Rumex
hydrolapathum
sexual none semi_ev v.tall erect large broad
Samolus
valerandi
sexual none aestival medium erect small broad
Senecio
aquaticus
sexual none evergreen tall erect medium broad

181
Table III-2. (continued).
Species Trait category
Reproductive
strategy
Clonal
organs
Leaf
persistence
Max
height
Stem
position
Leaf
area
Leaf
dimensions
Solanum
dulcamara
clo.sex stolons aestival v.tall climbing medium broad
Stachys
palustris
clo.sex rhizomes aestival tall erect medium broad
Teucrium
scordium
clonal rhizomes tall erect small broad
Typha
angustifolia
clo.sex rhizomes aestival v.tall erect medium narrow
Typha
latifolia
clo.sex rhizomes aestival v.tall erect large narrow
Urtica dioica
clo.sex rhizomes semi_ev v.tall erect medium broad
Veronica
catenata
sexual stolons aestival medium erect small narrow

182
IV: Insect visitors
Figure IV-1. Observations whilst conducting fieldwork suggest that insects may be attracted to dense
flowering mats of Crassula helmsii.