the e ects of strain rate and temperature on commercial ... · the e ects of strain rate and...
TRANSCRIPT

Applied Physics A, Paintings: analysis, conservation and interp. manuscript No.(will be inserted by the editor)
The effects of strain rate and temperature on commercialacrylic artist paints aged one year to decades
Eric W.S. Hagan · Maria N. Charalambides · Christina R.T. Young ·Thomas J. S. Learner
Received: date / Accepted: date
Abstract Acrylic artist paints are viscoelastic com-
posites containing a high molecular-weight copolymer,
pigment and a variety of additives. The glass transition
temperature of the latex binder is typically slightly be-
low ambient conditions, giving mechanical properties
that are strongly dependent on strain rate and tem-
perature. In previous work, the viscoelastic behaviour
of custom-formulated latex artist paints was reported
for films with known volume fractions of pigment using
data from uniaxial tensile tests at different strain rates
and temperatures. Secant Young’s modulus and fail-
ure strain mastercurves were constructed for each film
through time-temperature superposition (TTS), allow-
ing predictions beyond the experimental timescale at
a selected reference temperature. A similar analysis is
now presented for a small set of commercial artist paintstested at ages of one year and 27 years. Experimental
Funding for this research was provided by Tate, the DeborahLoeb Brice Foundation and the Natural Sciences and Engi-neering Research Council of Canada (NSERC).
E.W.S. HaganPreservation Services Division, Canadian Conservation Insti-tute, 1030 Innes Road, Ottawa ON, K1B 4S7, CanadaTel.: +1 613-998-3721 x224Fax: +1 613-998-4721E-mail: [email protected]
M.N. CharalambidesDepartment of Mechanical Engineering, Imperial CollegeLondon, South Kensington Campus, London SW7 2AZ, UK
C.R.T. YoungDepartment of Conservation and Technology, The CourtauldInstitute of Art, Somerset House, Strand, London WC2R0RN, UK
T.J.S. LearnerThe Getty Conservation Institute, 1200 Getty Center Drive,Suite 700. Los Angeles, CA 90049-1684, USA
shift factor values are reported with fits to the Arrhe-
nius, WLF and Vogel Fulcher (VF) equations, along
with a comparison to published data for acrylic poly-
mers. The tensile results highlight a spectrum of prop-
erties that acrylic paints may exhibit—brittle glass to
hyperelastic—depending on the conditions during de-
formation. Strong similarities are shown between prod-
ucts from different manufacturers, and the findings sug-
gest a high degree of stability with age. A method for
predicting failure as a function of strain rate and tem-
perature is also presented, and the methodology gives a
framework for investigating other artist materials and
the factors influencing their mechanical properties.
Keywords Artist Paints · Viscoelastic · Time-
Temperature Superpostion · Failure Criteria
1 Introduction
1.1 Mechanical testing of artist paints
Much of the present knowledge surrounding the me-
chanical properties of artist paints comes from the body
of research by Mecklenburg and coworkers [1–7]. Ten-
sile data are published for oil, alkyd and acrylic artist
paints, primarily as a function of temperature, humidity
and age. The main focus of their work was the charac-
terisation of equilibrium response at low rates of defor-
mation. This led to a better understanding of the effects
of fluctuating temperature and humidity in the museum
environment, where tight tolerances come at high cost.
The knowledge was then used to suggest relaxing the
range for environmental control in museums and gal-
leries, and achieve a practical balance of preservation
and cost. More recently, Tantideeravit et al [8] have also
2 Eric W.S. Hagan et al.
predicted fatigue crack initiation times in years for var-
ious environmental conditions including ordinary and
extreme histories that paintings may experience in mu-
seum and conservation settings.
The influence of strain rate appeared as a topic
of concern during the International Conference on the
Packing and Transportation of Paintings in 1991 [9].
This meeting included estimates of material response
to strain rate and temperature [10], and provided ten-
sile test data at different speeds for painting materi-
als [1,2]. In later work, stress relaxation measurements
were used to show the relative effectiveness of differ-
ent lining treatments for oil paintings on canvas [11,
12]. Small strains were rapidly applied to model paint-
ing specimens, and stress was recorded over a period of
milliseconds to several days under different environmen-
tal conditions. More recently, the viscoelastic properties
of latex artist paints were investigated using custom
formulations with controlled pigment content [13–15].
The effects of pigment concentration and geometry were
shown over a large timescale using uniaxial tensile tests
to failure. These data were compared to micromechan-
ics models for composites [15], and used to calibrate a
non-linear viscoelastic model that showed potential for
finite element analysis (FEA) of stress in paintings [13].
The present work expands on past mechanical test-
ing of commercial artist paints by focusing in greater
depth on the effects of time and temperature. Emphasis
is given to acrylics; however, the methods are applicable
to many other painting materials. Previous research has
shown that acrylic paints are time-dependent materials,exhibiting characteristic viscoelastic properties [13–16].
A technique for studying this form of material behav-
ior is dynamic mechanical analysis (DMA), where the
relationship between sinusoidal stress and strain is mea-
sured during temperature or frequency sweeps. Ormsby
et al [16] used DMA to examine the effects of tempera-
ture, humidity and accelerated ageing on acrylic artist
paints. In the present work, uniaxial tensile testing was
applied since the time dependent failure strains were of
interest for assessing failure criteria. A challenge with
this approach is that a greater amount of experimen-
tal time and sample material is required. Test films in-
cluded one-year-old artist paints and an acrylic ground.
Two samples of 27-year-old paint films were also do-
nated by Mecklenburg [17], allowing the opportunity to
simultaneously investigate the effects of age on mate-
rials of related composition. When possible, it is valu-
able to examine naturally aged paint samples due to the
complications that may arise during accelerated meth-
ods.
1.2 Ageing characteristics
The long-term stability of artist and conservation treat-
ment materials is often estimated through accelerated
ageing experiments at elevated temperature and light
intensity. A practical advantage of this approach is that
it provides useful data in a short period of time, while a
possible disadvantage is the generation of physical and
chemical processes not present under ambient condi-
tions. Consider the thermal aging of a latex paint film,
which may increase coalescence of the binder, evapo-
rate film components and melt crystalline surfactant
back into the film. All of these changes will affect me-
chanical properties and may not occur under ambient
conditions. On the other hand, accelerated ageing can
drive processes that provide a first approximation of
mechanical response that would occur under natural
conditions over an extended time.
The measurement of degradation by accelerated ag-
ing can be further complicated by heterogeneity through
the material thickness. If damage occurs at the surface
through photo-oxidation, then heterogenous aging can
result, and mechanical testing of the bulk material may
not show a change. Micro or nano-indentation of the
surface, or through the thickness profile, could possi-
bly provide more valuable information in this scenario.
Heterogenous ageing may also result during a thermo-
oxidative reaction if the thickness of the sample mate-
rial is large [18] with slow oxygen diffusion. With paint
films, this is less likely to occur due to the typical thin
sample geometry 0.1 mm to 0.2 mm).
Acrylic artist paints are considered highly stablematerials; however, evidence of degradation is reported
in the literature from experiments involving thermal
and light-induced ageing. Learner et al [19] showed a
lack of oxidation products after light aging, using fluo-
rescent light filtered below 400nm to simulate museum
conditions. Photo-ageing studies by Chiantore and Laz-
zari [20] on acrylic resins, and on paint films [21], showed
that cross-linking and chain scission can occur with
light exposure, and the form of damage appears to de-
pend on the type of copolymer binder: chain scission for
EA/MMA, and cross-linking for nBA/MMA (via alkyl
side chains). The light source used was a Xe-arc lamp
filtered below 295 nm , with a maximum temperature of
45 ◦C on the samples. Scalarone et al [21] reported that
the presence of pigment did not affect the degradation
results unless ultraviolet (UV) energy was unfiltered in
the 295 nm to 400 nm band. Smith [22] also studied the
photo-ageing of non-pigmented films of a nBA/MMA
copolymer commonly used to formulate artist paints.
Exposure to light from a Xenon arc lamp through reg-

The effects of strain rate and temperature on commercial acrylic artist paints aged one year to decades 3
ular glass (filtering below approx. 330 nm) showed in-
creased cross-linking with light dose.
Most ageing studies focus on chemical analysis of
degradation products, while mechanical testing is less
common. The correlation with mechanical properties is
important since it provides an indicator of the physical
significance of a chemical change. Ormsby et al [16] pro-
vide one of the few mechanical studies of aged acrylic
paint films using DMA. Photo-ageing with daylight flu-
orescent lamps (UV filtered) to a light dose of 40 Mlx · hdid not cause an observable change in the bulk film
properties; however, changes were observed after ther-
mal ageing at 60 ◦C for 16 weeks for some products.
2 Materials and Methods
2.1 Sample Materials
Acrylic latex artist paints were cast on polyester film
and allowed to naturally age for one year prior to test-
ing. The purpose of the initial ageing period was to
ensure adequate coalescence of the paint binder, evapo-
ration of volatile additives, and migration of surfactants
[23–27]. Additional films of 27-year-old artists acrylic
paints prepared by Mecklenburg [17] were included as a
subset of the materials. The method of preparing these
films was similar to the current approach. Table 1 pro-
vides a summary of the test materials indicating man-
ufacturer, pigment type and age at the time of testing.
One day prior to analysis, the paint films were re-
moved from the plastic substrate, and cut in 60× 6 mm
rectangular strips. Paper tabs were then bonded to the
ends of each specimen with cyanoacrylate adhesive, leav-
ing a 40 mm gauge length. The tabs provided rigid sec-
tions for gripping the samples, while minimizing slip-
page and stress concentrations during clamping. The
prepared samples were placed in small enclosures with
silica gel buffering at 50 % RH overnight to equilibrate
moisture content.
The thickness of each specimen was measured three
times across the gauge length immediately before place-
ment in the test chamber. An average value was used
to calculate the initial cross-sectional area, and the re-
sulting stress during deformation. Film thickness was in
the range of 0.1 mm to 0.2 mm across the entire sample
set.
2.2 Apparatus
Uniaxial tensile tests were performed with a univer-
sal testing machine (Instron, 4301) at four crosshead
speeds: 0.05, 0.5, 5 and 50 mm/min. Tests were repeated
Table 1 List of latex paint samples giving manufacturer,age, and abbreviation used in subsequent tables.
Product Abreviation Age (y)
Golden latex (no pigment) Binder 1Golden TiO2 Gldn TiO2 1Golden raw umber Gldn R. U. 1Liquitex ground Lqtx gnd. 1Liquitex burnt umber Lqtx B.U. 27Speedball raw umber Spdbll R.U. 27
twice for each speed at temperatures −10, 0, 10, 20
and 30 ◦C spanning the glass transition temperature at
Tg ≈ 10 ◦C. This provided a total of twenty test con-
ditions for each material, with 60 paint film specimens
required for the replicates.
A custom-made environmental chamber was used to
maintain the temperature set-point during tensile test-
ing. The inner chamber was constructed with a 200W
thermoelectric assembly (TE Tech., CP-200) mounted
to a die-cast aluminum enclosure with approximate di-
mensions of 345× 148× 82 mm (Hammond, 1590Z166).
A calibrated PID controller (TE Technology, TC-720)
was used to set the aluminum wall temperature for feed-
back control, and a thermistor was placed next to the
sample to monitor air temperature at the test location.
A small fan was also mounted inside the enclosure to
circulate the air and increase temperature uniformity.
The perimeter of the aluminum chamber was insulated,
and an outer support structure was built to adapt to
the Instron test machine. Ports were added to allow
for installation of the grips, load-cell extension, sensor
connections, and humidity control. An additional port
in the door allowed tightening of the lower grip after
the sample was conditioned to the environment in the
chamber.
Humidity was controlled using a system constructed
from a BasicX-24 microcontroller, serial LCD screen,
opto-isolated relays (Panasonic, AQZ105), diaphragm
pumps (Hargraves), and sensor (Vaisala, HMP50). A
program was written for simple on/off control of the
two pumps based on user set-point, which cycled air
from the chamber through a desiccant column and wa-
ter bubbler as required. The chamber was programmed
for 50 % RH, unless otherwise specified, for tempera-
tures at 10 ◦C and greater.
3 Results and Discussion
Load, extension and time were sampled during each
tensile experiment, and used to construct stress-strain
curves for the prescribed strain histories. From these
data, a secant modulus, Es, at 0.5 % elongation, and

4 Eric W.S. Hagan et al.
strain to failure, εf, were tabulated with corresponding
initial strain rate, Ro, and time at failure, tf, respec-
tively. A brief overview of the stress-strain calculations
is provided since the approach differs from previous me-
chanical studies on artist paints.
3.1 Stress and Strain
Three common measures of deformation are shown in
Equations 1-3 using the sample gauge length, l, at time,
t, and gauge length, lo (at t = 0). The engineering (nom-
inal) strain, e, is most often applied for small deforma-
tions, whereas true strain, ε, is better suited for small
to large extensions. The latter method accounts for in-
creasing gauge length as the sample is stretched. The
extension ratio, λ, is another common measure that is
used primarily for elastomers [28]. In this study, the
true strain was applied to all tensile data using Equa-
tion 3. Note that nominal and true strain converge as
e−→0; therefore, the difference is negligible at small
extensions (see Table 2).
e = (l − lo) /lo = ∆l/lo (1)
λ = l/lo (2)
ε =
∫ l
lo
dl
lo= ln (l/lo) (3)
There are also different ways to report stress in a tensile
experiment. For small strains, the nominal stress, s, is
calculated as
s = P/Ao, (4)
where P is the measured load on the sample, and Ao
is the initial cross-sectional area. Equation 4 underes-
timates stress at large strains since the cross-sectional
area decreases as the sample is stretched. A correction
is often applied using true stress
σ = λs, (5)
which accounts for the cross-sectional area decrease as a
function of strain. The accuracy of Equation 5 relies on
strain uniformity across the sample gauge length, and
the assumption of constant volume during deformation
(incompressibility). The incompressibility assumption
requires a shear modulus that is much smaller than the
bulk modulus, or similarly Poisson’s ratio of 0.5. Ideally,
the calculation of true stress would take into account
the compressibility of the sample using the time depen-
dent Poisson’s ratio or shear modulus; however, this was
beyond the scope of the project. Time-dependent mod-
uli and Poisson’s ratio are further discussed by Ferry
[29] and Tschoegl [30] respectively.
Table 2 Comparison of strain rate and nominal strain withtrue strain for a tensile test at constant speed.
ε (R-Ro)/Ro, % (e-ε)/ε, %
0 0 00.005 -0.50 0.250.010 -1.0 0.500.020 -2.0 1.00.050 -4.9 2.50.100 -9.5 5.20.200 -18 11
The purpose of collecting tensile data at multiple
temperatures and strain rates was to apply the time-
temperature superposition principle (TTS) [29,31], and
construct mastercurves of Es and εf. This requires a
measure of time for each of the parameters. The appa-
ratus was not capable of performing constant strain rate
experiments, where speed is increased accordingly dur-
ing sample extension. Tests were therefore performed
at constant speed, V, resulting in a strain rate decrease
with time and strain according to
R(t) =dε(t)
dt=
V
lo + V t, (6)
where
ε(t) = ln
(V t+ lolo
). (7)
Taking the limit of Equation 6 as t approaches zero
gives the initial strain rate
Ro = limt→0
R(t) =V
lo. (8)
The inverse of the initial strain rate, 1/Ro, was used
as the time parameter in seconds for plotting secant
modulus, Es. For failure strain, εf, the time at failure,
tf, was tabulated at each value and the average strain
rate was used. Table 2 shows the percentage decrease of
strain rate versus the applied true strain for a constant
speed tensile test. Deviation from Ro is less than 10 %
for strains below 0.1, indicating approximately constant
strain rate for the strains of primary interest. As a point
of reference, many artists’ oil paints fail at strains less
than 0.05 in an ambient environment when deformed
at low strain rate [2,7].
3.2 Stress-Strain Curves
Figure 1 shows a representative set of tensile stress-
strain curves using the 27 year-old Liquitex burnt um-
ber test data. The material exhibits a strong time de-
pendent response, where stress increases with increas-
ing strain rate and/or decreasing temperature. Note

The effects of strain rate and temperature on commercial acrylic artist paints aged one year to decades 5
0
1
2
3
4
5
6
7
8
0.000 0.001 0.002 0.003 0.004 0.005
True
Str
ess
[MPa
]
True Strain
1. 0.05mm/min 2. 0.5mm/min 3. 5mm/min 4. 50mm/min
1b
1a, 2b
2a
3b
4b
4a
3a b. 30˚C a. 20˚C
Fig. 1 Stress-strain curves for 27 year-old Liquitex burntumber paint films at two temperatures and four crossheadspeeds.
that the curve for 0.05 mm/min at 20◦C overlaps with
5 mm/min at 30◦C. The effect of a strain rate change
by two orders of magnitude is similar to changing tem-
perature by 10 ◦C. The curves highlight the viscoelastic
nature of the material, and show potential for applying
time-temperature superposition (TTS).
3.3 Secant Modulus
For an elastic-plastic material, the Young’s modulus,
E, is the slope of the stress-strain curve prior to plas-
tic deformation, and by definition it is unaffected by
strain rate. Stress varies with time at fixed strain for a
viscoelastic material; therefore, a relaxation modulus,
E (t), is more appropriately defined. Determining E (t)
experimentally is a challenge since it is the ratio of time
varying stress, σ(t), to a small step (i.e. instantaneous)
strain, εo, given by the relationship
E(t) =σ(t)
εo. (9)
It is possible to measure part of the relaxation mod-
ulus by performing a stress relaxation experiment where
a rapid initial strain is applied, followed by a period
of constant strain where the stress is monitored. Val-
ues of E (t) are typically taken at times significantly
greater than the ramp duration. In this investigation, a
secant modulus, Es at ε=0.005 was used as an alternate
method to summarise tensile data at small strains. The
value of Es was tabulated from each stress-strain curve
along with the corresponding initial strain rate, Ro, cal-
culated from Equation 8. The tensile experiments were
performed at constant speed; therefore, strain rate de-
creased during extension of the sample according to the
function R(t) in Equation 6. At ε=0.005, the strain rate
decreases by only 0.5 % from the initial value of Ro.
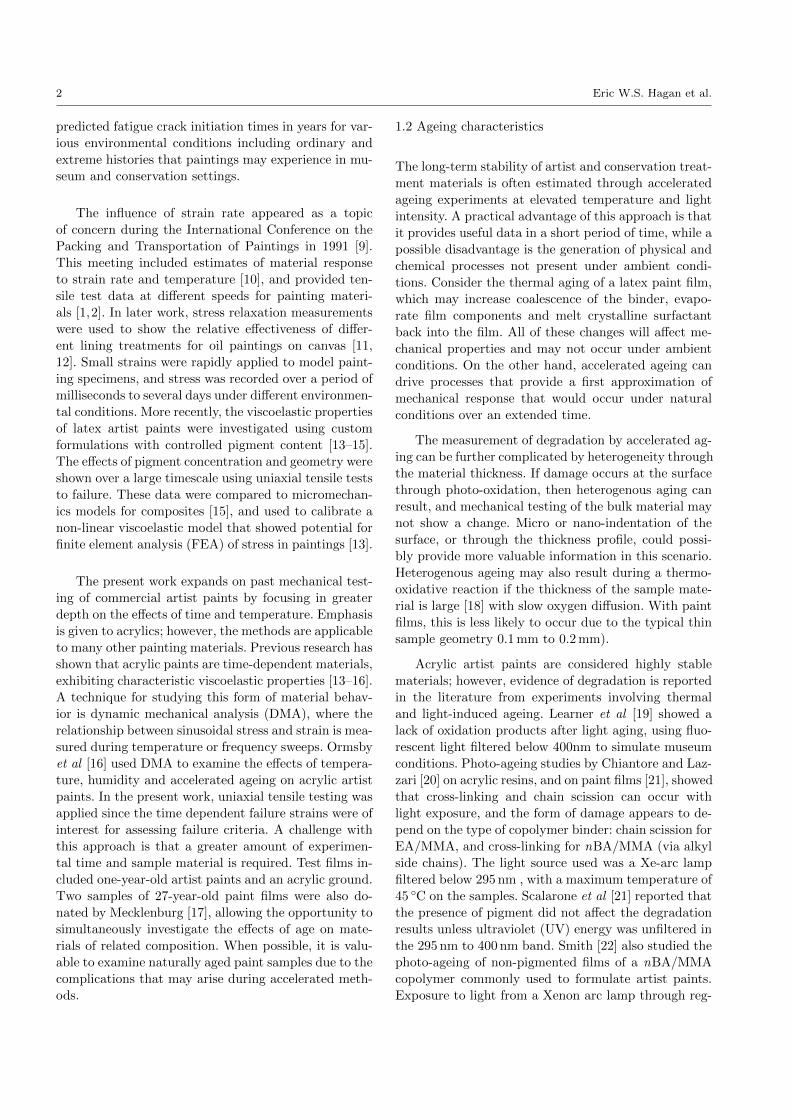
Figure 2 summarises the Es values for six materials
at the different test speeds and temperatures on a log-
log plot. The time axis is given as log(1/Ro) to show
decreasing Es with increasing time. The glass transition
temperature, Tg, of artists acrylic paints is typically
near 10 ◦C when measured with differential scanning
calorimetry (DSC), indicating that these data span the
approximate range of Tg ± 20 ◦C. Each plot highlights
the response of the respective film through the transi-
tion from glassy to rubbery behavior. The largest mod-
ulus change occurs for the latex binder since it lacks the
binder constraint given by rigid pigment particles. The
curves become compressed and shift upwards when pig-
ment is present, giving an effect similar to cross-linking.
For the artist paints and the acrylic ground, Es varies
by approximately two orders of magnitude between rub-
bery and glassy regions. The umber paints and ground
material contain platelet-shaped particles, which affect
the modulus to a greater extent than spherical particles.
The modulus enhancement from the pigment depends
on the volume fraction, geometry and orientation of the
particles [14,15,32–34]. Particle size, and adhesion be-
tween the particles and matrix, may also play a role.
For each material, the curves at −10◦C begin to
flatten as the test speed increases (short times) and
the acrylic binder becomes glassy. Higher strain rates
and/or lower temperature will not have a strong effect
on the modulus at this point, and the value is con-
sidered the instantaneous modulus, Eo. Figure 2 also
shows that the modulus approaches a lower limit at
30 ◦C for the slowest test speed, which indicates the
rubbery material response near equilibrium leading to
Ee. A factor that was not investigated in this study
was the influence of physical aging [35] when the mate-
rial is quenched below Tg. This will have an impact on
the measured Es values, which are expected to increase
with time spent at low temperature before the test is
initiated. All experiments were performed after approx-
imately 15 min equilibration at the low temperatures,
which is significantly longer than the duration of the
experiment.
Time-Temperature Superposition The TTS principle is
a valuable method for summarising modulus data for a
viscoelastic material, and predicting the response be-
yond the experimental timescale: (1) at strain rates
higher than the limits of the instrument; (2) at very
low strain rates, not practical due to the time required
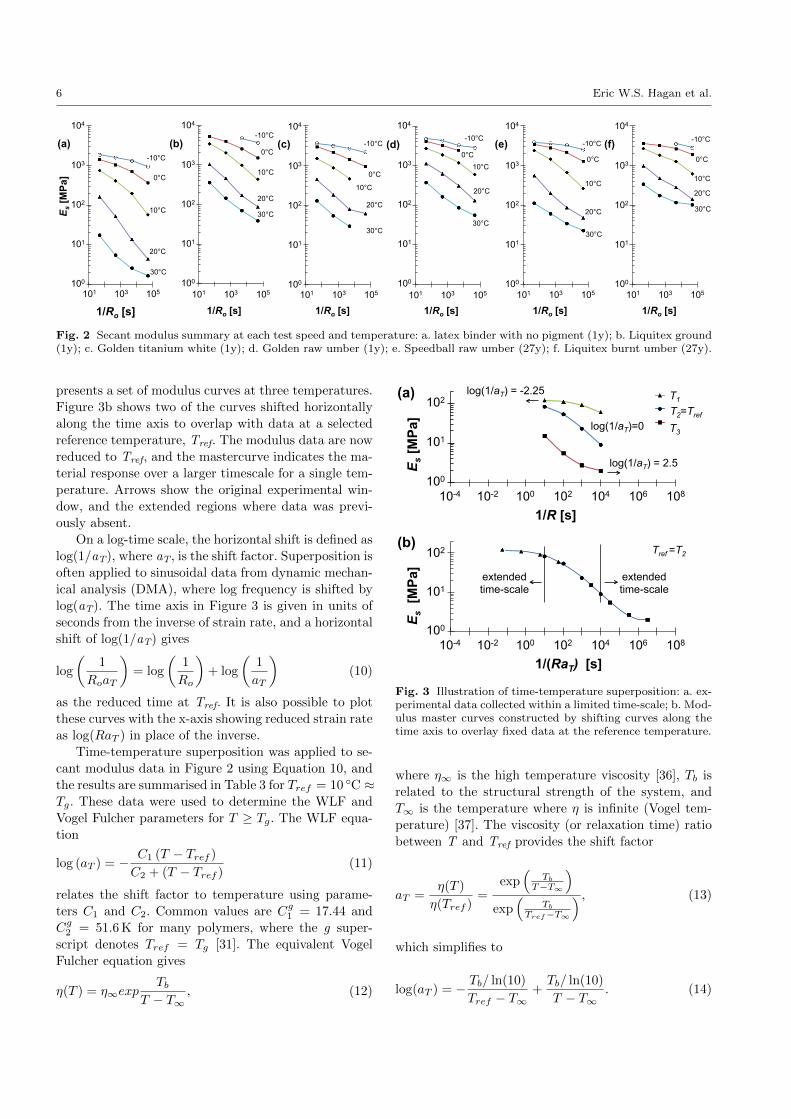
for measurement. To illustrate the method, Figure 3a
6 Eric W.S. Hagan et al.
E s [M
Pa]
1/Ro [s]
(a) -10°C
0°C
10°C
20°C
30°C 100
101
102
103
104
101 105 103
1/Ro [s]
(b) -10°C
0°C
10°C
20°C
30°C
100
101
102
103
104
101 105 103
1/Ro [s]
(c) -10°C
0°C
10°C
20°C
30°C
100
101
102
103
104
101 105 103
1/Ro [s]
(d) -10°C
0°C 10°C
20°C
30°C
101 105 103 100
101
102
103
104
1/Ro [s]
(f) -10°C
0°C
10°C
20°C
30°C
101 105 103 100
101
102
103
104
1/Ro [s]
(e) -10°C
0°C
10°C
20°C
30°C
101 105 103 100
101
102
103
104
Fig. 2 Secant modulus summary at each test speed and temperature: a. latex binder with no pigment (1y); b. Liquitex ground(1y); c. Golden titanium white (1y); d. Golden raw umber (1y); e. Speedball raw umber (27y); f. Liquitex burnt umber (27y).
presents a set of modulus curves at three temperatures.
Figure 3b shows two of the curves shifted horizontally
along the time axis to overlap with data at a selected
reference temperature, Tref. The modulus data are now
reduced to Tref, and the mastercurve indicates the ma-
terial response over a larger timescale for a single tem-
perature. Arrows show the original experimental win-
dow, and the extended regions where data was previ-
ously absent.
On a log-time scale, the horizontal shift is defined as
log(1/aT), where aT, is the shift factor. Superposition is
often applied to sinusoidal data from dynamic mechan-
ical analysis (DMA), where log frequency is shifted by
log(aT). The time axis in Figure 3 is given in units of
seconds from the inverse of strain rate, and a horizontal
shift of log(1/aT) gives
log
(1
RoaT
)= log
(1
Ro
)+ log
(1
aT
)(10)
as the reduced time at Tref. It is also possible to plot
these curves with the x-axis showing reduced strain rate
as log(RaT ) in place of the inverse.
Time-temperature superposition was applied to se-
cant modulus data in Figure 2 using Equation 10, and
the results are summarised in Table 3 for Tref = 10 ◦C ≈Tg. These data were used to determine the WLF and
Vogel Fulcher parameters for T ≥ Tg. The WLF equa-
tion
log (aT ) = − C1 (T − Tref )
C2 + (T − Tref )(11)
relates the shift factor to temperature using parame-
ters C1 and C2. Common values are Cg1 = 17.44 and
Cg2 = 51.6 K for many polymers, where the g super-
script denotes Tref = Tg [31]. The equivalent Vogel
Fulcher equation gives
η(T ) = η∞expTb
T − T∞, (12)
E s [
MPa
]
1/(RaT) [s]
(b)
extended time-scale
Tref =T2
10-4 10-2 100 102 104 106 108 100
102
101 extended time-scale
E s [M
Pa]
1/R [s]
Series3 Series1 Series2
log(1/aT) = 2.5
(a) log(1/aT) = -2.25
T2=Tref
T1
T3 log(1/aT)=0
10-4 10-2 100 102 104 106 108 100
102
101
Fig. 3 Illustration of time-temperature superposition: a. ex-perimental data collected within a limited time-scale; b. Mod-ulus master curves constructed by shifting curves along thetime axis to overlay fixed data at the reference temperature.
where η∞ is the high temperature viscosity [36], Tb is
related to the structural strength of the system, and
T∞ is the temperature where η is infinite (Vogel tem-
perature) [37]. The viscosity (or relaxation time) ratio
between T and Tref provides the shift factor
aT =η(T )
η(Tref )=
exp(
Tb
T−T∞
)exp
(Tb
Tref−T∞
) , (13)
which simplifies to
log(aT ) = − Tb/ ln(10)
Tref − T∞+Tb/ ln(10)
T − T∞. (14)

The effects of strain rate and temperature on commercial acrylic artist paints aged one year to decades 7
The VF equation is commonly written in the three pa-
rameter form [38],
log (aT ) = A+B
T − T∞, (15)
where
A = − B
Tref − T∞
B =Tb
ln(10).
(16)
Comparison with the WLF equation gives A = −C1
and B = C1C2. Two additional parameters that are
derived from the WLF/VF equations [36] are the dy-
namic fragility
m = Tg
(Cg
1
Cg2
)=
Tb/Tg
ln(10) (1− T∞/Tg)2 , (17)
and the apparent activation energy
Eg = ln(10)RTgm. (18)
The values of Eg and m relate to the rate of deviation
of Equation 15 from the Arrhenius equation
log (aT ) =Ea
ln(10)R
(1
T− 1
Tref
)(19)
at Tg, where Ea is the activation energy, and R is the
gas constant. A comparison of Equations 15 and 19 in-
dicates that the VF equation is equivalent to the Arrhe-
nius form when T∞ = 0 K and Eg = Ea, which gives
B = Ea/[ln(10)R] and m = Ea/[ln(10)RTg]. Devia-
tion of VF from Arrhenius increases as T∞ increases,
and with subsequent variation of B. Qin and MacKenna
[36] describe these concepts with an analysis of data in-
dicating a general relationship of Eg ≈ 0.006T 2g − 35
for polymeric materials. The estimate predicts Eg ≈445 kJ/mol for the paint films in this study where Tg =
283 K.
Table 4 summarises the WLF, VF and Arrhenius
parameters from fitting Equations 11 and 19 to log(aT)
data in Table 3. Values of Ea for the Arrhenius equa-
tion are in the range of 221 to 264 kJ/mol for the set
of materials. Accuracy is limited by three data points
and a narrow temperature range of 20 ◦C for curve fits
above and below Tg. The fits for WLF/VF were there-
fore performed under two conditions: 1. unconstrained,
solving for Cg1 and Cg
2 ; and 2. constrained, solving for
Cg1 with Cg
2 = 50 K. The latter condition is based on the
general observation that Cg2 ≈ 50 K for many polymers
[29]. Apparent activation energy is 304 to 399 kJ/mol
for the unconstrained fit (slightly lower than the pre-
diction of 445 kJ/mol), and dynamic fragility values
fall within the range of values in a review by Qin and
Table 3 Experimental values of log(aT) versus temperatureusing Tref = 283 K.
263 K 273 K 283 K 293 K 303 KProduct −10 ◦C 0 ◦C 10 ◦C 20 ◦C 30 ◦C
Latex binder 3.4 1.8 0 -2.1 -3.9Golden TiO2 3.7 2.0 0 -1.8 -3.3Golden R.U. 3.1 1.8 0 -2 -3.7Liquitex gnd. 3.2 1.5 0 -2 -3.3Speedball R.U. 3.3 1.8 0 -2.2 -3.8Liquitex B.U. 3.5 2.1 0 -2.3 -3.9
McKenna [36] at 64 to 79 for the films. The WLF pa-
rameters are significantly higher for the non-pigmented
latex and Golden products, while the values for 27 year-
old films are in the more typical range. Similarly, the
values of B are high for the first three films in the list,
and T∞ appears low in comparison to the typical value
of Tg − 50 K. The fits with the constraint of Cg2 = 50 K
show less variation of Cg1 and B, with an average of
12.6 and 630 respectively. The values of Ea and m are
slightly higher with the constraint added; however, they
are still within the same general magnitude.
Comparisons with data for pure homopolymers are
complicated by the fact that the latex paints are acrylic
copolymers containing a variety of additives and a pig-
ment phase. The one-year-old commercial films in this
study are most likely nBA/MMA copolymers, while
27 year-old films are expected to contain a EA/MMA
copolymer [39]. The ratio of the monomers is formu-
lated to give a glass transition near 10 ◦C, and the
molecular weight, Mw, is typically very high for latex
paint binders. In an analysis of acrylic artist paints from
the 1990’s, Chiantore et al [39] determined average Mw
in the range of 93,600 to 696,000. Difficulties were en-
countered when dissolving the copolymer into solution
with tetrahydrofuran, and it was noted that the molec-
ular weights may be higher than measured. In order to
provide an approximate comparison with related ma-
terials, Table 5 lists a series of WLF/VF parameters
for acrylic homopolymers from literature sources with
C1, C2 and A adjusted to Tref = Tg using Equation
16 and the described VF-WLF correlation. Values of
Mw are also given where available. Andreozzi et al [40]
have published VF parameters for p(EA), showing an
increase of B and T∞ with increasing Mw. Their re-
sults also indicate a decrease of Eg and m with Mw for
the materials. As a general observation, the WLF and
VF values for the constrained fits in Table 4 show good
correlation with those in Table 5. The Table 4 calcula-
tions of dynamic fragility and Eg are also of comparable
magnitude.
Figure 5 gives the secant modulus master curves of
the one-year-old films constructed using log(aT) values

8 Eric W.S. Hagan et al.
-‐6
-‐4
-‐2
0
2
4
6
240 250 260 270 280 290 300 310 320
log(a T
)
Temperature, Kelvin
Tg
Arrhenius WLF
Latex binder
Golden TiO2
Golden R.U.
Fig. 4 Comparison of log(aT) experimental values at Tref =283 K with WLF (unconstrained, see Table 4) and Arrheniuscurve fits above and below Tg respectively.
Table 4 Comparison of WLF, Vogel-Fulcher and Arrheniusfit parameters for log(aT) data in Table 3 using Tref = 283 K.
Arh. WLF V-FEa Eg Cg
1 Cg2 B T∞ m
Product kJmol
kJmol
K K
Unconstrained fitsBinder 244 347 29 130 3815 153 64Gldn TiO2 264 399 20 100 1977 183 74Gldn R.U. 221 334 25 113 2786 170 62Lqtx gnd 221 304 9 33 288 250 56Spdbll R.U. 235 401 14 53 742 230 74Lqtx B.U. 249 430 13 46 586 237 79Average 240 366 15 65 997 218 68Constrained Cg
2 = 50 KBinder — 405 13.2 50 660 233 75Gldn TiO2 — 353 11.5 50 575 233 65Gldn R.U. — 383 12.5 50 625 233 71Lqtx gnd — 353 11.5 50 575 233 65Spdbll R.U. — 405 13.2 50 660 233 75Lqtx B.U. — 420 13.7 50 685 233 78Average — 386 12.6 50 630 233 71
in Table 3 adjusted to Tref = 20 ◦C. Each curve shows
a transition from glassy behavior at very short times
(high strain rate) to rubbery at very long times (low
strain rate). The inflection occurs at a similar time,
which suggests a similar Tg between products. The in-
fluence of the inorganic particles is now more clearly
shown than Figure 2. Films with pigment or filler have
higher overall modulus values due to the strain enhance-
ment provided by the rigid particles. This is observed
by the upward shift to higher Es values at all times.
The titanium white paint film has a low modulus
relative to the other products, which is likely due to
the near spherical geometry of the particles. Earth pig-
E s [M
Pa]
1/(RoaT) [s]
Latex binder (no pigment) Liquitex ground Golden titanium white Golden raw umber
10-4 10-2 100 102 104 106 108 100
101
102
103
104
Fig. 5 Secant modulus master curves at 20 ◦C for one-year-old paint films and the non-pigmented latex.
ments (umber, ochre, sienna) contain clays, which are
expected to give a stronger enhancement effect due to
their platelet geometry [15]. The influence of particle
shape, and differences in concentration, are likely the
main factors contributing to differences in film mod-
ulus. The inorganic volume fraction for the titanium
white product was estimated at 33 % in a previous study
[42] using a combination of gas pycnometer measure-
ments for density, thermo-gravimetric analysis (TGA),
and a simple rule of mixtures calculation. Values were
not estimated for films containing other pigment types.
The acrylic ground used in this study was selected
from a range of commercial products examined in ear-
lier work [42,43]. It was found that this particular prod-
uct was relatively stiff and less extensible within a set of
similar materials. Energy dispersive x-ray (EDX) anal-
ysis of the ground indicated a variety of inorganic com-
pounds including TiO2, CaCO3, kaolin and likely talc.
Similar rule-of-mixtures approximations with TGA data
suggested a higher volume fraction of inorganic par-
ticles in the ground than in other products. Unfortu-
nately, the mixture of various types of inorganic com-
pounds made it difficult to provide an accurate value
for comparison. The higher Es values for the acrylic
ground relative to the titanium white paint are again
likely due to differences in concentration and particle
shape.
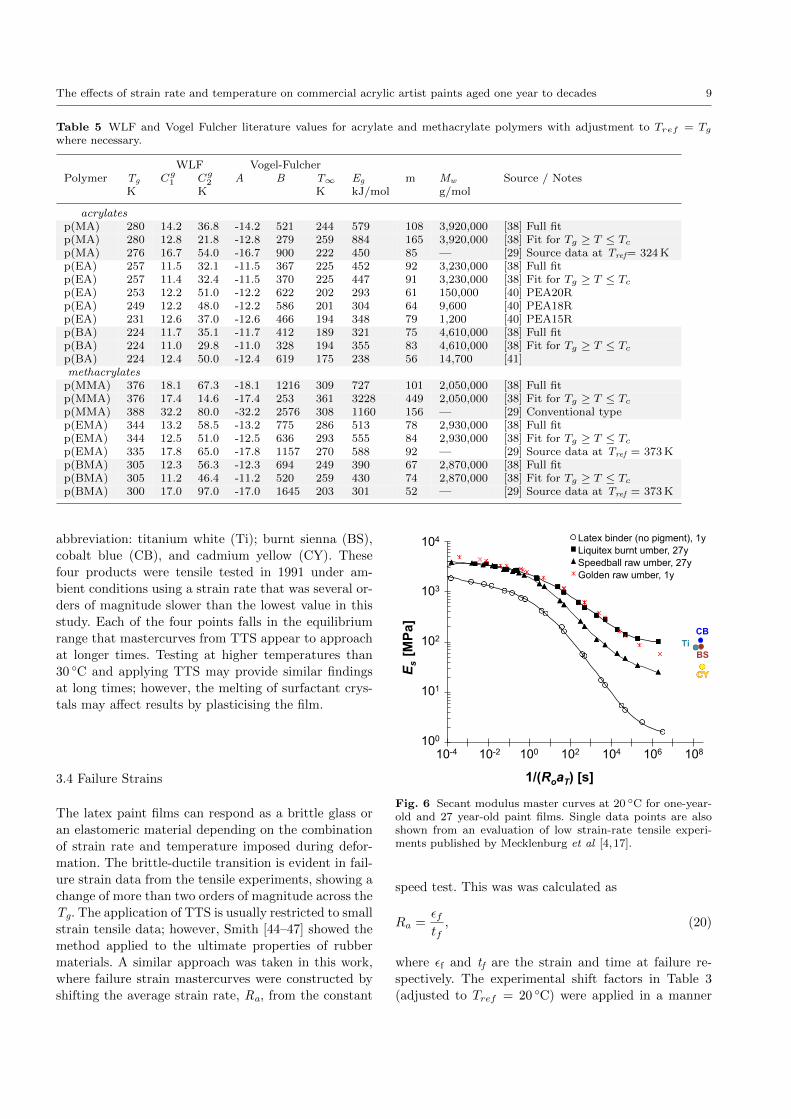
A similar plot of Es is given in Figure 6, showing
a comparison of curves for the one-year and 27 year-
old paint films. The results are similar, which provides
some indication that the acrylic binder has not changed
significantly with age. Four individual points are also
shown from a re-examination of tensile data collected
by Mecklenburg et al [4,17]. Pigments are indicated by
The effects of strain rate and temperature on commercial acrylic artist paints aged one year to decades 9
Table 5 WLF and Vogel Fulcher literature values for acrylate and methacrylate polymers with adjustment to Tref = Tg
where necessary.
WLF Vogel-FulcherPolymer Tg Cg
1 Cg2 A B T∞ Eg m Mw Source / Notes
K K K kJ/mol g/mol
acrylatesp(MA) 280 14.2 36.8 -14.2 521 244 579 108 3,920,000 [38] Full fitp(MA) 280 12.8 21.8 -12.8 279 259 884 165 3,920,000 [38] Fit for Tg ≥ T ≤ Tc
p(MA) 276 16.7 54.0 -16.7 900 222 450 85 — [29] Source data at Tref= 324 Kp(EA) 257 11.5 32.1 -11.5 367 225 452 92 3,230,000 [38] Full fitp(EA) 257 11.4 32.4 -11.5 370 225 447 91 3,230,000 [38] Fit for Tg ≥ T ≤ Tc
p(EA) 253 12.2 51.0 -12.2 622 202 293 61 150,000 [40] PEA20Rp(EA) 249 12.2 48.0 -12.2 586 201 304 64 9,600 [40] PEA18Rp(EA) 231 12.6 37.0 -12.6 466 194 348 79 1,200 [40] PEA15Rp(BA) 224 11.7 35.1 -11.7 412 189 321 75 4,610,000 [38] Full fitp(BA) 224 11.0 29.8 -11.0 328 194 355 83 4,610,000 [38] Fit for Tg ≥ T ≤ Tc
p(BA) 224 12.4 50.0 -12.4 619 175 238 56 14,700 [41]methacrylates
p(MMA) 376 18.1 67.3 -18.1 1216 309 727 101 2,050,000 [38] Full fitp(MMA) 376 17.4 14.6 -17.4 253 361 3228 449 2,050,000 [38] Fit for Tg ≥ T ≤ Tc
p(MMA) 388 32.2 80.0 -32.2 2576 308 1160 156 — [29] Conventional typep(EMA) 344 13.2 58.5 -13.2 775 286 513 78 2,930,000 [38] Full fitp(EMA) 344 12.5 51.0 -12.5 636 293 555 84 2,930,000 [38] Fit for Tg ≥ T ≤ Tc
p(EMA) 335 17.8 65.0 -17.8 1157 270 588 92 — [29] Source data at Tref = 373 Kp(BMA) 305 12.3 56.3 -12.3 694 249 390 67 2,870,000 [38] Full fitp(BMA) 305 11.2 46.4 -11.2 520 259 430 74 2,870,000 [38] Fit for Tg ≥ T ≤ Tc
p(BMA) 300 17.0 97.0 -17.0 1645 203 301 52 — [29] Source data at Tref = 373 K
abbreviation: titanium white (Ti); burnt sienna (BS),
cobalt blue (CB), and cadmium yellow (CY). These
four products were tensile tested in 1991 under am-
bient conditions using a strain rate that was several or-
ders of magnitude slower than the lowest value in this
study. Each of the four points falls in the equilibrium
range that mastercurves from TTS appear to approach
at longer times. Testing at higher temperatures than
30 ◦C and applying TTS may provide similar findings
at long times; however, the melting of surfactant crys-
tals may affect results by plasticising the film.
3.4 Failure Strains
The latex paint films can respond as a brittle glass or
an elastomeric material depending on the combination
of strain rate and temperature imposed during defor-
mation. The brittle-ductile transition is evident in fail-
ure strain data from the tensile experiments, showing a
change of more than two orders of magnitude across the
Tg. The application of TTS is usually restricted to small
strain tensile data; however, Smith [44–47] showed the
method applied to the ultimate properties of rubber
materials. A similar approach was taken in this work,
where failure strain mastercurves were constructed by
shifting the average strain rate, Ra, from the constant
E s [M
Pa]
1/(RoaT) [s]
Latex binder (no pigment), 1y Liquitex burnt umber, 27y Speedball raw umber, 27y Golden raw umber, 1y
BS Ti
CB
10-4 10-2 100 102 104 106 108 100
101
102
103
104
Fig. 6 Secant modulus master curves at 20 ◦C for one-year-old and 27 year-old paint films. Single data points are alsoshown from an evaluation of low strain-rate tensile experi-ments published by Mecklenburg et al [4,17].
speed test. This was was calculated as
Ra =εftf, (20)
where εf and tf are the strain and time at failure re-
spectively. The experimental shift factors in Table 3
(adjusted to Tref = 20 ◦C) were applied in a manner

10 Eric W.S. Hagan et al.
similar to Equation 10 using
log (RaaT ) = log (Ra) + log (aT ) . (21)
The use of Ra gives a slight correction for the strain
rate decrease during the experiment, particularly when
the sample extends to large strains in the rubbery re-
gion. Similar plots were also constructed using Ro and
the differences between the two curves were subtle. The
use of Ro and Ra for the abscissa are illustrated in Fig-
ure 7 for the non-pigmented latex binder material. The
points are shifted slightly apart at high failure strains,
and they converge as failure strains decrease at high
strain rate.
Figure 7 also gives a comparison of failure strain
mastercurves that complement the modulus data in Fig-
ure 5. As a general observation, values of εf lower than
0.01 indicate that the material is highly brittle, while
those above 0.1 indicate that the material is highly ex-
tensible. The area beneath each set of points is the pre-
dicted ‘safe region’ where failure does not occur in the
initially stress-free material if it is subjected to the re-
spective strains and rates of deformation. The horizon-
tal lines highlight several strain values that are within
the typical range of interest for artist paints. Follow-
ing one of the lines of constant strain from left to right
indicates that the binder must reach the strain faster
than any of the pigmented films in order for failure to
occur. The non-pigmented binder is therefore less sen-
sitive to failure, while the acrylic ground is the most
sensitive. The acrylic ground is, however, relatively ex-
tensible under many conditions when compared to a
traditional oil ground. For example, Mecklenburg [6,
7] gives tensile data for 10 to 15 year-old films of lead
white in linseed oil, which fail at a nominal strain of ap-
proximately e=0.05. A broader comparison with similar
data for oil paints would offer valuable perspective on
the differences between traditional and modern artist
paint media.
A similar plot in Figure 8 shows a strong similar-
ity of failure response for films at different ages. This
provides further indication of binder stability with age,
since it is expected that a significant level of deteriora-
tion by cross-linking or chain scission would alter the
shape of the curve, and its location on the time axis.
Unfortunately, a failure curve is not available for the 27
year-old products at an earlier age to verify that a small
change has not occurred in the film behaviour over time.
An ideal experiment on naturally aged films would in-
volve tracking the material response over many years
either with DMA for small strain response, or tensile
testing to failure.
It is also possible to reconstruct failure data to show
the influence of strain rate and temperature on a sin-
Failu
re S
trai
n, ε
f
Strain Rate, Ra aT [s-1]
Latex binder, no pigment Latex binder (using Ro) Golden titanium white Liquitex ground Golden raw umber
ε = 0.02
ε = 0.10 ε = 0.05
ε = 0.01
10-4 10-2 100 102 104 106 108 10-6 10-8
100
101
10-1
10-2
10-3
Fig. 7 Failure strain master curves for the one-year-old paintfilms and non-pigmented latex at 20 ◦C. Additional datapoints are shown for the non-pigmented latex using Ro inplace of Ra for reference.
Failu
re S
trai
n, ε
f
Strain Rate, Ra aT [s-1]
Latex binder (no pigment), 1y Speedball raw umber, 27y Liquitex burnt umber, 27y Golden raw umber, 1y
ε = 0.02
ε = 0.10 ε = 0.05
ε = 0.01
10-4 10-2 100 102 104 106 108 10-6 10-8
100
101
10-1
10-2
10-3
Fig. 8 Failure strain master curves for the one-year-old and27 year-old paint films at 20 ◦C.
gle isometric plot. As an example of this approach, a
polynomial curve was fit through the Liquitex ground
failure points in Figure 7. Values were then interpolated
at three selected values of εf (0.005, 0.01, and 0.05), and
the shift factors were used to adjust to different temper-
atures. The results from this series of calculations are
presented in Figure 9, showing three isometric curves
with combinations of strain rate and temperature that
predict failure for the ground material. Following a ver-
tical line at a fixed temperature highlights the increased
strain rate that is required for the material to fail at
the lower strain values. Conversely, a horizontal path
with increasing temperature shows the increasing fail-
ure strain at a fixed strain rate. This form of plot may
be useful for predicting safe regions for paintings; how-
ever, complicating factors such as stresses arising from
different thermal expansion coefficients of layered ma-

The effects of strain rate and temperature on commercial acrylic artist paints aged one year to decades 11
-10 0 10 20 30
Ra a
T [
s-1 ]
Temperature [˚C]
εf = 0.01
εf = 0.05
ε f = 0.005
10-8
10-6
10-4
10-2
100
102
104
Fig. 9 Isometric plot of failure strains as a function of strainrate and temperature for the Liquitex acrylic ground.
terials, and the unknown strain history of the painting
are important considerations.
3.5 Effect of Relative Humidity
The results presented in Figures 5-8 are strictly for sam-
ples equilibrated at 50 % RH since it is a common tar-
get for museums and galleries. The influence of varying
levels of relative humidity is a fundamental concern for
paintings preservation and deserves further attention.
In an investigation with DMA, Ormsby et al [16] high-
lighted the effect of RH on the tan(δ) peak and modulus
of artists’ acrylic paints at constant frequency. The in-
fluence of RH on tensile properties was also studied by
Erlebacheret al [3] using a single strain rate.
Figure 10 shows a sorption isotherm for the non-
pigmented acrylic latex in the current study, and a
similar curve for the Golden titanium white film with
moisture content calculated for the binder phase. This
change of moisture content with RH has an effect on
the stress relaxation response of an acrylic paint film,
which made it necessary to equilibrate moisture content
and control RH during tensile experiments. A detailed
investigation of moisture content effects was beyond
the scope of this work; however, preliminary results are
given in Figure 11 showing partial mastercurves that
were constructed for the latex binder conditioned to
5 % RH without pigment and with 38 % TiO2 by vol-
ume. The loss of moisture appears to increase the Tg
of the binder as the curve shifts to the right on the
time axis for the non-pigmented film. The application
of time-moisture superposition [48,49] may add further
value to this type of data for artist paint media, which
0
1
2
3
4
5
6
7
0 20 40 60 80 100
Moi
stur
e C
onte
nt [%
]
Relative Humidity [%]
Latex binder, adsorption
Golden TiO2, adsorption
Golden TiO2, desorption
Fig. 10 Sorption isotherms at 23 ◦C for the non-pigmentedlatex binder, and the organic phase of the Golden titaniumwhite paint.
E s [M
Pa]
1/(RoaT) [s]
Latex binder (no pigment), 50%RH Latex binder (no pigment), 5%RH Latex binder (38%TiO2), 50%RH Latex binder (38%TiO2), 5%RH"
10-4 10-2 100 102 104 106 108 100
101
102
103
104
Fig. 11 Secant modulus at 20 ◦C for the latex binder with0 % and 38 % TiO2 conditioned at two relative humidity lev-els.
is an area for further investigation. This may prove dif-
ficult, however, if changes in moisture content alter the
equilibrium modulus. As an example, the curves for the
pigmented film appear to differ by more than a simple
shift along the time axis.
4 Conclusions
The mechanical behaviour of artists acrylic paints was
measured over a broad range of strain rate and tem-
perature to the point of failure. Time-temperature su-
perposition was applied to secant modulus and failure
strains for each of the six test films, and the WLF/VF

12 Eric W.S. Hagan et al.
and Arrhenius equations were fit to experimental val-
ues of log(aT). The Arrhenius equation gave activation
energy in the range of 221 to 264 kJ/mol below Tg.
Considerable variation was observed in the WLF/VF
parameters, which is possibly a result of the small num-
ber of data points or differences in paint formulation.
Fits with the constraint of Cg2 = 50 K showed less varia-
tion and closer correlation of parameters with published
data for acrylic polymers. The modulus master curves
each showed a similar point of inflection on the time
axis, and the effect of inorganic particles was an overall
increase of Es at all times. There was a high degree of
similarity between the one-year and 27 year-old films
present in modulus data. Subtle differences were likely
due to variations in pigment concentration and particle
geometry. The identification of small changes over time
would require monitoring a single film over many years
with a similar test method.
The construction of εf master curves by TTS pro-
vided a method for predicting failure as a function of
strain rate and temperature, when the rate of defor-
mation does not vary significantly during extension.
Failure strains transitioned from very small (εf<0.01)
in the glassy region to very large (εf>1) in the rub-
bery regime. This is characteristic of the brittle-ductile
transition of an amorphous polymer across the glass
transition. The Liquitex ground was suspected to have
the highest volume fraction of inorganic material, and
particles with low aspect ratio (talc and kaolin). This
material showed the lowest failure strains of the exam-
ined films; however, it remained highly extensible un-
der many conditions when compared to a traditional
oil ground. Mecklenburg [6,7] gives tensile data for a
lead white oil ground showing a nominal strain to fail-
ure of 0.05 at an age of 10 to 15 years. The failure
response of the 27 year-old acrylic paint films was also
very similar to one-year-old products, which was consis-
tent with findings reported for secant modulus and the
shift factors. Finally, an approach for interpreting fail-
ure strain data was presented using an isometric graph
of strain rate versus temperature. This may provide a
useful method for presenting failure data for viscoelas-
tic artist paint media in future work.
Acknowledgements The authors sincerely thank Tate, theDeborah Loeb Brice foundation and the Natural Sciences andEngineering Research Council of Canada (NSERC) for spon-soring this project. We also greatly appreciate the sharing ofsamples and data files by Marion Mecklenburg at the Smith-sonian Institution.
References
1. M.F. Mecklenburg, C.S. Tumosa, in Art in transit: Stud-ies in the transport of paintings, ed. by M.F. Mecklenburg(National Gallery of Art, Washington, 1991), pp. 137–171
2. M.F. Mecklenburg, C.S. Tumosa, in Art in Transit: Stud-ies in the Transport of Paintings, ed. by M.F. Mecklen-burg (National Gallery of Art, Washington, 1991), pp.173–216
3. J.D. Erlebacher, E. Brown, M.F. Mecklenburg, C.S. Tu-mosa, in Materials Research Society Symposium Pro-ceedings, vol. 267, ed. by P.B. Vandiver, J.R. Druzik,G.S. Wheeler, I.C. Freestone (Materials Research Soci-ety, Pittsburgh, 1992), vol. 267, pp. 359–370
4. M.F. Mecklenburg, C.S. Tumosa, J.D. Erlebacher, Poly-mer Preprints 35(2), 297 (1994)
5. M.F. Mecklenburg, C.S. Tumosa, ASHRAE journal41(4), 77 (1999)
6. M.F. Mecklenburg, in Preprints of the InternationalConference on Painting Conservation: Canvases - Be-haviour, Deterioration and Treatment, ed. by M.C.Ahusti, M. Martin Rey, V. Guerola Blay (UniversitatPolitecnica de Valencia, 2005), pp. 119–155
7. M.F. Mecklenburg, C.S. Tumosa, D. Erhardt, in Materi-als Research Society Symposium: Materials Issues in Artand Archaeology VII, vol. 852, ed. by P.B. Vandiver, J.L.Mass, A. Murray (Materials Research Society, Warren-dale, 2005), vol. 852, pp. 13–24
8. S. Tantideeravit, M.N. Charalambides, D.S. Balint,C.R.T. Young, Engineering Fracture Mechanics 112, 41(2013)
9. M.F. Mecklenburg, Art in Transit: Studies in the Trans-port of Paintings (National Gallery of Art, Washington,1991)
10. S. Michalski, in Art in Transit: Studies in the Transportof Paintings, ed. by M.F. Mecklenburg (National Galleryof Art, Washington, 1991), pp. 223–248
11. S. Michalski, D. Daly Hartin, in Preprints of the ICOMCommittee for Conservation, 11th Triennial Meeting, ed.by J. Bridgland (James and James Ltd., London, 1996),pp. 288–296
12. D. Daly Hartin, E.W.S. Hagan, S. Michalski, M. Cho-quette, in Preprints of the ICOM Committee for Con-servation, 16th Triennial Meeting, ed. by J. Bridgland(Criterio, Almada, Portugal, 2011), pp. 1–9
13. E.W.S. Hagan, M.N. Charalambides, C.R.T. Young,T.J.S. Learner, S. Hackney, Mechanics of Time-Dependent Materials 13(2), 149 (2009)
14. E.W.S. Hagan, M.N. Charalambides, C.R.T. Young,T.J.S. Learner, S. Hackney, Progress in Organic Coat-ings 69(1), 73 (2010)
15. E.W.S. Hagan, M.N. Charalambides, C.R.T. Young,T.J.S. Learner, S. Hackney, Polymer 52(7), 1662 (2011)
16. B. Ormsby, G. Foster, T. Learner, S. Ritchie,M. Schilling, Journal of Thermal Analysis and Calorime-try 90(2), 503 (2007)
17. M.F. Mecklenburg. Personal communication. Smithso-nian Institution (2006)
18. M.C. Celina, Polymer Degradation and Stability 98(12),2419 (2013)
19. T. Learner, O. Chiantore, D. Scalarone, in Preprints ofthe ICOM Committee for Conservation, 13th TriennialMeeting, vol. II, ed. by R. Vontobel (James and JamesLtd., London, 2002), vol. II, pp. 911–919
20. O. Chiantore, M. Lazzari, Polymer 42(1), 17 (2001)

The effects of strain rate and temperature on commercial acrylic artist paints aged one year to decades 13
21. D. Scalarone, O. Chiantore, T. Learner, in Preprints ofthe ICOM Committee for Conservation, 14th TriennialMeeting, vol. I, ed. by I. Verger (James and James Ltd.,London, 2005), vol. I, pp. 350–357
22. G.D. Smith, in Modern Paints Uncovered, ed. by T.J.S.Learner, P. Smithen, J.W. Krueger, M.R. Schilling (GettyConservation Institute, Los Angeles, 2008), pp. 236–246
23. J.L. Keddie, Materials Science and Engineering: R Re-ports 21(3), 101 (1997)
24. P.A. Steward, J. Hearn, M.C. Wilkinson, Advances inColloid and Interface Science 86(3), 195 (2000)
25. E. Kientz, Y. Holl, Colloids and Surfaces a Physicochem-ical and Engineering Aspects 78(15), 255 (1993)
26. A. Tzitzinou, P.M. Jenneson, A.S. Clough, J.L. Keddie,J.R. Lu, P. Zhdan, K.E. Treacher, R. Satguru, Progressin Organic Coatings 35(1-4) (1999)
27. A.C. Hellgren, P. Weissenborn, K. Holmberg, Progress inOrganic Coatings 35(1-4), 79 (1999)
28. L.R.G. Treloar, The Physics of Rubber Elasticity, 3rdedn. (Oxford University Press, Oxford, 1975)
29. J.D. Ferry, Viscoelastic Properties of Polymers, 3rd edn.(Wiley, New York, 1980)
30. N.W. Tschoegl, Mechanics of Time-Dependent Materials1, 3 (1997)
31. M.L. Williams, R.F. Landel, J.D. Ferry, Journal of theAmerican Chemical Society 77(14), 3701 (1955)
32. G.P. Tandon, G.J. Weng, Polymer Composites 5(4), 327(1984)
33. B.E. Clements, E.M. Mas, Journal of Applied Physics90(11), 5522 (2001)
34. E.M. Mas, B.E. Clements, Journal of Applied Physics90(11), 5535 (2001)
35. L. Struik, Polymer Engineering and Science 17(3), 165(1977)
36. Q. Qin, G.B. McKenna, Journal of Non-Crystalline Solids352(28-29), 2977 (2006)
37. L. Dadug, Journal of Physics: Condensed Matter 12(46),9573 (2000)
38. X. He, J. Wu, G. Huang, X. Wang, Journal of Macro-molecular Science, Part B: Physics 50(1), 188 (2011)
39. O. Chiantore, D. Scalarone, T. Learner, InternationalJournal of Polymer Analysis and Characterization 8(1),67 (2003)
40. L. Andreozzi, V. Castelvetro, M. Faetti, M. Giordano,F. Zulli, Macromolecules 39(5), 1880 (2006)
41. L. Andreozzi, C. Autiero, M. Faetti, M. Giordano,F. Zulli, Journal of Physics: Condensed Matter 18(28),6481 (2006)
42. B.A. Ormsby, E. Hagan, P. Smithen, T.J.S. Learner, inPreparation for Painting: The Artist’s Choice and itsConsequences, ed. by J. Townsend, T. Doherty, G. Hey-denreich, J. Ridge (Archetype, London, 2008), pp. 163–171
43. C.R.T. Young, E. Hagan, in Preparation for Paint-ing: The Artist’s Choice and its Consequences, ed. byJ. Townsend, T. Doherty, G. Heydenreich, J. Ridge(Archetype, London, 2008), pp. 172–179
44. T.L. Smith, P.J. Stedry, Journal of Applied Physics31(11), 1892 (1960)
45. T.L. Smith, ASTM Materials Science, Series 3, 60 (1962)46. T.L. Smith, Journal of Polymer Science Part A: General
Papers 1(12), 3597 (1963)47. T.L. Smith, R.A. Dickie, Rubber Chemistry and Tech-
nology 42(5), 1257 (1969)48. H.F. Brinson, L.C. Brinson, Polymer engineering science
and viscoelasticity: an introduction (Springer, 2007)49. R.D. Maksimov, V.P. Mochalov, Y.S. Urzhumtsev, Me-
chanics of Composite Materials 8(5), 1573 (1972)