the dynamic interplay of inequality and trust - an
TRANSCRIPT

The Dynamic Interplay of Inequality and Trust
- An Experimental Study∗
Ben Greiner†, Axel Ockenfels‡, and Peter Werner§
Abstract
We study the interplay of inequality and trust in a dynamic growth
game, in which trust increases efficiency and thus allows higher growth
of the laboratory economy in the future. We find that trust is initially
high in a treatment starting with equal endowments, but decreases over
time. In a treatment with unequal endowments, trust is initially lower
yet remains relatively stable. The reason is that, with unequal initial
endowments, trust depends less on wealth comparisons. As a result,
with respect to efficiency, the initially more unequal economy grows
slower in the short run but faster in the long run, and the disparity of
wealth distributions across economies mitigates over time.
Keywords: inequality, trust, growth, laboratory experiments
JEL Classification: C73, C92, D63, E25, O15
∗Financial support from the German Science Foundation (DFG) is gratefully acknowl-edged. We thank Henrik Jordahl, David Laibson and participants at seminars in Cologne,Gottingen, Harvard, workshops in Copenhagen and Lille, and the 2008 joint DFG-NSFconference in NYC for valuable comments and suggestions.
†Corresponding author: University of New South Wales, School of Economics, UNSWSydney, NSW 2052, Australia, Tel: +61 2 9385 9701, Fax: +61 2 9313 6337, e-mail:bgreiner at unsw.edu.au.
‡University of Cologne, Department of Economics, Albertus-Magnus-Platz, D-50923 Koln, Germany. Tel.: +49/221/470-5761, Fax: +49/221/470-5068, e-mail:ockenfels at uni-koeln.de.
§University of Cologne, Department of Economics, Albertus-Magnus-Platz, D-50923 Koln, Germany. Tel.: +49/221/470-4354, Fax: +49/221/470-5068, e-mail:peter.werner at uni-koeln.de.

I Introduction
The degree of trust in an economy may positively influence economic growth
and the distribution of wealth. Yet trust is difficult to identify and mea-
sure in the field, both on the microeconomic and the macroeconomic level.
Survey data frequently discover individual attitudes towards trust, but can-
not easily identify to what extent such self-reported attitudes reflect actual
economic behavior, and how trust evolves in a dynamic environment. Fur-
thermore, as has been argued by Durlauf (2002), the causal relationship be-
tween trust and economic variables is often ambiguous. He thus advocates
the use of laboratory studies. In this paper we follow Durlauf’s advice and
complement the empirical and survey literature with laboratory experiments
that systematically investigate the dynamic interplay of trust, efficiency and
distribution.
The working horse of our experiment is a growth game, which embeds a
variant of the trust game introduced by Berg, Dickhaut and McCabe (1995)
into a dynamic context. In this game, an investor can send an amount
of money to an anonymous trustee. Before received by the trustee, the
amount sent is multiplied by a factor greater than one, and thus yields effi-
ciency gains. Subsequently, the trustee decides on how much of the amount
received she wishes to send back to the investor. The amount sent can be
interpreted as a measure of trust, while the amount returned measures the
degree of trustworthiness.1 However, in our game, income from interactions
is cumulated over time. Participants start with either an unequal or equal
distribution of initial endowments within a group. In each of several rounds
they play the trust game with a randomly matched anonymous partner.
Before making decisions, both transaction partners are informed about the
current wealth of their opponent. Round payoffs are added to endowments,
and therefore determine the amount that can be exchanged in future rounds.
That is, investments and repayments (i.e. trust and trustworthiness) jointly
1Berg et al. (1995)’s original game is sometimes called ‘investment game’, and theamount sent is interpreted as a measure for investment in risky projects. In our setting,that interpretation fits as well.
2

affect the current and potential future growth rates of the ‘laboratory econ-
omy’, as well as the evolution of economic inequality.2
We observe that initial investment levels are lower in the treatment start-
ing with unequal endowments (IEQ) compared to the treatment with equal
endowments (EQ). However, in IEQ trust depends less on wealth compar-
isons. Part of the reason is that the source of inequality plays a role in what
can be inferred from wealth comparisons: while in EQ all wealth differences
must be due to differences in trust and trustworthiness across subjects, in
IEQ differences in behavior are concealed by differences in the initial wealth
allocation. As a result, trust is triggered differently across treatments. In-
vestment rates decrease steadily and strongly over time in EQ, yet they
remain rather stable in IEQ. The wealth distributions in equal and unequal
economies converge to each other.
In Section II we review the literature related to our experiment. Sec-
tion III explains the details of our experimental design and procedures, and
sketches hypotheses based on previous empirical results and economic mod-
els. Our experimental data and statistical analysis are presented in Sec-
tion IV. We discuss our results and conclude in Section V.
II Related Literature
There is a large body of empirical and theoretical economic literature on the
relationship between inequality with a country and its level of growth and
prosperity. The evidence is, however, not unambiguous.3 Some authors have
2E.g., if all investments yield the same positive rate of return, the dynamic game allowsinitially rich subjects to increase their endowments much more than initially poor subjects.
3The academic discussion started in the 1950s with the Kuznets-Curve (Kuznets, 1955),which proposed a relation between inequality and economic development in the form of aninverted U. Most of the more recent theoretical literature assumes a negative relationship,including the models of Galor and Zeira (1993) and Persson and Tabellini (1994). Benabou(1996), Ros (2000) and Glaeser (2005) survey the differing strains of literature. Themajority of early empirical studies of the relationship of inequality and trust find a negativelink between income disparity and growth (see Benabou, 1996). However, some of the morerecent studies, employing panel data and advanced econometrics, yield either no effect (e.g.Barro, 2000) or even a positive relationship (e.g. Castello-Climent, 2004; Forbes, 2000).Banerjee and Duflo (2003) argue that non-linearity of the relationship might be a reasonfor the ambiguous results. They find that any change in inequality – in each direction –
3

argued that trust is the key for understanding this relationship: Inequality
decreases the level of trust and trustworthiness in an economy, which in
turn negatively affects growth.4 Empirical evidence is provided by Knack
and Keefer (1997) and Zak and Knack (2001), who found that countries
with higher income dispersion (measured by the Gini coefficient for income)
exhibit significantly lower values for a trust measure derived from the World
Value Surveys (WVS).5 Similarly, Alesina and Ferrara (2002) found a neg-
ative connection between social distance and trusting behavior in a study
restricted to the United States. Gustavsson and Jordahl (2008) combine
Swedish individual panel data with aggregate data on inequality and find
that stronger disparities among people in the bottom half of the income
distribution have a detrimental effect on trust. Furthermore, a number of
empirical studies established a positive impact of generalized trust on eco-
nomic development (Knack and Keefer, 1997; La Porta, Lopez-de-Silanes,
Shleifer and Vishny, 1997; Zak and Knack, 2001).
Durlauf (2002), however, notes that there are various problems of causal-
ity and identification in many empirical studies on the relationship between
social capital, trust and economic indices. He thus proposes the use of
laboratory experiments to investigate the causal structure between these
measures. Results from such economic experiments allow to build models
of individual behavior to explain the relationship between social capital and
economic measures on the aggregate (see, for example, the model by Glaeser,
Laibson and Sacerdote, 2002).
affects growth detrimentally. In their meta-analysis of empirical studies, De Dominicis,Florax and De Groot (2008) show that estimation techniques, included independents,development status of countries, and length of considered growth period have a significantimpact on the estimated size and direction of the effect of inequality on growth.
4See Jordahl (2008) for an overview of different mechanisms explaining the negativeimpact of inequality on generalized trust. Other authors see other forms of human capital,such as education (e.g. Castello-Climent, 2004), or social preferences as possible links.Corneo and Gruner (2000) and Corneo and Jeanne (2001) discuss concerns for socialstatus, as these might discourage both poor and rich subjects to accumulate income in anunequal society and lower the political will for redistribution.
5The World Values Surveys are repeated interview studies with representative popu-lation samples on the changes in moral values and beliefs, conducted in 80 countries allover the world since 1981. One question is: “Generally speaking, would you say that mostpeople can be trusted or that you can‘t be too careful in dealing with people?”. Thepercentage of positive responses is used as a measure of generalized trust in a country.
4

There is experimental evidence on the relationship between cooperation
and inequality in public goods games, which share a couple of features with
the trust game studied here. This evidence is, however, mixed. In a sur-
vey on repeated public goods games with complete information, Ledyard
(1995) comes to the conclusion that economic heterogeneity among subjects
generally lowers cooperation levels. Chan, Mestelman, Moir and Muller
(1996) find that poor subjects contribute more to a public good than rich
subjects. Buckley and Croson (2006) conduct a linear public good game
with heterogenous endowments of the subjects. In their study, rich and
poor subjects contribute on average the same absolute amount to a public
good. Thus, as poor subjects contribute a higher share of their respective
endowments, economic inequality increases within the experimental groups.
Other studies are devoted to the relationship between social distance
(measured on various scales) and investment behavior in the trust game in-
troduced by Berg et al. (1995). Glaeser, Laibson, Scheinkman and Soutter
(2000) combine questionnaires on social backgrounds and trust attitudes
with an experimental trust game. In their experiment, subjects interact-
ing face-to-face with a partner of a different race or nationality exhibit a
lower level of trustworthiness. In addition, a higher social status of the
sender seems to be positively related to the earnings of a trusting decision.
Hence, the results of this study indicate detrimental effects of social distance.
However, their survey measures of generalized trust are not correlated with
actual trusting behavior.
Fershtman and Gneezy (2001) find significantly different degrees of trust
towards different ethnical groups in the Israeli-Jewish society, although these
groups do not differ concerning their trustworthiness. In a recent study,
Haile, Sadrieh and Verbon (2006) conduct a trust game experiment with
South-African students. They find negative effects of socio-economic differ-
ences, as low-income subjects trust less when confronted with a high-income
transaction partner from another ethnic group.
To our knowledge, there are only two experiments which specifically
study the role of payoff inequality in the trust game. Contrary to the stud-
ies discussed above, social distance is induced by the experimental design.
5
Brulhart and Usunier (2007) vary endowments of the trustees, which how-
ever does not affect trust. Anderson, Mellor and Milyo (2006) employ an
equal as well as a symmetric and a skewed unequal distribution of show-up
fees in a trust game. The distribution of show-ups is either private or public
information. The authors observe only small and non-systematic effects of
unequal endowments on trusting behavior.
III Experimental design and hypotheses
In our study, we focus on the dynamic interaction of trust, trustworthiness
and inequality. Therefore, we develop a growth game which embeds the
essentials of Berg et al. (1995)’s trust game, but puts them into a dynamic
growth and distribution context. The growth game is played over 20 rounds.
In each round, two randomly and anonymously matched subjects play a
variant of the trust game. One of the subjects is randomly assigned the role
of the investor, the other the role of a trustee. Before decisions are made,
each subject is informed about his own and the opponent’s wealth in the
current round. Wealth is defined as the initial endowment plus any payoffs
that have been accumulated in earlier rounds. A player’s wealth limits the
amounts that he can invest or return in the current round of the growth
game in the following way. The investor decides on an amount S, which
is not allowed to exceed his current wealth, to be sent to the trustee. Any
amount sent is multiplied by the factor 1.2, i.e. the trustee receives 1.2S.
Next, the trustee can decide on the amount R to be sent back to the investor.
The minimum amount to be returned is 0.9S, or 90% of the amount sent.6
The upper limit is given by the sum of the current wealth of the trustee
plus the received amount. Because payoffs are accumulated over the course
of the repeated trust game, our laboratory economies could maximally grow
by an expected factor of 6.2.7
6These rules make the one-round interaction in our game equivalent to the originaltrust game interaction with a sent amount multiplier of three, with the exception thatthe amount that can be sent is restricted to 10% of the investor’s wealth. Without suchrestrictions, the experiment could have gone beyond the scope of any reasonable financialbudget.
7As in each round only half of the subjects in the economy are randomly assignedto the role of the investor, the expected maximum growth rate over 20 rounds with full
6

As our main experimental parameter, we varied the distribution of the
initial endowments across our two treatments. In the equality condition
(EQ), all subjects were endowed with an amount of 500 ET (Experiment
Talers) before the first round. In the inequality treatment (IEQ), half of the
subjects in each matching group received 200 ET, and the other half received
800 ET. In order to investigate experience effects and to test robustness of
behavior, we played two runs of 20 rounds; that is, after the first 20 rounds
of the experiment we restarted the game for another 20 rounds. Subjects
were told before the session that the experiment consisted of several runs,
one of which would be randomly selected for payoff.
The experimental sessions took place in the Cologne Laboratory for Eco-
nomic Research. We conducted four sessions, two for each of our treatments.
Subjects were recruited using the Online Recruitment System by Greiner
(2004). Altogether 128 student subjects participated. Each session con-
sisted of 32 participants. Random matching per round was restricted to
groups of 8 participants.8 It was publicly known that two subjects would
never interact with each other in consecutive rounds. Due to this procedure,
we obtained observations on 8 statistically independent ‘economies’ for each
treatment. Overall, we collected 2,560 choices for each player role.
The experiment was computerized using the zTree software (Fischbacher,
2007). After subjects arrived and were randomly assigned to a cubicle, in-
structions were distributed.9 Questions were answered privately. At the end
of the experiment subjects filled in a post-experimental questionnaire ask-
ing for demographical data and containing open questions for motivations
of subjects’ decisions. Finally, either run 1 or run 2 was selected for payoff
by publicly rolling a die. Participants were paid out privately and left the
laboratory. The exchange rate was fixed at 150 ET = 1 Euro. The average
payoff was 12.25 Euros (including a show-up fee of 2.50 Euros) with a stan-
dard deviation of 5.09 Euros. Each session lasted approximately one and a
half hours.
investments corresponds to 1.210.8Subjects were not informed that the matching procedure was restricted in such a way,
conveying the impression that being matched with the same opponent more than once isvery unlikely.
9Instructions are included in the appendix.
7

In the rest of this chapter, we will motivate a number of competing
hypotheses for the dynamic interplay of inequality and trust based on (sim-
plified) theoretical reasoning and empirical findings. These hypotheses help
organizing our analyses and findings. At the same time, however, we wish
to caution that our experiment is mainly designed to complement the em-
pirical studies, and not as a test of any particular theory - if only because
there is no theory yet that addresses the potentially complex dynamics we
are interested in.
The standard game theoretic prediction is trivial. Because of the finite-
ness of the growth game, there is no trust and no trustworthiness among
selfish and rational players if selfishness and rationality are common knowl-
edge. However, starting with Berg et al. (1995), numerous experiments have
shown that subjects are willing to invest and return non-trivial amounts of
money in the trust game. For a survey of the trust game literature see, for
example, Camerer (2003).
While the experimental one-shot version of the trust game is by now well-
analyzed and -understood, the dynamic interplay of inequality and trust in
the context of our growth game is not easily predicted. However, observe
that both of our treatments start with identical average endowments. If
inequality does not affect subjects’ willingness to send and return money,
relative to their endowments, the two treatments may be expected to yield
equivalent results with respect to growth rates.10 On the other hand, the
empirical and experimental literature on social and economic heterogeneity
cited in Section II suggests that we may observe a negative impact of in-
equality on trust in our setting. Dispersion of wealth could increase social
distance between economic agents and, as a result, trust and trustworthiness
may decrease. To the extent our experiment captures some of the under-
lying mechanisms assumed in this literature, we should expect less growth
and lower efficiency in treatment IEQ.
10In the beginning of the first round, the average endowment of investors in treatmentEQ is equal to 500, as it is in treatment IEQ. Thus, if the same share is sent and returned,expected overall invested amounts are the same, as well as the amounts returned. There-fore, the expected endowments of investors in round 2 are the same in both treatments.The same reasoning applies to all consecutive rounds of the game.
8
Finally, we note that theories of social preferences can organize some
of the deviations from standard equilibrium behavior observed in the trust
game. For instance, inequity aversion models (Bolton and Ockenfels, 2000;
Fehr and Schmidt, 1999) can in principle explain both trust and trustworthi-
ness in the trust game.11 However, these models do not yield unambiguous
comparative static predictions across the two treatments of our growth game.
To see why, observe for instance that a rather fair-minded investor who is
matched with a relatively poor trustee may send money to equalize payoffs,
while a rather selfish investor may not send money because he cannot expect
to get anything back from a relatively poor opponent. Thus, the predictions
of inequity aversion models will depend on the distribution of preferences.
It appears, though, that ‘myopic’, straightforward concerns for equal payoffs
lead to more trust and trustworthiness in IEQ in the following sense: Even
when an inequality averse subject assumes that everybody else behaves in
a completely selfish manner, he still has reason to trust and to be trustwor-
thy towards relatively poor opponents in the inequality treatment (where,
in the beginning of round 1, the payoff distribution is unfair), but no such
incentive exists in the equality treatment (where the payoff distribution is
fair if everybody behaves selfishly).
IV Experimental Results
IV.1 Aggregate Data
Figures 1 and 2 depict the evolution of average send and return rates over
time. We define the ‘send rate’ in a particular round as the share of the in-
vestor’s wealth in this round that she invests in the transaction. The ‘return
rate’ is defined as the amount returned minus the mandatory 90% (R−0.9S),
divided by the amount received minus the mandatory 90% (1.2S − 0.9S).
For example, a return rate of 1/3 implies that the trustee returns exactly
the amount invested by the investor. (The dashed horizontal line in Figure 2
indicates this ‘break-even line’.) For figures and non-parametrical tests the
11See Bolton and Ockenfels (2000), page 187, for a detailed description of the mechanicsof the fairness models in the context of Berg et al. (1995)’s trust game.
9

FIGURE 1
Average Send Rates over Rounds
send rate averages are calculated by adding up all amounts sent in a match-
ing group, and dividing the sum by the total wealth of the senders.12
Figure 1 shows that the dynamics of trust differ markedly between the
treatments. In the first round of the games, the equal distribution of wealth
leads to higher trust levels (54% more, to be exact) than the unequal distri-
bution. This finding is in line with previous empirical findings and theoret-
ical work suggesting that inequality hampers efficiency.13
However, send rates in treatment EQ strongly and steadily decrease over
time from 68% in round 1 to 20% in round 20 in run 1, and from 77% to
15% in run 2, while send rates in IEQ increase slightly in run 1 and decrease
slightly in run 2. Correspondingly, in EQ average send rates of the matching
12This procedure seems appropriate since here our focus is on aggregate behavior andindependent observations. However, our conclusions from statistical tests would not bedifferent if we had used individual averages.
13Applying one-sided Mann-Whitney-U (MWU) tests to (statistically independent) in-dividual send rates and to respective matching group data in round 1, all tests yieldp-values of p < .1. The reason significance is rather low is the heterogeneity of subjectsin treatment IEQ. More specifically, poor IEQ subjects send less in absolute terms thanEQ subjects (p < .01), but not in relative terms, while rich subjects send less in relativeterms (p < .05), but not in absolute terms. However, our analysis of individual behaviorin the next subsection, where we control for these wealth effects, confirms the observationthat initial inequality hampers efficiency on any standard significance level.
10

FIGURE 2
Average Return Rates over Rounds
groups are significantly and negatively correlated to the number of rounds
(Pearson-R=-.586, p = .000 and Pearson-R=-.394, p = .000 for run 1 and
2, respectively) while this is not (strongly) so in IEQ (Pearson-R=.061,
p = .442 and Pearson-R=-.154, p = .051 for run 1 and 2, respectively).14
As shown in Figure 2, average return rates are about the break-even
level that makes an investment profitable, with probably a small advantage
for IEQ in run 1. In fact, differences in return rates across treatments and
over time are much less pronounced than differences in send rates. In the
aggregate data, we find that, in the first run, average return rates are 24%
lower in treatment EQ than in treatment IEQ15 - yet the effect disappears
in run 2.
More investment directly expands overall wealth, because the latter is a
cumulative measure of the former. So, the different dynamics in trust across
laboratory economies are reflected in different growth rates of overall wealth.
Figure 3 depicts average economy wealth over time. There are substantial
14Applying Wilcoxon Matched Pairs Signed Ranks (WMPSR) tests, a similar conclusionis reached when comparing matching group averages in the first and the second half ofeach run.
15A one-sided MWU test applied to independent matching group averages indicatessignificance with p = .011.
11
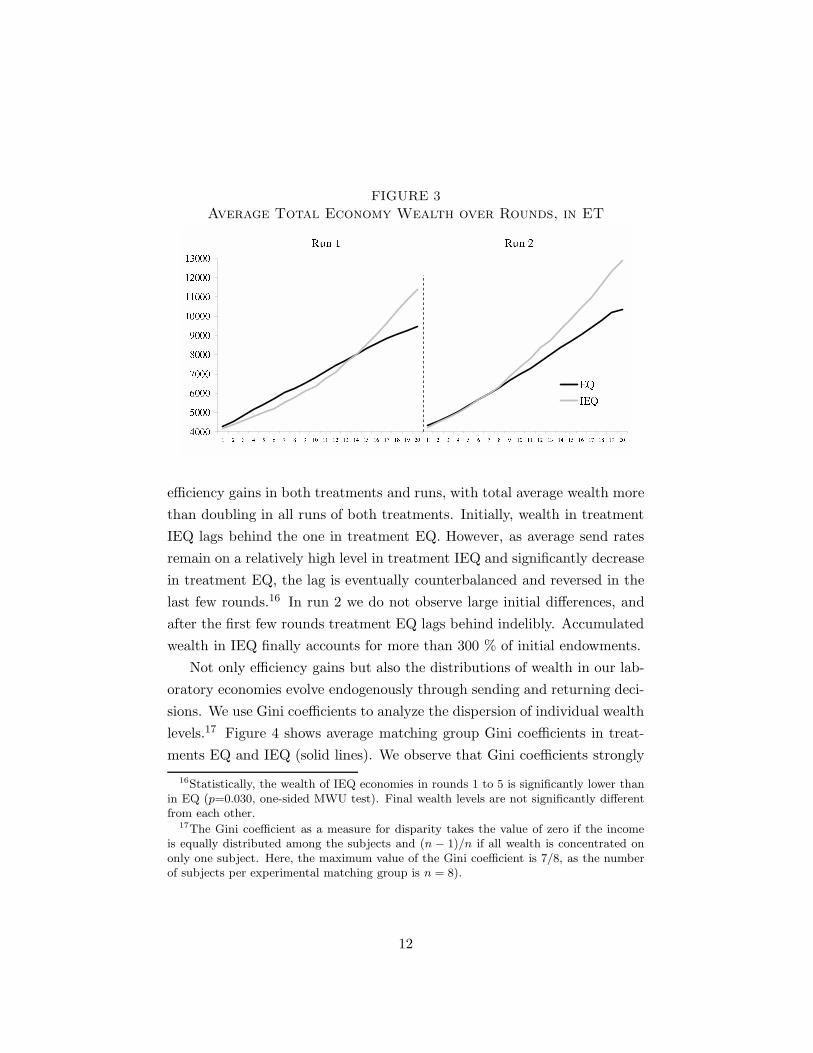
FIGURE 3
Average Total Economy Wealth over Rounds, in ET
efficiency gains in both treatments and runs, with total average wealth more
than doubling in all runs of both treatments. Initially, wealth in treatment
IEQ lags behind the one in treatment EQ. However, as average send rates
remain on a relatively high level in treatment IEQ and significantly decrease
in treatment EQ, the lag is eventually counterbalanced and reversed in the
last few rounds.16 In run 2 we do not observe large initial differences, and
after the first few rounds treatment EQ lags behind indelibly. Accumulated
wealth in IEQ finally accounts for more than 300 % of initial endowments.
Not only efficiency gains but also the distributions of wealth in our lab-
oratory economies evolve endogenously through sending and returning deci-
sions. We use Gini coefficients to analyze the dispersion of individual wealth
levels.17 Figure 4 shows average matching group Gini coefficients in treat-
ments EQ and IEQ (solid lines). We observe that Gini coefficients strongly
16Statistically, the wealth of IEQ economies in rounds 1 to 5 is significantly lower thanin EQ (p=0.030, one-sided MWU test). Final wealth levels are not significantly differentfrom each other.
17The Gini coefficient as a measure for disparity takes the value of zero if the incomeis equally distributed among the subjects and (n − 1)/n if all wealth is concentrated ononly one subject. Here, the maximum value of the Gini coefficient is 7/8, as the numberof subjects per experimental matching group is n = 8).
12

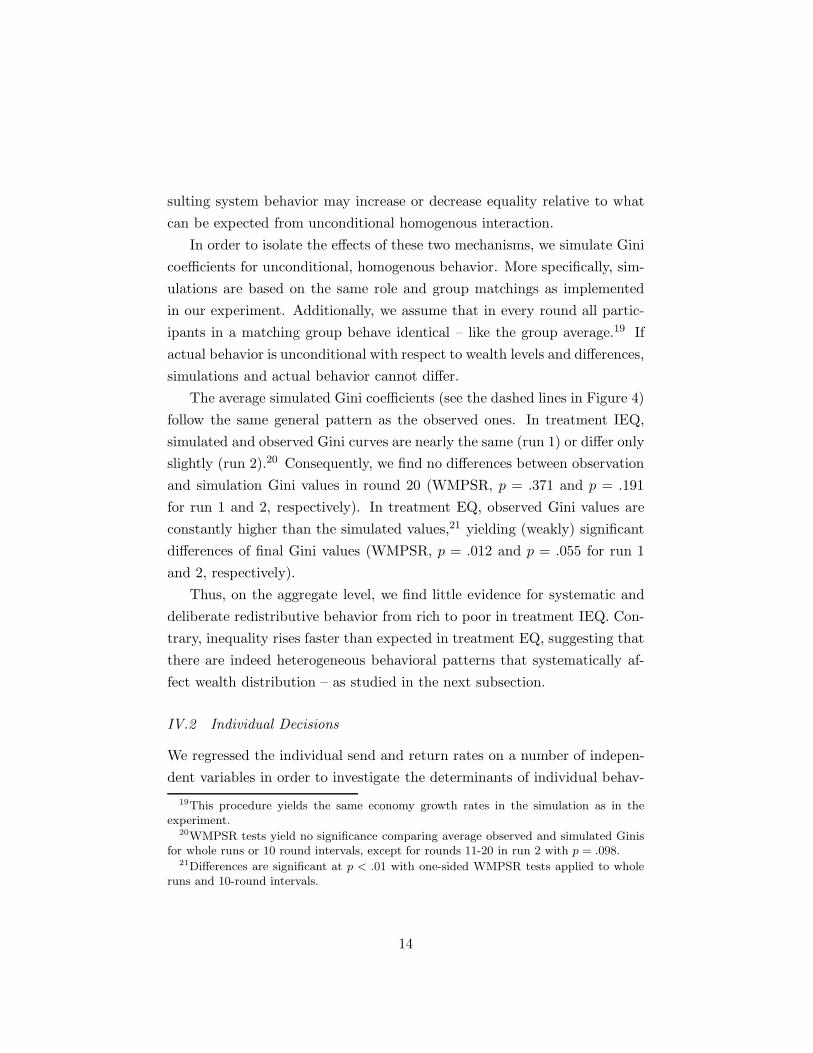
FIGURE 4
Observed and Simulated Gini Coefficients over Rounds
Note: Solid lines refer to observed, dashed lines to simulated values.
and significantly decrease (increase) in treatment IEQ (EQ).18 Furthermore,
the values for the Gini coefficients tend to converge to each other towards
the end of a run. In the last round of a run, IEQ and EQ Ginis are not or
only weakly significantly different (MWU, p = .252 and p = .053 for run 1
and 2, respectively).
Redistribution in our setting might have two different sources: on the
one hand, it could be the result of random, homogenous interaction, in the
sense that rates are not conditioned on individual wealth states or wealth
comparisons. Because, for a given rate, richer subjects send more in absolute
terms than poorer subjects, unconditional behavior moves the economy to-
wards more equality when starting with unequal endowments. On the other
hand, redistribution could be the result of send and return rates which sys-
tematically depend on own and probably others’ wealth in the current state.
Depending on the nature of conditional behavior (which will be analyzed in
subsection IV.2) and the heterogeneity of the behavioral patterns, the re-
18One-sided WMPSR tests applied to matching group averages for rounds 1-10 androunds 11-20 of each run yield p = .004 for treatment IEQ (both runs) and p = .027 andp = .004 for treatment EQ (run 1 and run 2, respectively).
13
sulting system behavior may increase or decrease equality relative to what
can be expected from unconditional homogenous interaction.
In order to isolate the effects of these two mechanisms, we simulate Gini
coefficients for unconditional, homogenous behavior. More specifically, sim-
ulations are based on the same role and group matchings as implemented
in our experiment. Additionally, we assume that in every round all partic-
ipants in a matching group behave identical – like the group average.19 If
actual behavior is unconditional with respect to wealth levels and differences,
simulations and actual behavior cannot differ.
The average simulated Gini coefficients (see the dashed lines in Figure 4)
follow the same general pattern as the observed ones. In treatment IEQ,
simulated and observed Gini curves are nearly the same (run 1) or differ only
slightly (run 2).20 Consequently, we find no differences between observation
and simulation Gini values in round 20 (WMPSR, p = .371 and p = .191
for run 1 and 2, respectively). In treatment EQ, observed Gini values are
constantly higher than the simulated values,21 yielding (weakly) significant
differences of final Gini values (WMPSR, p = .012 and p = .055 for run 1
and 2, respectively).
Thus, on the aggregate level, we find little evidence for systematic and
deliberate redistributive behavior from rich to poor in treatment IEQ. Con-
trary, inequality rises faster than expected in treatment EQ, suggesting that
there are indeed heterogeneous behavioral patterns that systematically af-
fect wealth distribution – as studied in the next subsection.
IV.2 Individual Decisions
We regressed the individual send and return rates on a number of indepen-
dent variables in order to investigate the determinants of individual behav-
19This procedure yields the same economy growth rates in the simulation as in theexperiment.
20WMPSR tests yield no significance comparing average observed and simulated Ginisfor whole runs or 10 round intervals, except for rounds 11-20 in run 2 with p = .098.
21Differences are significant at p < .01 with one-sided WMPSR tests applied to wholeruns and 10-round intervals.
14

ior.22 Besides the Round number (1-20), and two dummies for Treatment
(0 for EQ, 1 for IEQ) and Run (0 for 1st, 1 for 2nd run), we include the
relative wealth standing of the sender (WSDR) and the responder (WRSPR)
prior to the current transaction. Both variables are derived by dividing the
respective decision maker’s wealth by the average wealth in her economy
(matching group). For the regression of the return rate we also include
the send rate of the counterpart. To account for group-specific as well as
for subject-individual characteristics, we use Mixed Effects models. Due to
the rather complex dynamic nature of our game, we cannot exclude any
interaction effects between the independent variables, which poses a model
selection problem that we addressed in the following way: in our main re-
gressions, we start with the full factorial set of potential interaction effects.
We then iteratively throw out insignificant effects. After two iterations we
ended up with the models presented in Table 1. Note that, by construction,
all included interactions effects are significant. As a second approach we ran
regressions on the complete 2-factorial set of interaction factors. The results
are presented in Table 2 in the Appendix and basically confirm the analysis
discussed here.
The model for investor decisions, presented in the left column of Table 1,
shows that wealth positions influence trusting behavior in treatment EQ, but
are of only minor importance in treatment IEQ. In treatment EQ, the effect
of both direct wealth variables is negative. That is, participants send less
the richer they are and the richer the responder is. However, the positive
interaction effect indicates that the more equal sender and responder are,
the less pronounced are the wealth effects. The lowest send rates are found
for poor senders towards rich responders, and vice versa. Contrary, in treat-
ment IEQ all these three effects are mitigated (see the interaction effects of
Treatment with WSDR, WRSPR, and WSDR ∗ WRSPR). These observations
are consistent with the simulation results of the Gini coefficient dynamics.
While the trust decisions in EQ systematically affect the wealth distribu-
22We had to exclude 6 and 314 observations in the models on the send rate and returnrate, respectively, because the send rate is only defined for positive wealth of the investor,and the return rate is only defined for positive amounts sent.
15

TABLE 1
Regressions of individual send and return rates
Dependent Variable Send Rate Return RateCoefficient (StdErr) Coefficient (StdErr)
Round -0.017** (0.001) -0.005** (0.001)WSDR -0.950** (0.152) -0.080** (0.023)WRSPR -0.922** (0.145) 0.029 (0.030)WSDR ∗ WRSPR 0.662** (0.142)
Treatment -1.255** (0.198) 0.075* (0.033)Treatment*Round 0.013** (0.002)Treatment*WSDR 0.929** (0.160)Treatment*WRSPR 0.892** (0.151)Treatment*WSDR ∗ WRSPR -0.631** (0.147)
Run 0.036** (0.011) 0.016 (0.033)Run*WSDR -0.077* (0.038)Run*WSDR ∗ WRSPR 0.063* (0.027)
Send rate 0.154** (0.015)
Constant 1.866** (0.173) 0.275** (0.050)Random Effects
Group StdDev 0.186 (0.045) 0.0001Subject StdDev 0.264 (0.019) 0.174 (0.013)Residual StdDev 0.272 (0.004) 0.246 (0.004)No. of obs. 2554 2246Wald χ2 305.10 249.81Log-restricted likelihood -529.993 -207.612
Note: Standard errors are given in parentheses. * and ** denote significance on the 5%and 1%-level, respectively. Regression models are derived by starting with a full factorialset of interaction effects and iteratively throwing out insignificant effects.
tion in the economy beyond what can be expected from non-conditional,
homogenous trust patterns, this is not the case in IEQ.
The effect of the repetition of the game (Run) is positive and corresponds
to an increase of average send rates in the second run of the game, across
treatments. With respect to the evolution of investments over time, we find
a negative effect of the number of rounds for treatment EQ, whereas in
16

IEQ the effect of time is somewhat mitigated. Finally, the coefficient of the
treatment dummy is large and highly significant, pointing out a negative
effect of initial inequality introduced by the variation of endowments.23
The model for trustee decisions indicates that return rates are generally
higher in treatment IEQ, and shrink over time. We find that participants
reciprocate high investments, as the coefficient for the send rate is positive
and significant: The more of his wealth the investor sends, the higher his
expected profit margin. Rich senders can expect to earn less from their
trusting decisions than poor senders, while there seems to be no clear effect of
the wealth of the responder herself. Also, there are no significant interaction
effects between treatment and the relative wealth indicators.
V Discussion and Conclusions
We analyze the behavioral dynamics of economic inequality and trust. In our
laboratory economies, participants start with either equal or unequal endow-
ments. They then repeatedly play an investment game and, by accumulating
their payoffs, endogenously create growth and wealth distributions. In each
round, both transaction partners are informed about the current wealth of
their opponent.
Initially, investments are higher in economies starting with equal endow-
ments (EQ) compared to the economies starting with unequal endowments
(IEQ). However, in EQ cooperation deteriorates over time, while trust re-
mains stable in IEQ. As a result, EQ economies initially grow faster, but are
ultimately outperformed by the IEQ economies in terms of efficiency. With
respect to the distribution of wealth, IEQ economies become more equal,
while EQ economies become more unequal, such that the distributions of
wealth are converging to each other over time.
23Several robustness checks have been conducted with respect to the results of our re-gressions. First, Tobit Random Effects models controlling for censored send and returnquotas yield the same results as described above. Second, our main result - the condition-ing of trust on sender and responder wealth - is robust against inclusion of a ‘personalexperience’ variable (the average return rate a sender experienced in previous rounds),and is also present when comparing send rates from rich/poor senders to rich/poor re-sponders using non-parametric WMPSR tests on the economy level, not controlling forother factors as in the regression above.
17

The different dynamics of EQ and IEQ at the aggregate level are mirrored
by two differences at the individual level. First, there is generally less trust
in IEQ. Second, trust in the EQ economies is conditioned on the investor’s
and the trustee’s wealth, while no analogous effects can be identified in IEQ.
Conditional trust appears to be the main reason for the downward trend in
EQ.
We speculate that the differences are partly due to the fact that relative
wealth has a different information value and source in EQ compared to IEQ
economies. A large relative wealth in EQ is a rather reliable signal for not
having been trustworthy in the past: unfair agents become richer. A large
relative wealth in IEQ, on the other hand, is not only the result of relatively
selfish behavior but also of the exogenously imposed unequal endowments.24
Both, models of strategic and social behavior, are then in line with the
observed patterns of (conditional) trust. Because a higher wealth tends to
suggest lower trustworthiness in EQ (but not in IEQ), richer people should
be trusted less in EQ (but not in IEQ). Moreover, a number of studies (see,
for example, Bolton, Brandts and Ockenfels, 2005; Frey, Benz and Stutzer,
2004) suggest that people are more tolerant towards inequitable outcomes
if inequality is the result of a procedurally fair allocation mechanism. Thus,
to the extent that high wealth exogenously and randomly imposed in IEQ
economies is perceived as fair while high wealth endogenously resulting from
selfish behavior is perceived as unfair, inequality in EQ may invoke a different
social response than inequality in IEQ. Modeling the strategic and social
roots of the dynamic interaction of distribution and efficiency is left to future
research.
Our results suggest that the relationship between inequality and growth
through the transmitter trust is not as linear and straightforward as sug-
24This reasoning is supported by the data. Results of Pearson correlations of averagereturn rates and final wealth in half-runs of treatment EQ are R=-.358, p=.004 andR=-.479, p=.000 for rounds 1-10 and rounds 11-20 in run 1, and R=-.397, p=.001 andR=-.309, p=.013 for rounds 1-10 and rounds 11-20 in run 2, respectively. Contrary, intreatment IEQ half-run correlations between average return rates and wealth are low orinsignificant; R=-.142, p=.262 and R=-.048, p=.704 for rounds 1-10 and rounds 11-20 inrun 1, and R=-.240, p=.056 and R=-.152, p=.231 for rounds 1-10 and rounds 11-20 inrun 2, respectively.
18

gested in the related empirical literature (reviewed in Section II). Specifi-
cally, our results provide evidence that the source, timing and dynamics of
inequality (changes) within a society may have explanatory power for its
behavioral impact on prosperity and growth.
References
Alesina, A. and Ferrara, E. L. (2002), ‘Who trusts others?’, Journal of Public
Economics 85, 207–234.
Anderson, L. R., Mellor, J. M. and Milyo, J. (2006), ‘Induced heterogeneity
in trust experiments’, Experimental Economics 9, 223–235.
Banerjee, A. V. and Duflo, E. (2003), ‘Inequality and growth: What can the
data say?’, Journal of Economic Growth 8, 267–299.
Barro, R. J. (2000), ‘Inequality and Growth in a Panel of Countries’, Journal
of Economic Growth 5, 5–32.
Benabou, R. (1996), Inequality and Growth, in B. S. Bernanke and J. J.
Rotemberg, eds, ‘NBER Macroeconomics Annual’, The MIT press, Cam-
bridge, MA, pp. 11–74.
Berg, J., Dickhaut, J. and McCabe, K. (1995), ‘Trust, Reciprocity, and
Social History’, Games and Economic Behavior 10, 122–142.
Bolton, G. E., Brandts, J. and Ockenfels, A. (2005), ‘Fair Procedures: Ev-
idence from Games Involving Lotteries’, Economic Journal 115, 1054–
1076.
Bolton, G. E. and Ockenfels, A. (2000), ‘ERC - A Theory of Equity, Reci-
procity and Competition’, American Economic Review 90, 166–193.
Brulhart, M. and Usunier, J.-C. (2007), ‘Verified Trust: Reciprocity, Altru-
ism, and Randomness in Trust Games’, Working Paper.
19

Buckley, E. and Croson, R. (2006), ‘Income and wealth heterogeneity in the
voluntary provision of linear public goods’, Journal of Public Economics
90, 935–955.
Camerer, C. (2003), Behavioral Game Theory, Princeton University Press,
Princeton.
Castello-Climent, A. (2004), ‘A Reassessment Of The Relationship Be-
tween Inequality And Growth: What Human Capital Inequality Data
Say?’, Working Paper 2004-15 of Instituto Valenciano de Investigaciones
Economicas.
Chan, K. S., Mestelman, S., Moir, R. and Muller, R. A. (1996), ‘The volun-
tary provision of public goods under varying income distributions’, Cana-
dian Journal of Economics 34(1), 54–69.
Corneo, G. and Gruner, H. P. (2000), ‘Social Limits to Redistribution’,
American Economic Review 90, 1491–1507.
Corneo, G. and Jeanne, O. (2001), ‘Status, the Distribution of Wealth, and
Growth’, Scandinavian Journal of Economics 103(2), 283–293.
De Dominicis, L., Florax, R. J. and De Groot, H. L. F. (2008), ‘On the Em-
pirics of Social Capital’, Scottish Journal of Political Economy 55(5), 654–
682.
Durlauf, S. N. (2002), ‘On the Empirics of Social Capital’, The Economic
Journal 112, F459–F479.
Fehr, E. and Schmidt, K. (1999), ‘A Theory of Fairness, Competition, and
Cooperation’, Quarterly Journal of Economics 114, 817–868.
Fershtman, C. and Gneezy, U. (2001), ‘Discrimination in a Segmented
Society: An Experimental Approach’, Quarterly Journal of Economics
116(1), 351–377.
Fischbacher, U. (2007), ‘z-Tree: Zurich Toolbox for Ready-made Economic
experiments’, Experimental Economics 10(2), 171–178.
20

Forbes, K. (2000), ‘A Reassessment of the Relationship between Inequality
and Growth’, American Economic Review 90(4), 869–887.
Frey, B. S., Benz, M. and Stutzer, A. (2004), ‘Introducing Procedural Utility:
Not Only What, but Also How Matters’, Journal of Institutional and
Theoretical Economics 160, 377–401.
Galor, O. and Zeira, J. (1993), ‘Income Distribution and Macroeconomics’,
Review of Economic Studies 60(1), 35–52.
Glaeser, E. L. (2005), ‘Inequality’, Harvard Institute of Economic Research
Discussion Paper No. 2078.
Glaeser, E. L., Laibson, D. and Sacerdote, B. (2002), ‘An Economic Ap-
proach to Social Capital’, The Economic Journal 112, F437–F458.
Glaeser, E. L., Laibson, D., Scheinkman, J. A. and Soutter, C. L. (2000),
‘Measuring Trust’, Quarterly Journal of Economics 115(3), 811–846.
Greiner, B. (2004), An Online Recruitment System for Economic Ex-
periments, in K. Kremer and V. Macho, eds, ‘Forschung und wis-
senschaftliches Rechnen 2003, GWDG Bericht 63’, Ges. fur Wiss. Daten-
verarbeitung, Gottingen, Germany, pp. 79–93.
Gustavsson, M. and Jordahl, H. (2008), ‘Inequality and trust in Sweden:
Some inequalities are more harmful than others’, Journal of Public Eco-
nomics 92, 348–365.
Haile, D., Sadrieh, A. and Verbon, H. A. A. (2006), ‘Cross-Racial Envy and
Underinvestment in South Africa’, CESifo Working Paper No. 1657.
Jordahl, H. (2008), Inequality and Trust, in G. T. Svendsen and G. L. H.
Svendsen, eds, ‘Handbook of Social Capital’, Edward Elgar, Cheltenham.
Knack, S. and Keefer, P. (1997), ‘Does Social Capital have an Economic
Payoff? A Cross-Country Investigation’, Quarterly Journal of Economics
112, 1252–1288.
21

Kuznets, S. (1955), ‘Economic Growth and Income Inequality’, American
Economic Review 45(1), 1–28.
La Porta, R., Lopez-de-Silanes, F., Shleifer, A. and Vishny, R. W. (1997),
‘Trust in Large Organisations’, American Economic Review 87(2), 333–
338.
Ledyard, J. O. (1995), Public Goods: A Survey of Experimental Research,
in J. H. Kagel and A. E. Roth, eds, ‘The Handbook of Experimental
Economics’, Princeton University Press, Princeton, pp. 111–194.
Persson, T. and Tabellini, G. (1994), ‘Is Inequality Harmful for Growth?’,
American Economic Review 84(3), 600–621.
Ros, J. (2000), Development Theory and the Economics of Growth, The
University of Michigan Press, Ann Arbor.
Zak, P. J. and Knack, S. (2001), ‘Trust and Growth’, The Economic Journal
111, 295–321.
22
Appendix
A Instructions
Below we include the instructions used in the first run of treatment IEQ,
translated from German. Instructions for the other runs and treatments
were worded analogously.
Welcome to this experiment! In this experiment you can earn money. How
much money you earn depends on your decisions and the decisions of the
other participants.
From now on, please do not communicate with other participants. If you
have a question concerning the experiment, please raise your hand! We will
come to your place and answer your question privately. If you do not comply
with these rules, we will have to exclude you from the experiment and all
payments.
In the experiment, we will use ET (“Experiment-Taler”) as the currency.
At the end of the experiment, your payoff will be converted into Euros and
will be paid out in cash. The exchange rate is 150 ET = 1 Euro. In the
experiment, all amounts in ET are rounded to whole numbers.
The experiment consists of several parts. The payoff of only one of these
parts will be paid out at the end of the experiment. When the experiment is
finished, a die will be used to determine which part will be used for payment.
The following instructions refer to the first part of the experiment. After
the first part is finished you will receive new instructions.
In this part all participants receive an initial endowment. Half of the partici-
pants receive an initial endowment of 800 ET, the other half receive an initial
endowment of 200 ET. It will be determined by chance which participant
receives which initial endowment.
This part consists of 20 rounds. In each round pairs are formed randomly,
each pair consisting of participant A and participant B. It is guaranteed that
you do not interact with the same participant in two consecutive rounds.
The roles A and B within the pair are assigned randomly in every round.
23

The identity of the participant you are interacting with is secret, and no
other participant will be informed about your identity. In this sense, your
decisions are anonymous.
Every round proceeds as follows:
• At the beginning of the round both participants are informed about
their roles (A or B), the current round (1-20), their own current wealth
and the current wealth of the other participant.
• Then participant A decides how much of his/her wealth he/she wants
to send to participant B.
• The amount sent by participant A is multiplied by 1.2. This means
participant B not only receives the amount sent, but 120 % of the
amount sent (1.2*amount sent).
• Then participant B decides how much he/she sends back to partic-
ipant A. He/she must send back at least 90 % of the amount sent
(0.9*amount sent). The upper limit for the amount sent back is the
wealth of participant B.
After that the round is over. Wealth at the end of the round is calculated
as follows:
• Participant A: Wealth at the end of the round = wealth at the be-
ginning of the round - amount sent + amount sent back (at least
0.9*amount sent)
• Participant B: Wealth at the end of the round = wealth at the be-
ginning of the round + 1.2*amount sent - amount sent back (at least
0.9*amount sent)
Wealth at the beginning of a new round is equal to wealth at the end of the
preceding round. The payment for this part in case it is selected is given by
the wealth at the end of the last round of this part.
24
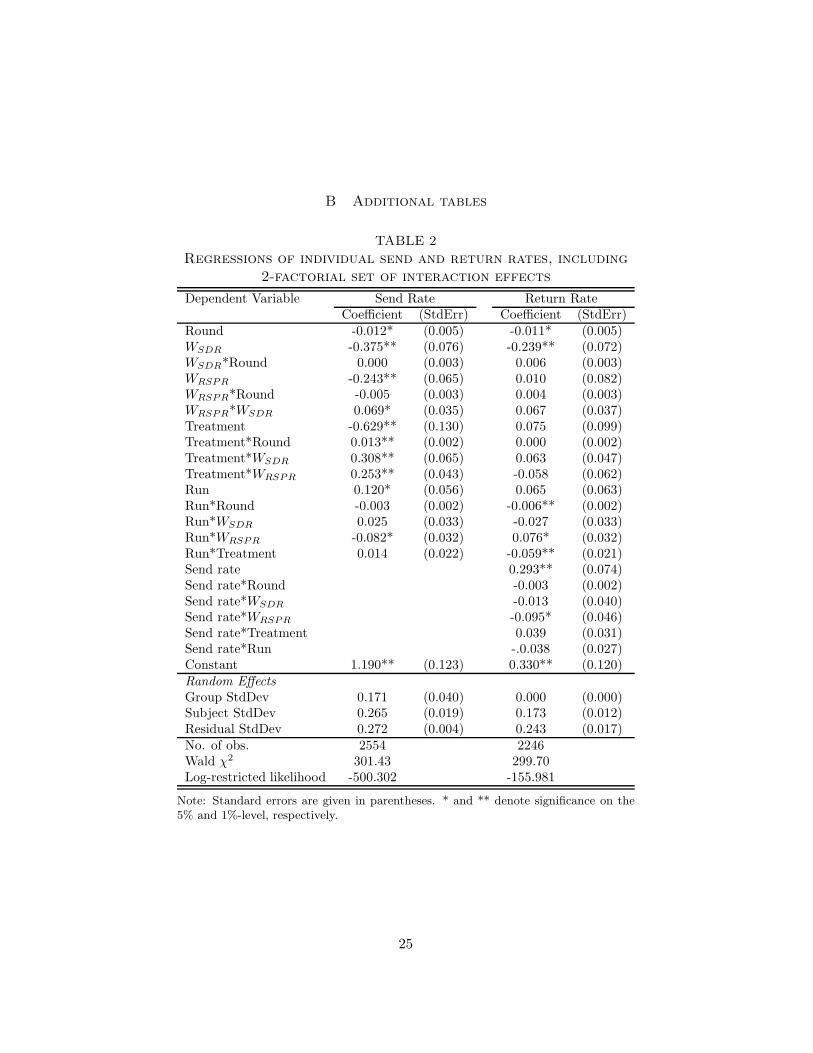
B Additional tables
TABLE 2
Regressions of individual send and return rates, including
2-factorial set of interaction effects
Dependent Variable Send Rate Return RateCoefficient (StdErr) Coefficient (StdErr)
Round -0.012* (0.005) -0.011* (0.005)WSDR -0.375** (0.076) -0.239** (0.072)WSDR*Round 0.000 (0.003) 0.006 (0.003)WRSPR -0.243** (0.065) 0.010 (0.082)WRSPR*Round -0.005 (0.003) 0.004 (0.003)WRSPR*WSDR 0.069* (0.035) 0.067 (0.037)Treatment -0.629** (0.130) 0.075 (0.099)Treatment*Round 0.013** (0.002) 0.000 (0.002)Treatment*WSDR 0.308** (0.065) 0.063 (0.047)Treatment*WRSPR 0.253** (0.043) -0.058 (0.062)Run 0.120* (0.056) 0.065 (0.063)Run*Round -0.003 (0.002) -0.006** (0.002)Run*WSDR 0.025 (0.033) -0.027 (0.033)Run*WRSPR -0.082* (0.032) 0.076* (0.032)Run*Treatment 0.014 (0.022) -0.059** (0.021)Send rate 0.293** (0.074)Send rate*Round -0.003 (0.002)Send rate*WSDR -0.013 (0.040)Send rate*WRSPR -0.095* (0.046)Send rate*Treatment 0.039 (0.031)Send rate*Run -.0.038 (0.027)Constant 1.190** (0.123) 0.330** (0.120)Random Effects
Group StdDev 0.171 (0.040) 0.000 (0.000)Subject StdDev 0.265 (0.019) 0.173 (0.012)Residual StdDev 0.272 (0.004) 0.243 (0.017)No. of obs. 2554 2246Wald χ2 301.43 299.70Log-restricted likelihood -500.302 -155.981
Note: Standard errors are given in parentheses. * and ** denote significance on the5% and 1%-level, respectively.
25