the doctoral space revisited? - kvab. manuel heitor.pdf · the doctoral space revisited? building...
TRANSCRIPT

The Doctoral space revisited? Building new horizons...
KVAB Thinker’s Programme 2016
Palace of the Academies,
7 November 2016
Amadeu Sousa Cardoso, 1913

Damião de Góis (1502 – 1574 ….a friend and student of Erasmus, appointed secretary to the Portuguese factory in Antwerp in 1523 by King John III
Jose Mariano Gago (1948-2016) Portuguese Minister of S&T (1995-2001; 2005-2011)
… . Our efforts must be seen as the first phase of what needs to be accomplished in the near future. Considerable time should be devoted to setting up a dialogue in each member State on the issue of human resources for SET, helping policy-makers understand what is required, and building bridges between national and European actors. Dialogue between industrial and academic organizations in Europe should also be pursued. José Mariano Gago EC, 2004


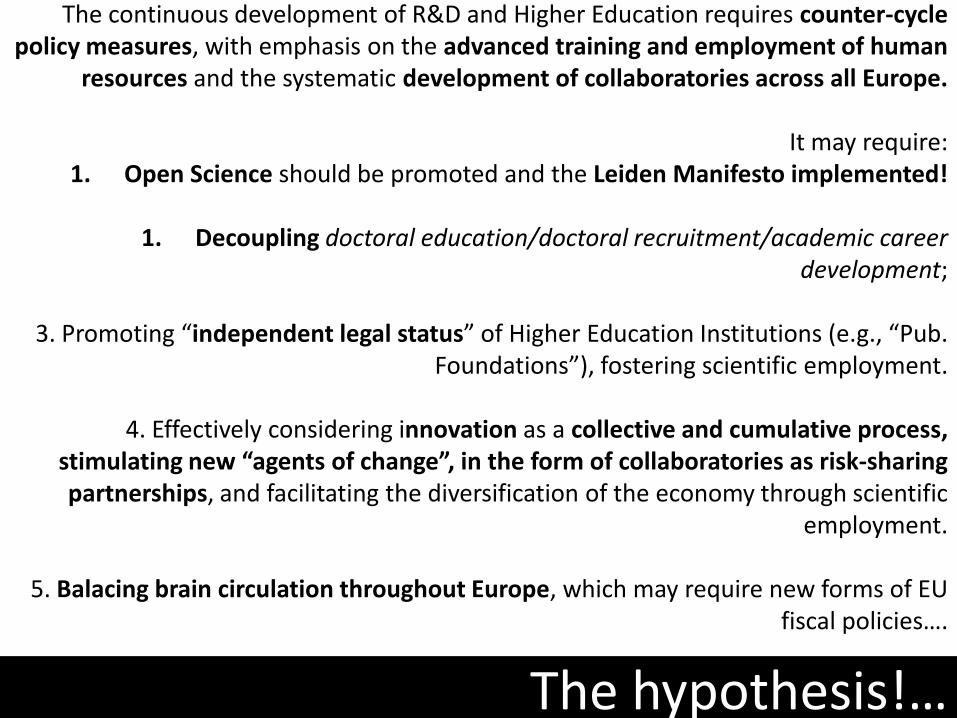
The hypothesis!…
The continuous development of R&D and Higher Education requires counter-cycle policy measures, with emphasis on the advanced training and employment of human
resources and the systematic development of collaboratories across all Europe.
It may require: 1. Open Science should be promoted and the Leiden Manifesto implemented!
1. Decoupling doctoral education/doctoral recruitment/academic career
development;
3. Promoting “independent legal status” of Higher Education Institutions (e.g., “Pub. Foundations”), fostering scientific employment.
4. Effectively considering innovation as a collective and cumulative process,
stimulating new “agents of change”, in the form of collaboratories as risk-sharing partnerships, and facilitating the diversification of the economy through scientific
employment.
5. Balacing brain circulation throughout Europe, which may require new forms of EU fiscal policies….

Note: total number of PhD’s (vertical) and the yearly number of new PhD’s (horizontal) by 10.000 inhabitants. Source: OECD
“Stock” versus Flux of doctorates: 2004-2012
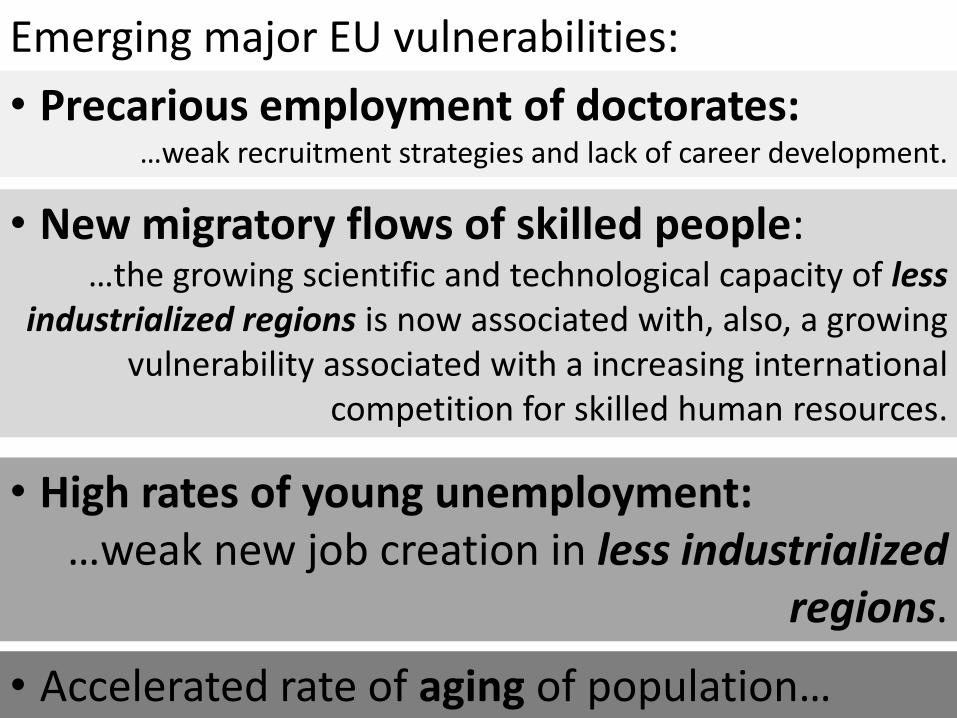
Emerging major EU vulnerabilities:
• New migratory flows of skilled people: …the growing scientific and technological capacity of less
industrialized regions is now associated with, also, a growing vulnerability associated with a increasing international
competition for skilled human resources.
• High rates of young unemployment: …weak new job creation in less industrialized
regions.
• Accelerated rate of aging of population…
• Precarious employment of doctorates: …weak recruitment strategies and lack of career development.

Fluxo de gregos, italianos, portugueses e espanhóis para o Reino Unido Evolução do número de atribuições de número de registo (National Insurance Number) pelo Sistema de Segurança Social
no Fonte: Department for Work and Pensions UK
0
10000
20000
30000
40000
50000
60000
2003 2004 2005 2006 2007 2008 2009 2010 2011 2012 2013
Origin countries
Greece Italy Portugal Spain

Evolução da entrada de gregos, italianos, portugueses e espanhóis na Alemanha
Fonte: Statistisches Bundesamt Deutschland, Fachserie 1 Reihe 2, volumes de 2005 a 2013
0
5000
10000
15000
20000
25000
30000
35000
40000
45000
2005 2006 2007 2008 2009 2010 2011 2012 2013
Origin countries
Greece Italy Portugal Spain
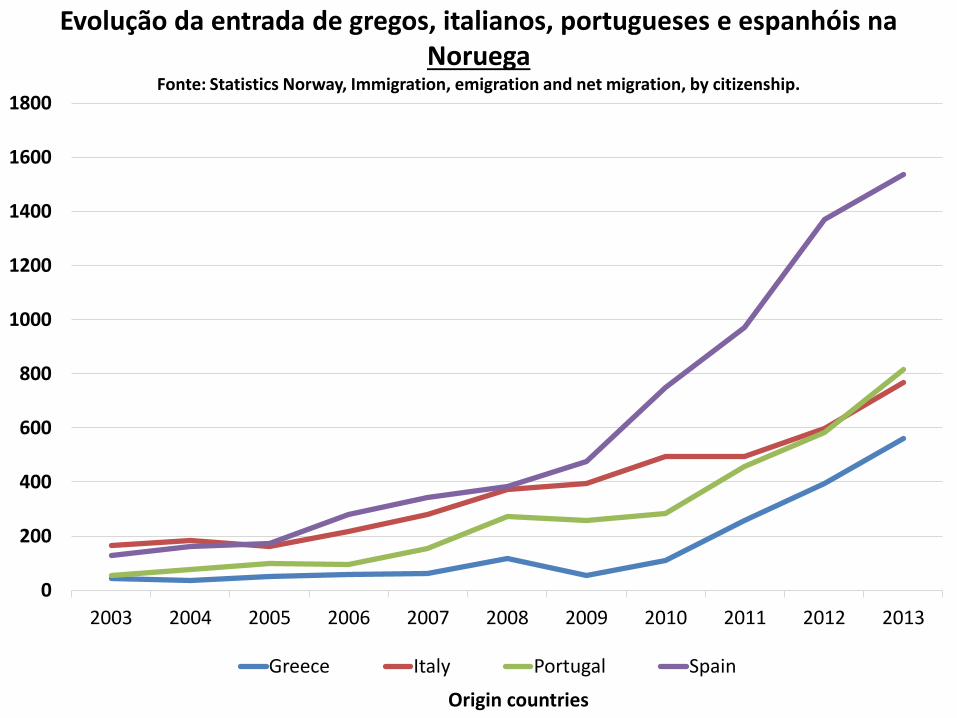
Evolução da entrada de gregos, italianos, portugueses e espanhóis na Noruega
Fonte: Statistics Norway, Immigration, emigration and net migration, by citizenship.
0
200
400
600
800
1000
1200
1400
1600
1800
2003 2004 2005 2006 2007 2008 2009 2010 2011 2012 2013
Origin countries
Greece Italy Portugal Spain

Francisco de Goya, 1797-1799 El sueño de la razon produce monstruos
Museo del Prado

After many years hit by recession and economic and budgetary problems:
- Which is the evolving path of R&D funding?
- Which policies to foster knowledge towards long-term growth?
The Questions Today…

Government Budget Appropriations or Outlays for R&D (GBOARD)/capita - 1995 (Purchasing Power Standard (PPS) per inhabitant at constant 2005 prices)
Source: Eurostat
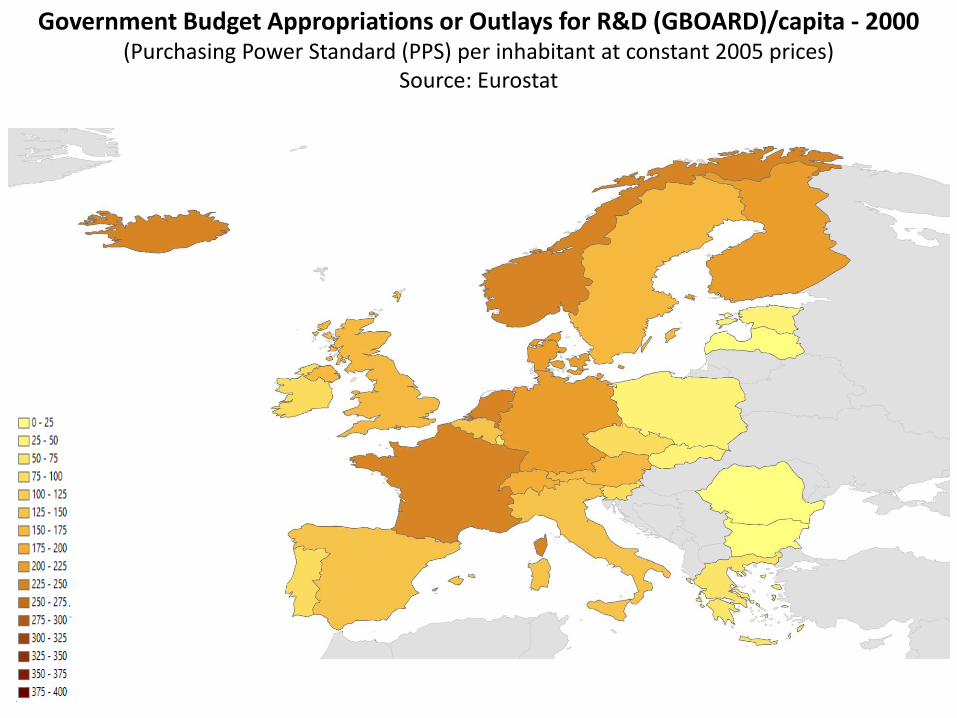
Government Budget Appropriations or Outlays for R&D (GBOARD)/capita - 2000 (Purchasing Power Standard (PPS) per inhabitant at constant 2005 prices)
Source: Eurostat

Government Budget Appropriations or Outlays for R&D (GBOARD)/capita - 2005 (Purchasing Power Standard (PPS) per inhabitant at constant 2005 prices)
Source: Eurostat

Government Budget Appropriations or Outlays for R&D (GBOARD)/capita - 2009 (Purchasing Power Standard (PPS) per inhabitant at constant 2005 prices)
Source: Eurostat
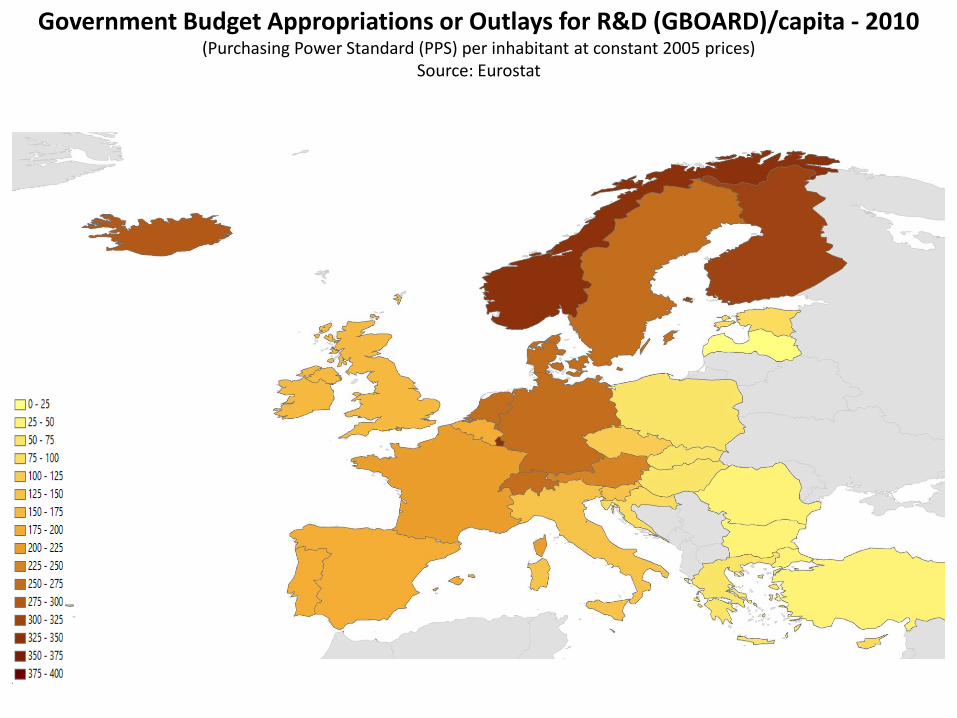
Government Budget Appropriations or Outlays for R&D (GBOARD)/capita - 2010 (Purchasing Power Standard (PPS) per inhabitant at constant 2005 prices)
Source: Eurostat
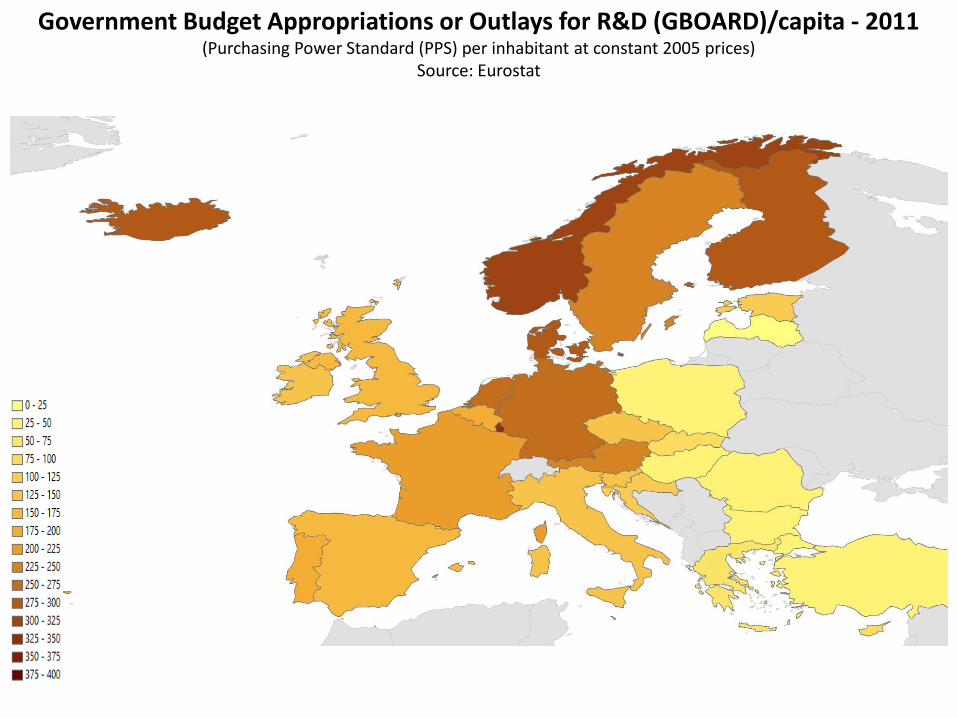
Government Budget Appropriations or Outlays for R&D (GBOARD)/capita - 2011 (Purchasing Power Standard (PPS) per inhabitant at constant 2005 prices)
Source: Eurostat
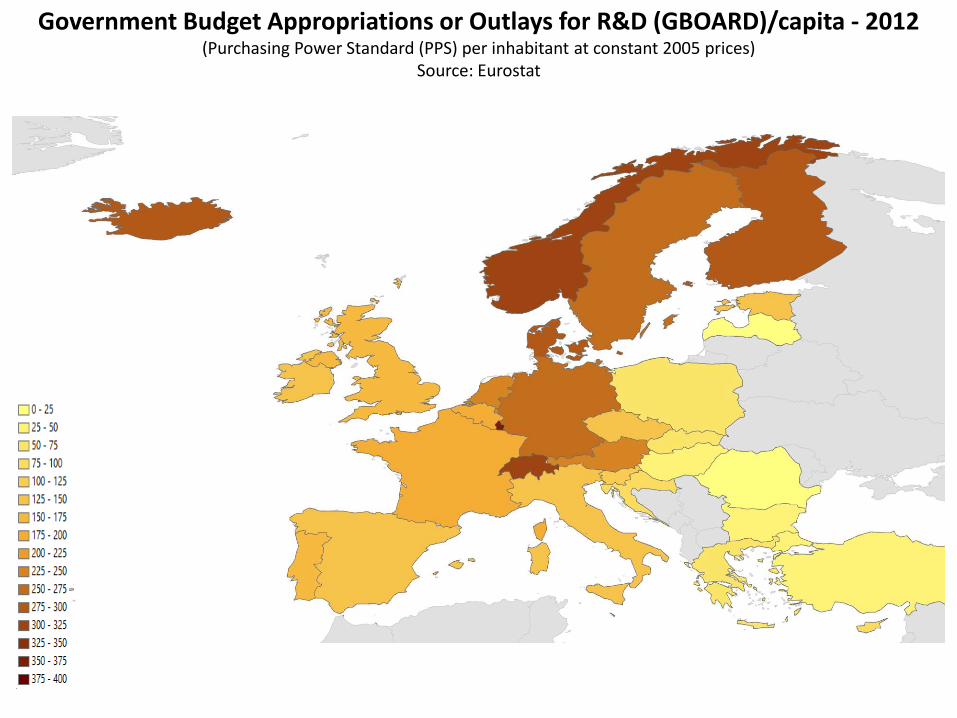
Government Budget Appropriations or Outlays for R&D (GBOARD)/capita - 2012 (Purchasing Power Standard (PPS) per inhabitant at constant 2005 prices)
Source: Eurostat
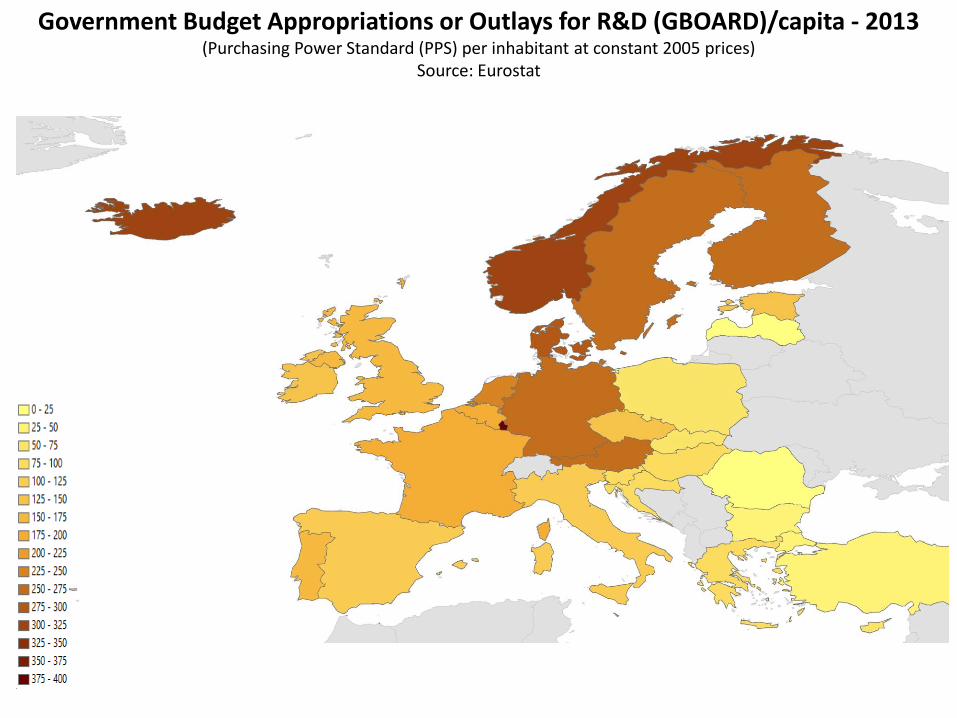
Government Budget Appropriations or Outlays for R&D (GBOARD)/capita - 2013 (Purchasing Power Standard (PPS) per inhabitant at constant 2005 prices)
Source: Eurostat
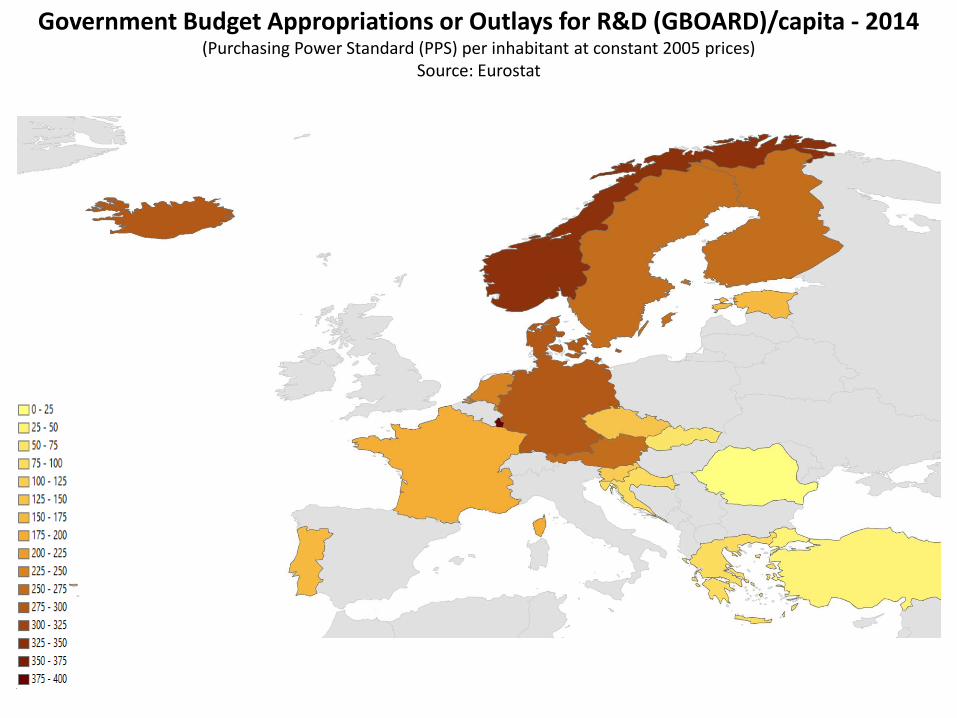
Government Budget Appropriations or Outlays for R&D (GBOARD)/capita - 2014 (Purchasing Power Standard (PPS) per inhabitant at constant 2005 prices)
Source: Eurostat
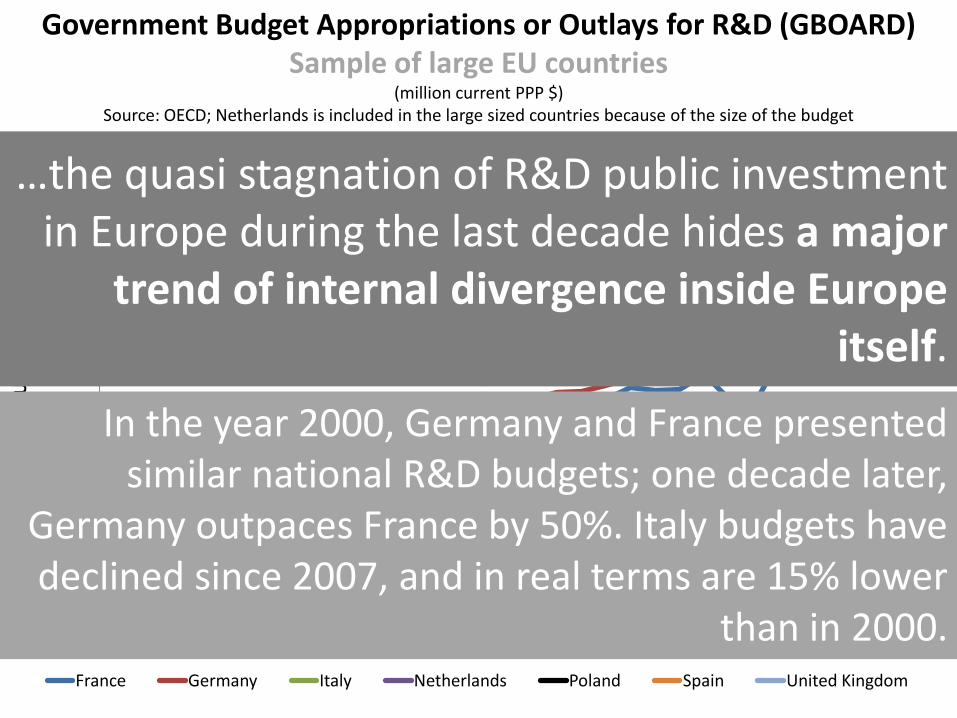
Government Budget Appropriations or Outlays for R&D (GBOARD) Sample of large EU countries
(million current PPP $) Source: OECD; Netherlands is included in the large sized countries because of the size of the budget
0
5000
10000
15000
20000
25000
30000
35000
19
81
19
82
19
83
19
84
19
85
19
86
19
87
19
88
19
89
19
90
19
91
19
92
19
93
19
94
19
95
19
96
19
97
19
98
19
99
20
00
20
01
20
02
20
03
20
04
20
05
20
06
20
07
20
08
20
09
20
10
20
11
20
12
20
13
20
14
GB
OA
RD
, Mill
ion
s o
f U
S D
olla
rs, c
urr
en
t P
PP
$
France Germany Italy Netherlands Poland Spain United Kingdom
In the year 2000, Germany and France presented similar national R&D budgets; one decade later,
Germany outpaces France by 50%. Italy budgets have declined since 2007, and in real terms are 15% lower
than in 2000.
…the quasi stagnation of R&D public investment in Europe during the last decade hides a major
trend of internal divergence inside Europe itself.
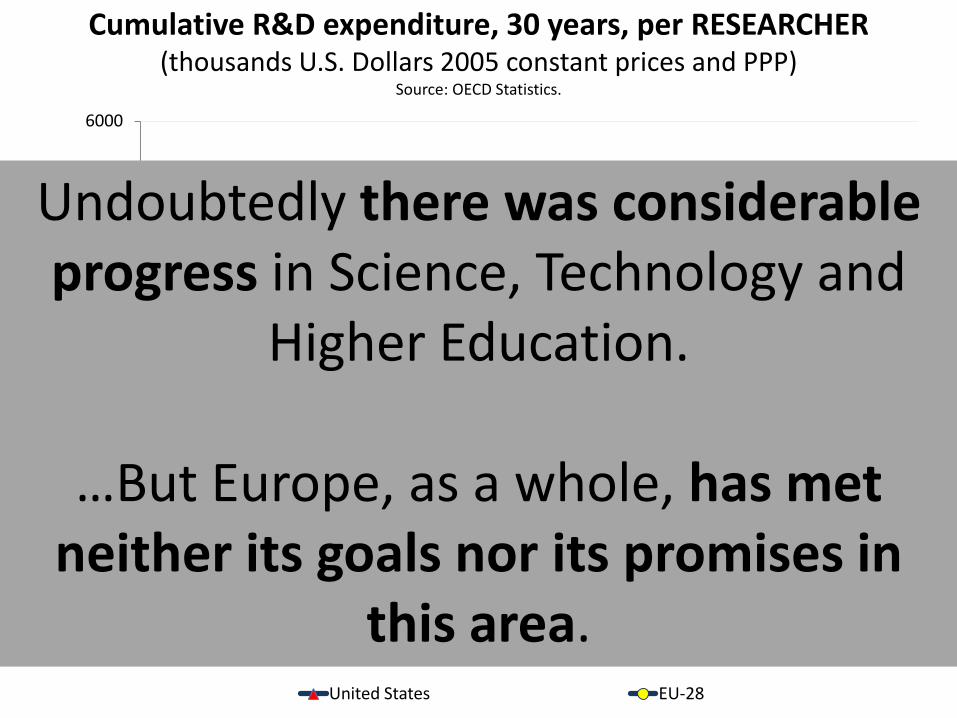
Cumulative R&D expenditure, 30 years, per RESEARCHER (thousands U.S. Dollars 2005 constant prices and PPP)
Source: OECD Statistics.
0
1000
2000
3000
4000
5000
6000
Cu
mu
lati
ve G
ross
Do
me
stic
Exp
en
dit
ure
on
R&
D p
er
rese
arch
er
(th
ou
san
ds
US
Do
llars
20
05
co
nst
ant
pri
ces
and
P
PP
)
United States EU-28
Undoubtedly there was considerable progress in Science, Technology and
Higher Education.
…But Europe, as a whole, has met neither its goals nor its promises in
this area.
…but,
what has
changed?
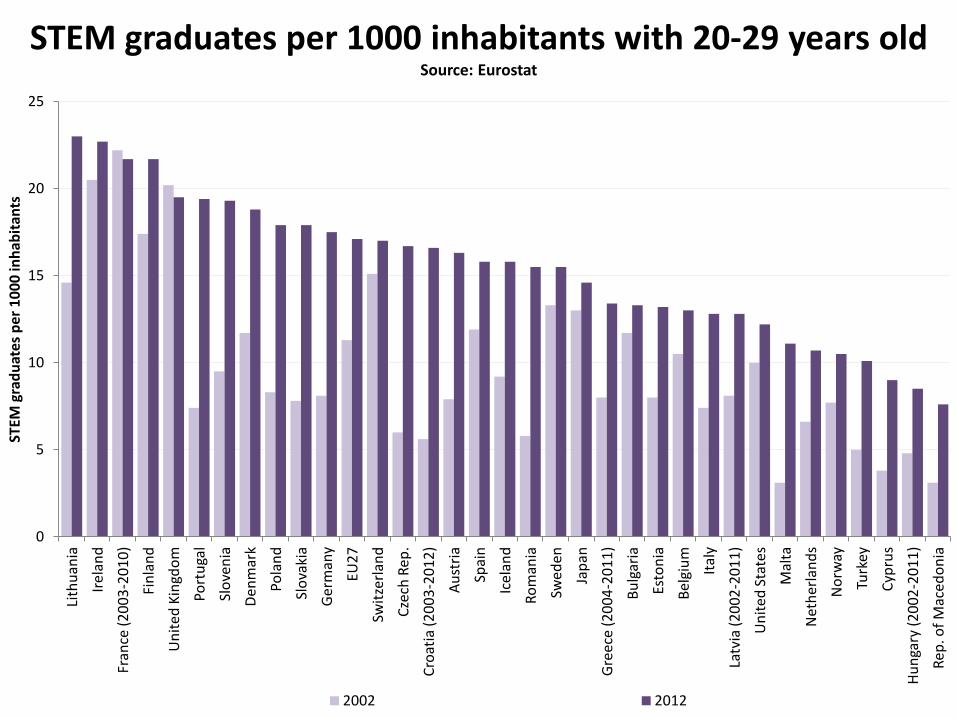
STEM graduates per 1000 inhabitants with 20-29 years old Source: Eurostat
0
5
10
15
20
25
Lith
uan
ia
Irel
and
Fran
ce (
20
03
-20
10
)
Fin
lan
d
Un
ited
Kin
gdo
m
Port
uga
l
Slo
ven
ia
Den
mar
k
Pola
nd
Slo
vaki
a
Ger
man
y
EU2
7
Swit
zerl
and
Cze
ch R
ep.
Cro
atia
(2
00
3-2
01
2)
Au
stri
a
Spai
n
Icel
and
Ro
man
ia
Swed
en
Jap
an
Gre
ece
(2
00
4-2
01
1)
Bu
lgar
ia
Esto
nia
Bel
giu
m
Ital
y
Latv
ia (
20
02
-20
11
)
Un
ited
Sta
tes
Mal
ta
Net
her
lan
ds
No
rway
Turk
ey
Cyp
rus
Hu
nga
ry (
20
02
-20
11
)
Rep
. of
Mac
edo
nia
STEM
gra
du
ates
per
10
00
inh
abit
ants
2002 2012

New PhDs per 10.000 inhabitants for 2005 and 2012 Source: UNESCO, Eurostat, INEP, CAPES, NSF, IBGE, NBS, SSB.NO.
U.S data – doctorate recipients ; Brazil data – total de titulados no doutorado ; Other data – Doctor of Philosophy.
0
0,5
1
1,5
2
2,5
3
3,5
4
4,5 M
assa
chu
sett
s
Ger
man
y
Un
ited
Kin
gdo
m
Fin
lan
d
Au
stri
a
No
rway
Den
mar
k
Swed
en
Cze
ch R
epu
blic
Net
her
lan
ds
Mar
ylan
d
Ind
ian
a
New
Yo
rk
Fran
ce (
20
11
)
Spai
n
Pen
nsy
lvan
ia
Ital
y
Illin
ois
Mic
hig
an
Port
uga
l
Vir
gin
ia
No
rth
Car
olin
a
Oh
io
Geo
rgia
São
Pau
lo
Jap
an
Hu
nga
ry
Rio
Gra
nd
e d
o S
ul
Rio
de
Jan
eiro
New
Jer
sey
Flo
rid
a
Pola
nd
New
Ph
Ds
pe
r 1
0.0
00
inh
abit
ants
2005 2012

The 500 largest EU firms investing in R&D (Following ICB - Industry Classification Benchmark; Source: EU Industrial R&D Investment Scoreboard
0
20000
40000
60000
80000
100000
120000
140000
2003 2004 2005 2006 2007 2008 2009 2010 2011 2012
Mill
ion
s o
f Eu
ros
Automobiles & Parts Pharmaceuticals & Biotechnology Technology Hardware & Equipment Aerospace & defence Industrial Engineering Electronic & Electrical Equipment Banks Software & Computer Services Chemicals Oil & Gas
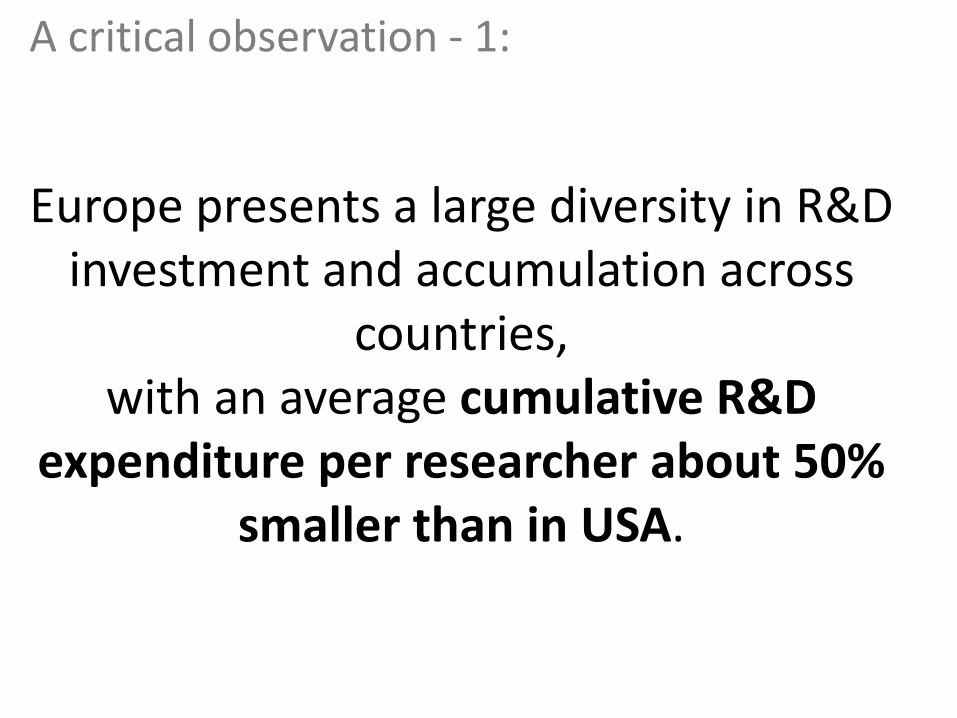
Europe presents a large diversity in R&D investment and accumulation across
countries, with an average cumulative R&D
expenditure per researcher about 50% smaller than in USA.
A critical observation - 1:

A critical observation - 2:
In many other EU countries, beyond notable exceptions (including Germany), the stagnation and/or recent decrease in public R&D and HE budgets has been justified by the need to change policies, including:
• Increase public funding to support firms and business activities;
• Increase the selectivity of public funding, decreasing public support for advanced training and scientific employment.

Which myths?
How can we effectively help debunking these myths and guarantee better policies?
Public vs Private R&D vs Innovation Higher Educ vs Vocational Training
…we live on times of increasing socialization of risks and the privatization of rewards

...uncertainty: which impact?
In a context of increased uncertainty and accelerated rate of technological change, for which knowledge and innovation
are critical factors for social and economical development, the role of the science and advanced education may be
enhanced, but requires to be adapted!
The scope:... the globalized “learning society”!
Knowledge Institutions Learning Organisations
Intellectual Property Learning Networks
Source: Conceição, Lundvall and Heitor (2002)

How people, institutions and incentives can be effectively
oriented, transmitted and assimilated to allow societies to
move towards a socially responsable, sustainable and
entrepreneurial world?
We can look, instead, at the process...
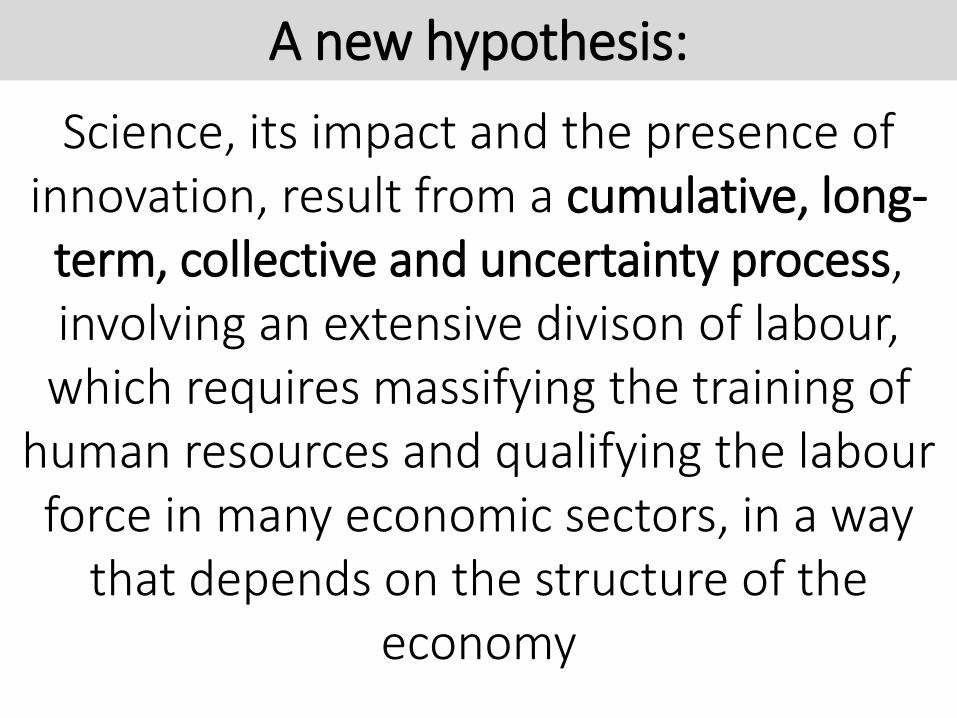
Science, its impact and the presence of innovation, result from a cumulative, long-
term, collective and uncertainty process, involving an extensive divison of labour, which requires massifying the training of
human resources and qualifying the labour force in many economic sectors, in a way
that depends on the structure of the economy
A new hypothesis:
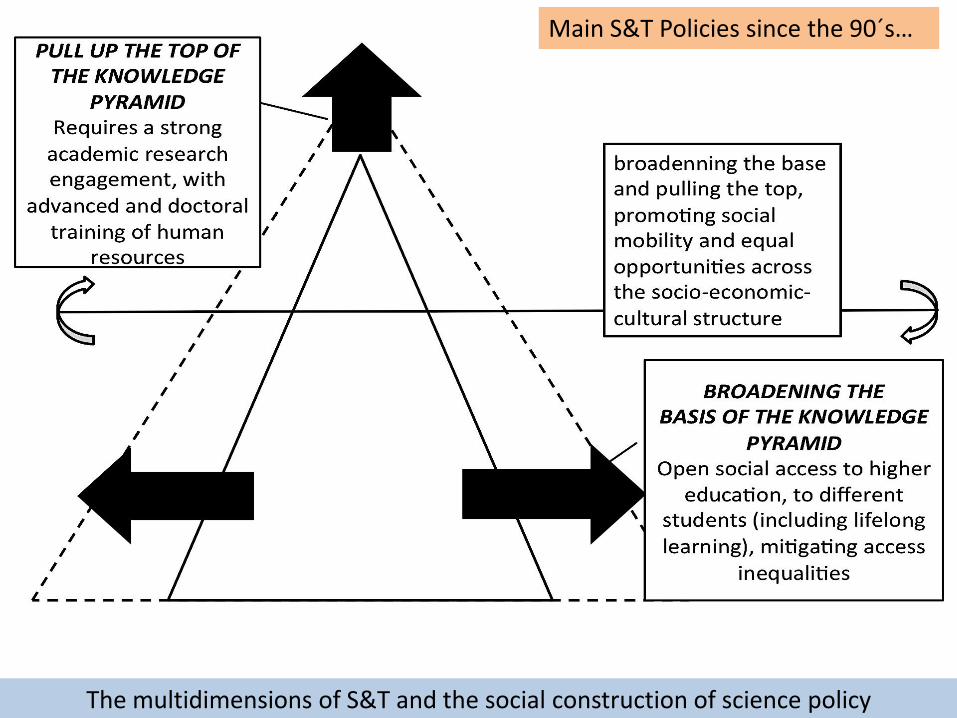
The multidimensions of S&T and the social construction of science policy
Main S&T Policies since the 90´s…
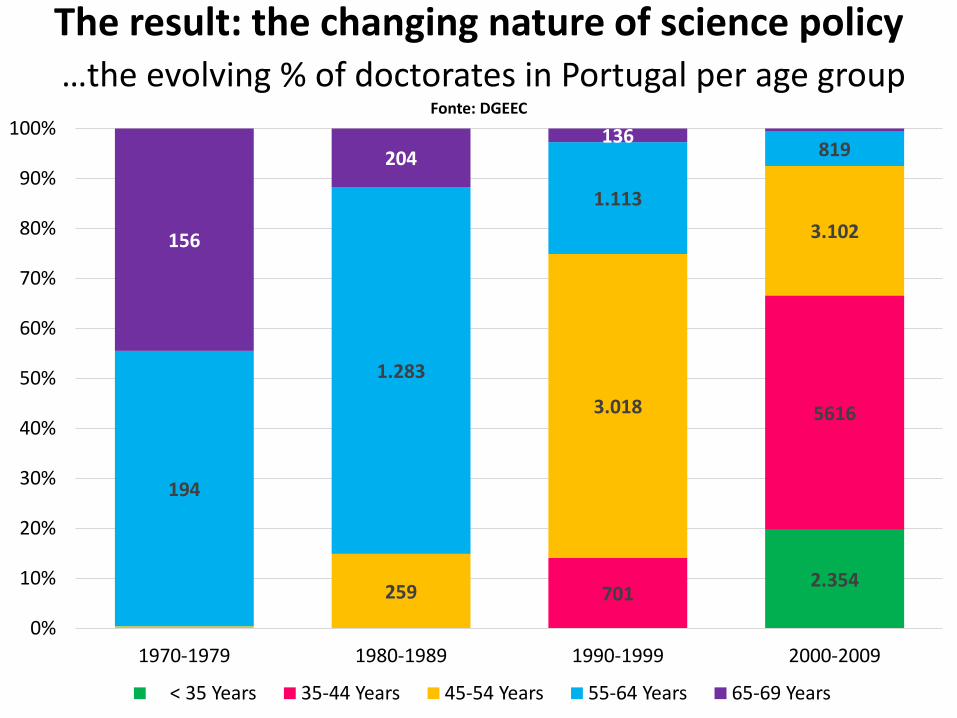
The result: the changing nature of science policy …the evolving % of doctorates in Portugal per age group
Fonte: DGEEC
2.354 701
5616
259
3.018
3.102
194
1.283
1.113
819
156
204 136
0%
10%
20%
30%
40%
50%
60%
70%
80%
90%
100%
1970-1979 1980-1989 1990-1999 2000-2009
< 35 Years 35-44 Years 45-54 Years 55-64 Years 65-69 Years

The case of Portugal: fostering institutional development
Period Main institutional breakthrough
80s – 90s Non for profit institutions, fostered through academic research
(a leading example is INESC, as created in 1980)
1995 – 2005
Associate Laboratories, to foster research excellence through
networks of academic research centres
(as created since 1999, with a few initial developments in biomedical and physical
science, but reaching 25 Laboratories by 2007)
2006 –…
HE REFORM - University Foundations (Independent Legal Status)
(includes three leading examples in 2008, including University of Porto, University
of Aveiro and ISCTE business school)
International partnerships, as thematic research and advanced
training networks
(includes partnerships with MIT, CMU, Harvard and UT Austin in emerging themes,
including ICTs, energy, bioengineering, design, clinical research)

The multidimensions of S&T and the social construction of science policy
Scientific employment
internationalize
Diversify institutions: strengthen polytechnics and universities
More “intermediaries”: collaborative Labs
strengthen networks
More employment
More scientific culture More public participation
Assessing S&T Policies for coming years…
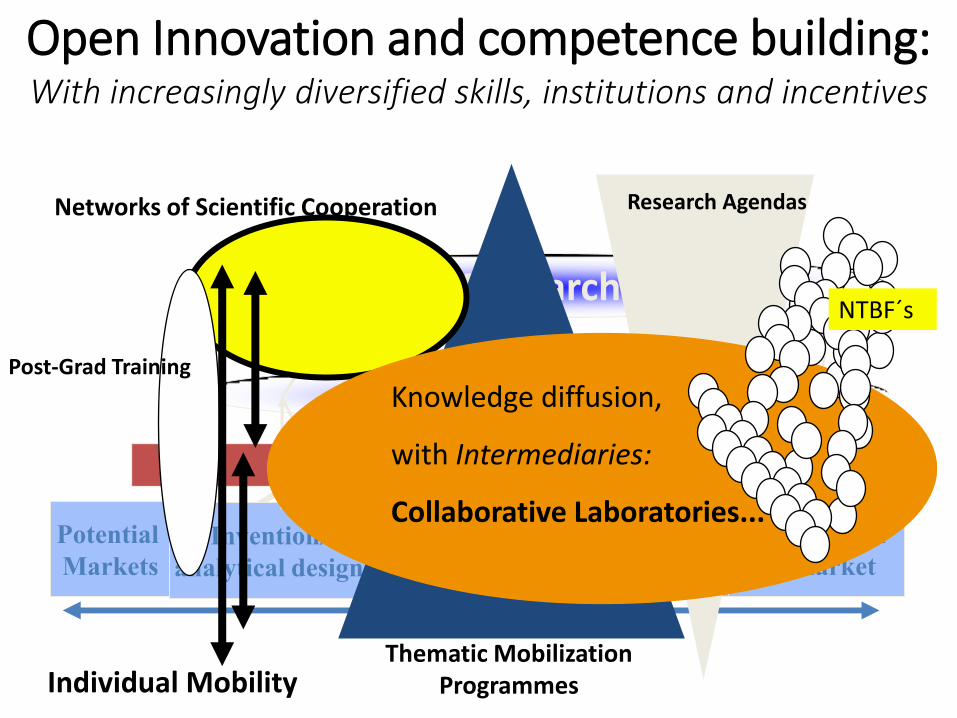
Open Innovation and competence building: With increasingly diversified skills, institutions and incentives
Chain Linked Model of
Innovation
Kline & Rosenberg
Technology platforms
Potential
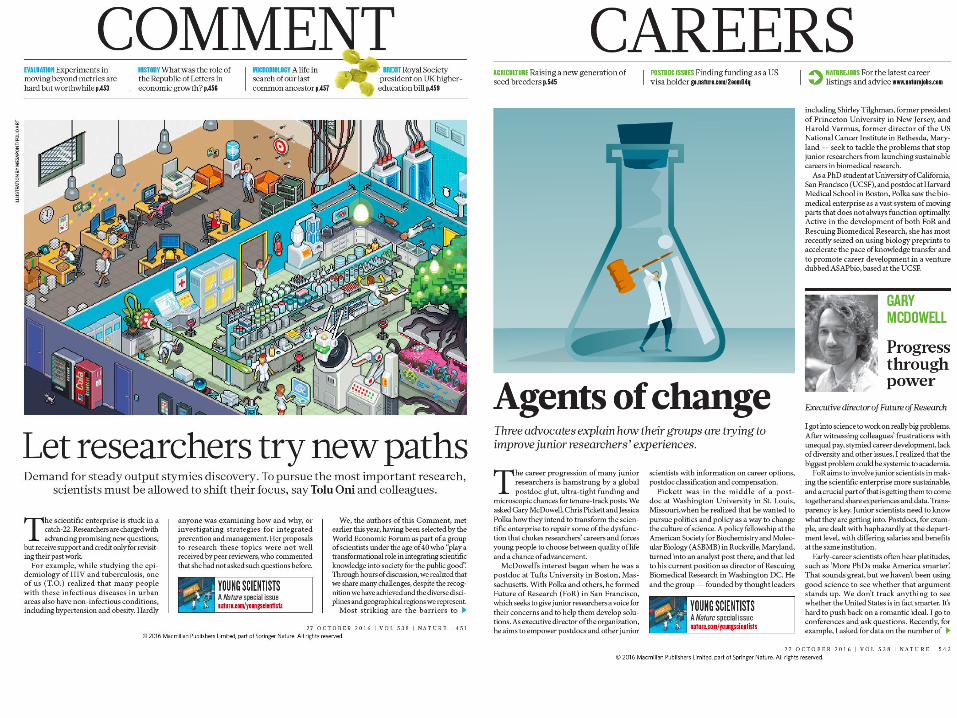
Markets
Invention/
analytical design
Detailed design
& Test
Re-design
& Production
Distribution
& market
Knowledge
Research
Research Agendas
Thematic Mobilization Programmes
Networks of Scientific Cooperation
Knowledge diffusion,
with Intermediaries:
Collaborative Laboratories...
Post-Grad Training
Individual Mobility
NTBF´s
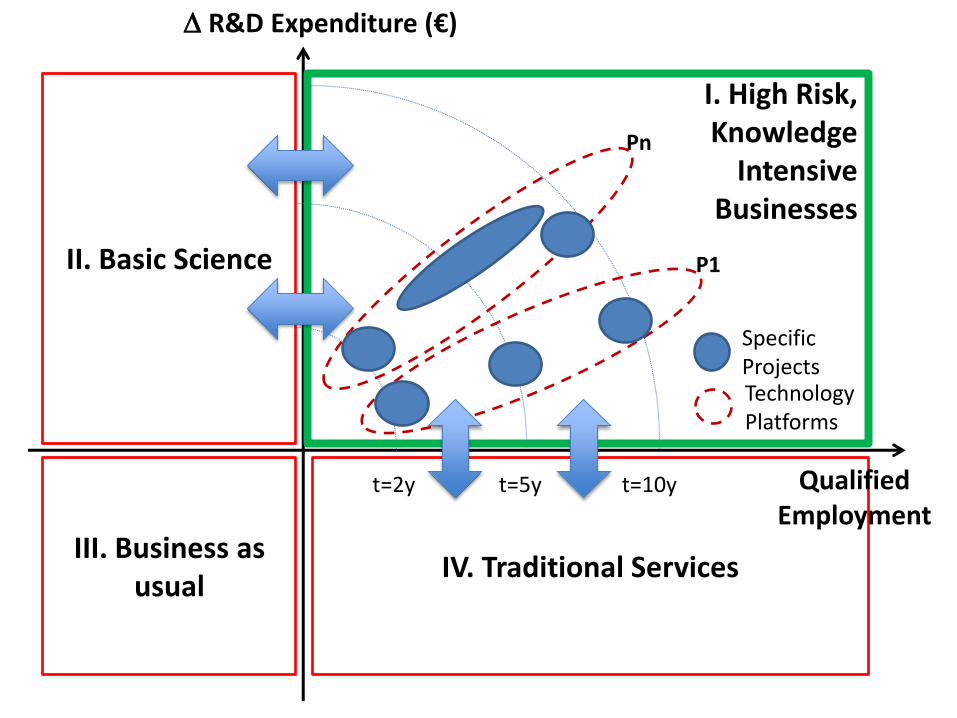
IV. Traditional Services
R&D Expenditure (€)
t=2y t=5y t=10y
Pn
P1 II. Basic Science
Specific Projects Technology Platforms
III. Business as usual
Qualified Employment
I. High Risk, Knowledge
Intensive Businesses

Goal: Open access, Open data, Open sources
Towards “Open science”?
Critical Issues: 1. Funding, recruitment, careers:
• “closed” assessment methods need to be revisied and go away of bibliometrics...
• Low sucess rates need to be avoided, by using “open deadlines” and “two-phase” assessment processes...
• Over valorization of “PIs” should be avoided and “team work” promoted.... • More content, less quantification, across the full processes of assessemnt
and recruitment
2. Open access to publications is still disfunctional... 3. New competencies of researchers in open data are
necessary across all disciplines... 4. Research integrity is to be promoted!
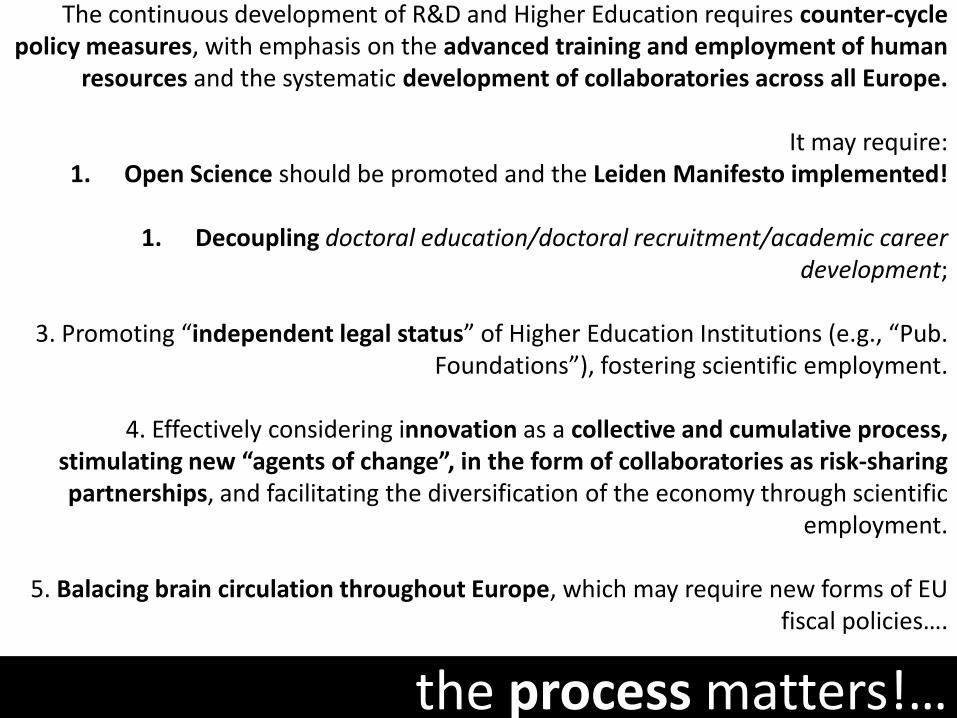
the process matters!…
The continuous development of R&D and Higher Education requires counter-cycle policy measures, with emphasis on the advanced training and employment of human
resources and the systematic development of collaboratories across all Europe.
It may require: 1. Open Science should be promoted and the Leiden Manifesto implemented!
1. Decoupling doctoral education/doctoral recruitment/academic career
development;
3. Promoting “independent legal status” of Higher Education Institutions (e.g., “Pub. Foundations”), fostering scientific employment.
4. Effectively considering innovation as a collective and cumulative process,
stimulating new “agents of change”, in the form of collaboratories as risk-sharing partnerships, and facilitating the diversification of the economy through scientific
employment.
5. Balacing brain circulation throughout Europe, which may require new forms of EU fiscal policies….

…"Science is a battle ground, it's not neutral. And if you know it's not neutral, it
becomes interesting. It can become part of the modern youth culture. You must
choose between generosity and greed, between peace and war, and choose
between disclosing or hiding the truth”…
José Mariano Gago


Annex: Where are we?
Two selected issues: 1. Public and private Expenditure in R&D
2. Population engagement in Tertiary Education

World share of GDP and GERD for the G20 over the last decade (2002-2012); values in %

Science and Innovation in Portugal Source: OECD Science,Technology and Industry Outlook 2012
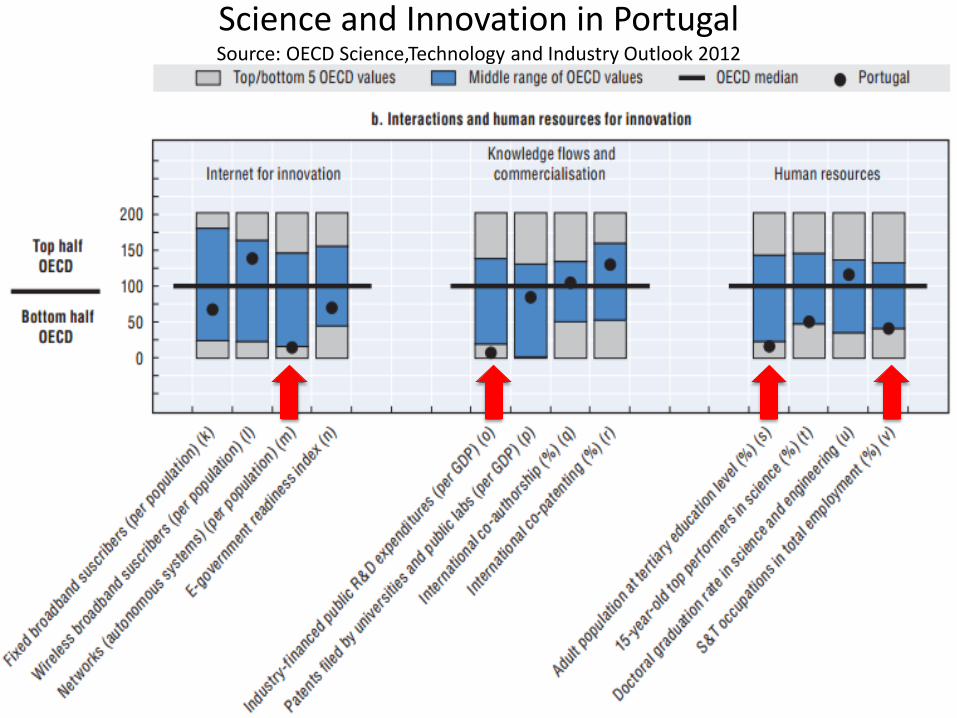
Science and Innovation in Portugal Source: OECD Science,Technology and Industry Outlook 2012
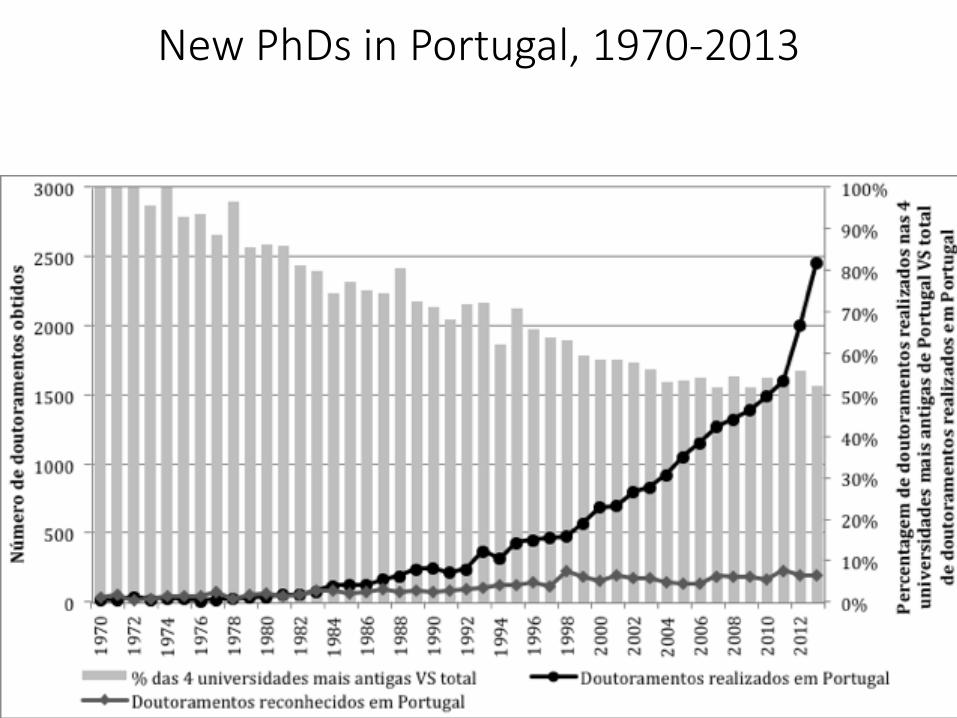
New PhDs in Portugal, 1970-2013

Issue 1: Gross expenditure in R&D 4 last years of divergence with Europe
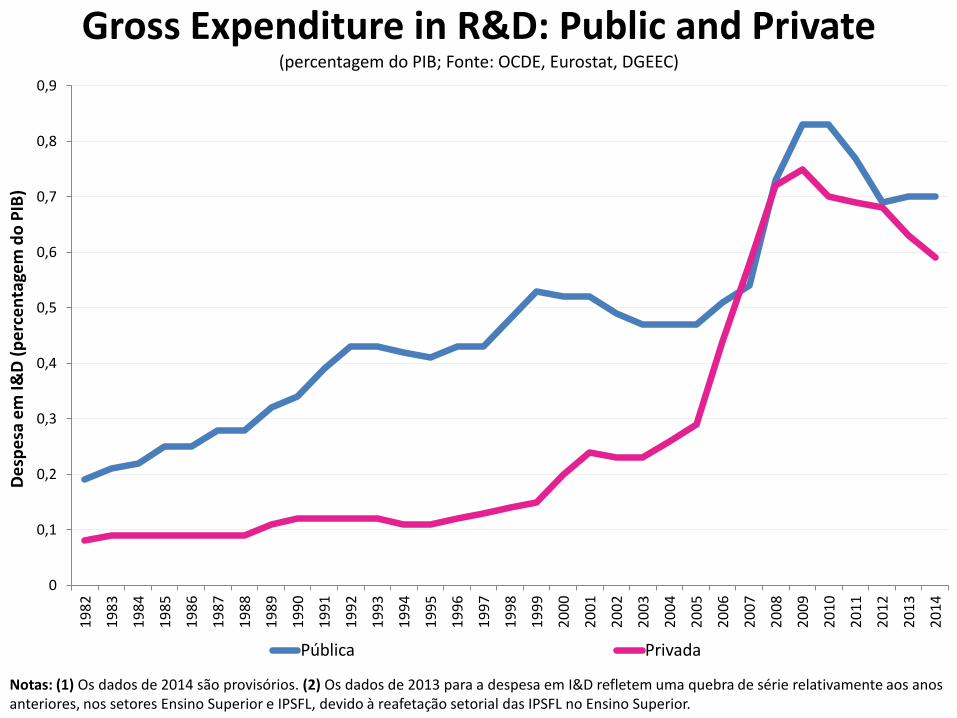
Gross Expenditure in R&D: Public and Private (percentagem do PIB; Fonte: OCDE, Eurostat, DGEEC)
Notas: (1) Os dados de 2014 são provisórios. (2) Os dados de 2013 para a despesa em I&D refletem uma quebra de série relativamente aos anos anteriores, nos setores Ensino Superior e IPSFL, devido à reafetação setorial das IPSFL no Ensino Superior.
0
0,1
0,2
0,3
0,4
0,5
0,6
0,7
0,8
0,9 1
98
2
19
83
19
84
19
85
19
86
19
87
19
88
19
89
19
90
19
91
19
92
19
93
19
94
19
95
19
96
19
97
19
98
19
99
20
00
20
01
20
02
20
03
20
04
20
05
20
06
20
07
20
08
20
09
20
10
20
11
20
12
20
13
20
14
De
spe
sa e
m I&
D (
pe
rce
nta
gem
do
PIB
)
Pública Privada

Share of R&D Expenditure (million Euros, current prices; Source: OCDE, Eurostat, DGEEC)
Notas: (1) Os dados de 2014 são provisórios. (2) Os dados de 2013 para a despesa em I&D refletem uma quebra de série relativamente aos anos anteriores, nos setores Ensino Superior e IPSFL, devido à reafetação setorial das IPSFL no Ensino Superior.
0%
10%
20%
30%
40%
50%
60%
70%
80%
90%
100% 1
98
2
19
83
19
84
19
85
19
86
19
87
19
88
19
89
19
90
19
91
19
92
19
93
19
94
19
95
19
96
19
97
19
98
19
99
20
00
20
01
20
02
20
03
20
04
20
05
20
06
20
07
20
08
20
09
20
10
20
11
20
12
20
13
20
14
De
spe
sa g
lob
al e
m I&
D (
pe
rce
nta
gem
po
r se
cto
r d
e
exe
cuçã
o)
IPSFL Ensino Superior Estado Empresas

Total exports versus R&D accumulated expenditure per capita (millions of U.S. Dollars 2005 constant prices and PPP)
Source: OECD
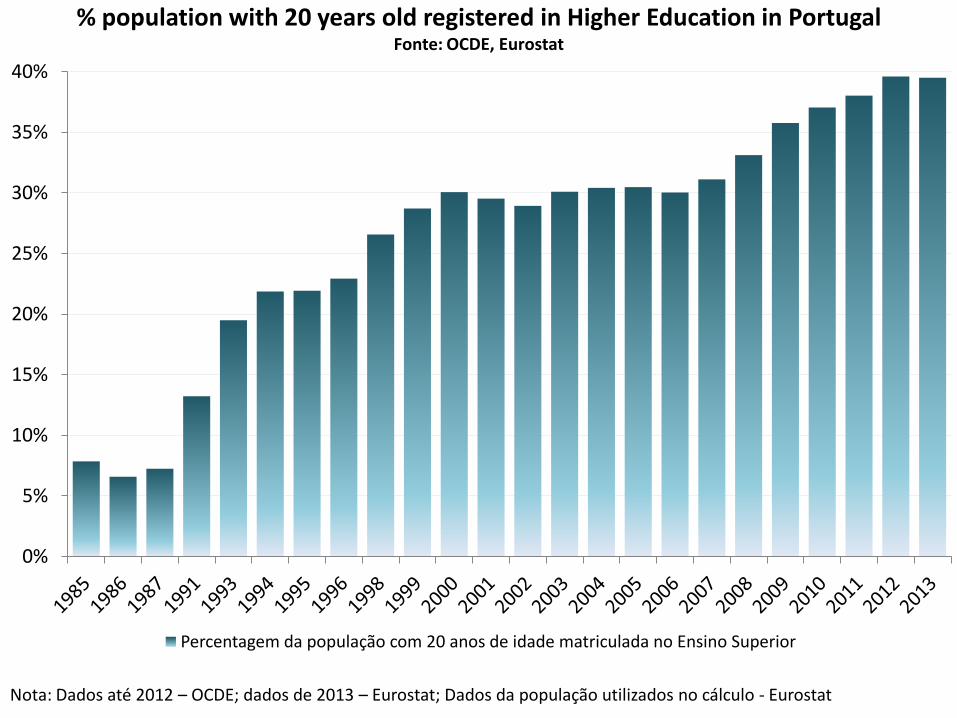
% population with 20 years old registered in Higher Education in Portugal Fonte: OCDE, Eurostat
Nota: Dados até 2012 – OCDE; dados de 2013 – Eurostat; Dados da população utilizados no cálculo - Eurostat
0%
5%
10%
15%
20%
25%
30%
35%
40%
Percentagem da população com 20 anos de idade matriculada no Ensino Superior
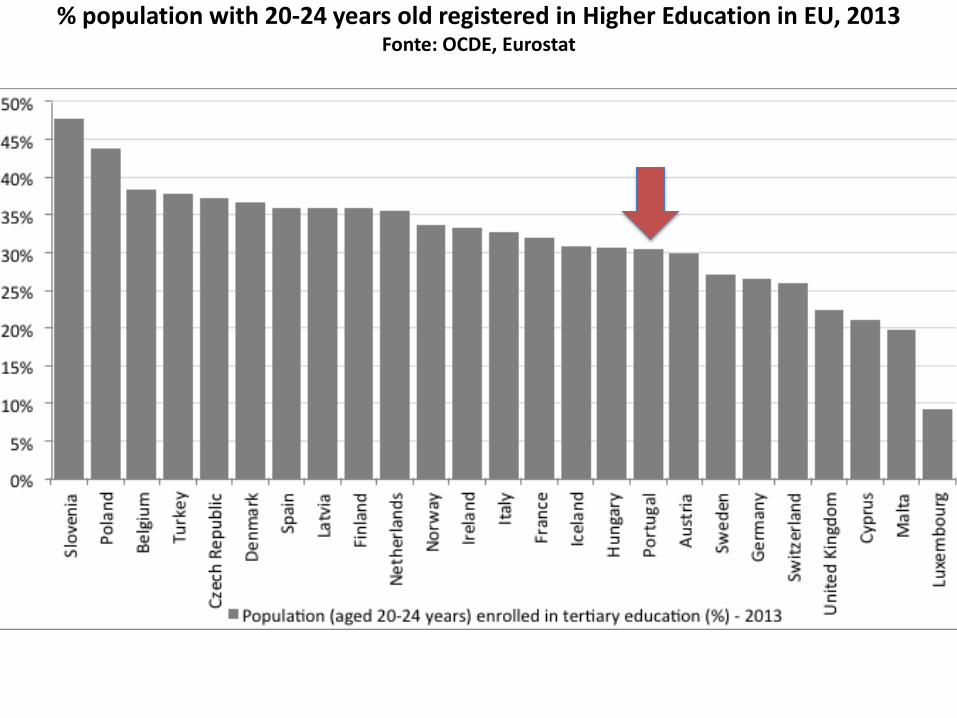
% population with 20-24 years old registered in Higher Education in EU, 2013 Fonte: OCDE, Eurostat
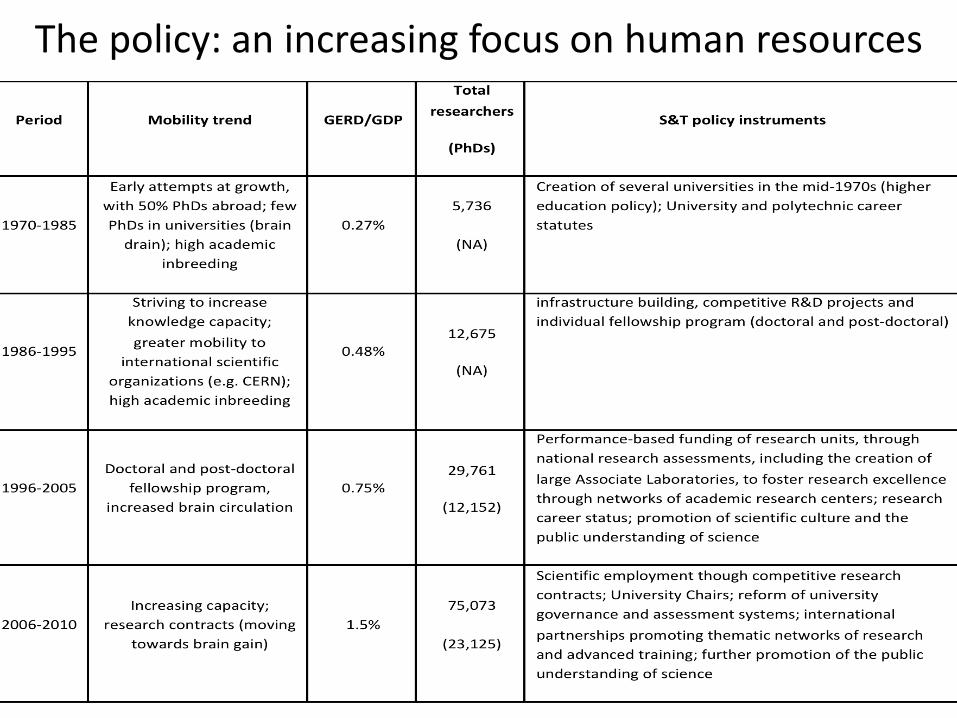
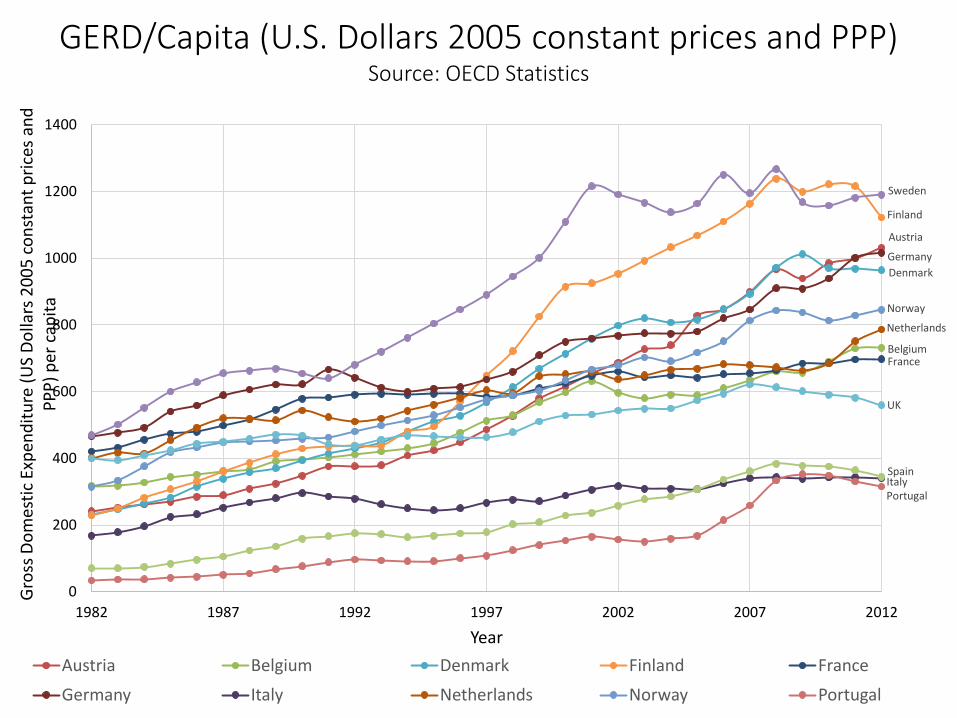
The policy: an increasing focus on human resources
Austria
Belgium
Denmark
Finland
France
Germany
Italy
Netherlands
Norway
Portugal
Spain
Sweden
UK
0
200
400
600
800
1000
1200
1400
1982 1987 1992 1997 2002 2007 2012
Gro
ss D
om
esti
c Ex
pen
dit
ure
(U
S D
olla
rs 2
00
5 c
on
stan
t p
rice
s an
d
PP
P)
per
cap
ita
Year
Austria Belgium Denmark Finland France
Germany Italy Netherlands Norway Portugal
GERD/Capita (U.S. Dollars 2005 constant prices and PPP) Source: OECD Statistics

Gross Expenditure in R&D: Public and Private (Million Euros, current prices; and % GDP)
Fonte: OCDE, Eurostat, DGEEC
Nota: Os dados de 2014 são provisórios.
0
0,2
0,4
0,6
0,8
1
1,2
1,4
1,6
1,8
0
500
1000
1500
2000
2500
3000 1
98
2
19
83
19
84
19
85
19
86
19
87
19
88
19
89
19
90
19
91
19
92
19
93
19
94
19
95
19
96
19
97
19
98
19
99
20
00
20
01
20
02
20
03
20
04
20
05
20
06
20
07
20
08
20
09
20
10
20
11
20
12
20
13
20
14
% G
DP
Mill
ion
Eu
ros,
cu
rre
nt
pri
ces
Milhões de Euros, preços correntes Percentagem do PIB
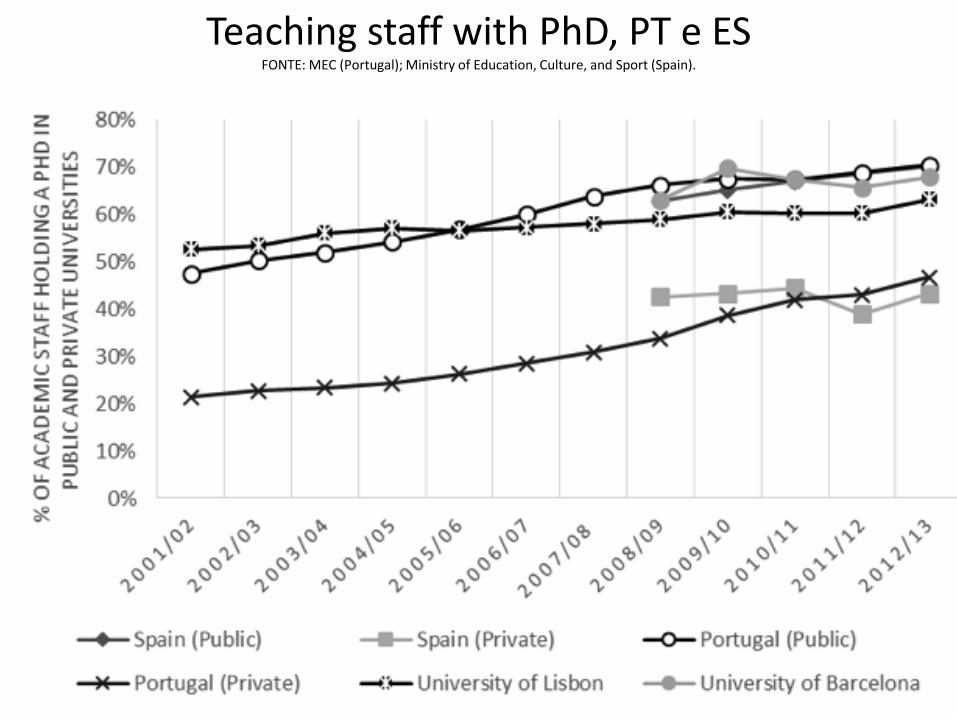
Teaching staff with PhD, PT e ES FONTE: MEC (Portugal); Ministry of Education, Culture, and Sport (Spain).