the dna of a successful company - blue label telecoms · microsoft corporation’s acquisition of a...
TRANSCRIPT

The DNA of a successful
company


For your convenience this Annual Report can be viewed on our website under the Investor Relations link.
www.bluelabeltelecoms.com
Blue Label Telecoms (BLT) and its subsidiary and associate companies (the group) produce and distribute
prepaid secure electronic tokens of value and transactional services.
The group’s prepaid products and service offerings include prepaid airtime and starter packs, prepaid
electricity, bill payments, electronic funds transfers, loyalty programmes, stored value cards, location based
services and other physical and virtual prepaid electronic tokens of value. The group processes in excess of
400 million monthly transactions through several hundred thousand mobile and fixed points of presence.
In South Africa the group has in excess of 120 000 points of presence through which it distributes its
products and services. Beyond South Africa, the group has introduced and is developing mirror images of its
proven business model in a number of emerging markets, including India, Mexico and countries in Africa.
In emerging and developing markets the supply of products and services through prepaid channels has
become a significant mode of distribution. Logistical impediments to the physical distribution of products are
surmounted through virtual delivery technology platforms. As the unbanked market does not have access to
credit, prepaid electronic tokens of value have become the access point to previously unavailable developed
world products and services.

MarchTPC acquires its initial equity stake in Virtual Voucher
MayTPC acquires its initial equity stake in Matragon
Predecessor accounting principles assume that all BLT acquisitionsoccurred on 1 June 2006
FebruaryBLI acquires an indirect initial equity stake in Datacel
MayTPC acquires its initial equity stake in SharedPhone International
Nthwese Investment Holdings Consortium (Pty) Ltd, a BEE Consortium, together with the Public Investment Corporation acquires a 33,33% in BLI
SeptemberBLI launches Blue Label One
JuneBlue Label Investments (BLI) founded by Mark and Brett Levy
after The Prepaid Company (TPC), its primary investment vehicleacquired a national licence to distribute prepaid airtime for Telkom.
Between the formation of BLI and the listing of Blue Label Telecoms (BLT), TPC acquired a range of strategic business investments aligned to the
telecommunications industry, resulting in substantial growth of market share.
Mission statementTo provide world class prepaid
product and service offerings to
consumers within the middle and
lower tiers of the world’s economic
pyramid. We aim to achieve
this through the development
and acquisition of cutting edge
technologies, the expansion of
our global footprint of touch
points and adherence to our core
values of enduring relationships,
entrepreneurship, innovation and
respect.
Vision statementTo become the leading global distributor
of secure electronic tokens of value
and transactional services, including
non-banking value added transactional
services, within emerging and
developing markets.
JuneBLI acquires its initial equity stake in Gold Label,
investment holding vehicle for Oxigen Services India
AugustBLI acquires its initial equity stake in Cellfind
OctoberTPC acquires its initial equity stake in Ventury
TPC acquires its initial equity stake in Kwikpay SA
DecemberBLI acquires its initial equity stake in African Prepaid Services
JanuaryBLT acquires equity stake in Content Connect Africa
MarchBLT acquires Crown Cellular
AprilBLT acquires remaining minority interest in Ventury
POST BALANCE SHEETJune
BLT launches mibliBLT acquires equity stake in Content Connect Australia
Gold Label acquires additional equity stake in Oxigen Services India
JulyBLT sets up joint venture – Blue Label Mexico
September BLT acquires equity stake in Ukash
Mark and Brett Levy at the JSE on 14 November 2007, listing date
AprilTPC acquires its initial equity stake in Activi Technology Services
NovemberMicrosoft Corporation (Microsoft) acquires its 12% equity stake in BLT
Microsoft and BLT sign strategic collaborationand preferred partnership agreements
Prior to listing, BLT restructures, acquiring the majorityof its minority shareholders’ interests
BLT successfully lists in the Telecommunications sector on theMain Board of the JSE Limited
1


our group in briefNature of business 01
Vision and mission 01
Strategic and operational highlights 10
Financial highlights 10
Financial performance 11
Salient features 11
Business overview 12
The evolution of prepaid 13
Product and service offerings 13
Group structure 14
Areas of focus 16
Areas of operation 17
Board of directors 18
Chairman’s report 22
Joint chief executive officers’ report 26
Segmental reviews 32
governance & sustainability
Corporate governance 48
Remuneration report 54
Sustainability report 57
financial statements
Chief financial officer’s report 63
Directors’ responsibility for the financial statements 69
Declaration by company secretary 69
Independent auditors’ report 70
Directors’ report 71
Group balance sheet 74
Group income statement 75
Group statement of changes in equity 76
Group cash flow statement 77
Notes to the group annual financial statements 78
Company balance sheet 120
Company income statement 121
Company statement of changes in equity 122
Company cash flow statement 123
Notes to the company annual financial statements 124
Notice of annual general meeting 134
Explanatory notes to resolutions for consideration
at the annual general meeting 138
Salient features of the forfeitable share plan 139
Proxy form 143
Notes to the proxy form 144
Blue Label Telecoms Limited
(Incorporated in the Republic of South Africa)Registration number 2006/022679/06JSE Code BLUISIN Code ZAE000109088


Any time...

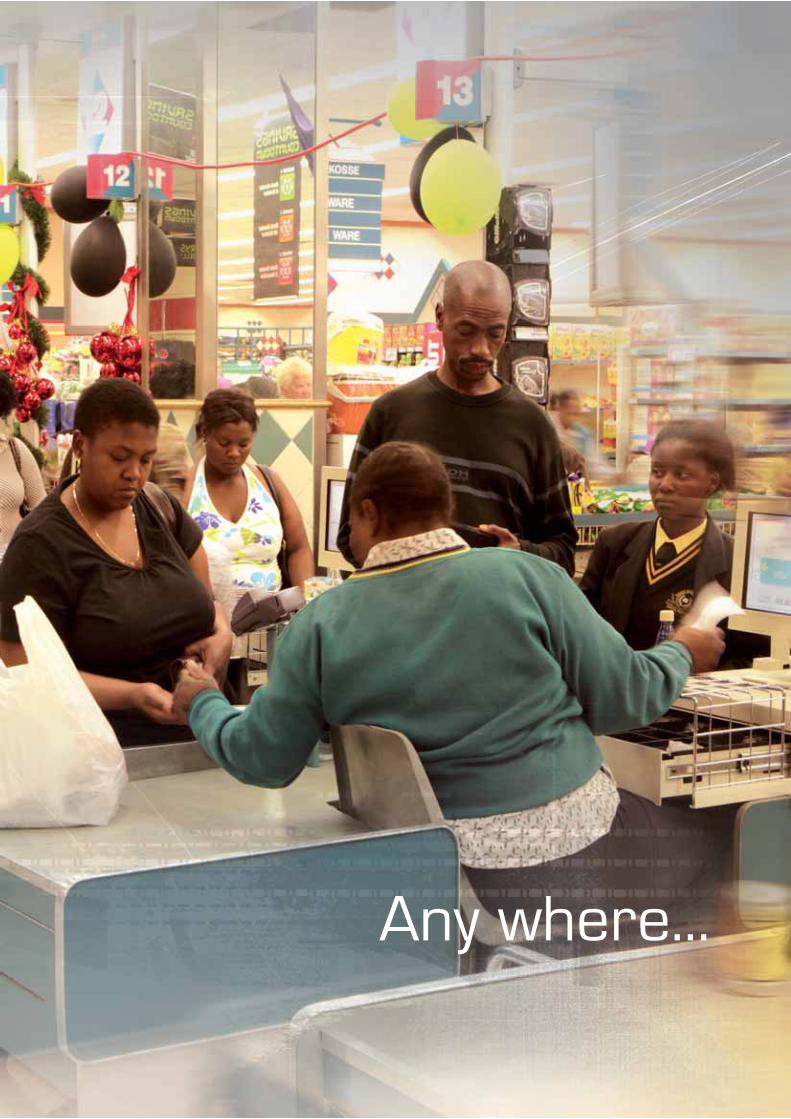
Any where...


Any way...


We’re virtuallyeverywhere!

10
Strategic highlights
Successful listing, capital raising of R1,3 billion
Microsoft Corporation’s acquisition of a 12% equity stake in the group and the conclusion of a strategic
collaboration agreement
Microsoft Corporation’s acquisition of a 38,85% equity stake in Oxigen Services India
Operational highlights
Remuneration, Nomination, Investment, Risk, Audit and Transformation Committees appointed by Board
South African group companies moved to a centralised IT platform after year-end
Created strategic, operational and technical working groups – enhanced synergies, including product
development and IT
Created co-ordinated national sales force
Significant growth in Cellfind’s client base
Delivering on social initiatives including: Let’s Play a Million and SharedPhone
TPC awarded Vodacom’s CEO’s Award for Best Airtime Supplier – second year in succession
Revenue Core earnings per shareCore net profit
R12,93 billion R371 million 48,40 cents
Pro formaActual
Pro formaForecast
Actual Actual Forecast
0
3
6
9
12
15
0
50
100
150
200
250
300
350
400
Pro formaActual
Pro formaForecast
Actual Actual Forecast
0
10
20
30
40
50
Pro formaActual
Pro formaForecast
Actual Actual Forecast
R billion R billion Cents
10

11
Accounting treatments
with minorities
Basis of pro forma preparation
Assumed group listing, restructuring and minority acquisitions occurred on 1 June 2007, therefore:
16,4%increase in pro forma revenue to R12,93 billion
R371 millionpro forma core net profit
Listing cash utilisedto repay borrowings and reduce interest expense
Acquired minority interests for R209 million
Exceeded pre-listing statement forecastsand achieved within trading update range
11

12
Business overviewFounded 2001, listed on JSE (2007)
2008 actual revenue: R12,55 billion
Employees: 1 800
Headquarters: Johannesburg – offices throughout South Africa
Operations: Africa, India, Europe (Latin America and Australia post year-end)
Key shareholder: Microsoft Corp owns 12% of BLT and 38,85% of Oxigen India
Retail points-of-presence: In excess of several hundred thousand
Transactions: ±400 million separate monthly transactions
Clients include: Ackermans, Clicks, Metcash, Mr Price, PEP, PnP, Shoprite, SPAR
Business model Market share
of value and complementary services leveraging off a favourable working capital cycle.
Africa’s total prepaid airtime revenue for the last year is estimated to be R20,3 billion of which R12,2 billion was distributed by group related companies)
Vodacom: 68%; MTN: 18%; Telkom: 10%; and Cell C: 4%
Target market
the world’s economic pyramid
market, in particular unbanked or badly banked consumers
Revenue streams from telecommunication segmentsTrading revenue from sale of e-tokens
As a super distributor of virtual and physical mobile and fixed line prepaid airtime, the group earns a margin on the sale of e-tokens through its wholesale, retail and merchant distribution footprint
The current economic slowdown has seen many postpaid consumers migrate toward prepaid in order to enhance their financial flexibility and control their airtime spend. In general, prepaid consumers are purchasing airtime in lower denominations whilst also benefiting from the variable call discounts recently introduced by the major mobile networks
Trading and annuity revenue from sale of starter packsActivation bonusThe group activates in excess of 200 000 starter packs per month – earning a rebate on each successful activation
Retention revenueIn addition, the group earns ongoing annuity revenue for the life of each starter pack and has successfully introduced loyalty campaigns to decrease the churn on its starter pack base to less than 25% per annum
Revenue streams from subscription based servicesAnnuity revenue from subscription based services
subscription based businesses and customer retention remains a key focus
to new and existing subscriber bases enhances annuity revenue
Interest income
favourable trading terms, generate significant interest income
to its target range of 3% to 6% before 2010.
their current range in the short to medium term
12

13
Future offerings
Ticketing solutions
Electronic funds transferand settlement
Additional prepaidinsurance products
e-wallet systems
Money transfer (cash in and cash out)
Single voucher for multiple products
Prepaid airtime and starter packs
Current offerings
mibli® mobile eco system
Location based services
Stored value cards,loyalty cards
and related programmes
Subscription based servicesand call centres
Bill payment
Prepaid electricity andprepaid insurance
1960 20151960 – 1976Pay Later – Credit
1976 – 1998Pay Now – Debit
1998 – 2015Pay Before – Prepaid
Since 1960, the world has witnessed an evolution in global payment terms with many consumers migrating from Pay Later (Credit) to Pay Now (Debit) to Pay Before (Prepaid). As a leading international distributor of prepaid e-tokens, the group is optimally positioned to take advantage of this ongoing evolution.
13

For further information on this segment please see page 32
This group structure includes only the significant operating entities.
*Acquired post year-end
Telecommunications Distribution
The Prepaid Company (TPC)TPC is a wholesale and retail distributor of virtual and physical prepaid airtime and starter packs. TPC uses proven technology to facilitate the wholesale purchasing, management and delivery of prepaid airtime for its clients, including Ackermans, Clicks, Metcash, Mr Price, PEP, Pick n Pay, Shoprite and other BLT subsidiaries.
Ventury Group is the holding company of Cigicell
Cigicell distributes virtual prepaid airtime and electricity vouchers through a network of POS terminals to BP, Sasol, Shell and a range of independent retailers.
Matragon is the holding company of Comm Express Services (CES)
CES distributes virtual and physical e-tokens (including starter packs) through a broad network of distribution channels including terminals, vending machines and integrated POS devices, directly to consumers through established retail
associations and independent retailers.
Kwikpay SAKwikpay distributes virtual prepaid airtime, electricity vouchers and value-added services through multi-application and managed terminal vending solutions and
integrated POS till points for SPAR, First National Bank, Nedbank and Clicks.
Virtual VoucherVirtual Voucher distributes virtual prepaid airtime through an integrated prepaid
voucher management system to over 500 Engen petroleum sites across South Africa.
Crown CellularTPC also owns Crown Cellular, a wholesale and retail distributor of virtual prepaid
airtime to the informal market.
See page 36
International TelecommunicationsDistribution
Blue Label Telecoms Ltd
Gold Label is a holding company of Oxigen Services India
Oxigen Services India (Oxigen)Oxigen is a virtual distributor of recharge vouchers, prepaid subscriptions and
bill payments, including the electronic distribution of prepaid and postpaid airtime for India’s leading telecommunications operators. Oxigen has over 50 000 touch
points and is the leading virtual distributor of prepaid airtime in India.
Africa Prepaid Services (APS)APS is a distributor of bulk printed physical prepaid products and starter packs. APS is currently active in Mozambique and the DRC and intends to pursue other
opportunities on the African continent.
SharedPhone International (SharedPhone)SharedPhone operates a SIM-card mobile payphone solution that allows vendors
in developing markets to offer consumers access to a public payphone and to vend prepaid airtime and prepaid electricity.
Content Connect Australia (CCAus)*CCAus is an agregator of on-portal and off-portal localised content to mobile
operators and third-party clients throughout Australia.
Blue Label Mexico*The group jointly established Blue Label Mexico with Nadhari S.A. de C.V., a Mexican company with emerging market expertise. Blue Label Mexico is an important step in the group’s goal of creating a distribution network in the emerging markets of
Latin America, one of the world’s largest remittance corridors.
Smart Voucher UK trading as Ukash*Ukash is a developer of proprietary and patented prepaid voucher technology,
allowing for online redemptions. It also provides the group with access to a footprint in Western Europe.
14

See page 44
Other Related Services
See page 40
Technology Platforms
Activi Technology Services (Activi)Activi develops, deploys and supports the group’s technology platforms. Its full
service offering, which is also offered to third party clients, includes:
transactions for many of South Africa’s leading banks, retailers and petroleum companies;
(airtime and electricity);
and self-service vending machines to enhance e-token distribution;
kiosks and vending machines
Blue Label One trading as the Mobile Services Company (MSC)
MSC provides mobile product and service solutions to the group.
Datacel Direct (Datacel)Datacel is a national business process outsourcing (BPO) company operating
inbound and outbound call centres (1 000 seats) that specialise in:
and services to both proprietary and third party databases;
Cellfind SA (Cellfind)Cellfind is the market leader in GSM based location based services (LBS) in South
Africa and has successfully launched the following products and services in conjunction with Vodacom South Africa:
(100 000 Discovery subscribers at 31 May)Cellfind is launching a range of LBS products for MTN South Africa
in mid October 2008.
Content Connect Africa (CCA)CCA is an aggregator of localised content for mobile operators and third-party clients throughout Africa. CCA has acquired exclusive distribution rights and
licence agreements for an array of local and international products and services including: music, entertainment, lifestyle, sports, fashion, news and games content.
CCA also has the exclusive African distribution rights to Prefueled, a kiosk and web-based digital entertainment provider of music, video, games and lifestyle
products that dispenses music via WiFi, Bluetooth, memory card, USB-disk and CD/DVD.
15

The Telecommunications Distribution segment
houses all group subsidiary companies involved
in the distribution of prepaid secure electronic
tokens of value (e-tokens) to South Africa’s
wholesale and retail consumer market.
The International Telecommunications
Distribution segment houses all group
subsidiary and associate companies involved
in the distribution of prepaid secure electronic
tokens (e-tokens) of value within global emerging
and developing markets.
The Technology Platforms segment houses
all companies aligned to the development,
integration and management of the group’s
IT systems, infrastructure
and technology solutions.
The Other Related Services segment houses
all group subsidiary and associate companies
broadly aligned to the South African information
and communication technologies (ICT) industry.
Telecommunications DistributionTelecommunications Distribution
Telecommunications DistributionInternational Telecommunications Distribution
Telecommunications DistributionTechnology Platforms
Telecommunications DistributionOther Related Services
16

We don’t believe in boundaries
Bricks and mortar
Licences
Areas of interest
17

A
B
C
D
E
FG
H
K
J
L
I
18

19
Joint chief executive officer(Born: 1975)
Brett has an impressive entrepreneurial history having founded and operated a number of small businesses from the early 1990s. During his career, Brett has been involved in a wide range of industries, including the distribution of fast moving consumer goods and insurance replacements for electronic goods. His business achievements have seen him secure a number of prestigious nominations and awards, including the ABSA Bank Jewish Entrepreneur of the Year Award (2003) and more recently, the ABSA Jewish Business Achiever Non-Listed Company Award (2007), which he won jointly with his brother Mark Levy. Brett was recently nominated as an Ernst & Young World Entrepreneur SA Finalist for 2007.
Brett LevyA .
Joint chief executive officer(Born: 1971)
BCompt (UNISA)
Mark graduated with a BCompt degree from UNISA in 1993. After initially taking up a position as a commodity trader, Mark decided to pursue his goal of becoming an entrepreneur in earnest and has spent the past several years spearheading Blue Label Telecoms’ impressive growth and international expansion. Together with his brother Brett Levy, Mark recently won the ABSA Jewish Business Achiever Non-Listed Company Award (2007). Mark was recently nominated as an Ernst & Young World Entrepreneur SA Finalist for 2007.
Mark LevyB .
Chief financial officer(Born: 1972)
BAcc (UNISA), CA(SA)
David commenced his articles at Papilsky Hurwitz and in 1999 he joined Merrill Lynch International (UK) as a financial controller. David was employed by Credit Suisse for a brief period before his return to South Africa in 2002. David then became the Financial Director at Integr8IT (Proprietary) Limited prior to his appointment as the chief financial officer for Blue Label Investments (Proprietary) Limited where he contributed significantly to the rapid growth of the Blue Label Telecoms Group. David is a member of South African Institute of Chartered Accountants (SAICA).
David Rivkind C .
Chief operating officer(Born: 1972)
BCom (WITS), BCompt (Hons) (UNISA), CA(SA)
Mark completed his articles with PricewaterhouseCoopers Inc. before moving to the corporate finance department of Mercantile Bank. In 1999 he joined a boutique corporate advisory firm, Nucleus Corporate Finance before joining Blue Label Investments (Proprietary) Limited in 2001. Mark has played an integral role in the new business development and operational management of the Blue Label Telecoms Group and much of its telecommunications footprint can be attributed to his strategic initiatives. Mark is a member of SAICA and the Young Presidents Organisation (YPO).
Mark Pamensky D .
Chairman and independent non-executive director(Born: 1950)
Larry has experienced a long and successful corporate career, both in South Africa and internationally. Larry is a co-founder and former executive director of Investec Bank Limited. He assisted in the creation and strategic development of a number of listed companies such as Capital Alliance Holdings Limited, Super Group Limited, Hosken Consolidated Investments Limited, SIB Holdings Limited and Global Capital Limited. In addition to having served as past chairman on the boards of these aforementioned companies, he is currently the executive chairman of Global Capital (Proprietary) Limited.
Larry has also served on the board of directors of Softline Limited, JCI Limited and Abacus Technologies Holdings Limited. Larry was a former director of the board on a number of non-listed companies, both internationally and locally; namely Stenham Limited (UK) and Prefsure Life Limited (AUS), the Pro Shop Group, Melrose Nissan, SellDirect Marketing (Proprietary) Limited, BCE Foodservice Equipment (Proprietary) Limited and Placo Holdings (Proprietary) Limited. Larry is a respected member of the South African business community and it is anticipated that his strategic vision and experience contributes significantly to the board.
Laurence (Larry) Nestadt E .
19

Non-executive director(Born: 1936)
Sidney served on the board of directors for Ellerine Holdings Limited until his retirement. He is now actively involved in the running of his family business, Ellerine Bros. (Proprietary) Limited, a company involved in the private equity and real estate industry.
Sidney Ellerine F .
Non-executive director(Born: 1958)
BA LLB (WITS)
Neil graduated from the University of the Witwatersrand in 1981 with a BA LLB degree. After completing his articles he was admitted as an attorney in 1983 and as an advocate in 1984. He was appointed as senior counsel by President Mandela in 1998. In 1999 he served as an acting judge. As an advocate Neil specialised in corporate restructures, mergers and acquisitions and was involved in significant corporate reorganisations both locally and internationally. Upon leaving the profession in 2000 he became an executive director of Corpcapital Limited and a member of its corporate finance team.
Neil acted as a corporate finance and strategic legal adviser in a number of local and international transactions. Neil currently advises the boards of directors of a number of listed and non-listed companies on strategic, legal and corporate finance matters. Neil has served on the boards of directors of a number of public and significant non-listed companies.
Neil Lazarus SC I .
Independent non-executive director(Born: 1962)
BProc, LLB (WITS)
Jackie is a practising attorney with the law firm Mkhabela Huntley Adekeye Incorporated. She obtained her BProc and LLB degrees from the University of the Witwatersrand and her Management Advance Programme (MAP) at Wits Business School. Jackie joined Gold Fields of South Africa Limited as a legal adviser in the commercial law department. She subsequently joined Nedbank Limited, where she spent four years.
Jackie has extensive experience in commercial and corporate law, including telecommunications law. She also worked extensively with issues pertaining to low cost housing and advised both the Department of Housing and various other institutions in the housing sector on housing policy issues and their legal aspects. Jackie was recently appointed to the board of Telkom.
Reitumetse Jackie Huntley H .
Non-executive director(Born: 1957)
BBusSci (Hons) (UCT), CIMA, FCMA, CA(SA)
Gary matriculated in 1975 from the South African College School in Cape Town. After graduating from the University of Cape Town in 1979, he qualified as a chartered accountant (SA) in 1982, an Associate of the Chartered Institute of Management Accountants (UK) in 1983 and as a Fellow Chartered Management Accountant (UK) in 1996. After forging a career in merchant banking, Gary was appointed financial adviser to the African National Congress in the early 1990s.
In 1992, he played an instrumental role in the creation of Thebe Investment Corporation and also served as chief executive officer of Msele Corporate and Merchant Bank, South Africa’s first black-controlled merchant bank. Gary was appointed group chief executive officer of Unihold Limited in 1996, where he led the transformation from an engineering conglomerate holding company to an international IT and telecommunications focused group. Subsequent to leading a management buy-out, Unihold de-listed from the JSE. Gary has served on numerous private and public company boards, including three listed banking groups.
Gary Harlow G.
20

Non-executive director(Born: 1964)
BCom (UNIN), HDip Ed (WITS)
Herbert obtained a BCom degree from the University of the North. He currently serves as managing director and chairperson of Nthwese Investment Group and Nthwese Investment Holdings Consortium (Proprietary) Limited. Herbert holds shares and directorships in various businesses operating in the property, engineering, warehousing, logistics, motor dealership and distribution industries. Herbert serves in several business and community forums in South Africa.
Herbert Cedrik Theledi K .
Independent non-executive director(Born: 1965)
BCom (Zululand), BCompt Hons/CTA (UNISA), CA(SA)
Joe qualified as a chartered accountant in 1993. After working for KPMG, he joined Nampak Limited in the capacity of group accountant. In 1996, he co-founded Gobodo Incorporated, an accounting practice with eight other partners and it became the biggest black accounting firm in South Africa at the time. In 1999, he led a management buy-out of Gobodo Corporate Finance from the accounting firm and re-branded it as aloeCap (Proprietary) Limited. He currently serves as the executive chairman of aloeCap. He also serves on the board of directors of non-listed companies where aloeCap Private Equity is invested.
Joe was a member of the Independent Regulatory Board of Accountants Education Committee from 2001 until 2007. He is a member of various professional bodies including the Securities Regulation Panel and SAICA.
Joe Mthimunye J .
Independent non-executive director(Born: 1962)
BComm (Hons) (UNISA), MBL (Master of Business Leadership), Diploma in Investment and Portfolio Analysis
Pani resigned in July 2008 from her position as head of the Isibaya Fund, the private equity arm of the Public Investment Corporation (PIC). Prior to her position at the PIC she worked for several financial institutions, including African Harvest Capital and ABN Amro, where she was employed in corporate advisory services. Pani also spent five years at the Development Bank of South Africa, where she worked in the Project Finance Unit. She currently serves on the board of directors of a number of companies and investment committees.
Lucy (Pani) Manage Tyalimpi L .
Non-executive director(Born: 1970)
BSc (Economics), Minor in Engineering from the University of California, San Diego
Peter began his career at Microsoft in 1995 as a Business and Strategy Analyst for MSN. During this period, he helped transition MSN from an Internet access business to an Internet portal business. He provided analytical and strategic support for several large acquisitions, including Hotmail and WebTV. In 1998, Peter joined the fledgling Windows CE team, where he served as the GPM for Pocket Outlook for the HandheldPC and PocketPC, which would eventually become Windows Mobile. In 2000, Peter left Microsoft to start Sproqit Technologies, where he served as president and CEO for six years. Sproqit’s patented thin-client architecture increased performance and simplified development for mobile applications.
Peter returned to Microsoft in 2006, where, as GM of Strategy and Business Development for the Unlimited Potential Group, he created Microsoft’s emerging markets mobile payment strategy and lead equity investments in Blue Label Telecoms in South Africa and Oxigen Services India in India. Peter currently runs mobile engineering for Microsoft’s emerging market division.
Peter Mansour*
A
B
C
D
E
FG
H
K
J
L
I
*Not present at time of photo
21


Embracingopportunities
Long-termstrategic
relationships
Stronggrowth
potential
Establishedsuper distributorwith favourableworking capital
cycle
Excellentfinancial
performance
Entrepreneurialmanagement
team
Ever-expandingglobal footprint
and productbase
Larry Nestadt – Chairman
23

24
Good trading results and stringent asset and treasury
management have resulted in significant group cash
on hand at year end, leaving the group highly liquid and
well placed to support planned organic growth and
acquisitions.
Microsoft Corporation’s (Microsoft) acquisition of
a 12% equity stake in the group, its acquisition of
a 38,85% equity stake in Oxigen Services India and
the conclusion of a strategic collaboration agreement
between the group and Microsoft were key strategic
highlights for the financial year.
The board is pleased with the significant momentum
already created with Microsoft in a number of strategic
initiatives and the group and Microsoft are firmly on
track to jointly develop innovative products, services
and solutions that will be rolled out across selected
geographies in due course.
The joint Chief Executive Officers’ Report provides
additional detail on this key strategic partnership
as well as providing further insight into the group’s
medium-term goals.
DirectorateI am pleased to welcome Mr Peter Mansour as
Microsoft’s non-executive director on the group’s
board. Mr Mansour’s experience, coupled with his
insight and understanding of both the group and
Microsoft, strategically and operationally, will make
him an invaluable member of the board.
JSE share dealing investigationDuring the year the group was investigated for
contraventions of the JSE Limited (JSE) Listings
Requirements relating to dealings in Blue Label
Telecoms’ shares by directors and their spouses.
The JSE’s investigation subsequently found that
while the company had not contravened any Listings
Requirements, three directors of The Prepaid
Company, a major group subsidiary, had contravened
Rules 3.65, 3.66, 3.71(a) and 3.72 of the JSE Listings
Dear stakeholdersI am pleased to be reporting on a financial period that
culminated in Blue Label Telecoms and its subsidiary
and associate companies (the group) exceeding the
unaudited pro forma and forecast financial information
contained in its pre-listing statement (PLS).
The group’s South African operations performed
above expectations and delivered an excellent
financial performance for the year ended 31 May 2008,
recording a 14,75% increase in actual revenue when
compared to its PLS and 41% when compared to its
predecessor value audited 2007 results.
This significant increase in group revenue equates
to a 25,5% increase in actual net profit and a
16,5% increase in actual basic earnings per share
when compared to the group’s PLS.
While the Chief Financial Officer’s Report provides
greater detail on the group’s overall financial
performance, it is important for shareholders to
note that the group’s pro forma core earnings of
R371 million are viewed as the most appropriate
base from which to measure the group’s current
and future financial performance.
When measured against its pro forma performance,
the group reported a 16,4% increase in pro forma
revenue, a 9,0% increase in pro forma core net profit
and a 5,7% increase in its pro forma core basic
earnings per share when compared to its PLS.
The group’s successful listing on the JSE Limited
raised R1,32 billion in cash which was used to settle
the majority of the group’s borrowings, to buy-out the
balance of the group’s minority shareholders, to settle
shareholder loan accounts and to provide funding
for both organic and acquisitive growth. Since its
listing the group has spent R290 million on strategic
acquisitions, of which R140 million was spent prior
to the financial year-end. The salient details of these
acquisitions appear in both the joint Chief Executive
Officers’ and Chief Financial Officer’s Reports.
24

25
AppreciationOn behalf of the board I would like to thank the group’s
management and staff for their commitment and
hard work over the year. I would also like to thank the
group’s suppliers, customers, business partners,
advisers and shareholders for their ongoing support
as well as my fellow board members for their counsel.
I look forward to being able to report on the group’s
progress, both financially and strategically, a year from
now.
Larry Nestadt
Chairman
Requirements. The salient details of the JSE’s
investigation and the findings of a board appointed
governance committee are provided in the Corporate
Governance section of this report.
Transformation and BBBEEThe board embraces South Africa’s codes on
transformation and broad-based black economic
empowerment (BBBEE) and has tasked a
transformation sub-committee to rapidly develop
framework policies and guidelines in order to
significantly enhance the whole group’s transformation
and BBBEE credentials. The sustainability report
provides further clarity on the implementation of the
group’s transformation initiatives.
ProspectsThe group is financially sound and well positioned
to organically grow its share in the markets in
which it currently operates and to expand its global
transactional footprint. This growth will provide the
group with additional critical mass from which to
diversify its revenue base and product and service
offerings.
The group will continue to develop its range of prepaid
products, value added services and transactional
products and services to improve its ability to generate
revenue, entrench its market share and enhance its
gross margins.
The group is well positioned to expand its global
transactional footprint
25


Mark and Brett Levy – Joint CEOs
The group’s core growth strategy is to gain
integrated access to national distribution
footprints
27

28
The group’s restructure also entailed each subsidiary
company realigning its go-to-market strategy to
accord with the strategic goals of its respective
business segment. During the current review period
each segment’s strategic goals have been further
aligned to the group’s overall strategic direction in
order to promote effective inter- and intra-segmental
collaboration. Further detail on each segment’s
strategy is provided in Segmental Reviews.
Footprint growth The group’s core growth strategy is to gain integrated
access to the national distribution footprints of leading
wholesalers and retailers in order to supply a broad
range of secure e-tokens and transactional products
and services to consumers.
Due to the diverse nature of the group’s local and
international customer base, these distribution
footprints often contain numerous types of touch
points (or points of presence) and include point of sale
(POS) devices, terminals, vending machines, integrated
till points, mobile handsets, web-based solutions and
bulk printing solutions. The group’s in-house technology
platform has developed proprietary software and
technology solutions that allow the group to seamlessly
and “virtually” distribute its proprietary and third-party
product and service offerings across this footprint.
In order to maximise the distribution margin it earns
on the sale of e-tokens, the group also actively rolls out
proprietary distribution footprints in certain sectors of
the South African consumer market.
Distributing more products and servicesIt is the group’s experience that traditionally un-banked,
badly banked and cost-conscious consumers within the
middle to lower economic tiers of the developing world’s
economic pyramid would prefer to transact with first world
prepaid products and services if they can do so using a
mode of payment which is familiar and convenient to them,
namely cash.
To better leverage our existing infrastructure the group
is both designing and trialling its own proprietary cash-
based prepaid products and services.
We are pleased to be reporting on Blue Label
Telecoms’ maiden financial year as a listed company.
The group listed on the Main Board of the JSE Limited
on 14 November 2007 and raised sufficient capital to
settle the majority of its operational and shareholder
debt and to provide the group with funds to implement
its local and international growth initiatives.
It is appropriate to briefly outline the group’s structure,
its core growth strategies and medium-term objectives
in order to contextualise these growth initiatives.
The group was restructured prior to its listing in
order to consolidate both the financial and strategic
objectives of its subsidiaries. The majority of those
subsidiaries had significant minority shareholders who
comprised the subsidiaries’ founding entrepreneurs,
management and employees. At listing, these minority
shareholders converted their equity into the group’s
listed equity. All key management and vending
entrepreneurs have service contracts, restraint of
trade and share lock up agreements which bind them
to the group.
Additional restructuring involved the creation of four
focused segments which house the group’s subsidiaries
and associates in accordance with common business
objectives.
The group’s four business segments are categorised
as follows:
Telecommunications Distribution: This segment
houses all group companies involved in the
distribution of prepaid secure electronic tokens of
value (e-tokens) within South Africa.
International Telecommunications Distribution:
This segment houses all group companies involved
in the distribution of prepaid secure e-tokens within
international emerging and developing markets.
Technology Platforms: This segment houses all
group companies aligned to the group’s IT systems
and infrastructure.
Other Related Services: This segment houses
all group companies broadly aligned to the
South African information and communication
technologies (ICT) industry.
28

29
In these markets, innovative products and services
are expected to be delivered directly to consumers
through transaction-centered interactions,
transforming the retail POS and mobile handset, into
the primary customer touch points. The aim of our
strategic relationship with Microsoft is to develop
technologies that allow a more intelligent interaction
with these customers, and the delivery of targeted
advertising.
Over the past months, the group and Microsoft have
introduced key initiatives to ensure software and system
alignment, enabling the group to begin to fully integrate
into Microsoft Windows Live, a key Microsoft back-end.
This is integral to the group and Microsoft’s recently
launched direct-to-consumer mobile eco-system known
as mibli®, a successful integration of the group’s back
and front-end capabilities coupled to key Microsoft
products and technologies. Salient details of the group
and Microsoft’s direct-to-consumer strategy are
provided in Segmental Review: Technology Platforms.
The group will shortly be launching other products and
services, including innovative retail POS solutions and
services, new transactional and financial products as well
as customer-relevant advertising and loyalty schemes.
These proprietary offerings, which the group will “own”
from source through delivery to final transaction, include
convenience, lifestyle and financial service solutions that
are due to be piloted, trialled and distributed across the
group’s footprint within the next 12-month period.
In addition, the group is pro-actively approaching
third-party suppliers of products that match or can
be converted to a prepaid methodology to establish
distribution agreements. Being able to offer numerous
types of third-party products across our footprint will
provide added revenue streams to retailers as well as
enhanced distribution reach to our third-party suppliers
whilst benefiting the group’s top and bottom line growth.
Microsoft The group’s unique ability to reach and transact with
consumers in a cash-based environment remains
its key differentiator and an important component of
the ten year strategic collaboration agreement with
Microsoft, signed in November 2007. As strategic
partners, the group and Microsoft are actively
engaging in exploring new business opportunities and
preferred partnerships both in South Africa and other
developing economies.
The group will continue to make investments in new
products, technologies and markets, whilst continuing
to drive organic growth in its existing businesses
29

30
The Chief Financial Officer’s Report details the group’s
restructuring and listing, providing insight into how
these corporate actions impacted on the group’s
financial reporting and overall financial performance.
Operating environmentGroup companies within the Telecommunications
Distribution and International Telecommunications
Distribution segments contributed 98% of the group’s
revenue and generated 125% of the group’s profit.
The group does not foresee any material change in its
operating environment and anticipates that these two
segments will continue to be the group’s main revenue
and profit drivers for the forthcoming financial year.
Despite an anticipated global slow down, this segment
continues to experience growing demand for prepaid
airtime.
Strategic acquisitions and investmentsDuring the year management has evaluated a number
of acquisition and investment targets and since listing
has spent R290 million on opportunities, including
increasing its overall stake in current businesses,
which are expected to add significant strategic and
financial value to the group over the next financial year.
Acquisitions material to the group include:
Ventury (additional 10%)
minority shareholders.
Crown Cellular (100%)
re-seller of airtime and starter packs in order to
boost its presence in previously under-represented
wholesale and retail environments.
Content Connect Africa (100%)
is an aggregator of localised content to mobile
operators and third-party clients throughout
Africa and provides the group with direct access
to aggregated content offerings for its direct-to-
consumer strategies.
Medium term objectives The cumulative effect of enhancing the group’s
critical mass – by growing its footprint and increasing
its ability to create end-to-end product and service
offerings – has resulted in the group setting itself the
following medium-term strategic objectives:
consumer strategy;
footprint; and
currently distributes.
As a significant global distributor of prepaid e-tokens,
the group has gained access to a global footprint that
currently numbers in excess of 500 000 touch points
(120 000 in South Africa) across 35 countries.
Combined with its proprietary e-token distribution,
issuing and redemption platforms – which facilitate
the rapid, low-cost, seamless and virtual integration
of numerous product and services into this footprint
– we are confident that over the medium term
the group’s combined value proposition, will see it
transform into a global player in the distribution of
transactional products and services.
Financial highlights We are proud of the group’s excellent financial
performance for the year ended 31 May 2008 and
would like to highlight the following financial measures
for the current review period:
R12,93 billion when compared to the R11,1 billion
forecast in the PLS
R371 million when compared to the R340 million
forecast in the PLS
by 5,7% to 48,40 cents when compared to the
45,81 cents forecast in the PLS
30

31
ProspectsThe group is financially sound, exhibiting strong liquidity,
operating and profitability ratios. We are pleased with
the group’s maiden results and intend to continue to
maintain our entrepreneurial spirit, and the focus on
improving the group’s performance, both operationally
and strategically, in order to provide our shareholders
an acceptable return on their investment.
The group continues to experience significant interest
in its combined value proposition from local and
multinational companies, including retailers and mobile
network operators, and intends to further build upon
its solid foundation in order to grow its global footprint
and suite of e-tokens.
In order to capture the market opportunities
presented by significant consumer demand for cash-
based prepaid products, the group will continue to
make investments in new products, technologies and
markets, whilst continuing to drive organic growth in
its existing businesses into 2009.
AppreciationWe value the ongoing support of our dedicated
employees who strive to make Blue Label Telecoms a
successful and prosperous group and look forward to
them shortly becoming shareholders via the group’s
employee share ownership plan.
In conclusion, we are grateful to our management
team and to the board for its guidance and support.
Mark Levy and Brett Levy
Joint chief executive officers
CNS call centre (80%)
a Bloemfontein-based outbound call centre,
specialising in non-affinity databases and selling an
average of 10 000 policies per month.
Strategic post year-end eventsOxigen Services India (additional 3,85%)
India by 3,85%, making it an equal shareholder
with Microsoft at 38,85%. It is not anticipated
that Oxigen Services India will be profitable by the
group’s next financial year-end because of the
ongoing investment in the rollout of touch points in
India, in accordance with its stated strategy.
Content Connect Australia (50,25%)
has been expanded into Australia through the
establishment of Content Connect Australia.
Ukash (17,25%)
of proprietary and patented prepaid voucher
technology which provides the group with access
to a footprint in Western Europe and its innovative
technology which allows for online redemption
capabilities of multiple products and services
through a single prepaid voucher.
Blue Label Mexico (50%)
de C.V., a Mexican company with strategic and
operational emerging market product and service
development expertise. Blue Label Mexico will
pursue opportunities complementary to the group’s
current areas of business and is an important step
in the group’s goal of creating a transaction-based
distribution network in the emerging markets
of Latin America, some of the world’s largest
remittance corridors.
31

Crown Cellular
The Prepaid Company
Ventury
Matragon
Virtual Voucher
Kwikpay SA
Telecommunications Distribution
The Telecommunications Distribution segment houses
all group companies involved in the distribution of prepaid
secure electronic tokens of value (e-tokens) to South Africa’s
wholesale and retail consumer markets.
Each subsidiary is focused on serving a specific market
segment and develops and deploys tailor-made distribution
solutions that allow end-users to access a broad range of
e-tokens via their chosen delivery device (touch point). Each
channel uses the latest technology standards and well-
defined protocols to make solutions-deployment easier, more
dependable and scalable. The segments distribution devices
currently include:
Supplementary Service Data (USSD);
32

Growing the relative contribution of non-airtime
related products remains a key segmental priority

The
grou
p co
ntin
ues
to f
orw
ard
inte
grat
e in
to it
s ai
rtim
e ve
ndin
g fo
otpr
int.
have
rol
led
out i
n ex
cess
of 7
50
sel
f-ser
vice
ven
ding
m
achi
nes
with
in t
hese
env
iron
men
ts t
o fu
rthe
r en
hanc
e its
abi
lity
to d
istr
ibut
e e-
toke
ns in
line
with
th
e gr
oup’
s ov
eral
l exp
ansi
on t
arge
ts a
nd C
ES’
self-
serv
ice
vend
ing
mac
hine
s ha
ve b
een
deve
lope
d to
cat
er fo
r So
uth
Afr
ica’
s un
ique
req
uire
men
ts.
Alth
ough
the
y ve
nd p
hysi
cal v
ouch
ers,
the
y to
p-up
vi
rtua
lly, n
ever
mis
sing
a s
ale.
In a
dditi
on, d
ue t
o th
eir
robu
st d
esig
n an
d qu
ality
man
ufac
ture
, the
y re
quir
e ve
ry li
ttle
on-
site
mai
nten
ance
.
Key
to
CES
’ suc
cess
rem
ains
its
abilit
y to
sea
mle
ssly
fo
rwar
d in
tegr
ate
the
grou
p’s
e-to
ken
dist
ribu
tion
plat
form
s, fo
r bo
th a
irtim
e an
d el
ectr
icity
, int
o its
pr
opri
etar
y ve
ndin
g m
achi
ne in
fras
truc
ture
.
By
bein
g pa
rt o
f the
gro
up, C
ES b
enef
its fr
om
sign
ifica
nt e
cono
mie
s of
sca
le a
s it
dire
ctly
acc
esse
s:
e-to
kens
;
segm
ent.
By
owni
ng a
sig
nific
ant p
ropo
rtio
n of
the
fo
otpr
int t
hrou
gh w
hich
it v
ends
e-to
kens
, CES
has
been
abl
e to
red
uce
the
mar
gin
it pa
ys
away
to
the
reta
iler
whi
lst s
till a
ddin
g va
lue
by
attr
actin
g fo
otfa
ll in
to t
he r
etai
l env
iron
men
t.
In a
dditi
on, C
ES c
ontin
ues
to p
rovi
de e
nd-to
-end
cu
stom
er a
nd b
usin
ess
spec
ific
man
ufac
turi
ng
and
depl
oym
ent s
olut
ions
for
the
grou
p an
d its
thi
rd-p
arty
cus
tom
ers,
suc
h as
the
whi
te
labe
lling
of s
elf-s
ervi
ce v
endi
ng m
achi
nes
for
sele
cted
clie
nts.
segm
ent i
s a
lead
ing
prov
ider
of s
ecur
e e-
toke
ns t
o w
hole
sale
and
ret
ail c
onsu
mer
mar
kets
in S
outh
A
fric
a.
owne
rshi
p of
its
foot
prin
t – in
clud
ing
inte
grat
ed
gate
way
s, t
ouch
scr
eens
, sel
f ser
vice
ter
min
als
and
vend
ing
mac
hine
s –
in o
rder
to
max
imis
e th
e m
argi
n it
earn
s on
the
dis
trib
utio
n of
its
broa
d ar
ray
of e
-toke
ns.
begu
n to
rol
lout
pro
prie
tary
dev
ices
with
in
sele
cted
sec
tors
of t
he S
outh
Afr
ican
co
nsum
er m
arke
t and
exp
ects
to
have
de
ploy
ed a
t lea
st 5
00
0 b
y th
e en
d of
20
09
.
Self-
serv
ice
vend
ing
mac
hine
sC
omm
Exp
ress
Ser
vice
s (C
ES),
a w
holly
ow
ned
subs
idia
ry, d
istr
ibut
es v
irtu
al a
nd
phys
ical
e-to
kens
(inc
ludi
ng s
tart
er p
acks
) di
rect
ly t
o co
nsum
ers
with
in lo
cal r
etai
l as
soci
atio
n an
d in
depe
nden
t ret
aile
r fo
otpr
ints
. CES
, thr
ough
its
man
ufac
turi
ng
divi
sion
man
ufac
ture
s, d
istr
ibut
es a
nd
mai
ntai
ns t
he g
roup
’s p
ropr
ieta
ry v
endi
ng
mac
hine
infr
astr
uctu
re.
By
the
end
of 2
00
9, C
ES, i
n co
njun
ctio
n
Cas
e st
udy

Contribution to group
95,3%
Telecomm
unications D
istribution
International Telecommunications Distribution
Telecommunications Distribution
Other Related Services
Technology Platforms
103,4%
Actual EBITDAPro forma EBITDA
Telecommunications Distribution
The segments’ product development initiatives are
focused on increasing the types of e-tokens available
to consumers through the group’s footprint of touch
points. Currently, its combined e-token product suite
includes the following products and services:
electricity and prepaid insurance;
The Prepaid Company (TPC)
Wholesale and retail distributor of virtual and
physical prepaid airtime and starter packs. TPC
uses proven technology to facilitate the wholesale
purchasing, management and delivery of prepaid
airtime for its clients, including Ackermans, Metcash,
Mr Price, PEP, Pick n Pay and Shoprite and other
group subsidiaries.
Ventury Group
Ventury is the holding company of Cigicell
Cigicell distributes virtual prepaid airtime and
electricity vouchers through a network of POS
terminals to BP, Sasol, Shell and a range of
independent retailers.
Matragon
Matragon is the holding company of Comm Express
Services (CES).
CES distributes virtual and physical e-tokens (as
well as starter packs) through a broad network of
distribution channels including terminals, vending
Actual RevenuePro forma Revenue
95,3%94,3%
99,6%
34

35
machines and software embedded on integrated POS
devices, directly to consumers through established
retail associations and independent retailers.
Kwikpay SA
Distributes virtual prepaid airtime, electricity vouchers
and value-added services through multi-application and
managed terminal vending solutions and integrated
POS till points for SPAR, FNB, Nedbank and Clicks.
Virtual Voucher
Distributes virtual prepaid airtime through an
integrated prepaid voucher management system to
over 500 Engen petroleum sites across South Africa.
During the financial year, the group acquired Crown
Cellular, a wholesale and retail distributor of virtual
prepaid airtime servicing the informal market. The
group purchased the balance (10%) of Ventury’s equity
from its minority shareholders. Ventury is now a wholly
owned subsidiary.
Performance reviewThe Telecommunications Distribution segment
significantly exceeded its financial targets for the
financial year. This enhanced performance resulted
from strong local demand for prepaid airtime as well
as the recent alignment of group subsidiaries with
specific strategic goals. This strategic alignment has
resulted in organic growth, primarily derived from
subsidiary-specific market sector specialisations and
performance goals, including the sharing of segmental
sales, IT and treasury resources and operational costs.
The creation of market specialisations has improved
the segments’ overall market penetration whilst also
significantly closing market gaps and successfully
identifying new market opportunities. The group’s
robust, scalable and easily deployed distribution and
technology solutions have allowed for the rapid but well
controlled rollout of additional local proprietary touch
points. This has also contributed to growth in the
segment wholesale and retail customer base during
the review period.
The group’s ability to offer its end-users increased
access to numerous e-tokens through an ever
expanding footprint has provided resellers with greater
convenience and availability when accessing products
and services offered by the group. This leads to better
end-user customer retention and loyalty.
Prospects for 2009The Telecommunications Distribution segment
expects to maintain its position as the preferred
provider of e-tokens and multi-application distribution
solutions to wholesale and retail consumer markets
in South Africa. These markets will benefit from the
segment’s aggressive market penetration strategy
that will both enhance end-user access to multiple
technology solution offerings and various new
e-token offerings. Current channel participants are
also expected to benefit from aggressive customer
acquisition and retention programmes as well as
integrated access to other value added products and
services.
Although the segment remains well positioned to
seamlessly deploy new and varied non airtime-related
prepaid products and services into the group’s existing
footprint, growing the relative contribution of non
airtime-related products and services to overall group
revenue and profit remains a key segmental priority
for the forthcoming financial year.
35

Gold Label
Oxigen Services India
SharedPhone International
Africa Prepaid Services
Content Connect Australia
Blue Label Mexico
Ukash
InternationalTelecommunications Distribution
The International Telecommunications Distribution
segment houses all group companies involved in the
distribution of prepaid secure e-tokens of value within
global emerging and developing markets.
The group’s strategic objective is to become a leading
provider of transactional services within global
emerging and developing markets. Replicating the
group’s distribution model in selected international
markets will diversify its revenue and profit streams
over the medium term, provide global mobile and
fixed line network operators, prepaid utility providers
and suppliers of varied e-tokens access to robust,
scalable and easily deployable multi-application
distribution solutions that efficiently facilitate end-
user access to a broad range of e-tokens, via their
chosen delivery device across multiple geographies.
Internationally, the group remains cognisant of the
need to adapt and deploy the most appropriate
distribution methodology and technology solutions
in order to successfully deliver a diverse range of
e-tokens within particular markets. This awareness
has allowed the group to successfully deploy
and integrate its proprietary processing back-
end technologies into many types of third-party
infrastructure such as multiple POS devices, ranging
from mobile phones to terminals, to vending machines
and mainframe enterprise systems.
36

The group will only enter a market with like-minded
local partners

com
pete
cru
mbl
es, l
ivel
ihoo
ds a
nd n
ew jo
b cr
eatio
n dw
indl
es a
nd m
argi
n di
stri
butio
n is
netw
ork’
s ai
rtim
e vo
uche
rs w
ill n
ot s
usta
in h
im.
But
to
equi
p hi
m w
ith t
he a
bilit
y to
ope
rate
a
payp
hone
, sel
l the
air
time
vouc
hers
of s
ever
al
diff
eren
t ne
twor
ks, s
ell u
tility
rec
harg
e vo
uche
rs
such
as
elec
tric
ity, s
ell a
ffor
dabl
e fu
nera
l and
ho
use
cove
r ..
. the
pos
sibi
litie
s st
art
to a
dd u
p to
a
mea
ning
ful,
exte
ndab
le li
velih
ood
with
the
ulti
mat
e op
port
unity
of b
ecom
ing
a ba
nk.
In o
ne y
ear
the
Take
It E
ezi p
roje
ct h
as e
nabl
ed
150
00
jobs
in t
owns
hips
and
rur
al a
reas
aro
und
Sou
th A
fric
a. S
imila
rly
the
proj
ect
has
man
aged
to
prov
ide
750
00
0 m
eals
to
crèc
hes
and
scho
ol-
goin
g ki
ds o
n th
e C
ape
Flat
s la
st y
ear,
all w
ithou
t an
y go
vern
men
t as
sist
ance
.
Beh
ind
the
conc
ept
Exte
nsiv
e tr
avel
and
in-d
epth
res
earc
h ha
s gu
ided
ou
r th
inki
ng a
nd d
istil
led
our
com
mon
pur
pose
: to
mak
e in
divi
dual
s se
lf-su
ffic
ient
.
purp
ose;
we
have
spo
ken
to t
he p
eopl
e on
the
agai
nst
whi
ch b
usin
ess
will
be
mea
sure
d on
e da
y w
ill b
e its
impa
ct o
n po
vert
y in
the
cou
ntri
es w
here
a m
odel
tha
t’s p
urpo
se is
sou
nd b
usin
ess
sens
e fo
r al
l, in
a c
ompe
titiv
e en
viro
nmen
t.
It’s
time
for
com
mun
ity t
o st
art
build
ing
com
mun
ity, r
ight
her
e, r
ight
now
!
Get
ting
the
wor
ld t
o th
e pe
ople
Take
It E
ezi p
roje
ct w
as c
reat
ed t
o pr
ovid
e th
e m
an o
n th
e st
reet
with
the
too
ls a
nd w
here
with
al
to d
evel
op h
is o
wn
busi
ness
, whi
ch n
ot o
nly
prov
ides
him
with
a li
ving
, but
whi
ch a
lso
has
the
pote
ntia
l to
expa
nd e
xpon
entia
lly o
ver
time.
shop
, is
star
ting
to c
lose
its
door
s as
the
big
re
taile
rs m
ove
in o
n th
eir
turf
. As
thei
r ab
ility
to
The
Take
It E
ezi p
roje
ct,
pow
ered
by
Sha
redP
hone
A c
omm
on p
urpo
se: m
akin
g in
divi
dual
s se
lf-su
ffic
ient
...
all y
ou n
eed
is a
goo
d po
siti
on a
nd
frie
nds
to s
uppo
rt y
ou
Cas
e st
udy

Contribution to group
3,1%
InternationalTelecom
munications
Distribution
InternationalTelecommunications Distribution
A cornerstone of the group’s growth strategy is its
ability to rapidly distribute proprietary and third party
e-tokens through a global network of touch points.
International footprint growth remains a key priority,
but the group will only enter a market if the majority
of the following stringent strategic and operational
criteria have been assessed:
communities;
distributor in the territory;
Oxigen Services India (Oxigen)
Oxigen is an IT enabled multi-services platform and
virtual distributor of recharge vouchers, prepaid
subscriptions and bill payments, including the
electronic distribution of prepaid airtime for India’s
leading telecommunications operators. Oxigen has in
excess of 50 000 touch points and is the leading virtual
distributor of prepaid airtime in India.
Africa Prepaid Services (APS)
APS is a distributor of bulk printed physical prepaid
products and starter packs. APS is currently active
in Mozambique and the DRC and intends to pursue
other opportunities on the African continent (excluding
South Africa).
International Telecommunications Distribution
Telecommunications Distribution
Other Related Services
Technology Platforms
Actual EBITDA
Actual Revenue
3,1%
5,5%
Pro forma EBITDA
Pro forma Revenue
3,9%
6,2%
38

39
due to the costs related to the aggressive rollout of
POS devices. Oxigen’s unique value proposition as a
centralised channel for e-tokens which are able to be
conveniently distributed through rural POS devices
has begun to gain significant traction. Although growth
of Oxigen’s footprint has become more structured,
it is not anticipated that Oxigen will be profitable
by the group’s next financial year-end. In the DRC
and Mozambique, APS has grown by developing
its infrastructure and joint distribution channels,
evidenced by month-on-month growth in total starter
pack connections.
Prospects for 2009Subsidiary and associate companies within the
International Telecommunications Distribution
segment are strategically aligned to consolidating
the group’s footprint in certain existing markets
and aggressively growing its footprint across two
geographic areas.
Africa
Following a period of consolidation, the group expects
new pan-African telecommunications operators
to emerge within the next 36 months, providing
further scope for the group to leverage its strategic
relationships and deployment methodologies to grow
its African footprint through which to distribute
e-tokens.
Latin America
Many Latin American countries don’t currently cater for
“super” distribution channels that provide combined
access to multi-application distribution solutions and a
single source of varied e-tokens. The formation of Blue
Label Mexico, in conjunction with experienced local
operators, will position the group to rapidly deploy its
footprint and distribute e-tokens to the whole region.
In conclusion, increased distribution of the group’s full
e-token product and service suite through its growing
global footprint is expected to generate additional
revenue and profit.
SharedPhone International (SharedPhone)
SharedPhone operates a SIM-card mobile payphone
solution that allows vendors in rural areas – including
other African countries – to offer consumers access to
a public payphone and also vend prepaid airtime and
prepaid electricity.
Content Connect Australia (CCAus)
In order to enter the mature and established Australasian
market, the group established, together with a local
partner, Content Connect Australia, an aggregator of
localised content to mobile operators and third-party
clients throughout Australia. The group will leverage
its investment by increasing the range of e-tokens it
distributes in Australia within the forthcoming year.
Post year-end eventsOxigen
The group increased its stake in Oxigen, its Indian
associate by 3,85%, equalling Microsoft’s 38,85%
shareholding.
Ukash
A developer of proprietary and patented prepaid cash
voucher technology; provides the group with access
to a footprint in Western Europe and its innovative
technology which allows for online redemption
capabilities of multiple products and services through
a single prepaid voucher.
Blue Label Mexico
The group jointly established Blue Label Mexico with
Nadhari S.A. de C.V., a Mexican company with strategic
and operational emerging market product and service
development expertise. Blue Label Mexico will pursue
opportunities complementary to the group’s current
areas of business and is an important step in the
group’s goal of creating a transaction-based distribution
network in the emerging markets of Latin America, one
of the world’s largest remittance corridors.
Performance reviewWithin the International Telecommunications segment,
the loss from Oxigen of R19,6 million was predominantly
39

Activi Technology Services
Mobile Services Company
Technology Platforms
The Technology Platforms segment houses all group
companies aligned to the development, integration and
management of the group’s IT systems, infrastructure
and technology solutions. The group’s technology
solutions include business-to-business technology
solutions and direct-to-consumer technology solutions.
Business-to-business technology solutionsActivi Technology Services (Activi)
Develops, deploys and supports the group’s technology
platforms through two subsidiaries:
Its full service offering, which is also offered to
third-party clients, includes:
transactions for many of South Africa’s leading banks,
retailers and petroleum companies;
(airtime and electricity);
printing devices and self-service vending machines to
enhance e-token distribution;
POS terminals, kiosks and vending machines.
40

Development of the group’s e-token has allowed the
segment to evolve into a value added solutions provider

Rol
lout
l
ogis
tics
– c
onfig
ure
Lott
o te
rmin
als
and
dist
ribu
te t
o te
chni
cal t
eam
s;in
stal
l ter
min
als
on n
atio
nal b
asis
;in
stal
l sho
p fit
ting
and
issu
e co
nsum
able
s; a
nd
tes
t th
e te
rmin
al a
nd s
ign-
off.
Sup
port
and
han
dove
r o
ngoi
ng o
nsite
ope
ratio
nal s
uppo
rt;
sca
le d
own
rollo
ut;
tes
ting
of r
egio
nal a
nd n
atio
nal r
etai
l net
wor
k;
and
fin
al p
repa
ratio
n to
go
live.
Ope
rati
ons
initi
ate
prev
enta
tive
mai
nten
ance
pro
cedu
res;
m
anag
e ne
w L
otto
inst
alla
tions
and
ca
ncel
latio
ns;
sw
ap L
otto
dev
ices
;in
itiat
e te
rmin
al r
efur
bish
men
ts; a
nd
man
age
term
inal
upg
rade
s or
dow
ngra
des.
Iden
tific
atio
n, t
rain
ing
and
hand
over
to
Gid
ani’s
op
erat
ing
team
s
Act
ivi’s
nat
iona
l rol
lout
pla
n w
as b
ased
on
thre
e to
fiv
e,4
0 m
inut
e in
stal
latio
ns, p
er t
wo
man
tea
m,
per
day.
From
Feb
ruar
y to
Apr
il 2
00
7, 1
02
Act
ivi
team
s su
cces
sful
ly d
eplo
yed
76
52
new
Lot
to
peri
od 6
84
ton
s of
ele
ctro
nic
equi
pmen
t w
as
hand
led
and
trac
ked
18tim
es fr
om m
anuf
actu
rer
to r
etai
ler.
In a
dditi
on, A
ctiv
i suc
cess
fully
fiel
ded
clos
e to
3
00
00
ons
ite fi
eld
supp
ort
calls
unt
il M
ay 2
00
8,
whe
n G
idan
i’s fu
lly t
rain
ed in
-hou
se m
aint
enan
ce
team
s as
sum
ed fu
ll op
erat
iona
l con
trol
ove
r its
Lo
tto
term
inal
s an
d in
-sto
re m
erch
andi
sing
.
Act
ivi’s
pri
mar
y re
spon
sibi
litie
s in
clud
ed:
the
tra
nspo
rtat
ion
of L
otto
ter
min
als,
from
the
re
gion
al o
ffic
es t
o m
erch
ant;
the
inst
alla
tion
and
com
mis
sion
ing
of L
otto
’s
term
inal
; t
he a
ssem
bly
and
plac
emen
t of
Lot
to’s
sta
nd
and
mer
chan
dise
; t
erm
inal
tes
ting
and
inst
alla
tion
sign
-off
ini
tial o
pera
tiona
l and
fiel
d su
ppor
t; an
d p
hase
2 h
ando
ver
to G
idan
i’s m
aint
enan
ce
team
s.
Act
ivi e
xecu
ted
the
rollo
ut in
five
pha
ses:
Pre
-rol
lout
d
esig
n of
the
rol
lout
“sy
stem
” –
pro
cedu
res
and
tech
nolo
gy;
acq
uire
“eq
uipm
ent”
req
uire
d fo
r ro
llout
; r
ecru
it an
d tr
ain
rollo
ut t
eam
s; a
nd
rou
te a
nd lo
gist
ics
plan
ning
.
Act
ivi T
echn
olog
y S
ervi
ces
(Act
ivi)
–
Suc
cess
ful n
atio
nal r
ollo
ut o
f nea
rly
80
00
Lot
to t
erm
inal
s
In 2
00
6, t
he N
atio
nal L
otte
ry B
oard
aw
arde
d G
idan
i a s
even
yea
r te
nder
to
man
age
the
runn
ing
of S
outh
Afr
ica’
s na
tion
al L
otte
ry. I
n D
ecem
ber
20
06
, G
idan
i app
oint
ed A
ctiv
i to
assi
st it
wit
h th
e ro
llout
and
init
ial m
aint
enan
ce o
f new
Lo
tto
mac
hine
s ac
ross
S
outh
Afr
ica.
Cas
e st
udy

Contribution to group
0,2%
TechnologyP
latforms
Technology Platforms
Direct-to-customer technology solutionsBlue Label One, trading as the Mobile Services
Company (MSC)
MSC provides mobile product and service solutions
to the group’s direct-to-consumer and business-to-
business channels. MSC, in conjunction with Microsoft,
recently launched mibli, its first mobile public offering.
mibli is a mobile eco-system combining numerous
services into one “on-phone” application supported by
an array of shared back-end components. MSC has
developed a number of revenue channels for mibli,
these include: unique targeted advertising, premium
services and e-products, airtime sales, partner
placement and white-labelled services.
mibli users can instantly access:
solution with powerful social community
features;
the group’s transactional back-
end infrastructure, hosted and
provisioned by Activi, which allows
for the purchase and delivery of
e-products such as airtime top-up,
direct loyalty rewards, bill payments,
ticketing and content-centric services;
International Telecommunications Distribution
Telecommunications Distribution
Other Related Services
Technology Platforms
EBITDA
Revenue
0,2%0,2%
(3,0%)
Pro forma EBITDA
Pro forma Revenue
42
(2,8%)

43
Prospects for 2009The Technology Platforms segment will continue
to focus on developing, deploying and supporting
commercially viable and functionally rich transaction
engines, providing end-to-end customer and business
specific technology solutions for the group and its
third-party customers.
2009 will see further segmental investment in software
development, business intelligence, Enterprise
Resource Planning systems and service orientated
architecture technologies.
The segment’s main focus for 2009 will remain the
development of group IT infrastructure, the creation
of proprietary products and services and the ongoing
integration and enablement of the group’s wholesale
and retail footprint.
In conclusion, the ongoing standardisation of system
deployments and the optimisation of group-wide
technology investments, through the sharing of group
IT infrastructure, are expected to significantly enhance
the segment’s economies of scale.
music, travel and weather etc;
banner adverts to elective full-page and text adverts.
MSC is uniquely positioned to leverage the group’s
distribution channels and transactional experience with
mibli’s unique wallet-based financial and transactional
service offerings.
Performance reviewThe Technology Platforms segment has delivered
pleasing results for the financial year. The segment’s
focus on consolidating the group’s existing IT systems
into a best of breed, stable and robust platform and
the enhancement of its ability to integrate and enable
third-party technologies has significantly entrenched
the group’s overall standing within the secure e-token
and transactional product and services sector.
The ongoing development and customisation of the
group’s e-token, PIN generation and redemption
platform has allowed the segment to evolve into a
customer centric value added solutions provider,
well placed to meet current group and third-party
requirements and to respond appropriately and
timeously to new market developments. The segment
is committed to providing open platform technology
solutions where possible and ensuring that customers
are retained through superior client service.
A key achievement for the review period remains the
successful standardisation and packaging of complex
platforms into standard products that will enhance
the group’s speed to market and ability to aggressively
deploy its footprint within new emerging and developing
markets.
43

Datacel Direct
Cellfind SA
Content Connect Africa
Other RelatedServices
The Other Related Services segment houses all
group companies broadly aligned to the South
African information and communication technologies
(ICT) industry. The group’s focus on forward
integrating its supply chain has resulted in this
segment being able to create end-to-end solutions
(from source, through transaction to final delivery)
for both group companies and third-party clients.
Across its current subscription-based businesses,
the group controls access to its proprietary
databases, location based services (LBS) and
aggregated content.
Datacel
Datacel is a national business process outsourcing
(BPO) company operating inbound and outbound call
centres (1 150 seats) that specialise in:
financial sector products and services to both
proprietary and third-party databases;
technical support; and
behalf of major retail chains.
Datacel’s key customers currently include: ACE,
Avusa, Hollard, Metropolitan Life, Pick n Pay, RCS and
Vodacom South Africa.
44

The segment is well positioned to grow its location based services and aggregated
content subscriber bases
45

boyf
rien
d) w
ere
tryin
g to
con
tact
her
. She
arr
ange
d to
mee
t her
fath
er a
nd b
oyfr
iend
at t
he n
eare
st
petr
ol s
tatio
n. A
fter
a w
hile
, her
mot
her
and
brot
her
also
arr
ived
to
find
out i
f she
was
in n
eed
of a
nyth
ing.
Sh
e w
as v
ery
luck
y to
get
aw
ay u
nhar
med
, but
was
ve
ry s
hake
n up
by
the
expe
rien
ce.
Look
4he
lp.
No
othe
r em
erge
ncy
serv
ice
was
as
inst
anta
neou
s an
d he
lpfu
l – t
he S
AP
S o
nly
resp
onde
d to
the
so m
uch
mor
e to
com
e to
you
r re
scue
, and
by
know
ing
your
loca
tion
they
hav
e th
e ab
ility
to
do
som
ethi
ng a
bout
you
r pr
edic
amen
t.
*N
ame
has
been
cha
nged
Look
4m
e is
a t
rack
ing
serv
ice
that
allo
ws
cellp
hone
use
rs
to t
rack
oth
er c
ellp
hone
use
rs, p
rovi
ded
cons
ent
has
been
gra
nted
. Loo
k4m
eW
AP
or
the
Inte
rnet
.
Look
4he
lp is
a v
oice
-free
pan
ic b
utto
n th
at a
llow
s th
e us
er t
o se
nd a
dis
tres
s m
essa
ge in
clud
ing
his/
her
loca
tion
to u
p to
four
pre
-spe
cifie
d ce
ll nu
mbe
rs. U
pon
spee
d-di
al, a
nd h
e/sh
e ca
n re
st a
ssur
ed t
hat
som
eone
w
ill b
e no
tifie
d of
the
ir lo
catio
n in
an
emer
genc
y.
spre
ad o
ut a
cros
s th
e ro
ad. S
he p
anic
ked,
kn
owin
g th
at t
his
is a
com
mon
hi-j
acki
ng t
actic
. S
he d
idn’
t w
ant
to s
low
dow
n or
sto
p, b
ut t
here
w
ere
too
man
y ob
stac
les
stre
wn
acro
ss t
he
did
was
try
to
dial
112
and
rep
ort
her
situ
atio
n.
She
look
ed u
p, t
here
was
a g
un-w
ield
ing
hija
cker
kn
ocki
ng o
n he
r w
indo
w a
nd s
hout
ing
at h
er t
o ha
nd o
ver
her
mob
ile p
hone
.
pres
sed
her
foot
dow
n ha
rd o
n th
e ac
cele
rato
r an
d sp
un a
way
from
the
scen
e, d
ecid
ing
that
a d
amag
ed
car
is a
sm
all p
rice
to
pay
for
your
life
. Att
he s
ame
time,
she
pre
ssed
the
Loo
k4he
lp p
anic
but
ton
(spe
ed d
ial o
n he
r m
obile
pho
ne),
thin
king
tha
t it
may
be
her
only
cha
nce
of b
eing
res
cued
from
thi
s or
deal
sho
uld
she
not b
e ab
le t
o ge
t aw
ay.
Seco
nds
late
r, th
e re
cipi
ents
of h
er d
istr
ess
Look
4he
lp
Dia
nne
Pea
rson
* fr
om W
elte
vred
en
Par
k, a
Loo
k4he
lp s
ubsc
ribe
r, ph
oned
Cel
lfind
’s C
lient
Ser
vice
s an
d ex
plai
ned
how
the
pro
duct
ha
d he
lped
her
in h
er t
ime
of n
eed.
Cas
e st
udy

Contribution to group
1,4%
Other R
elated Services
Other RelatedServices
Cellfind SA
Cellfind is the market leader in GSM based LBS in
South Africa and has successfully launched the
following products and services in conjunction with
Vodacom South Africa:
31 May) and Look4help (415 301 Vodacom
subscribers at 31 May);
31 May).
Cellfind is in the process of launching a range of LBS
products for MTN South Africa.
Content Connect Africa (CCA)
CCA is an aggregator of on-portal and off-portal
localised content for mobile operators and third
party clients throughout Africa. CCA has acquired
exclusive distribution rights and licence agreements
for an array of local and international products and
services including: music, entertainment, lifestyle,
sports, fashion, news and games content. CCA has
the exclusive African distribution rights to Prefueled,
a kiosk and web-based digital entertainment
provider of music, video, games and lifestyle
products that dispenses music via WiFi, Bluetooth,
memory card, USB-disk and CD/DVD.
International Telecommunications Distribution
Telecommunications Distribution
Other Related Services
Technology Platforms
EBITDA
Revenue
1,4%
12,9%
Pro forma EBITDA
Pro forma Revenue
14,7%
46
1,6%

47
providing consumers with focused, genre based
music content;
weather notifications; and
targeted at corporate and SMME customers.
In addition, the imminent launch of MTN’s LBS product
and service offering will significantly enhance Cellfind’s
subscriber base, both growing its market share and
leveraging its fixed cost base.
Datacel’s innovative offerings and national reach are
expected to ensure the retention of current customers
and acquisition of future customers. Coupled to a solid
annuity revenue base, the company is well positioned
for future growth.
As part of its African expansion strategy, CCA is
currently signing new, independent artists with strong
local and regional appeal. Prefueled, in association
with several key partners will be merchandised
throughout key locations across South Africa.
In conclusion, the relative contribution from
proprietary and third-party database telemarketing,
subscriber-based LBS and aggregated content to the
group’s revenue, is expected to grow significantly.
Performance reviewSignificant contributors within the Other Related
Services segment at all levels are Datacel and Cellfind.
A strategic decision was made to substantially increase
the number of seats in the call centre operations due
to the expansion of products and services through this
medium.
The cost pertaining thereto impacted to a degree
on managements’ original expectations for their
performance for the year.
Having said this, the resultant foundation that has
been built has manifested itself positively post the
balance sheet period.
Cellfind remains a steady profit contributor with a
continued increase in its subscriber base from month
to month.
Customer retention is vital in subscription-based
business models and both Datacel and Cellfind have
focused on improving their customer service levels,
new product development and sales and marketing
efforts during the review period.
Key acquisitions during the financial year have resulted
in Datacel becoming a significant BPO business with
the critical mass, diverse business focus and specialist
skills required to attract and secure key national
blue-chip customers.
Prospects for 2009The Other Related Services segment is well
positioned to grow its LBS and aggregated content
subscriber bases. Whilst Cellfind remains focused on
retaining and growing its current Vodacom subscriber
base, its enhanced product and service offerings will
soon include:
traffic flow and camera information and traffic fine
information and payment;
47

48
As a newly listed entity the group has embraced the
challenge of transforming from a privately owned
company into a publicly listed organisation whilst
maintaining a balance between its inherent
entrepreneurial culture and the stringent
requirements of the regulatory listed environment.
During the first seven months of being a publicly listed
entity governance processes became a greater focus
of the business with wider accountability and increased
monitoring. The corporate governance structure will
evolve with the corporate development of the group to
align with emerging best practices in South Africa and
abroad.
Governance approach and complianceThe company subscribes to the governance principles
of the King Report on Corporate Governance – 2002
(King II) and is developing its governance structure,
policies and procedures in line with best practice and
the guidelines as contained in the Code of Corporate
Practices and Conduct forming part of King II. The
directors recognise the need to conduct the group’s
business with integrity and according to sound
corporate governance principles. During the first
seven months of being a publicly listed entity certain of
the key aspects of the recommendations of King II
have been implemented, but the company
acknowledges that it is not in full compliance with all
material aspects of King II. These areas are highlighted
below in line with the “comply or explain” principle.
Key governance targeted milestones for 2009 include:
further improvement in reporting processes to the
board, its committees and executive committee;
annual director performance assessment;
annual board effectiveness assessment;
introduction of a corporate approval framework;
development of a corporate code of ethics; and
implementation of a corporate governance protocol
that will allow the group to apply for formal
certification of conformance to governance best
practices.
rollout of internal audit plan, processes and the
resultant recommendations.
formalisation of the documentation and
consideration of business risks.
The governance structure of the group is summarised
below:
Board structure and related matters
Board’s function and responsibilitiesThe board is the driving force of the company’s
corporate governance system and remains ultimately
accountable and responsible for the performance and
affairs of Blue Label Telecoms. The board’s primary
responsibilities include determining the company’s
purpose and values and giving strategic direction to
the company, identifying key risk areas and key
performance indicators of the company’s business,
monitoring the performance of the company against
agreed objectives, advising on significant financial
matters and reviewing the performance of executive
management against defined objectives and, where
applicable, industry standards.
The board has adopted a charter that defines its role
and composition, the composition and role of board
committees, proceedings at meetings as well as
director induction.
Having regard to its role set out in the charter, the
board considers the following as key issues when
providing strategic direction to the company:
approving specific financial objectives, including
budgets, and non-financial objectives and policies
proposed by management;
overseeing the company’s performance against
agreed targets and objectives;
reviewing the management of business risk;
reviewing investment, capital and funding proposals
reserved for board approval in terms of the
delegation policy set out in the board charter.
approving, on recommendation of the remuneration
and nomination committee, succession plans in
respect of key positions within the company; and
providing leadership and vision in a way that will
enhance value and ensure the long-term
organisational health of the company.
The board charter will be reviewed annually to ensure
its continued compliance with local and international
best practice and changes in the South African
regulatory environment.

49
CompositionBlue Label Telecoms is headed by a unitary and
effective board that leads and controls the company.
The board comprises 13 directors: four executive
directors and nine non-executive directors, four
of whom are independent. The balance between
executive, non-executive and independent non-executive
directors in the board composition allows for
appropriate and efficient decision-making, ensures that
no one individual has undue influence and that the
interests of all shareholders are protected.
Following Microsoft’s acquisition of a 12% equity stake
in the group, and in accordance with the agreement
entered into with Microsoft at that date, Mr Peter
Mansour was nominated by Microsoft for appointment
to the board of Blue Label Telecoms as its
representative. Mr Mansour was appointed as a
non-executive director with effect from 22 May 2008.
Brief curriculum vitae’s of each director are included in
this report on pages 19 to 21.
Chairman and chief executive officersIn line with best practice, the roles of chairman and
chief executive officers are separate. The board is led
by Mr Larry Nestadt, an independent non-executive
director.
The chairman presides over meetings of the board
ensuring the integrity and effectiveness of the board
governance process. The chairman fulfils this role by
acting as facilitator at meetings ensuring that no
director, whether executive or non-executive,
dominates the discussion, that relevant discussion
takes place, that the opinions of all directors relevant
to the subject under discussion are solicited and freely
expressed and that board discussions lead to
appropriate decisions.
Operational management of the group is the
responsibility of the joint chief executive officers,
Brett Levy and Mark Levy. The position of joint chief
executive officers is endorsed by the board, given the
achievements and entrepreneurial history of the two
individuals, the size of the Blue Label Telecoms group
and the distinctly different portfolios of the two chief
executive officers.
The chief executive officers are jointly responsible
for developing and recommending to the board a
long-term strategy and vision for the company that will
generate satisfactory stakeholder value. They are also
responsible for developing and recommending to the
board annual business plans and budgets that support
the company’s long-term strategy. The responsibilities
of Brett Levy include, amongst others, managing the
affairs of the Telecommunications Distribution
segment of the South African operations. Mark Levy is
responsible for, amongst others, managing the
Technology Platforms and Other Related Services
segments of the South African operations as well as
the operations of the International Telecommunications
segment and the group’s global marketing strategies.
The performance of the joint chief executive officers
will be appraised at least annually. The criteria
necessary to measure the performance of the chief
executive officers will be determined by the
remuneration and nomination committee of the board
and the results of the appraisal will be communicated
to the board.
Effectiveness of the boardThe board has defined its own functions and has
started establishing its governance structures during
the period. An evaluation of the effectiveness of the
board and its committees will be conducted during the
forthcoming financial year.
DirectorsThe board, in determining its optimum composition,
shall seek to ensure that it collectively contains the
skills, experience, diversity in demographics and mix
of personalities appropriate to the strategic direction
of the company and necessary to secure its sound
performance. The entire board selects and appoints
directors based on the recommendation of the
remuneration and nomination committee. All
appointments are in terms of a formal and
transparent process.
Executive directors are bound by a three-year employment
contract which commenced in November 2007. The
contracts may be renewed on expiration thereof.
The non-executive directors have no fixed term of
appointment and no service contracts with the group.
Their fees are independent of the group’s financial
performance and they receive no bonuses and will not
be eligible to participate in the company’s Forfeitable
Share Plan, salient details of which are discussed on
pages 139 to 142.

50
Board committeesThe board has established various committees to
assist them in discharging their duties and
responsibilities. However, the board remains the focal
point of the corporate governance system and is
ultimately accountable and responsible for the
performance and affairs of the company. The
responsibilities delegated to each board committee
are formally documented in board-approved terms of
reference, which will be reviewed annually and updated
as appropriate. It is intended that the effectiveness of
the committees will be reviewed annually by the board,
based on a self-evaluation exercise of the degree to
which they have fulfilled their terms of reference.
The following committees are in place:
Audit and risk management committeeMembers: JS Mthimunye [Chairman], GD Harlow,
LM Tyalimpi
Other individuals such as the chief financial officer,
audit partner and head of internal audit are invited to
attend meetings and have unrestricted access to the
chairman or any other member of the committee as is
required in relation to any matter falling within the
ambit of the committee.
Mandate: To assist the board in discharging its duties
relating to the safeguarding of assets, the operation of
adequate systems and internal controls and the
preparation of accurate financial reporting in
compliance with all applicable legal requirements and
accounting standards. The committee furthermore
sets out the nature, role, responsibility and authority of
the risk management function within the group and
outlines the scope of risk management work.
The committee is also mandated to evaluate the
performance of the external auditors as well as their
independence and effectiveness and to consider any
non-audit services rendered by such auditors and its
impact on their independence. Prohibited non-audit
related services include:
performing any internal audit or internal audit
outsourcing services to the group; and
Directors are subject to retirement by rotation and
re-election by shareholders at least once every three
years under article 15 of the articles of association.
At the company’s first annual general meeting to be
held on 12 November 2008, all directors, having been
newly appointed, are required to retire by rotation
(refer to section 2 on page 138). The directors have
offered themselves for re-election by shareholders.
To avoid conflicts of interest, board members must
disclose their interests in material contracts involving
the group, their shareholdings in Blue Label Telecoms
as well as any other directorships. Board members
are required to recuse themselves when participation
in deliberations or decision-making processes that
could in any way be affected by vested interests.
Board meetingsA minimum of four board meetings are scheduled per
financial year. Additional board meetings may be
convened when necessary. The table below depicts the
attendance by each director at board meetings during
the six months ended 31 May 2008:
Attendance at board meetings
Director
Dec
2007
Feb
2008
May
2008
LM Nestadt (Chairman)
BM Levy
MS Levy
S Ellerine
GD Harlow
RJ Huntley
NN Lazarus SC
P Mansour ¹ ¹
JS Mthimunye
MV Pamensky
DB Rivkind
HC Theledi
LM Tyalimpi
Apology for non-attendance submitted ¹Appointed to the board on 22 May 2008

51
appropriate remuneration strategy, ensuring the
directors and senior executives are fairly rewarded,
providing for succession planning, assessing the
effectiveness of the composition of the board and
evaluating the board and individual director’s
performance.
Attendance
Members (and invitees)
May
2008
NN Lazarus SC (Chairman)
GD Harlow
RJ Huntley
S Ellerine
DB Rivkind ¹
¹Attends by invitation and is not a member of the committee
Investment committeeMembers: GD Harlow [Chairman], NN Lazarus SC,
HC Theledi, JS Mthimunye, S Ellerine, D Hilewitz,
BM Levy, MS Levy, MV Pamensky, DB Rivkind, DA Suntup
Mandate: To review, consider and approve proposed
acquisitions and investments of Blue Label Telecoms
and its subsidiaries in accordance with the limits of
authority as defined by the board.
Attendance
2008
Members Jan Feb Mar April May
GD Harlow
(Chairman)
NN Lazarus SC
HC Theledi
JS Mthimunye ¹ ¹
S Ellerine ¹ ¹
D Hilewitz ² ² ²
BM Levy
MS Levy
MV Pamensky
DB Rivkind
DA Suntup
Apology for non-attendance submitted ¹Appointed to the investment committee on 18 February 2008 ²Appointed to the investment committee on 12 March 2008
performing any valuations on any business assets of
the group for which the external auditors will be
required to subsequently issue an audit opinion.
Non-audit related services which the external auditors
are permitted to render to Blue Label Telecoms
include:
tax compliance services;
assurance-related work, but excluding implementation
consulting work which results in an impairment of the
external auditors’ independence; and
opinion work not relating to or associated with any of
the prohibited services referred to above.
Services rendered by the external auditors during the
financial year and pre-approved by the audit
committee, comprised mainly compliance and other
assurance-based engagements, including opinion work
not relating to, or associated with any of the prohibited
services referred to above.
Attendance
Members (and invitees)
Feb
2008
May
2008
JS Mthimunye (Chairman)
GD Harlow
LM Tyalimpi
DB Rivkind ¹ ¹
DA Suntup (CFO of TPC) ¹ ¹
Apology for non-attendance submitted ¹Attends by invitation and is not a member of the committee
Remuneration and nomination committeeMembers: NN Lazarus SC [Chairman], GD Harlow,
RJ Huntley, S Ellerine
The joint chief executive officers, chief financial officer,
head of human resources and external advisors may
be invited to attend all or part of any meeting as and
when appropriate. The chairman, at his discretion, may
invite other executives or employees to attend and to
be heard at meetings of the committee.
Mandate: To assist the board in fulfilling its
responsibilities in respect of maintaining an

52
acting as a central source of guidance on matters of ethics and governance.
All directors of Blue Label Telecoms may liaise with the group company secretary on agenda items for board meetings. Where appropriate, the directors may also consult with independent professionals and advisers, at the expense of Blue Label Telecoms.
The group company secretary is furthermore responsible for the functions specified in section 268(G) of the Companies Act No 61 of 1973, as amended (the Act). All meetings of shareholders, directors, and board sub-committees are properly recorded as per the requirements of section 242 of the Act. The removal of the group company secretary is a matter for the board as a whole.
Risk management and internal controlRisk management and internal audit are integral parts of the governance framework. The board has accepted the responsibility for the system of internal control and the total process of risk management and in this regard established an audit and risk management committee to assist the board in discharging its duties and responsibilities. The board agreed to outsource the internal audit function to KPMG Services (Proprietary) Limited (KPMG), who were appointed post year-end.
KPMG in providing the outsourced internal audit function will be responsible for:
assisting management in evaluating the effectiveness of their processes for identifying, assessing and management of the key operational, financial and compliance risks of the group;
assisting management in evaluating the effectiveness of internal control systems, including compliance with internal policies;
recommending improvement in efficiency to the internal control systems established by management; and
keeping abreast of new developments affecting the activities of the group and matters affecting internal audit work.
In assisting the board with its responsibility for the process of risk management, the audit and risk management committee will be responsible for, inter alia:
monitoring and supervising the effective functioning of the internal audit;
ensuring that the roles and functions of internal audit are sufficiently clarified and co-ordinated with external audit to provide an objective overview of the effectiveness of the company’s internal control;
Transformation committeeMembers: RJ Huntley (Chairman), S Ellerine,
LM Tyalimpi, BM Levy, DB Rivkind (alternate to
BM Levy)
Mandate: To develop framework policies and guidelines
for the management of transformation issues
including affirmative procurement, enterprise
development, employment equity, human resource
development, social development matters and
ensuring the progressive implementation of the same
throughout Blue Label Telecoms and its subsidiaries.
Members (and invitees)
March
2008
April
2008
RJ Huntley (Chairman)
S Ellerine
LM Tyalimpi
I Hindley (Human resource manager)
Apology for non-attendance submitted ¹Attends by invitation and is not a member of the committee
Corporate governance committeeThe committee was constituted as an ad hoc committee mandated to investigate specific matters referred to it by the board. The committee will be constituted by members of the board as appropriate based on the specific matter to be investigated. During the financial year the committee met under the chairmanship of Mr LM Nestadt to consider the share dealings in Blue Label Telecoms by three directors of TPC and their spouses and the contravention of the JSE Limited Listings Requirements.
Company secretaryThe group company secretary acts as an adviser to the board and plays a pivotal role in ensuring compliance with procedures and applicable statutes and regulations. The activities in which the group company secretary engages includes, inter alia:
induction of new or inexperienced directors;
assisting the chairman and joint chief executive officers in determining the annual board plan;
assisting with other strategic issues of an administrative nature;
facilitating full and timely access by directors to all information such as corporate announcements, investor communications and other developments which may affect the group;
guiding the board and individual directors in the proper discharge of their responsibilities; and
53
The JSE investigation concluded that Rules 3.65, 3.66, 3.71(a) and 3.72 of the JSE Listings Requirements had been contravened. The JSE privately censured two of the directors and publicly censured and fined the third director R100 000 (of which R60 000 had been conditionally suspended for 12 months). The trades occurred in an open period, and there was no suggestion of insider trading.
The internal investigation by the corporate governance committee concluded that the three directors be reprimanded by the board of Blue Label Telecoms as their conduct caused damage and embarrassment to the company and its stakeholders. The investigation furthermore concluded that the conduct of the individuals did not justify their dismissal or the termination of their directorships, nor would it have been in the best interest of Blue Label Telecoms and its stakeholders for their employment or directorships to be terminated. The directors concerned were duly reprimanded by the board.
Additional measures were put in place to ensure that directors are aware of and understand their responsibilities under the Listings Requirements.
Stakeholder communicationIn all communications with stakeholders, the board aims to present relevant and timeous information that provides a balanced and understandable assessment of the position of Blue Label Telecoms and its group companies. This is done through adhering to principles of openness and substance over form and striving to address material matters of significant interest and concern to all stakeholders. The board encourages
shareholder attendance at the company’s first annual
general meeting and other future meetings.
Communication with institutional shareowners and
investment analysts is maintained through periodic
presentations of financial results, one-on-one visits, and
press announcements of interim and final results, as
well as the proactive dissemination of any messages
considered relevant to investors.
reviewing and assessing the integrity of the risk control systems and the risk identification and measurement methodologies; and
ensuring that the risk policies and strategies of the company are effectively managed.
Code of ethicsThe board is developing a formal code of ethics that demonstrates the company’s commitment to organisational integrity and will underwrite the group’s standards of ethical behaviour. This is an important component of the business of Blue Label Telecoms which requires a top-down approach with examples to be set by the board and individual directors to ensure acceptance by all involved in the affairs of the company. The code of ethics will furthermore confirm the board and management’s approach of zero tolerance, not only to fraud and dishonest behaviour, but also to criminal behaviour in general. Strong action will be taken against any employee found guilty of offences of this nature.
JSE Limited Listings Requirementsand share dealingsThe board as well as directors of the group’s major subsidiary, TPC, were addressed by the company’s sponsor on the Listings Requirements of the JSE Limited (JSE) to ensure a full understanding and appreciation of these requirements.
Subsequent to Blue Label Telecoms’ listing on the JSE, the board implemented an Insider Trading and Dealings in Securities Policy. The purpose of the policy is to govern the dealing in Blue Label Telecoms securities and insider trading by directors and employees of the group. The policy defines the group’s closed periods in terms of its year-end, details the information required to be disclosed in the event of a share trade and the procedure for obtaining clearance prior to dealing in Blue Label Telecoms shares.
A register of share dealings by directors is maintained by the company secretary and reviewed by the board on a quarterly basis.
During March and April 2008 the JSE carried out an investigation into dealings in Blue Label Telecoms shares by three directors of TPC and their spouses. An internal investigation was also conducted by the corporate governance committee comprising non-executive directors, appointed by the board, under the chairmanship of Mr LM Nestadt.

54
review the design of all share incentive plans
or similar plans for approval by the board and
shareholders and, determine each year whether
awards will be made, and if so, the overall amount of
such awards and the individual awards to executives
and other senior management;
determine specific remuneration packages for
executive directors of the company including, but
not limited to, basic salary, bonuses, performance
based incentives and share incentives;
make recommendations to the board regarding the
remuneration of non-executive directors for final
approval by the shareholders;
oversee any major changes in employee benefit
structures throughout the group;
ensure that all provisions regarding disclosure
of remuneration, including retirement benefits,
are fulfilled.
In applying agreed remuneration principles, the
committee is committed to principles of accountability,
transparency and to ensuring that the reward
arrangements are linked to performance and support
the business strategy.
Executive directors’ service contracts The executive directors have concluded three-
year employment contracts, which commenced in
November 2007. The contracts provide for an option
to renew (by mutual agreement) upon the expiry of the
initial term.
Advisers The committee consults with external independent
advisers on market information and remuneration
trends, as well as other advice necessary to fulfil its
responsibilities. In addition, the committee frequently
reviews remuneration and board best practice
reports.
Group remuneration philosophy Blue Label Telecoms is committed to ensure that
through its remuneration strategy it achieves
an optimum balance between the interests of
shareholders and providing attractive and competitive
remuneration packages.
The remuneration practices are structured to ensure
that the group attracts, retains, and continually
motivates the high calibre of employees required to
run the group efficiently and successfully.
Blue Label Telecoms seeks to ensure that the
application of remuneration structures are
applied equitably, fairly and consistently in relation
to responsibility, personal performance and the
employment market.
Remuneration committeeThe committee operates under the delegated
authority from the board and focuses its activities on
the group’s remuneration policy, the determination of
levels of remuneration, annual bonuses and long-term
incentive plans.
The joint chief executive officers attend most meetings
of the committee as invitees, at the request of the
committee. They do not attend or participate when
their own remuneration is discussed.
The mandate of the committee is to:
determine and agree with the board the framework
or broad policy for the remuneration of the executive
directors, non-executive directors and such other
members of the executive management as it is
designated to consider;
review, for recommendation to the board, the
design of, and targets for, any performance
related pay schemes operated by the company and
approve the total annual payments made under
such schemes;

55
Annual performance incentives Executive directors and senior management
participate in an annual executive performance
incentive scheme to reward and motivate the
achievement of group and subsidiary financial
performance as well as strategic and personal
performance.
The joint chief executive officers may earn an annual
incentive bonus of up to 120% of fixed remuneration
and other executive directors up to 70%. Senior
management may earn up to 50% of annualised
salary. The payment of bonuses is not an entitlement.
The quantum of bonuses paid is determined
with reference to the achievement of stipulated
performance criteria.
EmolumentsA full disclosure of executive directors’ emoluments
is recorded in note 27 to the group annual financial
statements on pages 114 and 115 of this report.
Non-executive directorsThe fees payable to the chairman and non-executive
directors are recommended by the remuneration
committee, and approved by the shareholders at
the annual general meeting. In determining the fees
payable to non-executive directors the committee
considered the opinions from external independent
advisers. The primary principles that the remuneration
committee applies to non-executive remuneration are,
inter alia:
fee based;
market related – having regard to the fees paid
and number of meetings attended by non-executive
directors of companies of similar size and structure;
not linked to share price or the group’s
performance.
Executive directors’ remunerationThe directors are appointed to the board based on
their ability, know-how and experience. The committee
aims to ensure that executive directors receive
remuneration that is appropriate to their scope of
responsibility and contribution to the group’s operating
and financial performance.
The primary principles that the committee applies in
determining the executive directors’ remuneration are,
inter alia:
to ensure that remuneration levels are appropriate
to reinforce the entrepreneurial culture of the
organisation and to create a performance
orientated environment whilst keeping a balance
between the interests of management and the
interests of shareholders;
to provide a competitive remuneration package in
the median to upper quartile of the market, taking
into account appropriate benchmarks including the
remuneration payable at companies of a similar
size and scope, to attract, motivate and retain the
exceptional quality individuals the group requires to
sustain its growth;
to use such benchmarks and comparisons
with caution, so as to avoid an upward ratchet
of remuneration levels with no corresponding
improvement in performance;
to establish an appropriate balance between fixed
and variable remuneration which is based on
realistic targets that are relevant and verifiable so
as to align the interests of management with the
interests of shareholders.

56
The proposed annual fees for membership of the board and membership of the various committees for the 2009 financial year are:
Fee permeeting*
Cappedfee perannum**
Services as directors
— R600 000
R30 000 R150 000
Audit and risk management
R41 666 R166 664
R25 000 R100 000
Remuneration committee
R33 333 R133 333
R20 000 R80 000
Investment committee
R25 000 R200 000
R15 000 R120 000
Transformation committee
R25 000 R100 000
R15 000 R60 000
Ad hoc committee
R25 000 R100 000
R15 000 R60 000
*In the event that there are fewer meetings as envisaged, the member shall receive the fee in respect of the number of meetings attended.
**In the event that there are more meetings per year than initially planned, directors fees will be paid only up to the cap.
Share incentive planIn order to align management and employee interests
with those of shareholders, the committee has
recommended the establishment of a Forfeitable
Share Plan (the plan), which will be submitted to
shareholders for approval at the annual general
meeting. There will be performance conditions
governing the vesting of shares under the plan which
will correlate with financial performance of the group
and growth in shareholder value.
It is proposed that the plan participants will be
granted an annual award of shares equal to an agreed
percentage of the participant’s annual salary. It is
intended that the percentage of annual salary used
to allocate the shares will be regularly reviewed and
benchmarked.
Employees will receive an annual forfeitable award,
which is an award of a specified number of ‘forfeitable’
shares. If the participant resigns or is dismissed prior
to the vesting date, or if the specified performance
conditions are not met, the shares will be forfeited.
The shares will be subject to forfeiture conditions and
restrictions on disposal for specified period from the
grant of the award. Thereafter the participants are
entitled to deal freely with the shares.
The salient features of the Forfeitable Share Plan are
detailed in an annexure to the notice of annual general
meeting and appear on pages 139 to 142 of this
annual report.

The building of long term and mutually beneficial relationships with our
stakeholders is a business imperative

57
The founders and management of Blue Label Telecoms
have, since the business was established in 2001, been
involved in sustainable development initiatives of various
kinds, albeit in an informal and unstructured manner.
With the listing of the company, the need to formalise
and enhance these initiatives has been identified.
Blue Label Telecoms participated in the 2008 JSE
Limited Socially Responsible Investment (SRI) Index.
The criteria for the index identify issues that
companies must address to show that they have
integrated triple bottom-line practices across their
activities. The final outcome of the SRI Index is
expected in November 2008.
This report represents a balanced and reasonable
presentation of the economic, environmental and
social performance of the group.
Stakeholder relationsThe building of long-term and mutually beneficial
relationships with our stakeholders is a business
imperative. In pursuit of this goal we will interact with
our stakeholders in a manner that is beyond reproach.
The guidelines we follow in interacting with our
stakeholders are summarised as follows:
Employees
manage our employees in an equitable, trustworthy
and transparent manner;
value diversity and ensure that the profile of our
workforce reflects the demographic composition
of South Africa;
actively care for the safety, health and welfare of
all employees; and
energise our employees to continuously deliver
superior performances.
Investors
adherence to the laws and regulations governing
our business;
benchmarking our operations and processes
against international standards;
provision of regular and comprehensive reports on
our operations, financial results and governance
processes; and
share the benefits of our operations in an equitable
manner.
Communities
acceptance of our responsibility to participate in
building capacity and alleviate poverty in the areas
where we operate; and
accepting that the sustainability of our host
communities extends beyond the finite time frames
associated with our operations.
Customers and business partners
building mutually beneficial long-term relationships
through the quality of our products, the reliability of
our services and our business integrity; and
recognising the need to add value throughout the
supply and distribution channels.
Governmental bodies
respect the laws and regulations governing our
business in the areas where we operate; and
support national aspirations and policies aimed at
building democratic and prosperous societies.
Media
acknowledge and respect the media as a primary
channel of communication; and
engage in open and honest dialogue and expect in
return, fair, balanced and objective reporting.
Ethical practicesIn pursuit of the company’s vision to provide
world-class prepaid product and service offerings to
consumers within the middle and bottom levels of the
world’s economic pyramid, we are committed to
behaving and interacting with all stakeholders in a
professional and ethical manner. Our core principles
that underpin our interaction with stakeholders
include:
Integrity
Mutual respect
Trust
Honesty
Accountability
The board is developing a formal code of ethics that
demonstrates the company’s commitment to
organisational integrity and will underwrite the group’s
standards of ethical behaviour.

58
Value added statementValue added is the measure of wealth the group has created in its operations by “adding value” to the cost of products
and services. The statement below summarises the total wealth created and shows how it was shared by employees
and other parties who contributed to its creation. Also set out below is the amount retained and re-invested in the
group for the replacement of assets and the further development of operations.
2008 2008 2007 2007 R000 % R000 %
VALUE ADDEDValue added by operating activities 594 545 77,2 368 916 81,1
Revenue 12 545 471 8 895 044Net operating expenses (11 950 926) (8 526 128)
Value added by investing activities 176 002 22,8 85 854 18,9
Fair value movement on financial assets at fair value through profit or loss (1 375) 2 540Interest income 177 377 83 314
770 547 100 454 770 100
VALUE DISTRIBUTEDDistributed to employees 265 003 34,4 142 320 31,3
Salaries, wages, medical and other benefits 265 003 142 320
Distributed to providers of finance 46 575 6,0 62 942 13,8
Finance costs 46 575 62 942
Distributed to the state 102 009 13,2 55 183 12,1
Income tax 101 759 55 094STC 250 89
Value reinvested 149 168 19,4 84 498 18,6
Depreciation, amortisation and impairment 58 670 26 682Net discounting finance cost 85 225 58 623Share of losses of associates 17 441 956Deferred taxation (12 168) (1 763)
Value retained 207 792 27,0 109 827 24,2
Retained profit 180 891 63 867Minority shareholders’ interest 26 901 45 960
770 547 100 454 770 100
2007
31,3%
24,2%
13,8%
12,1%
18,6%
2008
34,4%
27,0%
13,2%
6,0%
19,4%
Distributed to employees
Distributed to providers of finance
Distributed to the state
Value reinvested
Value retained

59
Shareholder analysis
No ofshareholdings % No of shares %
SHAREHOLDER SPREAD1 – 1 000 shares 652 20,70 391 052 0,051 001 – 10 000 shares 1 617 51,33 6 312 781 0,8210 001 – 100 000 shares 699 22,19 20 560 161 2,68100 001 – 1 000 000 shares 127 4,03 40 537 922 5,291 000 001 shares and over 55 1,75 698 558 978 91,15
Total 3 150 100,00 766 360 894 100,00
DISTRIBUTION OF SHAREHOLDERSBanks 26 0,83 96 625 991 12,61Close corporations 87 2,76 1 942 516 0,25Empowerment* 1 0,03 80 058 376 10,45Endowment funds 16 0,51 1 120 095 0,15Individuals 2 409 76,48 203 174 120 26,51Insurance companies 12 0,38 8 392 177 1,10Investment companies 21 0,67 24 504 940 3,20Medical schemes 1 0,03 10 000 0,00Mutual funds 44 1,40 26 999 952 3,52Nominees and trusts 302 9,59 52 247 015 6,82Other corporations 49 1,56 470 929 0,06Retirement funds 37 1,17 16 616 991 2,17Private companies 136 4,32 158 941 346 20,74Public companies 9 0,29 95 256 446 12,43
Totals 3 150 100,00 766 360 894 100,00
PUBLIC/NON-PUBLIC SHAREHOLDERSNon-public shareholders 12 0,38 367 291 589 47,93
Directors (direct and indirect)* 10 0,32 242 615 802 31,66Strategic holdings 1 0,03 91 851 852 11,99Empowerment* 1 0,03 32 823 935 4,28
Public shareholders 3 138 99,62 399 069 305 52,07
Total 3 150 100,00 766 360 894 100,00
*Please note that in the public/non-public shareholders section, 44 992 807 and 2 241 634 shares indirectly belonging to HC Theledi and RJ Huntley respectively, have been taken out of the empowerment holding of 80 058 376 shares (Nthwese Investment Holdings Consortium (Proprietary) Limited) and have been allocated to directors and associates.
Beneficial shareholders holding 5% or more No of shares %
Shotput Investments (Proprietary) Limited 116 736 000 15,23Microsoft Corporation 91 851 852 11,99Levy, BM 80 563 331 10,51Nthwese Investment Holdings Consortium (Proprietary) Limited 80 058 376 10,45Levy, MS 73 155 922 9,55Investec Asset Management 43 353 925 5,66
Total 485 719 406 63,38

60
employees and consequently their families and
communities;
provide proper information and advice on HIV/AIDS
to employees and their families as well as monitoring
and evaluating the epidemic; and
ensure that the rights of employees living with HIV/
AIDS are protected and enforced and that fair
process is followed when dealing with HIV/AIDS.
Workplace awareness programmes include
awareness activities, condom distribution, voluntary
HIV testing, infection control, counselling and
treatment.
EnvironmentBlue Label Telecoms has been classified by the SRI
Index as having an overall low environmental impact
due to the nature of its business.
Water consumption and use is limited to drinking
purposes and ablution facilities and no groundwater
is drawn from any of the operations of Blue Label
Telecoms.
The group occupies leased properties comprising
mainly of office buildings. None of the office buildings
are in biodiversity-rich or ecologically significant
habitats as determined by the Global Reporting
Initiative.
The group has a satisfactory recycling programme. In
terms of the programme, waste paper and scrap,
including printer cartridges, associated with an office
environment are collected by scrap dealers for
disposal in an environmentally friendly manner.
Social and transformation matters
Corporate social investment (CSI)The group has undertaken several initiatives during
the financial year in an endeavour to create an
environment conducive for the investment of money
and resources in the sustainable upliftment of
previously disadvantaged communities. The focus to
date has been on those communities that have the
greatest need and who can be found in amongst or on
the outskirts of the communities in which Blue Label
Telecoms employees reside. Consequently
considerable focus has been placed on the youth,
HIV/AIDS, sports development and education.
Safety, health and environment
SafetyWe acknowledge that an employee’s health and safety
is a fundamental right and that a healthy, safe and
incident-free working environment enhances
productivity and contribute towards everyone’s
wellbeing. In this regard the group has trained first aid
employee representatives on site.
The group had no major safety and health incidents
during the period under review.
HealthThe company recognises that HIV/AIDS poses a
threat to the employees, their families, communities
and to the company and its various stakeholders. It is
within this framework that the company adopted a
formal policy that defines the respective rights and
obligations of the employee and the company.
The company developed a comprehensive strategy and
programme of responses, which will manage HIV/AIDS
in the company and consequently among employees
and their families and surrounding communities.
The objective of the strategy is to minimise the risk to
exposure by way of:
instilling a prevention culture within the organisation;
providing employees with an opportunity to volunteer
to have an HIV/AIDS test resulting in detection of
infections; and
providing medication and treatment to affected
employees as the final element to the strategy.
Blue Label Telecoms and its employees agreed to take
joint responsibility for the following:
address the health, safety and wellbeing of
employees in relation to HIV/AIDS by implementing
HIV/AIDS programmes;
minimise the adverse effects of HIV/AIDS on
operations and the social circumstances and
development of employee and consequently their
families and communities;
create conducive environment in the workplace for
dealing with the epidemic constructively;
reduce the number of new infections among

61
training and employment for the blind and partially
sighted in conjunction with the Athlone School for
the blind;
sponsorship to the Topsy Foundation, an HIV and
AIDS foundation which focuses on assisting people
in rural areas with medical care, social support and
skills development;
donations made to MaAfrica Tikkun, Business
Against Crime South Africa, Supedi Trust,
SA Medical Centre, The Giving Organisation and
various other organisations and institutions; and
sponsorship of charity golf days.
Transformation and broad-based black economic empowermentBlue Label Telecoms recognised the need to develop
and adopt a formal transformation strategy in support
of the national programme for economic
transformation. The board constituted a
transformation committee at its first board meeting
held in December 2007 with a specific mandate to
develop framework policies and guidelines for the
management of transformation including affirmative
procurement, enterprise development, employment
equity, human resource development, social
development matters and ensuring the progressive
implementation of the same throughout the group.
As a newly listed public entity Blue Label Telecoms and its
subsidiaries embrace the challenge of transformation
and are dedicated to progressing transformation by
working closely with the transformation committee in
ensuring that the group’s policies are implemented
effectively and successfully throughout our group.
Nomonde’s Children’s HomeNomonde is a retired nursing sister who cares for
32 abandoned HIV/AIDS children. Nomonde was
referred to the group by a concerned staff
member. At the time that Blue Label Telecoms
associated with Nomonde, the children’s home
was situated in a ramshackle, uninhabitable house
in Kensington. The living conditions were not
suitable for children, least of all sick children.
Blue Label Telecoms assisted Nomonde in
securing a suitable house in Lombardy East for
her and the children. The ownership of the
property are being transferred into a Trust that
will allow Nomonde and the children to have a
proper home. In addition, Blue Label Telecoms will
assist on a continuous basis to secure other badly
needed resources.
The group’s CSI strategy will be formalised as part of
the overall transformation strategy. The group are
furthermore looking to create a Blue Label Telecoms
Foundation, managed and administered by staff,
management and patrons, with an objective of
indentifying projects that will align with the CSI strategy
of the group and project that will yield sustainable and
longer-term benefits for the relevant communities.
The group has spent in aggregate approximately
R900 000 on CSI initiatives during the period under
review. Certain of the initiatives undertaken included:
monthly donations to the Jakaranda and Louis Botha
Children’s Homes, as well as Berg-en-Dal Pregnancy
crisis centre;
The transformation committee adopted a four-phase approach comprising:
Objective Progress made
Phase 1 Situational analysis to evaluate the current
status within the organisation.
Completed in January 2008.
Phase 2 Determine a broad-based black economic
empowerment (BBBEE) policy framework for
the group and formulate a transformation
strategy that will include achievable and
measurable internal targets.
Appointment of a transformation manager to
facilitate strategy formulation and
implementation. The group strategy is being
finalised for final approval by the board.
Phase 3 Communication of the framework and strategy
to all group companies and implementation.
To commence during the 2009 financial year.
Phase 4 Monitoring and measuring of performance
against targets.
Ongoing activity subsequent to the
implementation of the strategy.

62
Since the listing of Blue Label Telecoms in November
2007 focus has been placed on integration and
consolidation of the respective group companies. The
group has furthermore implemented a standardised
consolidated payroll system in order to record
accurate group statistics. This process will assist in
determining achievable and realistic targets in terms
of the employment equity strategy encapsulated in the
group transformation strategy yet to be approved. In
ensuring compliance with the group strategy in this
regard a human resource, skills development and
employment equity officer has been appointed to drive
the process throughout the group and to assist the
group in complying with set targets.
The table below reflects the demographics of the
employee base in the group based on the most recent
submissions to the Department of Labour.
TrainingThe company has adopted several skills development
initiatives relating to core services. All employees have
access to this benefit and are encouraged to use this
facility through financial assistance for formal training,
internal training initiatives and mentoring.
Enterprise developmentBlue Label Telecoms, through its major subsidiary TPC,
is a funder of ZOK Cellular (Proprietary) Limited (ZOK).
ZOK aims to empower budding entrepreneurs from
South Africa’s previously disadvantaged communities
through equipping them with already made FMCG
retailing solution in the form of a ZOK container. This
container equally offers banking and telephony services
as well as a small business centre functionality in the
form of print, copy and scan services and internet
connectivity. The placement of ZOK containers in
previously disadvantaged areas is intended to bridge the
gap in telecommunications, ICT and banking services in
such areas as well as uplift the communities’ resident
there.
Human capital
Employment equityBlue Label Telecoms is committed to achieving equity
in the workplace by promoting equal opportunity and
fair treatment in employment. The ultimate objective is
to create an environment in which all employees are
able to compete for job opportunities on the sole
criterion of merit and where the demographics at all
levels within the workplace are a fair representation of
the demographics of the relevant general and regional
population.
Demographics of employee base
Male FemaleForeign
nationalsAfrican Coloured Indian White African Coloured Indian White Male Female Total
Top management 2 — — 43 — — — — — — 45
Senior management 5 1 — 31 — — 1 12 — — 50
Professionally qualified and experienced specialists and mid-management 1 1 4 31 0 3 3 32 2 — 75
Skilled technical and academically qualified workers 12 5 30 58 4 5 11 21 3 — 146
Semi-skilled and discretionary decision making 109 19 100 65 138 43 100 80 4 1 654
Unskilled and defined decision making 27 1 7 17 24 1 6 5 3 — 88
Non-permanent employees 280 35 58 10 137 11 19 8 4 2 558
Total 436 62 199 255 303 63 140 158 16 3 1 616

David Rivkind – Chief financial officer
The group’s strong balance sheet is attributable to good trading results and stringent
asset and treasury management

63
Microsoft Corporation collaboration In November 2007 Microsoft Corporation acquired
12% of the equity in BLT for R620 million, of which
R239 million was represented by a fresh issue of
shares at the listing price of R6,75.
Listing on the JSE Limited Blue Label Telecoms was listed on the Main Board of
the JSE Limited on 14 November 2007, through the
placement of 183 585 830 shares at R6,75 per
share and 14 545 455 shares at R5,50 per share.
This resulted in the successful raising of capital of
R1,32 billion.
The funds raised were allocated as follows:
R618 million
interests in subsidiaries and associate companies:
R209 million
bonus agreement: R80 million
The net cash residue from the funds raised on listing
amounted to R364 million.
Performance against the forecasts presented in the pre-listing statement
The PLS included the group’s unaudited forecasts of
basic and headline earnings of R144 million, core
earnings of R234 million, pro forma earnings of
R250 million and core pro forma earnings of
R340 million. The group exceeded these forecasts
in all four of these earnings categories.
The forecast earnings for the year ending 31 May
2008 were exceeded by 25,50% on the achievement
of actual earnings of R181 million. These results were
achieved after accounting for expending once off
extraneous costs, amortisation of intangible assets in
terms of IFRS 3: Business Combinations requirements,
allocation to minorities of their share of profits up until
listing date and the benefits of finance income
generated from the net proceeds of cash received on
listing from the date that such funds were received.
The forecast core earnings were exceeded by 15,38% on
the achievement of earnings of R270 million. The core
earnings are calculated after adding back the once off
extraneous costs and the amortisation of intangibles.
Blue Label Telecoms’ (BLT) maiden financial period as
a listed company embodied a multitude of corporate
transactions which need to be explained to provide
shareholders with meaningful insight into both the
resultant structure of the group and its performance.
In order of progression, the following events
transpired:
RestructuringPrior to the group’s listing on the JSE Limited in
November 2007, the companies incorporated in the
listing were previously subsidiaries and associates of
Blue Label Investments (Proprietary) Limited (BLI), The
Prepaid Company (Proprietary) Limited and House of
Business Solutions (Proprietary) Limited.
The group acquired these assets from the shareholders
of BLI in return for the issue of 314 623 074 BLT shares
at R5,50 per share. A further 63 474 919 BLT shares
were issued to these shareholders for the purchase of
their loan claims in BLI of R349 million.
The restructuring also embodied the acquisition of
minority interests in the following companies:
Minority interests remaining are:
(Proprietary) Limited 49,90%
The restructuring was the first step in a programme
to create the listed vehicle, in line with the group’s
strategy to control the cash flows and operations of
these companies, and in turn to achieve significant
vertical integration.
’
*This was purchased prior to year-end

64
Income statementRevenue
Revenue increased by R3,65 billion (41%)
predominantly due to strong organic growth and the
continued escalation in consumer demand for prepaid
airtime. The revenue of associate companies does not
form part of this revenue as these companies are
equity accounted for at net earnings level only.
Gross profit
The group’s trading environment is characterised by
high volumes and relatively low margins. The growth
in gross profit percentage margin from 4,78% to 5,34%
was congruous with the inclusion of the associated
companies that became subsidiaries post listing. Prior to
listing and in 2007, the margin contribution formed part
of the equity accounted net earnings only.
Operating expenses
The growth in expenditure of R181 million (78%)
incorporates once-off extraneous costs (R89 million)
and the expenditure of subsidiaries (R51 million) that
were previously associate companies prior to listing.
After deduction of the above operating expenses of
R269 million, it represented a growth of 17,66% on
the previous year, commensurate with the group’s
need for additional manpower and variable expenses
in support of the substantial growth in group revenue.
Earnings before interest, taxation, depreciation and amortisationThe growth in EBITDA from R229 million to R328 million
(43%) was after writing off the extraneous expenses of
R89 million. The growth before the write off of extraneous
expenses therefore equated to 82%.
Net finance incomeFinance income
The group’s finance income for the year was
R193 million earned from the residue of funds raised
on listing and the positive accumulative cash
generated from trading operations through the
majority of the year. Of this amount, R16 million relates
to imputed interest receivable on debtors balances in
terms of IFRS requirements.
The forecast pro forma earnings were exceeded by
8% on the achievement of earnings of R269 million.
The pro forma financial results have been prepared to
illustrate the impact of the group’s financial results as
if the listing, restructuring and acquisition of minorities
occurred on 1 June 2007.
The forecast core pro forma earnings were exceeded
by 9% on the achievement of earnings of R371 million.
The core pro forma earnings are calculated after
adding back extraneous costs and amortisation of
intangibles to the pro forma earnings.
The core pro forma earnings represent the
achievement of the company that currently makes up
the group and the cash reserves that the group holds.
These earnings therefore represent the effective
financial performance of the group and represent the
base on which management will compare growth in
the year to come.
Financial resultsBasis of preparationThe group’s financial statements have been prepared
in accordance with and in compliance of the
international financial reporting standards (IFRS), the
listings requirements of the JSE and the South African
Companies Act, 61 of 1973, as amended.
The consolidated financial statements have been
prepared in accordance with the going concern
principle under the historical cost basis as modified by
the revaluation of certain assets and liabilities where
required or elected in terms of IFRS. The accounting
policies and methods of computation are consistent
with those used in the corporate financial information
for the year ended 31 May 2007.
As a result of the group’s restructuring, its
comparatives have been restated using predecessor
accounting principles.
The accounting principles applied result in an extensive
restatement of comparatives. It is important to read
the financial results as reported in conjunction with
the pre-listing statement when assessing these
comparatives.
’

65
Finance expense
The group’s finance expense for the year of R148 million
included R101 million relating to imputed interest on
creditor balances in terms of IFRS requirements.
R47 million pertained to historical interest-bearing debt
that was expunged on listing.
Share of losses from associates
A loss amounting to R19,7 million is attributable to
Oxigen Services India (Private) Limited (Oxigen). Other
Segmental pro forma results
CorporateR’000
Telecommuni-cation
DistributionR’000
Inter-national
Telecommuni-cation
DistributionR’000
TechnologyPlatforms
R’000
OtherRelated
ServicesR’000
Pro forma31 May 2008
R’000
Turnover — 12 194 784 500 268 27 881 207 676 12 930 609 Costs of sales — (11 649 402) (436 826) (9 964) (115 315) (12 211 507)
Gross profit — 545 382 63 442 17 917 92 361 719 102 Other income 4 967 49 363 4 742 40 9 030 68 142 Overheads (66 573) (249 121) (46 640) (27 753) (50 228) (440 315)
Employee costs (37 677) (175 416) (22 191) (17 222) (23 123) (275 629)Other expenses (28 896) (73 705) (24 449) (10 531) (27 105) (164 686)
EBITDA (61 606) 345 624 21 544 (9 796) 51 163 346 929 Depreciation, amortisation and impairment charges (851) (28 417) (11 594) (4 079) (28 734) (73 675)
EBIT (62 457) 317 207 9 950 (13 875) 22 429 273 254 Interest received 2 572 235 278 68 93 1 459 239 470 Interest paid (489) (102 461) (1 127) (528) (1 999) (106 604)
EBT (60 374) 450 024 8 891 (14 310) 21 889 406 120 Taxation (1 376) (111 184) (1 707) 1 428 (3 690) (116 529)Income from associate — — (19 661) — — (19 661)
Basic pro forma earnings (61 750) 338 840 (12 477) (12 882) 18 199 269 930 Minorities’ share of income — (821) (974) 1 277 11 (507)
Basic pro forma earnings attributable to ordinary shareholders (61 750) 338 019 (13 451) (11 605) 18 210 269 423 Once off management fee net of tax — 57 600 — — — 57 600 Amortisation of intangibles raised through business combinations net of tax and minorities — 11 217 4 427 400 18 875 34 919 Cancellation of once off contract 9 000 — — — — 9 000
Core pro forma earnings (52 750) 406 836 (9 024) (11 205) 37 085 370 942
associated companies prior to listing generated
positive contributions of R2,3 million.
Effective tax rate
As a result of certain non-deductible expenses, the
group’s effective tax rate for the full year was 30%.
Dividends
As per the group’s previously disclosed dividend policy,
BLT will only consider paying a dividend from the
financial year commencing 1 June 2010.
66
Financial assets at amortised cost
These assets represent the carrying value of starter
packs acquired that are yet to be activated. A starter
pack enables the initiation of the connection between
the prepaid subscriber and the networks prior to the
purchase of prepaid airtime.
Current ratio
The current ratio of 2:1 is indicative of the liquidity of
the group.
Share capital and share premium
The number of shares in issue at a par value of
0,000001c per share is made up as follows:
No of shares
Sharepremium
R000’sShares issued to BLI shareholders 378 097 993 2 079 533
Share element of the purchase price of minority interests 190 131 616 1 045 724
Shares issued for cash on listing 198 131 285 1 319 203
Microsoft Corporation 35 437 682 239 204
Private and preferential placements 162 693 603 1 079 999
Total number of shares in issue 766 360 894
Total value 4 444 460
Less costs pertaining to the listing 39 723
Net total 4 404 737
Restructuring reserve
The restructuring reserve of R1,84 billion arose as a
result of the restatement of group comparatives as
required in terms of the principles of predecessor
accounting. This reserve represents the difference
between the fair value of the entities under the group’s
control and their respective net asset values as at the
assumed restructure date of 1 June 2006.
Transaction with minority reserve
The group has changed its accounting policy with
regard to accounting for transactions with minorities.
This differs from the group’s accounting policy
disclosure in its PLS. The group has adopted the
economic entity method which is consistent with the
requirements of IFRS 3 Revised: Business
combinations, and IAS 27 Revised: Consolidated
and separate financial statements.
’
Earnings per shareThe earnings per share at basic, headline, pro forma
and core levels exceeded the forecast as contained in
the pre-listing statement.
May 2008 Per PLS
Basic 30,65c 26,30c
Headline 30,26c 26,30c
Core basic 45,81c 42,68c
Pro forma basic 35,16c 33,61c
Pro forma headline 34,86c 33,61c
Pro forma core basic 48,40c 45,81c
Return on shareholders equity
Percentagereturn
Basic 9,43
Pro forma core 19,34
Balance sheetThe group’s strong balance sheet is attributable to
good trading results and stringent asset and treasury
management. The group is highly liquid and well
positioned to support the funding of potential
acquisitions without impairing its working capital
requirements.
Assets Goodwill and intangible assets
In terms of IFRS 3: Business combinations, the
intangible elements comprising goodwill and
intangibles in respect of acquisitions have to be
determined and allocated. The group’s carrying
value of these acquisitive intangible assets as at
31 May 2008 was R193 million. The majority of
these acquisitions emanated from the conversion
of investments in previous associate companies to
wholly owned subsidiaries as a result of the
restructure of the group immediately prior to listing.
The useful life of the majority of these intangible assets
is five years, which will be amortised accordingly.
Goodwill of R266 million relates to the acquisition of
subsidiaries in respect of which the group was not
transacting with minorities.
Investments in associates
The group’s investments in associates of R81 million
represents the carrying value of its investment in
Oxigen. As at 31 May 2008, BLT held 35% of the
company and was allocated a further 3,85% in June
2008.

67
Directors’ dealings in securities post year-endFurther to the disclosures of directors’ interests on
page 72, the interests of the directors changed as
follows from the end of the financial year to the most
recent information available at the date of publishing
this report:
DirectorNature
of changeNo of
sharesNature
of interestBM Levy Shares
acquired1 000 000 Direct beneficial
MS Levy Shares acquired
1 000 000 Direct beneficial
MV Pamensky Shares acquired
1 000 000 Indirect beneficial
DB Rivkind Shares acquired
3 431 669 Direct beneficial
ProspectsIt is not anticipated that Oxigen Services India will
become profitable during the next financial year as it
continues to invest in the expansion of its transactional
footprint. The group is confident that there will be
positive growth and profitability across the rest of the
group. The consolidation of the group emanating from
the acquisition of minority interests and the healthy
cash resources on hand have resulted in a solid
foundation to support the perpetual expected growth
of BLT both organically and acquisitively.
Management are constantly evaluating potential
acquisitions that will need to meet the criteria of the
group’s objectives to expand its footprint both locally and
globally in rolling out its bouquet of products and services
to additional points of presence. Vertical integration and
a positive impact on earnings per share are essential
fundamentals to the equation of acquisitions.
AppreciationI wish to acknowledge and express my appreciation to the
staff of the group, in particular the finance team for their
concerted efforts and high-quality performance.
David Rivkind
Chief financial officer
As a consequence of the above, goodwill of
R899 million, arising from transactions with
minorities, is recognised against reserves on the
balance sheet as minority shareholders are treated
as equity participants.
Cash flow statement Cash and cash equivalents increased by R237 million.
A summarised reconciliation of this growth is as
follows:
Proceeds from the listing R1,32 billion
Less:
Repayment of historical borrowings R618 million
Costs pertaining to the listing R40 million
Funds appropriated to investing activities
R405 million
Net funds applied to operating activities R20 million
The net funds applied to operating activities reflected
at year-end was after the application of R277 million
increase in net working capital assets on a piecemeal
basis over the year in support of the continued growth
in group operations.
Excess cash flow is utilised on a regular basis for
premature settlement of creditors in order to enjoy
the benefit of settlement discounts in excess of
interest receivable on such funds.
The majority of the R405 million pertaining to funds
appropriated to investing activities were applied to the
acquisition of shares and claims in group companies.
Net cash flows from financing activities resulted after
applying a portion of the proceeds raised on listing to
settle debt and listing costs.
Strategic acquisitions post listing
Ventury (additional 10%) R8,5 million
Crown Cellular (100%) R90 million
Content Connect Africa (100%) R30 million
CNS call centre (80%) R11million
Strategic acquisitions post year-end
Oxigen Services India (additional 3,85%) R72 million
Content Connect Australia (50,25%) R3 million
Ukash (17,25%) R49 million
Blue Label Mexico (50%) R27 million
Share incentive schemeA staff share incentive scheme has been formulated
for presentation and approval at the group’s
forthcoming annual general meeting.

www.bluelabeltelecoms.com
Directors’ responsibility for the financial statements 69
Declaration by company secretary 69
Independent auditors’ report 70
Directors’ report 71
Group balance sheet 74
Group income statement 75
Group statement of changes in equity 76
Group cash flow statement 77
Notes to the group annual financial statements 78
Company balance sheet 120
Company income statement 121
Company statement of changes in equity 122
Company cash flow statement 123
Notes to the company annual financial statements 124
68

6969
The directors are responsible for the maintenance of adequate accounting records and the preparation and integrity of the financial
statements and the related information including pro forma information. The auditors are responsible for reporting on the fair
presentation of the financial statements. The financial statements have been prepared in accordance with International Financial
Reporting Standards and in the manner required by the Companies Act, 1973.
The directors are also responsible for the company’s system of internal financial control. These are designed to provide reasonable,
but not absolute, assurance as to the reliability of the financial statements, and to adequately safeguard, verify and maintain
accountability of the assets, and to prevent and detect misstatement and loss. Nothing has come to the attention of the directors
to indicate that any material breakdown in the functioning of these controls, procedures and systems has occurred during the year
under review.
The financial statements have been prepared on the going-concern basis, since the directors have every reason to believe that the
company has adequate resources in place to continue in operation for the foreseeable future.
The financial statements have been audited by the independent auditors, PricewaterhouseCoopers Incorporated, which was
given unrestricted access to all financial records and related data, including minutes of all meetings of shareholders, the board of
directors and committees of the board. The directors believe that all representations made to the independent auditors during their
audit are valid and appropriate.
Approval of the financial statementsThe financial statements which appear on pages 74 to 132 were approved by the directors on 25 August 2008 and are signed on
its behalf.
LM Nestadt DB Rivkind
Non-executive chairman Chief financial officer
BM Levy MS Levy
Joint chief executive officer Joint chief executive officer
In terms of section 268G(d) of the South African Companies Act, 1973, as amended (Act), I certify that Blue Label Telecoms Limited
has lodged with the Registrar of Companies all such returns as are required of a public company in terms of the Act. Further, that
such returns are true, correct and up to date.
E Viljoen
Company secretary
Sandton
25 August 2008

70
’for the year ended 31 May 2008
To the members of Blue Label Telecoms Limited
We have audited the annual financial statements and group annual financial statements of Blue Label Telecoms Limited, which comprise the directors’ report, the balance sheet and the consolidated balance sheet as at 31 May 2008, the income statement and the consolidated income statement, the statement of changes in equity and the consolidated statement of changes in equity, the cash flow statement and the consolidated cash flow statement for the year then ended, and a summary of significant accounting policies and other explanatory notes, as set out on pages 74 to 132.
Directors’ responsibility for the financial statementsThe company’s directors are responsible for the preparation and fair presentation of these financial statements in accordance with International Financial Reporting Standards, and in the manner required by the Companies Act of South Africa. This responsibility includes: designing, implementing and maintaining internal control relevant to the preparation and fair presentation of financial statements that are free from material misstatement, whether due to fraud or error; selecting and applying appropriate accounting policies; and making accounting estimates that are reasonable in the circumstances.
Auditors’ responsibilityOur responsibility is to express an opinion on these financial statements based on our audit. We conducted our audit in accordance with International Standards on Auditing. Those standards require that we comply with ethical requirements and plan and perform the audit to obtain reasonable assurance whether the financial statements are free from material misstatement.
An audit involves performing procedures to obtain audit evidence about the amounts and disclosures in the financial statements. The procedures selected depend on the auditor’s judgement, including the assessment of the risks of material misstatement of the financial statements, whether due to fraud or error. In making those risk assessments, the auditor considers internal control relevant to the entity’s preparation and fair presentation of the financial statements in order to design audit procedures that are appropriate in the circumstances, but not for the purpose of expressing an opinion on the effectiveness of the entity’s internal control. An audit also includes evaluating the appropriateness of accounting policies used and the reasonableness of accounting estimates made by the directors, as well as evaluating the overall presentation of the financial statements.
We believe that the audit evidence we have obtained is sufficient and appropriate to provide a basis for our audit opinion.
OpinionIn our opinion, the financial statements present fairly, in all material respects, the financial position of the company and of the group as of 31 May 2008, and of the financial performance and the cash flows for the year then ended in accordance with International Financial Reporting Standards, and in the manner required by the Companies Act of South Africa.
PricewaterhouseCoopers Inc Director: EJ GerrytsRegistered Auditor Johannesburg
25 August 2008
2 Eglin RoadSunninghill2157
National executive:C Beggs (Chief Executive Officer), F Tonelli (Chief Operating Officer), ER MacKeown (Director – Managing Johannesburg Office)
The Company’s principle place of business is at 2 Eglin Road, Sunninghill where a list of directors’ names is available for inspection.

71
The directors have pleasure in presenting the annual financial statements of Blue Label Telecoms Limited (Blue Label Telecoms) and its subsidiary and associate companies (the group) for the year ended 31 May 2008.
Nature of business Blue Label Telecoms is a leading distributor of prepaid secure electronic tokens of value and transactional services within emerging and developing economies. Its core business is the virtual distribution of secure electronic tokens of value (predominantly prepaid airtime at present) and transactional services across its global footprint of touch points.
ListingBlue Label Telecoms listed in the Mobile Telecommunications sector of the JSE Limited on 14 November 2007 under the abbreviated name of Bluetel. The listing was done by way of a private placing. The main purpose of the private placing was to raise capital in order to fund current and future operations including the expansion of the group.
The company registration number is 2006/022679/06. The registered office is 75 Grayston Drive, Morningside Ext 5, Sandton, South Africa.
Share capital Authorised capital The authorised capital of the company comprises 1 000 000 000 ordinary shares of R0,000001 each.
Issued capital As at 31 May 2008 the issued share capital of the company was R766 divided into 766 360 894 ordinary shares of R0,000001 each. Other than the shares issued in terms of the private placing, no shares were issued during the period under review.
Refer note 13 to the group annual financial statements for full details of the share capital of the company.
Financial resultsFull details of the financial position and results of the company, the group and its segments are set out in the annual financial statements, and group annual financial statements.
DividendsBlue Label Telecoms expects to initiate a competitive dividend policy from the financial year commencing 1 June 2010. It is anticipated that interim dividends will be paid in February and final dividends will be paid in August of each financial year, in the approximate proportion of one-third and two-thirds of the annual dividend, respectively.
Subsidiaries, associates and other investmentsParticulars of the principal subsidiaries, joint ventures and associates of the Blue Label Telecoms group are provided in note 29 to the annual financial statements.
Strategic initiatives and acquisitions Microsoft Corporation (“Microsoft”)As previously disclosed to shareholders, Blue Label Telecoms and Microsoft signed a strategic collaboration agreement in November 2007 to provide each other with mutual assistance in exploring new business opportunities and preferred partnership initiatives across the world’s emerging
and developing economies. To date, the group has made significant progress with respect to integrating its core technology and services infrastructure into Microsoft’s service platforms, allowing for the imminent delivery of co-packaged services to support key group requirements, including those of the group’s mobile services business.
Content Connect Africa (Proprietary) LimitedIn January 2008, Blue Label Telecoms concluded an agreement to acquire the entire issued share capital of Content Connect Africa (Proprietary) Limited (“CCA”) for a consideration of R30 million.
CCA is an aggregator and provider of on-portal and off-portal localised content to mobile operators and third-party clients throughout Africa. CCA’s core business includes the distribution and marketing of mobile music, games and entertainment; interactive television; television and in-store music as well as the exclusive local rights to Prefueled, a full scale kiosk and web-based digital entertainment provider of music, video, games and lifestyle products.
Little River Trading 181 (Proprietary) Limited trading as Crown CellularOn 29 February 2008, the Competition Tribunal unconditionally approved the acquisition of the assets of the business conducted by Close Trade 393 CC trading as Crown Cellular (“Crown Cellular”) by The Prepaid Company (Proprietary) Limited, a major subsidiary of Blue Label Telecoms. The purchase consideration for the acquisition amounted to R90 million.
Crown Cellular is a wholesaler of prepaid airtime to the informal market. The business has successfully penetrated this market, due to its ability to make product available through otherwise difficult distribution channels. The business operates through exclusive supply agreements entered into with owner-managed cash and carry stores.
For further details of acquisitions during the year, refer to note 24 to the annual financial statements.
Post balance sheet eventsSubsequent to the financial year-end, Blue Label Telecoms, or its subsidiaries have entered into the following transactions:
Blue Label Telecoms purchased a 50% shareholding in a procurement company called Demtrade 11 (Proprietary) Limited for R3,03 million. The objective of the purchase is to centralise group procurement in order to realise greater efficiencies from the restructured group and to ensure the co-ordination of Blue Label Telecom’s BEE procurement initiatives. The company shall operate as a profit centre and shall seek also to offer similar services to external operations. The operational minorities in the company have extensive experience in the procurement field, gained both in businesses that they established themselves and in listed procurement and logistics companies.
Gold Label Investments (Proprietary) Limited (“Gold Label”) (a wholly owned subsidiary of Blue Label Telecoms) increased its stake, via sale and subscription, in Oxigen Services India Private Limited (“Oxigen”) (following a slight dilution occasioned by a share issuance to employees) to 38,85% for a consideration of US$9,15 million. This was pursuant to an agreement entered into with Microsoft Corporation who also took up 38,85% of the shares in
71
’

72
’
Oxigen. Following receipt of approval from the Reserve Bank, the additional shares were transferred to Gold Label in June 2008.
Gold Label has acquired a 17,25% interest in a United Kingdom based company called Smart Voucher Limited (trading under the name of Ukash) for an amount of US$6 million. That permission has not yet been obtained. Gold Label also has an option to purchase an additional 32,75% in the company in the next three years. This company has developed valuable proprietary technology which enables the purchase of a prepaid voucher that may be redeemed for online products and services, and will be integral to Blue Label Telecom’s mobile strategy in the future. The company has a footprint in Western Europe and intends to expand into developing markets, such as India, which have populations that are technologically sophisticated but are often unbanked.
Blue Label Telecoms has jointly established Blue Label Mexico, with Nadhari S.A. de C.V., a Mexican company that has expertise in the strategic and operational development of products and services within emerging markets. Blue Label Mexico has been created to pursue opportunities which are complementary to Blue Label Telecom’s current areas of business. The establishment of a business presence in Mexico is an important step in the group’s goal of creating a transaction-based distribution network in the emerging markets of Latin America. Blue Label Telecoms has subscribed for 50% plus one share of the company for US$3,5 million.
Content Connect Australia (Proprietary) Limited was
established by Blue Label Telecoms (holding 50,25% for a subscription price of AUS$500 000), Shark Reef Enterprises Limited and Daniel Segal, in Australia. The company owns or has access to significant music and other content which it makes available to Australian consumers online and through their mobile devices, utilising the model successfully developed by Content Connect South Africa (Proprietary) Limited.
Answers Direct (Proprietary) Limited is a company established by Blue Label Call Centre (Proprietary) Limited (80% held following a subscription for R150 000) and the balance held by the founding member of the close corporation out of which the business assets were acquired. The company operates an inbound and outbound call centre business. Its acquisition is consistent with the strategy of the call centre segment of the Blue Label Telecoms group to acquire additional call centre seats through which it can sell its suite of products.
Africa Prepaid Services RDC SPRL (a subsidiary of Africa Prepaid Services (Pty) Ltd) purchased a 51% stake in a business called E-Talk Box DRC for a purchase consideration of US$400 000. The company has successfully implemented a community based call box solution in the Democratic Republic of Congo.
The company is in the process of finalising a share incentive scheme for staff members. The arrangement shall be in the form of a forfeitable share plan and shall be presented to shareholders for approval at the upcoming annual general meeting.
Directorate The following were directors of the company for the period under review:
Name Office Appointment date
Larry M Nestadt Independent non-executive chairman 5 October 2007Brett M Levy Joint chief executive officer 1 February 2007Mark S Levy Joint chief executive officer 1 February 2007Sidney Ellerine Non-executive director 5 October 2007Gary D Harlow Non-executive director 5 October 2007Reitumetse J Huntley Independent non-executive director 5 October 2007Neil N Lazarus Non-executive director 5 October 2007Peter Mansour Non-executive director 21 May 2008Joe S Mthimunye Independent non-executive director 5 October 2007Mark V Pamensky Chief operating officer 5 October 2007David B Rivkind Chief financial officer 5 October 2007Herbert C Theledi Non-executive director 5 October 2007Lucy (“Pani”) M Tyalimpi Independent non-executive director 5 October 2007
In accordance with the company’s articles of association all directors will retire by rotation at the company’s first annual general meeting to be held on 12 November 2008. The directors have offered themselves for re-election by shareholders.
Directors’ interestsThe individual interests declared by directors and officers in the company’s share capital as at 31 May 2008, held directly or indirectly were as follows:
Nature of interest
DirectorDirect
beneficialIndirect
beneficialDirect
non-beneficialIndirect
non-beneficial
BM Levy 73 290 553 7 272 778 — —MS Levy 65 883 145 7 272 777 — —S Ellerine — 15 409 152 — 2 222 222HC Theledi — 44 992 807 — —MV Pamensky — 6 565 738 — —LM Nestadt — 8 204 674 — —GD Harlow — 3 277 871 — 14 815NN Lazarus 8 204 673 — — 177 779RJ Huntley — 2 241 634 — —
The aggregate interest of the current directors in the capital of the company was as follows:
Number of shares
2008 2007Beneficial 242 615 802 —
Non-beneficial 2 414 815 —

73
The shareholding within Nthwese Investment Holdings Corporation (Proprietary) Limited (“Nthwese”) was reorganised during this period. As part of the reorganisation, Joe Mthimunye’s interest in Nthwese (and thus his beneficial interest in the company) was disposed of.
Following the reorganisation of the shareholding in Nthwese, Reitumetse Jackie Huntley and Herbert Cedrik Theledi each currently hold a beneficial interest in Nthwese of 3,8% and 56,2% respectively, resulting in an indirect beneficial holding in Blue Label Telecoms of 1 368 998 and 20 246 763 respectively.
As part of the preferential placement (see page 1 of the PLS) shares in Blue Label Telecoms were allocated to Gary David Harlow’s spouse (14 815 shares), to Neil Norman Lazarus’ spouse (177 778 shares) and to a company in which Sidney Ellerine has an indirect non-beneficial interest (2 222 222 shares).
Reference was made to the SENS announcement of 15 November 2007, which provided details of the refinancing of Nthwese, Blue Label Telecoms’ BEE partner. Certain directors of Blue Label Telecoms purchased shares from Nthwese’s financier under a funding arrangement entered into by Nthwese pursuant to its purchase of the Public Investment Corporation’s interest in Blue Label Telecoms. In this regard Brett Marlon Levy purchased 4 115 755 shares, Mark Steven Levy 3 319 300 shares, Mark Vivian Pamensky 409 727 shares, Neil Norman Lazarus 509 660 shares, Gary David Harlow 199 866 shares and Larry Michael Nestadt 509 660 shares.
The announcement referred to above further advised that Nthwese sold eight million shares into the market on listing, as part of its financing arrangements.
ResolutionsThe company passed and registered a special resolution on 28 September 2007 approving the following:1. The sub-division of the company’s shares.2. A specific repurchase of shares to facilitate the listing.3. The change of name of the company to Blue Label
Telecoms (Proprietary) Limited.4. The conversion of the company into a public company.5. The adoption of new memorandum and articles of
association.6. The acquisition by the company or any of its subsidiaries of
the company’s shares.
No other special resolutions, the nature of which might be significant to shareholders in their appreciation of the state of affairs of the group, were passed by the company or its subsidiaries during the period covered by this annual report.
SecretaryThe company secretary is E Viljoen. The business and postal address of the company secretary appear on page 137.
AuditorsPricewaterhouseCoopers Incorporated will continue in office in accordance with section 270 (2) of the Companies Act.
The beneficial interest held by directors and officers of the company constitutes 31,65% of the issued share capital of the company and the non-beneficial interest represents 0,32% of the issued share capital.
Subsequent to the disclosure of directors interests contained in paragraph 18 of the pre-listing statement (“PLS”), but prior to listing, the following changes occurred in the direct and indirect beneficial interests that directors have in the shares of Blue Label Telecoms:
Paragraph 18 of the PLS described the beneficial interests of the directors in Blue Label Telecoms prior to the private placement, as well as their interests after the private placement. A portion of the private placement consisted of the offer for sale which represented shares disposed of by the original Blue Label Investment shareholders to settle funding obligations. The calculations in paragraph 18 of the PLS reflecting the movement between the “Before the Private Placing and after the Restructuring” and “After the Private Placing” tables was based on the mid price of R6,25 of the private placing range of between R5,75 – R6,75. The actual private placing price was R6,75 resulting in the actual number of shares sold being less than that assumed in the PLS. In this regard, the actual number of shares after the private placement, held by the affected directors, was:
Mark Steven Levy – 79 170 638;Brett Marlon Levy – 78 375 183;Mark Vivian Pamensky – 6 657 081;Larry Michael Nestadt – 7 695 013;Gary David Harlow – 3 078 005;Herbert Cedrik Theledi – 34 683 312;Neil Norman Lazarus – 7 695 013.
Paragraph 18 further detailed the acquisition of R50 million of Blue Label Telecoms shares, which equated to 7 407 407 shares, which was intended to be funded by Brett Marlon Levy on behalf of certain employees. This initiative has not been proceeded with as Blue Label Telecoms has decided to implement a group wide share incentive scheme, the details of which are provided above, and which will be voted on by shareholders at the Blue Label Telecoms annual general meeting. The shares have therefore been retained by Brett Marlon Levy.
In accordance with paragraph 61 of the PLS, the directors listed below disposed of shares in terms of the further allotment option awarded to the bookrunner at the bookrunner’s discretion:
Mark Steven Levy – 9 335 018;Brett Marlon Levy – 9 335 018;Mark Vivian Pamensky – 501 070;Herbert Cedrik Theledi – 4 801 898.
Mark Steven Levy and Brett Marlon Levy’s shares were disposed of as part of Microsoft Corporation’s 12% acquisition of Blue Label Telecoms. Shotput Investments (Proprietary) Limited also disposed of 15 918 545 shares to Microsoft Corporation (thereby reducing the indirect interest that Sidney Ellerine has in Blue Label Telecoms). Mark Vivian Pamensky’s and Herbert Cedrik Theledi’s shares were disposed of in the open market.

74
Note
31 May2008
Actual auditedR’000
31 May2007
Predecessorvalue
auditedR’000
ASSETS
Non-current assets 712 759 276 238
Property plant and equipment 4 69 484 43 516
Intangible assets 5 223 544 72 113
Goodwill 5 266 242 46 907
Investment in associates and joint ventures 6 81 356 61 804
Financial assets at amortised cost 7 72 133 51 898
Current assets 2 509 470 1 685 835
Financial assets at fair value through profit and loss 8 5 672 16 183
Financial assets at amortised cost 7 53 163 32 485
Inventories 9 484 501 263 631
Loans receivable 10 7 103 4 751
Trade and other receivables 11 630 687 278 741
Cash and cash equivalents 12 1 328 344 1 090 044
Total assets 3 222 229 1 962 073
EQUITY AND LIABILITIES
Capital and reserves 1 917 944 418 021
Share capital 13 * *
Share premium 4 404 737 2 079 533
Restructuring reserve (1 843 912) (1 843 912)
Foreign currency translation reserve 2 552 4 188
Transaction with minority reserve (898 564) (14 893)
Retained earnings 244 758 63 867
1 909 571 288 783
Minorities interest 8 373 129 238
Non-current liabilities 58 056 38 815
Deferred taxation 14 55 111 21 085
Interest bearing borrowings 15 2 945 17 730
Current liabilities 1 246 229 1 505 237
Trade and other payables 16 1 152 969 888 011
Non-interest-bearing borrowings 17 9 041 33 245
Current tax liabilities 71 146 31 617
Bank overdraft 12 50 —
Current portion of interest bearing borrowings 15 13 023 552 364
Total equity and liabilities 3 222 229 1 962 073
*Less than R1 000
audited results as at 31 May 2008

75
Notes
2008Pro forma**
unauditedR’000
2008Actual
auditedR’000
2007Predecessor
value auditedR’000
Revenue 12 930 609 12 545 471 8 895 044
Other income 68 142 69 545 34 585
Changes in inventories of finished goods (12 211 507) (11 875 606) (8 469 965)
Employee compensation and benefit expense (275 629) (265 003) (142 320)
Depreciation, amortisation and impairment charges (73 675) (58 670) (26 682)
Other expenses (164 686) (146 240) (88 208)
Operating profit 18 273 254 269 497 202 454
Finance costs 19 (106 604) (147 704) (134 280)
Finance income 19 239 470 193 281 96 029
Share of losses from associates 6 (19 661) (17 441) (956)
Net profit before taxation 386 459 297 633 163 247
Taxation 20 (116 529) (89 841) (53 420)
Net profit for the year 269 930 207 792 109 827
Equity holders of the parent 269 423 180 891 63 867
Minority interest 507 26 901 45 960
Earnings per share for profit attributable to equity holders (cents)
– Basic 21 35,16 30,65 16,89
– Headline 21 34,86 30,26 15,29
** Refer to annexure 1 for a reconciliation between group net profit and group pro forma net profit.
for the year ended 31 May 2008

76
audited results as at 31 May 2008
Note
Share capitalR’000
Share premium
R’000
Retainedearnings
R’000
Restruc-turing
reserve1
R’000
Foreigncurrency
trans-lation
reserveR’000
Trans-action
with minorityreserve2
R’000
Totalordinary
share-holders
equityR’000
Minority interest
R’000
TotalequityR’000
Balance as at 1 June 2006 * 2 079 533 — (1 998 328) — — 81 205 — 81 205
Net profit for the year — — 63 867 — — — 63 867 45 960 109 827
Dividends — — — — — — — (348) (348)
Minorities acquired during the year — — — 150 998 — (14 893) 136 105 83 631 219 736
Associates acquired during the year — — — 3 418 — — 3 418 — 3 418
Exchange gains on translation of foreign operations — — — — 4 188 — 4 188 (5) 4 183
Balance as at 31 May 2007 * 2 079 533 63 867 (1 843 912) 4 188 (14 893) 288 783 129 238 418 021
Shares issued during the year 13 * 2 364 928 — — — — 2 364 928 — 2 364 928
Share issue costs — (39 724) — — — — (39 724) — (39 724)
Net profit for the year — — 180 891 — — — 180 891 26 901 207 792
Dividends — — — — — — — (998) (998)
Minorities disposed of during the year — — — — — (883 671) (883 671) (146 294)
(1 029 965)
Exchange losses on translation of foreign operations — — — — (1 636) — (1 636) (474) (2 110)
Balance as at 31 May 2008 * 4 404 737 244 758 (1 843 912) 2 552 (898 564) 1 909 571 8 373 1 917 944
* Less than R1 000
1 The restructuring reserve arose as a result of the restatement of group comparatives, as required in terms of the principles of predecessor accounting. This reserve represents the difference between the fair value of the entities under the group’s control and their respective net asset values, as at the assumed restructure date of 1 June 2006.
2 The transaction with minority reserve relates to goodwill arising on transactions with minority shareholders as these are treated as equity participants.

77
for the year ended 31 May 2008
Note
31 May2008
Actual auditedR’000
31 May2007
Predecessorvalue
auditedR’000
Cash flows from operating activities
Cash received from customers 12 193 526 8 616 303
Cash paid to suppliers and employees (12 272 774) (8 411 815)
Cash generated by operations 22 (79 248) 204 488
Interest received 19 177 377 83 314
Interest paid 19 (46 575) (62 942)
Taxation paid 23 (71 350) (55 890)
Net cash flows from operating activities (19 796) 168 970
Cash flows from investing activities
Proceeds on disposal of shares in associate — 17 160
Proceeds on disposal of intangible assets 889 3 224
Acquisition of intangible assets (22 898) (11 286)
Acquisition of financial assets at fair value through profit or loss (1 391) (7 561)
Proceeds on disposal of financial assets at fair value through profit or loss 11 722 6 893
Exercise of share warrants in associate 6 (7 021) —
Acquisition of business combinations net of cash acquired 24 (313 364) 704 285
Loans advanced to associates (38 618) (14 222)
Dividends received 120 3 570
Proceeds on disposal of property, plant and equipment 12 642 3 915
Acquisition of property, plant and equipment (47 238) (21 595)
Net cash flows from investing activities (405 157) 684 383
Cash flows from financing activities
(Repayment of) /proceeds from interest bearing borrowings (590 076) 203 446
(Repayment of) /proceeds from non-interest-bearing borrowings (28 031) 33 245
Proceeds from issue of shares 1 319 613 —
Share issue costs (39 724) —
Net cash flows from financing activities 661 782 236 691
Increase in cash and cash equivalents 236 829 1 090 044
Cash and cash equivalents at the beginning of the year 1 090 044 —
Translation difference 1 421 —
Cash and cash equivalents at the end of the year 12 1 328 294 1 090 044

78
audited results as at 31 May 2008
Blue Label Telecoms Limited (“the company”) and its subsidiaries (together referred to as “the group”) is involved in the procurement, selling and distribution of prepaid products for inter-alia fixed and mobile networks and all business ancillary thereto.
The annual financial statements comprise the consolidated financial statements of the group and the stand-alone financial statements of the company and were authorised by the board of directors, as indicated on page 69.
1. Significant accounting policiesStatement of compliance
The annual financial statements have been prepared in accordance with International Financial Reporting Standards (“IFRS”) and its interpretations adopted by the International Accounting Standards Board (“IASB”) and the Companies Act, No. 61 of 1973, as amended. These financial statements are prepared in accordance with IFRS, issued and effective as at 31 May 2008. The group has early adopted IFRS 8 – Operating Segments.
Basis of preparation The annual financial statements and group financial
statements are prepared under the historical cost convention, as modified by the revaluation of certain financial instruments. The preparation of financial statements in conformity with IFRS requires management to make judgements, estimates and assumptions that affect the application of policies and reported amounts of assets and liabilities, income and expenses. The estimates and associated assumptions are based on historical experience and various other factors that are believed to be reasonable under the circumstances. Actual results may differ from these estimates.
The estimates and underlying assumptions are reviewed on an ongoing basis. Revisions to accounting estimates are recognised in the period in which the estimate is revised if the revision affects only that period, or in the period of the revision and future periods if the revision affects both current and future periods.
Judgements made by management in the application of IFRS that have a significant effect on the financial statements and estimates with a significant risk of material adjustment in the next year are discussed in note 2.
The comparative balances in the group financial statements arise from the application of predecessor accounting.
The accounting policies set out below are consistent with the accounting policies applied by BLI, with the exception of common control transactions and
transactions with minorities. Transactions with minorities were accounted for in BLI under the parent company model, and are accounted for under the economic entity method in BLT. Details of the accounting policies are included below.
Standards, interpretations and amendments to published standards that are not yet effective
Certain new standards, amendments and interpretations to existing standards have been published that are mandatory for the financial year commencing 1 June 2009, but which the group has not early adopted, are as follows:
Standards, amendments and interpretations not yet effectiveThe group has evaluated the effect of all new standards, amendments and interpretations that have been issued but which are not yet effective. Based on the evaluation, management does not expect these standards, amendments and interpretations to have a significant impact on the group’s results and disclosures. The expected implications of applicable standards, amendments and interpretations are dealt with below.
IAS 1 (Revised) Presentation of Financial StatementsThe main objective of IAS 1 was to aggregate information in the financial statements on the basis of shared characteristics. With this in mind, the International Accounting Standards Board (“IASB”) considered it useful to separate changes in equity (net assets) of an entity during a period arising from transactions with owners in their capacity as owners from other changes in equity. Consequently, the IASB decided that all owner changes in equity should be presented in the statement of changes in equity, separately from non-owner changes in equity.
In addition, the board’s intention in revising IAS 1 was to improve and reorder sections of IAS 1 to make it easier to read. The board’s objective was not to reconsider all the requirements of IAS 1.
The changes relate to disclosure in the financial statements and are unlikely to have a significant impact on the group’s financial statements. These changes are effective for the financial year commencing on 1 June 2009.
IAS 23 (Revised) Borrowing CostsBorrowing costs that are directly attributable to the acquisition, construction or production of a qualifying asset form part of the cost of that asset and may no longer be expensed. Other borrowing costs are recognised as an expense.

79
The group has not previously capitalised borrowing costs and furthermore does not have any qualifying projects, therefore no impact is expected.
IAS 27 (Revised) Consolidated and Separate Financial StatementsIn 2008 IAS 27 was amended as part of the second phase of the business combinations project. That phase of the project was undertaken jointly with the US Financial Accounting Standards Board (“FASB”) and the IASB. The amendments related, primarily, to accounting for non-controlling interests and the loss of control of a subsidiary.
The group already applies the economic entity model in their financial statements and therefore management believe their will be limited effects from the application of IAS 27R.
IAS 27R and IFRS 3R Business Combinations have to be adopted in the same period. Both these standards are effective for the period commencing on 1 June 2009.
IFRS 2 Amended Share-based Payments Vesting Conditions and CancellationsIFRS 2 was amended to provide more clarity on vesting conditions and cancellations. There are limited share-based payments schemes within the group and the impact is not likely to be significant.
IFRS 3 (Revised) Business Combinations As noted above IAS 27R and IFRS 3R were issued as part of a joint effort by the IASB and the US FASB to improve financial reporting while promoting the international convergence of accounting standards. The objective of the IFRS is to enhance the relevance, reliability and comparability of the information that an entity provides in its financial statements about a business combination and its effects.
As the standard will only be applicable to acquisitions on or after 1 June 2009, no effect has yet been considered.
IFRIC 12 Service concession arrangements This interpretation gives guidance on the accounting by operators for public-to-private service concession arrangements.
This Interpretation is not applicable to the group.
IFRIC 13 Customer Loyalty ProgrammeThis interpretation addresses how companies that grant their customers loyalty awards credits when buying goods or services, should account for their obligation to provide free or discounted goods, or services, if and when customers redeem the points.
This interpretation is not applicable to the group.
IFRIC 14 Limit on a Defined Benefit Asset Minimum Funding Requirements and their InteractionIFRIC 14 addresses three issues:
how entities should determine the limit placed by IAS 19 Employee Benefits on the amount of a surplus in a pension plan they can recognise as an asset
how a minimum funding requirement affects that limit and
when a minimum funding requirement creates an onerous obligation that should be recognised as a liability in addition to that otherwise recognised under IAS 19.
The effect of the interpretation is being considered.
IFRIC 15 Agreements for the Construction of Real EstateThe interpretation will standardise accounting practice across jurisdictions for the recognition of revenue among real estate developers for sales of units, such as apartments or houses, “off plan”, ie before construction is complete.
The interpretation provides guidance on how to determine whether an agreement for the construction of real estate is within the scope of IAS 11 Construction Contracts or IAS 18 Revenue and when revenue from the construction should be recognised.
The main expected change in practice is a shift for some entities from recognising revenue using the percentage of completion method (ie as construction progresses, by reference to the stage of completion of the development) to recognising revenue at a single time (ie at completion upon or after delivery).
This interpretation is not applicable to the group.
IFRIC 16 Hedges of a Net Investment in a Foreign OperationIFRIC 16 applies to an entity that hedges the foreign currency risk arising from its net investments in foreign operations and wishes to qualify for hedge accounting in accordance with IAS 39.
For convenience the interpretation refers to such an entity as a parent entity, however, all references to a parent entity apply equally to an entity that has a net investment in a foreign operation that is a joint venture, an associate or a branch.
The Interpretation does not apply to other types of hedge accounting; it should not be applied by analogy.
This interpretation is not applicable to the group.

80
audited results as at 31 May 2008
1. Significant accounting policies (continued) Standards, amendments and interpretations not yet
effective (continued)
Annual Improvements ProjectThe IASB decided to initiate an annual improvements project in 2007 as a method of making necessary, but non-urgent, amendments to IFRS that will not be included as part of another major project. The IASB’s objective was to ease the burden for all concerned.
Unless otherwise specified the amendments are effective for annual periods beginning on or after 1 January 2009, although entities are permitted to adopt them earlier.
The following standards have been effected by the project:
IFRS 5 Non-current Assets Held for SaleIAS 1 Presentation of Financial StatementsIAS 16 Property, Plant and EquipmentIAS 19 Employee BenefitsIAS 20 Accounting for Government GrantsIAS 23 Borrowing CostsIAS 27 Consolidated and Separate FinancialStatementsIAS 28 Investments in AssociatesIAS 31 Interests in Joint Ventures
IAS 29 Financial Reporting in Hyperinflationary EnvironmentIAS 36 Impairment of AssetsIAS 38 Intangible Assets
IAS 39 Financial Instruments: Recognition and MeasurementIAS 40 Investment PropertyIAS 41 Agriculture
Management are currently considering the effect of the changes.
The group has early adopted IFRS 8 – Operating Segments. The standard requires the segmental disclosures to be reported based on the “management approach”. The reporting would be based on the information that management uses internally for evaluating segment performance and when deciding to allocate resources to operating segments. IFRS 8 will supersede the current standard dealing with segmental reporting, IAS 14. The group had not previously applied the requirements of IAS 14. Refer to note 28.
Basis of consolidationSubsidiaries
Subsidiaries are all entities (including Special Purpose Entities) in which the group has an interest of more
than one half of the voting rights or otherwise has power to govern the financial and operating policies.
The existence and effect of potential voting rights that are presently exercisable or presently convertible are considered when assessing whether the group controls another entity.
Subsidiaries are consolidated from the date on which control is transferred to the group and are no longer consolidated from the date that control ceases. The purchase method of accounting is used to account for the acquisition of subsidiaries. The cost of an acquisition is measured as the fair value of the assets given up, shares issued, or liabilities undertaken at the date of acquisition plus costs directly attributable to the acquisition. Identifiable assets acquired and liabilities and contingent liabilities assumed in a business combination are measured initially at their fair values at the acquisition date, irrespective of the extent of any minority interest.
Transactions in which combining entities are controlled by the same party or parties before and after the transaction, and that control is not transitory, are referred to as common control transactions.
The telecommunications operations of BLI were “spun off” into a separate entity, BLT, which was subsequently listed. In terms of this “spin off” transaction, the shareholders and shareholdings of both BLI and BLT remained the same prior to the listing of BLT. The accounting treatment of a “spin off” is not dealt with under IFRS but is similar in nature to the accounting treatment of a common control transaction.
There is currently no guidance under IFRS for the accounting treatment of such transactions. In terms of IAS 8 – Accounting Policies, Changes in Accounting Estimates and Errors, the group may either apply IFRS 3 – Business Combinations or a similar GAAP. US GAAP uses the predecessor values with the restatement of comparatives method for such transactions, and the group has elected to apply this as their policy for common control transactions. Therefore no purchase price allocation is performed and any difference between the net asset value and the amount paid (ie the purchase consideration) is recorded directly in the restructuring reserve in equity. Comparatives have been restated in line with this policy for group purposes. For company purposes, comparatives have not been restated and transactions are accounted for from their effective date.
Intercompany transactions, balances and unrealised gains on transactions between group companies

81
are eliminated; unrealised losses are also eliminated unless costs cannot be recovered. The interests of minority shareholders in the consolidated equity and results of the group are shown separately in the consolidated balance sheet and income statement, respectively. Where the losses attributable to the minority shareholders in a consolidated subsidiary exceed their interest in that subsidiary, the excess, and any further losses attributable to them, are recognised by the group and allocated to those minority interests only to the extent that the minority shareholders have a binding obligation and are able to fund the losses. Where the group previously did not recognise the minority shareholders’ portion of losses and the subsidiary subsequently turns profitable, the group recognises all the profits until the minority shareholders’ share of losses previously absorbed by the group has been recovered.
Minority interest is stated at the minority’s proportion of the fair values of the identifiable assets and liabilities recognised. The group applies the economic entity method in accounting for transactions with minority shareholders. Minority shareholders are treated as equity participants. Acquisitions of minorities or disposals by the group of its minority interests in subsidiary companies where control is maintained subsequent to the disposal are accounted for as equity transactions with minorities. Consequently, the difference between the purchase price and the book value of a minority interest purchased is recorded in equity. All profits and losses arising as a result of the disposal of interests in subsidiaries to minorities where control is maintained subsequent to the disposal, are also recorded in equity.
When necessary, accounting policies of subsidiaries have been changed to ensure consistency with the policies adopted by the group.
The company financial statements account for subsidiaries at cost less any accumulated impairment.
Associates Associates are all entities over which the group
has significant influence but not control, generally accompanying a shareholding of between 20% and 50% of the voting rights. Investments in associates are accounted for by the equity method of accounting and are initially recognised at cost. The group’s investment in associates includes goodwill (net of any accumulated impairment loss) identified on acquisition.
The group’s share of its associates’ post-acquisition profits or losses is recognised in the income statement, and
its share of post-acquisition movements in reserves is recognised in reserves. The cumulative post-acquisition movements are adjusted against the carrying amount of the investment. When the group’s share of losses in an associate equals or exceeds its interest in the associate, including any other unsecured receivables, the group does not recognise further losses, unless it has incurred obligations or made payment on behalf of the associate. Unrealised gains on transactions between the group and its associates are eliminated to the extent of the group’s interest in the associate. Unrealised losses are also eliminated to the extent of the group’s interest in the associate unless the transaction provides evidence of an impairment of the asset transferred. Accounting policies of associates have been changed where necessary to ensure consistency with the policies adopted by the group.
The company financial statements account for associates at cost less any accumulated impairment.
A listing of the group’s principal subsidiaries and associates is set out in note 29 to the financial statements. The financial effects of the acquisition and disposal of the subsidiaries and associates are disclosed separately in the notes to the financial statements.
Joint ventures A joint venture is a contractual arrangement whereby two
or more parties undertake an economic activity that is subject to joint control. Joint control is the contractually agreed sharing of control over an economic activity, and exists only when the strategic financial operating decisions relating to the activity require the unanimous consent of the parties sharing control (venturers).
The group’s interest in its joint venture is accounted for under the equity method of accounting whereby an interest in jointly controlled entities is initially recorded at cost and adjusted thereafter for post-acquisition changes in the group’s share of net assets of the joint venture. The income statement reflects the group’s share of the results of operations of the joint venture.
The company financial statements account for joint ventures at cost less any accumulated impairment.
Foreign currencies(a) Functional and presentation currency Items included in the financial statements of each
of the group’s entities are measured using the currency of the primary economic environment in which the entity operates (“the functional currency”). The consolidated financial statements are presented in Rand, which is the company’s functional and presentation currency.

82
audited results as at 31 May 2008
1. Significant accounting policies (continued) Foreign currencies (continued)(b) Transactions and balances Foreign currency transactions are translated into the
functional currency using the exchange rates prevailing at the dates of the transactions. Foreign exchange gains and losses resulting from the settlement of such transactions and from the translation at year-end exchange rates of monetary assets and liabilities denominated in foreign currencies are recognised in the income statement.
Changes in the fair value of monetary securities denominated in foreign currency classified as available-for-sale are analysed between translation differences resulting from changes in the amortised cost of the security and other changes in the carrying amount of the security. Translation differences related to changes in the amortised cost are recognised in profit or loss, and other changes in the carrying amount are recognised in equity.
Translation differences on non-monetary financial assets and liabilities are reported as part of the fair value gain or loss. Translation differences on non-monetary financial assets and liabilities such as equities held at fair value through profit or loss are recognised in profit or loss as part of the fair value gain or loss. Translation differences on non-monetary financial assets such as equities classified as available-for-sale are included in the available-for-sale equity reserve.
(c) Group companies The results and financial position of associates (none
of which has the currency of a hyperinflationary economy) that have a functional currency different from the presentation currency are translated into the presentation currency as follows:
assets and liabilities are translated at the closing rate at the date of that balance sheet; andincome and expenses are translated at average exchange rates (unless this average is not a reasonable approximation of the cumulative effect of the rates prevailing on the transaction dates, in which case income and expenses are translated at the dates of the transactions); andall resulting exchange differences are recognised as a separate component of equity.
On consolidation, exchange differences arising from the translation of the net investment in foreign entities, and of borrowings and other currency instruments designated as hedges of such investments, are taken to shareholders’ equity. When a foreign operation is sold, such exchange differences are recognised in the income statement as part of the gain or loss on sale.
Goodwill and fair value adjustments arising on the acquisition of a foreign entity are treated as the foreign entity’s assets and liabilities and are translated at the closing rate.
Financial instruments Financial instruments carried on the balance sheet
include:financial assets at fair value through profit or loss;financial assets at amortised cost;loans receivable;trade and other receivables;cash and cash equivalents;borrowings;trade and other payables; andbank overdraft.
The particular recognition methods adopted are disclosed in the individual policy statements associated with each item.
The purchases and sales of financial assets that require delivery are recognised on trade date, being the date on which the group commits to purchase or sell the asset.
The group recognises a financial asset or a financial liability on its balance sheet when, and only when, the group becomes a party to the contractual provisions of the instrument.
Financial assets are derecognised when the rights to receive cash flows from the financial asset have expired or have been transferred and the group has transferred substantially all risks and rewards of ownership. Financial liabilities (or a part of a financial liability) are removed from its balance sheet when, and only when, they are extinguished – ie when the obligation specified in the contract is discharged or cancelled or expires.
Financial assets The group classifies its financial assets in the following
categories: financial assets at fair value through profit or loss, loans and receivables, and available-for-sale financial assets. The classification depends on the purpose for which the financial assets were acquired. Management determines the classification of its investments at initial recognition.
(a) Financial assets at fair value through profit or loss This category has two sub-categories: financial assets
held-for-trading, and those designated at fair value through profit or loss at inception. A financial asset is classified in this category if acquired principally for the purpose of selling in the short term or if so designated by management. Derivatives are also categorised as held-for-trading unless they are designated as hedges. Assets

83
in this category are classified as current assets if they are either held-for-trading or are expected to be realised within 12 months of the balance sheet date.
Financial assets at fair value through profit or loss are initially recognised at fair value. Transaction costs are expensed in the income statement. These assets are subsequently measured at fair value. All related realised and unrealised gains and losses arising from changes in fair value are recognised in the income statement.
The group did not hold any financial assets designated at fair value through profit or loss at the balance sheet date.
(b) Loans and receivables Loans and receivables are non-derivative financial assets
with fixed or determinable payments that are not quoted in an active market. This category does not include those loans and receivables that the group intends to sell in the short term or that it has designated as at fair value through profit or loss or available-for-sale. These assets are included in current assets, except for maturities greater than 12 months after the balance sheet date, which are classified as non-current assets.
Financial assets classified as loans and receivables are initially recognised at fair value plus transaction costs. Subsequent to initial recognition, loans and receivables are carried at amortised cost using the effective interest rate method, less any provision for impairment.
Loans and receivables comprise loans receivable (including loans to associates), trade and other receivables (excluding prepayments and VAT), cash and cash equivalents as well as starter pack assets.
A starter pack is a tool which enables the connection of a mobile device to a mobile network operator, also known as SIM (subscriber identity module) card.
Starter pack assets are accounted for as financial assets as they represent a contractual right for the group to receive cash.
(c) Available-for-sale financial assets Available-for-sale financial assets are non-derivatives
that are either designated in this category or not classified in any of the other categories. They are included in non-current assets unless management intends to dispose of the investment within 12 months of the balance sheet date.
Financial assets classified as available-for-sale are initially recognised at fair value plus transaction costs. Subsequent to initial recognition, available-for-sale financial assets are carried at fair value. Unrealised gains and losses arising from the change in fair value are recognised directly in equity until the financial
asset is derecognised or impaired, at which time the cumulative gain or loss previously recognised in equity is recognised in the income statement. Interest and dividend income received on available-for-sale financial assets are recognised in the income statement.
The group did not hold any available-for-sale financial assets at balance sheet date.
Impairment of financial assets A financial asset is impaired if its carrying amount is
greater than its estimated recoverable amount.
(a) Loans and receivables The group assesses at each balance sheet date
whether there is objective evidence that a financial asset or a group of financial assets is impaired. A provision for impairment is established when there is objective evidence that the group will not be able to collect all amounts due according to the original terms of the receivables. Objective evidence that receivables are impaired includes observable data that comes to the attention of the company about the following events: significant financial difficulty of the debtora breach of contract, such as default or delinquency in paymentsit becoming probable that the debtor will enter bankruptcy or other financial reorganisation
The amount of the provision is the difference between the carrying amount and the recoverable amount of the assets being the present value of expected cash flows discounted at the original effective interest rate. The amount of the provision is recognised as a charge in the income statement.
When a receivable is uncollectible, it is written off against the provision. Subsequent recoveries of amounts previously written off are credited to the income statement.
(b) Available-for-sale financial assets The group assesses whether there is objective
evidence that a financial asset carried at fair value is impaired at each balance sheet date. If any objective evidence of impairment exists for available-for-sale financial assets (for example, a significant or prolonged decline in the fair value of a security below its cost), the cumulative loss, measured as the difference between the acquisition cost and current fair value, less any impairment loss on the financial asset previously recognised in profit or loss, is removed from equity and recognised in the income statement. If, in a subsequent period, the fair value of a debt instrument classified as available-for-sale increases and the increase can be related objectively to an event occurring after the impairment loss was recognised in profit or loss, the impairment loss is reversed through the income statement.

84
audited results as at 31 May 2008
with the item will flow to the group and the cost of the item can be measured reliably. All other repairs and maintenance are charged to the income statement during the financial period in which they are incurred.
Property, plant and equipment are subsequently carried at cost less accumulated depreciation and any accumulated impairment losses.
Property, plant and equipment, with the exception of land, are depreciated on the straight-line basis over each asset’s estimated useful life. Land is not depreciated as it is deemed to have an indefinite life.
Depreciation is calculated on the straight-line basis to write off the cost of the assets to their residual values over their estimated useful lives as follows:
Motor vehicles 20% – 25%Furniture and fittings 16,67% – 25%Office equipment 25%Computer equipment 25% – 33,33%Electronic terminals 16,67%Security equipment 20% – 33,33%Vending machines 16,67%Media equipment 33,33%Plant and machinery 2%Buildings 8,33%
Major leasehold improvements are amortised over the shorter of their respective lease periods and estimated useful life.
Borrowing costs directly attributable to the acquisition, construction or production of qualifying assets are not capitalised as part of the cost of those assets. All borrowing costs are expensed under the benchmark treatment, in the period in which they are incurred.
The assets’ residual values and useful lives are reviewed, and adjusted if appropriate at each balance sheet date.
Gains and losses on disposal of property, plant and equipment are determined as the difference between the carrying amount and the fair value of the sale proceeds, and are included in operating profit.
Where the carrying amount of an asset is greater than its estimated recoverable amount, it is written down immediately to its recoverable amount.
Intangible assets(a) Computer software development Acquired computer software licences are capitalised
on the basis of the costs incurred to acquire and bring to use the specific software. These costs are amortised over their estimated useful lives (three years).
1. Significant accounting policies (continued)Financial liabilities and equity
Financial liability and equity instruments issued by the group are classified according to the substance of the contractual arrangements entered into and the definitions of a financial liability and an equity instrument. An equity instrument is any contract that evidences a residual interest in the assets of the Group after deducting all of its liabilities.
Refer to accounting policies on borrowings and trade and other payables for financial liabilities (which exclude employee related liabilities and VAT), and share capital for equity instruments issued by the group.
Fair value estimation The best evidence of fair value on initial recognition
is the transaction price, unless the fair value is evidenced by comparison with other observable current market transactions in the same instrument or based on discounted cash flow models and option pricing valuation techniques whose variables include only data from observable markets. Subsequent to initial recognition, the fair values of quoted financial assets are based on current bid prices. If the market for a financial asset is not active (and for unlisted securities), the group establishes fair value by using valuation techniques.
These include the use of recent arm’s length transactions, reference to other instruments that are substantially the same, discounted cash flow analysis, and option pricing models refined to reflect the issuer’s specific circumstances.
Derivative financial instruments Derivatives are recognised initially at fair value on the
date the derivative contract is entered into and are subsequently remeasured at their fair value. The method of recognising the resulting gain or loss depends on whether the derivative is designated as a hedging instrument and, if so, the nature of the item being hedged.
Certain derivative instruments do not qualify for hedge accounting and are accounted for at fair value through profit or loss. Changes in the fair value of these derivative instruments that do not qualify are recognised immediately in the income statement.
The group did not hold any derivative instruments at balance sheet date.
Property, plant and equipment Property, plant and equipment are initially recorded at
cost, being the purchase cost plus any cost to prepare the assets for their intended use. Subsequent costs are included in the asset’s carrying amount or recognised as a separate asset, as appropriate, only when it is probable that future economic benefits associated

85
Costs associated with developing or maintaining computer software programmes are recognised as an expense as incurred. Costs that are directly associated with the production of identifiable and unique software products controlled by the group, and that will probably generate economic benefits exceeding costs beyond one year, are recognised as intangible assets. Direct costs include the software development employee costs and an appropriate portion of relevant overheads. Costs associated with the maintenance of existing computer software programmes are expensed as incurred.
Computer software development costs recognised as assets are amortised over their estimated useful lives.
Costs associated with research activities and the maintenance of existing computer software programmes are expensed as incurred.
(b) Trademarks and licences Trademarks and licences are shown at historical cost.
Trademarks and licences have a finite useful life and are subsequently carried at cost less accumulated amortisation. Amortisation is calculated using the straight-line method to allocate the cost of trademarks and licences over their estimated useful lives (10 years).
(c) Databases, customer listings and distribution agreements Databases, customer listings and distribution
agreements acquired through business combinations are initially shown at fair value as determined in accordance with IFRS 3 – Business combinations, and are subsequently carried at the initially determined fair value less accumulated amortisation and impairment losses. Amortisation is calculated using the straight-line method to allocate the value of these assets over their estimated useful lives (three – five years).
(d) Research and development Costs incurred on development projects are
recognised as intangible assets when the following criteria are fulfilled:
it is technically feasible to complete the intangible asset and that it will be available for use or salemanagement intend to complete the intangible asset and use or sell itthere is an ability to use or sell the intangible assetit can be demonstrated how the intangible asset will generate probable future economic benefitsadequate technical, financial and other resources to complete the development and to use or sell the intangible asset are availablethe expenditure attributable to the intangible asset during its development can be reliably measured.
Research expenditure is recognised as an expense as incurred. Other development expenditures that do not meet these criteria are recognised as an expense as incurred. Development costs previously recognised as an expense are not recognised as an asset in a subsequent period. Capitalised development costs are recorded as intangible assets and amortised from the point at which the asset is available for use (ie when it is in the location and condition necessary for it to be capable of operating in the manner intended by management) on a straight-line basis over its useful life (10 years).
Direct costs include the product development employee costs and an appropriate portion of relevant overheads. Costs associated with the maintenance of existing products are expensed as incurred.
(e) Goodwill Goodwill represents the excess of the cost of an
acquisition over the fair value of the group’s share of the net identifiable assets of the acquired subsidiary, associate or jointly controlled entity at the date of acquisition. If the cost of acquisition is less than the net assets of the subsidiary acquired, the difference is recognised directly in the income statement. Goodwill on the acquisition of subsidiaries is included in “goodwill” in the balance sheet. Goodwill on acquisitions of associates and joint ventures is included in “investments in associates”, and “investments in joint ventures” respectively.
Goodwill is allocated to cash-generating units for the purpose of impairment testing. Impairment is determined by assessing the recoverable amount of the cash-generating unit, to which the goodwill relates. Where the recoverable amount of the cash-generating unit is less than the carrying amount, an impairment is recognised.
Separately recognised goodwill is tested annually for impairment and carried at cost less accumulated impairment losses. Impairment losses on goodwill are not reversed. Gains and losses on the disposal of an entity include the carrying amount of goodwill relating to the entity sold.
Impairment of non-financial assets The group evaluates the carrying value of
assets with finite useful lives when events and circumstances indicate that the carrying value may not be recoverable. Intangible assets that have an indefinite useful life are not subject to amortisation and are tested annually for impairment. Intangible assets not yet available for use are tested annually for impairment.
86
audited results as at 31 May 2008
1. Significant accounting policies (continued)Impairment of non-financial assets (continued)
An impairment loss is recognised in the income statement when the carrying amount of an asset exceeds its recoverable amount. An asset’s recoverable amount is the higher of the fair value less cost to sell (the amount obtainable from the sale of an asset in an arm’s length transaction between knowledgeable willing parties), or its value in use. Value in use is the present value of estimated future cash flows expected to arise from the continuing use of an asset and from its disposal at the end of its useful life. The estimated future cash flows are discounted to their present value using a pre-tax discount rate that reflects current market assessments of the time value of money and the risks specific to the asset. For the purposes of assessing impairment, assets are grouped at the lowest levels for which there are separately identifiable cash flows.
An impairment loss recognised for an asset, other than goodwill, in prior years is reversed if there has been a change in the estimates used to determine the asset’s recoverable amount since the last impairment loss was recognised and the recoverable amount exceeds the new carrying amount. The reversal of the impairment is limited to the carrying amount that would have been determined (net of depreciation or amortisation) had no impairment loss been recognised in prior years. The reversal of such an impairment loss is recognised in the income statement in the same line item as the original impairment charge.
Leased assetsFinance leases
Lease agreements that transfer substantially all the risks and rewards of ownership are classified as finance leases at inception of the lease. The asset is capitalised at the lower of the fair value of the asset or the present value of the minimum lease payments at inception of the lease, with an equivalent amount being stated as a finance lease liability. Finance lease liabilities are classified as non-current or current liabilities, as appropriate. Each lease payment is allocated between the liability and finance charges using the effective interest rate. Finance costs are charged to the income statement over the lease period.
The capitalised asset is depreciated over the shorter of the useful life of the asset or the lease term to its residual value.
Operating leases Leases in which all the risks and benefits of ownership
are effectively retained by the lessor are classified
as operating leases. Payments under operating leases, net of incentives, are charged to the income statement on a straight-line basis over the period of the lease. When an operating lease is terminated before the lease period has expired, any payment required to be made to the lessor by way of penalty is recognised as an expense in the period in which termination takes place.
Inventories Inventories are stated at the lower of cost or estimated
net realisable value. Cost comprises direct materials and, where applicable, overheads that have been incurred in bringing the inventories to their present location and condition, excluding borrowing costs. The cost of the inventory is determined by means of the weighted average cost basis method for inventory. Net realisable value is the estimate of the selling price in the ordinary course of business, less selling expenses. Provisions are made for obsolete, unusable and unsaleable inventory and for latent damage first revealed when inventory items are taken into use or offered for sale.
Trade receivables Trade receivables are recognised initially at fair
value and subsequently measured at amortised cost using the effective interest method, less provision for impairment. A provision for impairment of trade receivables is established when there is objective evidence that the group will not be able to collect all amounts due according to the original terms of receivables. The amount of the provision is the difference between the asset’s carrying amount and the present value of estimated future cash flows, discounted at the original effective interest rate. The amount of the provision is recognised in the income statement.
Cash and cash equivalents Cash and cash equivalents includes cash in hand,
deposits held at call with banks, other short-term highly liquid investments with original maturities of three months or less, and bank overdrafts. Bank overdrafts are shown within borrowings in current liabilities on the balance sheet.
Share capital Ordinary shares are classified as equity and the shares
are fully paid up.
Incremental costs directly attributable to the issue of new shares or options are shown in equity as a deduction, net of tax, from the proceeds. Share issue costs incurred directly in connection with a business combination are shown as a deduction in equity.

87
Provisions Provisions are recognised when the group has a present
legal or constructive obligation as a result of past events, it is more likely than not that an outflow of resources embodying economic benefits will be required to settle the obligation and a reliable estimate of the amount of the obligation can be made. Provisions are not recognised for future operating expenses.
Provisions are measured at the present value of the expenditures expected to be required to settle the obligation using a pre-tax rate that reflects current market assessments of the time value of money and the risks specific to the obligation. The increase in the provision due to the passage of time is recognised as an interest expense.
Borrowings Borrowings are recognised initially at fair value, net of
transaction costs incurred when the relevant contracts are entered into. Borrowings are subsequently stated at amortised cost; any difference between the proceeds (net of transaction costs) and the redemption value is recognised in the income statement over the period of the borrowings using the effective interest method.
Financial liabilities are derecognised when the obligation specified in the contract is discharged, cancelled or expires.
Borrowings are classified as current liabilities unless the group has an unconditional right to defer settlement of the liability for at least 12 months after the balance sheet date.
Normal taxation The current income tax charge is calculated on the basis
of the tax laws enacted or substantively enacted at the balance sheet date in the countries where the company’s subsidiaries and associates operate and generate taxable income. Management periodically evaluates positions taken in tax returns with respect to situations in which applicable tax regulations are subject to interpretation and establishes provisions where appropriate on the basis of amounts expected to be paid to the tax authorities.
Deferred taxation Deferred taxation is provided using the liability method for
all temporary differences arising between the tax bases of assets and liabilities and their carrying values for financial reporting purposes. However, if the deferred income tax arises from initial recognition of an asset or liability in a transaction other than a business combination that at the time of the transaction affects neither accounting nor taxable profit or loss, it is not accounted for. Deferred income tax is determined using tax rates (and laws) that have been enacted or substantially enacted by the balance
sheet date and are expected to apply when the related deferred income tax asset is realised or the deferred income tax liability is settled.
Deferred income tax assets are recognised to the extent that it is probable that future taxable profit will be available against which the temporary differences can be utilised. Deferred income tax is provided on temporary differences arising on investments in subsidiaries and associates, except where the timing of the reversal of the temporary difference is controlled by the group and it is probable that the temporary difference will not reverse in the foreseeable future.
Secondary tax on companies (“STC”) South African companies are subject to a dual
corporate tax system, one part of the tax being levied on the taxable income and the other, a secondary tax (“STC”) on distributed income. STC is not a withholding tax on shareholders but a tax on companies.
The STC tax consequence of dividends is recognised when a liability to pay the dividend is recognised. The STC liability is reduced by dividends received during the dividend cycle, and where dividends received exceed dividends declared within a cycle, there is no liability to pay STC. The potential tax benefit related to excess dividends received is carried forward to the next dividend cycle. Deferred tax assets are recognised on unutilised STC credits to the extent that it is probable that the group will declare future dividends to utilise such STC credits.
Where dividends declared exceed the dividends received during a cycle, STC is payable at the current STC rate. STC is a charge against income, and is recognised in the taxation charge in the income statement in the same period as the related dividend is accrued as a liability.
Trade and other payables Trade payables are measured initially at fair value and
are subsequently measured at amortised cost, using the effective interest rate method.
Revenue recognition Revenue comprises the fair value of the consideration
received or receivable for the sale of goods and services in the ordinary course of the group’s activities. Revenue is shown net of indirect taxes, estimated returns, rebates and discounts and after eliminated sales within the group.
Revenue from the sale of goods and the rendering of services is recognised when it is probable that the economic benefits associated with a transaction will flow to the group and the amount of revenue, and associated costs incurred or to be incurred, can be measured reliably.

88
audited results as at 31 May 2008
1. Significant accounting policies (continued)Revenue recognition (continued)
The main categories of revenue and the bases of recognition are as follows:
(a) Sale of starter packs Activation bonuses received from the networks are
recognised when the SIM-card is activated on the relevant cellular phone network. Ongoing rebates and other incentives are recognised once certain criteria have been met and the significant act has been completed.
(b) Sales of prepaid airtime Sales of prepaid airtime are recognised when the
group sells the airtime to the customer. Sales are recorded based on the price specified in the sales contracts, net of discounts at the time of sale.
(c) Sales of services Sales of services are recognised in the accounting
period in which the services are rendered, by reference to completion of the specific transaction assessed on the basis of the actual service provided as a proportion of the total services to be provided.
(d) Interest income Interest income is recognised on a time-proportion
basis using the effective interest method. When a receivable is impaired, the group reduces the carrying amount to its recoverable amount, being the estimated future cash flow discounted at original effective interest rate of the instrument, and continues unwinding the discount as interest income. Interest income on impaired loans is recognised using the original effective interest rate.
(e) Dividend income Dividend income is recognised when the right to
receive payment is established.
Employee benefits(a) Defined contribution plans A defined contribution plan is one under which
the group pays a fixed percentage of employees’ remuneration as contributions into a separate entity (a fund), and will have no further legal or constructive obligations to pay additional contributions if the fund does not hold sufficient assets to pay all employee benefits relating to employee service in the current and prior periods. Contributions to defined contribution plans in respect of services rendered during a period are recognised as an employee benefit expense when they are due. The group does not have any defined benefit plans.
(b) Profit sharing and bonus plans The group recognises a liability and an expense for
bonuses and profit sharing which is determined based on a formula that takes into consideration the profit attributable to the shareholders after certain adjustments. A provision is recognised where the group is contractually obliged or where there is a past practice that has created a constructive obligation.
(c) Leave pay accrual The group recognises a liability and an expense for
leave. The accrued liability is determined by valuing all future leave expected to be taken and payments expected to be made in respect of benefits.
Dividend distribution Dividend distribution to the company’s shareholders
is recognised as a liability in the group’s financial statements in the period in which they are approved by the shareholders.
2. Critical accounting estimates and assumptions The group makes estimates and assumptions
concerning the future. The resulting accounting estimates will, by definition, seldom equal the related actual results. The estimates and assumptions that have a significant risk of causing a material adjustment to the carrying amounts of assets and liabilities within the next financial year are discussed below.
(a) Estimated impairment of goodwill The group tests annually whether goodwill has
suffered any impairment, in accordance with the accounting policy. The recoverable amounts of cash-generating units have been determined based on value-in-use calculations. These calculations require the use of estimates.
Goodwill is allocated to cash-generating units (“CGUs”) for the purpose of impairment testing. The recoverable amount of CGUs has been determined based on value-in-use calculations, which is the higher of fair value less cost to sell and value in use. These calculations use cash flow projections based on financial budgets approved by the board of directors for the forthcoming year and forecasts for up to five years which are based on assumptions of the business, industry and economic growth. Cash flows beyond this period are extrapolated using terminal growth rates, which do not exceed the expected long-term economic growth rate.
The average growth rates applied were between 10% and 20%. The weighted average cost of capital used to discount these cash flows ranged between 17% and 23%. The discount rates used are pre-tax

89
and reflect specific risks relating to the relevant companies.
The valuation of the goodwill balances resulted in no goodwill impairment charges for the year (2007: Rnil).
(b) Classification of financial assets at amortised cost The group assesses at each balance sheet date
the classification of financial assets carried at amortised cost between current and non-current. This assessment takes into consideration historical trends and an analysis of the expected period to receipt of the cash. These calculations require the use of estimates and assumptions.
(c) Capitalisation of development cost The group capitalises development relating to
software development. Costs incurred on development projects of identifiable and unique products which are controlled by the group are recognised as intangible assets when it is probable that the project will be profitable considering its commercial and technical feasibility, and its costs can be measured reliably. Management makes some estimates on the technical feasibility of project and, based on the estimates and the recognition criteria, cost are capitalised.
(d) Contingent consideration for acquisitions Contingent payments for business acquisitions are
generally conditional on the future revenue and/or profits achieved by the acquired business. On acquisition date, estimates are made of the expected future revenue and profit based on forecasts made by management. These estimates are reassessed at each reporting date and adjustments are made to the deferred consideration and related goodwill balances, where necessary. Amounts of deferred consideration payable after one year are discounted using discount rates that reflect the current market assessment of the time value of money and, where appropriate, the risks specific to the acquired business.
Changes in the estimates of the consideration could result in the recognition of material adjustments in future periods.
3. Financial risks In the course of its business, the group is exposed to
a number of financial risks: credit risk, liquidity risk and market risk (including foreign currency, interest rate and other price risks). This note presents the group’s objectives, policies and processes for managing its financial risk and capital.
Credit risk Credit risk arises because a counterparty may fail to
meet its obligations to the group. The group is exposed to credit risk on financial assets mainly in respect of trade receivables, loans receivable and cash and cash equivalents.
Trade receivables consist primarily of invoiced amounts from normal trading activities. The group has a diversified customer base and policies are in place to ensure sales are made to customers with an appropriate credit history. Individual credit limits are set for each customer and the utilisation of these credit limits is monitored regularly. Where necessary, a provision for impairment is made. A significant portion of the group’s customer base is made up of major retailers, with the balance of the customer base being widely dispersed.
Loans are only granted to holders with an appropriate credit history, taking into account the holder’s financial position and past experience.
The group places cash and cash equivalents with major banking groups and quality institutions that have high credit ratings.
The group has no significant concentrations of credit risk.
The group’s maximum credit risk exposure is the carrying amount of all financial assets on the balance sheet, including guarantees, with the maximum amount the group could have to pay if the guarantees are called on, amounting to R6,5 million (2007: R1 million).
Liquidity risk Liquidity risk arises when a company encounters
difficulties in meeting commitments associated with liabilities and other payment obligations. The group’s objective is to maintain prudent liquidity risk management by maintaining sufficient cash and marketable securities, the availability of funding through an adequate amount of committed credit facilities and the ability to close out market positions. Due to the dynamic nature of the underlying businesses, the company aims to maintain flexibility in funding by keeping committed credit lines available.

90
audited results as at 31 May 2008
3. Financial risks (continued)
Maturity of financial liabilities
Payable in:
Less than 1 month or on
demandR’000
More than 1 month but
not exceeding 1 yearR’000
More than 1 year but not
exceeding 2 yearsR’000
More than 2 years but
not exceeding 5 yearsR’000
More than 5 yearsR’000
2008
Interest bearing borrowings 11 285 1 738 1 608 1 337 —
Non-interest-bearing borrowings 8 539 502 — — —
Trade and other payables* 171 637 925 978 — — —
Bank overdraft 50 — — — —
Total 191 511 928 218 1 608 1 337 —
2007
Interest bearing borrowings 540 951 11 413 11 909 1 631 4 190
Non-interest-bearing borrowings 32 945 300 — — —
Trade and other payables* 99 747 749 946 — — —
Bank overdraft — — — — —
Total 673 643 761 659 11 909 1 631 4 190
*Trade and other payables exclude non-financial instruments
Market risk
The group is exposed to risks from movements in foreign exchange rates and interest rates that affect its assets, liabilities and anticipated future transactions.
Cash flow and fair value interest rate risk
The group’s cash flow interest rate risk arises from loans receivable, cash and cash equivalents and borrowings carrying interest at variable rates. The group is not exposed to fair value interest rate risk as the group does not have any fixed interest-bearing instruments carried at fair value.
The group’s exposure to interest rate risk is reflected under the respective borrowings, loans receivable and cash and cash equivalents notes (notes 15, 10 and 12).
As part of the process of managing the group’s exposure to interest rate risk, interest rate characteristics of new borrowings and the refinancing of existing borrowings are positioned according to expected movements in interest rates.
Foreign currency risk
The group is exposed to foreign currency risk from transactions and translation. Transaction exposure arises because affiliated companies undertake transactions in currencies other than their functional currency. Translation exposure arises from the consolidation of subsidiaries with a functional currency other than the group’s reporting currency (Rand).
The group manages its exposure to foreign currency risk by ensuring that the net foreign currency exposure remains within acceptable levels. Hedging instruments are used in certain instances to reduce risks arising from foreign currency fluctuations. The group did not enter into any forward exchange contracts during the period under review.
IFRS7 Sensitivity analysis
The group has used a sensitivity analysis technique that measures the estimated change to the income statement of either an instantaneous increase or decrease of 1% (100 basis points) in market interest rates or a 10% strengthening or weakening of the rand against all other currencies, from the rates applicable at 31 May 2008, for each class of financial instrument with all other variables remaining constant. This analysis is for illustrative purposes only, as in practice market rates rarely change in isolation.

91
3. Financial risks (continued)Interest rate riskThe interest rate sensitivity analysis is based on the following assumptions:
Changes in market interest rates affect the interest income or expense of variable interest financial instruments
Changes in market interest rates only affect interest income or expense in relation to financial instruments with fixed interest rates if these are recognised at fair value.
Under these assumptions, a 1% increase or decrease in market interest rates at 31 May 2008 would increase or decrease profit before tax by R13,2 million (2007: R5,3 million).
Foreign currency risk
Financial instruments by currency
2008ZAR
R’000USD
R’000EUR
R’000CDF
R’000MZN
R’000Total
R’000
Financial assets
Cash and cash equivalents 1 313 550 5 933 8 456 1 404 1 328 344
Trade and other receivables* 553 859 20 550 2 686 — 9 525 586 620
Loans receivable (including loans to associates) 5 798 20 149 830 — — 26 777
Financial assets at fair value throughprofit or loss 5 320 — 352 — — 5 672
Financial assets at amortised cost 119 134 3 227 — — 2 935 125 296
1 997 661 49 859 12 324 1 12 864 2 072 709
Financial liabilities
Interest bearing borrowings 15 968 — — — — 15 968
Non-interest-bearing borrowings 544 — 8 497 — — 9 041
Trade and other payables* 1 052 172 16 886 10 020 — 18 538 1 097 616
Bank overdraft 50 — — — — 50
1 068 734 16 886 18 517 — 18 538 1 122 675
Net financial position 928 927 32 973 (6 193) 1 (5 674) 950 034
*Trade and other receivables, and trade and other payables exclude non-financial instruments.
With a 10% strengthening or weakening in the Rand against all other currencies, profit before tax would have decreased or increased by R2,1 million respectively. The exposure and sensitivities to foreign currencies in the prior year were in line with the above.
Capital risk
The company’s objectives when managing capital are to safeguard the company’s ability to continue as a going concern in order to provide returns for shareholders and benefits for other stakeholders and to maintain an optimal capital structure to reduce the cost of capital.
In order to maintain or adjust this capital structure, the company may issue new shares, adjust the amount of dividends paid to shareholders, return capital to shareholders or sell assets to reduce debt.
The group defines capital as capital and reserves and non-current borrowings.
The company is not subject to externally imposed capital requirements.
There were no changes to the group’s approach to capital management during the year.
Fair value measurement
For all short-term financial assets and liabilities, the carrying amount is regarded as an approximation of the fair value.
The fair value of all non-current loans receivable and borrowings are calculated using a discounted cash flow model based on prevailing market interest rates.

92
audited results as at 31 May 2008
Computerequipment
R’000
Furniture and fittings
R’000
Motor vehicles
R’000
Officeequipment
R’000Terminals
R’000
4. Property, plant and equipmentYear ended 31 May 2008
Actual
Opening carrying amount 5 748 3 150 6 918 1 339 5 879
Additions 12 189 6 148 7 251 2 027 3 048
Disposals (762) (583) (1 862) (172) (306)
Depreciation charge (5 494) (1 393) (2 899) (605) (1 067)
Translation differences 407 55 250 33 342
Closing carrying amount 12 088 7 377 9 658 2 622 7 896
At 31 May 2008
Cost 20 744 10 365 14 309 3 919 9 940
Accumulated depreciation (8 656) (2 988) (4 651) (1 297) (2 044)
Carrying amount 12 088 7 377 9 658 2 622 7 896
Year ended 31 May 2007
Predecessor value
Opening carrying amount 192 1 738 196 338 —
Additions 8 855 2 426 10 427 1 676 6 879
Disposals (258) (77) (1 957) (122) (23)
Depreciation charge (3 041) (937) (1 748) (553) (977)
Closing carrying amount 5 748 3 150 6 918 1 339 5 879
At 31 May 2007
Cost 8 910 4 745 8 670 2 031 6 856
Accumulated depreciation (3 162) (1 595) (1 752) (692) (977)
Carrying amount 5 748 3 150 6 918 1 339 5 879
Property, plant and equipment include the following amounts where the company is a lessee under a finance lease:
2008R’000
2007R’000
Motor vehicles
Cost 1 601 1 381
Accumulated depreciation (657) (428)
Carrying value at 31 May 2008 944 953
These assets have been pledged as surety against the liability.
Land and buildings to the value of Rnil (2007: R4,970 million) was pledged as security for mortgage bonds on these properties. Refer to note 15.

93
Leaseholdimprovements
R’000
Vending machines
R’000
Mediaequipment
R’000
Plant andmachinery
R’000Land
R’000Buildings
R’000Total
R’000
358 13 283 1 846 25 1 176 3 794 43 516
3 055 13 594 4 800 2 654 — — 54 766
(248) (2 882) — (1 996) (1 176) (2 937) (12 924)
(277) (3 695) (1 439) (96) — — (16 965)
5 — — — — — 1 091
2 893 20 300 5 207 587 — 856 69 484
3 239 25 995 7 787 716 — 856 97 870
(346) (5 695) (2 580) (129) — — (28 386)
2 893 20 300 5 207 587 — 856 69 484
— — — — — — 2 464
427 16 958 3 160 110 1 176 3 957 56 051
— (1 675) (173) (52) — — (4 337)
(69) (2 000) (1 141) (33) — (163) (10 662)
358 13 283 1 846 25 1 176 3 794 43 516
427 15 283 2 987 58 1 176 3 957 55 098
(69) (2 000) (1 141) (33) — (163) (11 582)
358 13 283 1 846 25 1 176 3 794 43 516

94
audited results as at 31 May 2008
GoodwillR’000
TrademarksR’000
Customerlisting
R’000
Distributionagreement
R’000
Computersoftware
R’000
Internallygenerated
develop-mentcosts
R’000
Franchisefees
R’000
Customerrelation-
shipsR’000
Supplierrelation-
shipsR’000
Total R’000
5. Intangible assetsYear ended 31 May 2008ActualOpening carrying amount 46 907 6 004 17 601 3 973 43 278 1 257 — — — 119 020Additions 225 828 1 493 924 8 375 13 259 11 640 2 022 154 907 1 491 419 939Disposals — — — — (372) — — — — (372)Amortisation charge — (1 531) (10 804) (1 223) (6 208) (901) (121) (21 300) (435) (42 523)Translation differences — — — 211 4 — — — — 215Adjustment* (6 493) — — — — — — — — (6 493)Closing carrying amount 266 242 5 966 7 721 11 336 49 961 11 996 1 901 133 607 1 056 489 786At 31 May 2008 Cost 266 242 8 206 29 225 13 102 59 989 12 960 2 022 154 907 1 491 548 144Accumulated amortisation — (2 240) (21 504) (1 766) (10 028) (964) (121) (21 300) (435) (58 358)Accumulated Impairment — — — — — — — — — —Carrying amount 266 242 5 966 7 721 11 336 49 961 11 996 1 901 133 607 1 056 489 786
Year ended 31 May 2007Predecessor value Opening carrying amount — — — — — — — — — —Additions 46 907 6 714 28 301 4 516 50 324 1 320 — — — 138 081Disposals — — — — (3 226) — — — — (3 226)Amortisation charge — (710) (10 700) (543) (3 820) (63) — — — (15 836)Closing carrying amount 46 907 6 004 17 601 3 973 43 278 1 257 — — — 119 020At 31 May 2007 Cost 46 907 6 714 28 301 4 516 47 098 1 320 — — — 134 856Accumulated amortisation — (710) (10 700) (543) (3 820) (63) — — — (15 836)Accumulated impairment — — — — — — — — — —
Carrying amount 46 907 6 004 17 601 3 973 43 278 1 257 — — — 119 020
* This adjustment arose due to a reversal of the present value of a contingent purchase price liability that is no longer applicable due to the restructuring of the group.
Notes
31 May2008
Actual auditedR’000
31 May2007
Predecessorvalue
auditedR’000
6. Investment in associates and joint venturesInvestment in associatesOpening net book value 61 804 —
Associates acquired on restructure date by Blue Label subsidiaries* — 27 167Associates acquired on restructure date by Blue Label Telecoms* — 3 418Share of results after tax (17 426) (884)Amortisation of intangible asset (21) (101)Deferred tax on intangible assets amortisation 6 29Dividends received (120) (3 570)Foreign currency translation reserve (336) 4 193Exercise of share warrants in associate 7 021 —Associates converted to subsidiaries 24 (9 043) —Disposal of associate — (5 649)
41 885 24 603
Movement in loansLoans granted to associates 50 724 35 979Loans repaid by associates (12 106) —Unrealised foreign exchange gains on loans to associates 853 1 222
39 471 37 201
Closing net book value 81 356 61 804
The directors believe that the carrying value of the shares approximates their fair value.The loans are neither past due nor impaired with a low risk of default.

95
6. Investment in associates and joint ventures (continued)
* In terms of predecessor accounting principles the following associates are assumed to have been acquired as at the earliest reporting period, 1 June 2006. The resulting effect is that the group’s share of the net asset value as at 1 June 2006 is brought into account. No purchase price allocations were reperformed. Any goodwill or intangible assets previously recognised on these associates are assumed to have been recognised by Blue Label Telecoms.
Dateacquired
Effectivepercentage
acquired
Carryingvalue atdate of
acquisition
Amountassumed tohave been
paid
Amountstransferredto restruc-
turingreserve
2007Associates assumed by Blue Label Telecoms on restructure dateAfrica Prepaid Services (Proprietary) Limited 1 June 2006 28 (1 744) —House of Business Solutions (Proprietary) Limited 1 June 2006 33 (1 882) 7 000Cellfind SA (Proprietary) Limited 1 June 2006 42,7 (2 587) 2 500
Datacel Direct (Proprietary) Limited 1 June 2006 21,12 129 —
(6 084) 9 500 3 418
Associates acquired by Blue Label Telecoms’ subsidiaries on restructure date
Oxigen Services India (Private) Limited 1 June 2006 29,66 22 057Virtual Voucher (Proprietary) Limited 1 June 2006 10,44 1 543Transunion CGS (Proprietary) Limited 1 June 2006 25,06 3 567
27 167
In the 2007 financial year Ventury Group (Proprietary) Limited sold their 40% interest in Transunion CGS (Proprietary) Limited.
The group’s interest in its principal associates, which are unlisted, is as follows:
NameCountry of Incorporation
AssetsR’000
LiabilitiesR’000
RevenuesR’000
Profit/(loss)
R’000
Effectivepercentage
interestheld
Net bookvalue
R’000
2008Oxigen Services India (Private) Limited India 208 093 128 070 1 057 732 (56 175) 35 81 356
2007Oxigen Services India (Private) Limited India 140 885 72 540 938 909 (29 088) 29,66 42 850 House of Business Solutions (Proprietary) Limited South Africa 9 609 14 211 20 289 1 320 33 10 620 Cellfind SA (Proprietary) Limited South Africa 9 622 10 828 31 903 12 020 42,7 2 002 Africa Prepaid Services (Proprietary) Limited South Africa 28 314 40 627 73 958 (4 698) 28 3 424 Virtual Voucher (Proprietary) Limited South Africa 22 596 12 530 487 814 8 306 10,44* 2 279 Datacel Direct (Proprietary) Limited South Africa 4 792 1 842 16 743 2 345 21,12 629
61 804
*Virtual Voucher’s effective holding is less than 20%. However BLT has representation on the board which allows BLT to exercise significant influence.
There are no contingent liabilities relating to the group’s interest in associates. For details on related party transactions refer to note 26.
On 14 November 2007, the group increased its shareholding in the following associates to obtain a controlling interest:House of Business Solutions (Proprietary) LimitedCellfind SA (Proprietary) LimitedAfrica Prepaid Services (Proprietary) LimitedVirtual Voucher (Proprietary) LimitedDatacel Direct (Proprietary) Limited
Refer to note 24 for details of these acquisitions.

96
audited results as at 31 May 2008
2008auditedR’000
2007restated
R’000
6. Investment in associates and joint ventures (continued)
Investment in joint ventures ** —
** The net book value of the investment in joint ventures, including the group’s share of the results after tax is less than R1 000.
During the prior year, the group acquired the following interests in joint ventures:
Effectivepercentage
acquired
The Hub Pretalk (Proprietary) Limited 27,8
Premet Cellular (Proprietary) Limited 27,8
Set out below is the summarised financial information of joint ventures:
AssetsR’000
LiabilitiesR’000
RevenuesR’000
LossR’000
2008
The Hub Pretalk (Proprietary) Limited 2 585 5 523 19 651 (1 774)
Premet Cellular (Proprietary) Limited 2 303 7 214 297 945 (2 602)
2007
The Hub Pretalk (Proprietary) Limited 3 546 4 710 21 233 (1 164)
Premet Cellular (Proprietary) Limited 3 831 6 140 362 966 (2 309)
There are no contingent liabilities relating to the group’s interest in joint ventures.
2008Actual
auditedR’000
2007Predecessor
value auditedR’000
7. Financial assets at amortised cost
Starter packs
Balance at the beginning of year 84 383 —
Additions 114 855 133 193
Disposals (74 412) (48 810)
Translation differences 470 —
At the end of year 125 296 84 383
Less: Amounts included in current portion of financial asset (53 163) (32 485)
72 133 51 898
The credit risk in respect of the balance at the end of the year is considered low.

97
2008Actual
auditedR’000
2007Predecessor
value auditedR’000
8. Financial assets at fair value through profit or loss
Balance at beginning of year 16 183 —
Additions 1 391 19 729
Disposals (10 527) (6 086)
Fair value movements (1 375) 2 540
At the end of year 5 672 16 183
Changes in the fair value of these assets are recorded in other income.
The fair value of financial assets is based on quoted market prices at 31 May.
An investment to the value of Rnil (2007: R3,6 million) included in the above balance has been ceded to First National Bank.
9. InventoriesAirtime and related products 484 501 263 631
484 501 263 631
A first and second general notarial bond is held by Investec Private Bank over airtime amounting to R105 million and R145 million respectively (2007: R105 million and a further bond of R95 million to be registered).
In the prior year, airtime was held as security for a loan from Investec Private Bank to a minimum value of R180 million. During the current financial year the loan was repaid and the security released.
10. Loans receivableInterest free 3 593 347
Bearing interest at the prime interest rate +2% 3 510 4 404
7 103 4 751
Loans are unsecured and have no fixed terms of repayment.
11. Trade and other receivablesTrade receivables 556 974 251 627
Less: Provision for impairment (5 299) (1 071)
551 675 250 556
Sundry debtors and prepayments 55 703 12 579
VAT 23 309 15 606
630 687 278 741

98
audited results as at 31 May 2008
GrossR‘000
ImpairmentR‘000
11. Trade and other receivables (continued)
The aging of trade receivables at the reporting date was:
31 May 2008
Fully performing 527 010 25
Past due by 1 to 30 days 10 123 53
Past due by 31 to 60 days 12 668 622
Past due by 61 to 90 days 4 498 —
Past due by more than 90 days 11 413 4 599
565 712 5 299
31 May 2007
Fully performing 231 831 —
Past due by 1 to 30 days 7 833 —
Past due by 31 to 60 days 11 451 —
Past due by 61 to 90 days 2 195 —
Past due by more than 90 days 3 919 1 071
257 229 1 071
Receivables in respect of starter packs are included in fully performing debtors above. Ongoing activation revenue due to these debtors is set off against the receivable balance as and when it is earned by them.
The effect of discounting of the trade receivables balance is not taken into account in the above table.
The trade receivables that are neither past due nor impaired are considered to have a low risk of default.
May2008R’000
May2007
R’000
Provision for impairment of receivables
At 1 June 1 071 1 230
Acquisition of subsidiaries 613 —
Allowances made during the year 3 815 433
Amounts used and reversal of unused amounts (200) (592)
At 31 May 5 299 1 071
Impairment of receivables is determined after assessing the nature of the customer, their geographic location and specific circumstances.Based on historic trend and expected performance of the customers, the group believes that the above provision for impairment of receivables sufficiently covers the risk of default.
There is a cession of trade receivables of R391,8 million (2007: R197,1 million) in favour of Investec Bank Limited.

99
31 May2008
Actual auditedR’000
31 May2007
Predecessorvalue
auditedR’000
12. Cash and cash equivalentsCash at bank 1 317 963 1 089 856 Cash on hand 10 381 188 Favourable balances 1 328 344 1 090 044 Bank overdraft (50) —
1 328 294 1 090 044
The general banking facility granted by First National Bank to the value of R20 million is secured by letters of suretyship by certain of the directors of the company.
Cash and cash equivalents of R1 055 million (2007: R945 million) are restricted.
2008Number
of sharesActual
2007Number
of sharesPredecessor
value
2008R
ActualauditedR’000
2007R
Predecessorvalue
auditedR’000
13. Share capitalAuthorisedTotal authorised share capital of ordinary shares (par value of R0,000001 each) 1 000 000 000 1 000 000 000 1 1 IssuedBalance at the beginning of the year1 378 097 993 378 097 993 * *Shares issued during the period 388 262 901 — * —Balance at the end of the year 766 360 894 378 097 993 * *
Number
Issueprice
per shareR
Share capitalR’000
Share premium
R’000
Shares issued during the periodShares issued to buy out minority shareholders on restructuring2 190 131 616 5,50 * 1 045 724Shares issued to Brett Levy and Mark Levy to terminate the management bonus agreement3 14 545 455 5,50 * 80 000Shares issued as part of the preferential allocation in the private placement 148 148 148 6,75 * 1 000 000Shares issued to Microsoft Corporation 35 437 682 6,75 * 239 204
388 262 901 * 2 364 928* Less than R1 000
1. In terms of predecessor accounting principles the shares issued by Blue Label Telecoms to buy out the original Blue Label Investments’ shareholders is assumed to have happened at the beginning of the earliest reporting period. Please refer to the pre-listing statement for details on the restructuring (Step 3 in the overview of the restructuring).
2. Please refer to pre-listing statement for details of the minority shareholders who received shares as part of the restructuring (Step 4 –13 in the overview of the restructuring).
3. Please refer to pre-listing statement for details of the management bonus settlement agreement (Section 20.1).

100
audited results as at 31 May 2008
Capitalallowances
R’000
Fair value gains
R’000Provisions
R’000
TaxlossesR’000
Pre-payments
R’000Other
R’000Total
R’000
14. Deferred taxationGroupAcquisition of subsidiary (note 24) 199 22 539 (1 416) (23) 471 1 078 22 848Charge/(credited) to income statement (292) (4 097) (19) 5 (385) 3 025 (1 763)
At 31 May 2007 (Predecessor value) (93) 18 442 (1 435) (18) 86 4 103 21 085Charge/(credited) to income statement 951 (9 915) (1 128) (1 162) 27 234 (10 993)Tax rate change (9) (467) (244) 1 38 (494) (1 175)Acquisition of subsidiary (note 24) 337 46 951 (541) (553) — — 46 194
At 31 May 2008 (Actual) 1 186 55 011 (3 348) (1 732) 151 3 843 55 111
Deferred tax assets are recognised for tax loss carry forwards to the extent that the realisation of the related tax benefit through future taxable profits is probable. The group did not recognise deferred income tax assets of R5,9 million (2007: R2,7 million) in respect of losses amounting to R20,5 million (2007: R8,8 million) that can be carried forward against future taxable income.
Deferred income tax liabilities of R2,3 million (2007: Rnil) have not been recognised.
31 May2008
Actual auditedR’000
31 May2007
Predecessorvalue
auditedR’000
15. Interest-bearing borrowingsBank borrowings — 488 472 Liabilities under non-cancellable finance leases 794 881 Instalment sale liabilities 3 918 1 976 Other borrowings Bearing interest at prime linked interest rates 11 256 75 909 Bearing interest at fixed interest rates — 2 856
15 968 570 094
Less: Amounts included in current portion of borrowings (13 023) (552 364)
2 945 17 730
Finance lease liabilities – minimum lease payments due: Not later that one year 427 425 Later than one year and not later than five years 514 595
941 1 020
Future finance charges on finance leases (147) (139)
Present value of finance lease liabilities 794 881
Instalment sale liabilities – minimum payments due: Not later that one year 1 855 664 Later than one year and not later than five years 2 918 1 476
4 773 2 140 Future finance charges on finance leases (855) (164)
Present value of finance lease liabilities 3 918 1 976
The group did not default on any loans or finance lease liabilities, or breach any terms of the underlying agreements during the period.
Bank borrowings The bank borrowings above have the following terms: Borrowing 1 — 22 682 The loan is repayable in 38 equal monthly instalments commencing 1 May 2006. The loan bears interest at 1% below prime. The loan is secured by a cession and pledge of 50% of all shares issued in Matragon (Pty) Ltd in favour of Investec Private Bank. Borrowing 2 — 241 134 The loan bears interest at 1% below prime. The loan has no fixed repayment terms and is secured by general notarial bonds over inventories to the value of R200 million.

101
31 May2008
Actual auditedR’000
31 May2007
Predecessorvalue
auditedR’000
15. Interest-bearing borrowings (continued)
Borrowing 3 — 123 807
The loan bears interest at 1% below prime. The loan has no fixed repayment terms and is secured by a cession of prepaid airtime inventory to a minimum value of Rnil (2007: R180 million).
Borrowing 4 — 96 659
The loan bears interest at 1% below prime. The loan has no fixed repayment terms and is secured by a cession and pledge of cash deposits held with Investec Bank Limited to the total value of R100 million.
The bank holds various other securities for the above loans. The most significant of these are:
– Joint and several continuing suretyship by certain directors and holding company directors limited to a cumulative total of R452 million.
– Joint and several continuing suretyship by BSC Technologies (Proprietary) Limited, ZOK Cellular (Proprietary) Limited and Vocall Cellular (Proprietary) Limited.
– Subordination of all shareholders loan accounts by Blue Label Investments(Proprietary) Limited to the value of R49 million.
– An unlimited cession of trade receivables of the company.
Borrowing 5 — 3 410
The loan is secured by the land and buildings in Kwikprop (Proprietary) Limited and bears interest at rates linked to prime. It is repayable in 120 monthly instalments from 1 March 2006.
Borrowing 6 — 780
This mortgage bond bears interest at prime less 2%, and is secured by the property to which it relates. It is repayable in fixed monthly instalments over 20 years.
Liabilities under non-cancellable finance leases
Liabilities under capitalised finance leases are payable over periods of one to five years at effective interest rates linked to the prime interest rate per annum. They are secured by the motor vehicles to which they relate.
Instalment sale liabilities
All instalment sale liabilities are secured over the plant and equipment to which they relate, are repayable in monthly instalments and are subject to interest at prime linked rates.
Other borrowings
Other borrowings are unsecured and have no fixed terms of repayment.
16. Trade and other payablesTrade payables 1 072 565 834 971
Accruals 45 670 49 086
Sundry creditors 23 694 2 843
VAT 11 040 1 111
1 152 969 888 011
17. Non-interest-bearing borrowingsBank borrowings 300 650
The loan is unsecured. The bank has the right to request full payment in cash unless otherwise negotiated.
Other borrowings 8 741 32 595
The loans are unsecured and have no fixed terms of repayment.
9 041 33 245

102
audited results as at 31 May 2008
2008Actual R’000
2007Predecessor
value R’000
18. Operating profitThe following items have been charged/(credited) in arriving at operating profit:
Loss/(profit) on disposal of property, plant and equipment 422 424
Operating lease rentals – premises 12 140 8 326
Operating lease rentals – equipment 2 356 797
Foreign exchange profit – realised (520) (65)
Foreign exchange profit – unrealised (1 969) (1 233)
Audit fees 7 590 2 957
Management fees paid 1 468 352
Legal fees 1 978 2 309
Consulting fees 2 383 2 433
Excess of acquirers’ interest in the net fair value over cost (2 585) (691)
Rent and security 711 9 624
Discount received for cash — (82)
Rent received (244) (524)
Management fees received (8 157) (7 317)
Profit on sale of investments — (807)
Profit on sale of group company — (11 511)
Fair value movements on financial assets at fair value through profit or loss 1 375 (2 540)
Repairs and maintenance 1 927 4 158
Impairment of loans — 152
Impairment of trade receivables 3 244 530
Insurance 5 189 3 428
Overseas travel 7 861 523
Courier and postage 4 599 3 136
Gain on derecognition of financial asset (43 000) —
Loan release (2 335) —
19. Finance (income)/costsInterest received
Bank (175 496) (80 246)
Loans (959) (2 822)
Other (922) (246)
Discounting of receivables (15 904) (12 715)
(193 281) (96 029)
Interest paid
Bank 34 194 49 194
Loans 9 596 12 639
Finance leases 645 459
Other 2 140 650
Discounting of payables 101 129 71 338
147 704 134 280
Net finance (income)/costs (45 577) 38 251

103
31 May2008
Actual auditedR’000
31 May2007
Predecessorvalue
auditedR’000
20. Taxation
Current tax 101 759 55 094
current year 101 759 55 094
Deferred tax (12 168) (1 763)
current year (12 168) (1 763)
STC 250 89
89 841 53 420
Profit before tax 297 633 163 247
Tax at 28% (2007: 29%) 83 337 47 342
Income not subject to tax (3 504) (6 378)
Expenses not deductable for tax purposes 8 187 12 912
Secondary tax on companies 250 89
Capital gains (1 453) (2 429)
Effect of tax rate changes (1 175) —
Utilisation of previously unrecognised tax losses (3 532) (851)
Tax effect of assessed losses not recognised 3 391 2 325
Share of losses from associates 4 883 277
Effect of different tax dispensations (543) 133
Tax charge 89 841 53 420

104
audited results as at 31 May 2008
21. Earnings per share
a) Basic
Basic earnings per share are calculated by dividing the profit attributable to equity holders of the company by the weighted average number of ordinary shares in issue during the year.
2008Actual
2007Predecessor
value
Profit attributable to equity holders of the company (R’000) 180 891 63 867
Weighted average number of ordinary shares in issue (thousands) 590 264 378 098
Basic earnings per share (cents per share) 30,65 16,89
b) Headline
Headline earnings are calculated applying the principles contained in SAICA circular 8/2007. The weighted average number of shares used is as for the basic earnings per share figure discussed above.
2008Actualaudited
Profit beforetax and
minoritiesR’000
TaxR’000
MinoritiesR’000
Headlineearnings
R’000
Profit attributable to equity holders of the company 297 633 (89 841) (26 901) 180 891
Loss on disposal of property, plant and equipment 422 (118) — 304
Excess of acquirers’ interest in the net fair value over cost (2 585) — — (2 585)
Headline earnings 178 610
Weighted average number of ordinary shares in issue (thousands) 590 264
Headline earnings per share (cents per share) 30,26
2007Predecessor value
audited
Profit beforetax and
minoritiesR’000
TaxR’000
MinoritiesR’000
Headlineearnings
R’000
Profit attributable to equity holders of the company 163 247 (53 420) (45 960) 63 867
Profit on disposal of property, plant and equipment (424) 123 149 (152)
Profit on sale of group company (11 511) 2 488 4 090 (4 933)
Profit on sale of investment (807) 117 208 (482)
Excess of acquirers’ interest in the net fair value over cost
(691) —210 (481)
Headline earnings 57 819
Weighted average number of ordinary shares in issue (thousands) 378 098
Headline earnings per share (cents per share) 15,29

105
21. Earnings per share (continued)
c) Diluted – basic and headline
There are no potentially dilutive instruments therefore diluted earnings per share and diluted headline earnings per share are not calculated.
d) Core
Core earnings per share is calculated after adding back the amortisation of intangible assets as a consequence of the purchase price allocations exercised in terms of IFRS 3: Business Combinations, the costs incurred in terms of the Management Bonus Settlement Agreement and the termination of the Otter Mist Trading CC consulting agreement, as explained in the pre-listing statement.
2008Proformaunaudited
R’000
2008Actual
unauditedR’000
2007Predecessor
value unaudited
R’000
Reconciliation between net profit for the period and core net profit for the period:
Net profit for the period 269 423 180 891 63 867
Management bonus settlement net of tax 57 600 57 600 —
Amortisation on intangibles raised through business combinations net of tax 34 919 22 937 3 916
Cancellation of onerous contract 9 000 9 000 —
Core net profit for the period 370 942 270 428 67 783
Core net profit for the year attributable to: 373 093 301 409 120 333
Equity holders of parent 370 942 270 428 67 783
Minority interest 2 151 30 981 52 550
Weighted average number of ordinary shares in issue 766 360 894 590 263 513 378 097 993
Core earnings per share (cents per share) 48,40 45,81 17,93

106
audited results as at 31 May 2008
2008ActualR’000
2007Predecessor
valueR’000
22. Cash generated by operations
Reconciliation of operating profit to cash generated by operating activities:
Operating profit 269 497 202 454
Adjustments for:
Depreciation of property plant and equipment 16 965 10 662
Amortisation of intangible assets 42 523 15 836
Loss on disposal of investments 53 —
Gain on derecognition of financial asset (43 000) —
Discounting of receivables 15 904 12 715
Discounting of payables (101 129) (71 338)
Impairment of loan — 152
Loss on disposal of property, plant and equipment 422 424
Profit on disposal of associate — (11 511)
Profit on disposal of financial assets at fair value through profit and loss — (807)
Excess of acquirers’ interest in the net fair value over cost (2 585) (691)
Fair value movements on investments 1 375 (2 540)
Unrealised forex gains (1 969) (1 233)
Changes in working capital (excluding the effects of acquisitions and disposals):
Increase in inventories (194 417) (48 818)
Increase in trade and other receivables (252 084) (140 475)
Increase in trade and other payables 205 078 103 781
Increase in loans receivable 5 032 181 200
Increase in financial assets at amortised cost (40 913) (45 323)
(79 248) 204 488
23. Taxation paid
Balance at beginning of year 31 617 —
Translation differences 50 —
Taxation charge 102 009 55 183
Acquisition of subsidiaries 8 820 32 324
Balance at end of year (71 146) (31 617)
71 350 55 890

107
24. Business combinations24.1 Acquisition of subsidiaries
31 May 2008
VirtualVoucher
AfricaPrepaid
Services
House of Business Solutions
Group Cellfind SACNS
Call Centre
ContentConnect
AfricaLittle River
Trading 181
POSControl
Services
Provider of a fully
integrated prepaid voucher
management system
operating in over
500 Engen petroleum forecourts
Distributor of prepaid
cellularairtime and
Vodacom starter packs
in Africa, excluding
South Africa
Holdingcompany
of Datacel Direct group.
The Group is a provider
of direct marketing of
short-term insurance products
to various databases
Provider of location
basedservices
Call centre operations
specialisingin insurance policy sales
Provider of content for mobile
devices
The procure-ment,
selling and distribution of prepaid products
for inter-alia fixed and
mobilenetworks and
all business ancillary thereto
Assemblesand sells
point of sale devices
Initialacquisition
Date acquired 1 June2006
1 June2006
1 June2006
1 June2006
1 January2008
23 January2008
1 March2008
1 March2008
% acquired 15% 28% 33,3% 42,7% 80% 100% 100% 52%
Furtheracquisition
Date acquired14 November
200714 November
200714 November
200714 November
2007
% acquired 85% 44% 66,7% 57,3%
R’000 R’000 R’000 R’000 R’000 R’000 R’000 R’000
Assets 32 538 49 243 303 25 131 10 523 7 595 56 254 651
Liabilities 15 556 61 374 42 5 122 2 341 3 685 54 165 719
Revenue 365 015 212 471 — 45 039 11 044 4 500 342 271 609
Profit/(loss) after tax since acquisition 4 327 220 8 231 18 453 1 062 (32) 2 089 (68)

108
audited results as at 31 May 2008
24.1 Acquisition of subsidiaries (continued)31 May 2008
The fair value of the net assets approximated the assets acquired
VirtualVoucher
R’000
AfricaPrepaid
ServicesR’000
House of Business Solutions
GroupR’000
Cellfind SAR’000
CNSCall Centre
R’000
ContentConnect
AfricaR’000
Little RiverTrading 181
R’000
POSControlR’000
TotalR’000
Cash and cash equivalents (5 296) 2 973 2 920 4 614 — 6 145 — — 11 356
Property, plant and equipment 183 2 774 3 069 117 718 667 — — 7 528
Intangible assets 35 1 366 669 2 002 248 — — — 4 320
Intangible assets – revalued — 29 875 28 289 62 686 924 6 387 38 732 — 166 893
Goodwill — 1 127 3 319 — 5 488 — — — 9 934
Investments — — 1 209 — — — — — 1 209
Inventories 13 043 10 265 — — — — — — 23 308
Receivables 15 069 20 741 4 428 9 664 — 2 983 — * 52 885
Loan receivable — — 5 313 — — — — — 5 313
Deferred tax — 553 (134) 128 — — — — 547
Deferred tax – revalued — (8 365) (7 921) (17 564) (259) (1 788) (10 845) — (46 742)
Borrowings (1 644) (17 924) (16 344) — — (37) — — (35 949)
Payables (8 735) (31 904) (5 332) (14 967) — (5 817) — — (66 755)
Fair value of subsidiaries acquired 12 655 11 481 19 485 46 680 7 119 8 540 27 887 * 133 847
Minority interests — (2 365) — — (1 424) — — — (3 789)
Investments in associates cost as at restructure date (2 703) 2 478 (5 651) (3 167) — — — — (9 043)
Fair value of net assets acquired 9 952 11 594 13 834 43 513 5 695 8 540 27 887 * 121 015
Amounts transferred to transactions with minority reserve 16 354 12 705 44 876 101 251 — — — — 175 186
Goodwill 11 728 13 296 79 897 21 406 5 660 21 460 62 113 — 215 560
Total purchase consideration 38 034 37 595 138 607 166 170 11 355 30 000 90 000 * 511 761
Settled in shares (19 125) (23 925) (68 821) (137 170) — — — — (249 041)
Settled in cash 18 909 13 670 69 786 29 000 11 355 30 000 90 000 * 262 720
Less cash and cash equivalents in subsidiary 5 296 (2 973) (2 920) (4 614) — (6 145) — — (11 356)
Cash flow on acquisition 24 205 10 697 66 866 24 386 11 355 23 855 90 000 * 251 364
*Less than R1 000

109
24.1 Acquisition of subsidiaries (continued)31 May 2007
Friedshelf 771 IT ExpertsTransaction
Junction Polsa Holdings E-Voucha
Companiesunder common
control
Investment holding
company of:1. ITEX
2. Transaction Junction3. Activi
Provider ofsecure, innovative
products andsolutions based on
global cutting-edge
technology
Provider of acomplete service
to institutionsdeploying paymentsolutions includingtransaction switch
management,professional
services,transaction
switching andproducts to
manage EFTenvironments
Procurementselling and
distribution ofprepaid products
for inter-aliafixed and mobilenetworks and all
ancillary services
Uses technologyto supply a stored
value card solution to the
insurance industry in order
to facilitate thesupply chain
managementprocess for thereplacement ofmerchandise to their clients via
the retail sector
Initialacquisition
Date acquired 1 February2007
1 February2007
1 April2007
1 February2007
5 October2006
1 June2006
% acquired 100% 100% 60% 50% 51%
R’000 R’000 R’000 R’000 R’000 R’000
Assets 10 433 6 582 3 036 10 863 15 156 1 783 231
Liabilities (10 433) (5 978) (3 659) 12 208 (16 917) 1 537 910
Revenue — 167 38 25 229 3 266 8 869 815
Profit/(loss) after tax since acquisition — (1 590) (304) (700) (784) 115 463

110
audited results as at 31 May 2008
24.1 Acquisition of subsidiaries (continued)31 May 2007
The fair value of the net assets approximated the assets acquired:
Friedshelf771
R’000IT Experts
R’000
Trans-action
JunctionR’000
Polsa HoldingsR’000
E-VouchaR’000
Companiesunder
commoncontrolR’000
TotalR’000
Cash and cash equivalents — — 58 1 447 — 717 763 719 268 Property, plant and equipment — 187 1 134 3 313 — 29 822 34 456 Intangible assets — — — — — 66 067 66 067Intangible assets – revalued — 5 039 8 783 — — — 13 822 Goodwill — — — — 2 500 39 774 42 274 Investments — — — — — 12 168 12 168 Investments in Associates — — — — — 48 925 48 925 Inventories — — — 1 223 — 213 589 214 812 Financial assets at amortised cost — — — — — 39 060 39 060 Receivables * 9 3 3 202 1 135 052 138 267 Loan receivable — — — — — 104 897 104 897 Deferred tax — — (57) — — (18 783) (18 840)Deferred tax – revalued — (1 461) (2 547) — — — (4 008)Borrowings — — (590) (7 932) (2 500) (353 162) (364 184)Payables — (271) (512) (1 887) — (813 537) (816 207)Minority interests — — (2 509) 317 — (85 530) (87 722)Fair value of net assets acquired * 3 503 3 763 (317) 1 136 105 143 055 Amounts transferred to transactions with minority reserve — — — — — 14 893 14 893 Goodwill — 1 297 437 400 2 499 — 4 633Total * 4 800 4 200 83 2 500 150 998 162 581Amounts transferred to restructuring reserve — — — — — (150 998) (150 998) Total purchase consideration * 4 800 4 200 83 2 500 — 11 583Less cash and cash equivalents in subsidiary — — (58) (1 447) — (717 763) (719 268)Cash flow on acquisition * 4 800 4 142 (1 364) 2 500 (717 763) (707 685)*Less than R1 000
The goodwill is attributable to the assembled workforce of the acquired business and the significant synergies expected to arise after the group’s acquisition of the above entities. If the acquisitions had occurred at the beginning of the financial year in which they occurred, group revenue and group profit before minority allocations would have been:
2008R’000
2007R’000
Group revenue 12 946 659 12 282 716Group profit 200 737 108 760
These amounts have been calculated using the group’s accounting policies and by adjusting the results of the subsidiary to reflect the additional depreciation and amortisation that would have been charged assuming the fair value adjustments to intangible assets had applied from the beginning of the financial year, together with the consequential tax effects.

111
24.2 Acquisition of minorities’ shareholdings31 May 2008
The PrepaidCompany Matragon Kwikpay SA Velociti
Blue LabelOne
BuddingTrade1170
VenturyGroup
Theprocurement,
selling,distribution of prepaid
products for inter-alia fixed
and mobile networks and
all business ancillary thereto
Matragon is the holding
company of Comm
Express Services SA
which is a distributor of prepaid
airtime and other prepaid products and
starter packs. Distribution
channels include
terminals, vending
machines and software embedded on
POS devices
Supply of electronic vouchers
and related services
Call centre operations
specialisingin insurance policy sales and cellular
contract sales
Focus on technology
strategy and new product development
Company holds Telkom
licence
Group company
consisting of:1. Ventury
Group2. Cigicell
3. iVeriDistributor of prepaid
airtime through own
terminals. Multi-channel payment and
transaction processing
group
Initial acquisition
Date acquired 1 June2006
1 June2006
1 June2006
1 June2007
1 June2006
1 June2006
1 June2006
% acquired 69,6% 50% 60% 51% 75% 50% 90%
Further acquisition
Date acquired 14 November2007
14 November2007
14 September2006
14 November2007
14 November2007
14 November2007
22 April2008
% acquired 30,4% 50% 15% 49% 25% 50% 10%
Date acquired 1 March2007
% acquired 20%
Date acquired 14 November2007
% acquired 5%
R’000 R’000 R’000 R’000 R’000 R’000 R’000
Assets 2 311 711 378 312 107 615 13 086 9 685 — 137 184
Liabilities 1 973 312 331 916 88 048 14 058 17 611 — 41 454
Revenue 10 342 528 4 132 280 630 302 32 569 — — 1 638 497
Profit/(loss) after tax since acquisition 100 264 23 579 7 121 2 736 (3 596) — 5 476

112
audited results as at 31 May 2008
24.2 Acquisition of minorities’ shareholdings (continued)
31 May 2008
The fair value of the net assets approximated the assets acquired
ThePrepaid
Company R’000
MatragonR’000
Kwikpay SAR’000
VelocitiR’000
Blue LabelOne
R’000
BuddingTrade1170
R’000
VenturyGroupR’000
TotalR’000
Minority interests 114 121 25 735 791 — (1 556) * 10 992 150 083 Fair value of net assets acquired 114 121 25 735 791 — (1 556) * 10 992 150 083 Amounts transferred to transactions with minority reserve 615 479 71 265 — 7 185 11 556 3 000 — 708 485 Goodwill/(excess of acquirers’ interest in the net fair value over cost) — — 334 — — — (2 585) (2 251) Total purchase consideration 729 600 97 000 1 125 7 185 10 000 3 000 8 407 856 317 Settled in shares (729 600) (48 500) (1 125) (3 592) (10 000) (1 500) — (794 317) Settled in cash — 48 500 — 3 593 — 1 500 8 407 62 000Cash flow on acquisition — 48 500 — 3 593 — 1 500 8 407 62 000*Less than R1 000
31 May 2007Kwikpay SA
Supply of electronic vouchers and related servicesInitial acquisitionDate acquired 1 June 2006% acquired 60%Further acquisitionDate acquired 14 September 2006% acquired 15%Date acquired 1 March 2007% acquired 20%
R’000Assets 59 027 Liabilities (46 582)Revenue 472 396 Profit after tax 2 773 The fair value of the net assets approximated the assets acquired Minority interests 4 091 Fair value of net assets acquired 4 091 Excess of acquirers’ interest in the net fair value over cost (691)Total 3 400 Total purchase consideration 3 400 Cash flow on acquisition 3 400
31 May2008
Actual auditedR’000
31 May2007
Predecessorvalue
auditedR’000
25. CommitmentsFuture operating lease commitments:The group leases various offices and warehouses under non-cancellable operating lease agreements. The lease terms are between 1 and 5 years, and the majority of lease agreements are renewable at the end of the lease period at market rate.The group also leases various plant and machinery under cancellable operating lease agreements. The group is required to give a six-month notice for the termination of the majority of these agreements. The lease expenditure charged to the income statement during the year is disclosed in note 18.The future aggregate minimum lease payments under non-cancellable operating leases are as follows:PremisesPayable within one year 16 589 4 181 Payable in two to five years 57 555 9 824 Payable in greater than five years 7 818 6 585 EquipmentPayable within one year 6 321 540 Payable in two to five years 10 586 1 046 Payable in greater than five years 46 —
98 915 22 176

113
31 May2008
Actual auditedR’000
31 May2007
Predecessorvalue
auditedR’000
26. Related party transactionsFor details of subsidiaries, associates and joint ventures refer to note 29.For details of the company’s directors, refer to the Directors’ report.ZOK Cellular (Proprietary) Limited is a related party due to the company having common directorships.Moneyline 311 (Proprietary) Limited, PLL Investments (Proprietary) Limited, Friedshelf 669 (Proprietary) Limited and Ellerine Bros. (Proprietary) Limited are related parties due to the companies having certain common directorships.For details of the shareholdings in the company, refer to the Directors’ report.The following transactions were carried out with related partiesDirectors emolumentsRefer to note 27Sales to related partiesZOK Cellular (Proprietary) Limited 493 13 011Premet Cellular (Proprietary) Limited 280 386 319 991The Hub (Proprietary) Limited 15 594 24 720BSC Technologies (Proprietary) Limited 1 650 904Purchases from related partiesZOK Cellular (Proprietary) Limited 19 911 572Premet Cellular (Proprietary) Limited 4 996 2 746The Hub (Proprietary) Limited 1 519 1 436BSC Technologies (Proprietary) Limited 2 550 9 298Cost recoveries from related partiesPremet Cellular (Proprietary) Limited 41 2The Hub (Proprietary) Limited 180 —BSC Technologies (Proprietary) Limited 160 —ZOK Cellular (Proprietary) Limited 414 —Interest paid to related partiesShareholders — 426Interest received from related partiesHouse of Business Solutions (Proprietary) Limited 401 746Cellfind SA (Proprietary) Limited — 307 Africa Prepaid Services (Proprietary) Limited 469 692Management fees received from related partiesHouse of Business Solutions (Proprietary) Limited — 218 Cellfind SA (Proprietary) Limited 119 262Africa Prepaid Services (Proprietary) Limited 108 240 ZOK Cellular (Proprietary) Limited 4 449 5 500Rent received from related partiesHouse of Business Solutions (Proprietary) Limited 101 247 Africa Prepaid Services (Proprietary) Limited 56 197 Datacel Direct (Proprietary) Limited 69 94Rent paid to related partiesMoneyline 311 (Proprietary) Limited 1 880 —PLL Investments (Proprietary) Limited 828 —Friedshelf 669 (Proprietary) Limited 240 296Ellerine Bros. (Proprietary) Limited 1 767 1 563Loans to related partiesHouse of Business Solutions (Proprietary) Limited — 5 623 Loans from related partiesShareholders — 2 531 Amounts due from related partiesCellfind SA (Proprietary) Limited — 25Virtual Voucher (Proprietary) Limited — 1 015 African Prepaid Services (Proprietary) Limited — 85ZOK Cellular (Proprietary) Limited 27 271 32 218Premet Cellular (Proprietary) Limited — 12 691The Hub (Proprietary) Limited 4 147 4 624BSC Technologies (Proprietary) Limited — 34Amounts due to related partiesHouse of Business Solutions (Proprietary) Limited — 2Premet Cellular (Proprietary) Limited 2 850 332The Hub (Proprietary) Limited 188 533ZOK Cellular (Proprietary) Limited 16 —Moneyline 311 (Proprietary) Limited 113 —Basis of transactionsAll transactions with related parties are conducted on an arm’s length basis

114
audited results as at 31 May 2008
Services asdirectors of
Blue LabelTelecoms
LimitedR’000
Salary andallowances
R’000
Bonuses andperformance
relatedpayments
R’000
Otherbenefits
R’000
Sub-total
R’000
27. Directors’ emolumentsFor the year ended 31 May 2008
Executive directors
Levy, BM — 2 763 3 360 37 6 160
Levy, MS — 2 763 3 360 37 6 160
Pamensky, MV — 2 026 1 429 16 3 471
Rivkind, DB — 1 034 735 16 1 785
— 8 586 8 884 106 17 576
Non-executive directors
Nestadt, LM 325 — — — 325
Ellerine, S 230 — — — 230
Harlow, GD 330 — — — 330
Huntley, RJ 205 — — — 205
Lazarus, NN 228 — — — 228
Mansour, P — — — — —
Mthimunye, J 233 — — — 233
Theledi, HC 150 — — — 150
Tyalimpi, LM 115 — — — 115
1 816 — — — 1 816
1 816 8 586 8 884 106 19 392
For the year ended 31 May 2007
Executive directors
Levy, BM — — — — —
Levy, MS — — — — —
Pamensky, MV — — — — —
Rivkind, DB — — — — —
— — — — —
Non-executive directors
Nestadt, LM — — — — —
Ellerine, S — — — — —
Harlow, GD — — — — —
Huntley, RJ — — — — —
Lazarus, NN — — — — —
Mthimunye, J — — — — —
Theledi, HC — — — — —
Tyalimpi, LM — — — — —
— — — — —
— — — — — * The sum of R80 million was paid to Brett and Mark Levy in lieu of their pre-listing contractual bonus entitlements. The R80 million was used to acquire
BLT shares.

115
Services asdirectors ofsubsidiaries
of Blue LabelTelecoms
LimitedR’000
Salary andallowances
fromsubsidiaries
R’000
Bonuses andperformance
relatedpayments
fromsubsidiaries
R’000
Cancellationof pre-listing
managementbonus
participationagreement*
R’000
Otherbenefits
fromsubsidiaries
R’000
Corporate finance and
legal fees for services
rendered to Blue Label Telecoms
Limited subsidiaries
R’000
Retirementand related
benefitsfrom
subsidiariesR’000
TotalR’000
— 4 001 — 40 000 23 — 200 50 384
— 3 098 — 40 000 25 — 201 49 484
— 1 752 1 021 — 10 — 200 6 454
— 403 525 — 8 — 101 2 822
— 9 254 1 546 80 000 66 — 702 109 144
— — — — — — — 325
— — — — — — — 230
— — — — — 600 — 930
30 — — — — — — 235
— — — — — 1 219 — 1 447
— — — — — — — —
45 — — — — — — 278
— — — — — — — 150
25 — — — — — — 140
100 — — — — 1 819 — 3 735
100 9 254 1 546 80 000 66 1 819 702 112 879
— 8 562 6 981 — 47 — 320 15 910
— 5 725 6 981 — 238 — 301 13 245
— 3 481 621 — 20 — 320 4 442
— 897 500 — — — 151 1 548
— 18 665 15 083 — 305 — 1 092 35 145
— — — — — — — —
— — — — — — — —
— — — — — — — —
— — — — — — — —
— — — — — 1 254 — 1 254
45 — — — — — — 45
— 474 — — — — — 474
— — — — — — — —
45 474 — — — 1 254 — 1 773
45 19 139 15 083 — 305 1 254 1 092 36 918

116
audited results as at 31 May 2008
28. Segmental summaryThe group’s segment reporting follows the organisational structure as reflected in its internal management reporting systems, which are the basis for assessing the financial performance of the business segments and for allocating resources to the business segments. Management’s assessment of the group’s organisational structure takes the geographical location of the segments into account. All reporting segments located outside of South Africa are included in the International Distribution segment. Operations included in all other segments are located within South Africa.
At 31 May 2008, the group is managed on the basis of five main business segments:
mobile network operators and Telkom, and the distribution of starter packs in South Africa.
the distribution of starter packs in Africa.
network as well as the development of new mobile services to take to market.
Transactions between reportable segments are conducted at arm’s length.
TotalTelecommunication
distribution
31 May 2008
Actualaudited
R’000
31 May 2007
Predecessorvalue
auditedR’000
31 May2008
Actualaudited
R’000
31 May 2007
Predecessorvalue
auditedR’000
The segment results for the year ended 31 May are as follows:
Total segment revenue 18 044 759 12 232 240 17 451 794 12 147 799
Inter-segment revenue (5 499 288) (3 337 196) (5 490 224) (3 337 196)
Revenue 12 545 471 8 895 044 11 961 570 8 810 603
Segment result
Operating profit before depreciation, amortisation and impairment charges 328 167 229 136 339 352 259 616
Depreciation and amortisation (58 670) (26 682) (28 376) (23 667)
Finance costs (147 704) (134 280) (144 769) (133 596)
Finance income 193 281 96 029 188 797 94 147
Share of (losses)/profits from associates (17 441) (956) 545 3 328
Taxation (89 841) (53 420) (84 431) (52 491)
Net profit for the year 207 792 109 827 271 118 147 337
Non-cash items
Excess of acquirers’ interest in the net fair value over cost 2 585 691 2 585 691
Profit on sale of associate — 11 511 — 11 511
Fair value adjustment (1 375) 2 540 (1 375) 2 540
Profit on sale of investments — 807 — 807
The segment assets and liabilities at 31 May are as follows:
Assets excluding investments in associates and joint ventures 3 140 873 1 900 269 2 687 522 1 856 942
Investment in associates and joint ventures 81 356 61 804 1 2 280
Total assets 3 222 229 1 962 073 2 687 523 1 859 222
Additions to non-current assets
Property, plant and equipment 54 766 56 051 31 046 48 962
Intangible assets 419 939 138 081 119 630 116 119
Investment in joint ventures — — * *
Total liabilities 1 304 285 1 544 052 1 125 116 1 484 886
* Less than R1 000.

117
International distribution
Technology platforms
Related services Corporate
31 May2008
Actualaudited
R’000
31 May2007
Predecessorvalue
auditedR’000
31 May 2008
Actualaudited
R’000
31 May 2007
Predecessorvalue
auditedR’000
31 May2008
Actualaudited
R’000
31 May 2007
Predecessorvalue
auditedR’000
31 May2008
Actualaudited
R’000
31 May 2007
Predecessorvalue
auditedR’000
383 749 50 461 35 594 1 705 173 622 32 275 — —
(344) — (7 713) — (1 007) — — —
383 405 50 461 27 881 1 705 172 615 32 275 — —
17 968 3 954 (9 796) (3 935) 42 247 (1 557) (61 604) (28 942)
(7 891) (1 655) (4 079) (578) (17 473) (19) (851) (763)
(888) (2) (528) (179) (1 030) (213) (489) (290)
51 — 93 108 976 27 3 364 1 747
(19 176) (9 811) — — 1 190 5 527 _ —
(2 093) (1 044) 1 428 115 (3 369) — (1 376) —
(12 029) (8 558) (12 882) (4 469) 22 541 3 765 (60 956) (28 248)
— — — — — — — —
— — — — — — — —
— — — — — — — —
— — — — — — — —
157 451 12 180 40 543 22 012 282 567 15 156 (27 210) (6 021)
81 355 46 273 — — — 16 311 — (3 060)
238 806 58 453 40 543 22 012 282 567 31 467 (27 210) (9 081)
5 038 5 553 7 883 1 164 9 966 178 832 194
46 523 533 9 231 16 418 242 904 2 500 1 651 2 512
— — — — — — — —
80 654 23 523 9 737 16 228 63 547 16 917 25 230 2 498

118
Country
Number ofissued ordinary
sharesPercentage
held
29. Interest in subsidiaries, associates and joint ventures2008SubsidiariesDirectly held:Subsidiaries of Blue Label Telecoms Limited:Activi Technology Services (Proprietary) Limited (previously Friedshelf 771) RSA 300 100Africa Prepaid Services (Proprietary) Limited RSA 150 72Blue Label One (Proprietary) Limited RSA 300 100Blue Label Investments (Proprietary) Limited RSA 100 100Budding Trade 1170 (Proprietary) Limited RSA 100 100Cellfind SA (Proprietary) Limited RSA 1 000 100Content Connect Africa (Proprietary) Limited RSA 100 100Datacel Direct (Proprietary) Limited RSA 100 100E-Voucha (Proprietary) Limited RSA 1 000 51House of Business Solutions (Proprietary) Limited RSA 1 000 100Kwikpay SA (Proprietary) Limited RSA 100 100Matragon (Proprietary) Limited RSA 100 100Matrix Investments No 4 (Proprietary) Limited RSA 100 100SharedPhone International (Proprietary) Limited RSA 5 000 50,1The Prepaid Company (Proprietary) Limited RSA 100 100The Post Paid Company (Proprietary) Limited RSA 200 51**Ventury Group (Proprietary) Limited RSA 2 000 100Virtual Voucher (Proprietary) Limited RSA 200 100
Indirectly held:Subsidiaries of Blue Label Investments (Proprietary) Limited:Gold Label Investments (Proprietary) Limited RSA 1 000 100Polsa Holdings Limited Cyprus 17 600 50*
Subsidiary of The Prepaid Company (Proprietary) Limited:Little River Trading 181 (Proprietary) Limited (trading as Crown Cellular) RSA 100 100
Subsidiaries of Ventury Group (Proprietary) Limited:Cigicell (Proprietary) Limited RSA 100 100iVeri (Proprietary) Limited RSA 1 000 51
Subsidiaries of Matragon (Proprietary) Limited:Airtime Xpress (Proprietary) Limited RSA 200 100Comm Express Services SA (Proprietary) Limited RSA 100 100POS Control Services (Proprietary) Limited RSA 100 52
Subsidiaries of Activi Technology Services (Proprietary) Limited:Activi Deployment Services (Proprietary) Limited (previously Terminal Deployment Centre) RSA 100 100IT Experts (Proprietary) Limited RSA 300 100Transaction Junction (Proprietary) Limited RSA 120 60
Subsidiaries of Africa Prepaid Services (Proprietary) Limited:Africa Prepaid Services (Mozambique) Limitada Mozambique — 90Africa Prepaid Services – RDC sprl DRC 300 80
Subsidiaries of Datacel Direct (Proprietary) Limited:Blue Label Call Centre (Proprietary) Limited RSA 300 100CNS Call Centre (Proprietary) Limited RSA 1 000 80Velociti (Proprietary) Limited RSA 1 000 100
AssociateIndirectly held:Associate of Gold Label (Proprietary) Limited:Oxigen Services India (Private) Limited India 100 35
Joint venturesJoint ventures of The Prepaid Company (Proprietary) Limited:The Hub Pretalk (Proprietary) Limited RSA 300 40Premet Cellular (Proprietary) Limited RSA 100 40
**49% was disposed of on 1 April 2008 for a nominal amount. No further disclosure has been made as the effect of this transaction is below R1 000.
audited results as at 31 May 2008

119
Country
Number ofissued ordinary
sharesPercentage
held
29. Interest in subsidiaries, associates and joint ventures (continued)2007SubsidiariesDirectly held:Subsidiaries of Blue Label Telecoms Limited:Blue Label Investments (Proprietary) Limited RSA 100 100Blue Label One (Proprietary) Limited RSA 300 75The Prepaid Company (Proprietary) Limited RSA 100 69,60
Indirectly held:Subsidiaries of Blue Label Investments (Proprietary) Limited:Gold Label Investments (Proprietary) Limited RSA 1 000 75Polsa Holdings Limited Cyprus 17 600 50*
Subsidiaries of The Prepaid Company (Proprietary) Limited:Budding Trade 1170 (Proprietary) Limited RSA 100 50*E-Voucha (Proprietary) Limited RSA 1 000 51Friedshelf 771 (Proprietary) Limited RSA 300 100Kwikpay SA (Proprietary) Limited RSA 100 95Matragon (Proprietary) Limited RSA 100 50*Matrix Investments No 4 (Proprietary) Limited RSA 100 100SharedPhone (Proprietary) Limited RSA 5 000 50,1*The Post Paid Company (Proprietary) Limited RSA 100 100Ventury Group (Proprietary) Limited RSA 2 000 90
Subsidiaries of Ventury Group (Proprietary) Limited:Cigicell (Proprietary) Limited RSA 100 100iVeri (Proprietary) Limited RSA 1 000 51Terminal Deployment Centre (Proprietary) Limited RSA 100 100
Subsidiaries of Matragon (Proprietary) Limited:Airtime Xpress (Proprietary) Limited RSA 200 100Comm Express Services SA (Proprietary) Limited RSA 100 100
Subsidiaries of Friedshelf 771 (Proprietary) Limited:IT Experts (Proprietary) Limited RSA 300 100Transaction Junction (Proprietary) Limited RSA 120 60
AssociatesDirectly held:Associates of Blue Label Telecoms Limited:Africa Prepaid Services (Proprietary) Limited RSA 150 28Cellfind SA (Proprietary) Limited RSA 100 42,70House of Business Solutions (Proprietary) Limited RSA 1 000 33,30
Indirectly held:Associate of Gold Label (Proprietary) Limited:Oxigen Services India (Private) Limited India 100 35
Associate of Prepaid Company (Proprietary) Limited:Virtual Voucher (Proprietary) Limited RSA 200 15
Subsidiary of House of Business Solutions (Proprietary) Limited:Datacel Direct (Proprietary) Limited RSA 100 21,31
Subsidiaries of Africa Prepaid Services (Proprietary) Limited:Africa Prepaid Services (Mozambique) Limitada Mozambique 90Africa Prepaid Services – RDC sprl DRC 300 80
Joint venturesIndirectly held:Joint ventures of The Prepaid Company (Proprietary) Limited:The Hub Pretalk (Proprietary) Limited RSA 300 40Premet Cellular (Proprietary) Limited RSA 100 40
*Control is demonstrated by the company as a result of a number of factors, including financial policies regarding funding.
30. Post balance sheet eventsRefer to the directors’ report for details on the post balance sheet events.

120
Note
31 May2008
Actual auditedR’000
31 May2007Actual
auditedR’000
ASSETS
Non-current assets 3 267 104 —
Property, plant and equipment 3 1 212 —
Intangible assets 4 1 671 —
Deferred taxation 5 136 —
Investment in subsidiaries 6 3 264 085 —
Current assets 1 210 276 *
Loans receivable 7 476 —
Loans to subsidiaries 6 1 174 310 —
Receivables 8 34 878 —
Cash and cash equivalents 9 612 *
Total assets 4 477 380 *
EQUITY AND LIABILITIES
Capital and reserves 4 403 436 *
Share capital 10 * *
Share premium 10 4 404 737 —
Accumulated loss (1 301) —
Current liabilities 73 944 —
Trade and other payables 11 23 815 —
Loans from subsidiaries 6 48 866 —
Current tax liabilities 1 214 —
Bank overdraft 9 49 —
Total equity and liabilities 4 447 380 *
*Less than R1 000
audited results as at 31 May 2008

121
for the year ended 31 May 2008
Note
31 May2008
Actual auditedR’000
31 May2007Actual
auditedR’000
Other income 43 516 —
Employee compensation and benefit expense (29 478) —
Depreciation, amortisation and impairment charges (3 444) —
Other expenses (14 513) —
Operating loss 12 (3 919) —
Finance costs 13 (11) —
Finance income 13 3 706 —
Net loss before taxation (224) —
Taxation 14 (1 077) —
Net loss for the year (1 301) —

122
audited results as at 31 May 2008
Note
Share CapitalR’000
Share premium
R’000
Accumulated loss
R’000Total equity
R’000
Balance as at 31 May 2007 * — — —
Shares issued during the year 10 * 4 444 461 — 4 444 461
Share issue costs — (39 724) — (39 724)
Net loss for the year — — (1 301) (1 301)
Balance as at 31 May 2008 * 4 404 737 (1 301) 4 403 436
*Less than R1 000

123
for the year ended 31 May 2008
Note
31 May2008
Actual auditedR’000
31 May2007Actual
auditedR’000
Cash flows from operating activities 15 (12 015) —
Finance income 13 3 706 —
Finance costs 13 (11) —
Taxation paid 16 — —
Net cash flows from operating activities (8 320) —
Cash flows from investing activities
Acquisition of property, plant and equipment (1 244) —
Acquisition of intangible assets (1 719) —
Acquisition of investment in subsidiaries 6 (180 203) —
Loans advanced to subsidiaries (1 177 672) —
Loans received from subsidiaries 48 866 —
Net cash flows from investing activities (1 311 972) —
Cash flows from financing activities
Proceeds from issue of shares 1 360 579 *
Share issue costs (39 724) —
Net cash flows from financing activities 1 320 855 —
Increase in cash and cash equivalents 563 —
Cash and cash equivalents at the beginning of the period * —
Cash and cash equivalents at the end of the period 9 563 *
*Less than R1 000

124
audited results as at 31 May 2008
1. Accounting policies
The accounting policies applied to the company annual
financial statements are consistent with the group
accounting policies as detailed on pages 78 to 89.
2. Financial risks
In the course of its business, the company is exposed
to a number of financial risks: credit risk, liquidity
risk and market risk (including foreign currency and
other price risk). This note presents the company’s
objectives, policies and processes for managing its
financial risk and capital.
Credit risk
Credit risk arises because a counterparty may fail to
meet its obligations to the company. The company is
exposed to credit risks on financial instruments such
as receivables, loans receivable and cash.
Receivables consist primarily of invoiced amounts from
normal trading activities. The company has a diversified
customer base and policies are in place to ensure
sales are made to customers with an appropriate
credit history. Individual credit limits are set for each
customer and the utilisation of these credit limits is
regularly monitored. Where necessary, a provision for
impairment is made.
The company places cash and cash equivalents with
major banking companies and quality institutions that
have high credit ratings.
Loans are only granted to holders with an appropriate
credit history, taking into account the holder’s financial
position and past experience.
The company has no significant concentrations of
credit risk.
The company’s maximum credit risk exposure is
the carrying amount of all financial assets on the
balance sheet.
Liquidity risk
Liquidity risk arises when a company encounters
difficulties to meet commitments associated
with liabilities and other payment obligations. The
company’s objective is to maintain prudent liquidity
risk management by maintaining sufficient cash
and marketable securities, the availability of funding
through an adequate amount of committed credit
facilities and the ability to close out market positions.
Due to the dynamic nature of the underlying
businesses, the company aims to maintain flexibility in
funding by keeping committed credit lines available.
Maturity of financial liabilities
Payable in:
2008
Less than
1 month or
on demand(R‘000)
More than
1 month
but not
exceeding
1 year(R‘000)
More than
1 year
but not
exceeding
2 years(R‘000)
More than
2 years
but not
exceeding
5 years(R‘000)
More than
5 years(R‘000)
Non-interest-bearing borrowings 48 866 — — — —
Trade and other payables* 13 640 4 515 — — —
Bank overdraft 49 —- — — —
Total 62 555 4 515 —- — —*Trade and other payables exclude non-financial instruments
Market risk
The company is exposed to risks from movements in
foreign exchange rates and interest rates that affect
its assets, liabilities and anticipated future transactions.
Cash flow and fair value interest rate risk
The company’s cash flow interest rate risk arises
from loans receivable and cash and cash equivalents.
The company is not exposed to fair value interest rate
risk as the company does not have any fixed interest-
bearing instruments carried at fair value nor any
interest-bearing borrowings.
As part of the process of managing the company’s
exposure to interest rate risk, interest rate
characteristics of new borrowings and the refinancing
of existing borrowings are positioned according to
expected movements in interest rates.

125
Foreign currency risk
The company is exposed to foreign currency risk from
transactions. Transaction exposure arises due to the
company granting loans to affiliated companies in
foreign currencies.
The company manages its exposure to foreign
currency risk by ensuring that the net foreign currency
exposure remains within acceptable levels. Hedging
instruments are used in certain instances to reduce
risks arising from foreign currency fluctuations. The
company did not enter into any forward exchange
contracts during the period under review.
IFRS 7 Sensitivity analysis
The company has used a sensitivity analysis technique that
measures the estimated change to the income statement
of either an instantaneous increase or decrease of 1%
(100 basis points) in market interest rates or a 10%
strengthening or weakening of the Rand.
The sensitivity analysis is based on the following
assumptions:
Interest rate risks
The interest rate sensitivity analysis is based on the
following assumptions:
Changes in market interest rates affect the interest
income or expense of variable interest financial
instruments
Changes in market interest rates only affect
interest income or expense in relation to financial
instruments with fixed interest rates if these are
recognised at fair value.
Under these assumptions, a 1% increase or decrease
in market interest rates at 31 May 2008 would
increase or decrease profit before tax by R173 194.
Foreign currency risk
Financial instruments by currency
2008ZAR
R‘000USD
R‘000Total
R‘000
Financial assetsCash 612 — 612
Receivables* 32 084 — 32 084
Loans receivable 1 174 310 476 1 174 786
1 207 006 476 1 207 482
Financial liabilitiesNon-interest-bearing borrowings 48 866 — 48 866
Trade and other payables* 18 155 — 18 155
Bank overdraft 49 —- 49
67 070 — 67 070
Net financial position 1 139 936 476 1 140 412
*Receivables and trade and other payables exclude non-financial instruments.
With a 10% strengthening or weakening in the Rand against all other currencies, profit before tax would have decreased or increased by R47 525 respectively.
Capital risk
The company’s objectives when managing capital are to safeguard the company’s ability to continue as a going concern in order to provide returns for shareholders and benefits for other stakeholders and to maintain an optimal capital structure to reduce the cost of capital.
In order to maintain or adjust this capital structure, the company may issue new shares, adjust the amount of dividends paid to shareholders, return capital to shareholders or sell assets to reduce debt.
The company defines capital as capital and reserves and non-current borrowings.
The company is not subject to externally imposed capital requirements.
There were no changes to the company’s approach to capital management during the year.
Fair value measurement
For all short-term financial assets and liabilities, the carrying amount is regarded as an approximation of the fair value.
The fair value of all non-current loans receivable and borrowings are calculated using a discounted cash flow model based on prevailing market interest rates.

126
audited results as at 31 May 2008
Computerequipment
R’000
Furniture and fittings
R’000
Motor vehicles
R’000
Officeequipment
R’000Total
R’000
3. Property, plant and equipmentYear ended 31 May 2008
Actual
Opening carrying amount — — — — —
Additions 279 485 349 131 1 244
Depreciation charge (9) (1) (20) (2) (32)
Closing carrying amount 270 484 329 129 1 212
At 31 May 2008
Cost 279 485 349 131 1 244
Accumulated depreciation (9) (1) (20) (2) (32)
Carrying amount 270 484 329 129 1 212
31 May2008
Actual auditedR’000
31 May2007Actual
auditedR’000
4. Intangible assetsComputer software
Opening carrying amount — —
Additions 1 719 —
Amortisation charge (48) —
Closing carrying amount 1 671 —
5. Deferred taxation
At 31 May 2007
Credited to income statement: — —
– Provisions 117 —
– Other 19 —
At 31 May 2008 136 —
Deferred taxation comprises:
– Provisions 117 —
– Other 19 —
136 —

127
31 May2008
Actual auditedR’000
31 May2007Actual
auditedR’000
6. Investments in subsidiaries
Shares at cost less amounts written off 3 264 085 —
Loans owing by subsidiaries 1 174 310 —
Loans owing to subsidiaries (48 866) —
4 389 529 —
Shares at cost less amounts
written offR’000
Loansowing by
subsidiariesR’000
Loansowing to
subsidiariesR’000
Details are reflected below:
Africa Prepaid Services (Proprietary) Limited 61 520 13 539 —
Activi Technology Services (Proprietary) Limited 5 000 — —
Blue Label Investments (Proprietary) Limited 108 416 — (866)
Blue Label One (Proprietary) Limited 40 000 — —
Budding Trade (Proprietary) Limited 6 000 — —
Cellfind SA (Proprietary) Limited 290 000 — —
Content Connect Africa (Proprietary) Limited 30 000 — —
Datacel Direct (Proprietary) Limited 150 000 7 120 —
E-Voucha (Proprietary) Limited 2 500 — —
Gold Label Investments (Proprietary) Limited 29 400 100 340 —
Kwikpay SA (Proprietary) Limited 22 500 — —
Matragon (Proprietary) Limited 194 000 30 377 —
Matrix Investments No 4 (Proprietary) Limited 4 160 — —
The Postpaid Company (Proprietary) Limited * — —
SharedPhone International (Proprietary) Limited 20 000 3 216 —
The Prepaid Company (Proprietary) Limited 2 150 214 1 018 903** —
Velociti (Proprietary) Limited 7 185 815 —
Ventury Group (Proprietary) Limited 98 406 — (48 000)
Virtual Voucher (Proprietary) Limited 44 784 — —
3 264 085 1 174 310 (48 866)
* Less than R1 000** R450 million of this balance is subordinated in favour of other creditors of The Prepaid Company (Proprietary) Limited
All subsidiaries are based in the Republic of South Africa. For details on percentage held and issued shares refer to note 29 in the group notes.
The directors believe that the carrying value of the shares approximate their fair value.
The above subsidiaries were acquired by the company as part of the restructuring of the group. R3,042 billion of the acquisition price was settled in shares and R184,6 million was settled in cash.

128
audited results as at 31 May 2008
31 May2008
Actual auditedR’000
31 May2007Actual
auditedR’000
7. Loans receivableInterest free 476 _
Loans are unsecured and have no fixed terms of repayment 476 —
8. Trade and other receivables
Receivables from related parties 32 104 —
Sundry debtors and prepayments 2 774 —
34 878 —
The ageing of trade receivables at the reporting date was:
GrossR‘000
ImpairmentR‘000
31 May 2008
Fully performing 31 963 —
Past due by 1 to 30 days 67 —
Past due by 31 to 60 days 74 —
Past due by 61 to 90 days — —
Past due by more than 90 days — —
32 104 —
Based on the credit history of the relevant debtors, management does not consider there to be any indications of potential default in respect of the fully performing book.
31 May2008
Actual auditedR’000
31 May2007Actual
auditedR’000
9. Cash and cash equivalents
Cash at bank 611
Cash on hand 1
Favourable balances 612
Bank overdraft (49)
563

129
2008Actual
Numberof shares
2007Actual
Numberof shares
2008ActualR’000
2007ActualR’000
10. Share capitalAuthorised
Total authorised share capital of ordinary shares
1 000 000 000 1 000 1 *
Par value of R0,000001 each (2007: Par value of R1 each)
Refer to the directors’ report for the details of the special resolution passed to effect the change in the par value.
Issued
Balance at the beginning of the year 1 1 * *
Shares issued during the period 766 360 893 — * —
Balance at the end of the year 766 360 894 1 * *
Number
Issueprice
R
Share capital R’000
Share premium
R’000
Shares issued during the period
Shares issued to buy out minority shareholders on restructuring1
190 131 616 5,50 * 1 045 724
Shares issued to Brett Levy and Mark Levy to terminate the management bonus agreement2
14 545 455 5,50 * 80 000
Shares issued to the previous shareholders of Blue Label Investments (Proprietary) Limited to purchase the said company3
378 097 993 5,50 * 2 079 533
Shares issued as part of the preferential allocation in the private placing
148 148 148 6,75 * 1 000 000
Shares issued to Microsoft Corporation 35 437 682 6,75 * 239 204
766 360 894 * 4 444 461 *Less than R1 000
1. Please refer to pre-listing statement for details of the minority shareholders that received shares as part of the restructuring (Step 4 – 13 in the overview of the restructuring).
2. Please refer pre-listing statement for details of the management bonus settlement agreement (Section 20.1).3. Please refer to pre-listing statement for details (Step 3 in the overview of the restructuring).

130
audited results as at 31 May 2008
31 May2008
Actual auditedR’000
31 May2007Actual
auditedR’000
11. Trade and other payables
Trade payables 2 753 —
Accruals 15 630 —
Sundry creditors 1 542 —
VAT 3 890 —
23 815 —
12. Operating profitThe following items have been charged/(credited), in arriving at operating profit:
Management fees received (43 268) —
Consulting fees 114 —
Foreign exchange loss 730 —
Impairment of loans 3 365 —
Insurance 988 —
Legal fees 282 —
Operating lease rentals – premises 717 —
Overseas travel 3 724 —
Rent and security 156 —
Repairs and maintenance 16 —
Audit fees 2 267 —
13. Finance (income)/costsInterest received
– Bank (2 631) —
– Loans (1 075) —
(3 706) —
Interest paid
– Bank 11 —
11 —
Net finance income (3 695) —
14. TaxationCurrent tax 1 214 —
current year 1 214 —
Deferred tax (137) —
current year (137) —
1 077 —
Tax rate reconciliation
Net loss before tax (224) —
Tax at 28% (62) —
Adjusted for:
– income not taxable (118) —
– expenditure not deductible 1 257 —
1 077 —

131
31 May2008
Actual auditedR’000
31 May2007Actual
auditedR’000
15. Cash flows from operating activities Reconciliation of operating profit to cash flows
from operating activities:
Operating loss (3 919) —
Adjustments for:
Depreciation of property, plant and equipment 32 —
Amortisation on intangible assets 48 —
Impairment of loan 3 363 —
Changes in working capital
Increase in trade and other receivables (34 878) —
Increase in trade and other payables 23 815 —
Increase in loans receivable (476) —
(12 015) —
16. Taxation paid Balance at beginning of year —
Taxation charge 1 214 —
Balance at end of year (1 214) —
— —
17. CommitmentsFuture operating lease charges for:
Premises
Payable within one year 1 265 —
Payable in 2 to 5 years 2 057 —
3 322 —

132
for the year ended 31 May 2008
31 May2008
Actual auditedR’000
31 May2007
Predecessorvalue
auditedR’000
18. Related party transactionsRelated party relationshipsFor details of subsidiaries, associates and joint ventures refer to note 29 in the group notes.For details of the company’s directors, refer to the Directors’ report.ZOK Cellular (Proprietary) Limited is a related party due to the company having common directorships.Moneyline 311 (Proprietary) Limited is a related party due to the company having common directorships.For details of the shareholdings in the company, refer to the Directors’ report.
The following transactions were carried out with related partiesSales to related partiesThe Prepaid Company (Proprietary) Limited 27 — Purchases from related partiesThe Prepaid Company (Proprietary) Limited 351 —Interest received from related partiesAfrica Prepaid Services (Proprietary) Limited 1 060 —SharedPhone International (Proprietary) Limited 16 Management fees received from related partiesActivi Technology Services (Proprietary) Limited 20 —Africa Prepaid Services (Proprietary) Limited 174 —Cellfind SA (Proprietary) Limited 1 245 —Comm Express Service SA (Proprietary) Limited 720 —Datacel Direct (Proprietary) Limited 330 —E-Voucha (Proprietary) Limited 160 —Gold Label Investments (Proprietary) Limited 350 —IT Experts (Proprietary) Limited 20 —Kwikpay SA (Proprietary) Limited 195 —SharedPhone International (Proprietary) Limited 210 —The Prepaid Company (Proprietary) Limited 39 597 —Ventury Group (Proprietary) Limited 370 —ZOK Cellular (Proprietary) Limited 99 —Rent paid to related partiesMoneyline 311 (Proprietary) Limited 717 —Loans to related partiesAfrica Prepaid Services (Proprietary) Limited 13 539 —Datacel Direct (Proprietary) Limited 7 120 —Gold Label Investments (Proprietary) Limited 100 340 —Matragon (Proprietary) Limited 30 377 —SharedPhone International (Proprietary) Limited 3 216 —The Prepaid Company (Proprietary) Limited 1 018 903 —Velociti (Proprietary) Limited 815 —Loans from related partiesBlue Label Investments (Proprietary) Limited 866 —Ventury Group (Proprietary) Limited 48 000 —Amounts due from related partiesActivi Technology Services (Proprietary) Limited 6 —Comm Express Service SA (Proprietary) Limited 6 —Datacel Direct (Proprietary) Limited 6 —E-Voucha (Proprietary) Limited 11 —The Prepaid Company (Proprietary) Limited 31 920 —ZOK Cellular (Proprietary) Limited 113 —Amounts due to related partiesHouse of Business Solutions (Proprietary) Limited 2 —Kwikpay SA (Proprietary) Limited 108 —The Prepaid Company (Proprietary) Limited 400 —Purchase of property, plant and equipment from related party Blue Label Investments (Proprietary) Limited 866 —
Basis of transactionsAll transactions with related parties are conducted on an arm’s length basis

133
Reconciliation between group net profit and group pro forma net profit:The table below sets out the unaudited pro forma information of BLT. The unaudited group pro forma income statement has been prepared for illustrative purposes only.
31 May 2008Actual(1)
AuditedR’000
Restructuringand
acquisitions(2)
R’000
Casheffects(3)
R’000
31 May 2008Pro forma(4)
UnauditedR’000
Revenue 12 545 471 385 138 — 12 930 609
Other income 69 545 (1 403) — 68 142
Changes in inventories of finished goods (11 875 606) (335 901) — (12 211 507)
Employee compensation and benefit expense (265 003) (10 626) — (275 629)
Depreciation, amortisation and impairment charges (58 670) (15 005) — (73 675)
Other expenses (146 240) (18 446) — (164 686)
Operating profit 269 497 3 757 — 273 254
Finance income 193 281 (215) 46 404 239 470
Finance expense (147 704) (1 433) 42 533 (106 604)
Share loss of associates (17 441) (2 220) — (19 661)
Profit for the period before taxation 297 633 (111) 88 937 386 459
Taxation (89 841) (1 785) (24 903) (116 529)
Net profit 207 792 (1 896) 64 034 269 930
Reconciliation between net profit and core net profit attributable to equity holders:Net profit 180 891 24 498 64 034 269 423
Management bonus settlement net of tax 57 600 — — 57 600
Amortisation on intangibles raised through business combinations net of tax 22 937 11 982 — 34 919
Cancellation of onerous contract 9 000 — — 9 000
Core net profit 270 428 36 480 64 034 370 942
Net profit attributable to: 207 792 (1 896) 64 034 269 930
Equity holders of parent 180 891 24 498 64 034 269 423
Minority interest 26 901 (26 394) — 507
Core net profit attributable to: 301 409 7 650 64 034 373 093
Equity holders of parent 270 428 36 480 64 034 370 942
Minority interest 30 981 (28 830) — 2 151
Earnings per share on profit attributable to equity holders (cents)*
– Basic 30,65 35,16
– Headline 30,26 34,86
– Core 45,81 48,40
Number of ordinary shares in issue 766 360 894 766 360 894
Weighted average number of ordinary shares in issue 590 263 513 766 360 894
*There are no potentially dilutive equity instruments in issue
Notes 1. Extracted from the audited group income statement of BLT for the year ended 31 May 2008.2. Represents the effects of the group restructure based on the assumption that minority acquisitions occurred on 1 June 2007.
The following subsidiaries are therefore consolidated as wholly owned for the full year:– The Prepaid Company– Kwikpay– Matragon– Blue Label OneSimilarly, the following associates are consolidated as subsidiaries for the full year:– 72% Africa Prepaid Services– 100% Virtual Voucher– 100% Cellfind SA– 100% Datacel– 100% House of Business Solutions
3. Represents the positive impact on finance income and expense assuming cash raised on listing was received 1 June 2007.4. Represents the pro forma unaudited group income statement of BLT on the assumption that the restructuring, listing and minority acquisitions
were effective 1 June 2007.5. All adjustments are expected to have a continuing effect on BLT.

134
Notice is hereby given that the first annual general meeting of the shareholders of Blue Label Telecoms will be held in the boardroom, Blue Label Telecoms Corporate Offices, 75 Grayston Drive, Sandton, on Wednesday, 12 November 2008 at 10:00 to conduct the following business:
1. To receive, consider and adopt the annual financial statements of the company and of the Blue Label Telecoms group for the year ended 31 May 2008, including the directors’ report and auditors report thereon.
2. To re-elect directors in accordance with the provisions of the company’s articles of association. In accordance with the articles of association of the company all directors are required to retire at the company’s first annual general meeting.
All retiring directors are eligible and have offered themselves for re-election respectively.
Abbreviated curriculum vitae in respect of each director offering himself/herself for re-election are contained on pages 19 to 21 of this annual report.
3. To ratify the non-executive directors’ remuneration paid for the period ended 31 May 2008 as follows:
Aggregate fees paid for
the periodR
Board chairman 325 000
Board members 780 000
Audit and Risk Management committee chairman and members 158 332
Remuneration and Nomination committee chairman and members 93 333
Investment committee chairman and members 320 000
Transformation committee chairman and members 80 000
Special committee members 60 000
1 816 665
4. To approve the non-executive directors’ remuneration for the year ending 31 May 2009.
Proposed remuneration for non-executive directors:
Fee per meeting
R
Capped fee per annum
R
Services as directors
— 600 000
30 000 150 000
Audit and Risk Management
41 666 166 664
25 000 100 000
Remuneration Committee
33 333 133 333
20 000 80 000
Investment Committee
25 000 200 000
15 000 120 000
Transformation Committee
25 000 100 000
15 000 60 000
Ad-Hoc Committee
25 000 100 000
15 000 60 000

135
5. To re-appoint PricewaterhouseCoopers Inc. as independent registered auditors of the company, to authorise the directors to fix the remuneration of the auditors for the past year’s audit as reflected in note 18 of the annual financial statements and to note that the individual registered auditor who will undertake the audit during the financial year ending 31 May 2009 is Mr EJ Gerryts.
To consider and, if deemed fit, pass with or without modification the following special resolution and ordinary resolutions.
6. Special resolution number 1 – General authority to repurchase shares Resolved that the company or any of its subsidiaries be and they are hereby authorised, by way of a general approval, to acquire
ordinary shares issued by the company, in terms of section 85 and 89 of the Companies Act, No 61 of 1973, as amended (the Companies Act), and in terms of the JSE Limited (the JSE) Listings Requirements, being that:
done without any prior understanding or arrangement with the counterparty;
15 (fifteen) months from the date of passing of this special resolution number 1;
constituting, on a cumulative basis, 3% of the number of ordinary shares in issue and for each 3% in aggregate of the initial number acquired thereafter, in compliance with paragraph 11.27 of the JSE Listings Requirements;
capital as at the date of passing of this special resolution number 1;
such ordinary shares are traded on the JSE as determined over the five business days immediately preceding the date of repurchase of such ordinary shares;
until the company’s sponsor has provided written confirmation to the JSE regarding the adequacy of the company’s working capital in accordance with Schedule 25 of the JSE Listings Requirements;
Requirements unless a repurchase programme is in place, where dates and quantities of shares to be traded during the prohibited period are fixed and full details of the programme have been disclosed in an announcement over the Securities Exchange News Service (SENS) prior to the commencement of the prohibited period.
Before entering the market to effect the general repurchase, the directors, having considered the effects of the repurchase of the maximum number of ordinary shares in terms of the aforegoing general authority, will ensure that for a period of 12 (twelve) months after the date of the notice of annual general meeting:
Financial Reporting Standards, will exceed the liabilities of the company and the Blue Label Telecoms group;
ordinary business purposes; and
the company and the Blue Label Telecoms group.
The following additional information, some of which may appear elsewhere in the annual report of which this notice forms part, is provided in terms of the JSE Listings Requirements for purposes of the general authority:

136
Litigation statementIn terms of paragraph 11.26 of the JSE Listings Requirements, the directors, whose names appear on pages 19 to 21 of this annual report of which this notice forms part, are not aware of any legal or arbitration proceedings that are pending or threatened, that may have or had in the recent past, being at least the previous 12 (twelve) months, a material effect on the Blue Label Telecoms group’s financial position.
Directors’ responsibility statementThe directors whose names appear on pages 19 to 21 of this annual report confirm that to the best of their knowledge and belief:
to ascertain such facts have been made;
and in these circumstances the directors accept responsibility for the information contained in this annual report.
Material changeOther than the facts and developments reported on in this annual report, there have been no material changes in the affairs or financial position of the company and its subsidiaries since the date of signature of the audit report and up to the date of this notice.
The reason for and effect of this special resolution is to grant the directors of the company or its subsidiaries a general authority in terms of the Companies Act and the JSE Listings Requirements for the repurchase by the company or a subsidiary company of the company, of the company’s shares.
The repurchase of the company’s shares may be advisable having regard to a number of factors, including share price, surplus cash and the opportunity to enhance earnings per share. The company requests shareholders to give the directors a general authority for the company to purchase its shares should it be opportune to do so.
7. Ordinary resolution number 1 – Control of authorised but unissued shares Resolved that a general authority be granted to the directors to allot and issue the unissued ordinary shares of the company
subject to the following limitations:
beyond 15 (fifteen) months from the date of this annual general meeting.
company’s issued share capital as at 31 May 2008.
Requirements.
8. Ordinary resolution number 2 – General authority to issue shares for cash Resolved that subject to the general authority proposed in terms of ordinary resolution number 1 above and in terms of the
JSE Listings Requirements, shareholders grant the directors a general authority for the allotment and issue of ordinary shares in the capital of the company for cash as and when suitable situations arise, subject to the following limitations:
beyond 15 (fifteen) months from the date of this annual general meeting;
at the time of any such allotment and issue of shares representing, on a cumulative basis within one year, 3% or more of the ordinary number of issued shares prior to any such issues;
of the company from time to time; and
discount permitted will be 10% of the weighted average traded price of the ordinary shares over the 30 days prior to the date that the price of issue is determined or agreed by the directors of the company.
In terms of the JSE Listings Requirements, the approval of 75% majority of the votes cast by shareholders present or represented by proxy at this annual general meeting will be required for this authority to become effective.

137
9. Ordinary resolution number 3 – Approval of the Blue Label Telecoms Forfeitable Share Plan (the share plan) Resolved that the Blue Label Telecoms Forfeitable Share Plan, the rules of which was tabled at the meeting and initialled by the
chairman of the meeting for the purposes of identification, be and is hereby adopted.
10. Ordinary resolution number 4 – Authorisation to implement the share plan Resolved that, subject to ordinary resolution number 3 being passed at the meeting at which this ordinary resolution number
4 will be proposed and considered, the directors of Blue Label Telecoms be and are hereby authorised to do all such things and sign all documents, including company forms, and take all such action as they consider necessary to give effect to and implement the Forfeitable Share Plan.
11. Ordinary resolution number 5 – Signature of documents Resolved that any one director or the secretary of the company be and is hereby authorised to do all such things and sign all
documents and take all such action as they consider necessary to implement the resolutions set out in the notice convening this annual general meeting at which this ordinary resolution will be considered.
VOTING AND PROXIESShareholders may appoint a proxy to attend, speak and, in respect of the applicable resolution(s), vote in their stead. Shareholders holding dematerialised shares but not in their own name must furnish their Central Securities Depository Participant (CSDP) or broker with their instructions for voting at the annual general meeting should they wish to vote. If your CSDP or broker, as the case may be, does not obtain instructions from you, it will be obliged to act in terms of your mandate furnished to it, or if the mandate is silent in this regard, to complete the relevant from of proxy attached. Unless you advise your CSDP or broker, in terms of the agreement between you and your CSDP or broker by the cut-off time stipulated therein, that you wish to attend the annual general meeting or send a proxy to represent you at the annual general meeting, your CSDP or broker will assume you do not wish to attend the annual general meeting or send a proxy. If you wish to attend the annual general meeting or send a proxy, you must request your CSDP or broker to issue the necessary letter of representation to you.
Shareholders holding dematerialised shares in their own name, or who hold shares that are not dematerialised, and who are unable to attend the annual general meeting and wish to be represented thereat, must complete the relevant form of proxy attached in accordance with the instructions therein and lodge it with, or mail it to, the transfer secretaries.
Forms of proxy should be forwarded to reach the company’s transfer secretaries at the address given below by not later than 10:00 on Tuesday 11 November 2008. The completion of a form of proxy will not preclude a shareholder from attending the annual general meeting.
By order of the board
E ViljoenGroup Company Secretary
13 October 2008
REGISTERED OFFICE TRANSFER SECRETARIES75 Grayston Drive Computershare Investor Services (Pty) LtdMorningside Ext 5 70 Marshall StreetSandton Johannesburg2196 2001(PO Box 652261, Benmore, 2010) (PO Box 61051, Marshalltown, 2107)

138
1. Adoption of annual financial statementsIn terms of the Companies Act 61 of 1973 as amended (the Companies Act), the directors are required to present to shareholders at the annual general meeting the annual financial statements incorporating the directors’ report and the report of the auditors, for the year ended 31 May 2008.
2. Re-election of directorsIn accordance with the articles of association of the company all directors are required to retire at the first annual general meeting of the company. At each subsequent annual general meeting of the company one third of the directors shall retire from office. In addition, any person appointed to the board of directors after the annual general meeting shall be required to retire and is eligible for re-election at the first annual general meeting following the appointment.
All retiring directors are all eligible for re-election. Abbreviated curriculum vitae in respect of each director offering himself/herself for re-election are contained on pages 19 to 21 of this annual report.
3. Non-executive remunerationShareholders are requested to ratify the fees paid to non-executive directors during the six month period ended 31 May 2008.
Shareholders are further requested to approve the fees payable to the company’s non-executive directors during the period 1 June 2008 to 31 May 2009. The proposed fees have been reviewed by the Remuneration and Nomination Committee and are recommended by the board of directors. Particulars of the process followed by the Remuneration and Nomination Committee are contained in the Remuneration Report on page 54 of this annual report.
4. Re-appointment of auditors and determination of auditors’ feesPricewaterhouseCoopers Inc. has indicated its willingness to continue in office and resolution number 4 proposes the re-appointment of that firm as the company’s auditors until the next annual general meeting. The resolution further gives authority to the directors to fix the remuneration of the auditors, which fee determination will be reviewed and recommended by the Audit and Risk Management Committee.
In accordance with section 270A of the Corporate Laws Amendment Bill, the Audit and Risk Management Committee has satisfied itself that the proposed auditor, PricewaterhouseCoopers Inc, is independent of the company.
5. Special resolution number 1 – General authority to purchase sharesThe effect of this special resolution and the reason therefore is to grant the company or any of its subsidiaries a general authority in terms of the Companies Act 61 of 1973, as amended (the Companies Act), for the acquisition by the company or any of its subsidiaries of the company’s shares, which general approval shall be valid until the earlier of such next annual general meeting of the company or its variation or revocation of such general authority by special resolution at any subsequent general meeting of the company, provided that the general authority shall not extend beyond 15 months from the date of this annual general meeting.
The directors are of the opinion that the granting of this general authority would be in the best interests of the company as it would allow the company or any its subsidiaries to be in a position to repurchase the securities issued by the company through the order book of the JSE, should the market conditions and price justify such an action.
6. Ordinary resolutions numbers 1 and 2 – Control of authorised but unissued shares and general authority to issue shares for cashIn terms of sections 221 and 222 of the Companies Act the shareholders have to approve the placement of the unissued shares under the control of the directors. The authorities granted under these resolutions would be subject to the Companies Act and the JSE Listings Requirements and will not, in any financial year, exceed in aggregate 22 990 827 ordinary shares, being 3% of the number of ordinary shares in the company’s issued share capital as at 31 May 2008.
Ordinary resolution numbers 1 and 2 require a 50% and 75% majority of the votes respectively, cast by shareholders present or represented by proxy at the annual general meeting to become effective.
The directors consider it to be advantageous for the company to be granted these authorities as it would enable the company to take advantage of business opportunities that may arise in the future.
7. Ordinary resolution number 3 – Approval of the Blue Label Telecoms Forfeitable Share PlanThe effect of ordinary resolution number 3 and the reason therefore is to provide a mechanism for the incentivisation of the senior executives, management and other employees within the Blue Label Telecoms group, to increase employee and shareholder alignment through employee share ownership and to attract and retain key talent.
The salient features of the Blue Label Telecoms Forfeitable Share Plan (share plan) are set out on pages 139 to 142 of this annual report. The rules of the share plan will be available for inspection during normal business hours at the registered office of the company, from the date of this annual report up to and including the date of the annual general meeting.

139
Introduction
In line with global best practice and emerging South African practice, the company intends to adopt a new forfeitable share incentive
plan (the plan). The plan is in line with practice in FTSE 100 and FTSE 250 companies in the UK and with several recently adopted
schemes for large JSE listed and dual listed companies.
The plan will include participation by executive directors and employees of the group. The purpose of the plan is to recognise contributions
made by directors and employees to the company and to provide an incentive for their continuing relationship with the group.
Apart from the initial award, all awards made under the plan shall vest three years from the award date, subject to the participant
continuing to be employed by the group and performance conditions being met. The initial award will have a vesting period just
less than two years. The performance conditions to be met before the shares under the initial award will vest will be determined
with effect from 31 May 2008. It is anticipated that future awards will be made on 1 September of each year. In the event that the
participant is not in the employ of the group, or the performance conditions are not met, then the shares allocated to the participant
will be forfeited and will be sold on the open market by the escrow agent. The proceeds will be returned to the participating employer.
As it is the intention to purchase shares in the market to settle the awards made under the plan, the plan will not have the same
dilutionary effect as conventional share option schemes. The company does have the right to issue new shares at its election, should
it not be advisable or feasible to purchase the shares in the market at any given point in time. The number of shares which will be
allocated under the plan will not exceed 10% (ten percent) of the issued ordinary shares over the life of the plan, which at date of
approval equates to 76 636 085 shares. It is the intention that the annual allotment of shares under the plan will not exceed one
percent of the issued ordinary shares, which at date of approval of the plan equates to 7 663 608 shares.
In order to achieve an alignment of the interests of management and shareholders, performance conditions in the form of
continuing employment and financial hurdle rate achievements will need to be met before the shares vest.
Glossary of terms
Allocated For purposes of setting the scheme limits, one share allocated per any one forfeitable award made
Award date The date on which a forfeitable award is made to an employee as specified in the award certificate,
irrespective of the date on which the forfeitable award is actually accepted
Award certificate The document prepared by the board which details the name of the employee to whom the forfeitable award
is made, the number of forfeitable shares comprising the forfeitable award, the performance condition
applicable to the award, the release date and any relevant terms and conditions pertaining thereto
Employee A person eligible for participation in the plan, namely an officer or employee, including any director holding
salaried employment or office, of any employer company in the group, as determined from time to time by
the board in its absolute discretion but excluding any non-executive directors
Financial year The financial year of the company which currently runs from 1 June to 31 May each year
Forfeitable award An award of a specified number of forfeitable shares to the participant on terms that he shall forfeit
them if he ceases to be an employee of an employer company before the release date, unless otherwise
specified in the rules, or determined by the board in its absolute discretion
Forfeitable shares The shares comprised in the forfeitable award and registered in the name of the participant, subject to
the rules
Participant An employee to whom a forfeitable award has been made and who has accepted such forfeitable award
and includes the executor of his deceased estate, where applicable
Performance condition The condition specified in the award certificate, to which a forfeitable award is subject, which performance
condition is determined by the board
Performance period The period in respect of which a performance condition is to be satisfied as specified in the award certificate
Release date The date on which a participant becomes entitled to the forfeitable shares free of any restrictions, as set
out in the award certificate, and “vest” and “vested” shall be construed accordingly
Rules The rules of the plan
Settlement Delivery of the required number of forfeitable shares to which a participant is entitled pursuant to the
making of the forfeitable award
Settlement date The date on which settlement shall occur

140
Salient features of the plan
The plan
A forfeitable award will be made to executives and employees on an annual basis, this is an award of a specified number of
forfeitable shares to the participant on condition that he will forfeit the forfeitable shares if he ceases to be an employee of an
employer company before the release date or if the specified performance condition has not been met, unless otherwise specified
by the rules or determined by the board. In the event that the participant is not in the employ of the group, or the performance
conditions are not met, then the shares allocated to the participant will be forfeited and will be sold on the open market by the
escrow agent. The proceeds will be returned to the participating employer.
Following the making of the forfeitable award, the relevant employer company shall, within 100 (one hundred) days of the award
date procure the settlement of that number of forfeitable shares to the participant (without deducting any costs or income tax
at that stage) as were allocated. The forfeitable shares shall either be acquired by the escrow agent on the open market, with
funds provided by the participating employer, alternatively the company may issue shares to settle the award, if it is not feasible or
advisable to acquire same on the market. These shares shall be issued at market value. The participant shall not be required to pay
for the forfeitable shares allocated to him at any stage over the life of the plan.
The forfeitable award will be subject to the restriction that the forfeitable shares to which such forfeitable award relate may not
be disposed of, ceded, transferred or otherwise encumbered at any time before the release date and shall be held in escrow by an
escrow agent.
Prior to the release date the participants shall not be entitled to exercise any voting rights in respect of the forfeitable shares. On
the release date the participant shall have all shareholder rights in respect of the shares, and the right to receive accumulated
dividend payments.
Eligibility
Directors (excluding non-executive directors) and employees of the group are eligible to participate in the plan. The employer
companies will recommend participation in the plan to the board, which shall exercise its discretion in determining the suitability of
the employee for participation.
Performance conditions
The release of forfeitable awards will be subject to the achievement of a specified performance condition. The performance
condition will be stated in the award certificate, and will be set by the board on an annual basis. The performance condition for the
first award (which will be measured over a two-year period) is:
HEPS at the end of the performance period exceeds the core HEPS per
ordinary share as at the beginning of the performance period by the percentage change in the CPI index over the performance
period, plus 20 (thirty) % (threshold performance criteria);
HEPS at the end of the performance period exceeds the core HEPS per ordinary
share as at the beginning of the performance period by the percentage change in the CPI index over the performance period,
plus 30 (forty five) % (target performance criteria);
determined by the board;
The board may, in its discretion, allow retesting of the performance condition on the first and second anniversary of the end of the
performance period.

141
Limits
Overall company limit
The aggregate number of shares which may be allocated under the plan shall not exceed 10 % (ten percent) of the number of issued
ordinary shares over the life of the plan, which currently equates to 76 636 089 shares. The limit referred to shall exclude shares
allocated to participants under the plan which have been forfeited but will include the actual number of new shares as may be issued
by the company in settlement of the plan.
Individual limit
The maximum number of shares allocated to any one participant in respect of all unvested awards granted in terms of the plan shall
not exceed 2% (two percent) of the issued ordinary share capital of the company over the life of the plan, which currently equates to
15 327 218 shares.
Cessation of employment and death
Resignation or dismissal
If a participant’s employment with an employer company terminates by reason of his resignation or dismissal on grounds of
misconduct, poor performance or proven dishonest or fraudulent conduct (whether such cessation occurs as a result of notice
given by him or otherwise or where he resigns to avoid dismissal on grounds of misconduct, poor performance or proven dishonest
or fraudulent conduct) before the release date, all his forfeitable awards will be forfeited, except to the extent that the board shall
otherwise determine in its discretion.
Retirement
If a participant’s employment with any employer company terminates before the release date by reason of retirement, then the
participant shall be entitled to the same rights and be subject to the same conditions as if he had continued to be an employee,
unless the board determines otherwise.
Retrenchment, death, ill health, disability or other reasons for cessation of employment
If a participant ceases to be an employee of an employer company by reason of retrenchment, death, ill health, disability or
other reasons for cessation of employment other than resignation or dismissal or retirement, then the release date in respect
of a pro rata portion of his forfeitable shares shall be advanced to a date as soon as practical after the date of termination of
employment. The pro rata portion of the shares released, unless the board determines otherwise, shall reflect the number of
months served since the award date and the extent to which the performance condition has been satisfied. The balance of the
shares not released as aforesaid will lapse.
Change of control and delisting
In the event that before the release date, an offer is made which might result in a change in control of the company, the release date
in respect of the forfeitable shares may, at the discretion of the company, be advanced to a date determined by the board.
In the event of an employer company (other than the company), ceasing to be a subsidiary of the company, the board may take such
action as it considers appropriate relating to the forfeiture or accelerated vesting of the forfeitable awards previously made to the
employees of that employer company.
Variation in share capital
In the event of a rights issue, capitalisation issue, capital distribution, subdivision of shares, consolidation of shares, the company
being put into liquidation for the purpose of reorganisation or any other event affecting the share capital of the company or in the
event of the company making distributions to shareholders, including a distribution in specie or a payment in terms of section 90
of the Companies Act 61 of 1973 (other than a dividend paid in the ordinary course of business out of the current year’s retained
earnings), participants shall continue to participate in the plan. The board may, however, vary the number of forfeitable shares to
take account of any variation in the share capital of the company to ensure that the participant is not disadvantaged.

142
The board shall notify the participants of any adjustments which are made under this paragraph. Where necessary, in respect of any
such adjustments, the company’s auditors, acting as experts and not as arbitrators and whose decision shall be final and binding on
all persons affected thereby, will determine whether the participants have been disadvantaged by the adjustments.
Shares to rank pari passu
On the release date the participant shall have all shareholder rights in respect of the shares and the shares shall rank pari passu
with the existing shares in the issued ordinary share capital of the company.
Amendments to the plan
Amendments to the provisions of the plan relating to:
Are subject to approval by the JSE and an ordinary resolution of the shareholders in general/annual general meeting.

143
Blue Label Telecoms Limited(Incorporated in the Republic of South Africa)(Registration number 2006/022679/06)Share code: BLU ISIN: ZAE000109088(“Blue Label Telecoms” or “the company”)
FORM OF PROXY FOR THE FIRST ANNUAL GENERAL MEETING TO BE HELD AT BLUE LABEL TELECOMS CORPORATE OFFICES AT 75 GRAYSTON DRIVE, SANDTON, ON WEDNESDAY, 12 NOVEMBER 2008 AT 10:00 – FOR USE BY CERTIFICATED ORDINARY SHAREHOLDERS AND DEMATERIALISED ORDINARY SHAREHOLDERS WITH OWN NAME REGISTRATION ONLY
Dematerialised shareholders other than “own name” registration must inform their CSDP or broker of their intention to attend the annual general meeting and request their CSDP to issue them with the necessary authorisation to attend the annual general meeting in person or provide their CSDP or broker with their voting instructions should they not wish to attend the annual general meeting in person but wish to be represented thereat.
I/We(Please print)
of address
Being the registered holder(s) of ordinary shares in the capital of the company do hereby appoint
1.
2.
the chairman of the annual general meeting as my/our proxy to act for me/us and on my/our behalf at the first annual general meeting of the company which will be held on Wednesday, 12 November 2008 at 10:00 for the purpose of considering and, if deemed fit, passing, with or without modification, the resolutions to be proposed thereat and at any adjournment thereof, and to vote for and/or against the resolutions and/or abstain from voting in respect of the shares registered in my/our name/s, in accordance with the following instructions:
NUMBER OF ORDINARY SHARESFor Against Abstain
1. Adoption of annual financial statements2. Re-election of directors
2.1 S Ellerine2.2 GD Harlow2.3 RJ Huntley2.4 NN Lazarus2.5 BM Levy2.6 MS Levy2.7 P Mansour2.8 JS Mthimunye2.9 LM Nestadt2.10 MV Pamensky2.11 DB Rivkind2.12 HC Theledi2.13 LM Tyalimpi
3. Ratification of fees paid to non-executive directors4. Approval of non-executive director fees 5. Reappointment of independent auditors6. Special resolution: General authority to repurchase shares7. Ordinary resolution number 1: Control of authorised but unissued shares8. Ordinary resolution number 2: General authority to issue shares for cash9. Ordinary resolution number 3: Adoption of the Forfeitable Share Plan
10. Ordinary resolution number 4: Authorisation to implement the Forfeitable Share Plan11. Ordinary resolution number 5: Signature of documents
Signed at on 2008
Signature
Assisted by me (where applicable)

144
1. An ordinary shareholder may insert the name of a proxy or the names of two alternative proxies of the ordinary shareholder’s
choice in the space provided and any such proxy need to be a shareholder of the company. Should a proxy not be specified, this
will be exercised by the chairman of the annual general meeting.
2. An ordinary shareholder is entitled to one vote on a show of hands and, on a poll, one vote in respect of each ordinary share held.
3. If a shareholder does not indicate on this instrument that his/her proxy is to vote in favour of, against any resolution or to
abstain from voting, or should any further resolution(s) or any amendment(s) which may be properly put before the annual
general meeting be proposed, the proxy shall be entitled to vote as he/she thinks fit.
4. Documentary evidence establishing the authority of a person signing the proxy form in a representative capacity must be
attached to this form, unless previously recorded by the company or waived by the chairman of the annual general meeting.
5. This proxy form should be completed and returned to the company’s transfer secretaries, Computershare Investor Services
(Pty) Ltd, 70 Marshall Street, Johannesburg, 2001 (PO Box 61051, Marshalltown, 2107), so as to reach them by not later than
Tuesday, 11 November 2008 at 10:00.
ADDITIONAL FORMS OF PROXY ARE AVAILABLE FROM THE TRANSFER SECRETARIES ON REQUEST

BASTION GRAPHICS

www.bluelabeltelecoms.com